U.S. Rare Earths — Investor Presentation (March 2015)
31 slides from U.S. Rare Earths's investor presentation, Mar 5, 2015
Slide 1: U.S. Rare Earths, Inc. Investor Presentation March 2015
\Iy [SS EN...) = U.S. Rare Earths, Inc. MINING THE FUTURE INVESTOR PRESENTATION MARCH 2015
Slide 2: Cautionary Note Regarding Forward Looking Statements
Cautionary Note Regarding Forward Looking Statements Certain statements included in this presentation may be considered forward-looking. All statements in this presentation that are not historical facts are forward-looking statements. Such statements involve known and unknown risks, uncertainties an
Slide 3: U.S. Rare Earths Overview
U.S. Rare Earths Overview Mineral exploration company headquartered in Texas Controls approx. 22,000 acres across six project areas with approx. 1,250 claims in Colorado & Idaho / Montana (Lemhi Pass regions) USRE Properties hold all of the Rare Earth Elements, including the 5 Critical Rare Earth Ox
Slide 4: Management & Directors
Management & Directors John Victor Lattimore, Jr, Chairman of the Board: Mr. Lattimore was appointed Chairman of the Board of Directors on June 27, 2011. Since 1996, Mr. Lattimore has served as President and Chairman of the Board of Lattimore Properties, Inc. of Plano, Texas. From 1986 to 2011, he w
Slide 5: Management & Directors
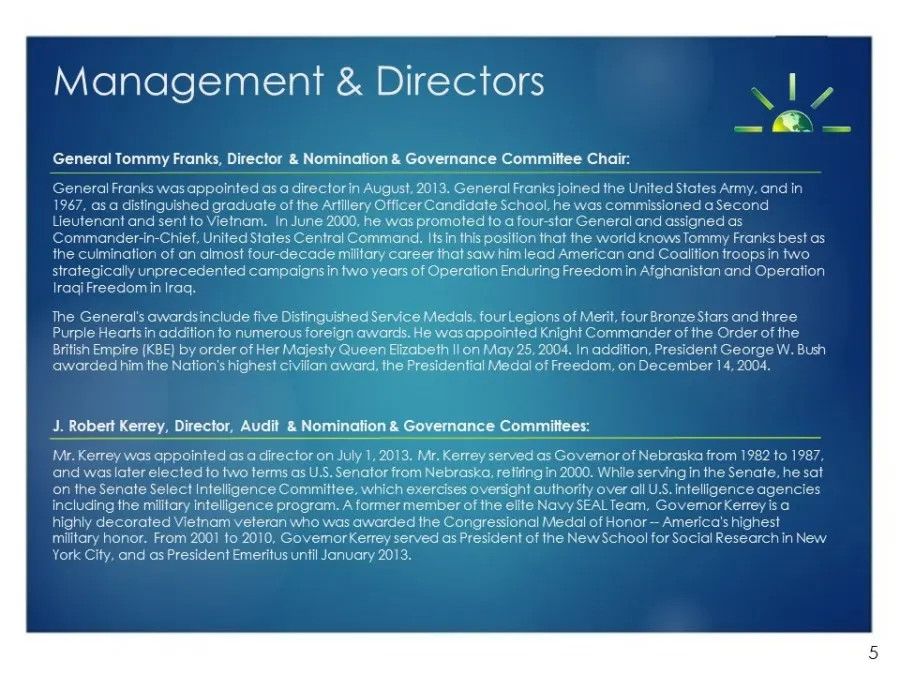
Management & Directors General Tommy Franks, Director & Nomination & Governance Committee Chair: General Franks was appointed as a director in August, 2013. General Franks joined the United States Army, and in 1967, as a distinguished graduate of the Artillery Officer Candidate School, he was commis
Slide 6: Management & Directors 1A
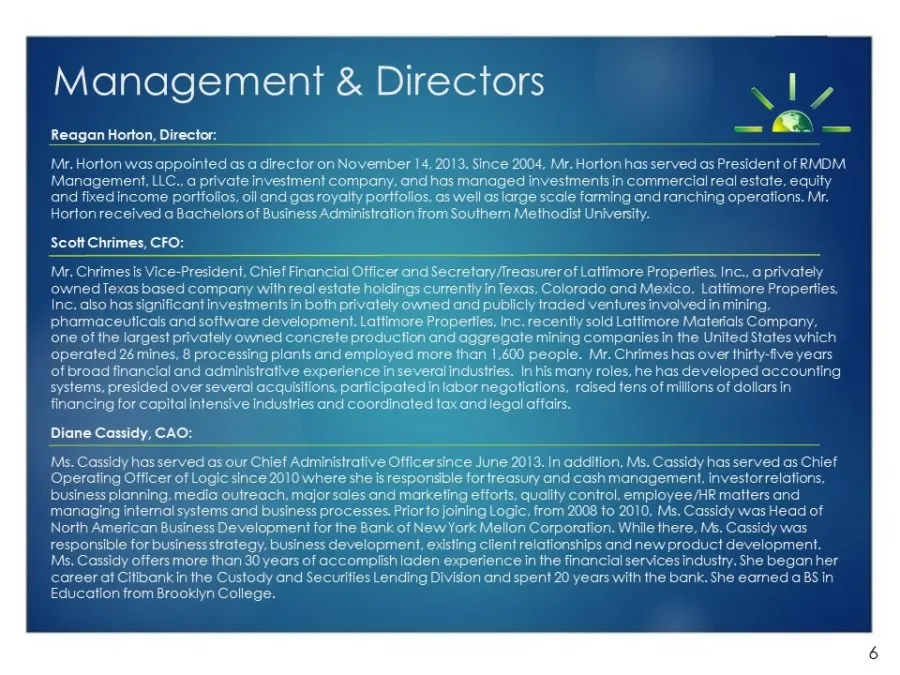
Management & Directors 1A — &@ Mr. Horton was appointed as a director on November 14, 2013. Since 2004, Mr. Horton has served as President of RMDM. Management, LLC., a private investment company, and has managed investments in commercial real estate, equity and fixed income portfolios, oil and gas r
Slide 7: What are Rare Earth Elements?
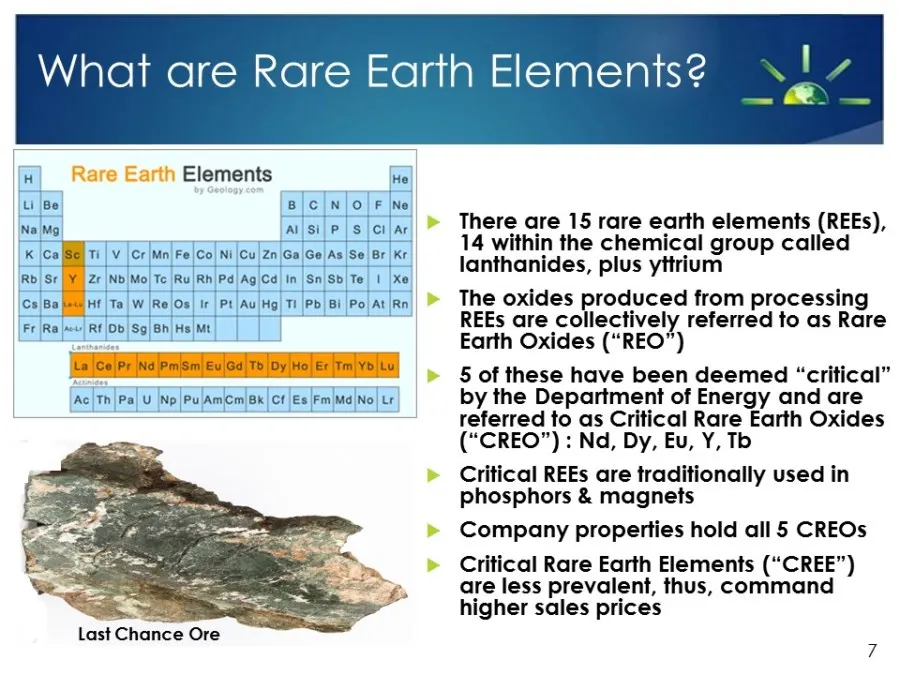
What are Rare Earth Elements? Elements |He BC NO F \Ne ni|silP |S (cllar x [ca [Bl ri | v [cr |htn|Fe|co] ni [cul zn|GalGe|As|Se| Br |Kr IRD) Sr |¥| Zr |Nb|Mo| Te |Ru|Rh/Pd|Ag|Cd In |Sn|/Sb\Te| | |xe s|00 fae) |W RO r[Pt|au/Ha] 11 [Pb [Pol At Rn Fr Ra jew] RED S| 8h Hs| Me ‘e|th [Pa] fo[Pulamlonx or
Slide 8: U.S. Imports >90% of Rare Earth from China
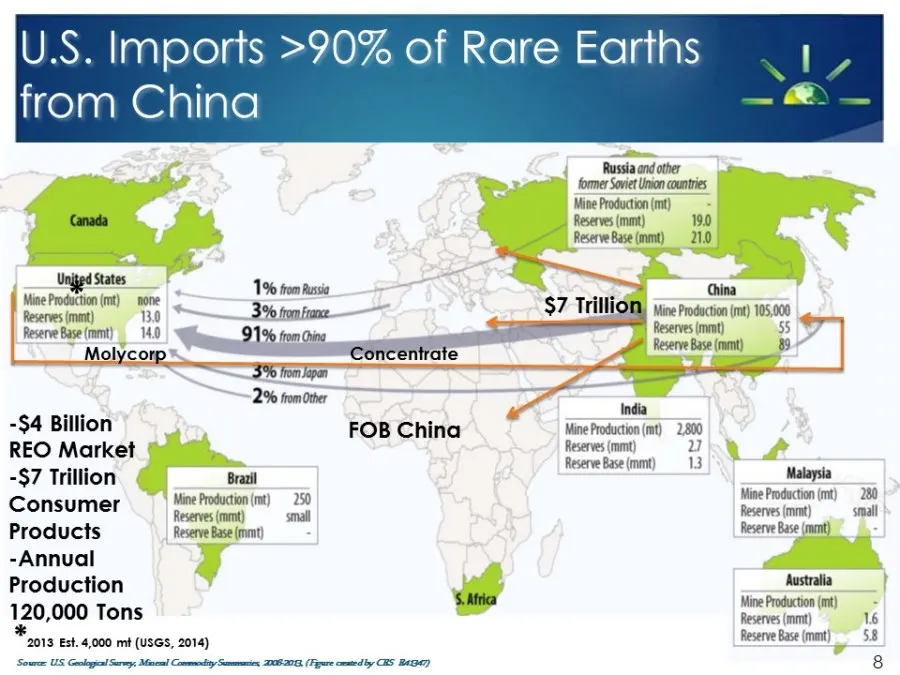
U.S. Imports >90% of Rare Earth from China States: f Peal eed FOB China REO Market -$7 Trillion Bradt Consumer pee ta 3 Products Reserve Base (mt) -Annual Production 120,000 Tons S.Africa '2018 Est. 4,000 mt (USGS, 2014) Sower US Genoa! Sey, Mine! Commodi Sammie T6206. (Fgere cmtey RS BAG) j former
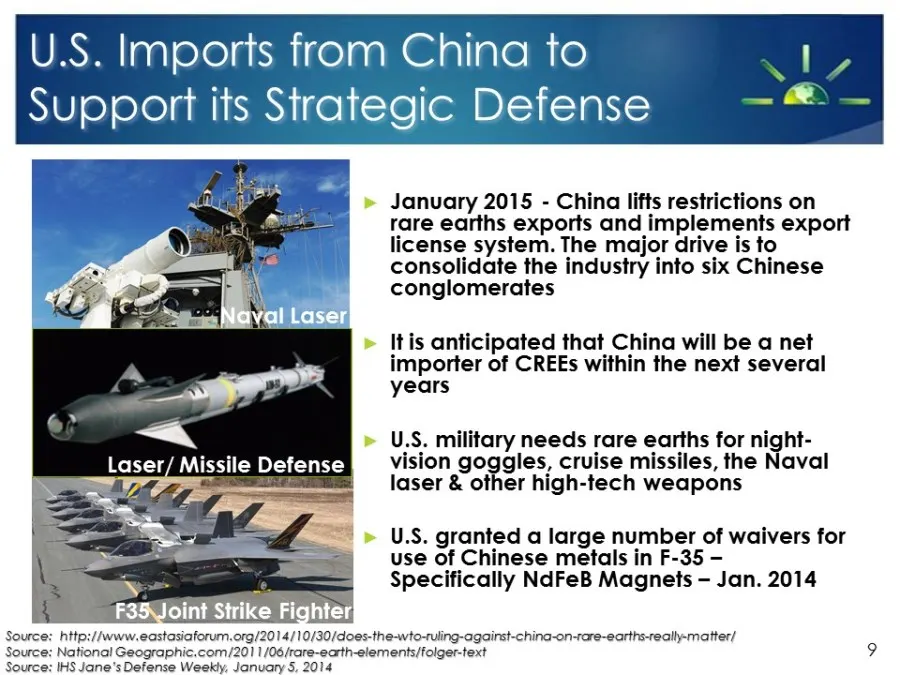
Slide 9: U.S. Imports from China to Support its Strategic Defense
U.S. Imports from China to Support its Strategic Defense » January 2015 - China lifts restrictions on rare earths exports and implements export license system. The major drive is to consolidate the industry into six Chinese conglomerates » Itis anticipated that China will be a net importer of CREEs
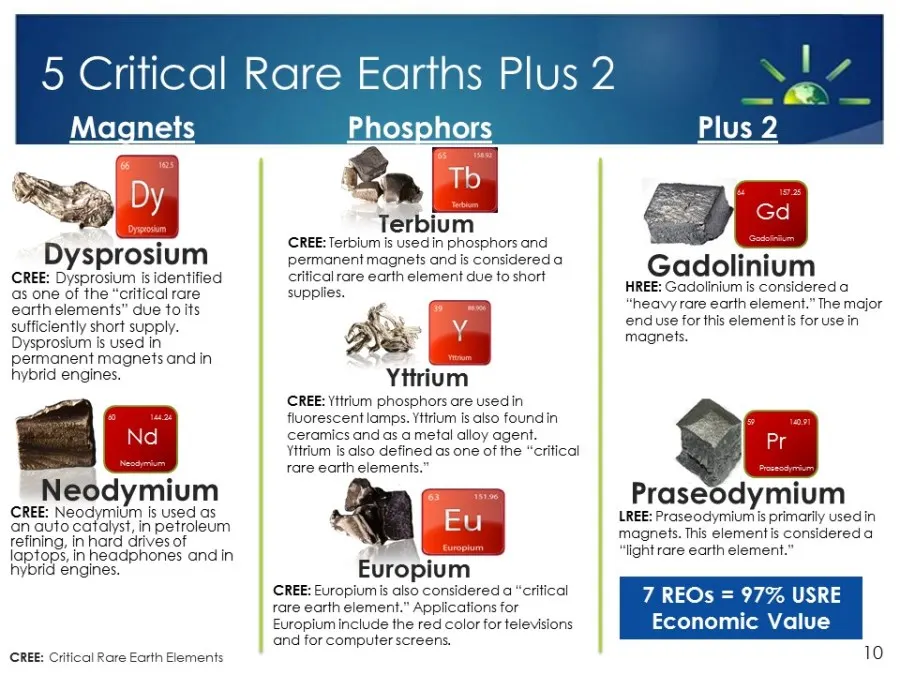
Slide 10: Critical Rare Earths Plus
5 Critical Rare Earths Plus 2 Magnets Dysprosium CREE: Dysprosium is identified as one of the “critical rare earth elements” due to its sufficiently short supply. Dysprosium is used In permanent magnets and in hybrid engines. Neodymium CREE: Neodymium is used as an auto catalyst, in petroleum refini
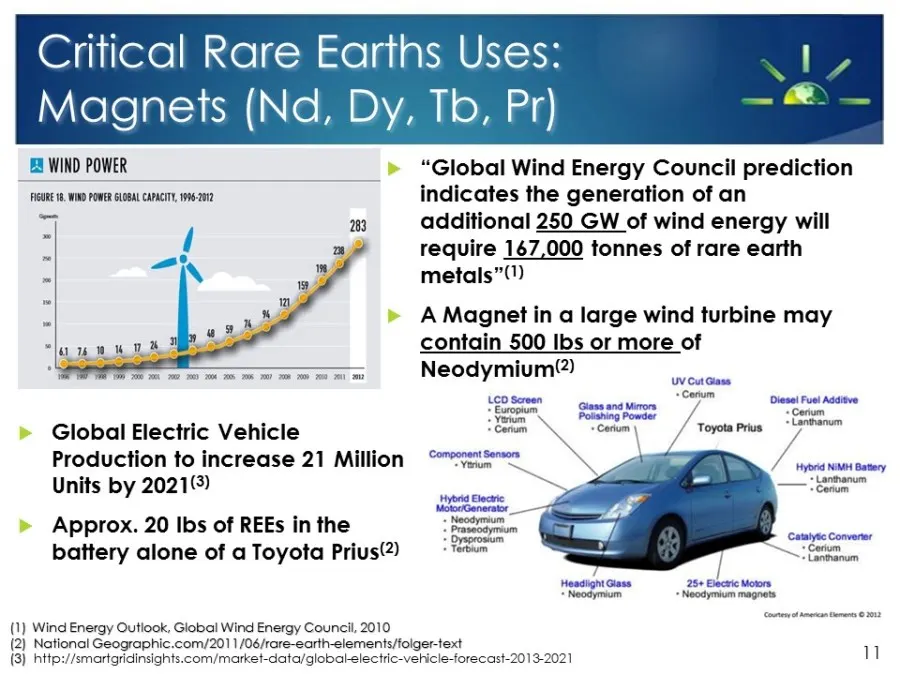
Slide 11: Critical Rare Earths Uses: Magnets
Critical Rare Earths Uses: Magnets (Nd, Dy, Tb, Pr) ES WIND POWER “Global Wind Energy Council prediction RE, WD Powe OBA CAPACITY, 196-202 indicates the generation of an additional 250 GW of wind energy will require 167,000 tonnes of rare earth metals”() A Magnet in a large wind turbine may contain
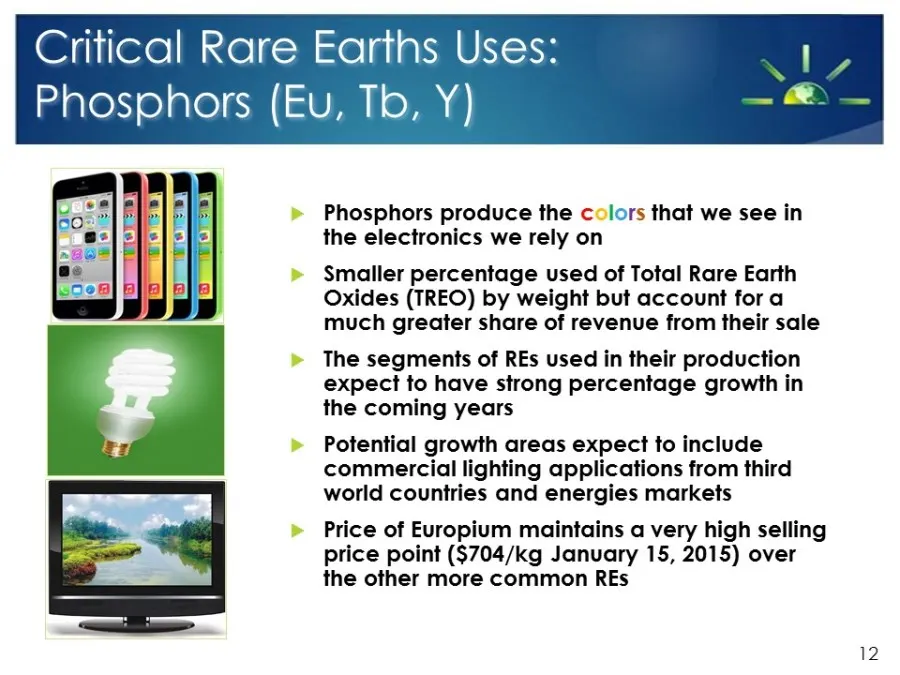
Slide 12: Critical Rare Earths Uses: Phosphors
Critical Rare Earths Uses: Phosphors (Eu, Tb, Y) Phosphors produce the colors that we see in the electronics we rely on Smaller percentage used of Total Rare Earth Oxides (TREO) by weight but account for a much greater share of revenue from their sale The segments of REs used in their production exp
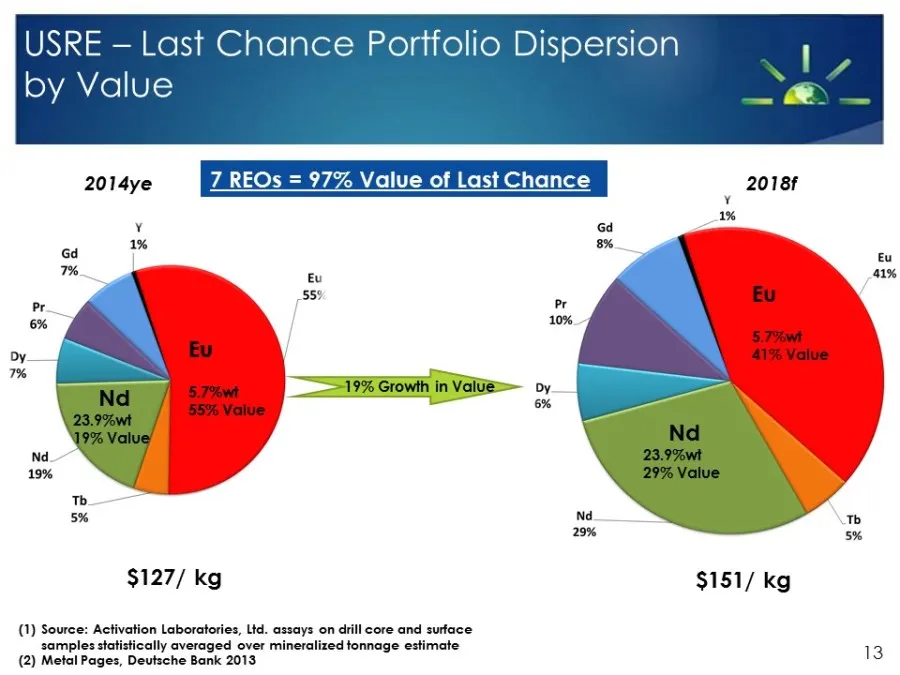
Slide 13: USRE — Last Chance Portfolio Dispersion by Value
USRE — Last Chance Portfolio Dispersion by Value 2014ye 7 REOs = 97% Value of Last Chance 2018f Gd 2 “ Eu 41% 559 6 Eu 10%, 5.7%wt Eu \ 41% Value s7%et oy 55% Value % Nd. 19% J . ’ $127/ kg $151/ kg (1) Source: Activation Laboratories, Ltd. assays on drill core and surface samples statistically aver
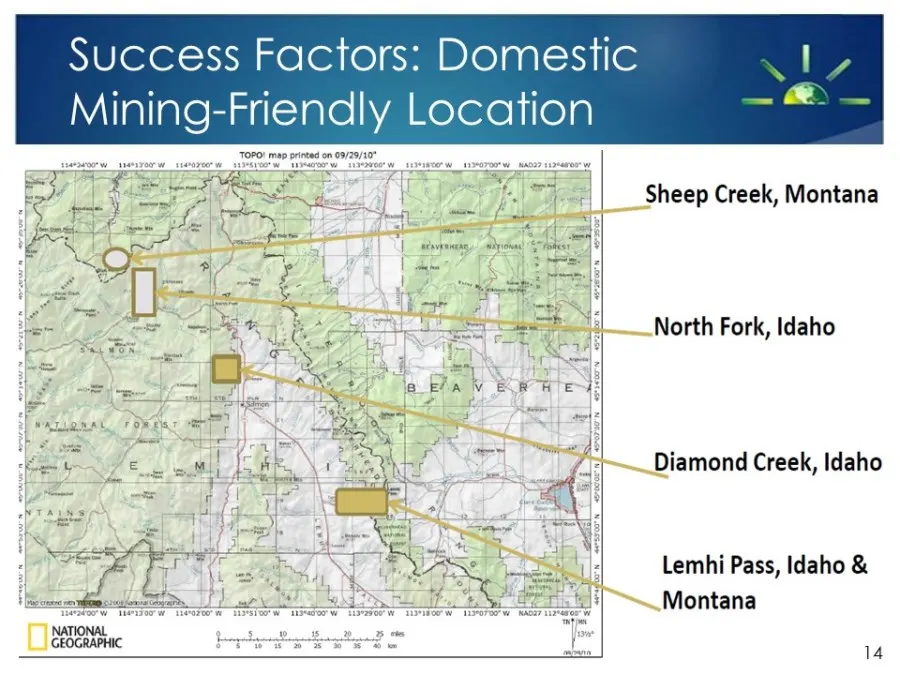
Slide 14: Sheep Creek, Montana
Sheep Creek, Montana North Fork, Idaho Diamond Creek, Idaho Lemhi Pass, Idaho & Montana 14
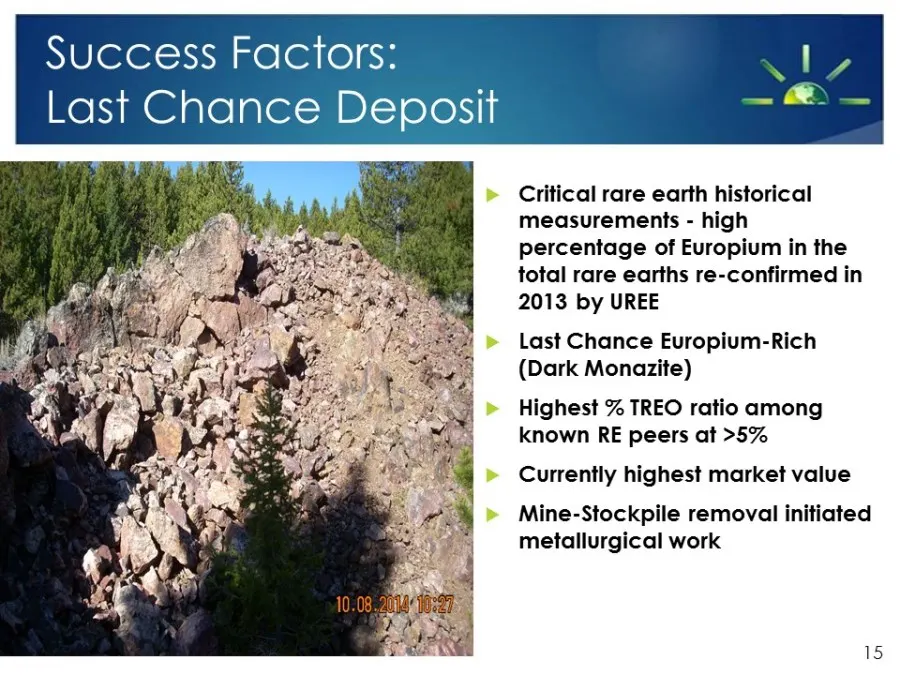
Slide 15: Success Factors: Last Chance Deposit
Success Factors: Last Chance Deposit Critical rare earth historical measurements - high percentage of Europium in the total rare earths re-confirmed in 2013 by UREE Last Chance Europium-Rich (Dark Monazite) Highest % TREO ratio among known RE peers at >5% Currently highest market value Mine-Stockpil
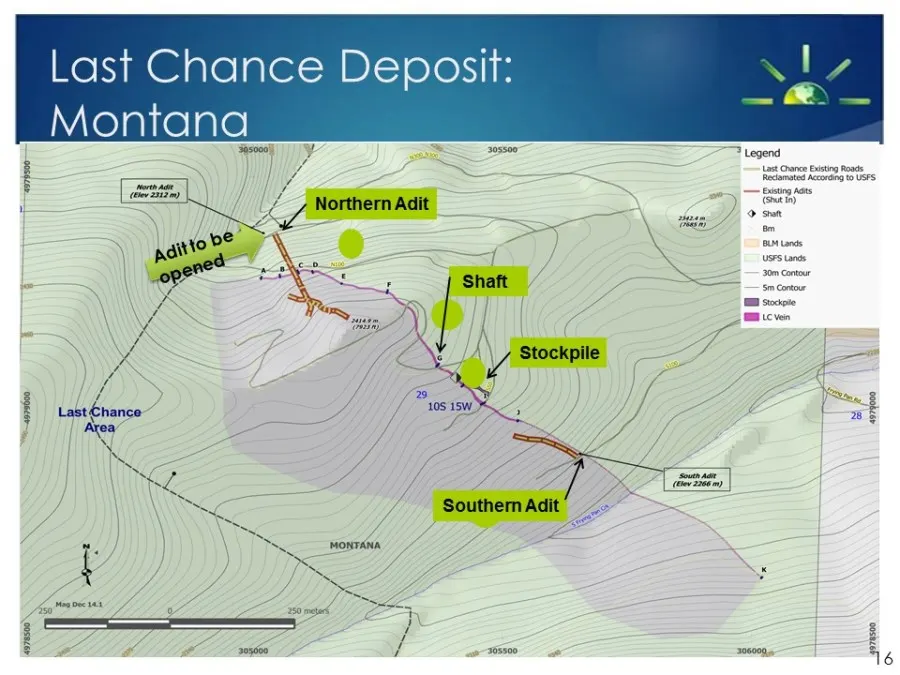
Slide 16: Last Chance Deposit
Last Chance Deposit: _ Montana eertitim) a o = =— = = res = BL ee. — py gy e —_ —S Z aN Z | t Chance AS di a t at Area ya < (ete) in = y > ie < } SE ae SL Z i ZA - =
Slide 17: CD REE IRS SME ELS oa a a
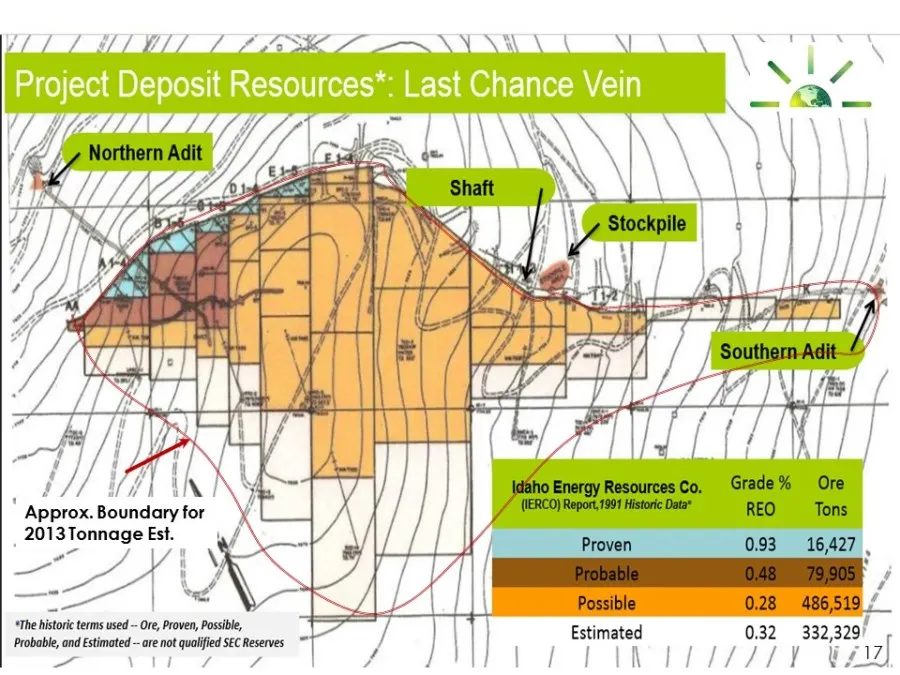
CD REE IRS SME ELS oa a a LLL LL / Uf Api # acres ani: PTR | Akin ba} /} A Ney " Approx. ee _ 2013Tonnage Est. on : ; se t y _ | ag ‘The histo terms used ~ Ore, Proven, Possible, = : 7 vail Eabesied ast sealed a Estimated 0.32 332,329) a aie Pir Pwr i/777. ba oEnergyResourcesCo. Grade% Ore i net eee
Slide 18: Last Chance Vein: Historical Work Advantages
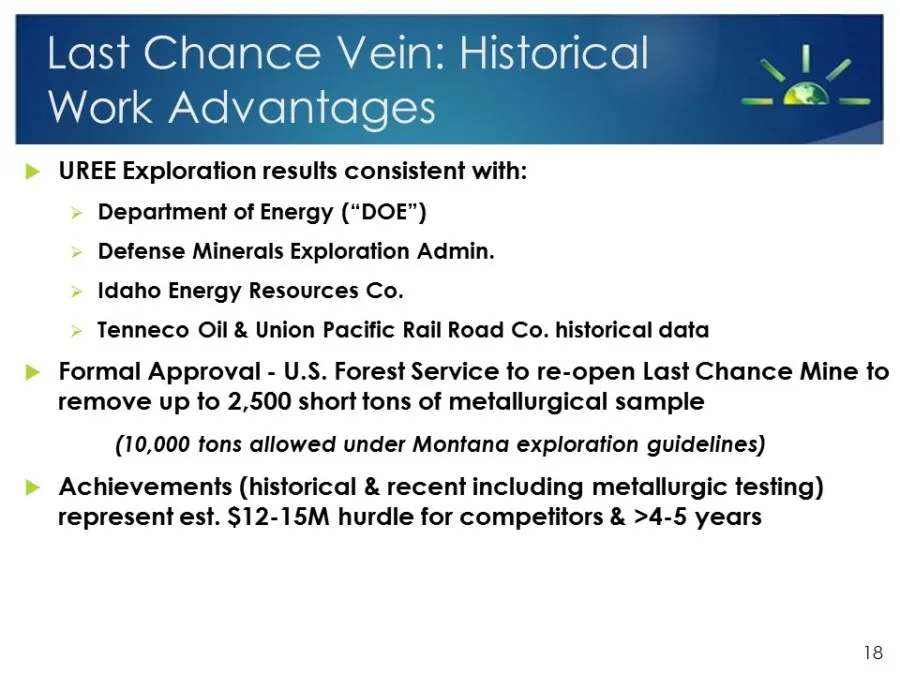
Last Chance Vein: Historical Work Advantages » UREE Exploration results consistent with: » Department of Energy (“DOE”) » Defense Minerals Exploration Admin. » Idaho Energy Resources Co. » Tenneco Oil & Union Pacific Rail Road Co. historical data » Formal Approval - U.S. Forest Service to re-open La
Slide 19: Project Deposit Resources
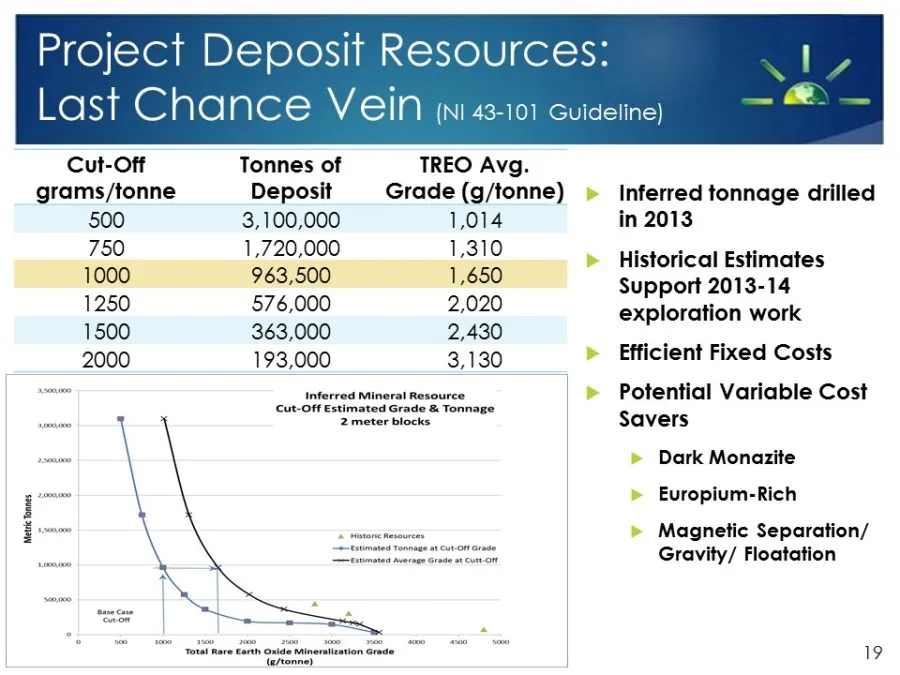
Project Deposit Resources: Last Chance Vein (NI 43-101 Guideline) Cut-Off Tonnes of TREO Avg. grams/tonne Deposit Grade (g/tonne) Inferred tonnage drilled 500 3,100,000 1,014 in 2013 750 1,720,000 1,310 pee . 1000 963,500 1,450 Hspalatietat a 1250 576,000 2,020 exploration work 1500 363,000 2,430 a
Slide 20: USRE — Last Chance Portfolio Dispersion by Weight
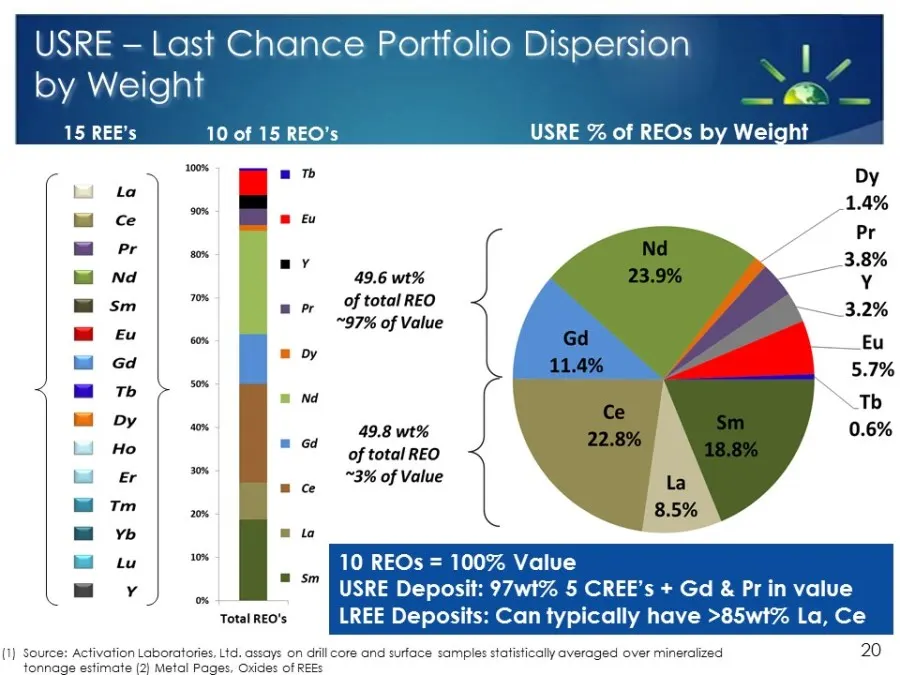
SRE — Last Chance Portfolio Dispersion 1 by Weight a 15 REE’s 10 of 15 REO’s USRE % of REOs by Weight ll Ce on ew . fea Pr a | = 3.8% ll na 49.6 wt% Y osm 70% of total REO o : Sn 49796 of Value 22% Mm cu lat Eu lal Gd ”: @ Tb om a7 Nd Tb Py | am ae 49:8 wt 0.6% kid Ho of total REO ta oer om ~3% of V
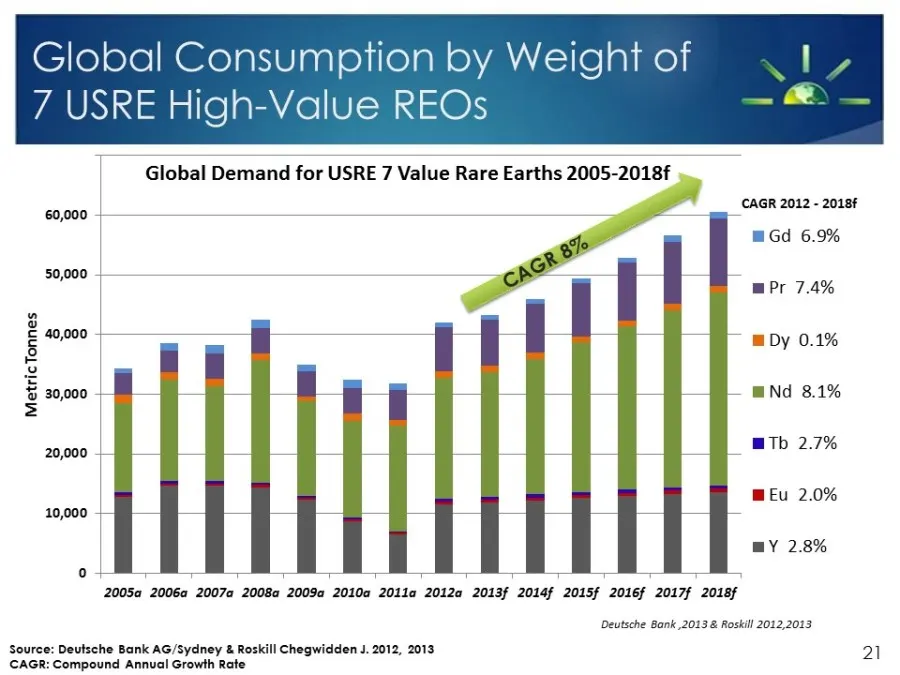
Slide 21: Global Consumption by Weight of USRE High-Value REOs
Global Consumption by Weight of 7 USRE High-Value REOs Global Demand for USRE 7 Value Rare Earths 2005-2018f CAGR 2012 - 2018f 60,000 Z yy i mGd 6.9% 50,000 a il | mPr 7.4% 3 § 000 il | Dy 0.1% 30,000 ia] | Nd 8.1% = 20,000 mTb 2.7% MEU 2.0% 10,000 mY 2.8% ° : : 2005a 2006 2007a 20084 2009a 2010a 20
Slide 22: Success Factors: Resources
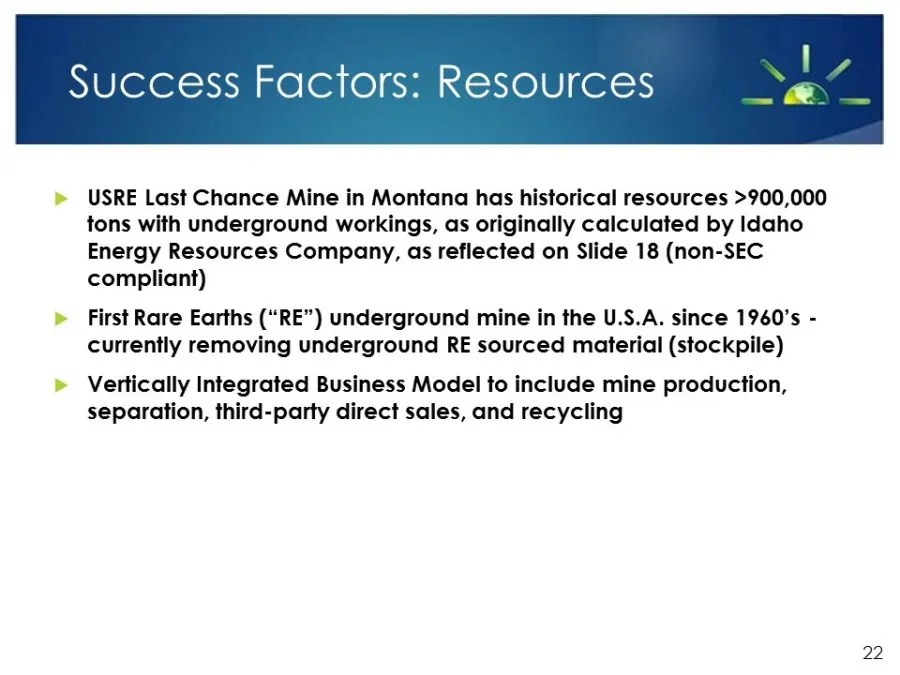
Success Factors: Resources » USRE Last Chance Mine in Montana has historical resources >900,000 tons with underground workings, as originally calculated by Idaho Energy Resources Company, as reflected on Slide 18 (non-SEC compliant) » First Rare Earths (“RE”) underground mine in the U.S.A. since 196
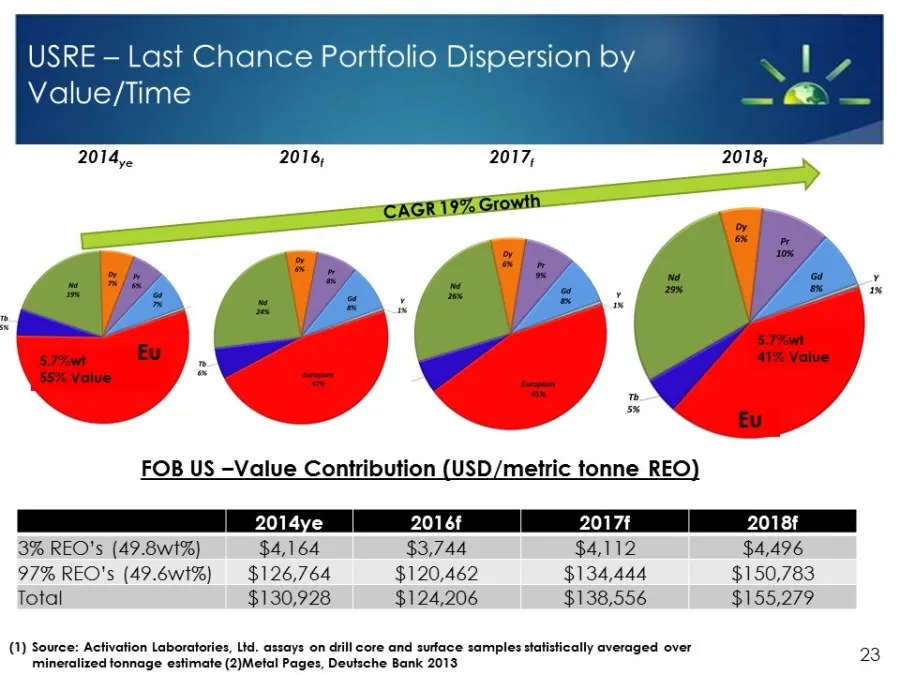
Slide 23: USRE - Last Chance Portfolio Dispersion by Value/Time
USRE - Last Chance Portfolio Dispersion by Value/Time 41% Value Eu FOB US -Value Contribution (USD/metric tonne REO) 3% REO's (49.8wt%) $4,164 $3,744 $4,112 $4,496 97% REO's (49.6wt%) $126,764 $120,462 $134,444 $150,783 Total $130,928 $124,206 $138,556 $155,279 (1) Source: Activation Laboratories, L
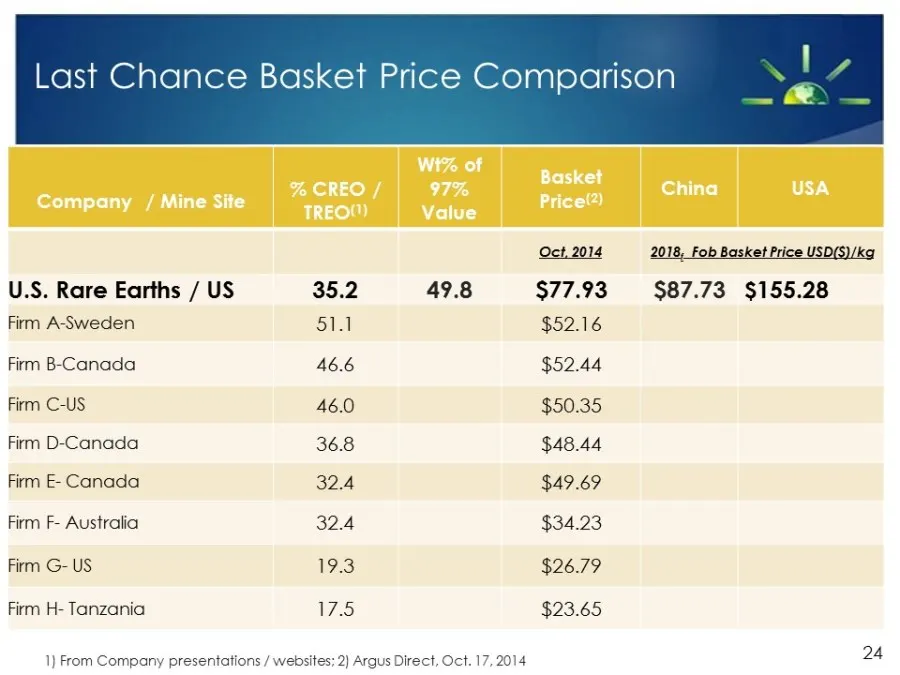
Slide 24: Last Chance Basket Price Comparison
Last Chance Basket Price Comparison Oct, 2014 2018, Fob Basket Price USD(S)/kg U.S. Rare Earths / US 35.2 49.8 $77.93 $87.73 $155.28 Firm A-Sweden S18 $52.16 Firm B-Canada 46.6 $52.44 Firm C-US 46.0 $50.35 Firm D-Canada 36.8 $48.44 Firm E- Canada 32.4 $49.69 Firm F- Australia 32.4 $34.23 Firm G- US
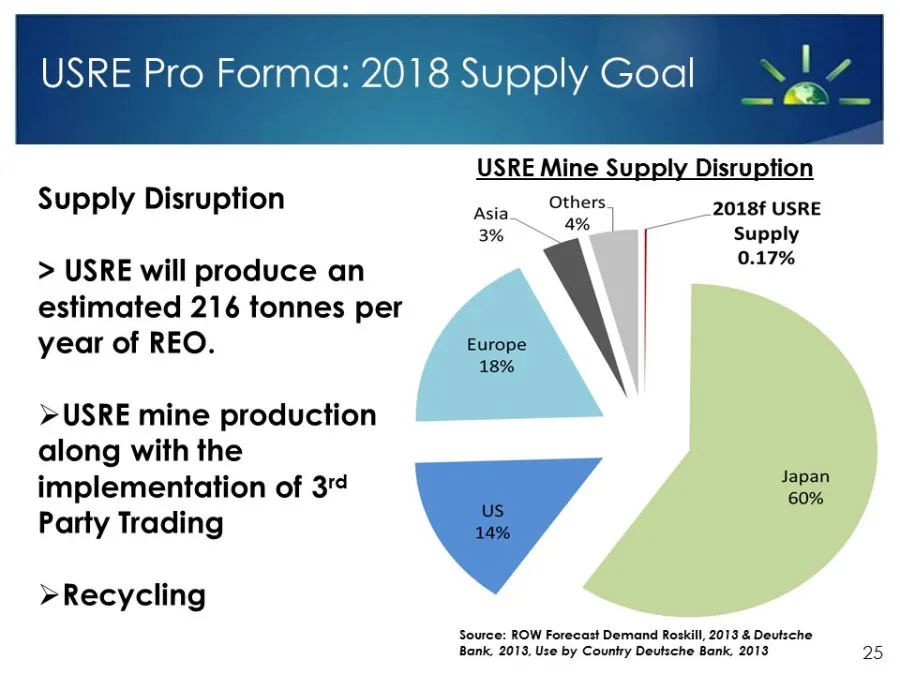
Slide 25: Supply Disruption: Others 2018f USRE
Supply Disruption |. Others 2018f USRE Asia 3% a Supply > USRE will produce an adie estimated 216 tonnes per year of REO. Europe 18% >USRE mine production along with the implementation of 3'¢ apn Party Trading > Recycling Source: ROW Forecast Demand Roskill, 2013 & Deutsche Bank, 2013, Use by Countr
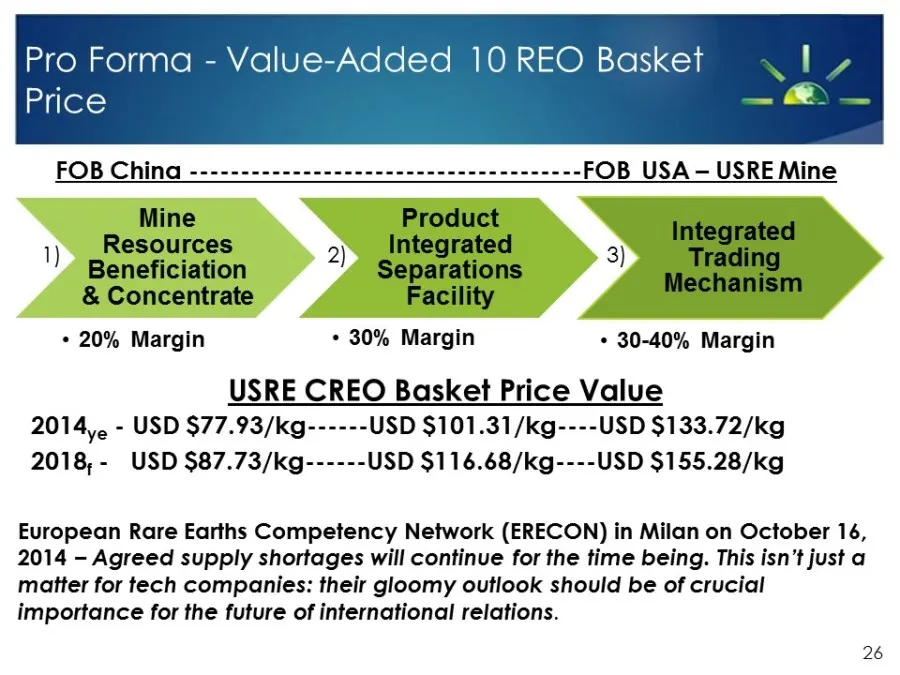
Slide 26: FOB China vs FOB USA — USRE Mine
FOB China -------------------------------------- FOB USA — USRE Mine Mine Product 1 ‘ 1) Resources 2) Integrated 3) ieorne Beneficiation Separations Mechanism & Concentrate Facility + 20% Margin + 30% Margin * 30-40% Margin USRE CREO Basket Price Value 2014, - USD $77.93/kg------USD $101.31/kg----US
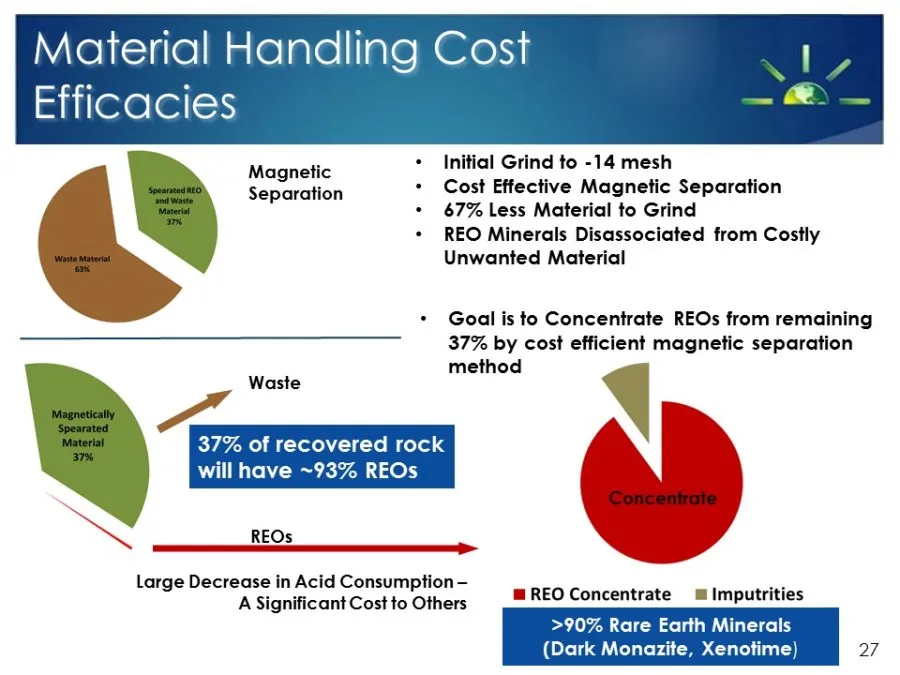
Slide 27: Material Handling Cost
Material Handling Cost Efficacies Magnetic y Separation 2 r OR x ~~ > _@ . Waste Initial Grind to -14 mesh Cost Effective Magnetic Separation 67% Less Material to Grind REO Minerals Disassociated from Costly Unwanted Material Goal is to Concentrate REOs from remaining 37% by cost efficient magnetic
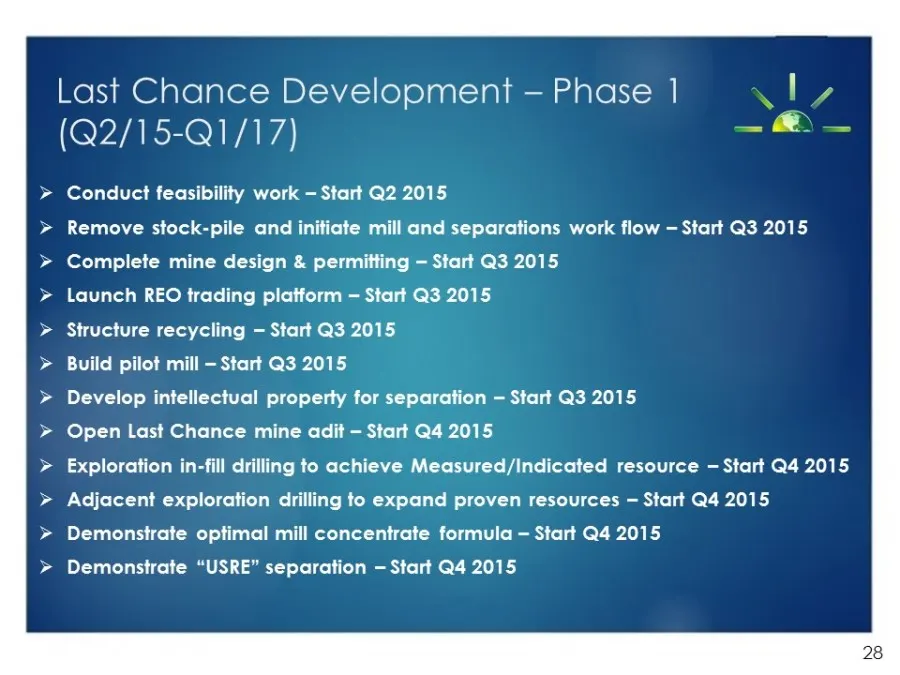
Slide 28: Last Chance Development — Phase
Last Chance Development — Phase 1 (Q2/15-Q1/17) Conduct feasibility work — Start Q2 2015 Remove stock-pile and initiate mill and separations work flow — Start Q3 2015 Complete mine design & permitting — Start Q3 2015 Launch REO trading platform — Start Q3 2015 Structure recycling — Start Q3 2015 Bui
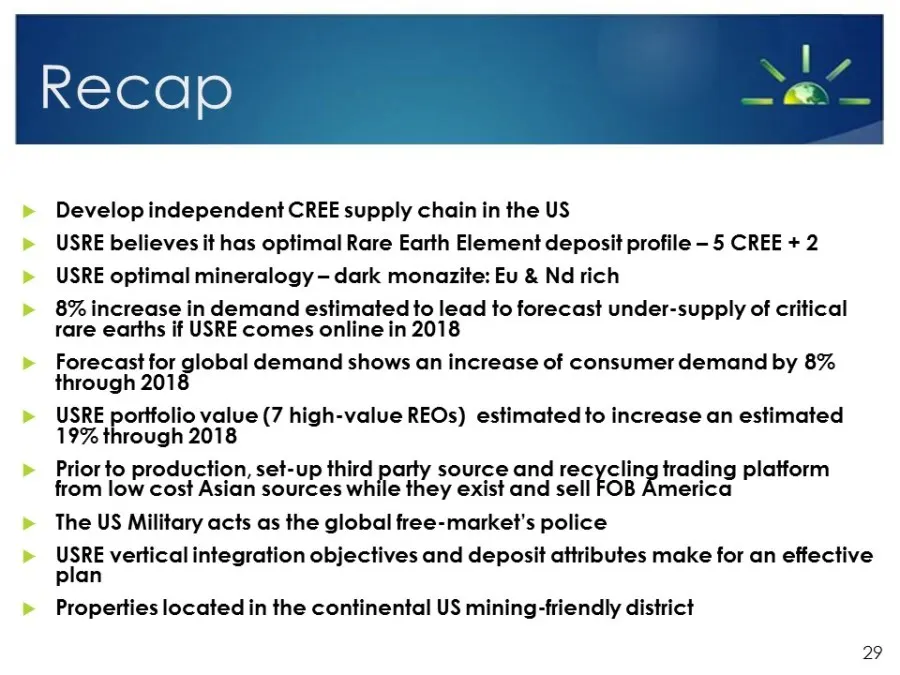
Slide 29: Develop independent CREE supply chain in the US
Develop independent CREE supply chain in the US USRE believes it has optimal Rare Earth Element deposit profile — 5 CREE + 2 USRE optimal mineralogy — dark monazite: Eu & Nd rich 8% increase in demand estimated to lead to forecast under-supply of critical rare earths if USRE comes online in 2018 For
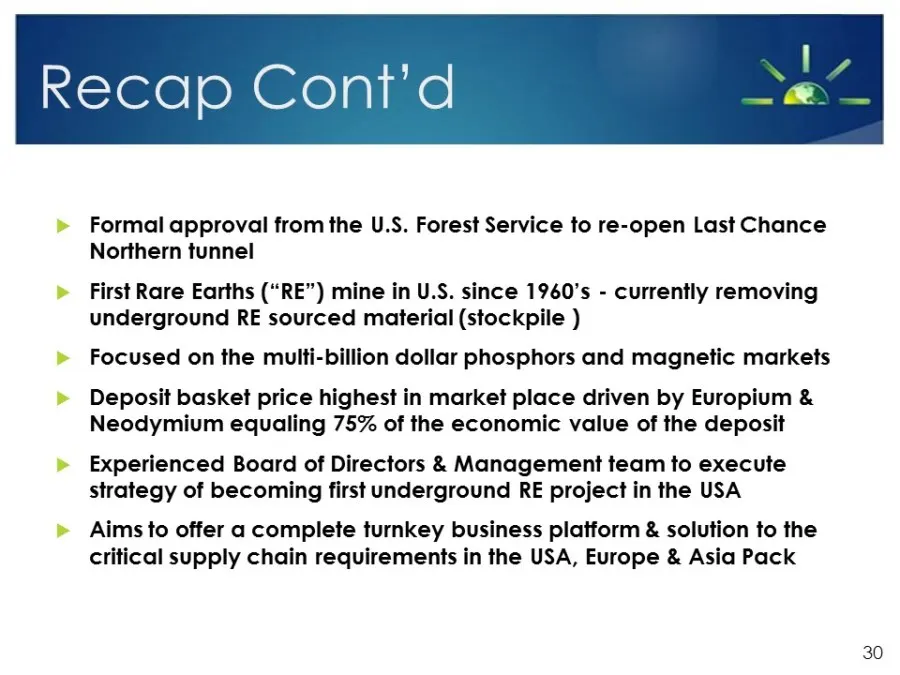
Slide 30: Recap
Recap Conia Formal approval from the U.S. Forest Service to re-open Last Chance Northern tunnel First Rare Earths (“RE”) mine in U.S. since 1960’s - currently removing underground RE sourced material (stockpile ) Focused on the multi-billion dollar phosphors and magnetic markets Deposit basket price
Slide 31: Questions? Thank You
Questions? l Thank You 31
Source: SEC EDGAR · 8-K filed Mar 5, 2015