PacWest Bancorp — RBC Financial Institutions Conference 2012
48 slides from PacWest Bancorp's conference presentation, Apr 27, 2012
Slide 1: RBC Financial Institutions Conference
RBC Financial Institutions Conference May 1, 2012 Boston, Massachusetts
Slide 2: Forward-Looking Statements and Where to Find Additional Information
May 1, 2012 RBC Financial Institutions Conference 2 Forward-Looking Statements and Where to Find Additional Information This presentation contains certain forward-looking information about PacWest Bancorp that is intended to be covered by the safe harbor for “forward-looking statements” provided by
Slide 3: Stock Summary
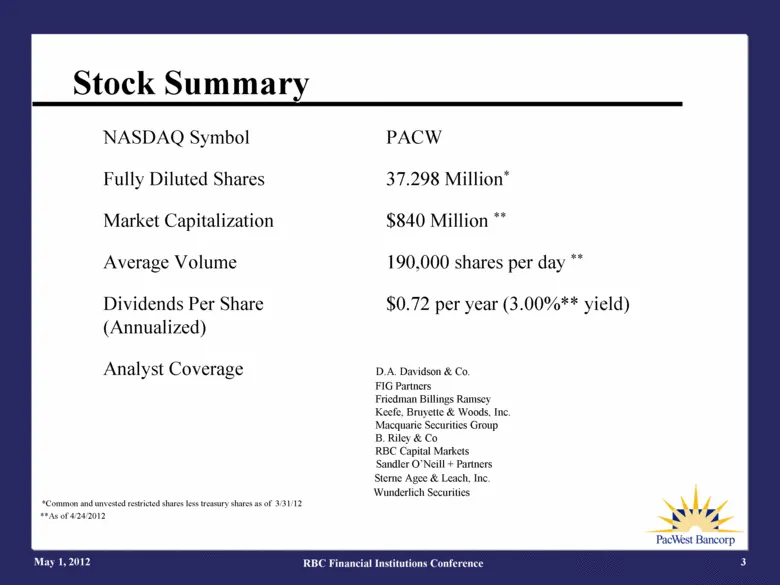
May 1, 2012 RBC Financial Institutions Conference 3 NASDAQ Symbol PACW Fully Diluted Shares 37.298 Million* Market Capitalization $840 Million ** Average Volume 190,000 shares per day ** Dividends Per Share $0.72 per year (3.00%** yield) (Annualized) Analyst Coverage D.A. Davidson & Co. FIG Partners
Slide 4: PacWest Bancorp agenda
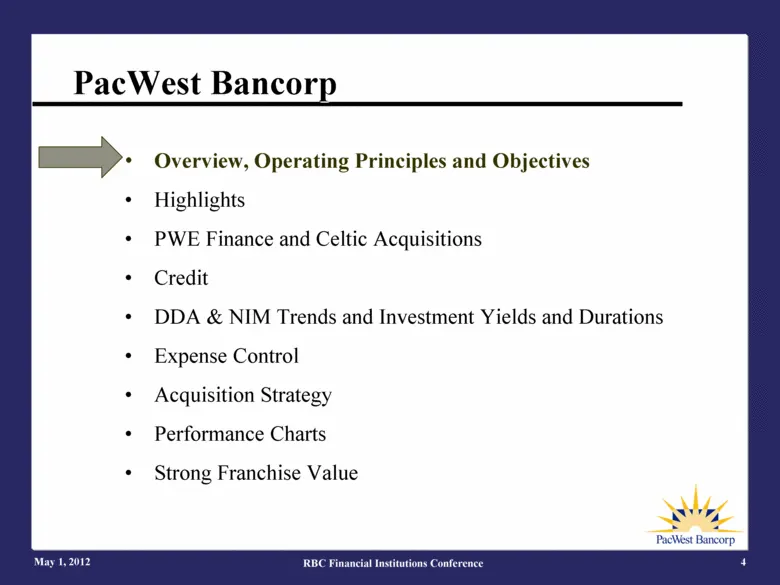
PacWest Bancorp May 1, 2012 RBC Financial Institutions Conference 4 Overview, Operating Principles and Objectives Highlights PWE Finance and Celtic Acquisitions Credit DDA & NIM Trends and Investment Yields and Durations Expense Control Acquisition Strategy Performance Charts Strong Franchise Value
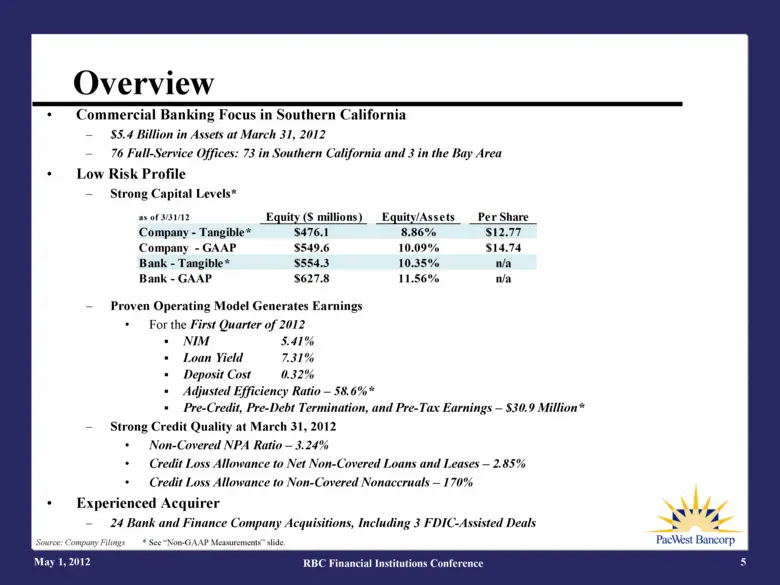
Slide 5: Commercial Banking Focus in Southern California
May 1, 2012 RBC Financial Institutions Conference 5 Source: Company Filings * See “Non-GAAP Measurements” slide. Commercial Banking Focus in Southern California $5.4 Billion in Assets at March 31, 2012 76 Full-Service Offices: 73 in Southern California and 3 in the Bay Area Low Risk Profile Strong C
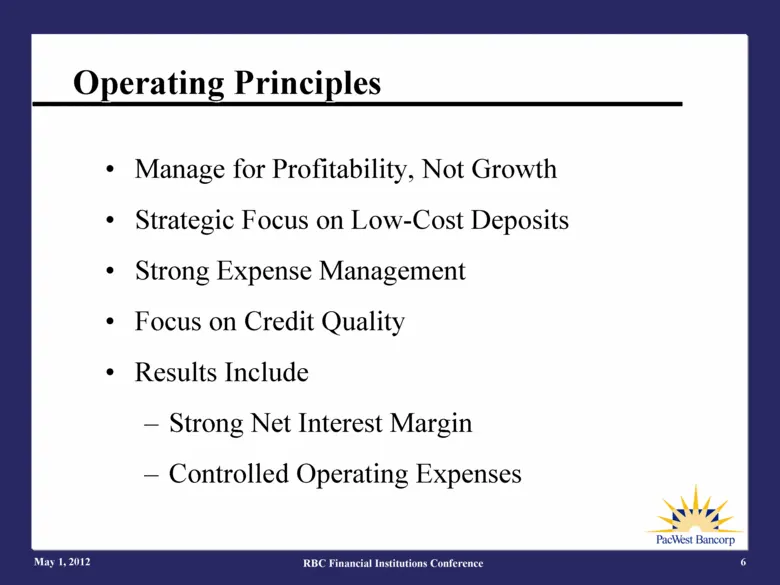
Slide 6: Operating Principles
May 1, 2012 RBC Financial Institutions Conference 6 Operating Principles Manage for Profitability, Not Growth Strategic Focus on Low-Cost Deposits Strong Expense Management Focus on Credit Quality Results Include Strong Net Interest Margin Controlled Operating Expenses
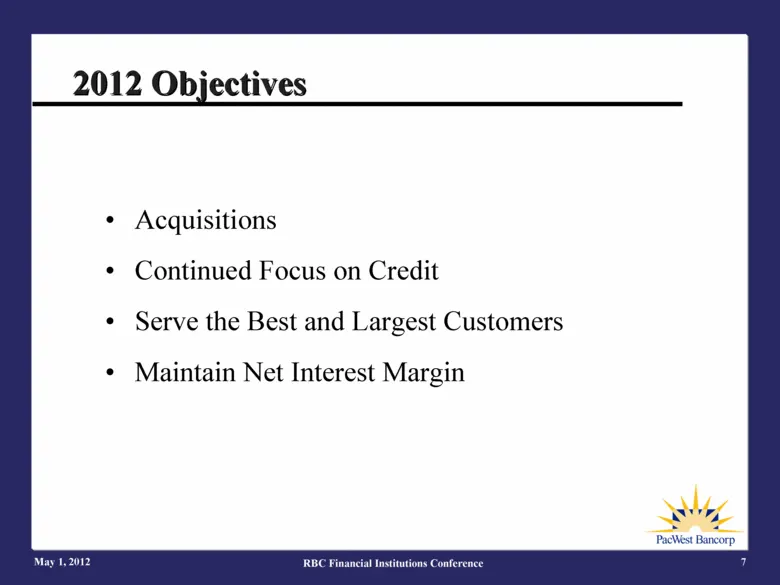
Slide 7: 2012 Objectives
May 1, 2012 RBC Financial Institutions Conference 7 2012 Objectives Acquisitions Continued Focus on Credit Serve the Best and Largest Customers Maintain Net Interest Margin
Slide 8: PacWest Bancorp agenda
PacWest Bancorp May 1, 2012 RBC Financial Institutions Conference 8 Overview, Operating Principles and Objectives Highlights PWE Finance and Celtic Acquisitions Credit DDA & NIM Trends and Investment Yields and Durations Expense Control Acquisition Strategy Performance Charts Strong Franchise Value
Slide 9: 1Q12 Highlights
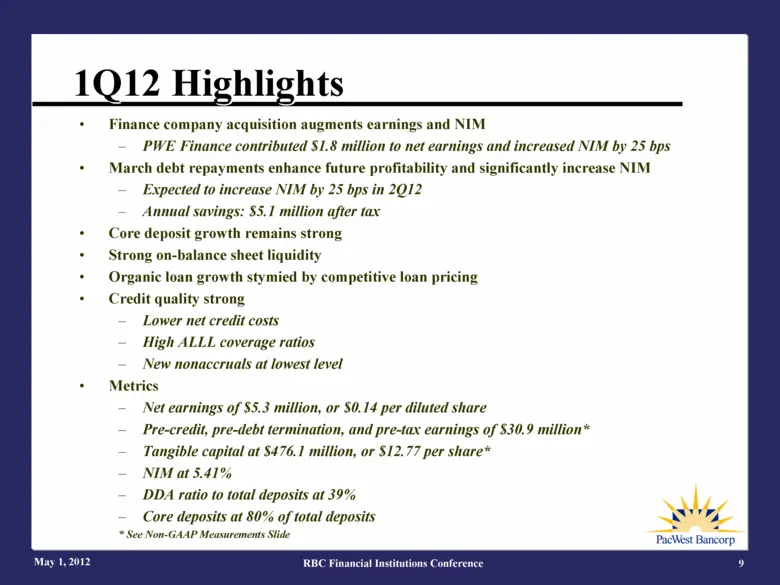
1Q12 Highlights Finance company acquisition augments earnings and NIM PWE Finance contributed $1.8 million to net earnings and increased NIM by 25 bps March debt repayments enhance future profitability and significantly increase NIM Expected to increase NIM by 25 bps in 2Q12 Annual savings: $5.1 mil
Slide 10: Net Earnings (Loss)
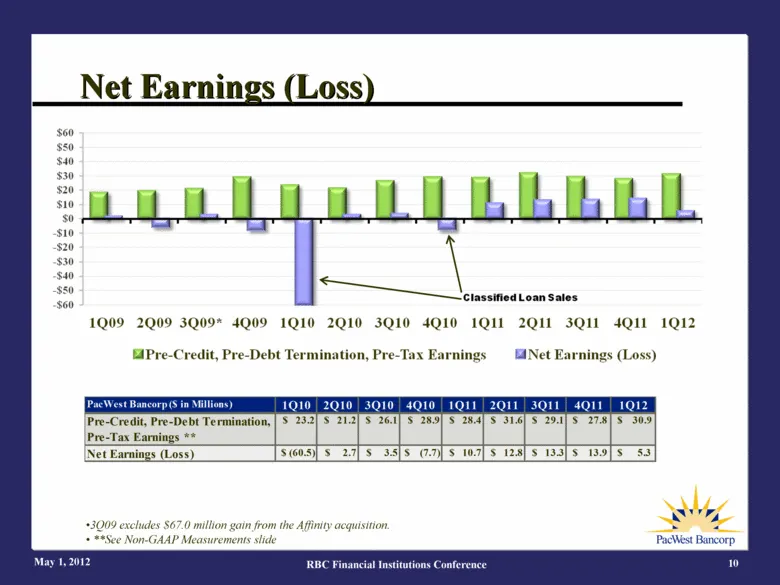
Net Earnings (Loss) May 1, 2012 10 3Q09 excludes $67.0 million gain from the Affinity acquisition. **See Non-GAAP Measurements slide RBC Financial Institutions Conference PacWest Bancorp ($ in Millions) 1Q10 2Q10 3Q10 4Q10 1Q11 2Q11 3Q11 4Q11 1Q12 Pre-Credit, Pre-Debt Termination, Pre-Tax Earnings *
Slide 11: PacWest Bancorp agenda
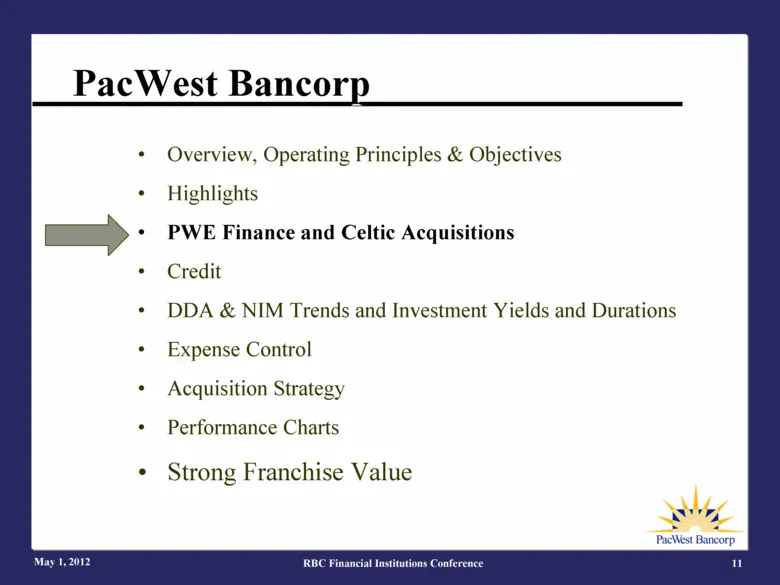
PacWest Bancorp Overview, Operating Principles & Objectives Highlights PWE Finance and Celtic Acquisitions Credit DDA & NIM Trends and Investment Yields and Durations Expense Control Acquisition Strategy Performance Charts Strong Franchise Value May 1, 2012 RBC Financial Institutions Conference 11
Slide 12: PWE Finance and Celtic Acquisitions
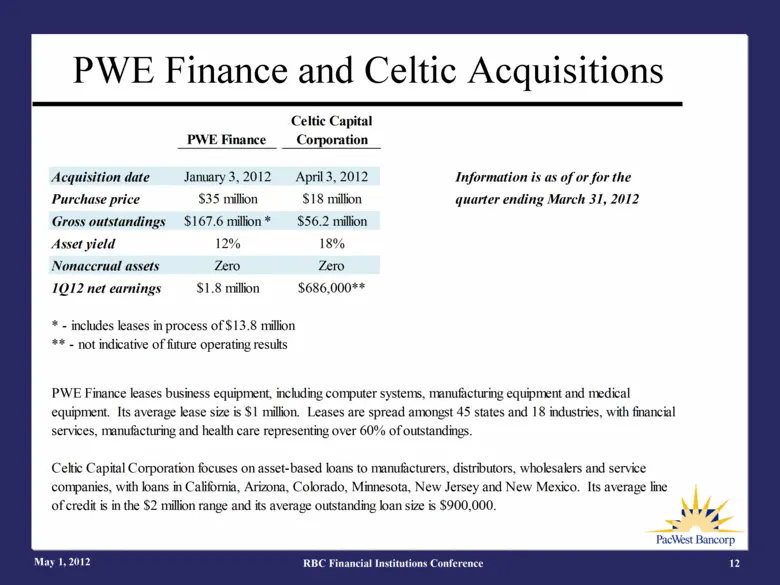
PWE Finance and Celtic Acquisitions May 1, 2012 RBC Financial Institutions Conference 12 Acquisition date January 3, 2012 April 3, 2012 Information is as of or for the Purchase price $35 million $18 million quarter ending March 31, 2012 Gross outstandings $167.6 million * $56.2 million Asset yield 1
Slide 13: PacWest Bancorp agenda
PacWest Bancorp May 1, 2012 RBC Financial Institutions Conference 13 Overview, Operating Principles & Objectives Highlights PWE Finance and Celtic Acquisitions Credit DDA & NIM Trends and Investment Yields and Durations Expense Control Acquisition Strategy Performance Charts Strong Franchise Value
Slide 14: Loan Credit Quality Steadily Improving
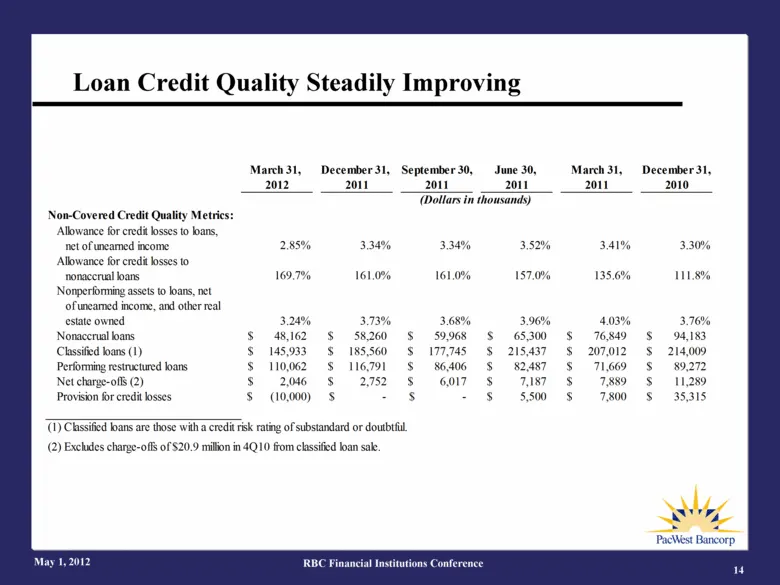
Loan Credit Quality Steadily Improving May 1, 2012 RBC Financial Institutions Conference 14 March 31, December 31, September 30, June 30, March 31, December 31, 2012 2011 2011 2011 2011 2010 (Dollars in thousands) Non-Covered Credit Quality Metrics: Allowance for credit losses to loans, net of unear
Slide 15: Strong Credit Coverage Ratios
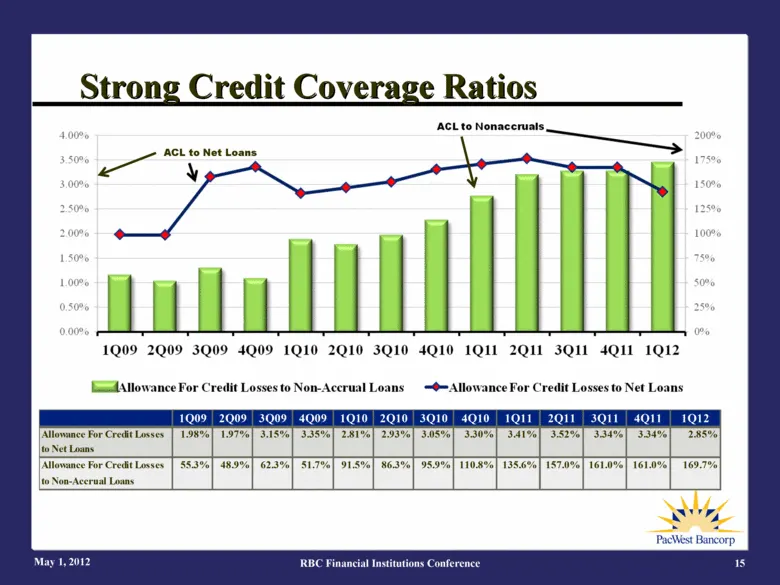
Strong Credit Coverage Ratios May 1, 2012 15 RBC Financial Institutions Conference ACL to Net Loans 1Q09 2Q09 3Q09 4Q09 1Q10 2Q10 3Q10 4Q10 1Q11 2Q11 3Q11 4Q11 1Q12 Allowance For Credit Losses to Net Loans Allowance For Credit Losses to Non-Accrual Loans 2.85% 169.7% 161.0% 3.34% 86.3% 95.9% 110.8%
Slide 16: Non-Accrual Loans Trending Down
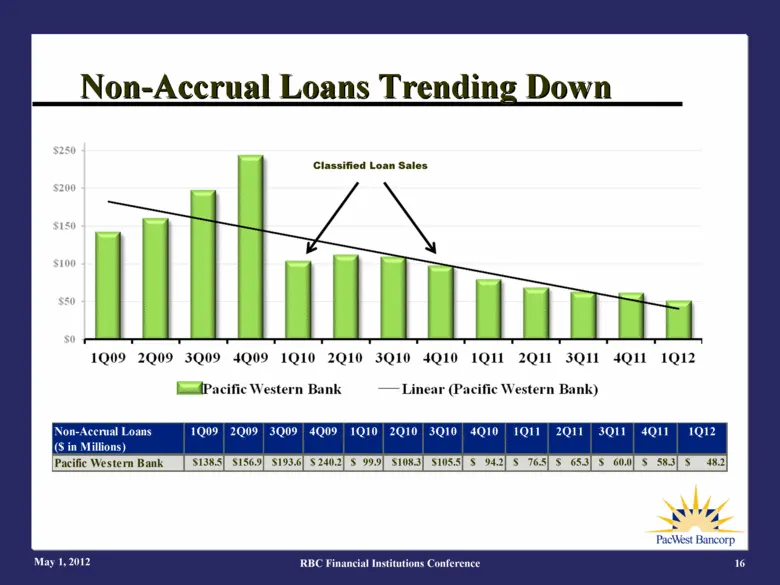
Non-Accrual Loans Trending Down May 1, 2012 16 RBC Financial Institutions Conference Classified Loan Sales Non-Accrual Loans ($ in Millions) 1Q09 2Q09 3Q09 4Q09 1Q10 2Q10 3Q10 4Q10 1Q11 2Q11 3Q11 4Q11 1Q12 Pacific Western Bank $138.5 $156.9 $193.6 $ 240.2 $ 99.9 $108.3 $105.5 $ 94.2 $ 76.5 $ 65.3 $
Slide 17: New Non-Accrual Loans at Lowest Level
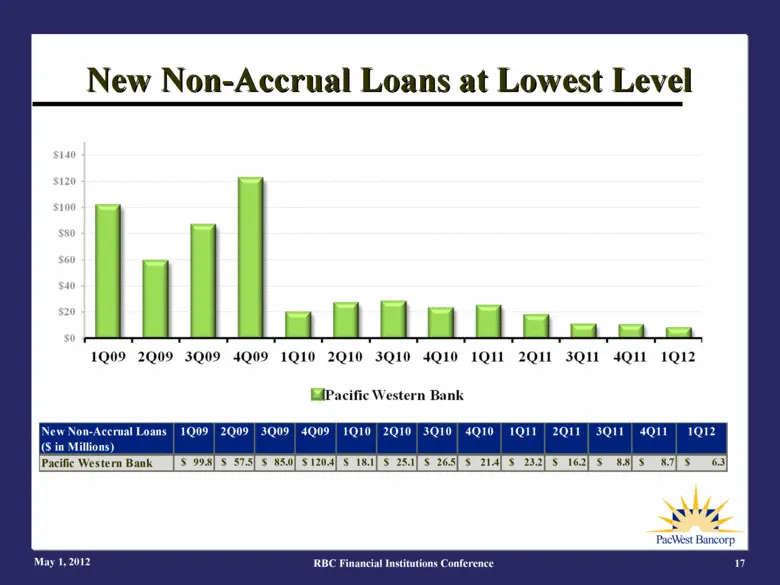
New Non-Accrual Loans at Lowest Level May 1, 2012 17 RBC Financial Institutions Conference New Non-Accrual Loans ($ in Millions) 1Q09 2Q09 3Q09 4Q09 1Q10 2Q10 3Q10 4Q10 1Q11 2Q11 3Q11 4Q11 1Q12 Pacific Western Bank $ 99.8 $ 57.5 $ 85.0 $ 120.4 $ 18.1 $ 25.1 $ 26.5 $ 21.4 $ 23.2 $ 16.2 $ 8.8 $ 8.7 $
Slide 18: Classified Loans Declined from Crisis High
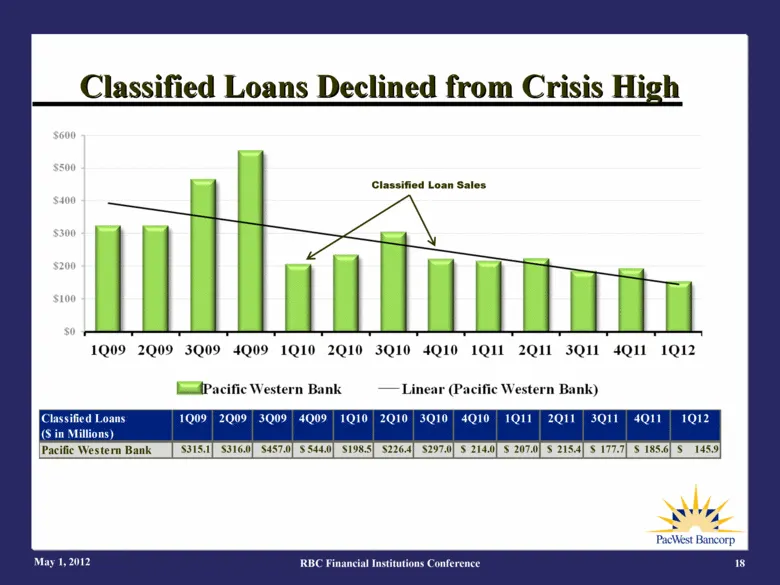
Classified Loans Declined from Crisis High May 1, 2012 18 RBC Financial Institutions Conference Classified Loan Sales Classified Loans ($ in Millions) 1Q09 2Q09 3Q09 4Q09 1Q10 2Q10 3Q10 4Q10 1Q11 2Q11 3Q11 4Q11 1Q12 Pacific Western Bank $315.1 $316.0 $457.0 $ 544.0 $198.5 $226.4 $297.0 $ 214.0 $ 207
Slide 19: Non-Performing Assets Trending Down
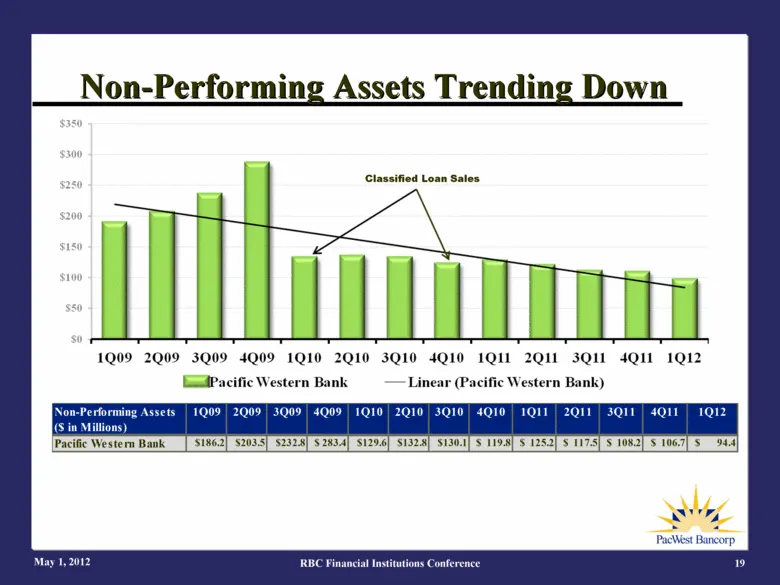
Non-Performing Assets Trending Down May 1, 2012 19 RBC Financial Institutions Conference Classified Loan Sales Non-Performing Assets ($ in Millions) 1Q09 2Q09 3Q09 4Q09 1Q10 2Q10 3Q10 4Q10 1Q11 2Q11 3Q11 4Q11 1Q12 Pacific Western Bank $186.2 $203.5 $232.8 $ 283.4 $129.6 $132.8 $130.1 $ 119.8 $ 125.2
Slide 20: Largest Non-Covered Nonaccrual Loans
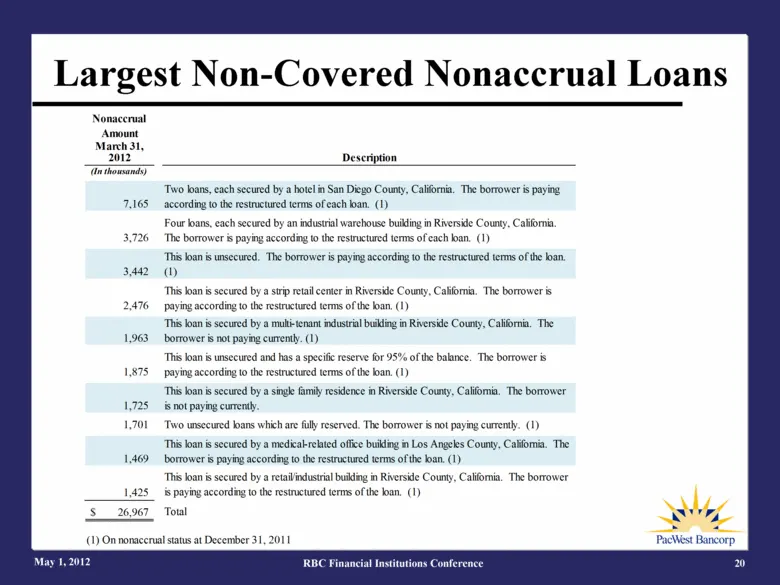
Largest Non-Covered Nonaccrual Loans May 1, 2012 RBC Financial Institutions Conference 20 Nonaccrual Amount March 31, 2012 Description (In thousands) 7,165 Two loans, each secured by a hotel in San Diego County, California. The borrower is paying according to the restructured terms of each loan. (1)
Slide 21: Non-Covered Loan Charge-Off History
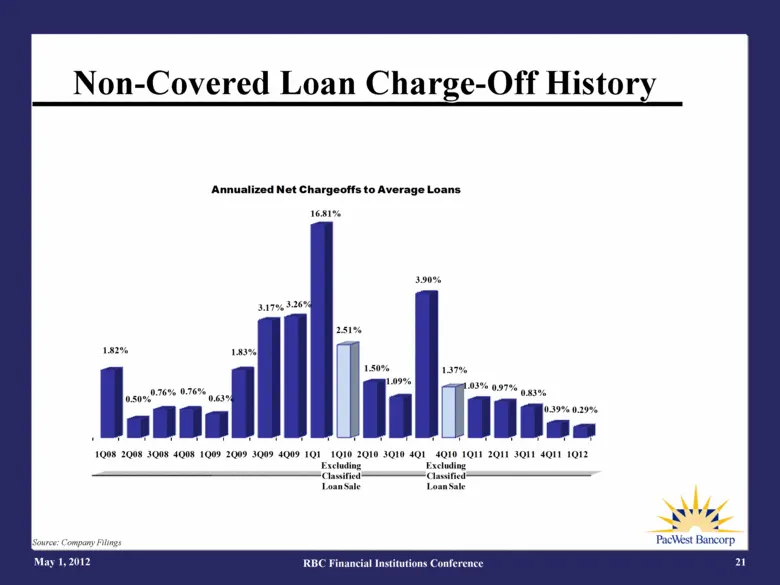
May 1, 2012 RBC Financial Institutions Conference 21 Non-Covered Loan Charge-Off History Source: Company Filings 1Q08 2Q08 3Q08 4Q08 1Q09 2Q09 3Q09 4Q09 1Q10 Excluding Classified Loan Sale 2Q10 3Q10 4Q10 Excluding Classified Loan Sale 2Q11 3Q11 4Q11 1Q12 1.82% 0.50% 0.76% 0.76% 0.63% 1.83% 3.17% 3.2
Slide 22: Net Credit Costs Have Declined
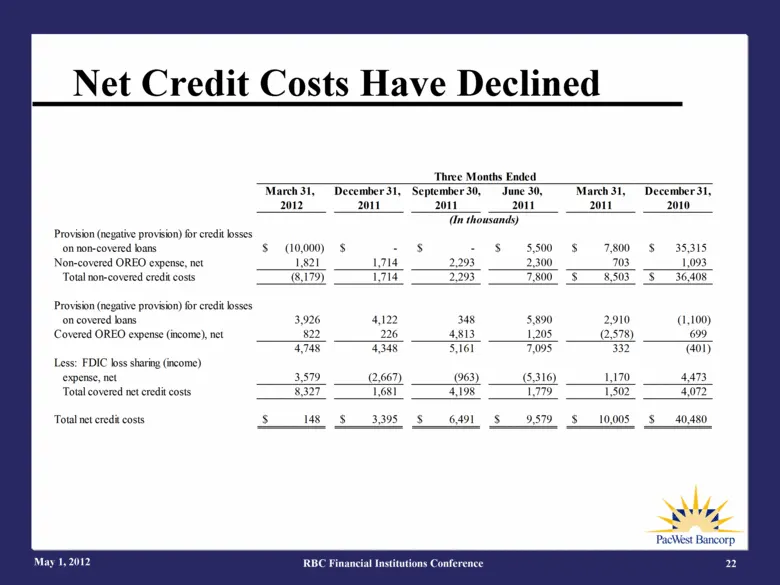
Net Credit Costs Have Declined May 1, 2012 RBC Financial Institutions Conference 22 Three Months Ended March 31, December 31, September 30, June 30, March 31, December 31, 2012 2011 2011 2011 2011 2010 (In thousands) Provision (negative provision) for credit losses on non-covered loans (10,000) $ -
Slide 23: Loan Portfolio Concentrations
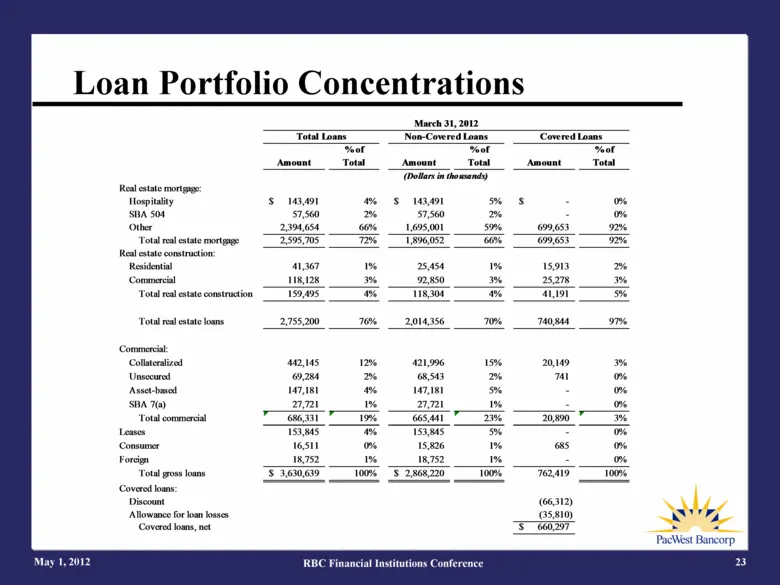
May 1, 2012 RBC Financial Institutions Conference 23 Loan Portfolio Concentrations March 31, 2012 Total Loans Non-Covered Loans Covered Loans % of % of % of Amount Total Amount Total Amount Total (Dollars in thousands) Real estate mortgage: Hospitality 143,491 $ 4% 143,491 $ 5% - $ 0% SBA 504 57,560
Slide 24: Non-Covered Real Estate Mortgage Exposure
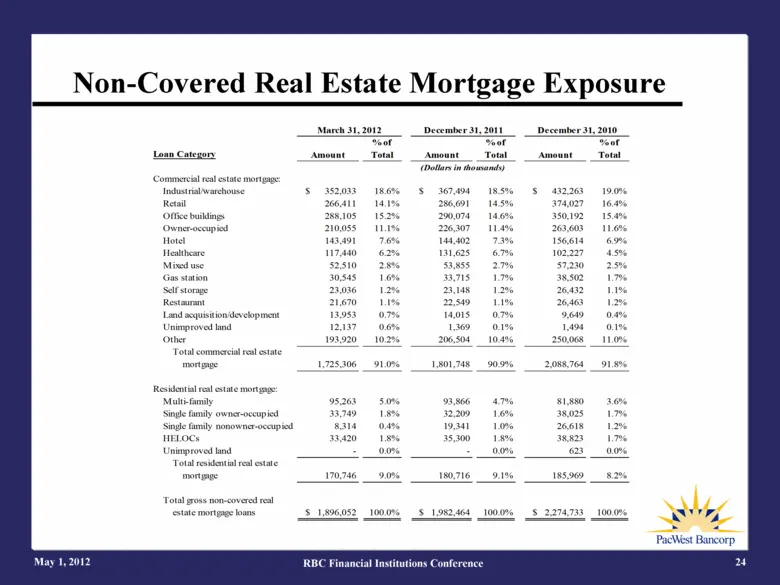
May 1, 2012 RBC Financial Institutions Conference 24 Non-Covered Real Estate Mortgage Exposure March 31, 2012 December 31, 2011 December 31, 2010 % of % of % of Loan Category Amount Total Amount Total Amount Total (Dollars in thousands) Commercial real estate mortgage: Industrial/warehouse $ 352,033
Slide 25: Covered Real Estate Loan Exposure
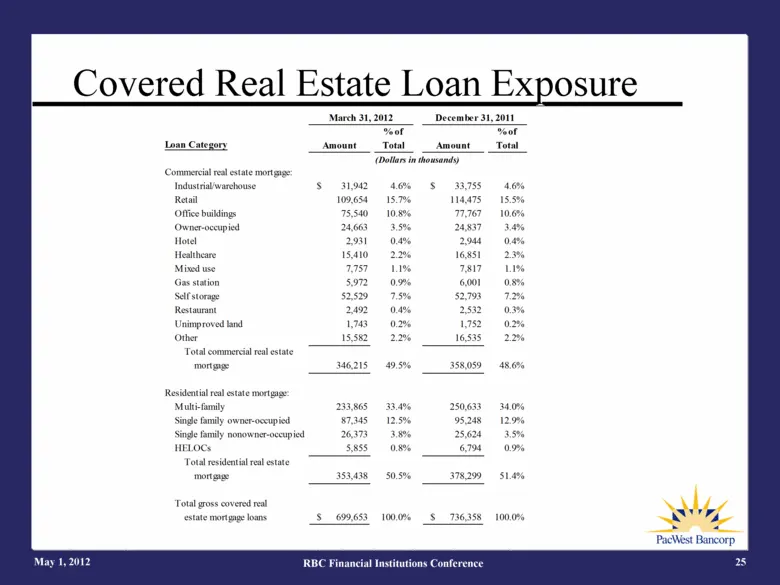
Covered Real Estate Loan Exposure May 1, 2012 RBC Financial Institutions Conference 25 March 31, 2012 December 31, 2011 % of % of Loan Category Amount Total Amount Total (Dollars in thousands) Commercial real estate mortgage: Industrial/warehouse $ 31,942 4.6% $ 33,755 4.6% Retail 109,654 15.7% 114,
Slide 26: Other Real Estate Owned
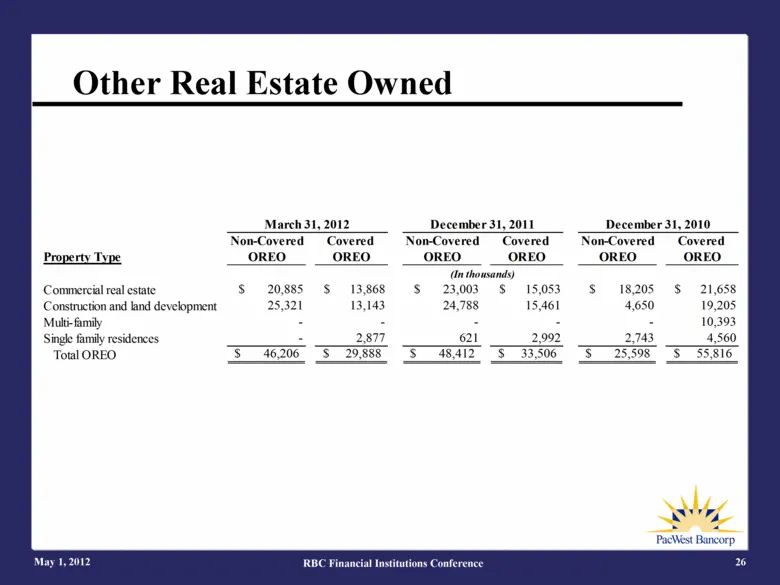
May 1, 2012 RBC Financial Institutions Conference 26 Other Real Estate Owned Non-Covered Covered Non-Covered Covered Non-Covered Covered Property Type OREO OREO OREO OREO OREO OREO (In thousands) Commercial real estate $ 20,885 $ 13,868 $ 23,003 $ 15,053 $ 18,205 $ 21,658 Construction and land devel
Slide 27: PacWest Bancorp agenda
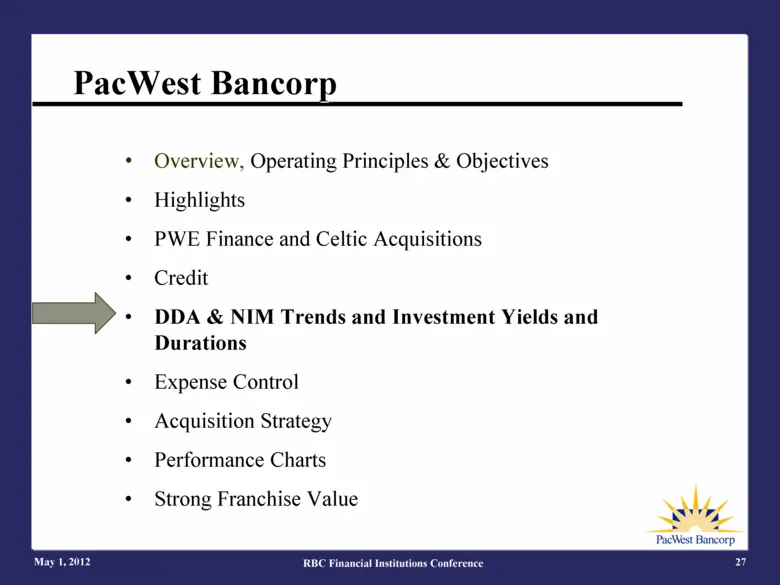
PacWest Bancorp May 1, 2012 RBC Financial Institutions Conference 27 Overview, Operating Principles & Objectives Highlights PWE Finance and Celtic Acquisitions Credit DDA & NIM Trends and Investment Yields and Durations Expense Control Acquisition Strategy Performance Charts Strong Franchise Value
Slide 28: Non Interest-Bearing Deposits to Total Deposits
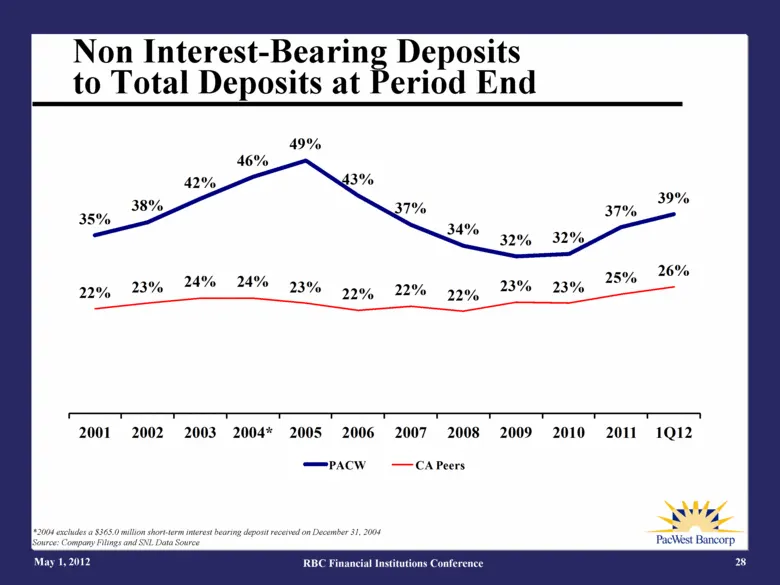
May 1, 2012 RBC Financial Institutions Conference 28 Non Interest-Bearing Deposits to Total Deposits at Period End *2004 excludes a $365.0 million short-term interest bearing deposit received on December 31, 2004 Source: Company Filings and SNL Data Source 35% 38% 42% 46% 49% 43% 37% 34% 32% 32% 37%
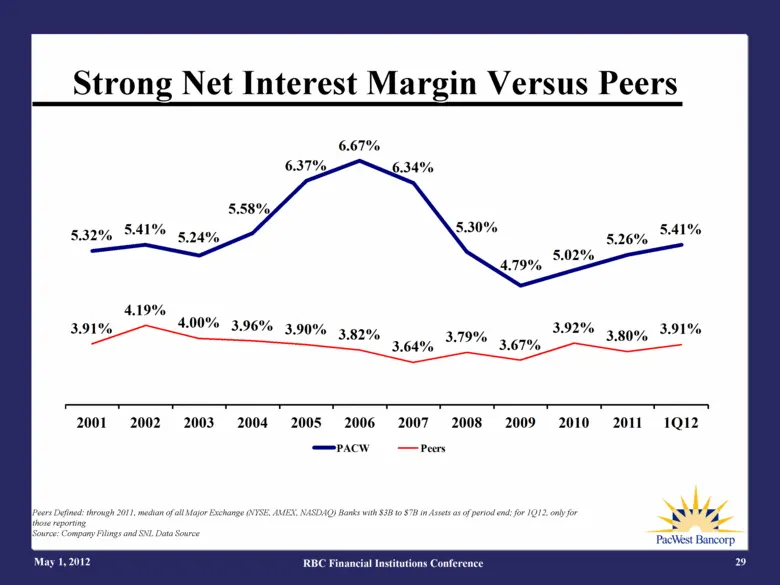
Slide 29: Strong Net Interest Margin Versus Peers
Strong Net Interest Margin Versus Peers May 1, 2012 RBC Financial Institutions Conference 29 Peers Defined: through 2011, median of all Major Exchange (NYSE, AMEX, NASDAQ) Banks with $3B to $7B in Assets as of period end; for 1Q12, only for those reporting Source: Company Filings and SNL Data Source
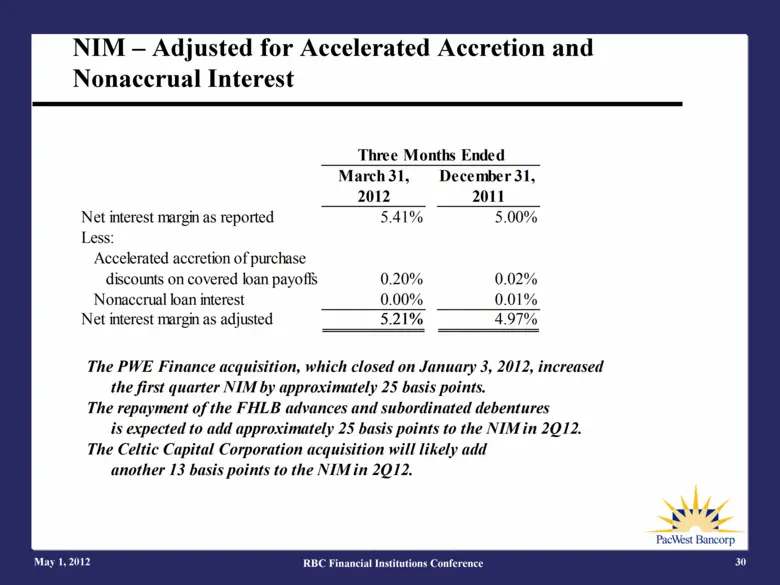
Slide 30: NIM – Adjusted for Accelerated Accretion and Nonaccrual Interest
NIM – Adjusted for Accelerated Accretion and Nonaccrual Interest May 1, 2012 RBC Financial Institutions Conference 30 Three Months Ended March 31, December 31, 2012 2011 Net interest margin as reported 5.41% 5.00% Less: Accelerated accretion of purchase discounts on covered loan payoffs 0.20% 0.02%
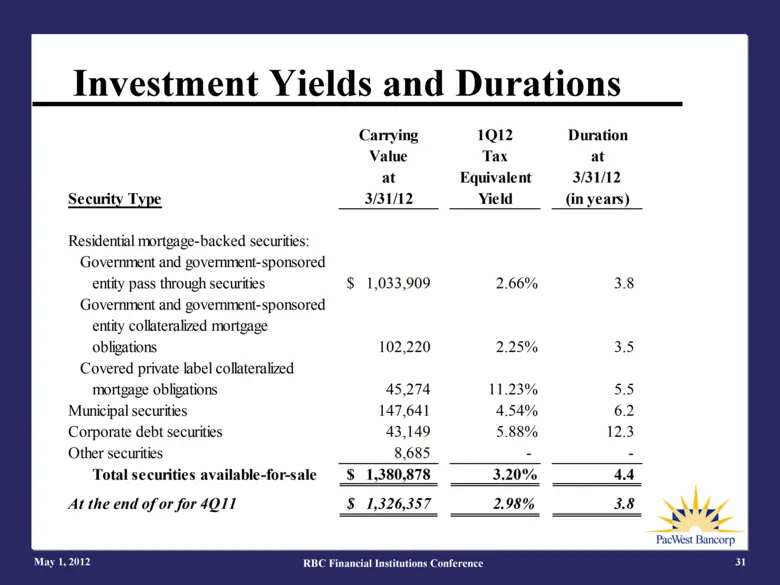
Slide 31: Investment Yields and Durations
Investment Yields and Durations May 1, 2012 RBC Financial Institutions Conference 31 Carrying 1Q12 Duration Value Tax at at Equivalent 3/31/12 Security Type 3/31/12 Yield (in years) Residential mortgage-backed securities: Government and government-sponsored entity pass through securities 1,033,909 $
Slide 32: PacWest Bancorp agenda
PacWest Bancorp May 1, 2012 RBC Financial Institutions Conference 32 Overview, Operating Principles & Objectives Highlights PWE Finance and Celtic Acquisitions Credit DDA & NIM Trends and Investment Yields and Durations Expense Control Acquisition Strategy Performance Charts Strong Franchise Value
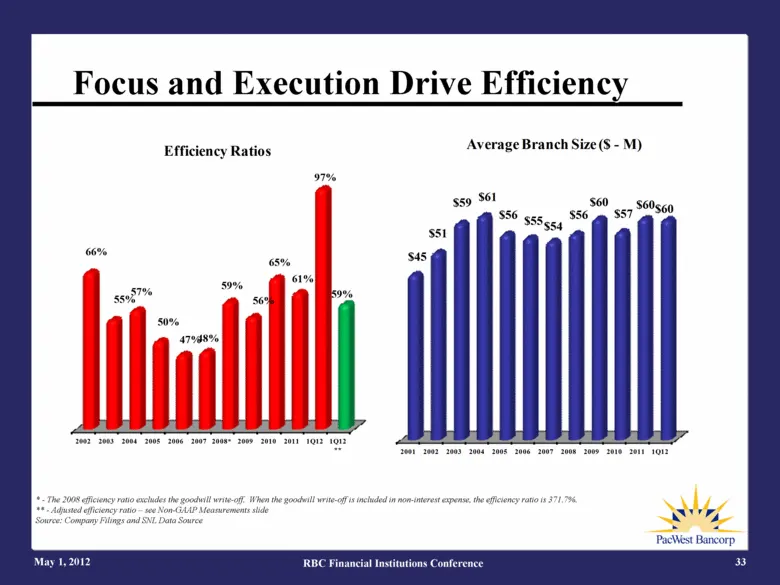
Slide 33: Focus and Execution Drive Efficiency
May 1, 2012 RBC Financial Institutions Conference 33 * - The 2008 efficiency ratio excludes the goodwill write-off. When the goodwill write-off is included in non-interest expense, the efficiency ratio is 371.7%. ** - Adjusted efficiency ratio – see Non-GAAP Measurements slide Source: Company Filing
Slide 34: PacWest Bancorp agenda
PacWest Bancorp May 1, 2012 RBC Financial Institutions Conference 34 Overview, Operating Principles & Objectives Highlights PWE Finance and Celtic Acquisitions Credit DDA & NIM Trends and Investment Yields and Durations Expense Control Acquisition Strategy Performance Charts Strong Franchise Value
Slide 35: Acquisition Strategy
Acquisition Strategy May 1, 2012 RBC Financial Institutions Conference 35 Similar Strategic Focus Asset generation capability Market Expansion In-Market Consolidation Key Drivers of Accretion Cost Savings Customer Retention Margin Improvement
Slide 36: PacWest Bancorp agenda
PacWest Bancorp May 1, 2012 RBC Financial Institutions Conference 36 Overview, Operating Principles & Objectives Highlights PWE Finance and Celtic Acquisitions Credit DDA & NIM Trends and Investment Yields and Durations Expense Control Acquisition Strategy Performance Charts Strong Franchise Value
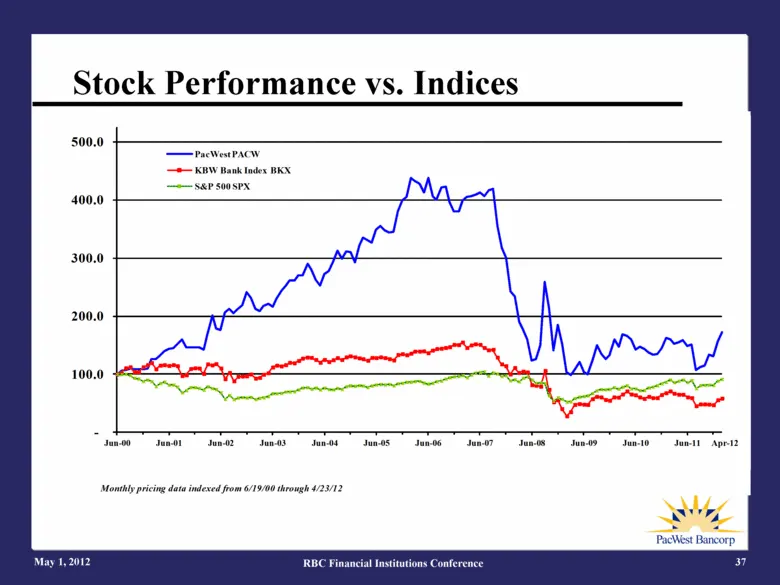
Slide 37: Stock Performance vs. Indices
May 1, 2012 RBC Financial Institutions Conference 37 Stock Performance vs. Indices Monthly pricing data indexed from 6/19/00 through 4/23/12 - 100.0 200.0 300.0 400.0 500.0 Jun - 00 Jun - 01 Jun - 02 Jun - 03 Jun - 04 Jun - 05 Jun - 06 Jun - 07 Jun - 08 Jun - 09 Jun - 10 Jun - 11 PacWest PACW KBW Ba
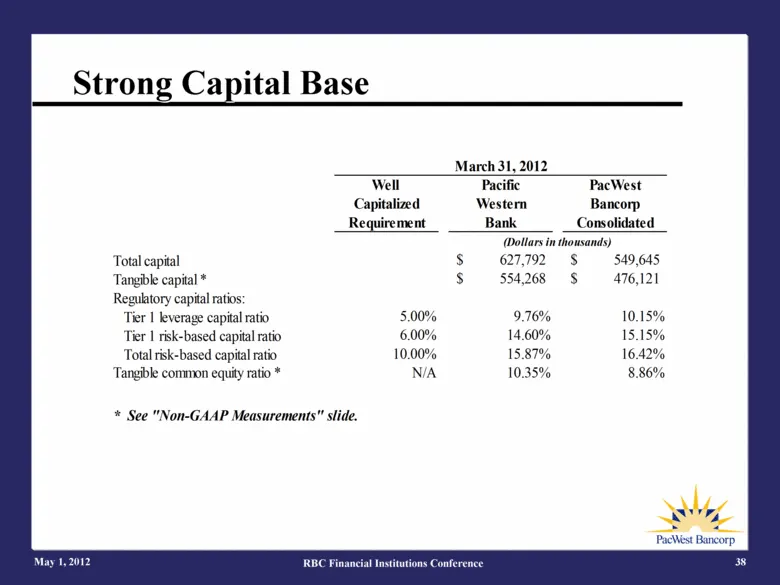
Slide 38: Strong Capital Base
Strong Capital Base May 1, 2012 RBC Financial Institutions Conference 38 March 31, 2012 Well Pacific PacWest Capitalized Western Bancorp Requirement Bank Consolidated (Dollars in thousands) Total capital 627,792 $ 549,645 $ Tangible capital * 554,268 $ 476,121 $ Regulatory capital ratios: Tier 1 lev
Slide 39: PacWest Bancorp agenda
PacWest Bancorp May 1, 2012 RBC Financial Institutions Conference 39 Overview, Operating Principles & Objectives Highlights PWE Finance and Celtic Acquisitions Credit DDA & NIM Trends and Investment Yields and Durations Expense Control Acquisition Strategy Performance Charts Strong Franchise Value
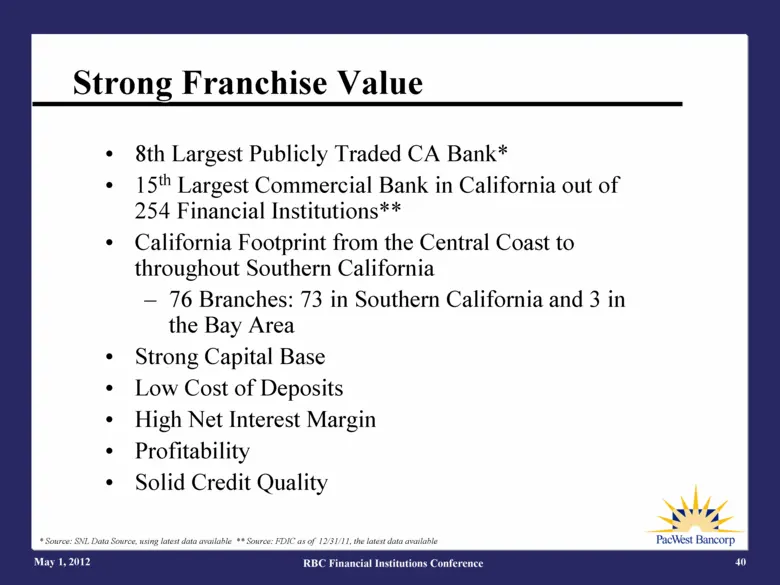
Slide 40: Strong Franchise Value
Strong Franchise Value May 1, 2012 RBC Financial Institutions Conference 40 * Source: SNL Data Source, using latest data available ** Source: FDIC as of 12/31/11, the latest data available 8th Largest Publicly Traded CA Bank* 15th Largest Commercial Bank in California out of 254 Financial Institutio
Slide 41: Attractive Southern California Footprint
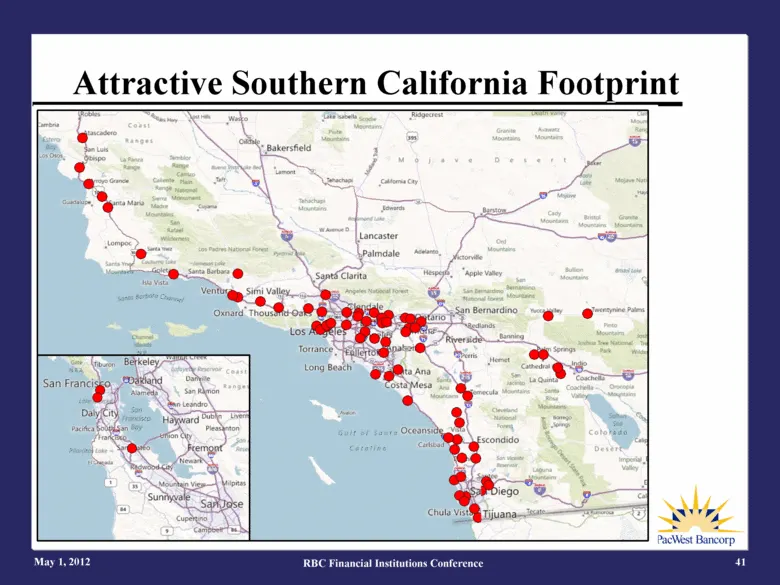
May 1, 2012 RBC Financial Institutions Conference 41 Attractive Southern California Footprint
Slide 42: California Public Banks & Thrifts
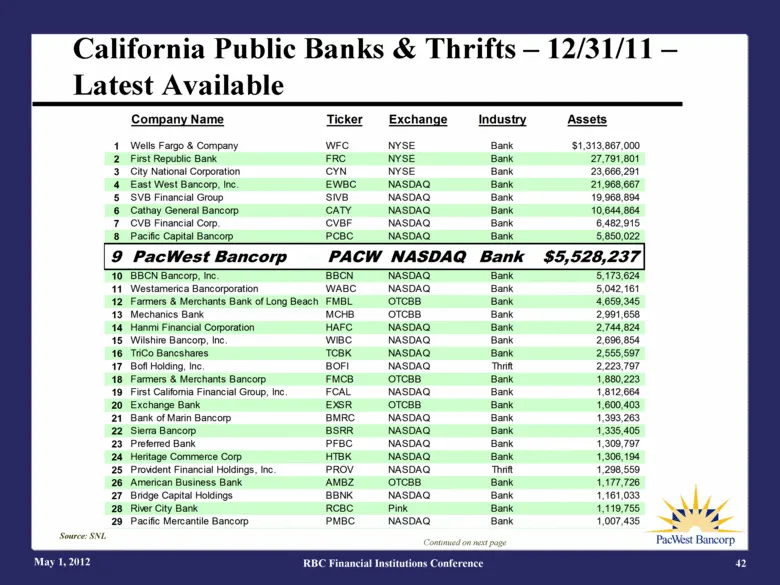
California Public Banks & Thrifts – 12/31/11 – Latest Available RBC Financial Institutions Conference 42 May 1, 2012 Source: SNL Continued on next page Company Name Ticker Exchange Industry Assets 1 Wells Fargo & Company WFC NYSE Bank $1,313,867,000 2 First Republic Bank FRC NYSE Bank 27,791,801 3 C
Slide 43: California Public Banks & Thrifts – Continued
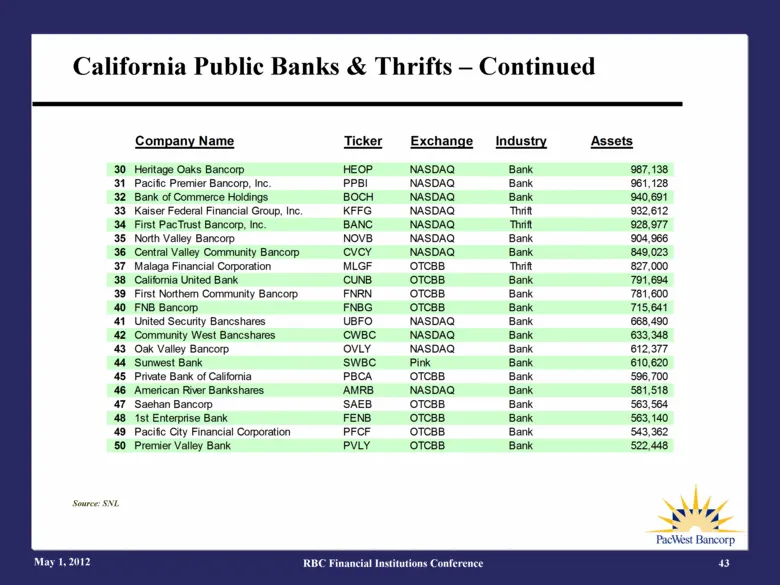
California Public Banks & Thrifts – Continued RBC Financial Institutions Conference 43 May 1, 2012 Source: SNL Company Name Ticker Exchange Industry Assets 30 Heritage Oaks Bancorp HEOP NASDAQ Bank 987,138 31 Pacific Premier Bancorp, Inc. PPBI NASDAQ Bank 961,128 32 Bank of Commerce Holdings BOCH NA
Slide 44: Non-GAAP Information
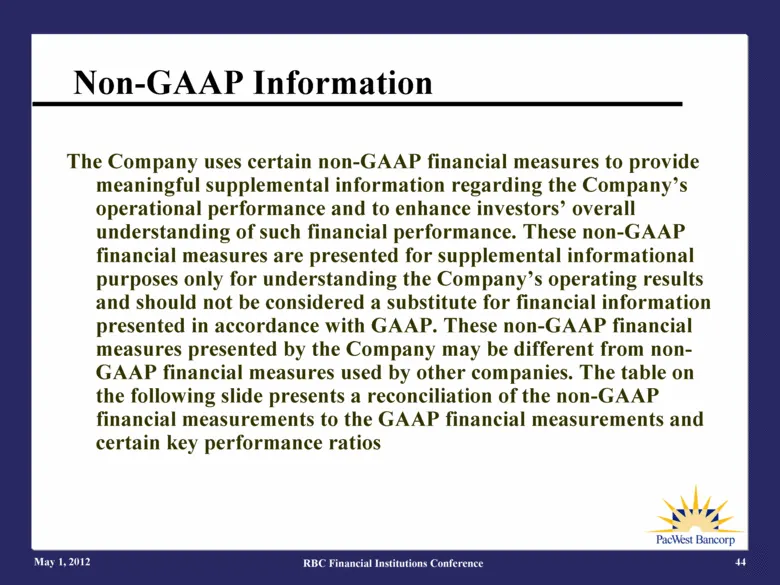
Non-GAAP Information The Company uses certain non-GAAP financial measures to provide meaningful supplemental information regarding the Company’s operational performance and to enhance investors’ overall understanding of such financial performance. These non-GAAP financial measures are presented for
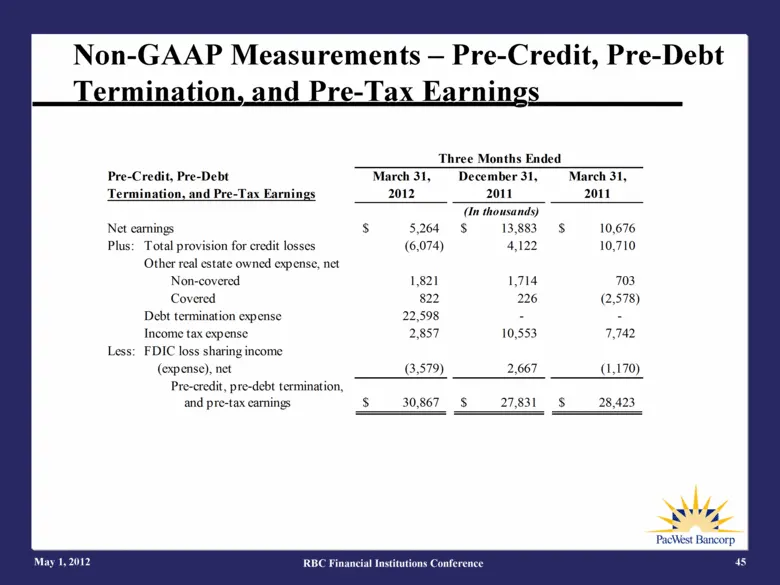
Slide 45: Non-GAAP Measurements – Pre-Credit, Pre-Debt Termination, and Pre-Tax Earnings
Non-GAAP Measurements – Pre-Credit, Pre-Debt Termination, and Pre-Tax Earnings May 1, 2012 RBC Financial Institutions Conference 45 Pre-Credit, Pre-Debt March 31, December 31, March 31, Termination, and Pre-Tax Earnings 2012 2011 2011 (In thousands) Net earnings 5,264 $ 13,883 $ 10,676 $ Plus: Total
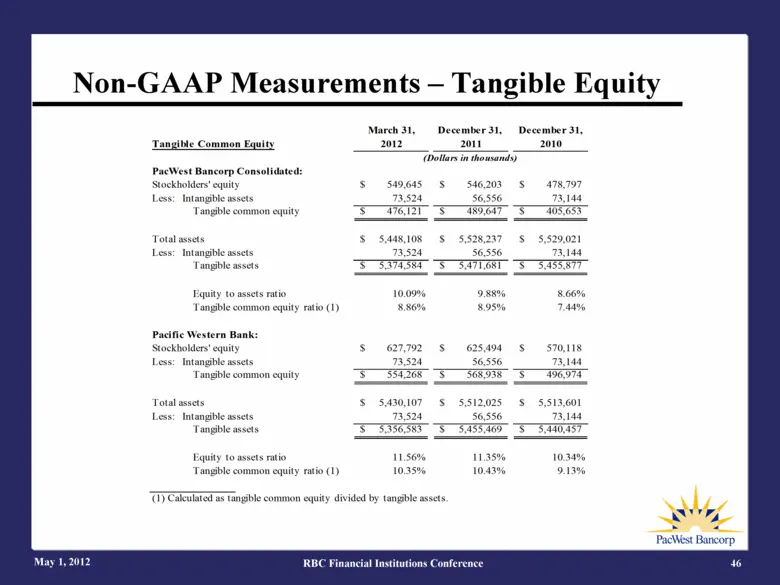
Slide 46: Non-GAAP Measurements – Tangible Equity
Non-GAAP Measurements – Tangible Equity RBC Financial Institutions Conference 46 May 1, 2012 March 31, December 31, December 31, Tangible Common Equity 2012 2011 2010 (Dollars in thousands) PacWest Bancorp Consolidated: Stockholders' equity 549,645 $ 546,203 $ 478,797 $ Less: Intangible assets 73,52
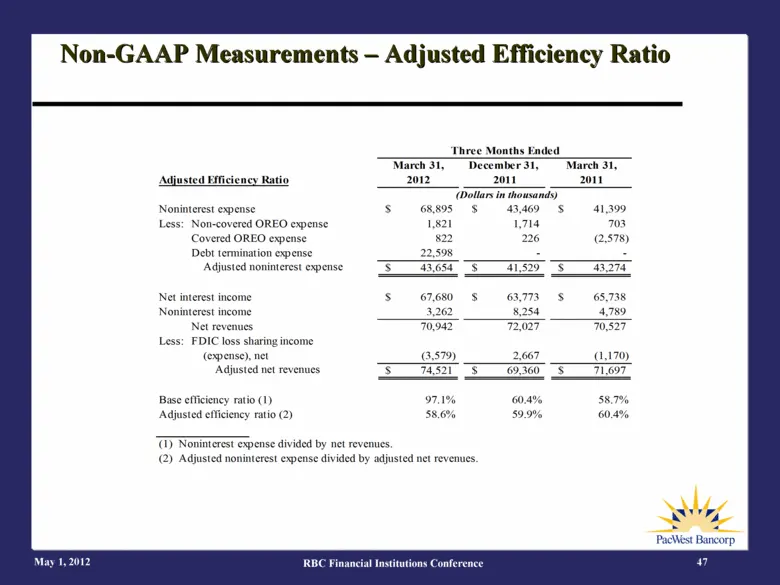
Slide 47: Non-GAAP Measurements – Adjusted Efficiency Ratio
May 1, 2012 RBC Financial Institutions Conference 47 Non-GAAP Measurements – Adjusted Efficiency Ratio March 31, December 31, March 31, Adjusted Efficiency Ratio 2012 2011 2011 (Dollars in thousands) Noninterest expense $ 68,895 $ 43,469 $ 41,399 Less: Non-covered OREO expense 1,821 1,714 703 Covere
Slide 48: PacWest Bancorp contact details
PacWest Bancorp 10250 Constellation Boulevard Suite 1640 Los Angeles, California 90067 Matt Wagner, CEO Vic Santoro, CFO 310.728.1020 310.728.1021
Source: SEC EDGAR · 8-K filed Apr 27, 2012
More decks from PacWest Bancorp
 Q3 2023 Earnings Presentation27 slides · Oct 24, 2023
 Merger or Acquisition (July 2023)24 slides · Jul 25, 2023
 Q1 2023 Earnings Presentation22 slides · Apr 25, 2023
 Q4 2022 Earnings Presentation17 slides · Jan 26, 2023
 Q3 2022 Earnings Presentation33 slides · Oct 19, 2022
 Investor Presentation (September 2022)23 slides · Sep 19, 2022