Kendle International — First Analysis Analyst Luncheon, San Francisco (June 2008)
31 slides from Kendle International's conference presentation, Jun 3, 2008

Slide 1: Kendle – First Analysis Analyst Luncheon
Kendle First Analysis Analyst Luncheon San Francisco June 3, 2008 Exhibit 99.1

Slide 2: Safe Harbor
Safe Harbor Information herein contains forward-looking statements pursuant to the safe harbor provision of the Private Securities Litigation Reform Act of 1995. All such forward- looking statements are based largely on management’s expectations and are subject to risks and uncertainties that could

Slide 3: Why Kendle?
Why Kendle? Strategy to drive share growth • Customer Development • Business Expansion Leadership to drive sustainable performance Commitment to drive shareholder understanding
Slide 4: Customer Development
Customer Development • High customer need: R&D efficiency and Delivery Confidence • High shareholder value: Repeat business and Efficiencies • Growth opportunities • Supports Expansion • Leverage Best-in-class geographies, i.e. Latin America • Patient access • Leapfrog in new geographies competitive
Slide 5: Customer drivers for R&D efficiency
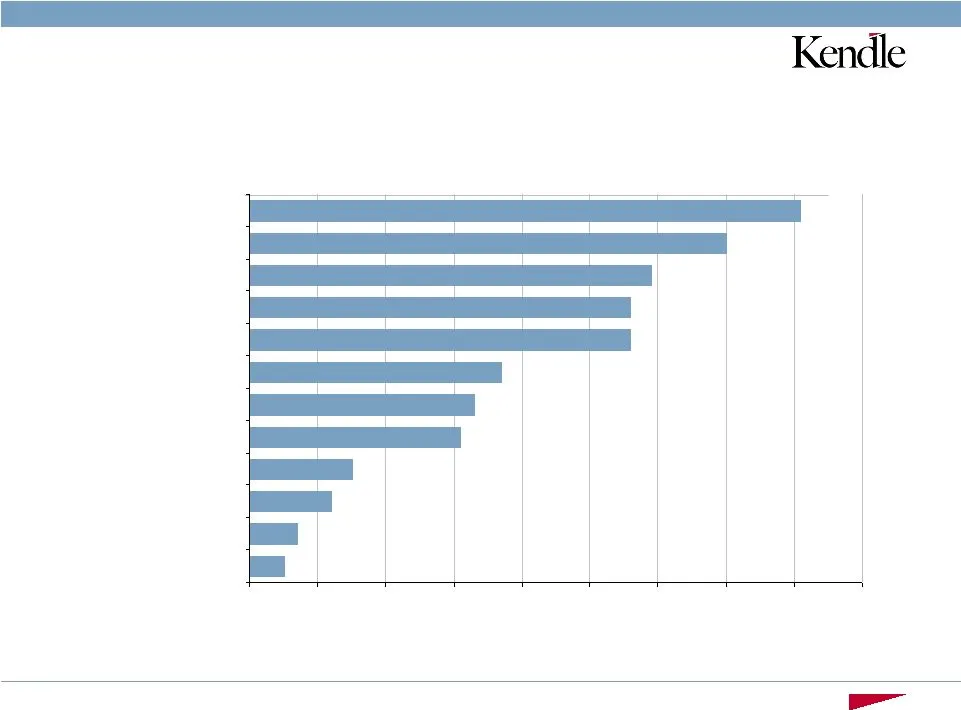
Source: Jefferies, CRO Survey, March 2007 Customer drivers for R&D efficiency % of total respondents Vendor relationship management principles Electronic data capture (EDC) Functional outsourcing Preferred provider agreements Centralized sourcing groups Biomarkers research Program outsourcing Offsho

Slide 6: The need for global capability
The need for global capability Strong project leadership for large global trials Geographic reach over five regions Efficiency and productivity through technology Workforce needs Megatrial delivery
Slide 7: Allocation of development spending by global region
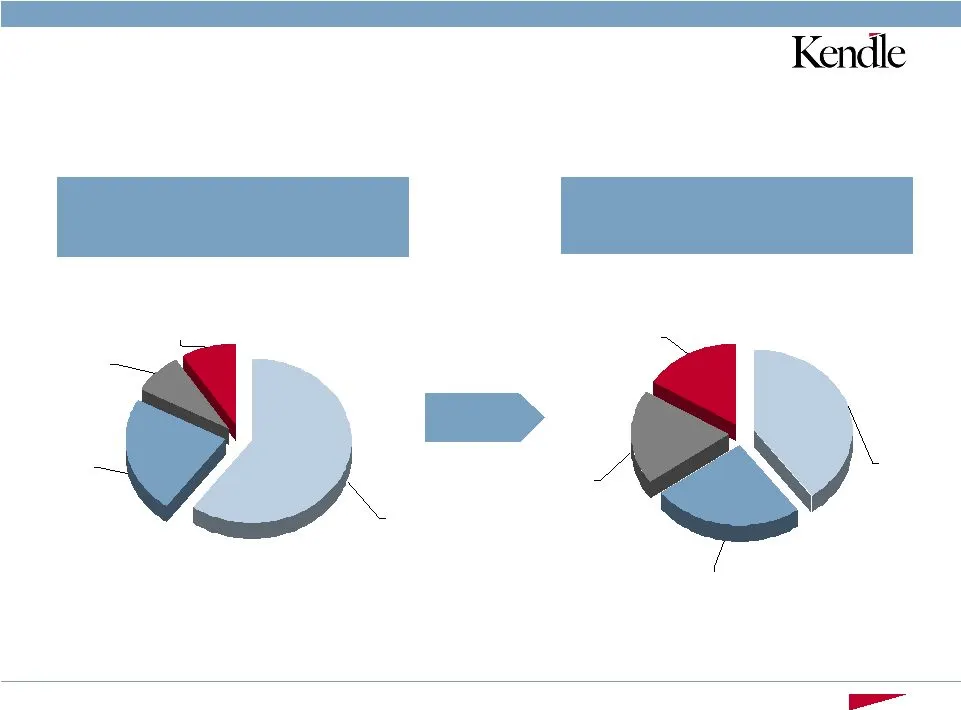
Allocation of development spending by global region – current Expected development spending allocation by 2010; significant increase in Asia/Pacific, ROW Patient Access and Retention U.S. 60% Asia/Pacific 8% Europe 23% Rest-of- World 9 % U.S. 40% Asia/Pacific 19% Europe 25% Rest-of- World 16 % Sourc
Slide 8: Continuing globalization
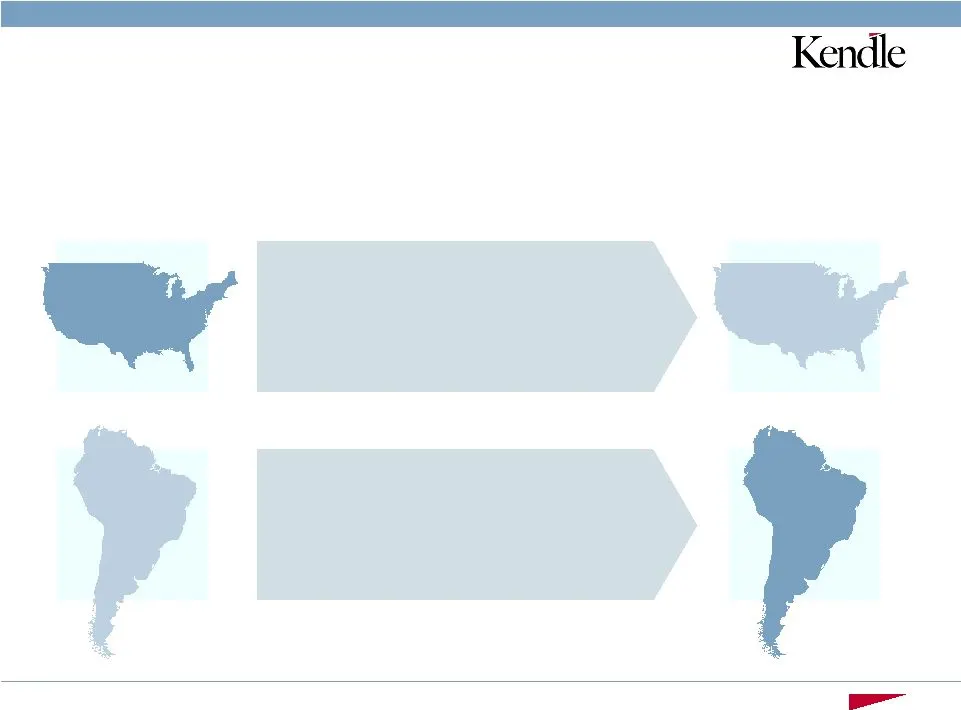
7% 50% Continuing globalization Latin America grows from 4% of total revenue in Q1 2007 to 7% of total revenue in Q1 2008 Q1 2008 4% Q1 2007 Revenue moves away from United States into global markets with a shift from 50% in Q1 2007 to 46% in Q1 2008 46% Q1 2008 Q1 2007

Slide 9

Slide 10

Slide 11

Slide 12

Slide 13

Slide 14

Slide 15: Business Expansion
Business Expansion Early Phase Opportunities Geographic Expansion
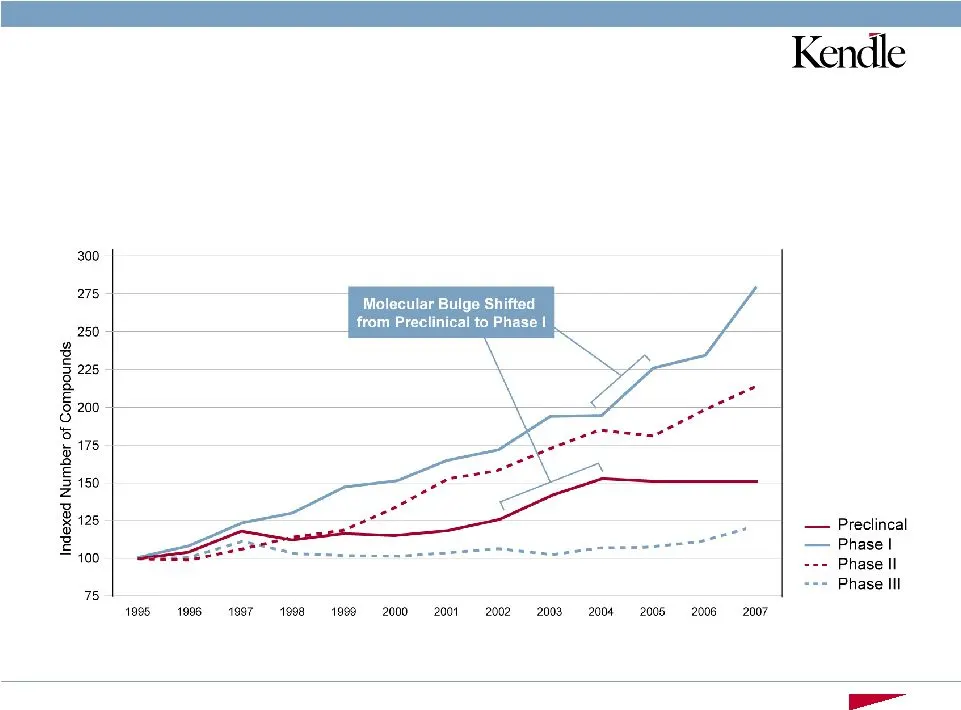
Slide 16: Shift in opportunity by phase
Shift in opportunity by phase Source: William Blair & Company, CRO Industry Update , Oct. 5, 2007. New compounds in pharmaceutical development, 1995 to present
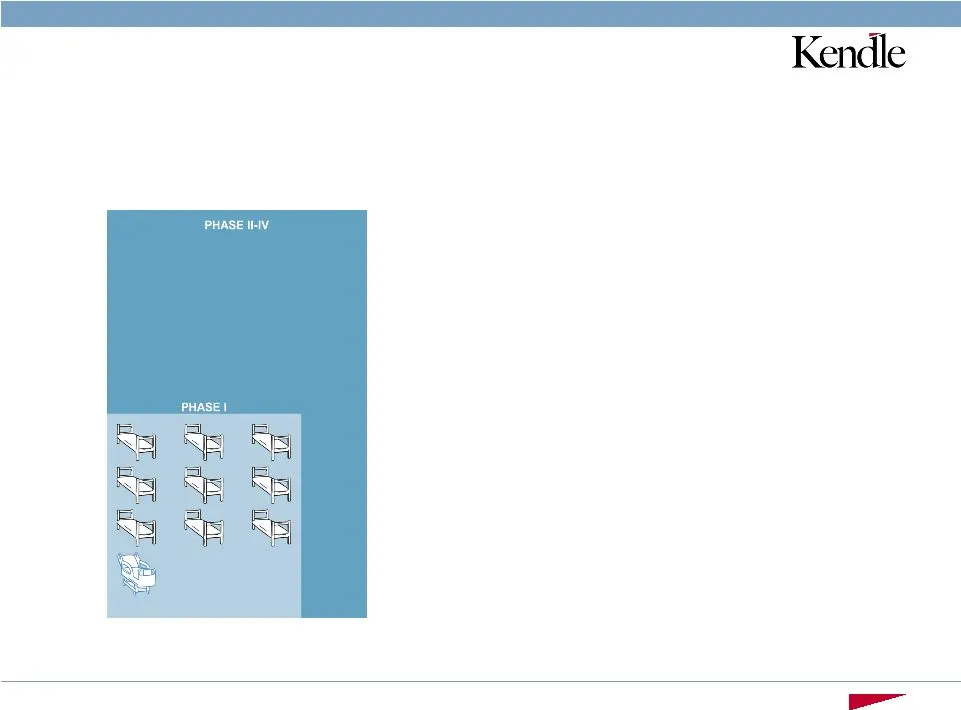
Slide 17: A closer look at the current landscape
A closer look at the current landscape • Global capacity 9,000 beds • 90% of beds are routine, high throughput, bioequivalence studies occurring in later stages of clinical development • Since these study drugs have been administered in thousands of subjects previously, medical coverage at such site
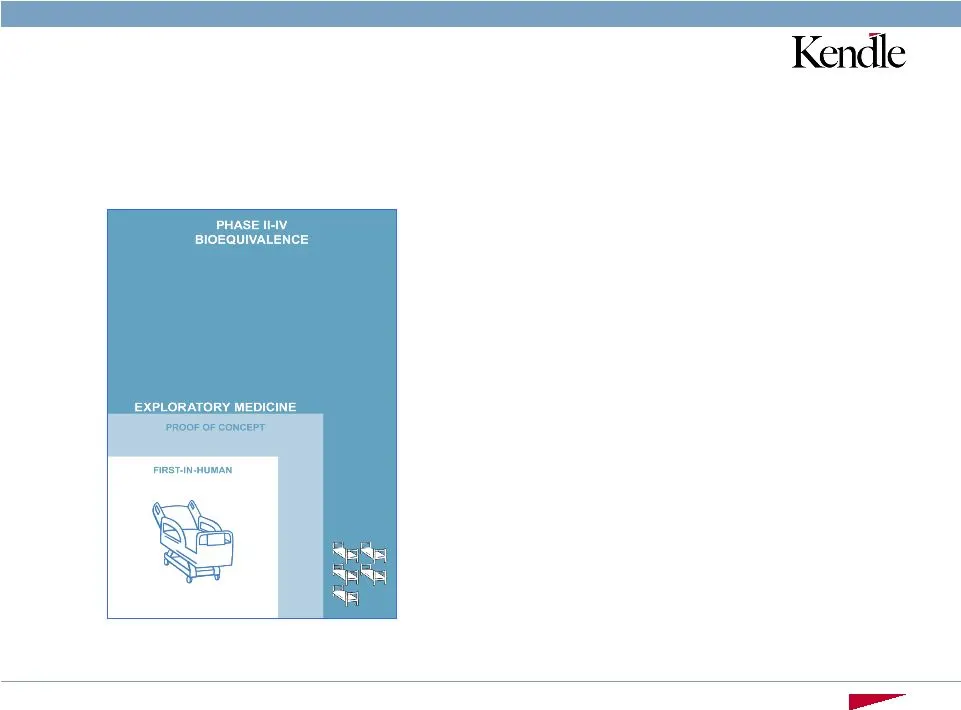
Slide 18: The new landscape - exploratory medicine
The new landscape - exploratory medicine • Kendle will take the lead in exploratory medicine space where; • FIH to POC studies are looking at the effects of the body on the drug and the drug on the body, to make go/no-go decisions • This requires specialist expertise, high quality and scientific pro
Slide 19: Building Kendle Early Phase Brand
Founded in 1997 by Dr. Ed Sellers and Dr. Myroslava Romach Industry leader in evaluation of early stage innovative CNS drugs Specialists in abuse liability and cognitive testing Also perform FIM/QTc and other studies Building Kendle Early Phase Brand • Dr. Sellers (MD, PhD, FRCPC, FACP) is an intern
Slide 20: Strategic fit
Strategic fit • Delivers high-end exploratory/translational medicine capabilities • Expanded capacity and enhanced capability from first-in-man to proof-of-concept • Strong therapeutic focus in an “unmet medical need” growth area (CNS) • Increased geographic reach (highly diverse ethnic population,
Slide 21: Leadership to drive sustainable performance
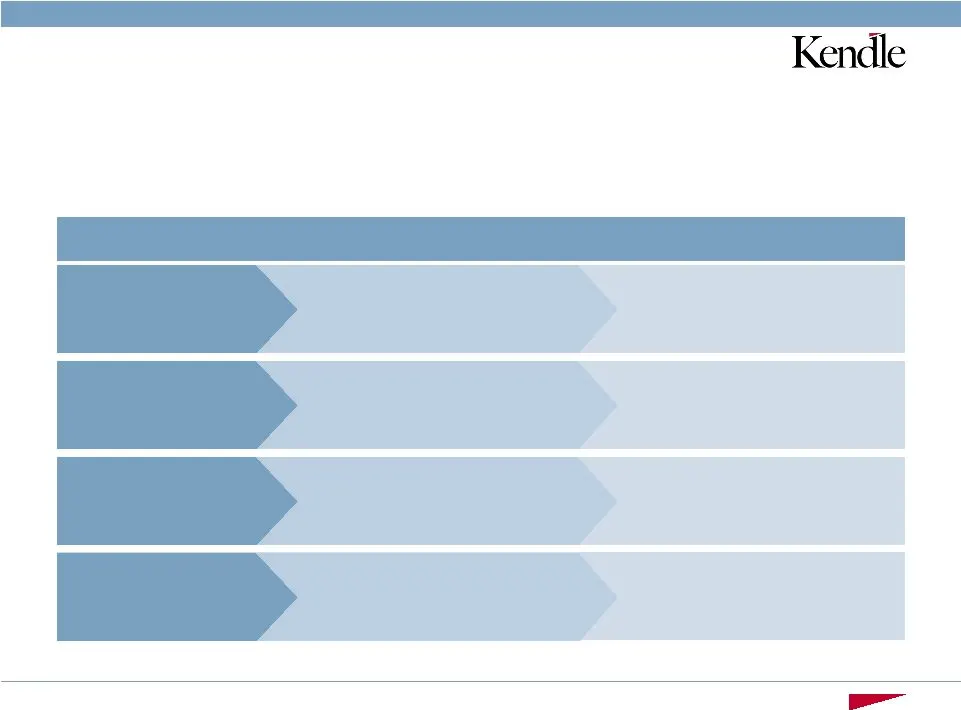
Component Example Outcome Finance, Commercial Operations Functional Operational Asia Pacific, Early phase System/Processes Infrastructure/ERP Leadership to drive sustainable performance Business orientation and sophistication Scientific and technical leadership Executive C-suite movement Leadership
Slide 22: Commitment to drive shareholder understanding
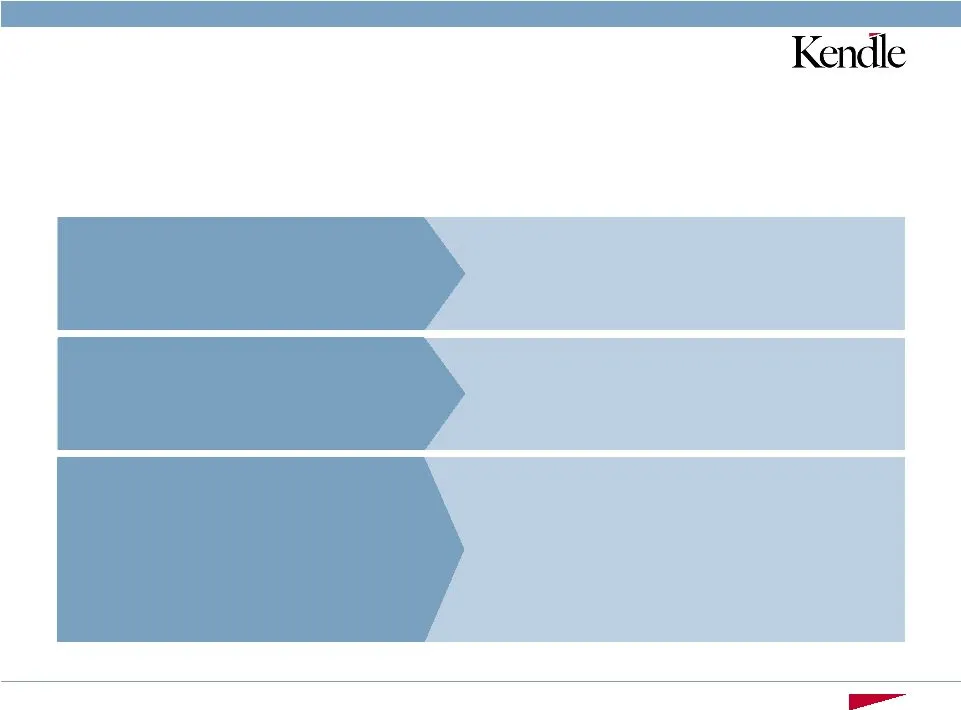
• Broadened team experience for future leadership needs Commitment to drive shareholder understanding • DecisionLine acquisition Conference call and Webcast Opportunities to update investors • US West Coast and US East Coast luncheon – June • Investors meet with senior management in Cincinnati – Jun

Slide 23: Financial Profile
Financial Profile
Slide 24: $Million
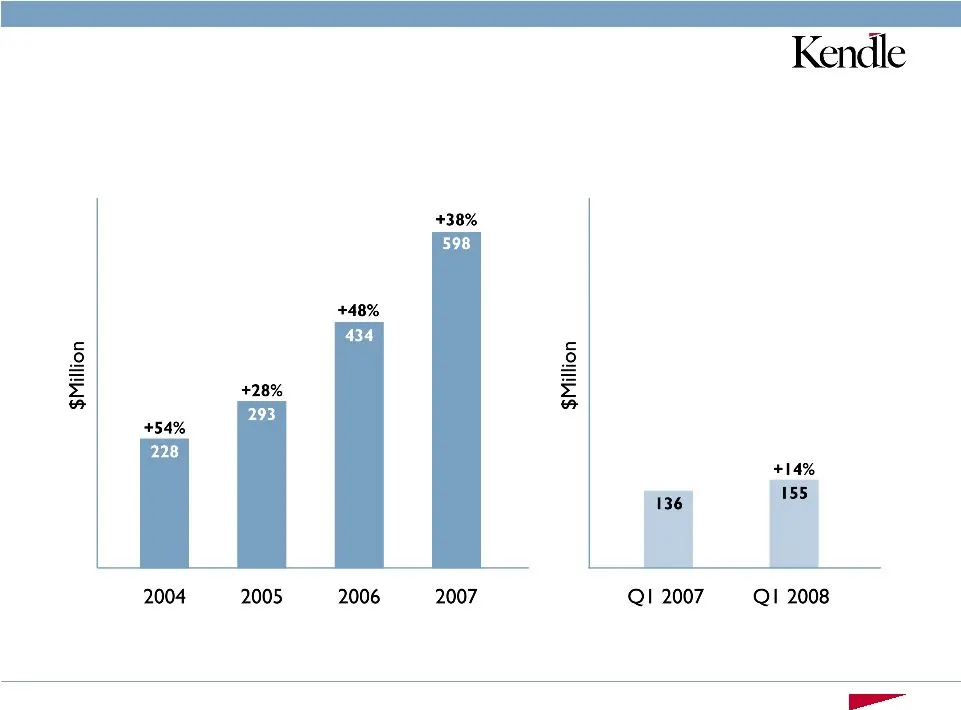
$Million Kendle +38% +48% « s +28% = oe 454% 2004 2005 2006 2007 QI 2007 QI 2008
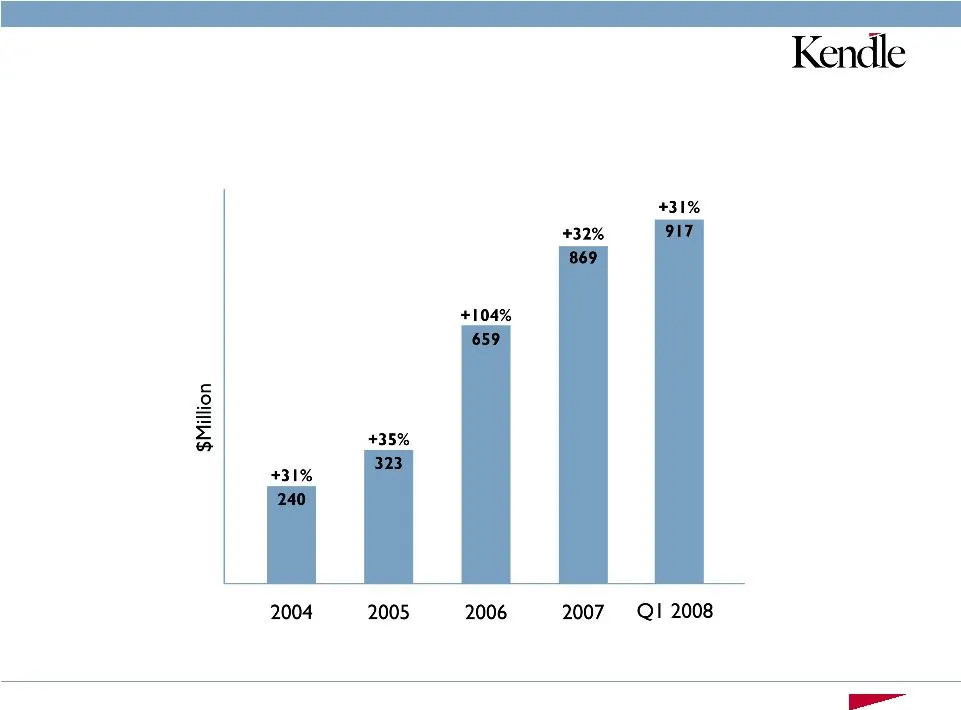
Slide 25: $Million
$Million +31% +32% +104% +35% 21% i 2004 2005 200 2007. QI 2008 Kendle
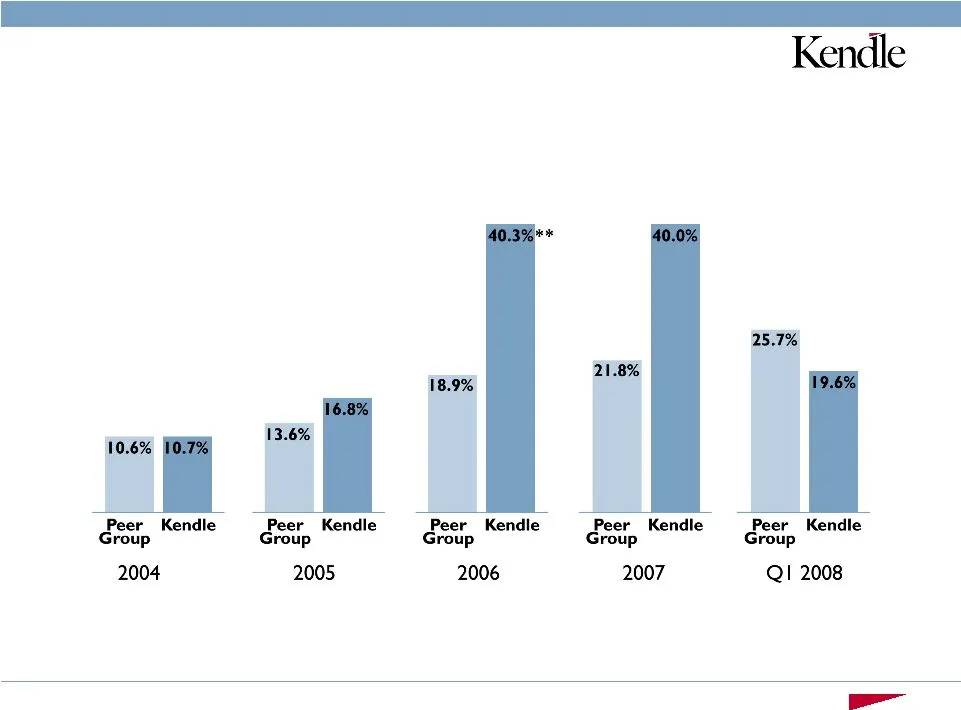
Slide 26: Growth in Revenues
Growth in Revenues * Peer Group includes PPD, Parexel, PRA and ICON for 2004-2006. 2007 excludes PRAI. 2008 Includes PPD, Parexel, ICON, and Pharmanet. **Includes acquisition of Charles River Laboratories Clinical Services (CRLCS) as of Aug. 16, 2006.
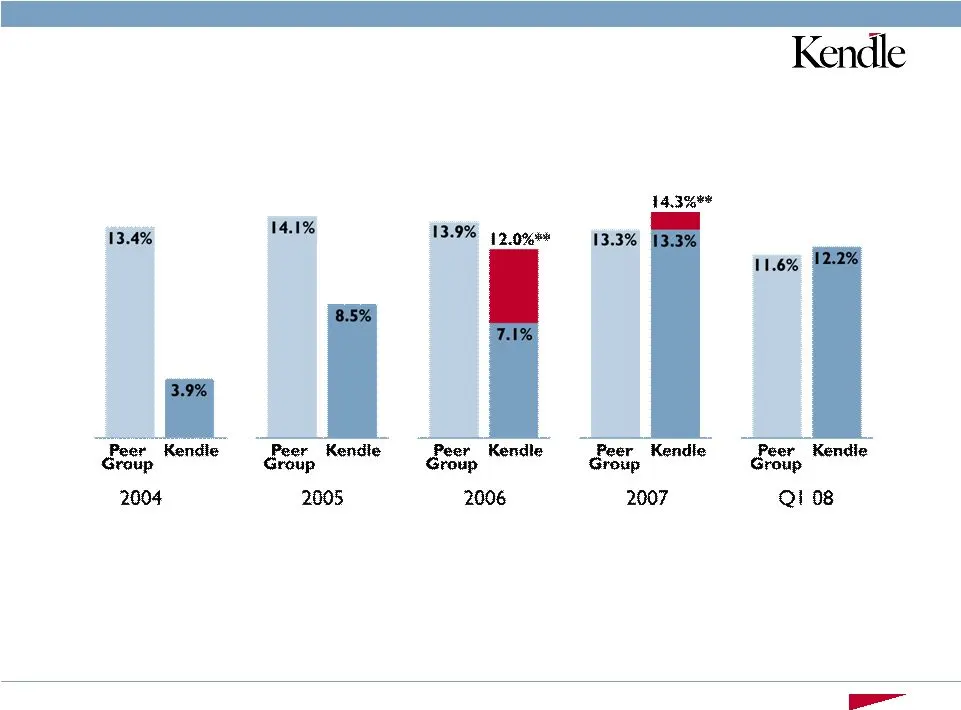
Slide 27: Operating Margin Comparison
Operating Margin Comparison *Peer Group includes PPD, Parexel, PRA and ICON for 2004-2006. 2007 excludes PRAI. 2008 includes PPD, Parexel, ICON, and Pharmanet. ** Proforma operating margin for full year 2006 excludes charges for stock option expense in accordance with FAS 123R, amortization of acqui
Slide 28: 2008 Guidance
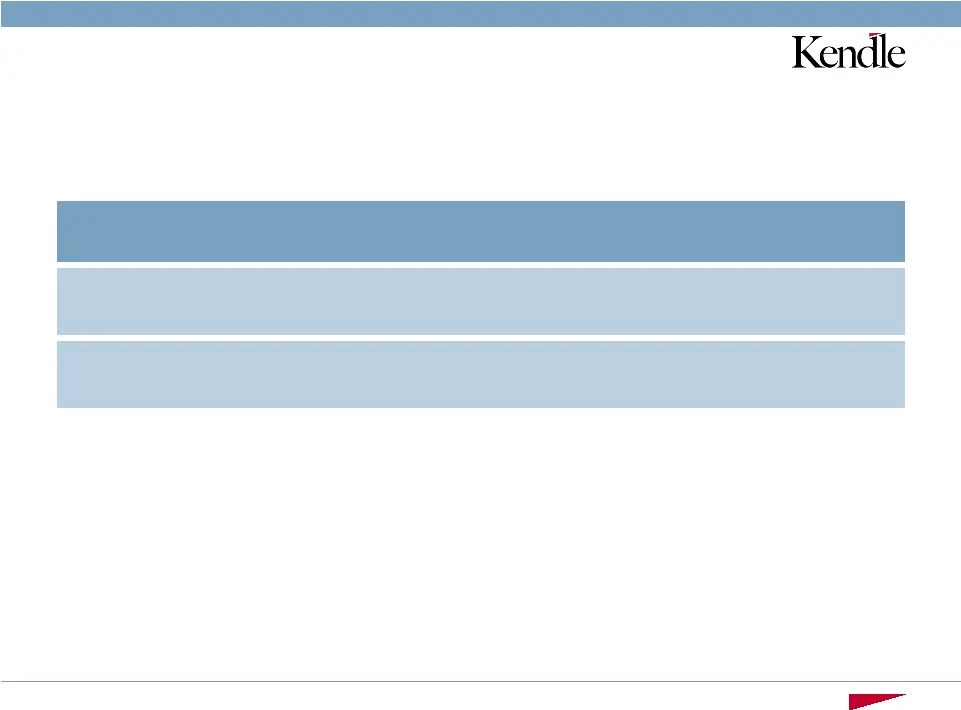
Growth 2008 est 2007 2008 Guidance * Amounts in Millions 51% – 64% $1.90 – $2.07 $1.26 EPS 13% – 16% $450 – $460 $398 Net Service Revenue*
Slide 29: Q2 Progress
Q2 Progress Revenue Expenses Other expenses DecisionLine • Billable hours recorded in April and May ahead of budget • Director grants for stock options ($0.4M-$0.5M) • Annual merit increases effective April 1, 2008 (approx $2M) • Payroll taxes – should decline ($0.25M) • Cross currency swap ($0.5M)
Slide 30: Summary for Q2
• At or above the high end of current analysts’ estimates Summary for Q2 • At or above current Street consensus* Operating Margin • At or above current Street consensus* Earnings Per Share Revenue * Absent changes in foreign exchange rates or interest rate yield curves in the month of June

Slide 31
Source: SEC EDGAR · 8-K filed Jun 3, 2008
More decks from Kendle International Inc
 Jefferies 3rd Annual Healthcare Conference (June 2009)23 slides · Jun 18, 2009
 Conference Presentation (March 2009)23 slides · Mar 10, 2009
 27th Annual J.P. Morgan Healthcare Conference (January 2009)19 slides · Jan 12, 2009
 UBS Global Life Sciences Conference 200835 slides · Sep 24, 2008
 Raymond James Institutional Investors Conference 200826 slides · Mar 5, 2008
 Wachovia 2008 Healthcare Conference29 slides · Jan 30, 2008