Fauquier Bankshares — Investor Presentation (December 2010)
47 slides from Fauquier Bankshares's investor presentation, Dec 14, 2010

Slide 1: Deeply rooted in our community.
Deeply rooted in our community. December 2010 Ticker: FBSS
Slide 2: Safe Harbor Statement
2 FAUQUIER BANKSHARES, INC. Safe Harbor Statement In addition to the historical information contained herein, this report contains forward-looking statements. Forward-looking statements are based on certain assumptions and describe future plans, strategies, and expectations of the Company, and are g
Slide 3: Table of Contents
3 FAUQUIER BANKSHARES, INC. Table of Contents — Who We Are — Market Area — Financial Condition — Financial Performance and Goals — Building Shareholder Value

Slide 4: Who We Are
4 FAUQUIER BANKSHARES, INC. Who We Are
Slide 5: Summary Statistics
5 FAUQUIER BANKSHARES, INC. Summary Statistics Founded 1902 Headquarters Warrenton, Virginia (50 miles west of Washington, D.C.) (10 branch locations) Total Assets $624.4 million Total Loans, net $459.8 million Shares Outstanding 3,636,758 Insider Ownership 5.69% Institutional Ownership 11.50% 1 (8.
Slide 6: Industry Recognition
6 FAUQUIER BANKSHARES, INC. Industry Recognition — Named #134 of “Top 200 Publicly-Traded Community Banks” in the June 2010 issue of U.S. Banker magazine, based on previous 3-year average ROE of 1,075 public institutions. This marks the fourth consecutive year that FBSS was on the “Top 200” listing.
Slide 7: Our Success Is a Result of Our Culture
7 FAUQUIER BANKSHARES, INC. Our Success Is a Result of Our Culture — Strategic Planning — Teamwork — Disciplined Execution (aka “Blocking and Tackling”) — Consistently Strong Credit Culture — Disciplined Loan and Deposit Pricing Strategy
Slide 8: Management Focus On Growth
8 FAUQUIER BANKSHARES, INC . Management Focus On Growth l Quality Growth l Loan Portfolio l Core Transaction Deposits l Non-Interest Fee Income l Wealth Management and Financial Planning
Slide 9: Our Customer Focus
9 FAUQUIER BANKSHARES, INC . Our Customer Focus To deliver a superior experience for our retail and commercial customers by enabling them to make the right choices when selecting financial products and services that best fit their needs and lifestyles, thereby empowering our customers to achieve the
Slide 10: Market Area
10 FAUQUIER BANKSHARES, INC . Market Area
Slide 11: Northern Virginia Marketplace
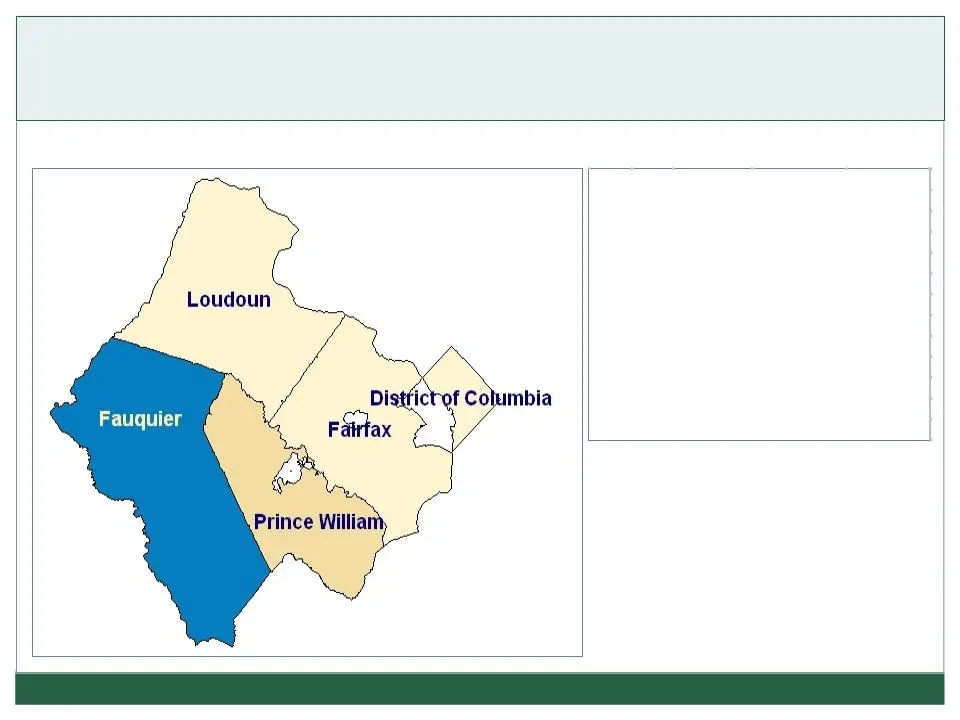
11 FAUQUIER BANKSHARES, INC . Northern Virginia Marketplace *Including City of Manassas data Source: Weldon Cooper Center for Public Service Fauquier County 11,822 41.89 % Fairfax County 5,499 19.48 % Prince William County* 4,295 15.22 % Loudoun County 1,595 5.65 % District of Columbia 1,139 4.04 %
Slide 12: Primary Market Area
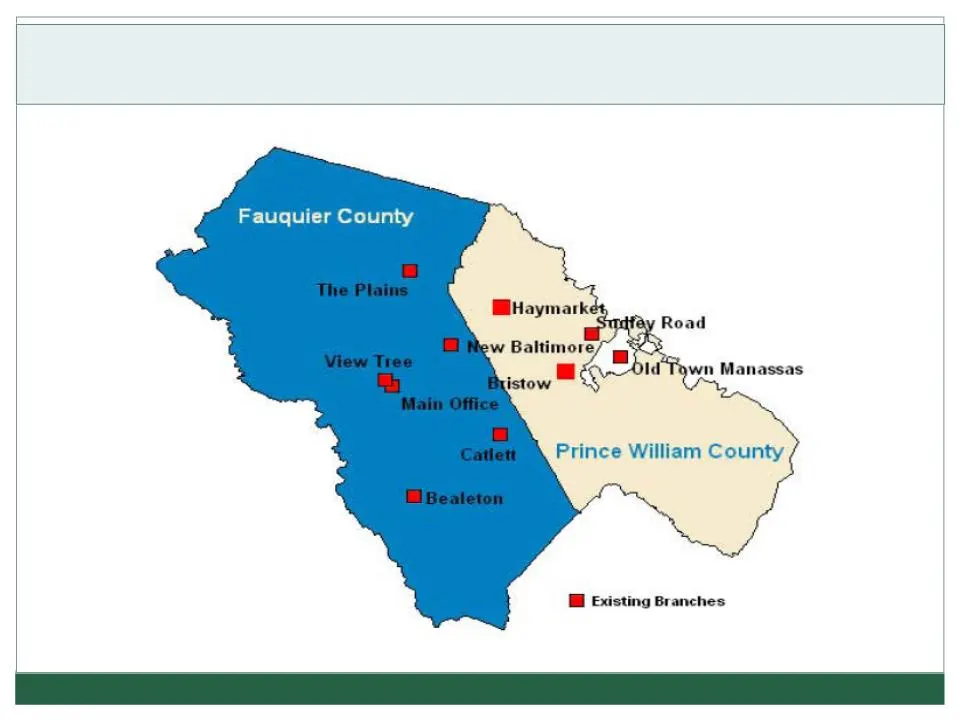
12 FAUQUIER BANKSHARES, INC . Primary Market Area
Slide 13: Northern Virginia Marketplace
13 FAUQUIER BANKSHARES, INC . Northern Virginia Marketplace — Virginia voted “No. 1 Most Business-Friendly State” by Forbes Magazine for the fourth straight year. (2006 - 2009) — Comparably stronger population, economic and employment growth — Stable federal government presence — Exceptional higher
Slide 14: FAUQUIER BANKSHARES, INC .
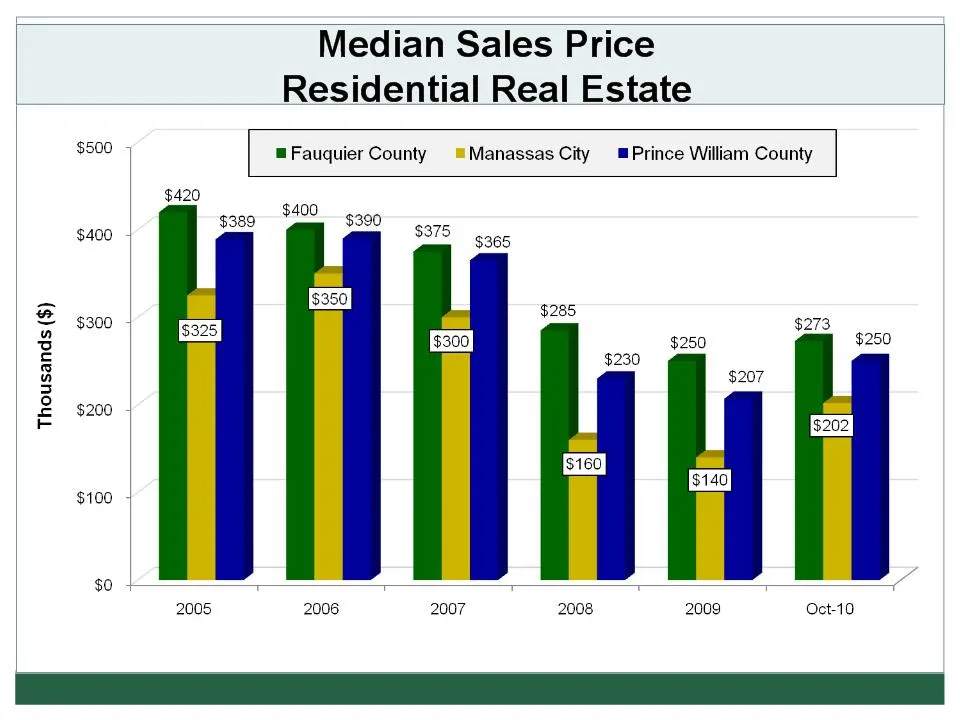
14 FAUQUIER BANKSHARES, INC . Source: MRIS
Slide 15: Unemployment Rates
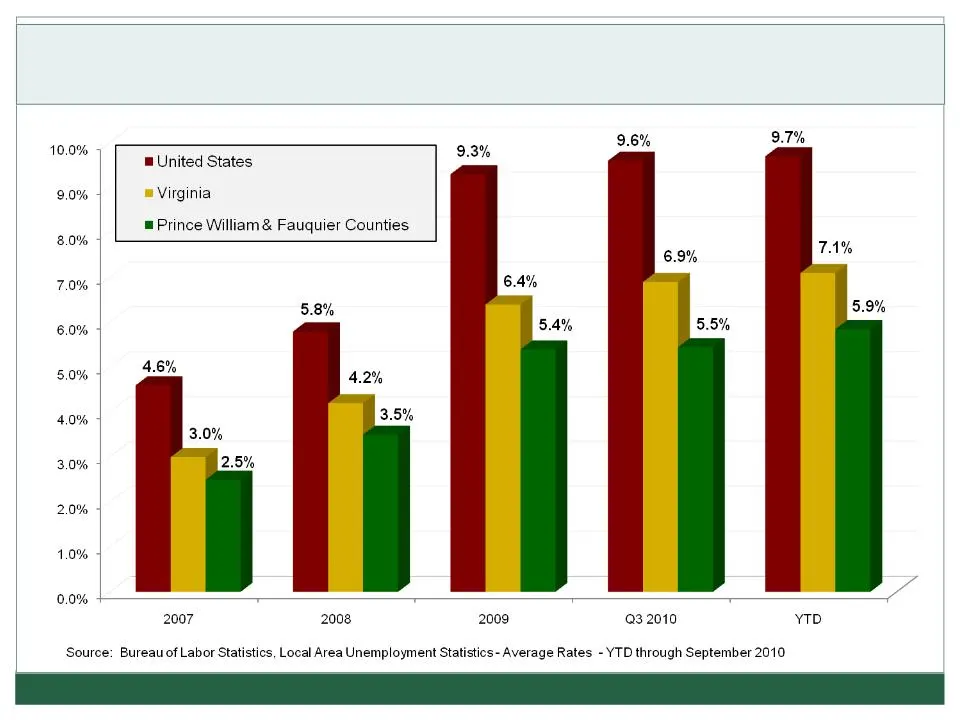
15 FAUQUIER BANKSHARES, INC . Unemployment Rates
Slide 16: Current Market with Sustainable Growth
16 FAUQUIER BANKSHARES, INC . Market Total Population 2010 (actual) Population Change 2000 - 2010 (%) Projected Change 2010 - 2015 (%) Total Households 2010 (actual) Median HH Income 2010 ($) HH Income Change 2000 - 2010 (%) Projected HH Income Change 2010 - 2015 (%) Fauquier, VA 68,698 24.59 5.40 2

Slide 17: Financial Condition
FAUQUIER BANKSHARES, INC. 17 Financial Condition
Slide 18: As of December 1 or last day of quarter.
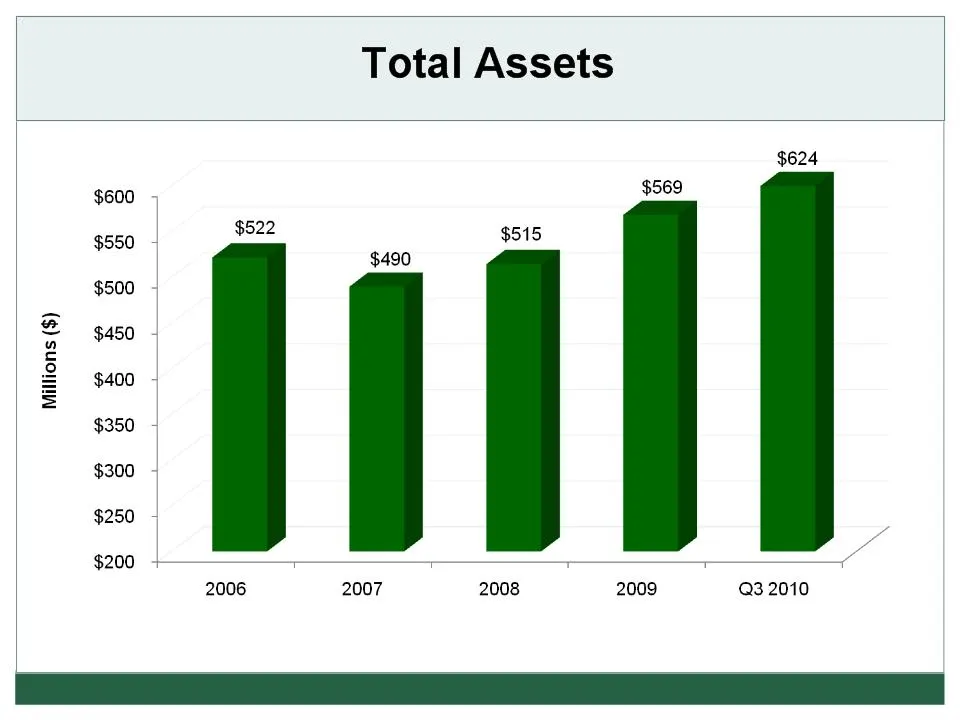
18 FAUQUIER BANKSHARES, INC. Source: Fauquier Bankshares Financials As of December 31 or last day of quarter.
Slide 19: Loans, Net
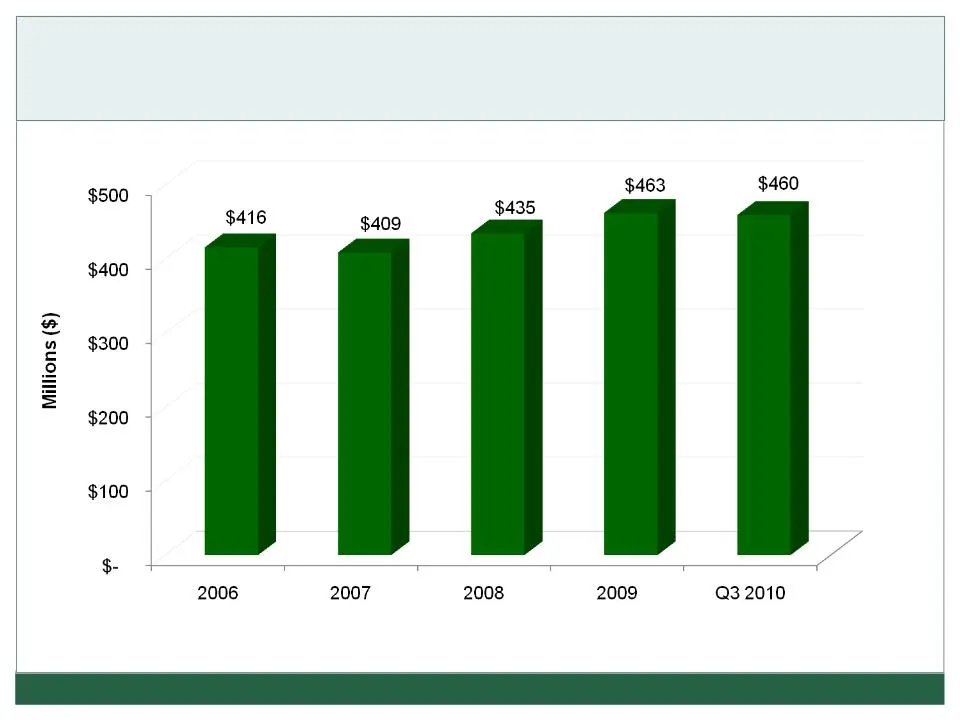
19 FAUQUIER BANKSHARES, INC. Loans, Net Source: Fauquier Bankshares Financials As of December 31 or last day of quarter.
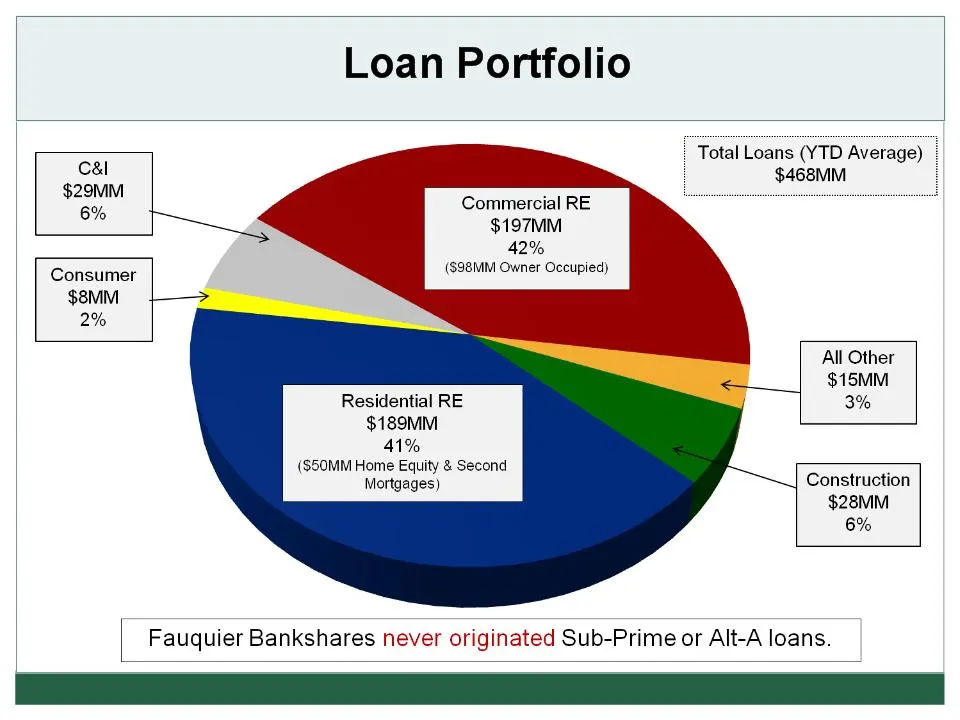
Slide 20: At September 30, 2010
20 FAUQUIER BANKSHARES, INC. At September 30, 2010
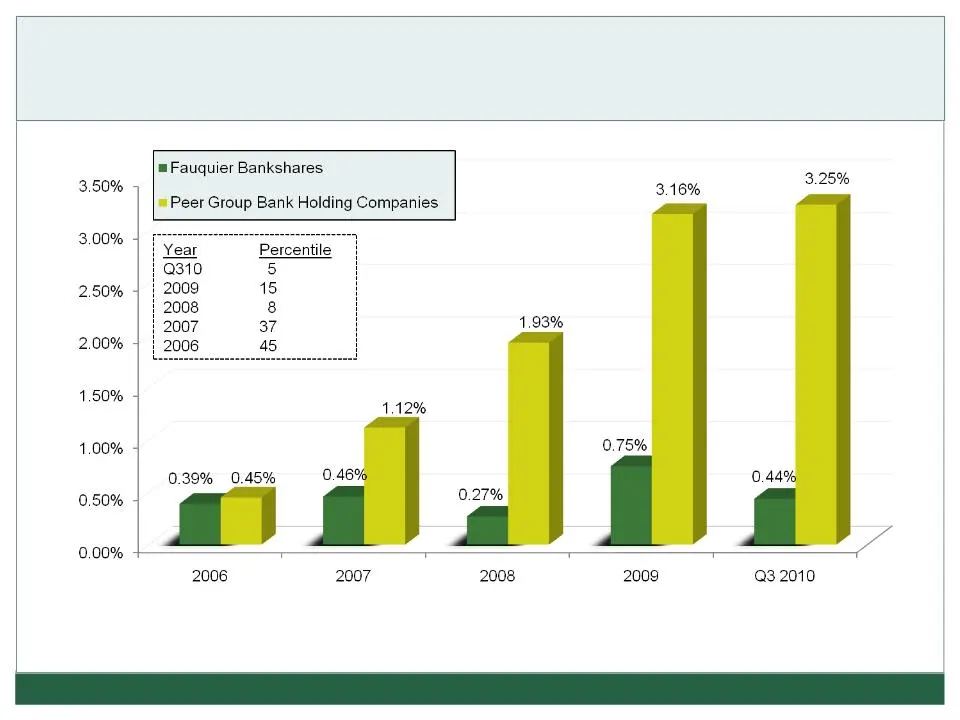
Slide 21: Nonperforming Loans to Period End Loans
21 FAUQUIER BANKSHARES, INC. Nonperforming Loans to Period End Loans Peer Group - Bank Holding Companies with Consolidated Assets of $500MM - $1B (2010/2009/2008) Peer Group - Bank Holding Companies with Consolidated Assets less than $500MM (2007) Sources: BHC Performance Report and Fauquier Banksha
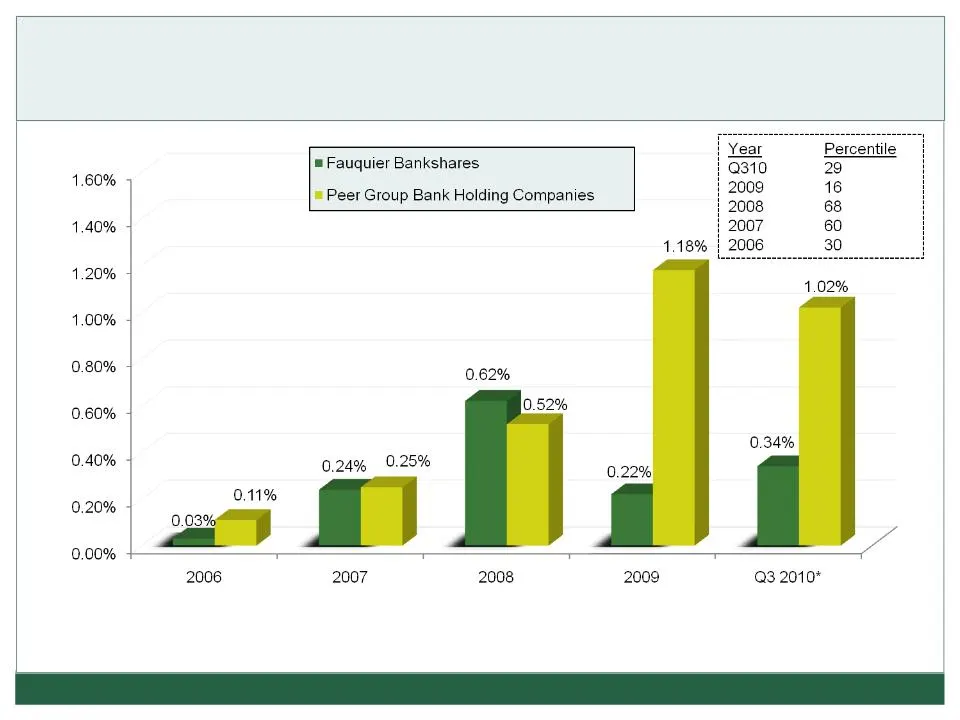
Slide 22: Loan Losses (Net of Recoveries)
22 FAUQUIER BANKSHARES, INC. Loan Losses (Net of Recoveries) As a Percentage of Average Total Loans Peer Group - Bank Holding Companies with Consolidated Assets of $500MM - $1B (2010/2009/2008) Peer Group - Bank Holding Companies with Consolidated Assets less than $500MM (2007) Sources: BHC Performa
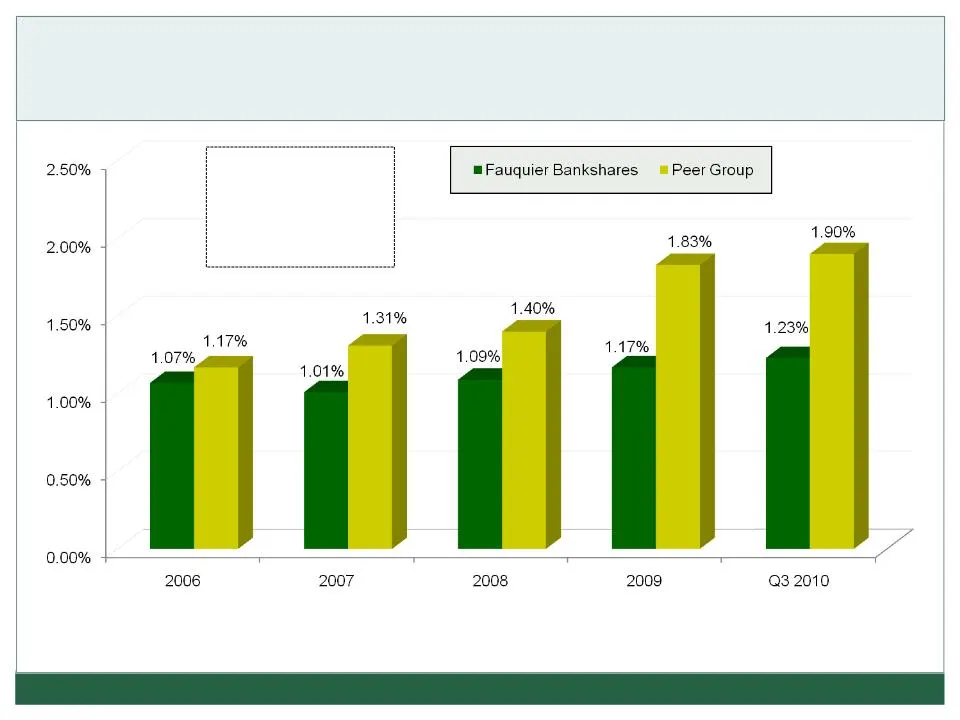
Slide 23: Allowance for Loan Loss
23 FAUQUIER BANKSHARES, INC. Allowance for Loan Loss As a Percentage of Total Loans Peer Group - Bank Holding Companies with Consolidated Assets of $500MM - $1B (2010/2009/2008) Peer Group - Bank Holding Companies with Consolidated Assets less than $500MM (2007) Sources: BHC Performance Report and F
Slide 24: Allowance for Loan Loss
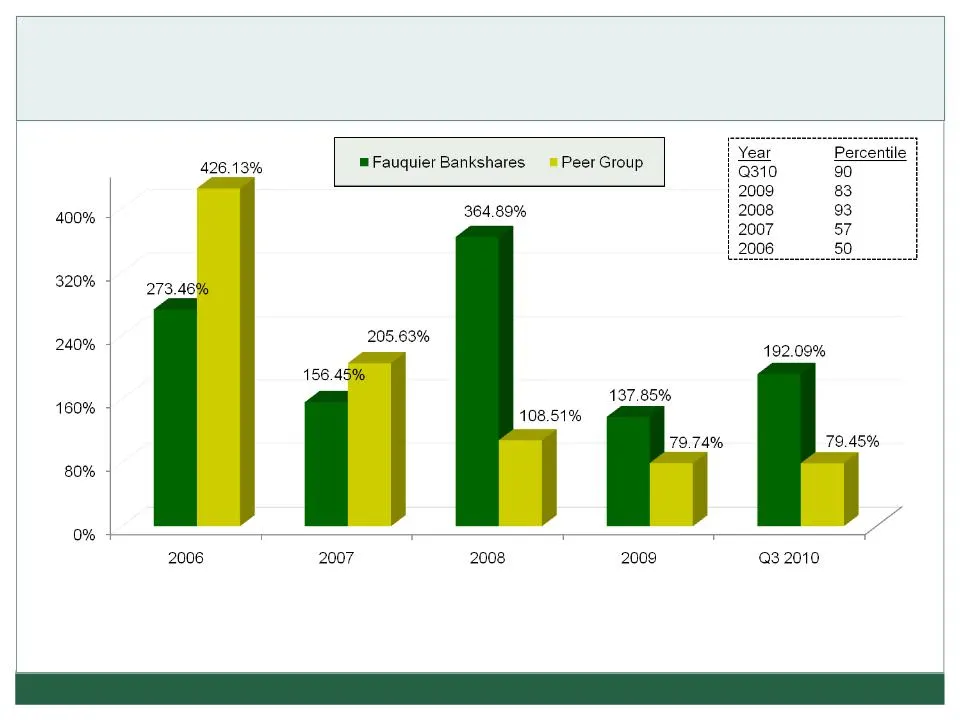
24 FAUQUIER BANKSHARES, INC. Allowance for Loan Loss As a Percentage of 90 Days Past Due & Nonaccrual Loans Peer Group - Bank Holding Companies with Consolidated Assets of $500MM - $1B (2010/2009/2008) Peer Group - Bank Holding Companies with Consolidated Assets less than $500MM (2007) Sources: BHC
Slide 25: As of December 1 or last day of quarter.
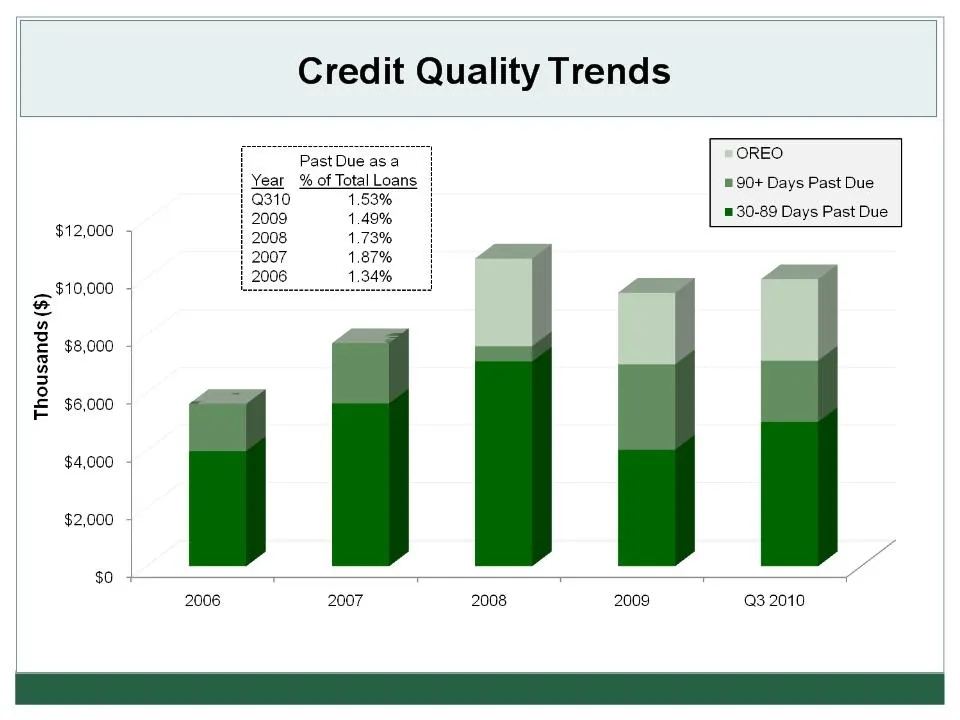
25 FAUQUIER BANKSHARES, INC. Source: Fauquier Bankshares Financials As of December 31 or last day of quarter.
Slide 26: Total Deposits
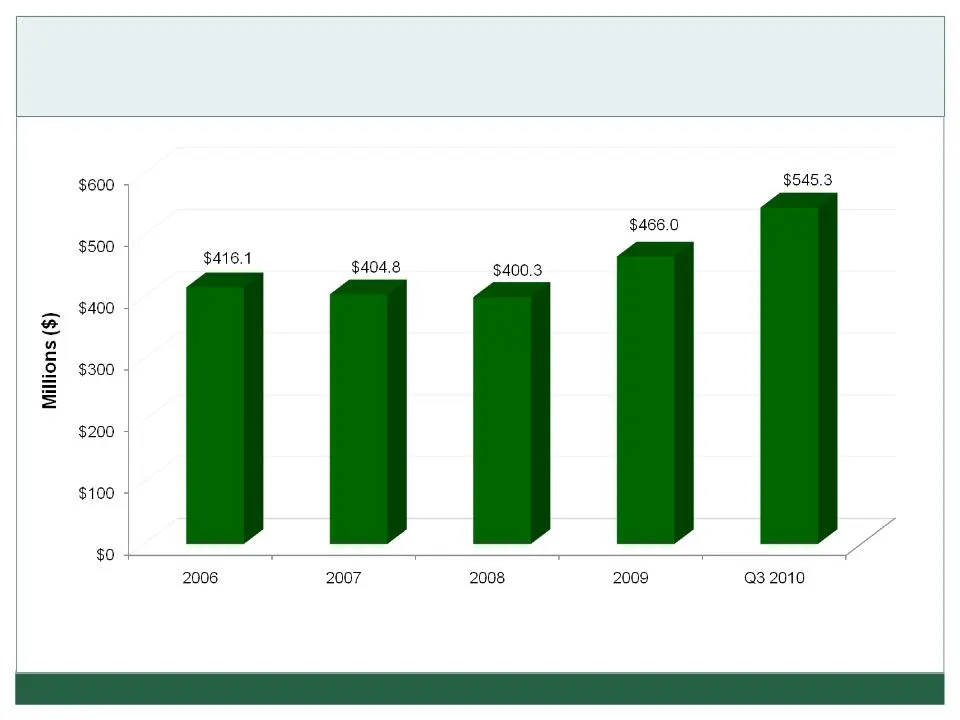
26 FAUQUIER BANKSHARES, INC. Total Deposits Source: Fauquier Bankshares Financials As of December 31 or last day of quarter.
Slide 27: Tangible Equity to Assets Ratio
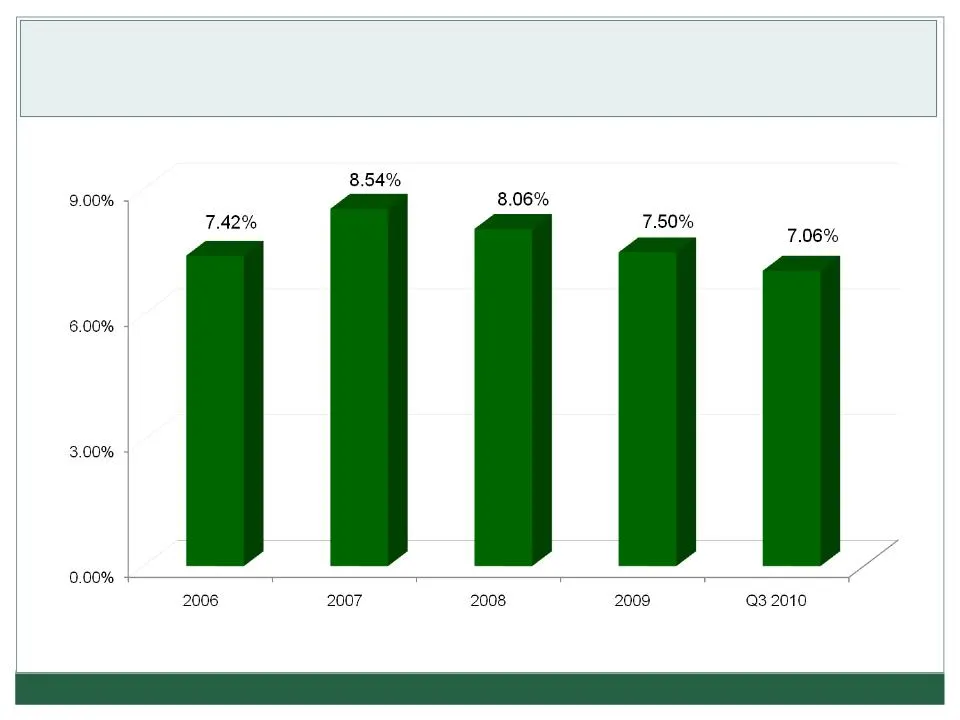
27 FAUQUIER BANKSHARES, INC. Tangible Equity to Assets Ratio Source: Fauquier Bankshares Financials As of December 31 or last day of quarter.
Slide 28: Leverage Ratio
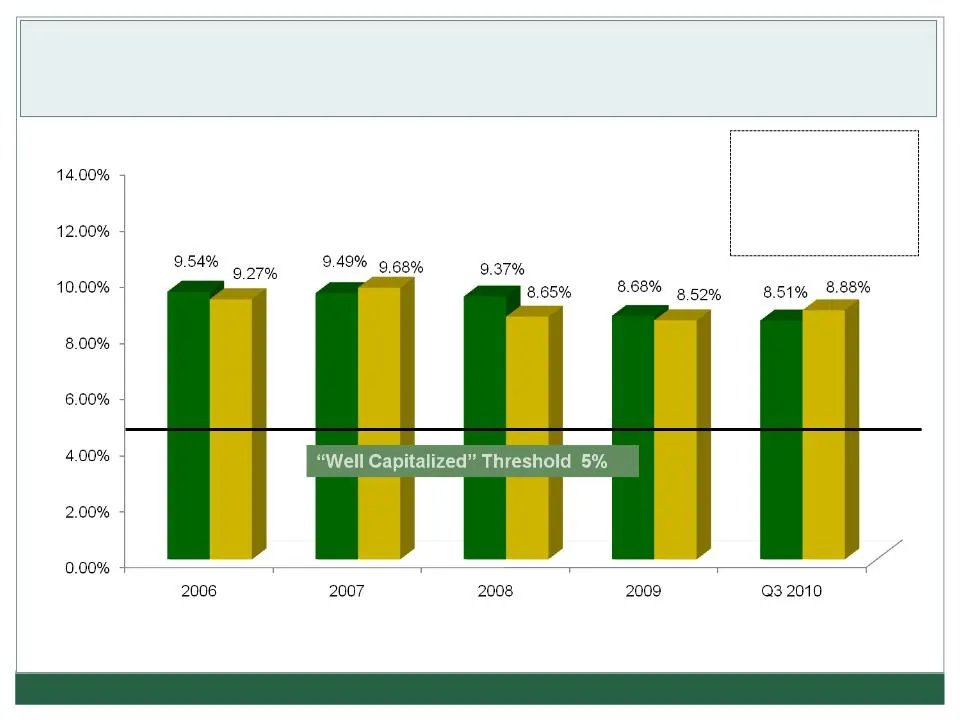
28 FAUQUIER BANKSHARES, INC. Leverage Ratio Year Percentile Q310 41 2009 53 2008 67 2007 49 2006 58 Peer Group - Bank Holding Companies with Consolidated Assets of $500MM - $1B (2010/2009/2008/2006) Peer Group - Bank Holding Companies with Consolidated Assets less than $500MM (2007) Source: BHC Perf
Slide 29: Well Capitalized Threshold 6%
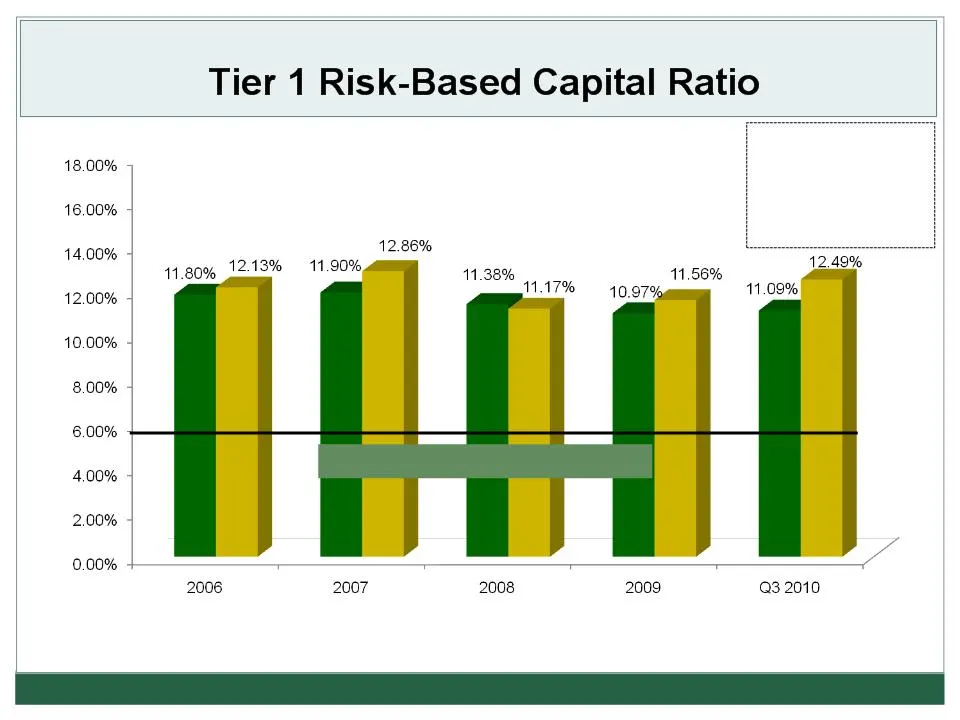
29 FAUQUIER BANKSHARES, INC. “Well Capitalized” Threshold 6% Year Percentile Q310 33 2009 43 2008 57 2007 46 2006 54 Peer Group - Bank Holding Companies with Consolidated Assets of $500MM - $1B (2010/2009/2008/2006) Peer Group - Bank Holding Companies with Consolidated Assets less than $500MM (2007)
Slide 30: Peer Group - Bank Holding Companies with Consolidated Assets of $500MM - $1B (2010/2009/2008/2006)
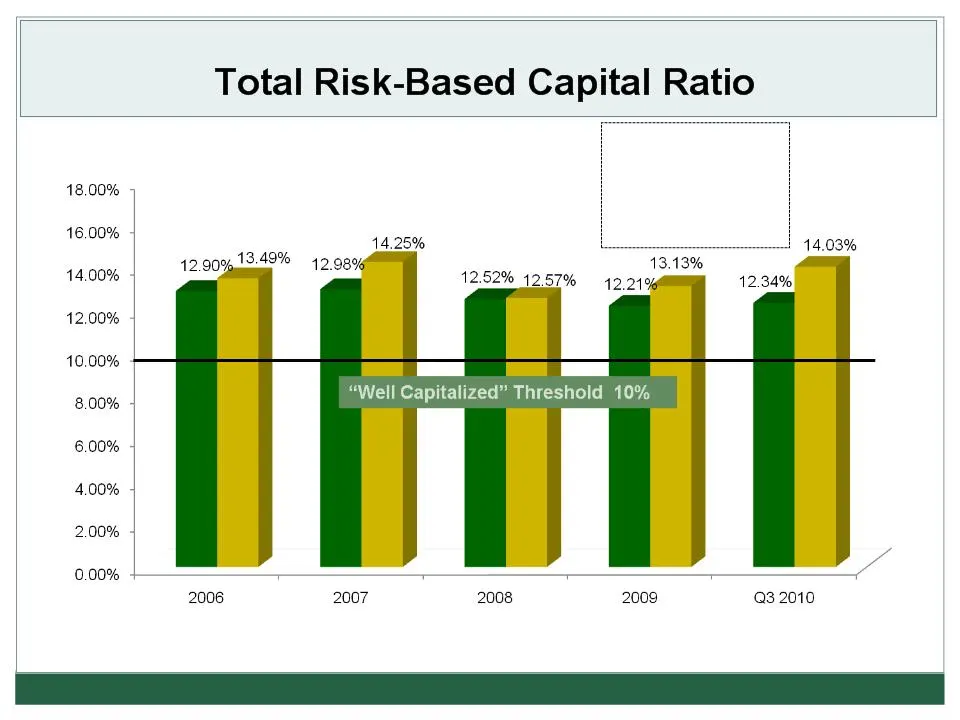
30 FAUQUIER BANKSHARES, INC. Peer Group - Bank Holding Companies with Consolidated Assets of $500MM - $1B (2010/2009/2008/2006) Peer Group - Bank Holding Companies with Consolidated Assets less than $500MM (2007) Source: BHC Performance Report Year Percentile Q310 28 2009 38 2008 56 2007 42 2006 52
Slide 31: Average Daily Balances for Three Months Ended September 30, 2010
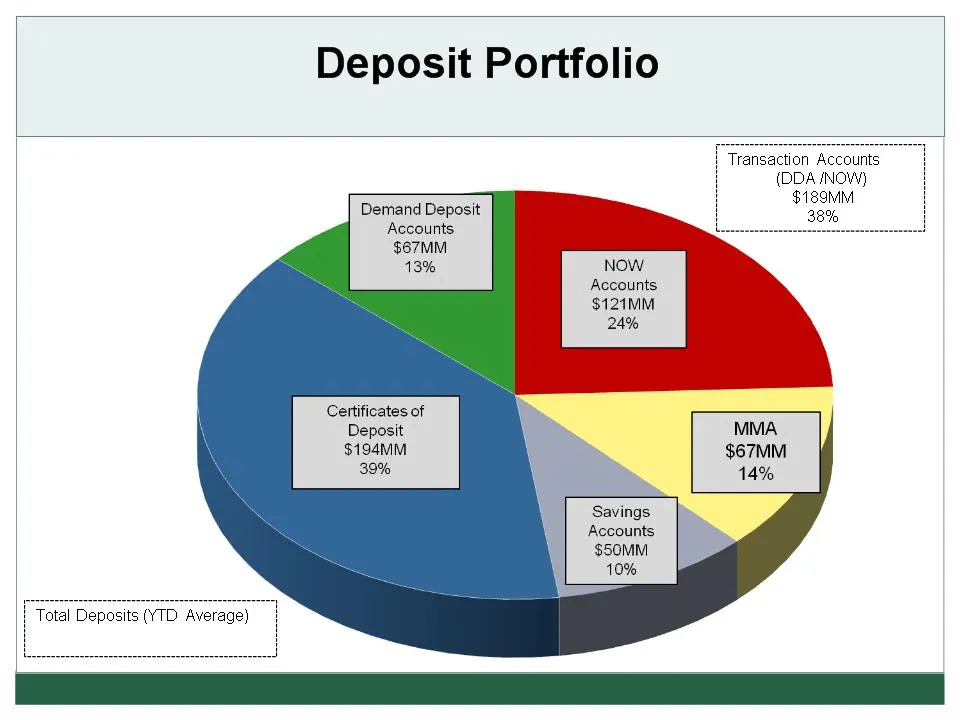
FAUQUIER BANKSHARES, INC. 31 Average Daily Balances for Three Months Ended September 30, 2010 $501MM
Slide 32: Deposit Market Share
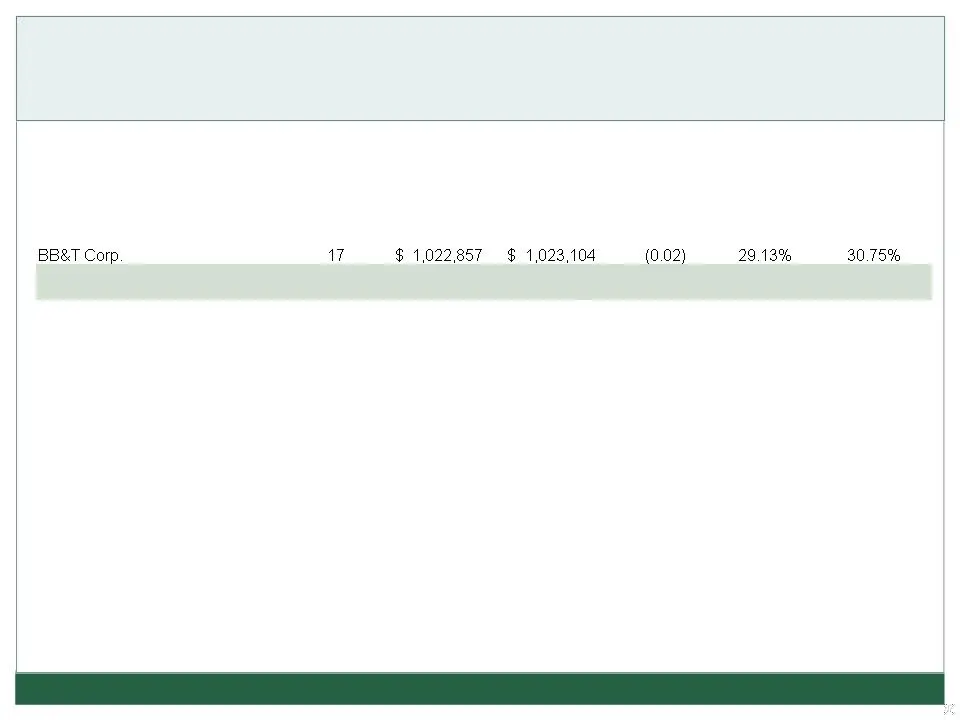
32 Financial Institution Current Number of Branches Total Deposits 2010 ($000) Total Deposits 2009 ($000) Year to Year Deposit Change 2010 (%) Market Share 2010 Market Share 2009 BB&T Corp. 17 $ 1,022,857 $ 1,023,104 (0.02) 29.13% 30.75% Fauquier Bankshares 10 493,053 412,892 19.41 14.04% 12.41% Sun
Slide 33: Financial Performance and Goals
FAUQUIER BANKSHARES, INC. 33 Financial Performance and Goals
Slide 34: Return on Average Equity (ROAE)
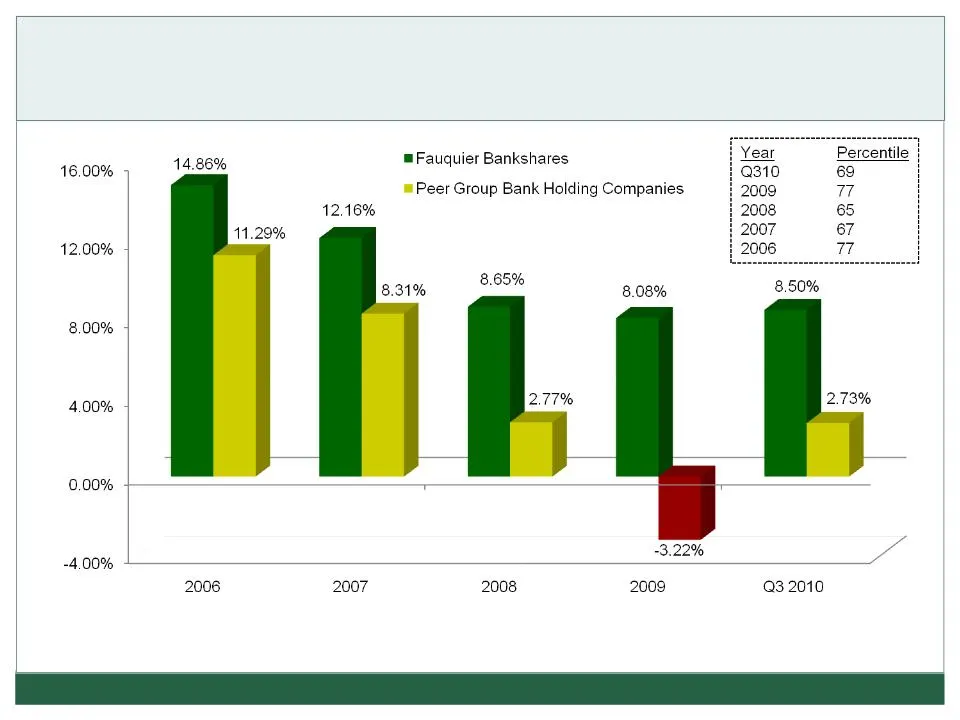
34 FAUQUIER BANKSHARES, INC. Return on Average Equity (ROAE) Peer Group - Bank Holding Companies with Consolidated Assets of $500MM - $1B (2010/2009/2008/2006) Peer Group - Bank Holding Companies with Consolidated Assets less than $500MM (2007) Sources: BHC Performance Report and Fauquier Bankshares
Slide 35: Earnings Per Share, Diluted
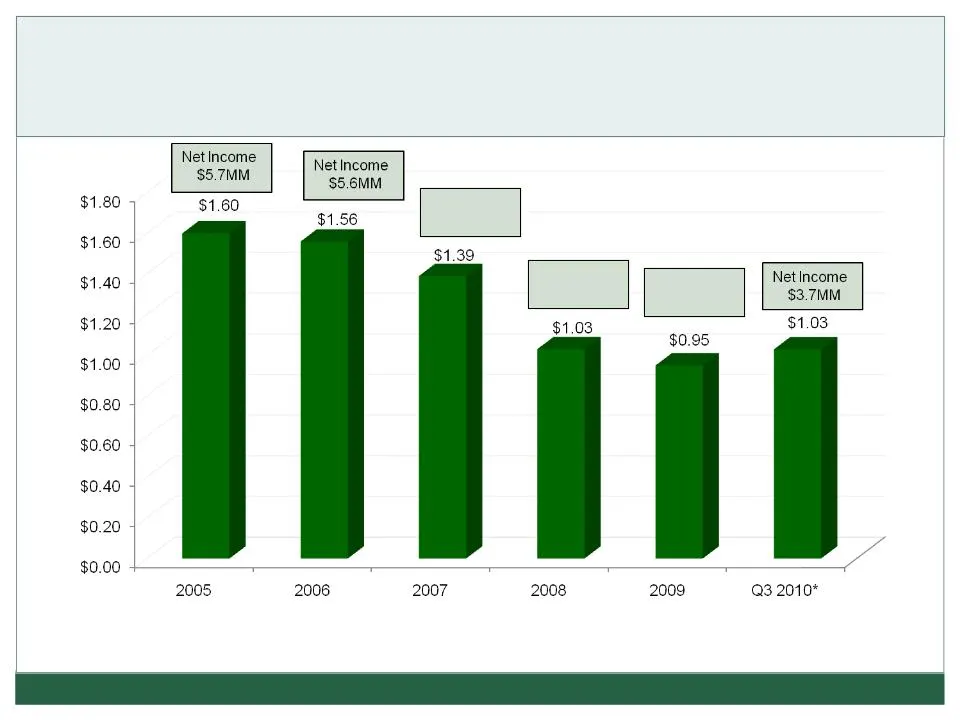
FAUQUIER BANKSHARES, INC. 35 Earnings Per Share, Diluted Net Income $3.7MM Net Income $5.0MM Net Income $3.4MM Source: Fauquier Bankshares Financials As of December 31, unless otherwise noted. Q3 2010 (9 mo.) data is annualized based on $0.77 per share and net income of $2.8 MM as of September 30, 2
Slide 36: Net Income (ROAA)
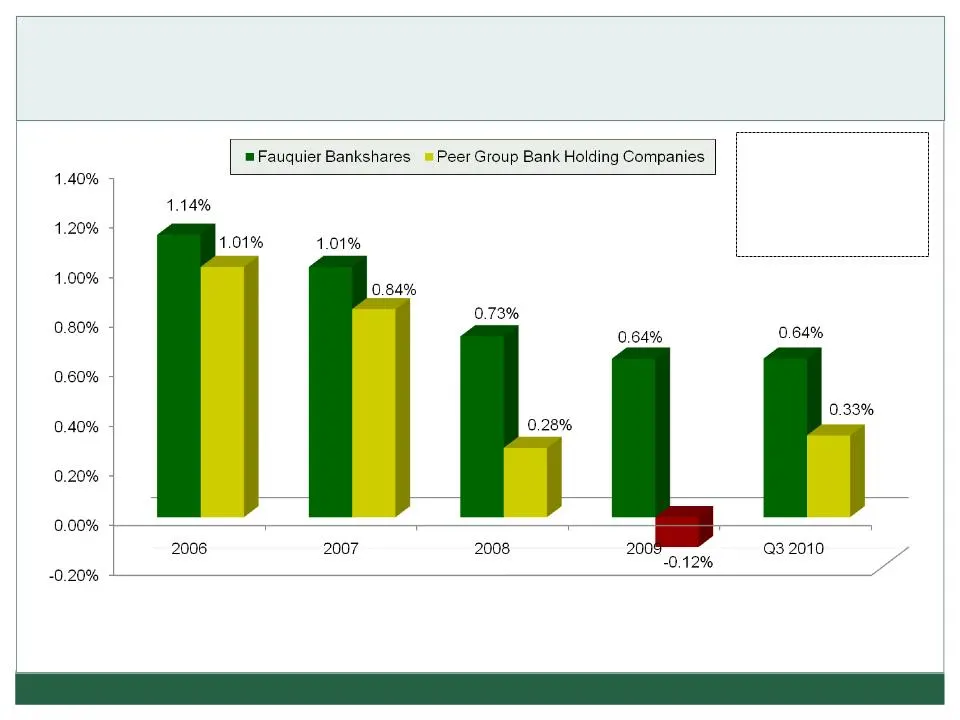
36 FAUQUIER BANKSHARES, INC. Net Income (ROAA) (As a Percent of Average Assets) Year Percentile Q310 61 2009 69 2008 65 2007 59 2006 62 Peer Group - Bank Holding Companies with Consolidated Assets of $500MM - $1B (2010/2009/2008/2006) Peer Group - Bank Holding Companies with Consolidated Assets less
Slide 37: Net Margin Interest
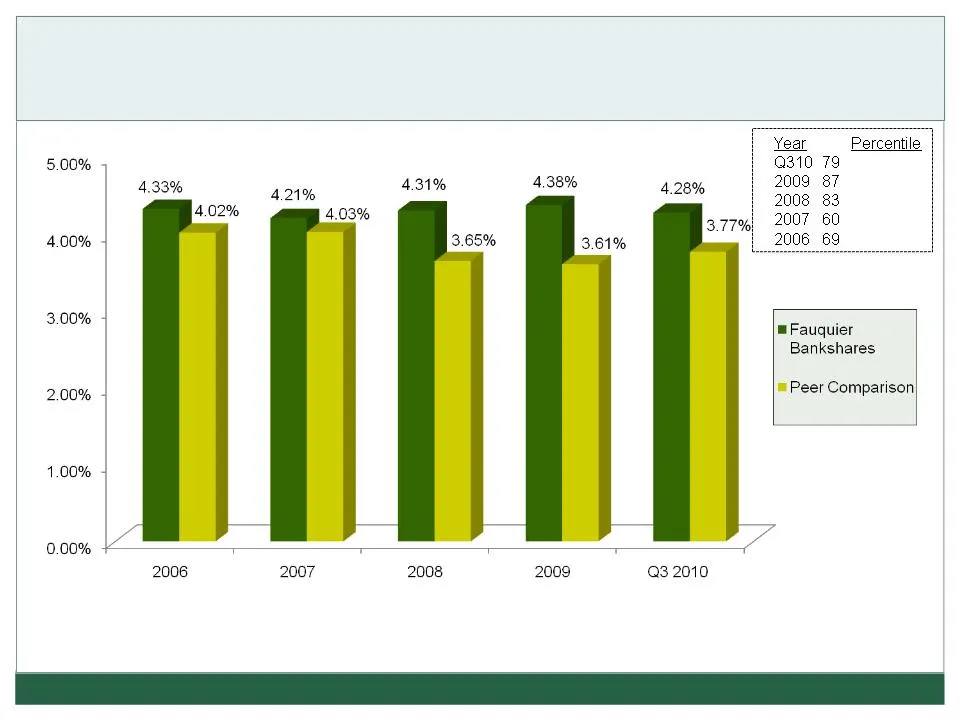
37 FAUQUIER BANKSHARES, INC. Net Margin Interest* *Net interest income on a taxable equivalent basis divided by average earning assets - four point average. Peer Group - Bank Holding Companies with Consolidated Assets of $500MM - $1B (2010/2009/2008/2006) Peer Group - Bank Holding Companies with Con
Slide 38: Cost of Funds
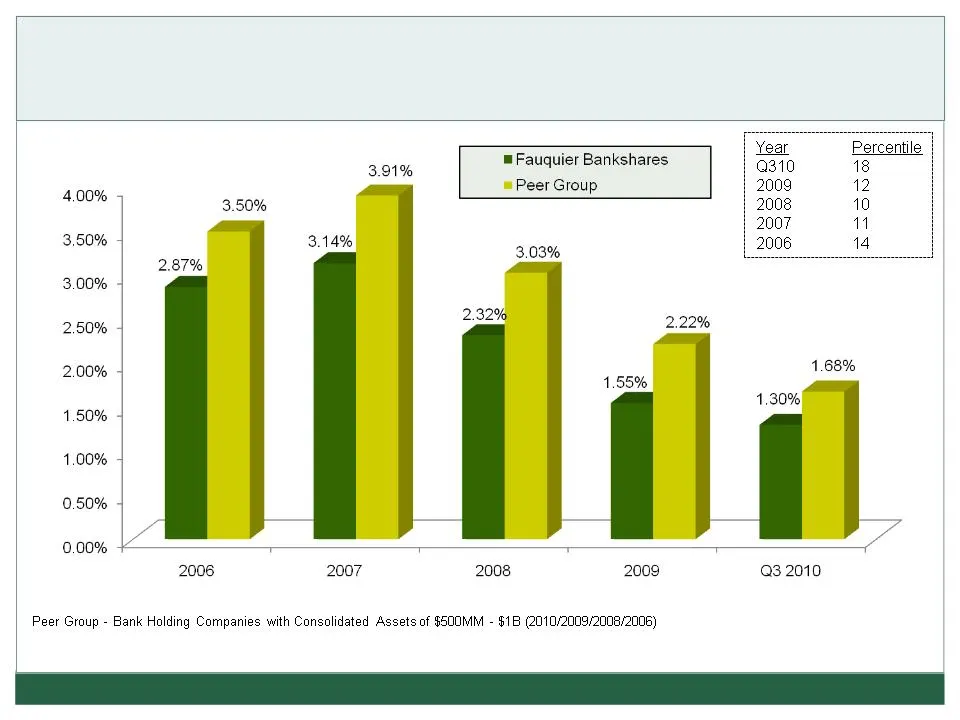
38 FAUQUIER BANKSHARES, INC. Cost of Funds Peer Group - Bank Holding Companies with Consolidated Assets less than $500MM (2007) Sources: BHC Performance Report and Fauquier Bankshares Financials
Slide 39: Total Non-Interest Income
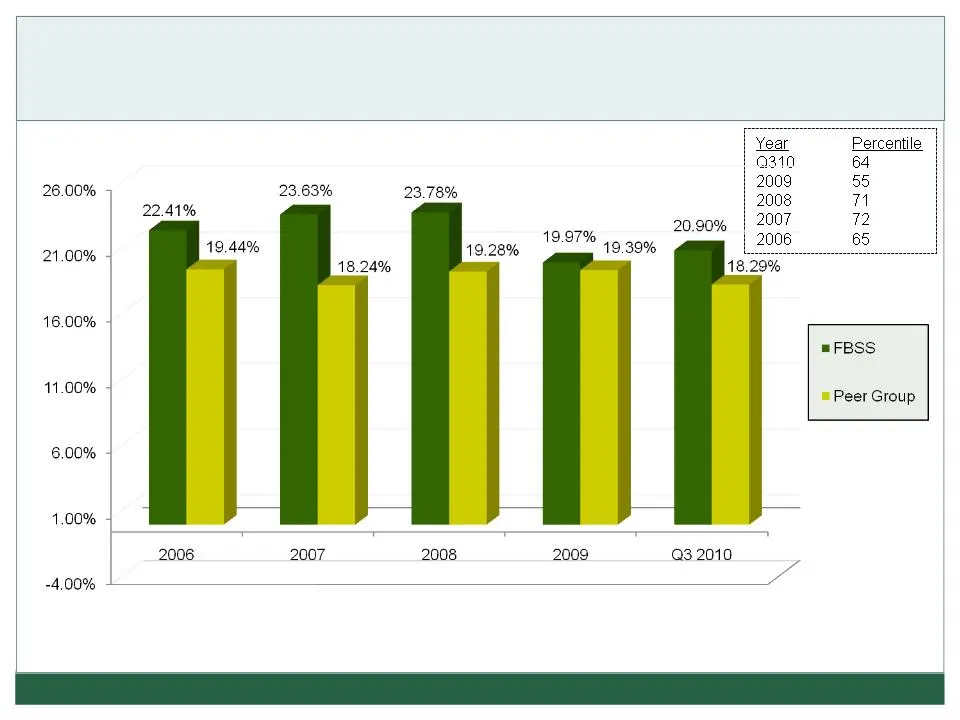
FAUQUIER BANKSHARES, INC. 39 Total Non-Interest Income As a Percent of Adjusted Operating Income (TE) Peer Group - Bank Holding Companies with Consolidated Assets of $500MM - $1B (2010/2009/2008) Peer Group - Bank Holding Companies with Consolidated Assets less than $500MM (2007) Source: BHC Perform
Slide 40: Assets Under Management
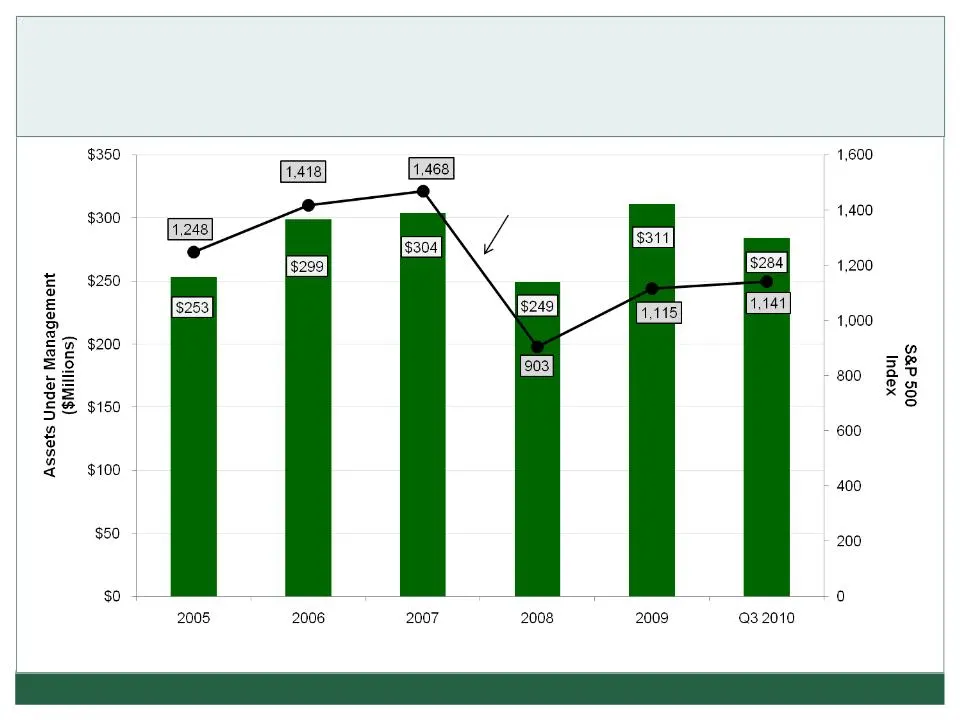
40 FAUQUIER BANKSHARES, INC. Assets Under Management (At Market Value) Source: Wealth Management Services Statement of Condition and SNL - As of December 31 or last day in quarter S&P 500 Index
Slide 41: Keys to Building Shareholder Value
FAUQUIER BANKSHARES, INC. 41 Keys to Building Shareholder Value — Maintain strong credit quality - Past due loans as a percent of total loans consistently under 2% — Build transaction account deposit base — Disciplined loan and deposit pricing — Continue to improve and implement technology
Slide 42: Stock Total Return Performance
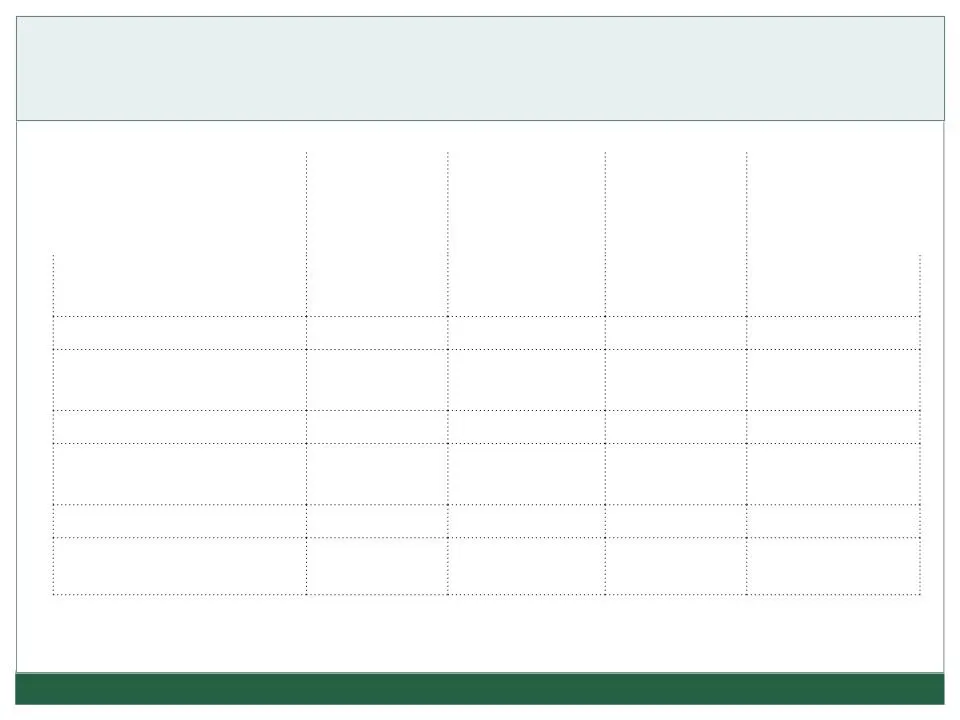
FAUQUIER BANKSHARES, INC. 42 Index Over Last Year Over Last Two Years Over Last Three Years Since Going Public (1997) FBSS 2.99% 11.08% (14.56%) 201.58% SNL Banks (2.16%) (6.13%) (45.41%) (0.63%) SNL $250M - $500M 7.47% (12.56%) (44.80%) 47.61% SNL $500M - $1B 3.56% (10.60%) (40.76%) 61.73% Stock To
Slide 43: Stock Total Return Performance
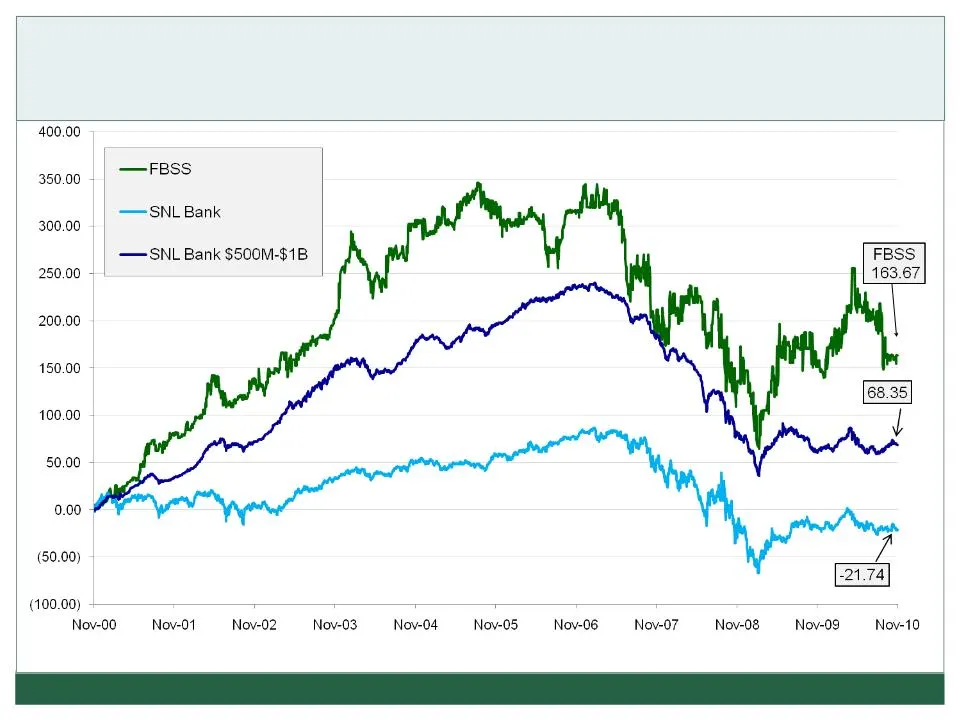
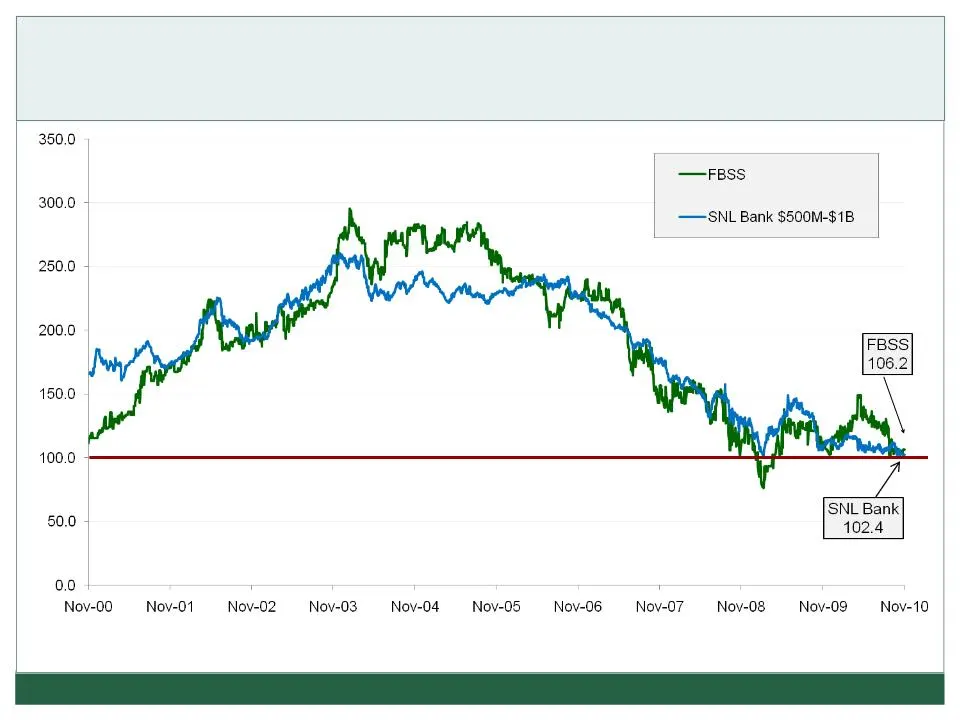
43 FAUQUIER BANKSHARES, INC. Stock Total Return Performance (November 30, 2000 - November 30, 2010) Source: SNL Financial
Slide 44: Stock Chart - Price/Tangible Book Value
44 FAUQUIER BANKSHARES, INC. Source: SNL Financial - December 2, 2010 Stock Chart - Price/Tangible Book Value (November 30, 2000- November 30, 2010)
Slide 45: Stock Chart - Price/Tangible Book Value
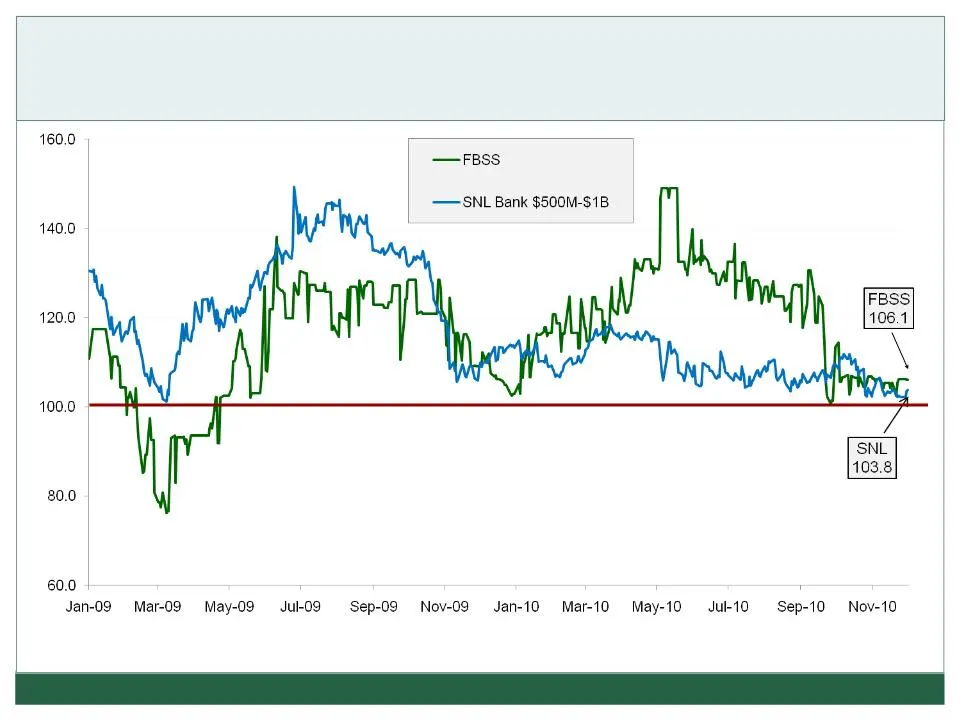
45 FAUQUIER BANKSHARES, INC. Source: SNL Financial - December 3, 2010 Stock Chart - Price/Tangible Book Value (January 2, 2009- December 2, 2010)
Slide 46: Buybacks and Dividends
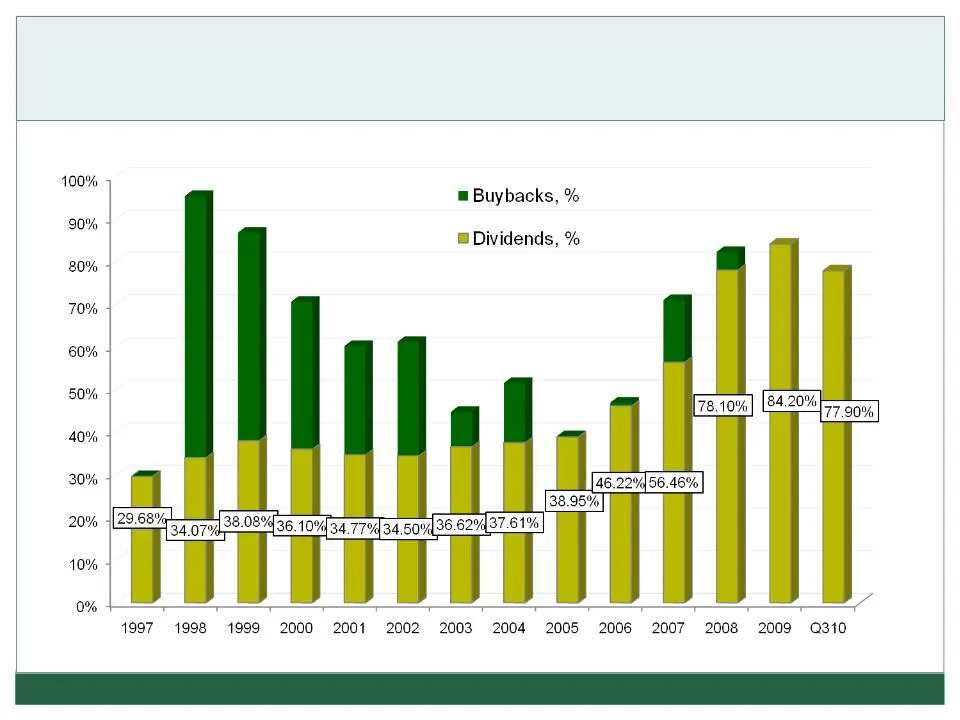
46 FAUQUIER BANKSHARES, INC. Buybacks and Dividends as a Percentage of Net Income
Slide 47: Contact Information
FAUQUIER BANKSHARES, INC. 47 Contact Information Investor Relation Contacts Randy K. Ferrell President & Chief Executive Officer randy.ferrell@fauquierbank.com Eric P. Graap Executive Vice President & Chief Financial Officer eric.graap@fauquierbank.com Valerie Barlowe Investor Relations Coordinator
Source: SEC EDGAR · 8-K filed Dec 14, 2010
More decks from Fauquier Bankshares Inc
 Merger or Acquisition (October 2020)20 slides · Oct 1, 2020
 Shareholder Meeting (May 2020)30 slides · May 19, 2020
 Investor Presentation (August 2019)20 slides · Aug 7, 2019
 Shareholder Meeting (May 2019)31 slides · May 21, 2019
 Investor Presentation (October 2018)18 slides · Oct 22, 2018
 Shareholder Meeting (May 2018)33 slides · May 15, 2018