Grenergy Renovables S.A · BME:GRE
Grenergy Renovables — Investor Presentation (February 2024)
36 slides from Grenergy Renovables's investor presentation, February 2024
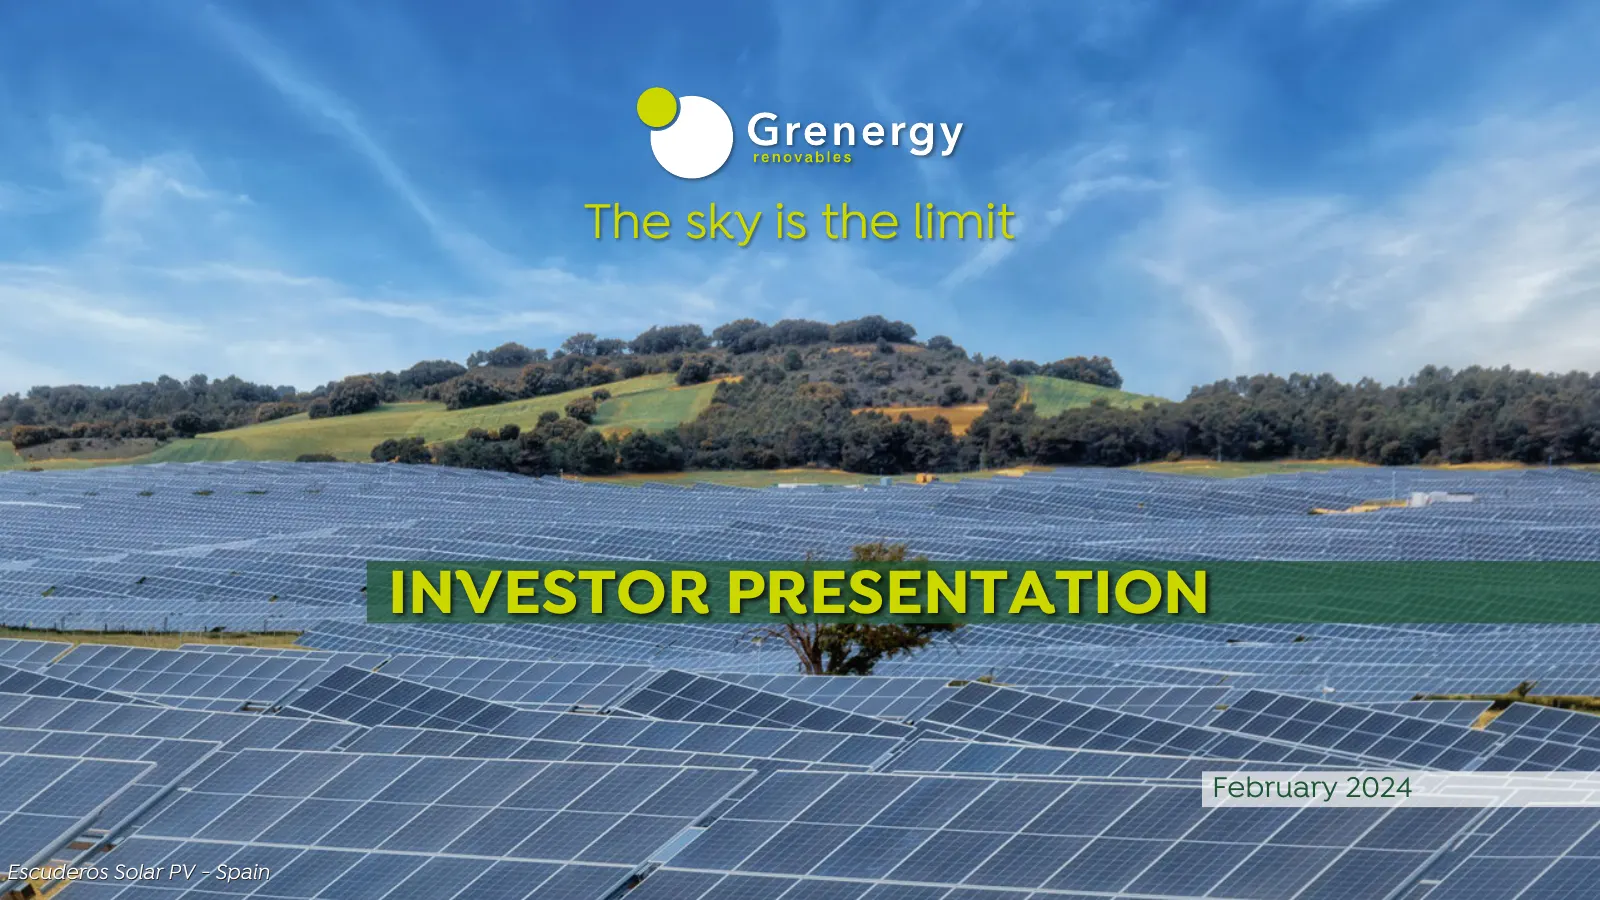
Slide 1: Investor Presentation February 2024
The sky is the limit INVESTOR PRESENTATION February 2024 Escuderos Solar PV - Spain
Slide 2: Disclaimer
DISCLAIMER By attending this presentation and/or by accepting this presentation you will be cial condition or results of operations by the Company and should not be relied upon taken to have represented, warranted and undertaken that you have read and when making an investment decision. Certain finan
Slide 3: Agenda
1 EQUITY STORY & KEY FIGURES 2 PLATFORM & PIPELINE 3 OPERATIONAL INFORMATION 4 STRONG GOVERNANCE STRUCTURE WITH FOCUS ON ESG 03
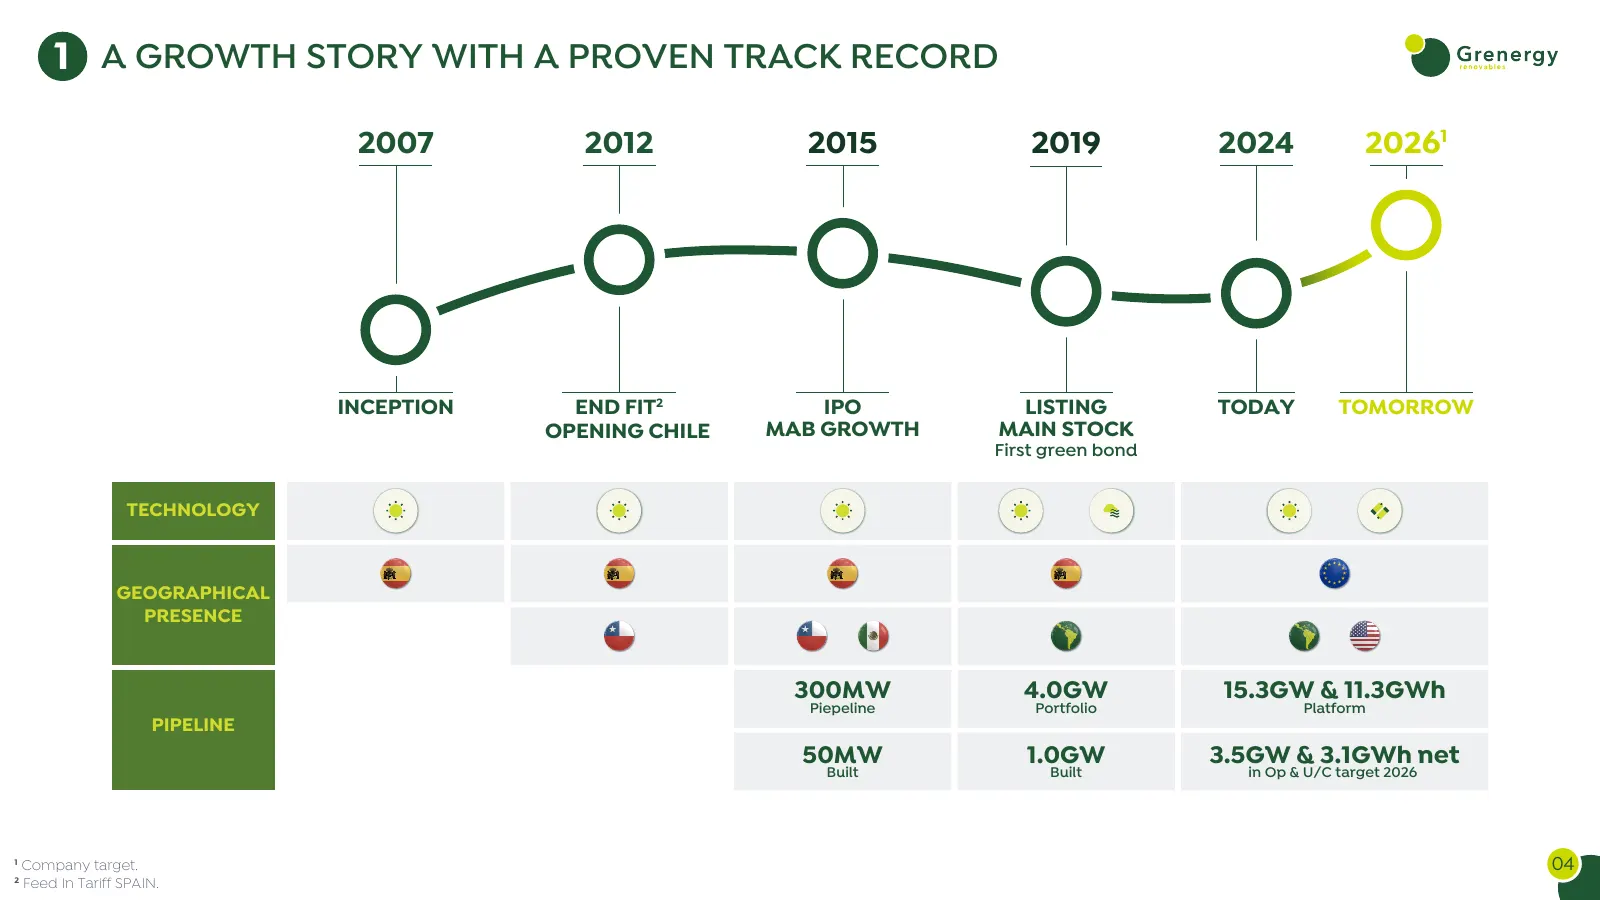
Slide 4: A Growth Story with a Proven Track Record
1 A GROWTH STORY WITH A PROVEN TRACK RECORD 2007 2012 2015 2019 2024 20261 INCEPTION END FIT2 IPO LISTING TODAY TOMORROW OPENING CHILE MAB GROWTH MAIN STOCK First green bond TECHNOLOGY GEOGRAPHICAL PRESENCE 300MW 4.0GW 15.3GW & 11.3GWh Piepeline Portfolio Platform PIPELINE 50MW 1.0GW 3.5GW & 3.1GWh
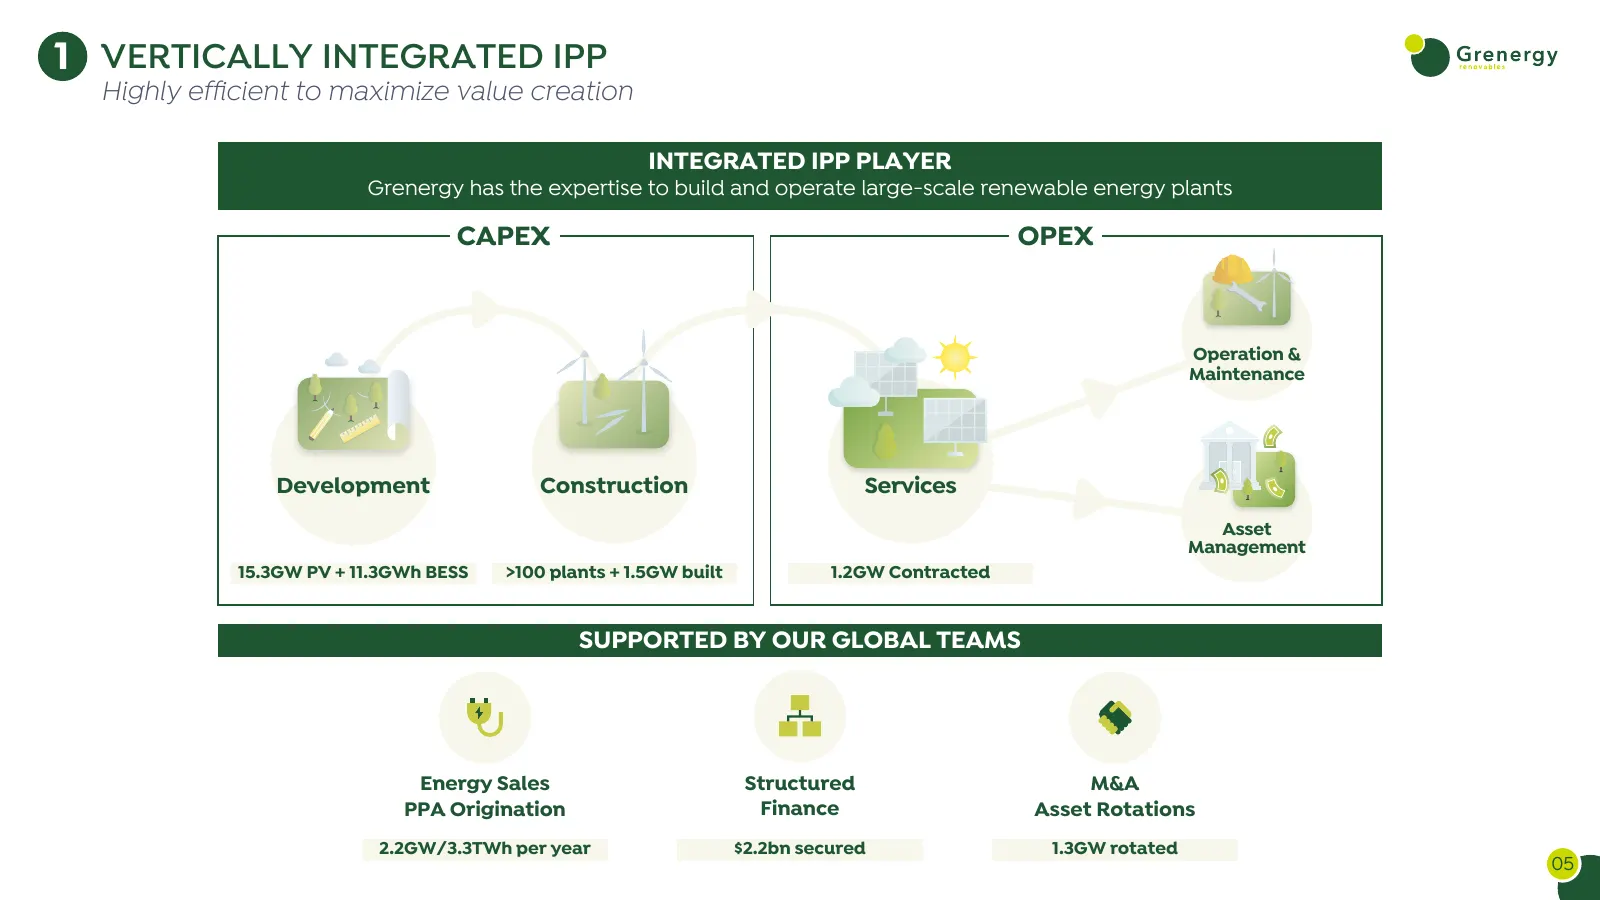
Slide 5: Vertically Integrated IPP
1 VERTICALLY INTEGRATED IPP Highly efficient to maximize value creation INTEGRATED IPP PLAYER Grenergy has the expertise to build and operate large-scale renewable energy plants CAPEX OPEX Operation & Maintenance Development Construction Services Asset Management 15.3GW PV + 11.3GWh BESS >100 plants
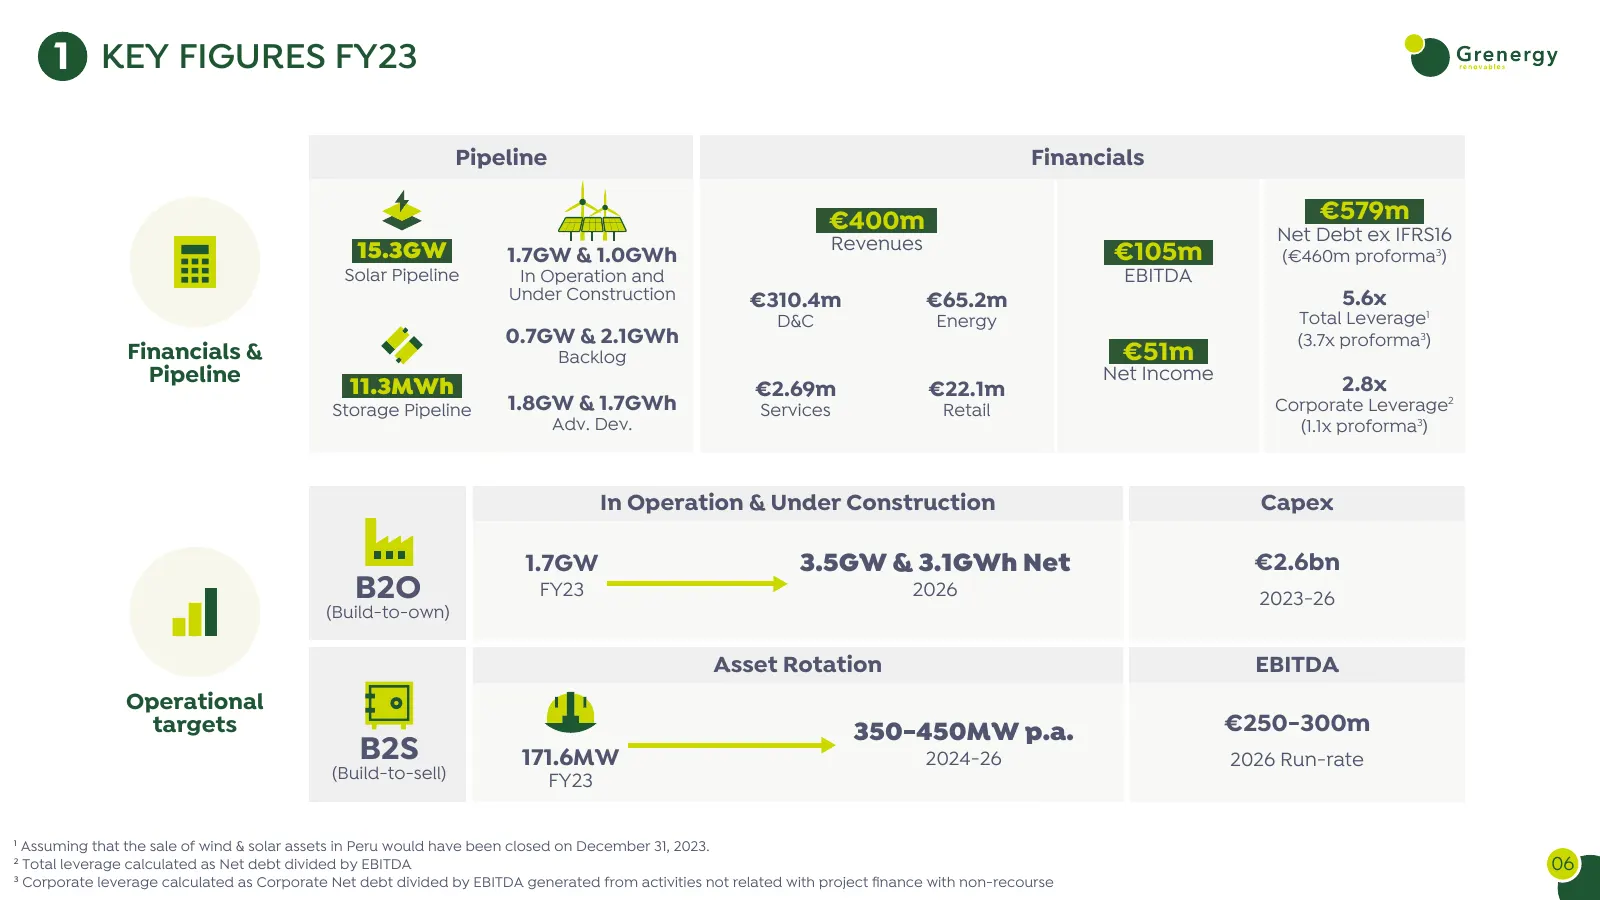
Slide 6: Key Figures FY23
1 KEY FIGURES FY23 Pipeline Financials €400m €579m Revenues Net Debt ex IFRS16 15.3GW 1.7GW & 1.0GWh €105m (€460m proforma3) Solar Pipeline In Operation and EBITDA Under Construction €310.4m €65.2m 5.6x D&C Energy Total Leverage1 0.7GW & 2.1GWh (3.7x proforma3) Financials & Backlog €51m Pipeline 11.
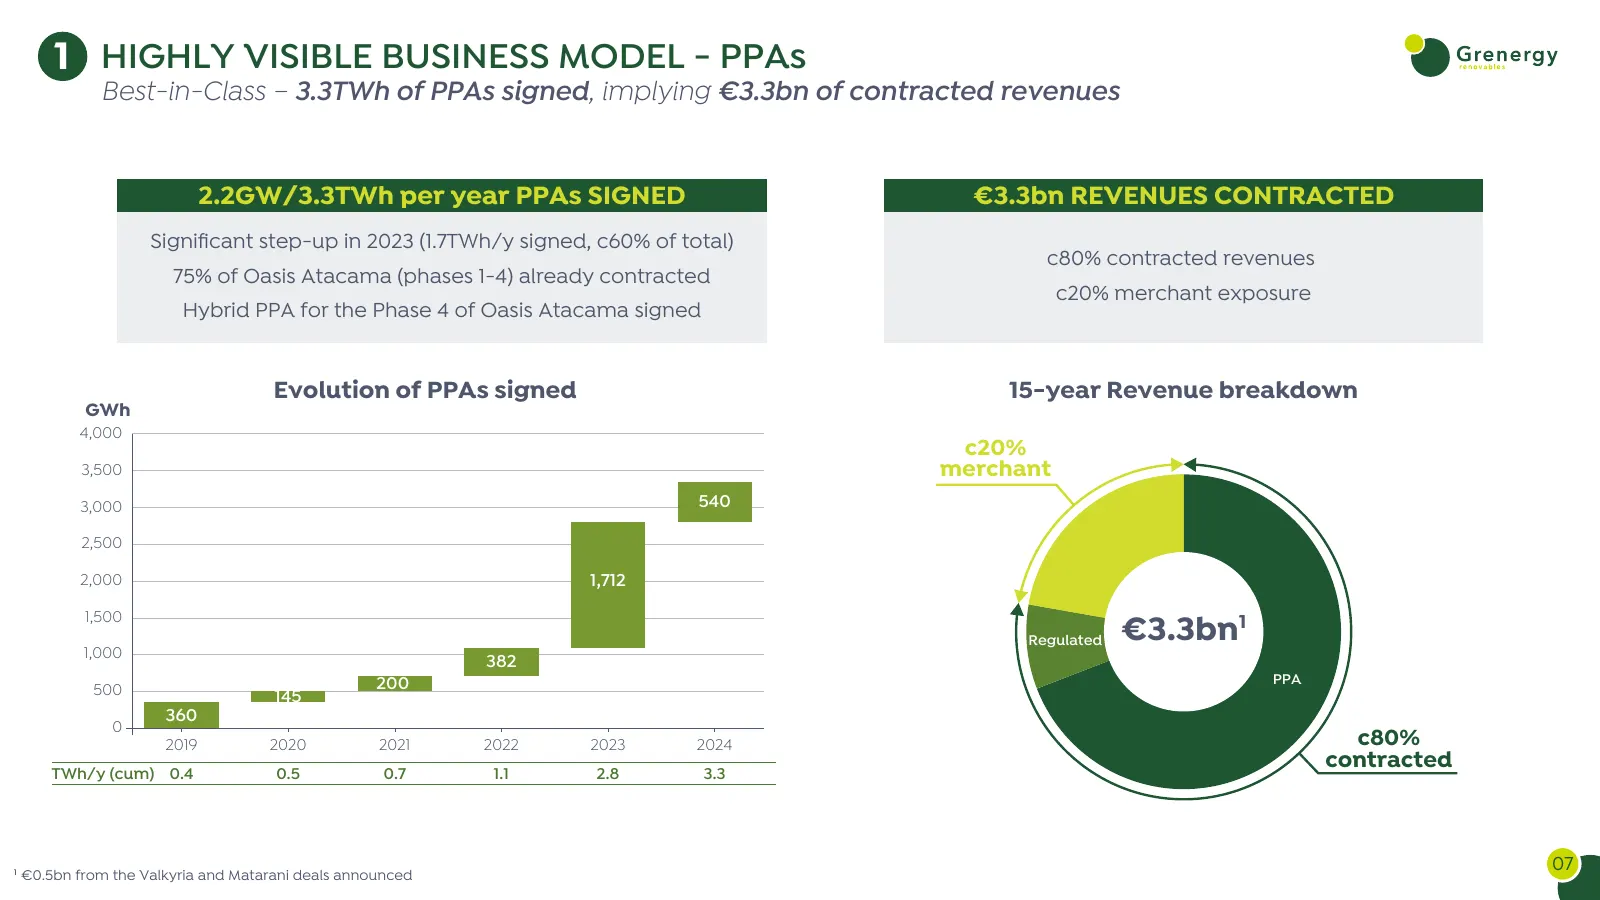
Slide 7: Highly Visible Business Model - PPAs
1 HIGHLY VISIBLE BUSINESS MODEL - PPAs Best-in-Class – 3.3TWh of PPAs signed, implying €3.3bn of contracted revenues 2.2GW/3.3TWh per year PPAs SIGNED €3.3bn REVENUES CONTRACTED Significant step-up in 2023 (1.7TWh/y signed, c60% of total) c80% contracted revenues 75% of Oasis Atacama (phases 1-4) al
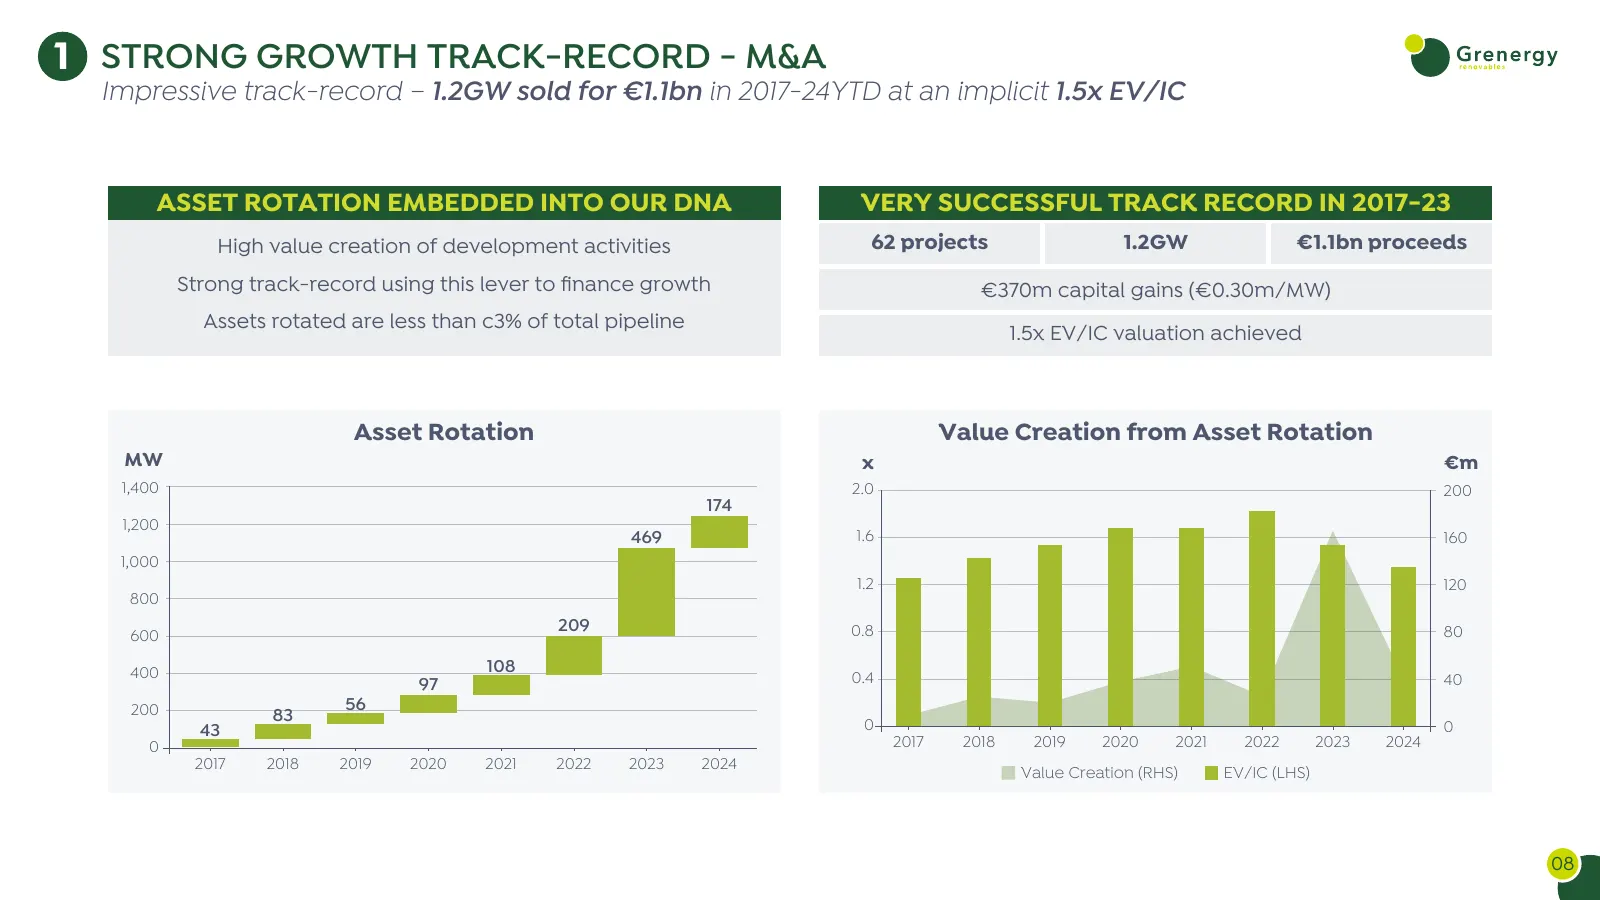
Slide 8: Strong Growth Track-Record - M&A
1 STRONG GROWTH TRACK-RECORD - M&A Impressive track-record – 1.2GW sold for €1.1bn in 2017-24YTD at an implicit 1.5x EV/IC ASSET ROTATION EMBEDDED INTO OUR DNA VERY SUCCESSFUL TRACK RECORD IN 2017-23 High value creation of development activities 62 projects 1.2GW €1.1bn proceeds Strong track-record
Slide 9: Self-Funded Investment Plan
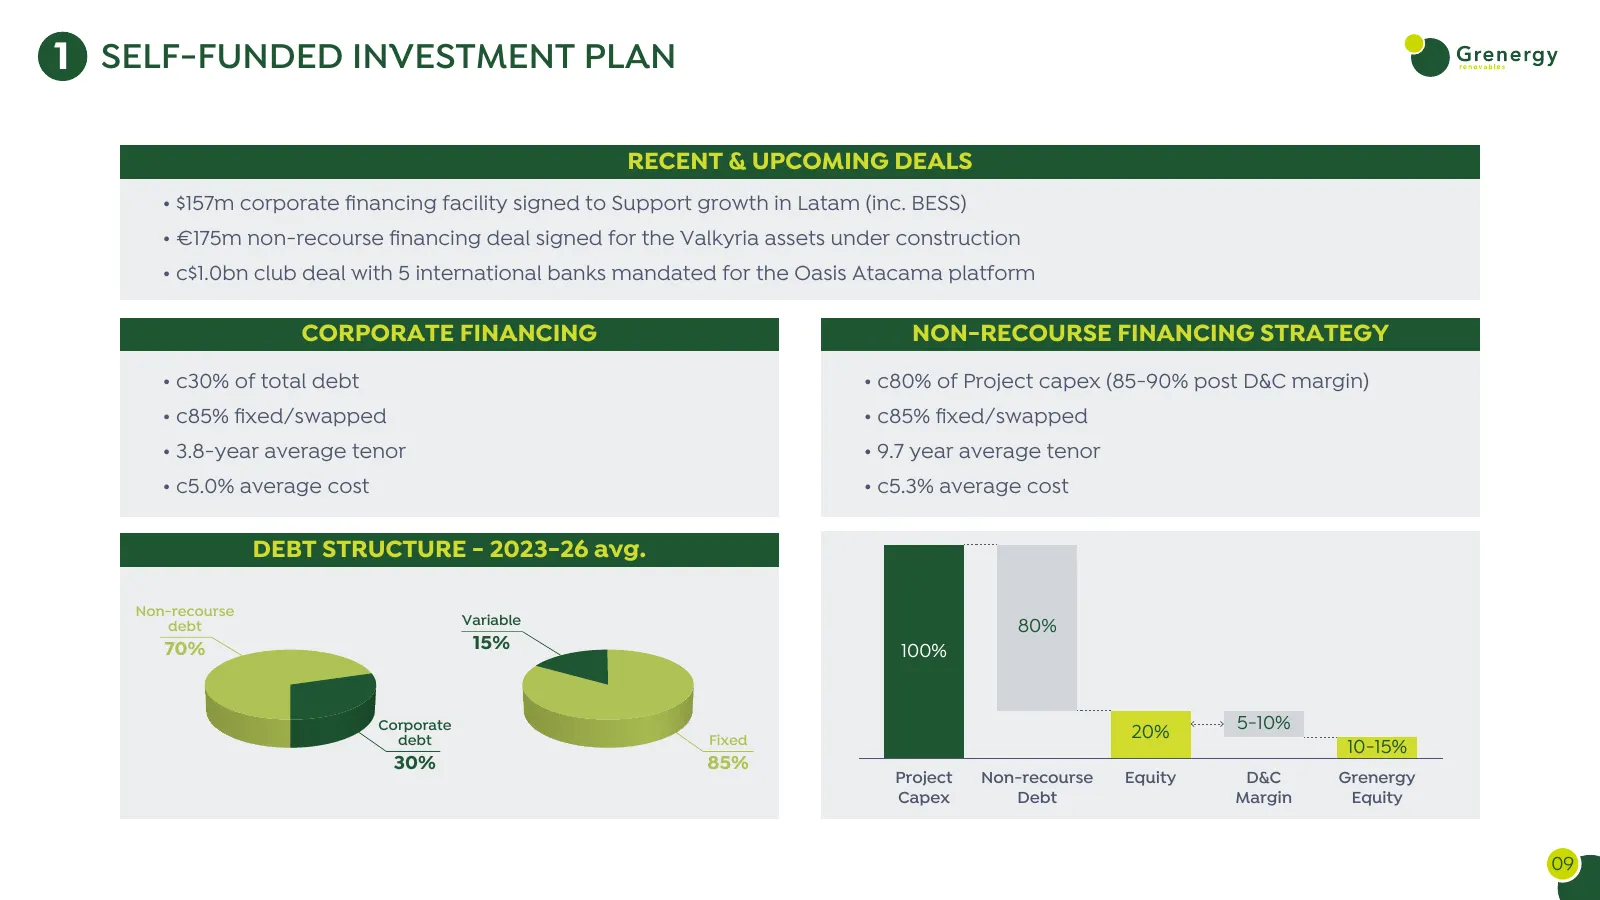
1 SELF-FUNDED INVESTMENT PLAN RECENT & UPCOMING DEALS • $157m corporate financing facility signed to Support growth in Latam (inc. BESS) • €175m non-recourse financing deal signed for the Valkyria assets under construction • c$1.0bn club deal with 5 international banks mandated for the Oasis Atacama
Slide 10: Key Strategic Targets 2026
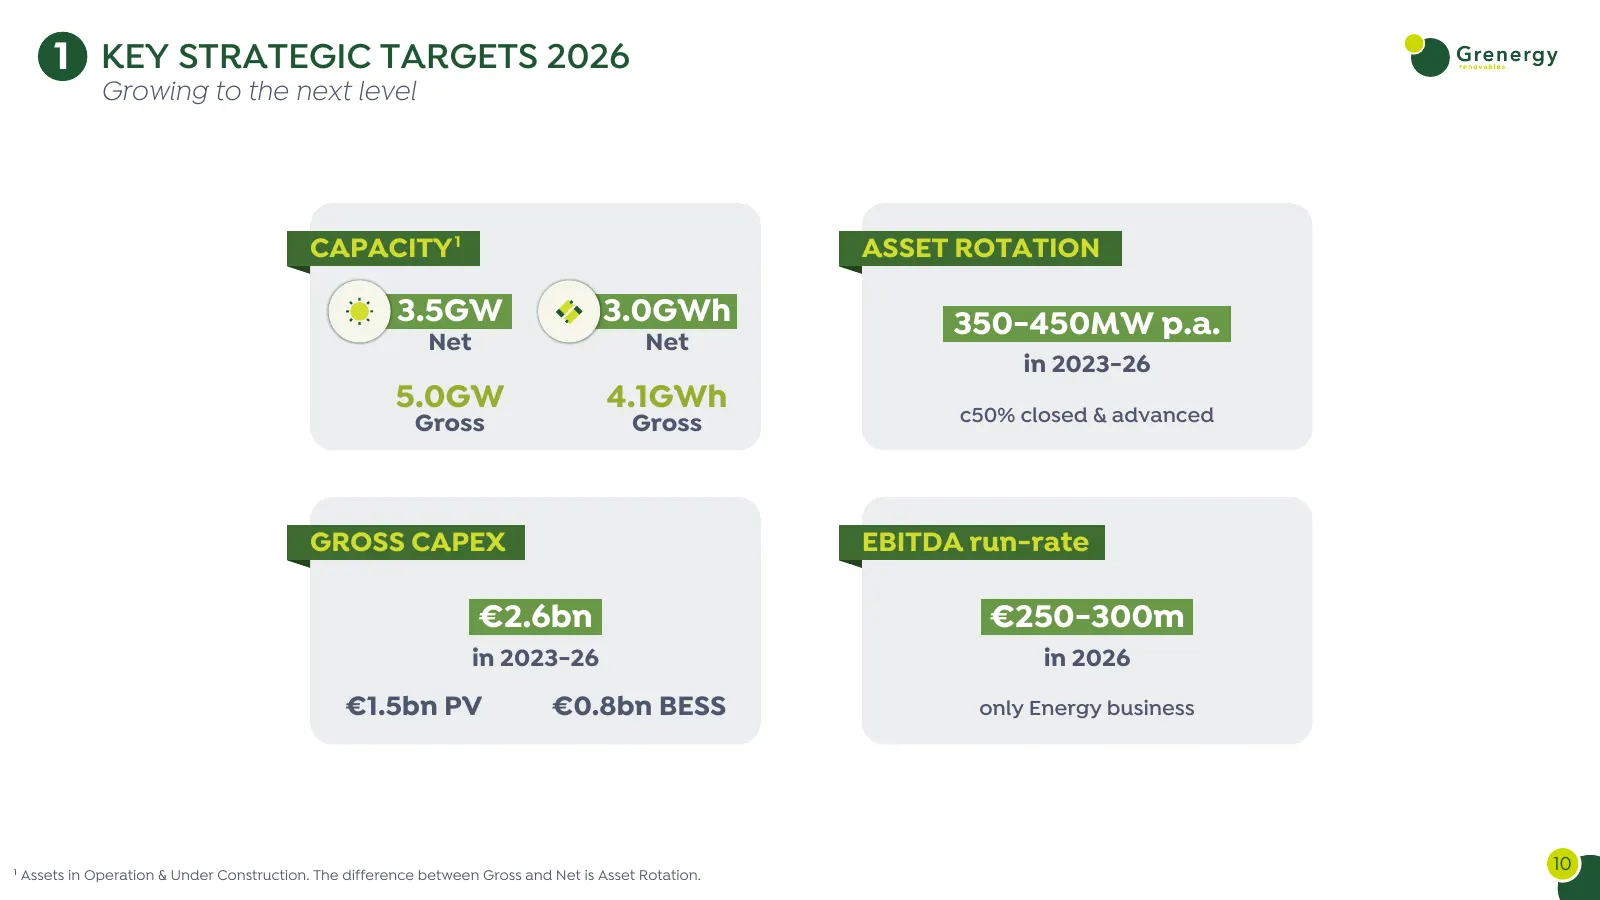
1 KEY STRATEGIC TARGETS 2026 Growing to the next level CAPACITY 1 ASSET ROTATION 3.5GW 3.0GWh 350-450MW p.a. Net Net in 2023-26 5.0GW 4.1GWh c50% closed & advanced Gross Gross GROSS CAPEX EBITDA run-rate €2.6bn €250-300m in 2023-26 in 2026 €1.5bn PV €0.8bn BESS only Energy business 1 Assets in Opera
Slide 11: Agenda
1 EQUITY STORY & KEY FIGURES 2 PLATFORM & PIPELINE 3 OPERATIONAL INFORMATION 4 STRONG GOVERNANCE STRUCTURE WITH FOCUS ON ESG 11
Slide 12: Platform Overview - Solar PV & BESS
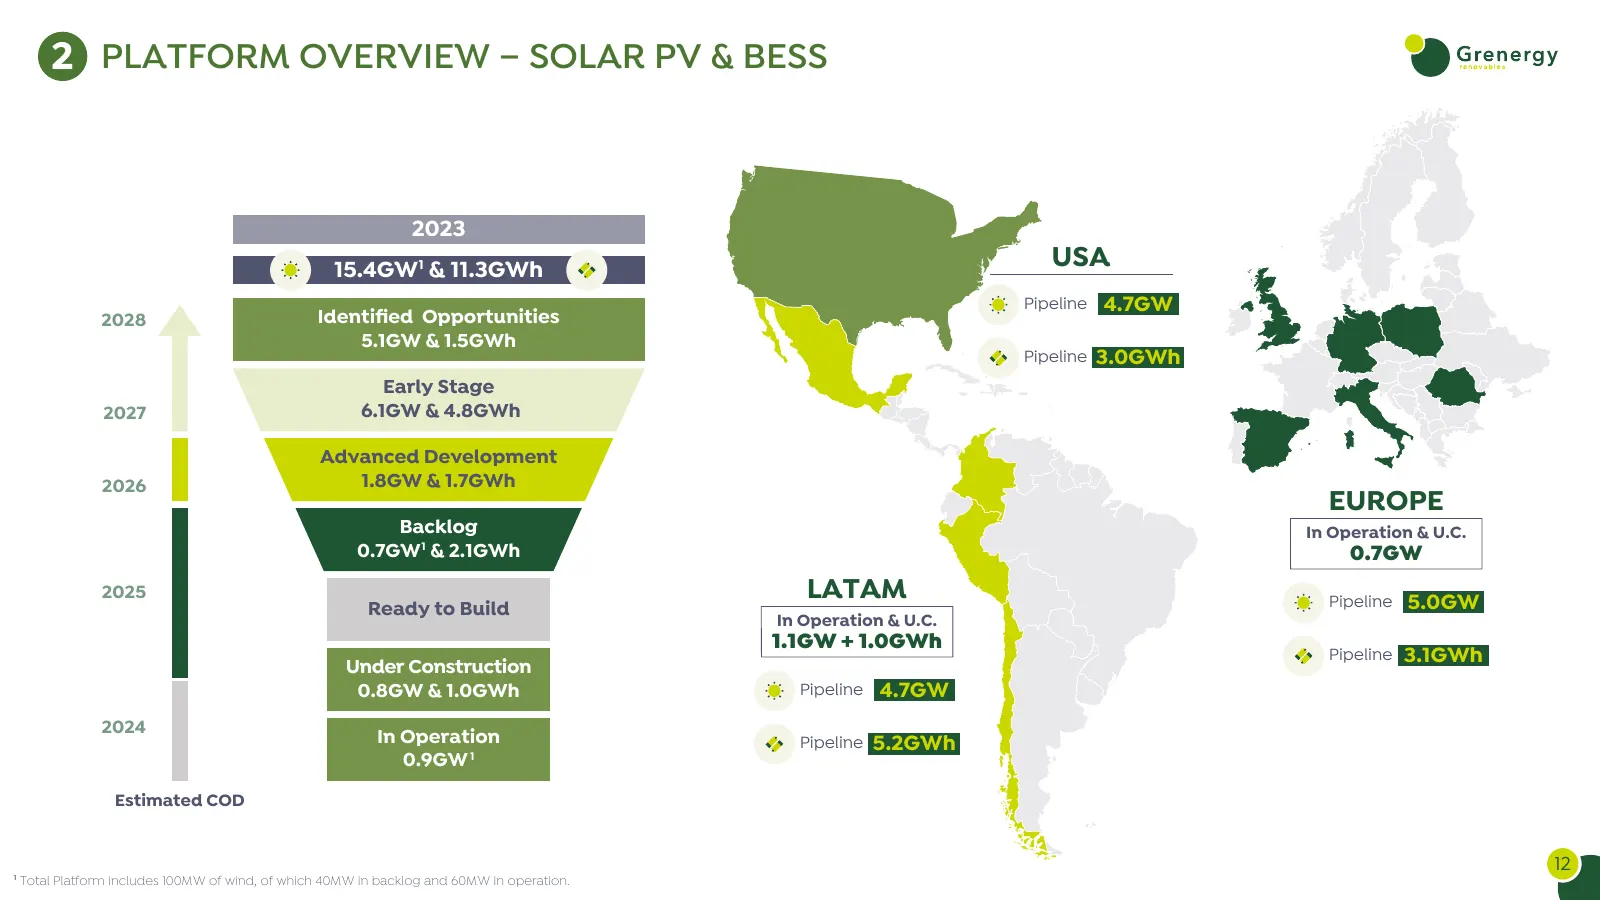
2 PLATFORM OVERVIEW – SOLAR PV & BESS 2023 15.4GW1 & 11.3GWh USA Pipeline 4.7GW 2028 Identified Opportunities 5.1GW & 1.5GWh Pipeline 3.0GWh Early Stage 2027 6.1GW & 4.8GWh Advanced Development 2026 1.8GW & 1.7GWh EUROPE Backlog In Operation & U.C. 0.7GW 1 & 2.1GWh 0.7GW 2025 LATAM Pipeline 5.0GW Rea
Slide 13: Solar PV & BESS Pipeline Update
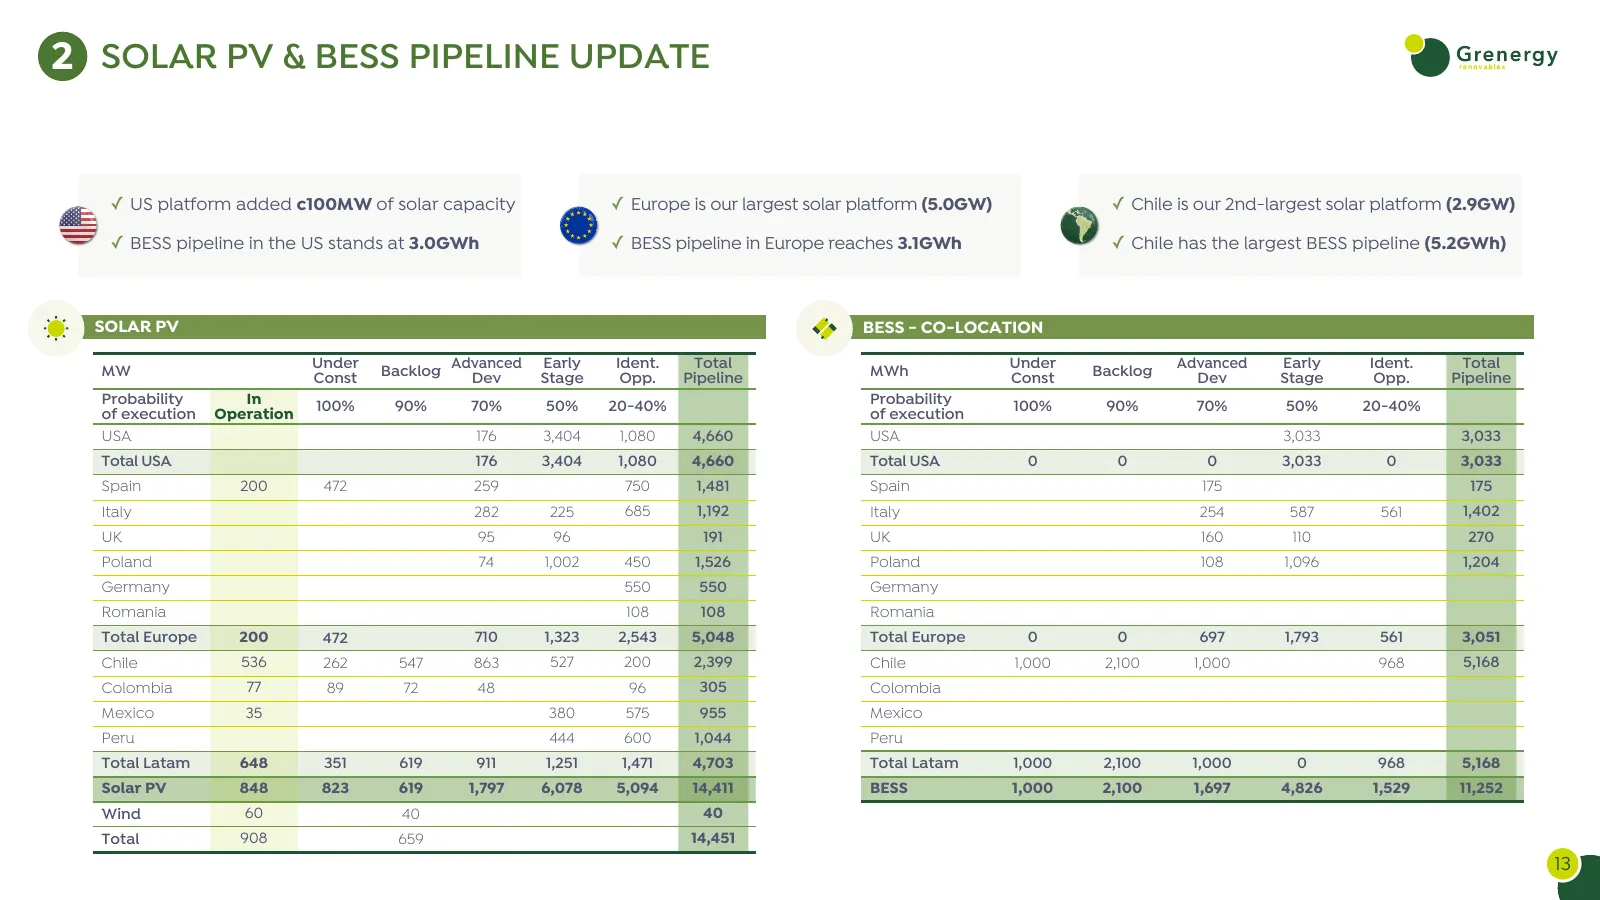
2 SOLAR PV & BESS PIPELINE UPDATE ✓ US platform added c100MW of solar capacity ✓ Europe is our largest solar platform (5.0GW) ✓ Chile is our 2nd-largest solar platform (2.9GW) ✓ BESS pipeline in the US stands at 3.0GWh ✓ BESS pipeline in Europe reaches 3.1GWh ✓ Chile has the largest BESS pipeline (5
Slide 14: Largest BESS Project in LatAm with 4.1GWh
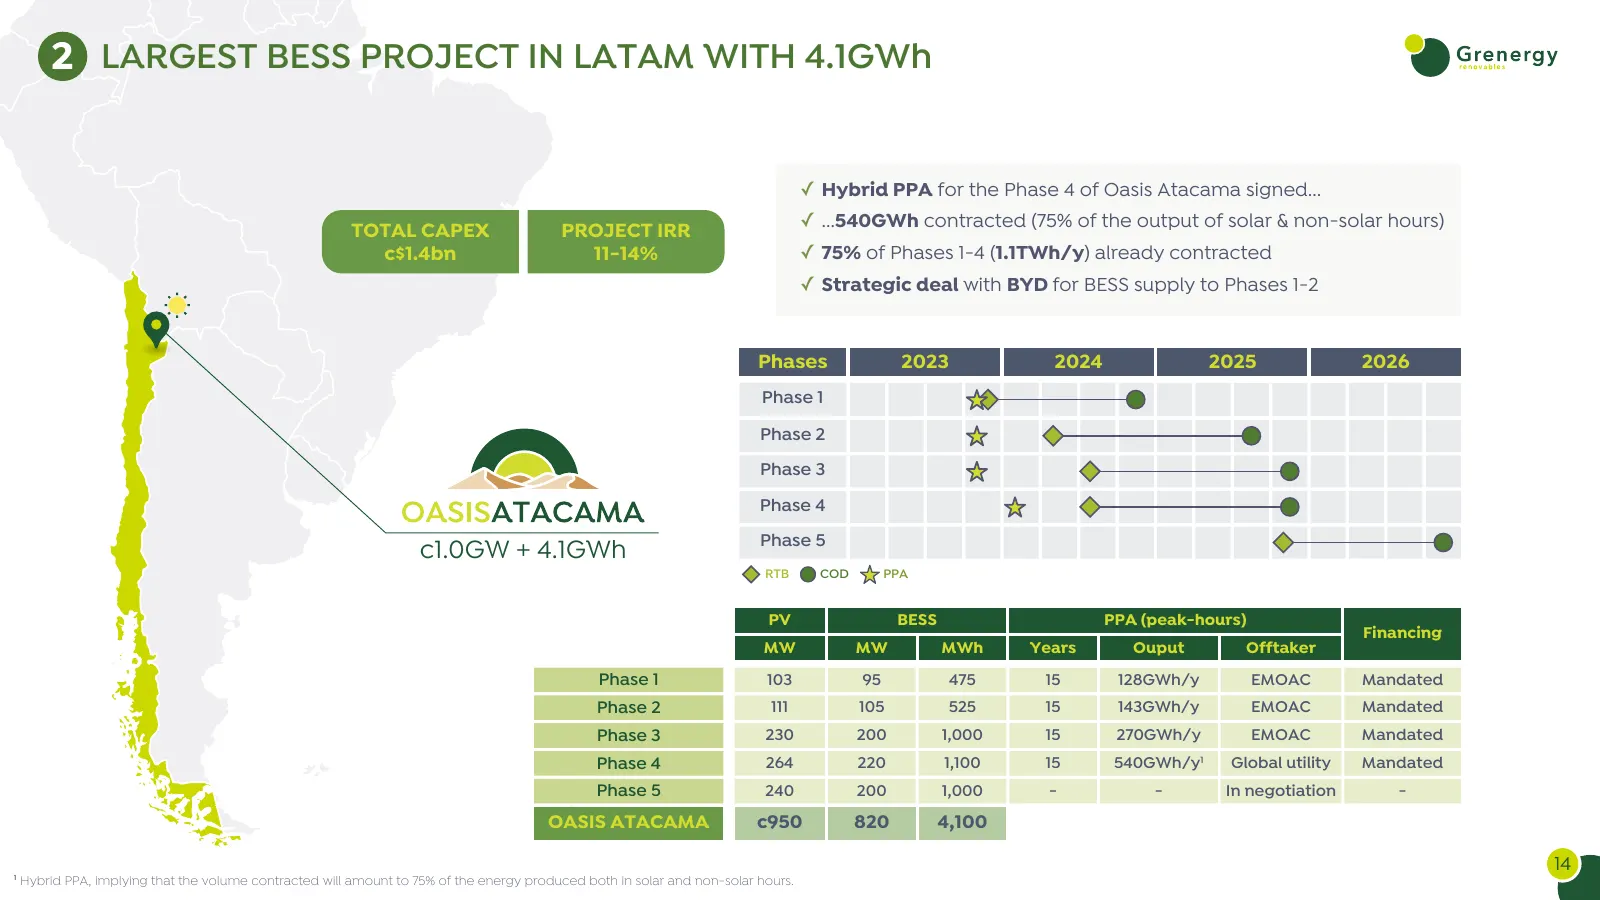
2 LARGEST BESS PROJECT IN LATAM WITH 4.1GWh ✓ Hybrid PPA for the Phase 4 of Oasis Atacama signed... TOTAL CAPEX PROJECT IRR ✓ ...540GWh contracted (75% of the output of solar & non-solar hours) c$1.4bn 11-14% ✓ 75% of Phases 1-4 (1.1TWh/y) already contracted ✓ Strategic deal with BYD for BESS supply
Slide 15: Platform Update: Projects In Operation, Under Construction & Backlog
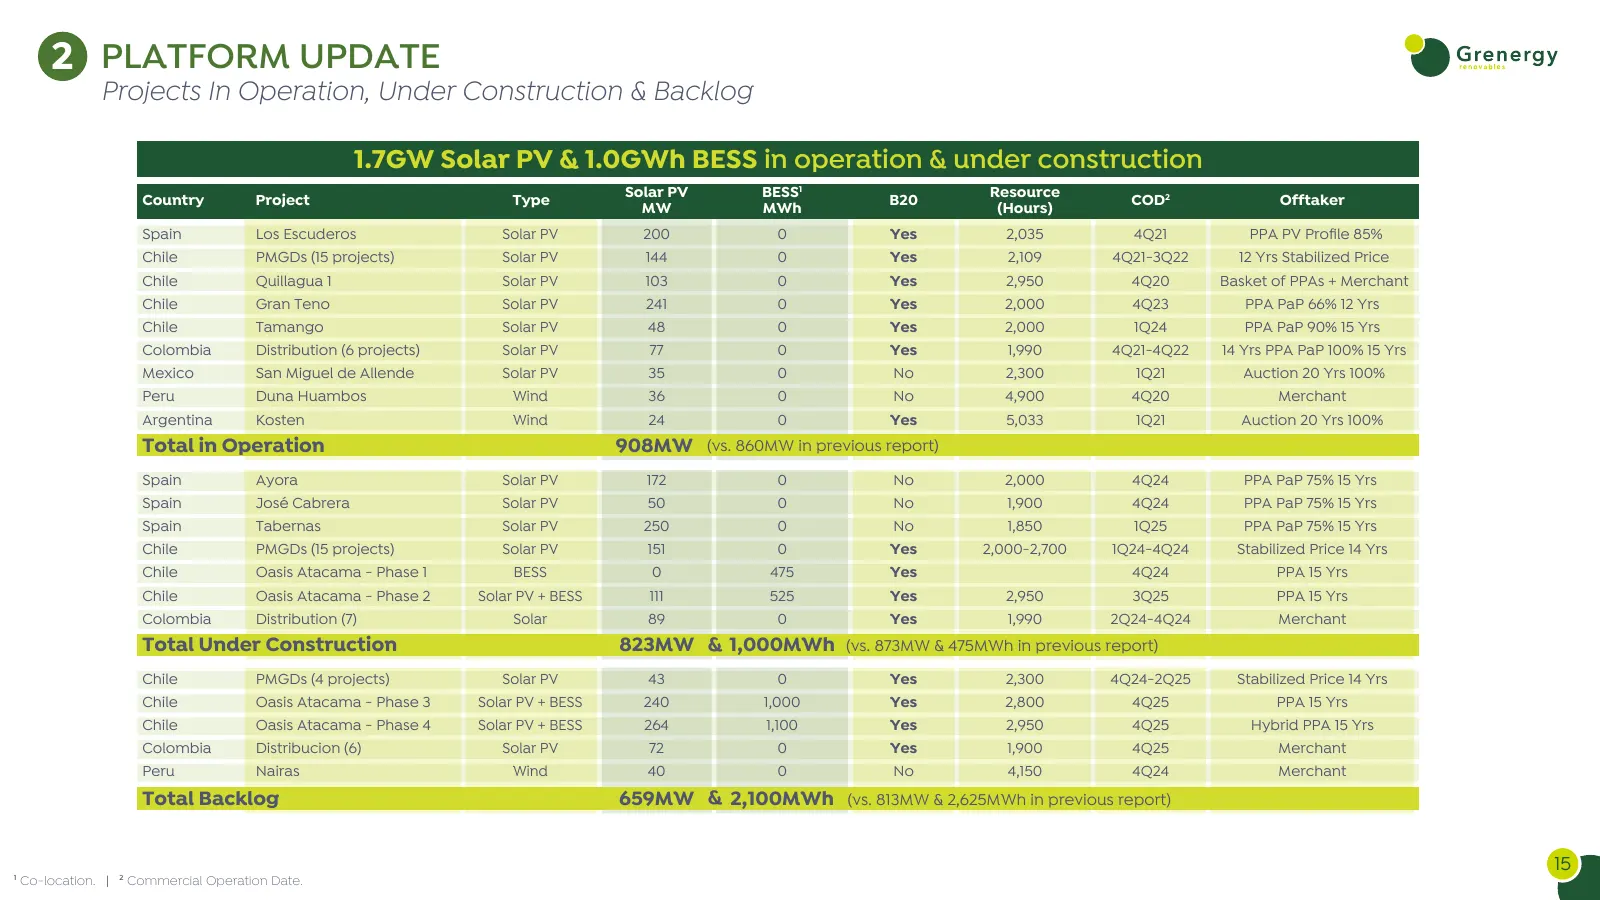
2 PLATFORM UPDATE Projects In Operation, Under Construction & Backlog 1.7GW Solar PV & 1.0GWh BESS in operation & under construction Country Project Type Solar PV BESS1 B20 Resource COD2 Offtaker MW MWh (Hours) Spain Los Escuderos Solar PV 200 0 Yes 2,035 4Q21 PPA PV Profile 85% Chile PMGDs (15 proje
Slide 16: Platform Update: Projects in Advanced Development
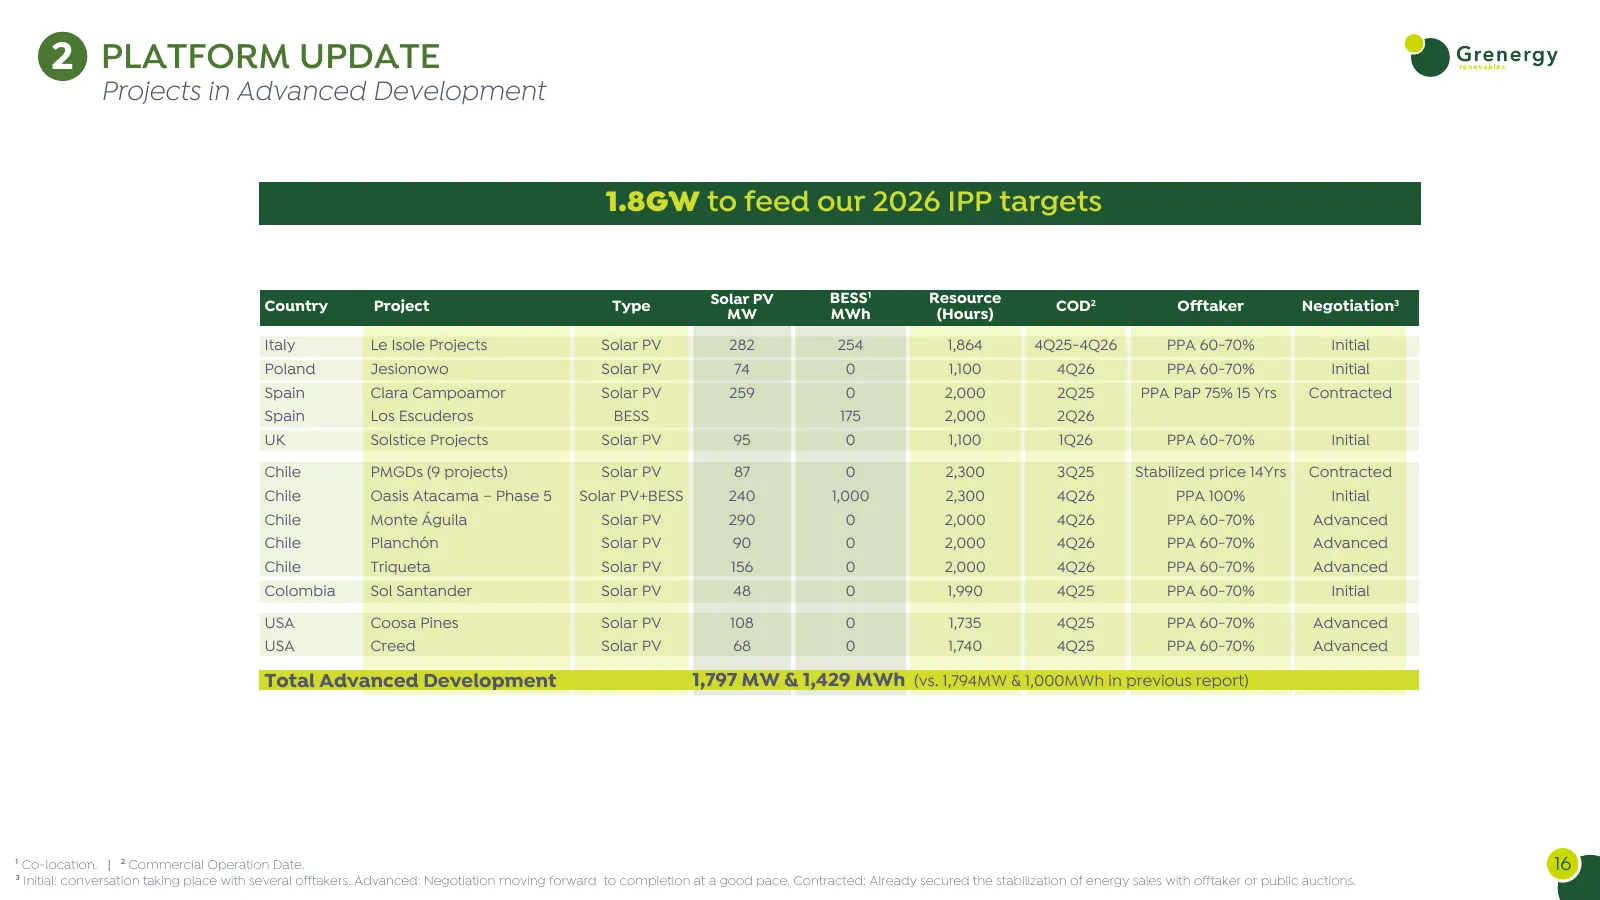
2 PLATFORM UPDATE Projects in Advanced Development 1.8GW to feed our 2026 IPP targets Country Project Type Solar PV BESS1 Resource COD2 Offtaker Negotiation3 MW MWh (Hours) Italy Le Isole Projects Solar PV 282 254 1,864 4Q25-4Q26 PPA 60-70% Initial Poland Jesionowo Solar PV 74 0 1,100 4Q26 PPA 60-70
Slide 17: Agenda
1 EQUITY STORY & KEY FIGURES 2 PLATFORM & PIPELINE 3 OPERATIONAL INFORMATION 4 STRONG GOVERNANCE STRUCTURE WITH FOCUS ON ESG 17
Slide 18: PPAs - High Revenue Visibility
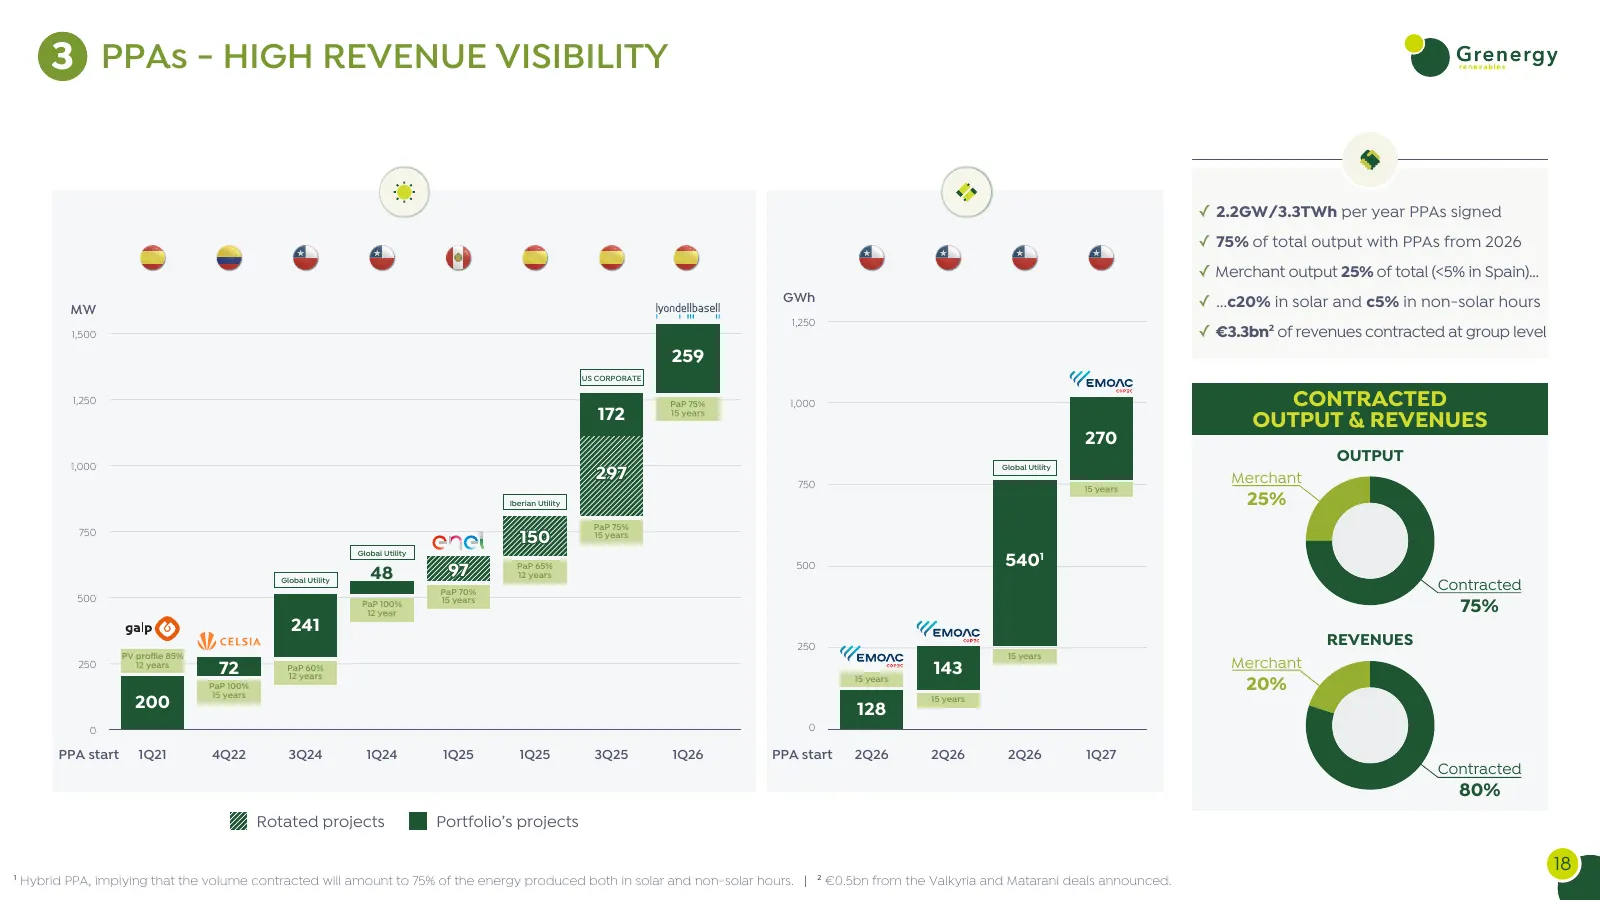
3 PPAs - HIGH REVENUE VISIBILITY ✓ 2.2GW/3.3TWh per year PPAs signed ✓ 75% of total output with PPAs from 2026 ✓ Merchant output 25% of total (<5% in Spain)... MW GWh ✓ ...c20% in solar and c5% in non-solar hours 1,250 1,500 ✓ €3.3bn2 of revenues contracted at group level 259 US CORPORATE 1,250 PaP
Slide 19: 643MW Asset Rotated for Equity Proceeds of c€340m
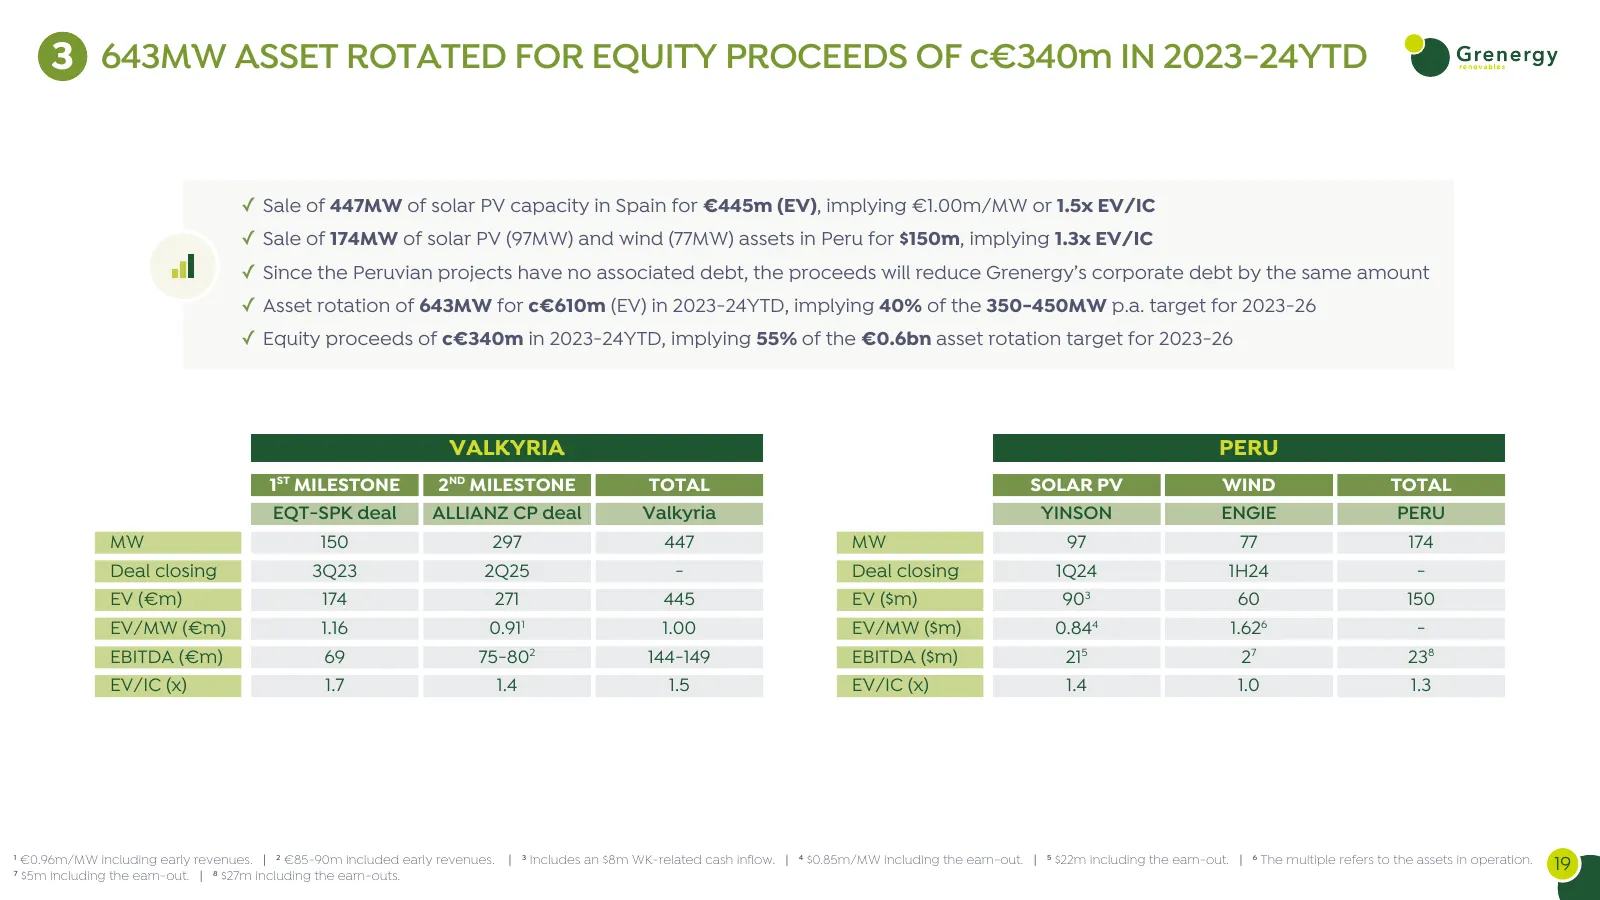
3 643MW ASSET ROTATED FOR EQUITY PROCEEDS OF c€340m IN 2023-24YTD ✓ Sale of 447MW of solar PV capacity in Spain for €445m (EV), implying €1.00m/MW or 1.5x EV/IC ✓ Sale of 174MW of solar PV (97MW) and wind (77MW) assets in Peru for $150m, implying 1.3x EV/IC ✓ Since the Peruvian projects have no asso
Slide 20: Key Operating & Financial Data
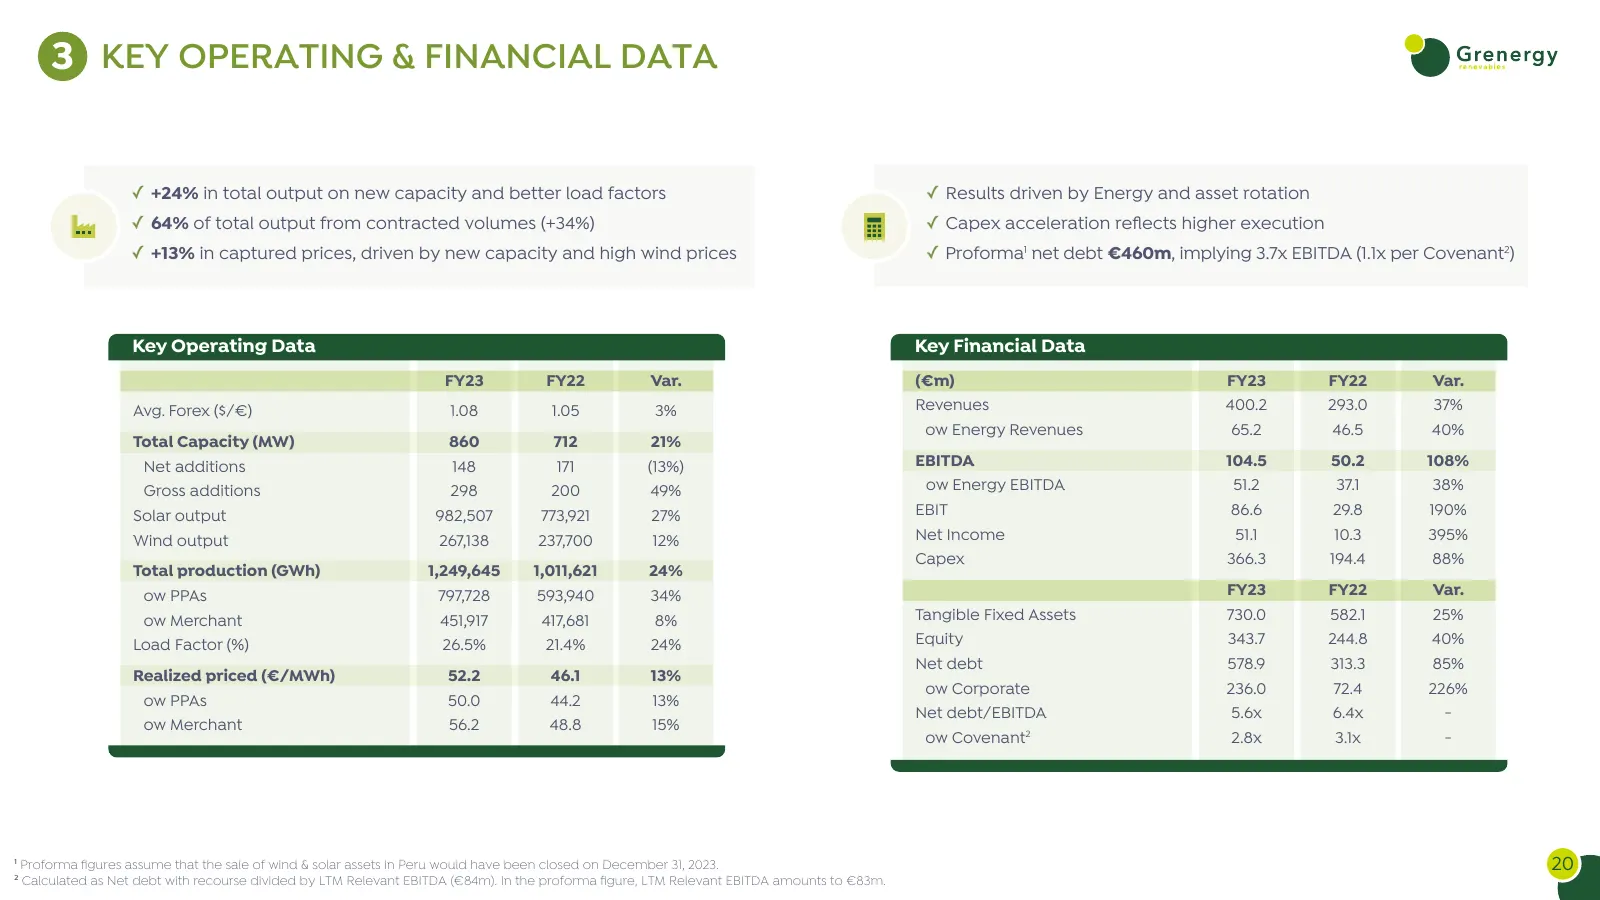
3 KEY OPERATING & FINANCIAL DATA ✓ +24% in total output on new capacity and better load factors ✓ Results driven by Energy and asset rotation ✓ 64% of total output from contracted volumes (+34%) ✓ Capex acceleration reflects higher execution ✓ +13% in captured prices, driven by new capacity and high
Slide 21: Capex Plan - Gross Investment 2023-26
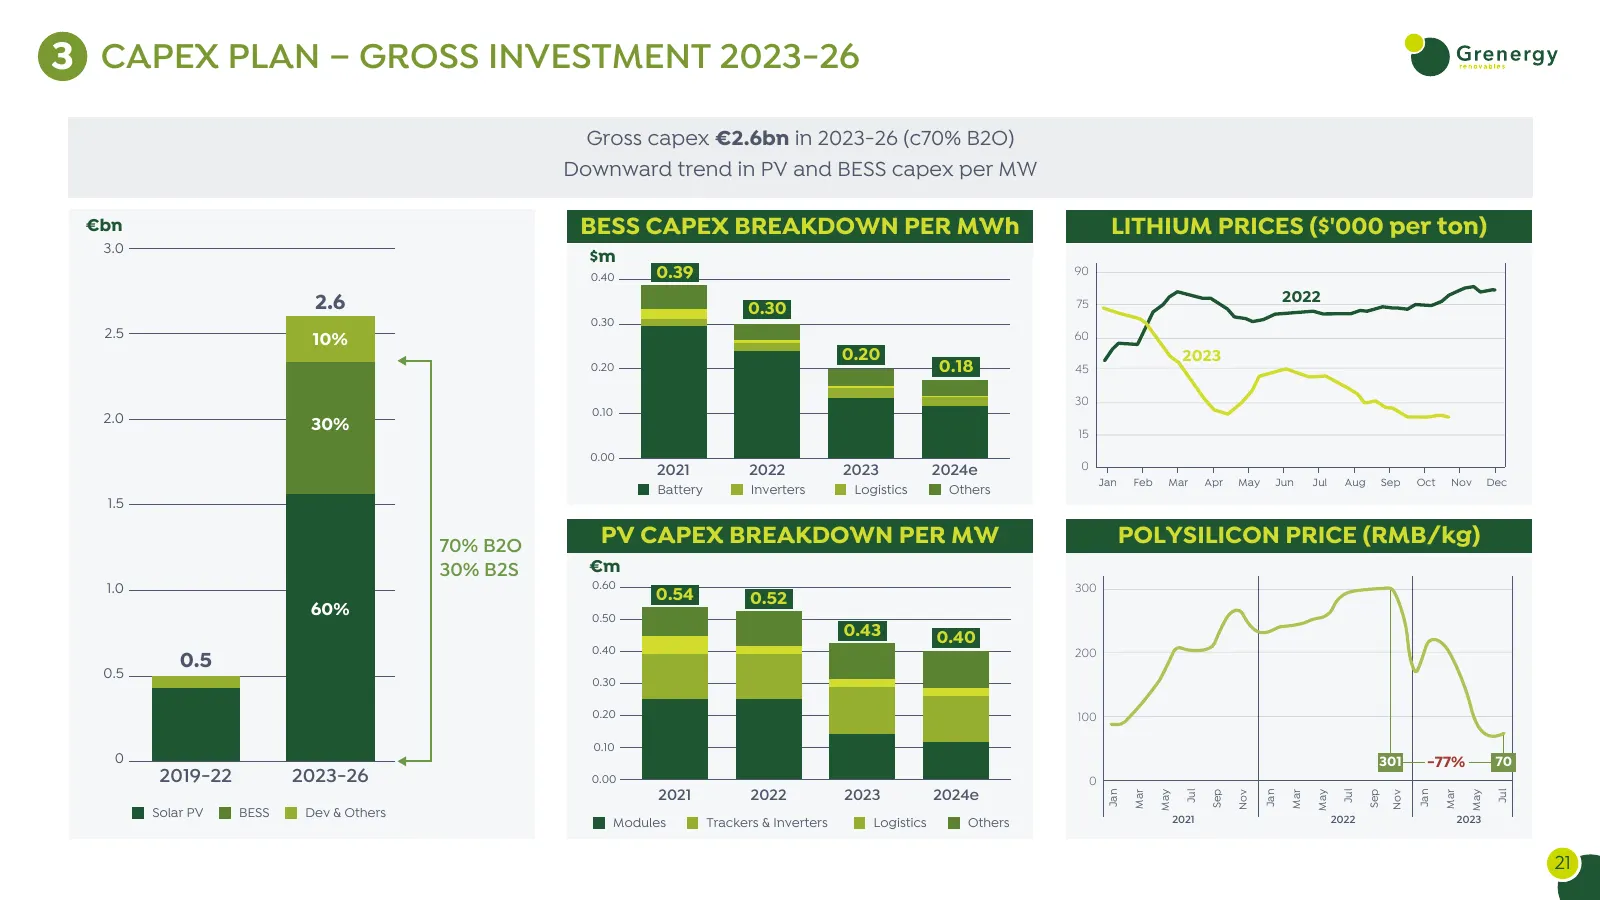
3 CAPEX PLAN – GROSS INVESTMENT 2023-26 Gross capex €2.6bn in 2023-26 (c70% B2O) Downward trend in PV and BESS capex per MW €bn BESS CAPEX BREAKDOWN PER MWh LITHIUM PRICES ($'000 per ton) 3.0 $m 0.40 0.39 90 2.6 75 2022 0.30 0.30 2.5 10% 60 0.20 2023 0.20 0.18 45 30 0.10 2.0 30% 15 0.00 2021 2022 20
Slide 22: Leverage & Liquidity
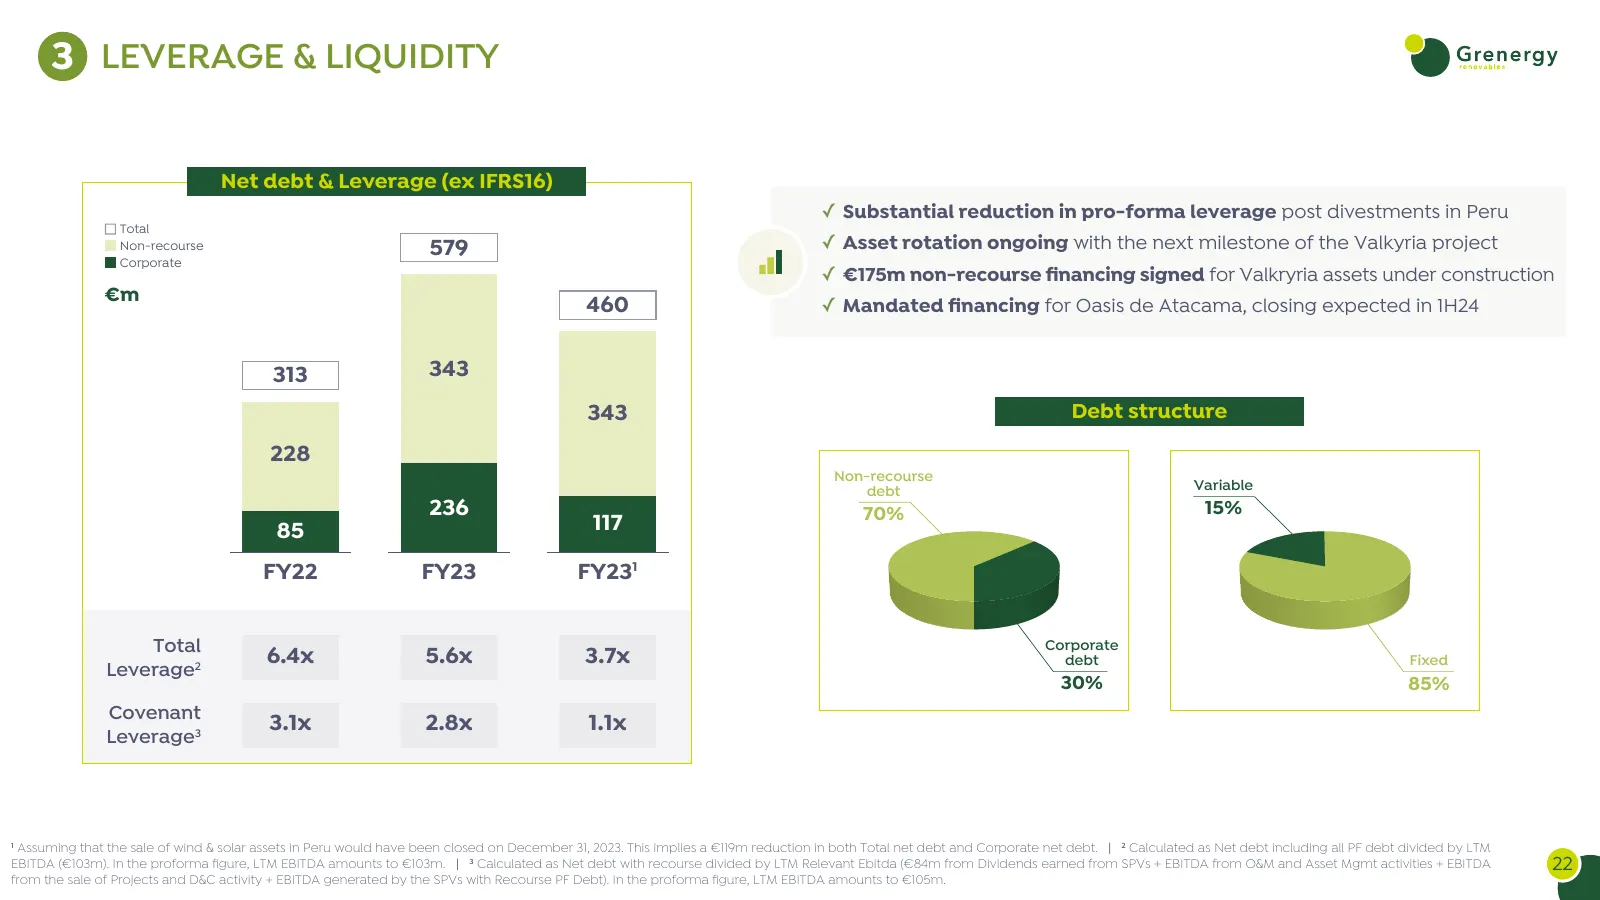
3 LEVERAGE & LIQUIDITY Net debt & Leverage (ex IFRS16) ✓ Substantial reduction in pro-forma leverage post divestments in Peru Total Non-recourse 579 ✓ Asset rotation ongoing with the next milestone of the Valkyria project Corporate ✓ €175m non-recourse financing signed for Valkryria assets under con
Slide 23: Agenda
1 EQUITY STORY & KEY FIGURES 2 PLATFORM & PIPELINE 3 OPERATIONAL INFORMATION 4 STRONG GOVERNANCE STRUCTURE WITH FOCUS ON ESG 23
Slide 24: ESG Roadmap 2021-2023
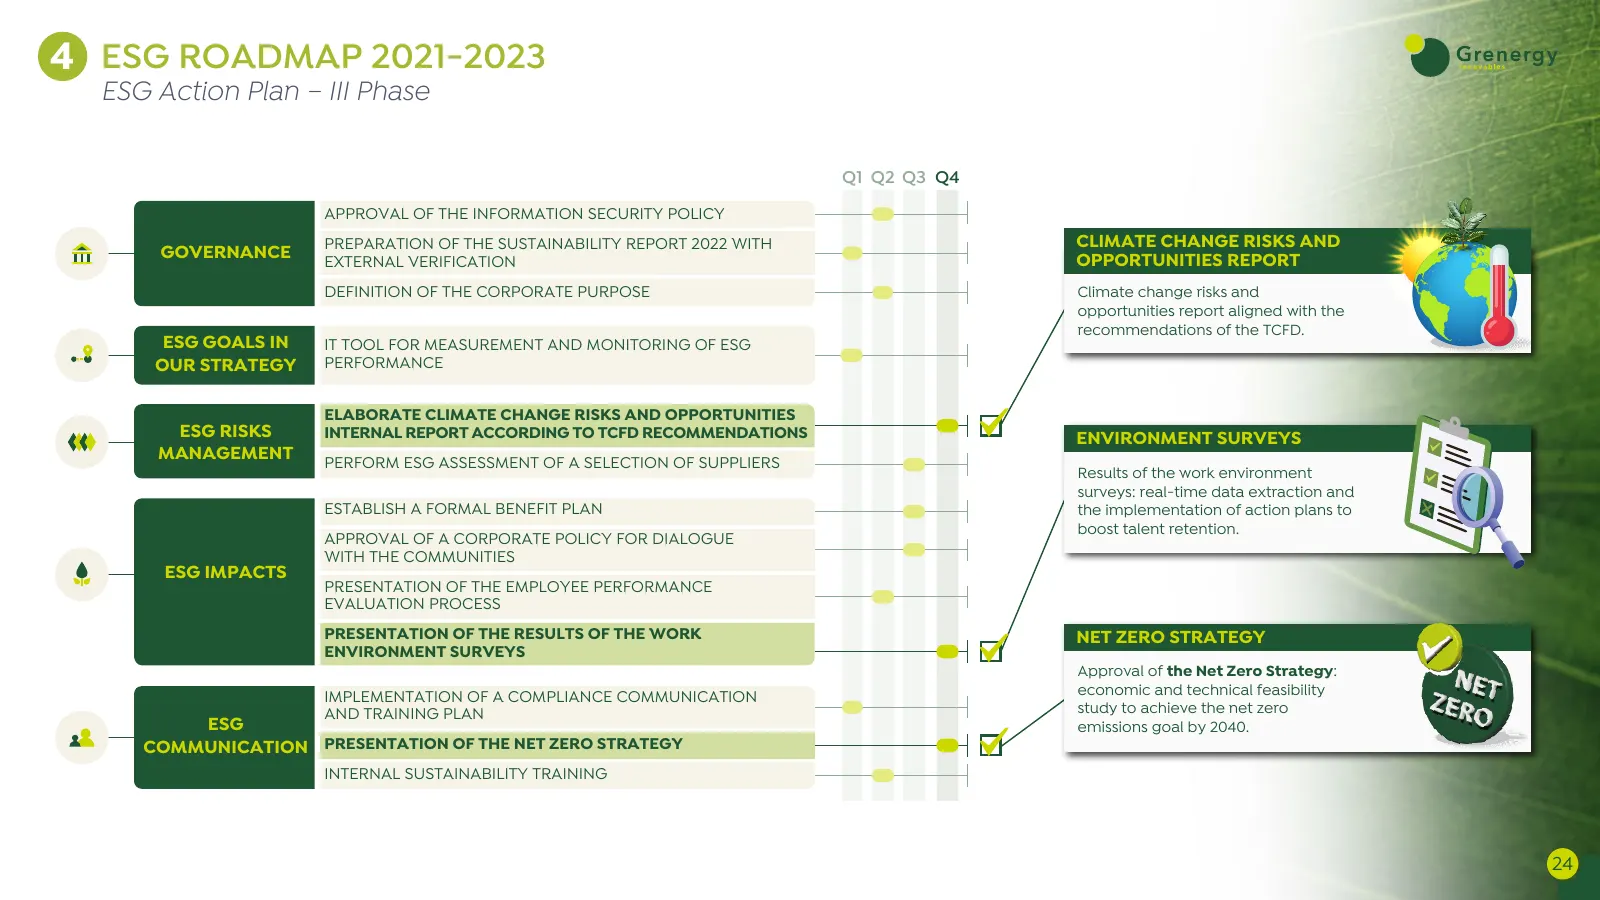
4 ESG ROADMAP 2021-2023 ESG Action Plan – III Phase Q1 Q2 Q3 Q4 APPROVAL OF THE INFORMATION SECURITY POLICY PREPARATION OF THE SUSTAINABILITY REPORT 2022 WITH CLIMATE CHANGE RISKS AND GOVERNANCE OPPORTUNITIES REPORT EXTERNAL VERIFICATION DEFINITION OF THE CORPORATE PURPOSE Climate change risks and o
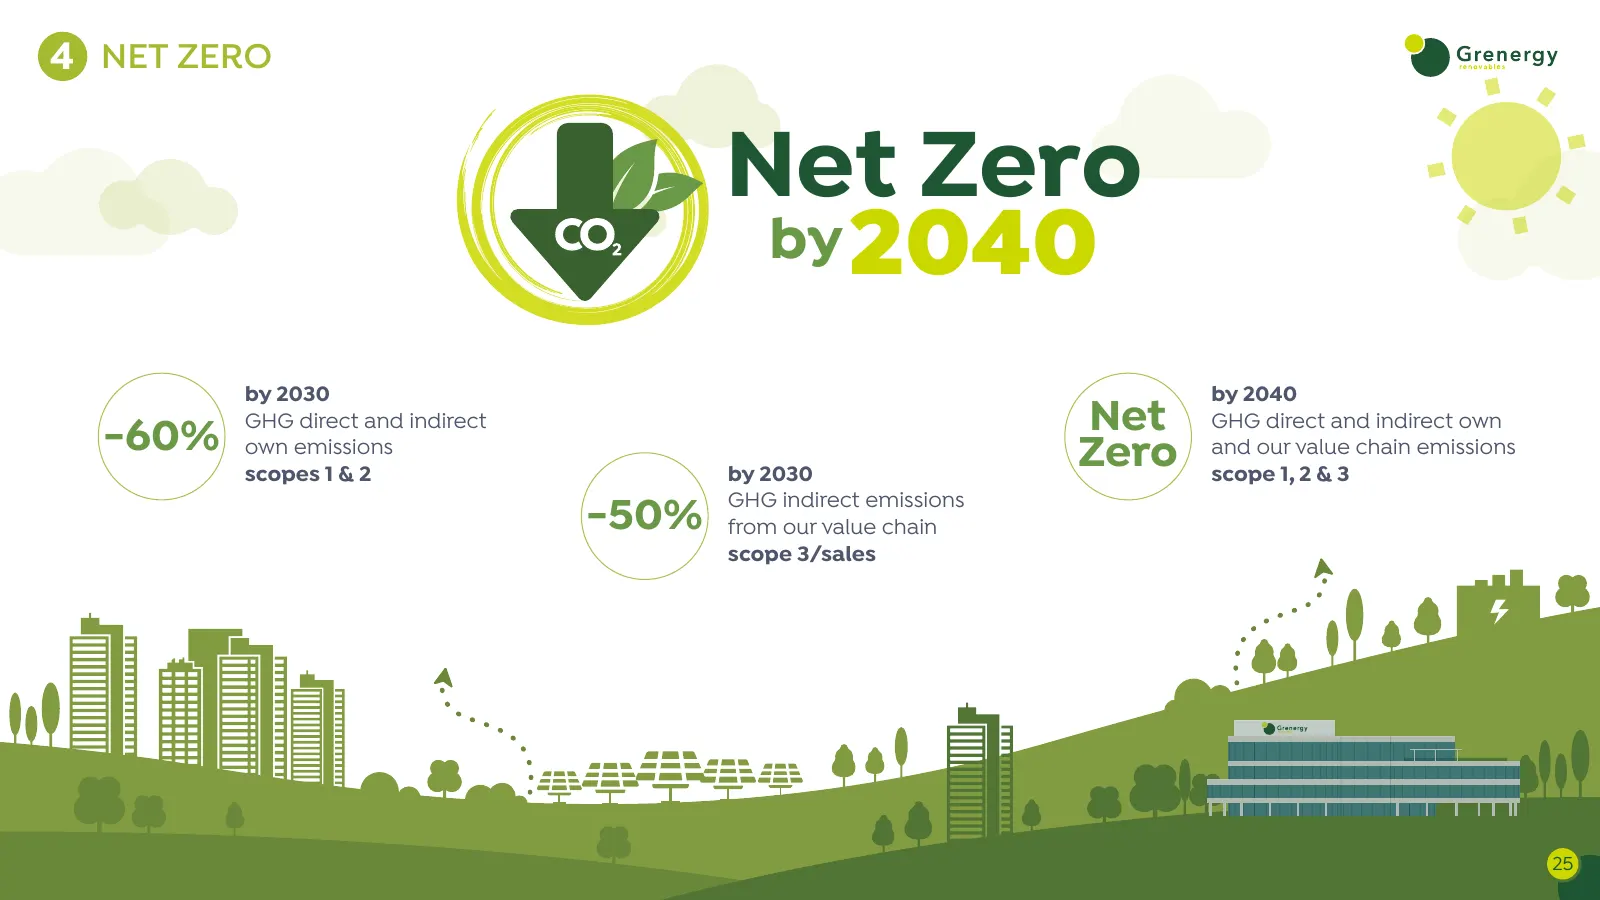
Slide 25: Net Zero by 2040
4 NET ZERO Net Zero by 2040 by 2030 by 2040 -60% GHG direct and indirect Net GHG direct and indirect own own emissions scopes 1 & 2 by 2030 Zero and our value chain emissions scope 1, 2 & 3 -50% GHG indirect emissions from our value chain scope 3/sales 25
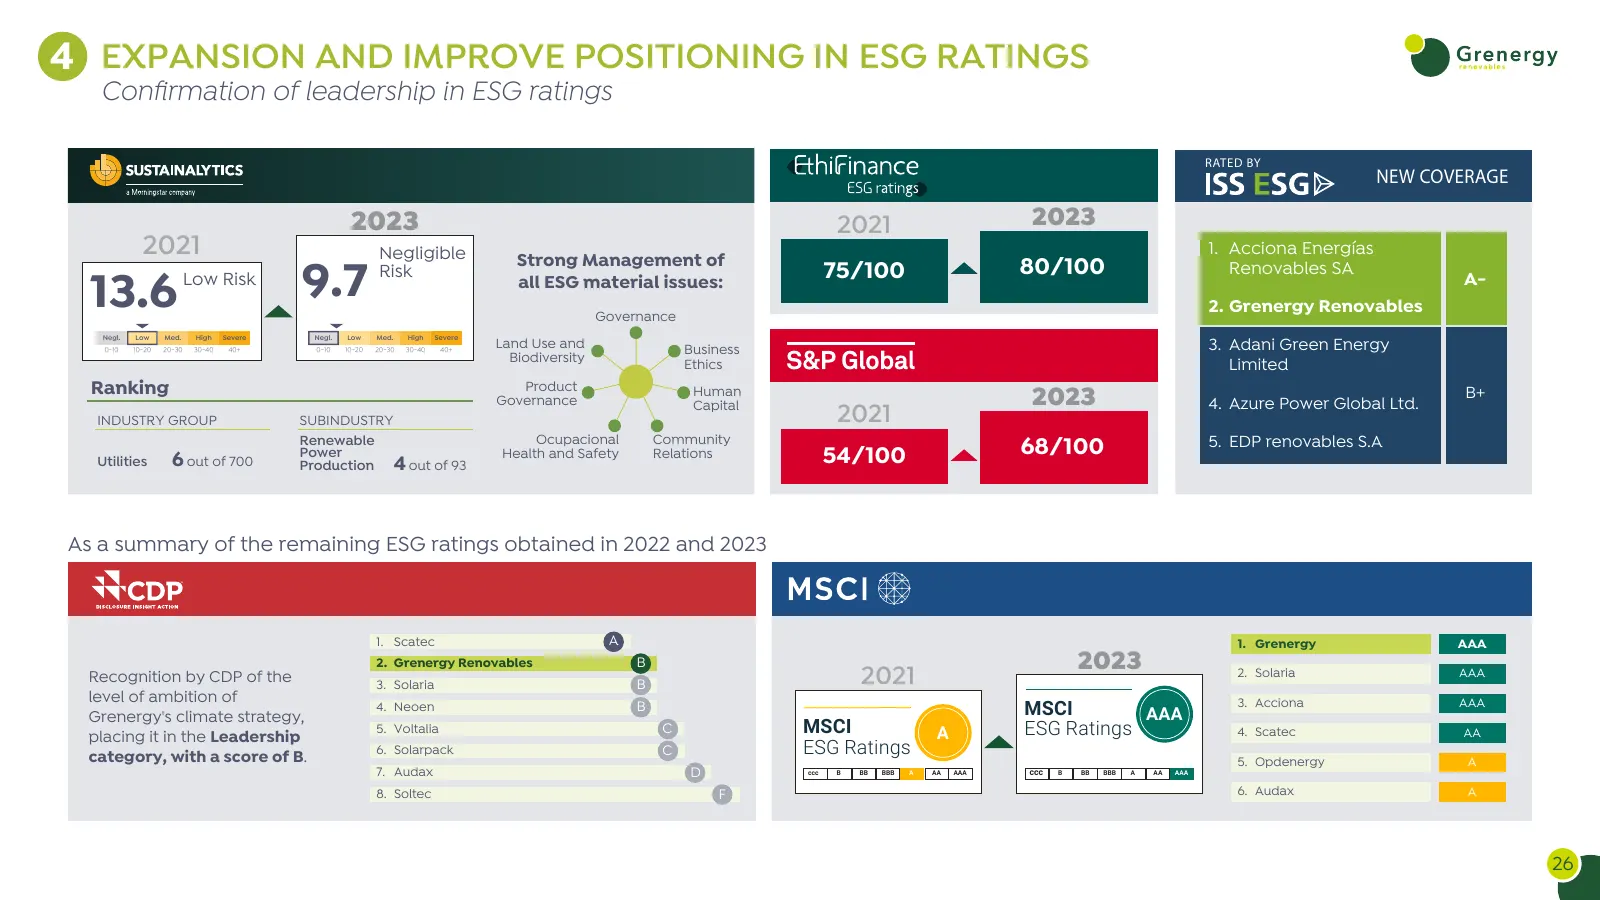
Slide 26: Expansion and Improve Positioning in ESG Ratings
4 EXPANSION AND IMPROVE POSITIONING IN ESG RATINGS Confirmation of leadership in ESG ratings RATED BY NEW COVERAGE 2023 2021 2023 2021 Negligible Strong Management of 1. Acciona Energías 13.6 Low Risk 9.7 Risk all ESG material issues: 75/100 80/100 Renovables SA 2. Grenergy Renovables A- Governance
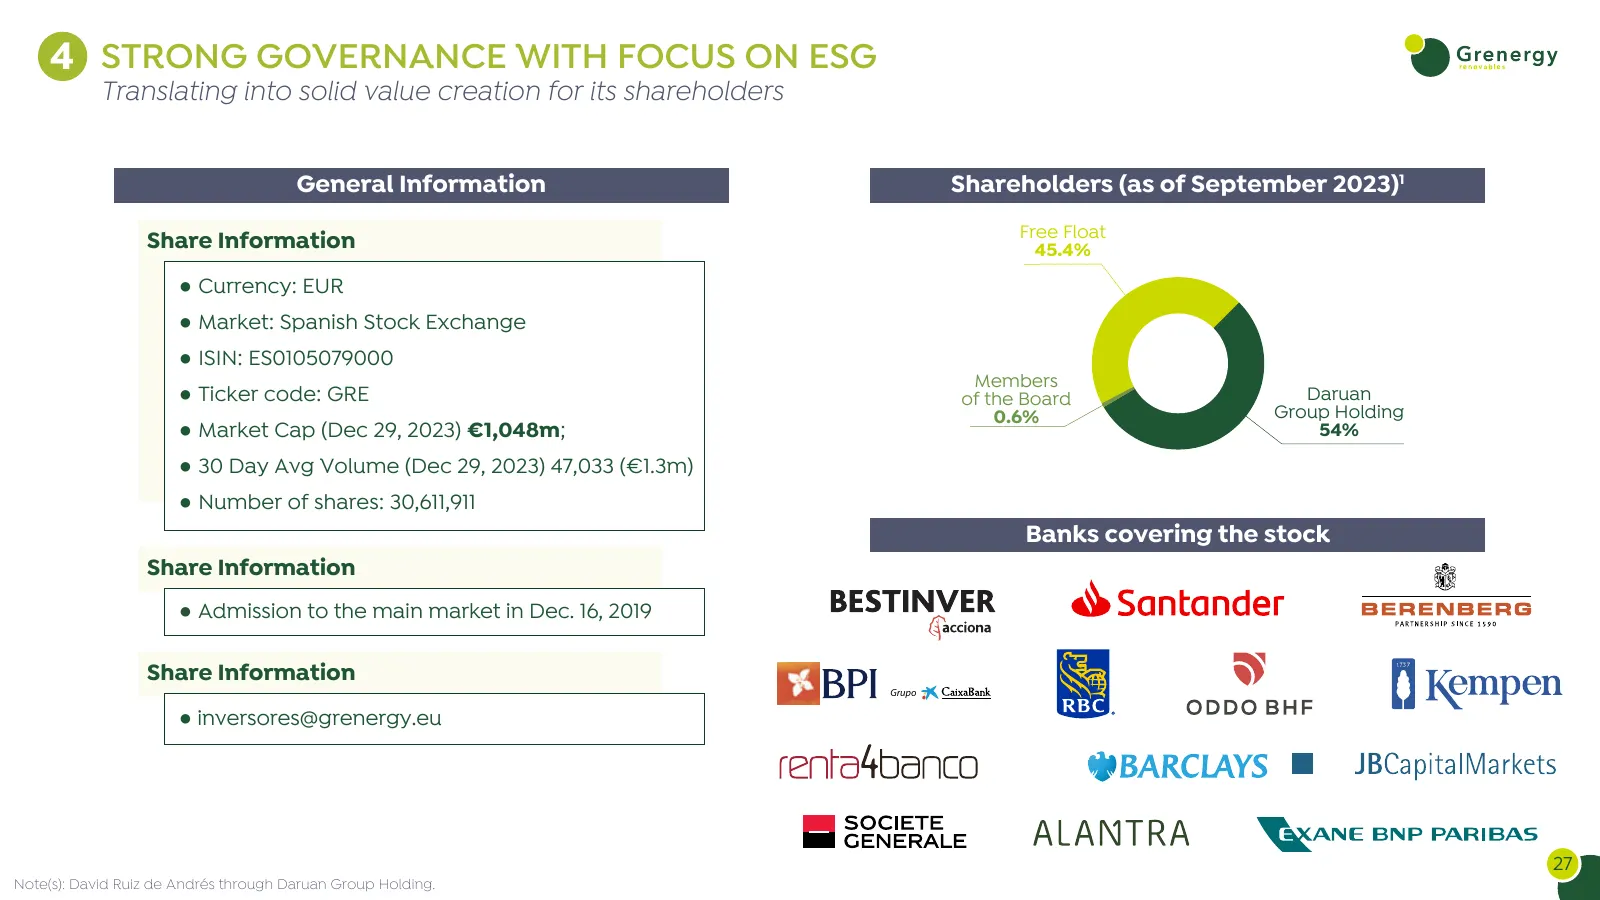
Slide 27: Strong Governance with Focus on ESG
4 STRONG GOVERNANCE WITH FOCUS ON ESG Translating into solid value creation for its shareholders General Information Shareholders (as of September 2023)1 Free Float Share Information 45.4% ● Currency: EUR ● Market: Spanish Stock Exchange ● ISIN: ES0105079000 Members ● Ticker code: GRE of the Board D
Slide 28: Appendices
APPENDICES
Slide 29: Platform with Relevant Growth Potential
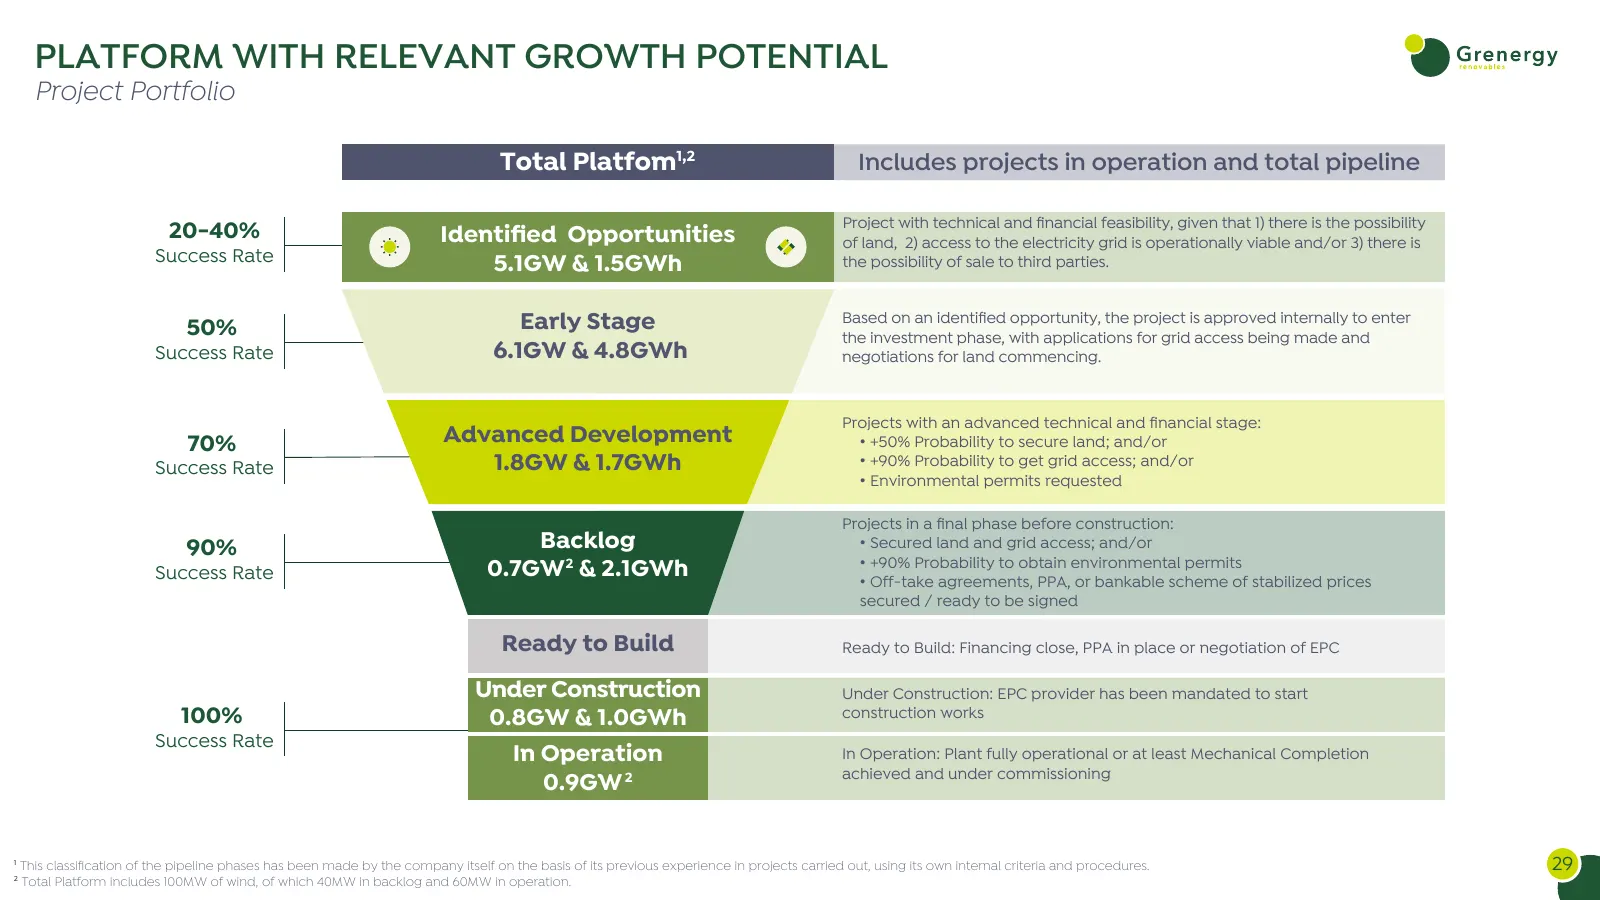
PLATFORM WITH RELEVANT GROWTH POTENTIAL Project Portfolio Total Platfom1,2 Includes projects in operation and total pipeline Project with technical and financial feasibility, given that 1) there is the possibility 20-40% Identified Opportunities of land, 2) access to the electricity grid is operationa
Slide 30: FY23 Results: Revenue & EBITDA Breakdown
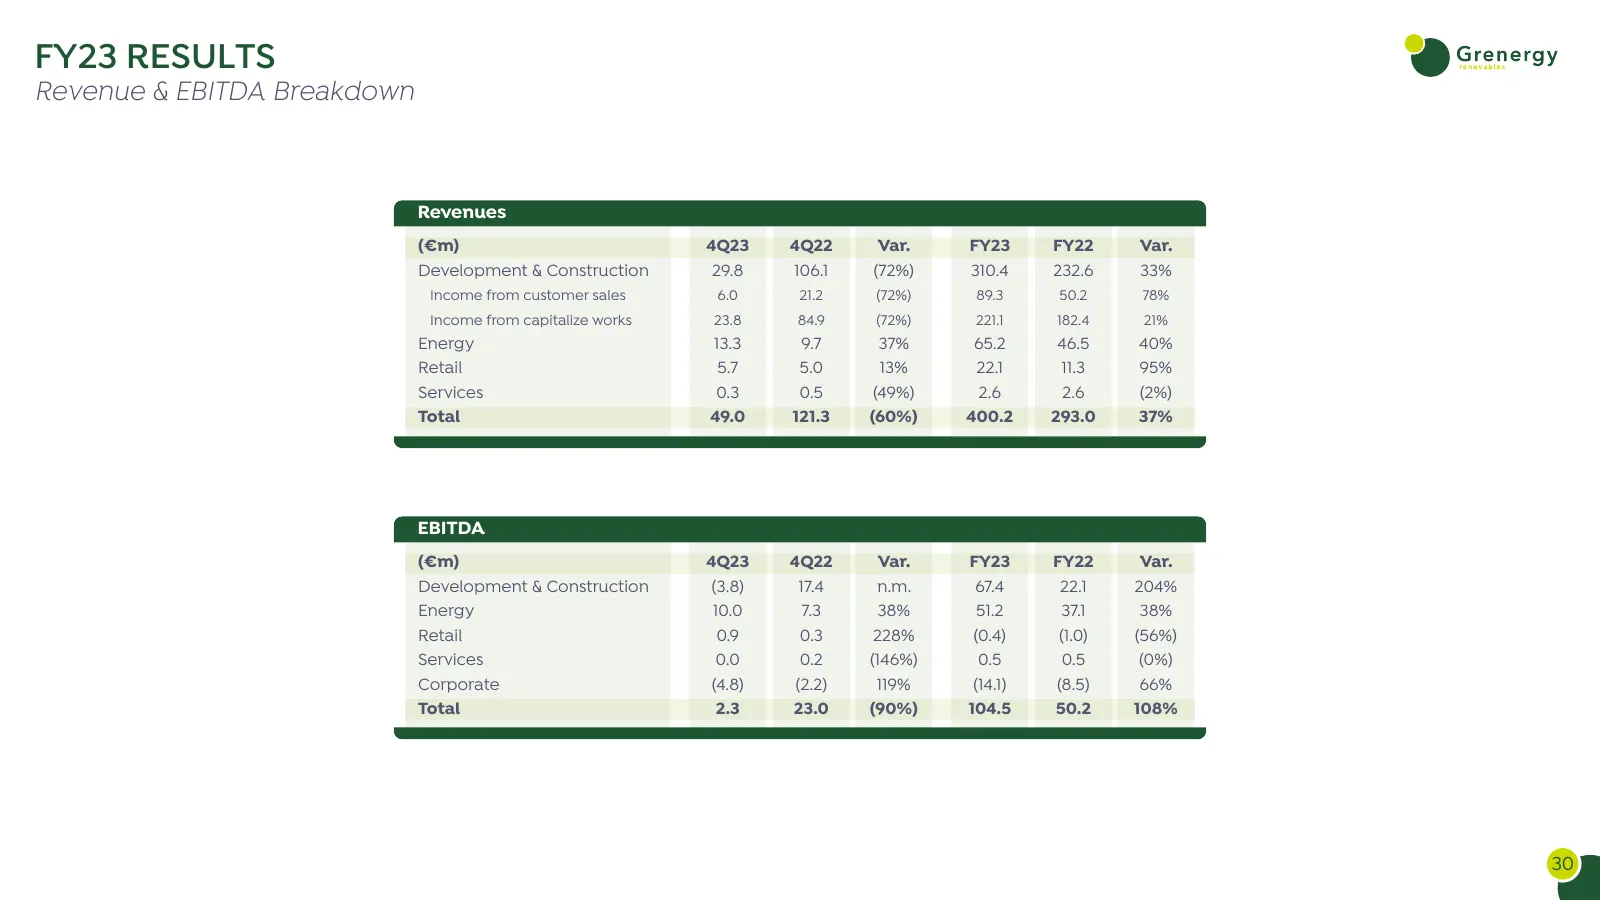
FY23 RESULTS Revenue & EBITDA Breakdown Revenues (€m) 4Q23 4Q22 Var. FY23 FY22 Var. Development & Construction 29.8 106.1 (72%) 310.4 232.6 33% Income from customer sales 6.0 21.2 (72%) 89.3 50.2 78% Income from capitalize works 23.8 84.9 (72%) 221.1 182.4 21% Energy 13.3 9.7 37% 65.2 46.5 40% Retai
Slide 31: FY23 Results: Profit and Losses
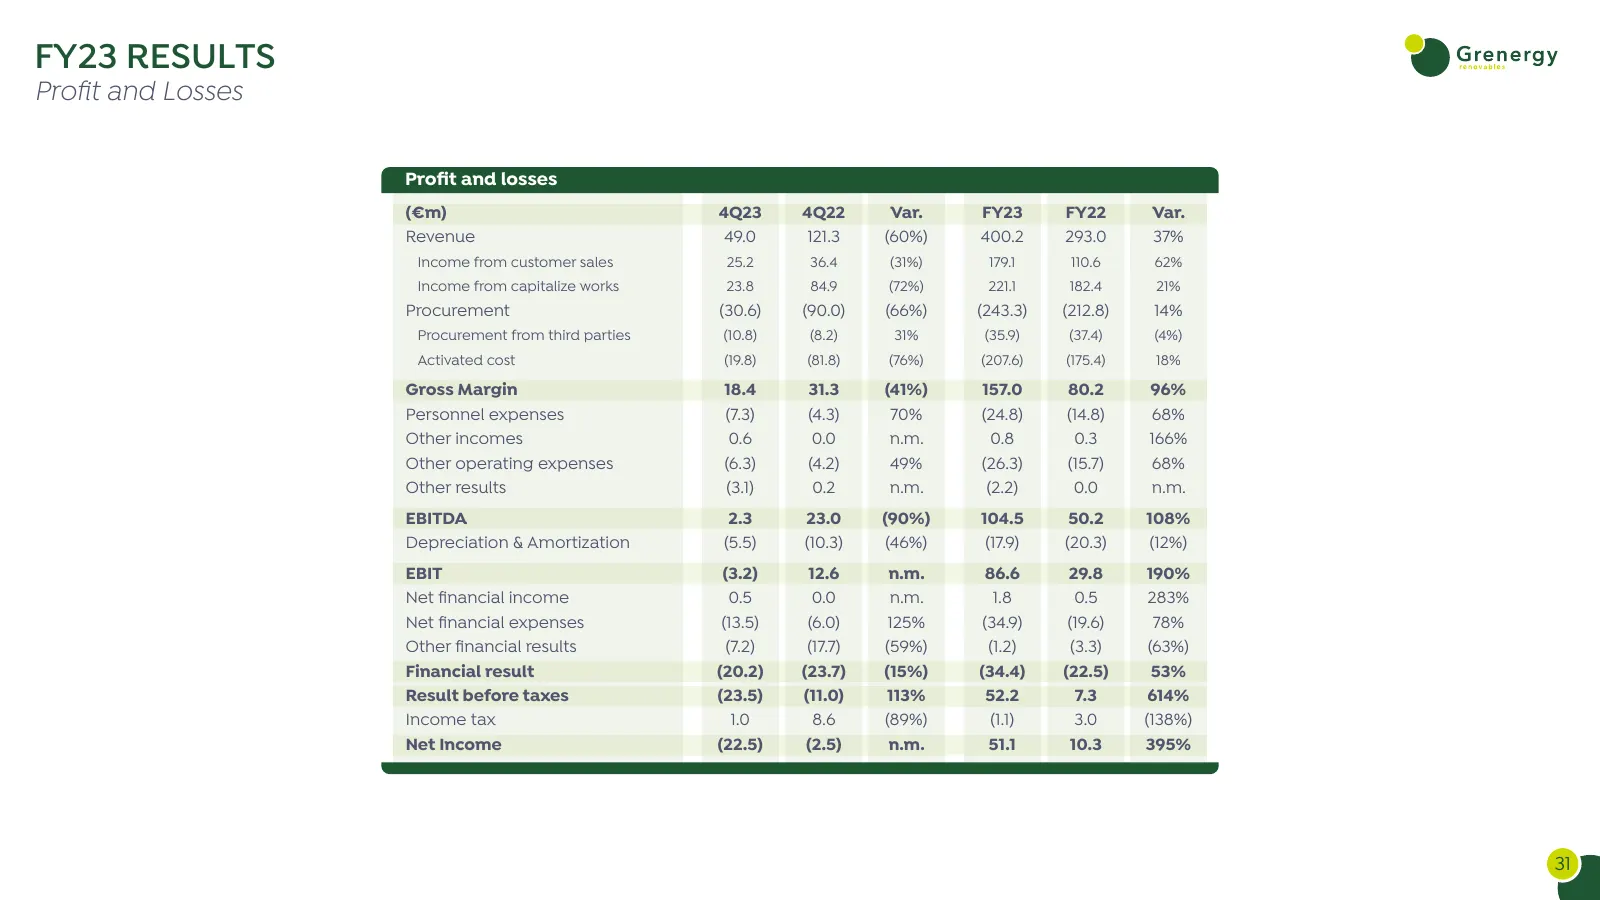
FY23 RESULTS Profit and Losses Profit and losses (€m) 4Q23 4Q22 Var. FY23 FY22 Var. Revenue 49.0 121.3 (60%) 400.2 293.0 37% Income from customer sales 25.2 36.4 (31%) 179.1 110.6 62% Income from capitalize works 23.8 84.9 (72%) 221.1 182.4 21% Procurement (30.6) (90.0) (66%) (243.3) (212.8) 14% Proc
Slide 32: FY23 Results: Balance Sheet
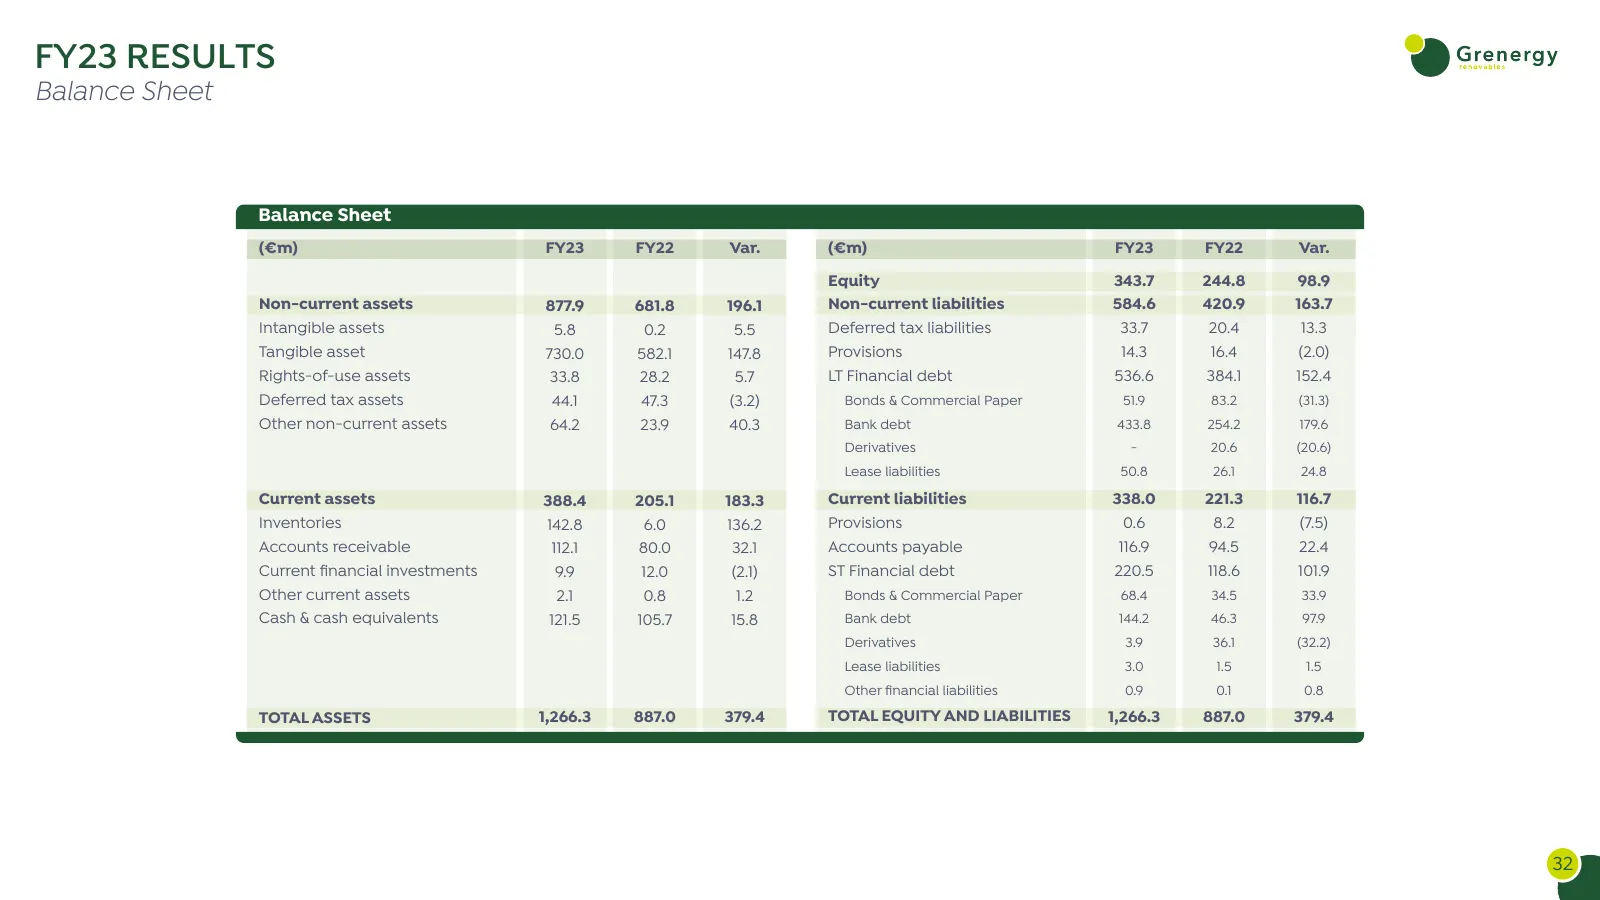
FY23 RESULTS Balance Sheet Balance Sheet (€m) FY23 FY22 Var. (€m) FY23 FY22 Var. Equity 343.7 244.8 98.9 Non-current assets 877.9 681.8 196.1 Non-current liabilities 584.6 420.9 163.7 Intangible assets 5.8 0.2 5.5 Deferred tax liabilities 33.7 20.4 13.3 Tangible asset 730.0 582.1 147.8 Provisions 14
Slide 33: FY23 Results: Cash Flow
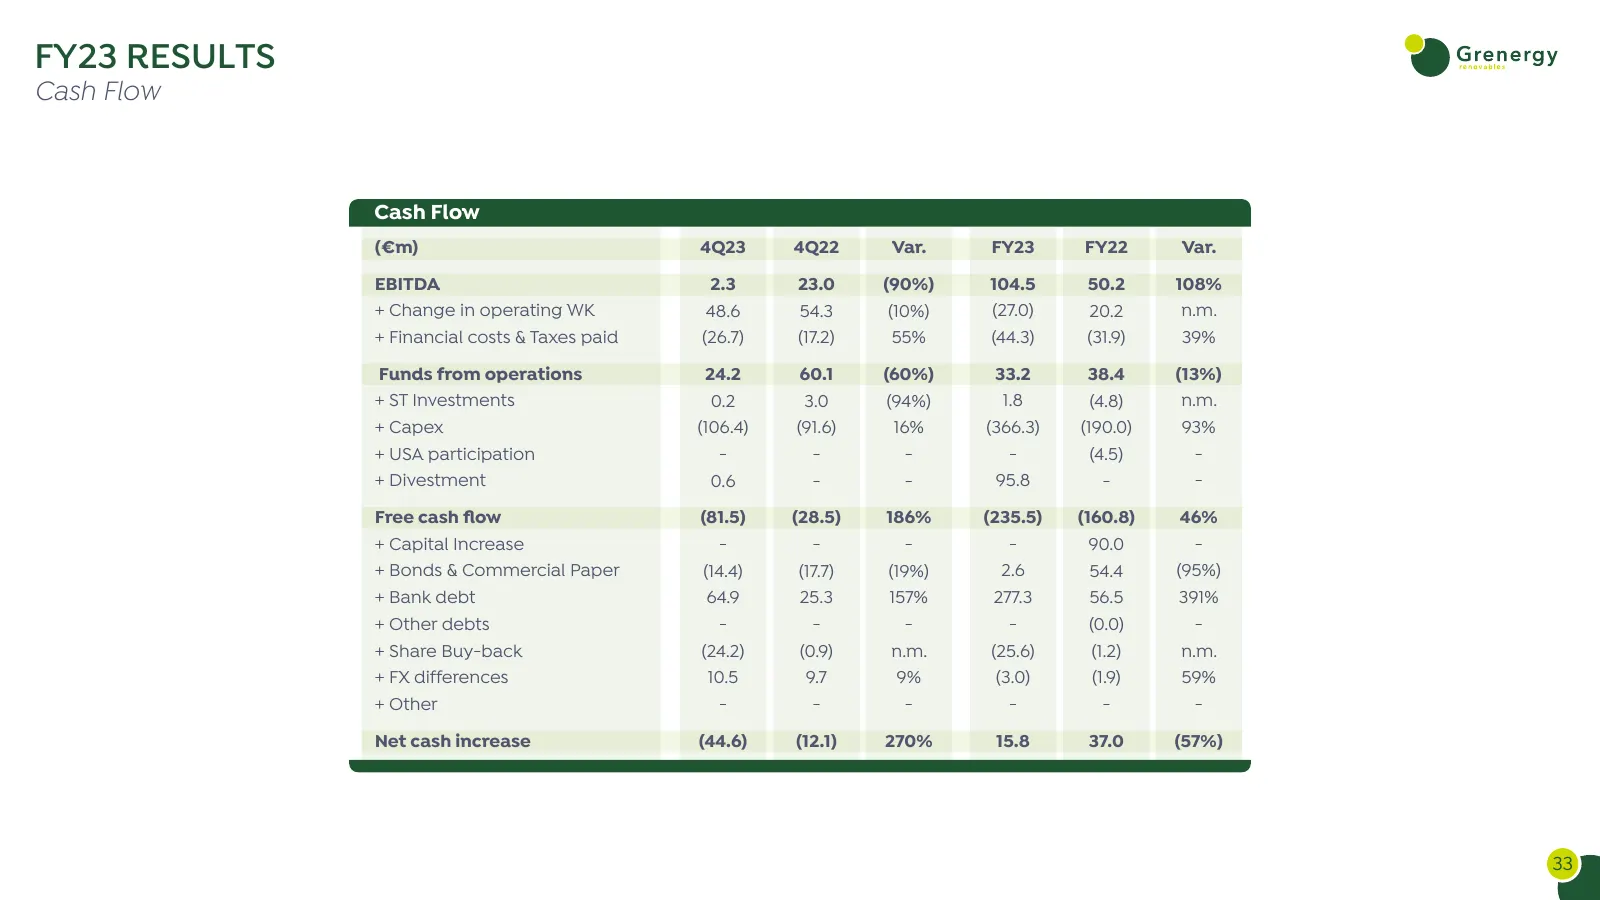
FY23 RESULTS Cash Flow Cash Flow (€m) 4Q23 4Q22 Var. FY23 FY22 Var. EBITDA 2.3 23.0 (90%) 104.5 50.2 108% + Change in operating WK 48.6 54.3 (10%) (27.0) 20.2 n.m. + Financial costs & Taxes paid (26.7) (17.2) 55% (44.3) (31.9) 39% Funds from operations 24.2 60.1 (60%) 33.2 38.4 (13%) + ST Investment
Slide 34: FY23 Results: Net Debt
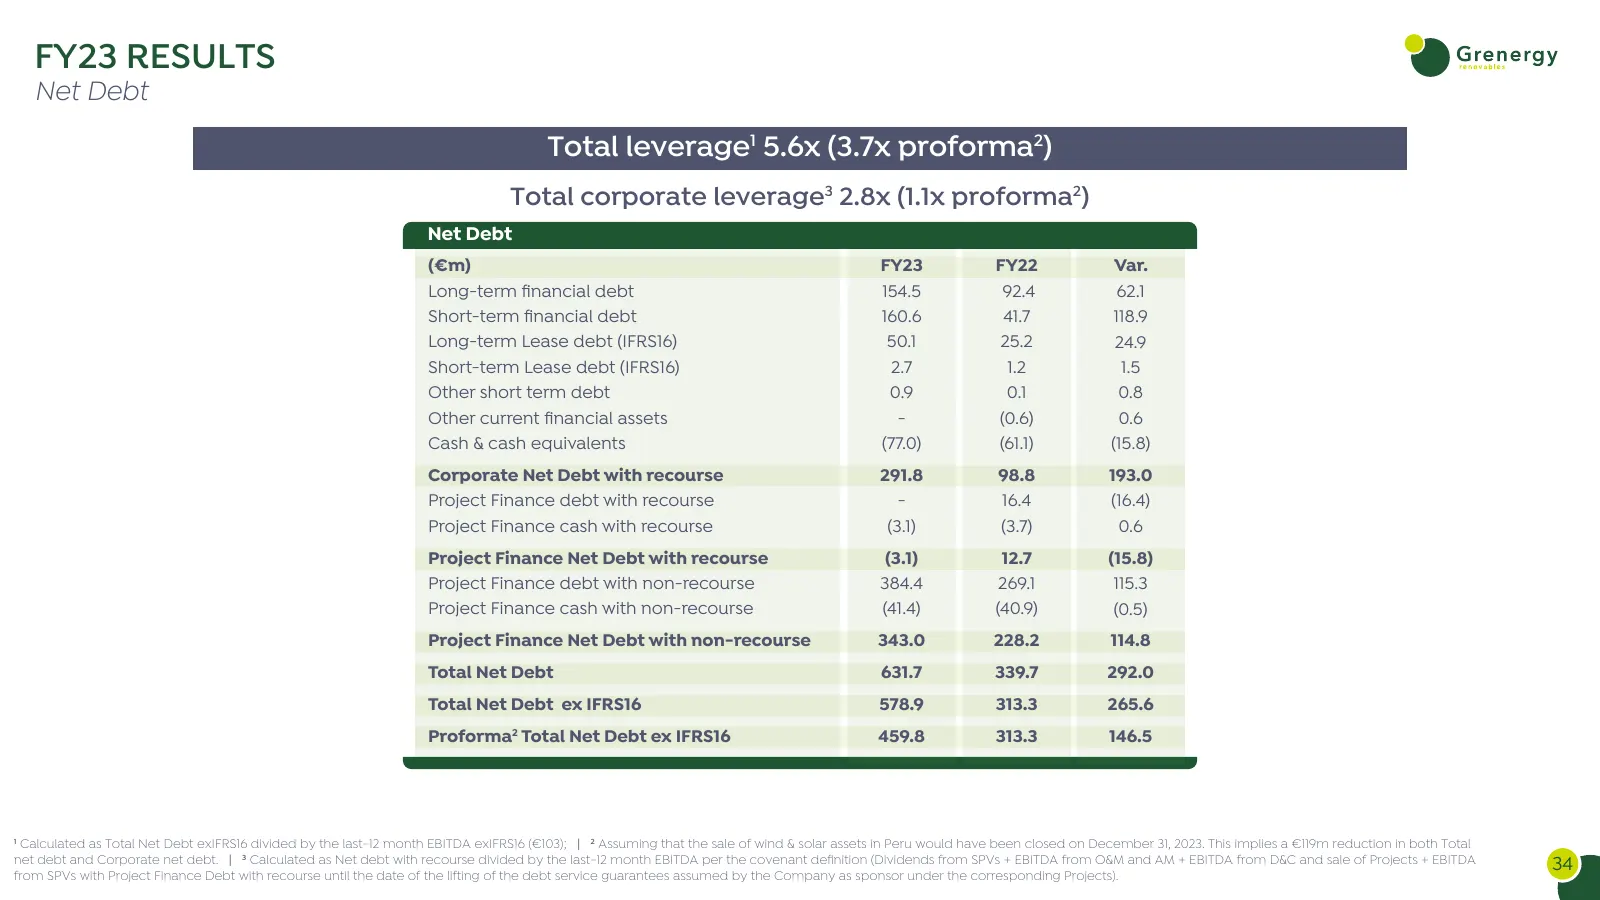
FY23 RESULTS Net Debt Total leverage1 5.6x (3.7x proforma2) Total corporate leverage3 2.8x (1.1x proforma2) Net Debt (€m) FY23 FY22 Var. Long-term financial debt 154.5 92.4 62.1 Short-term financial debt 160.6 41.7 118.9 Long-term Lease debt (IFRS16) 50.1 25.2 24.9 Short-term Lease debt (IFRS16) 2.7
Slide 35: Net Debt/EBITDA Reconciliation
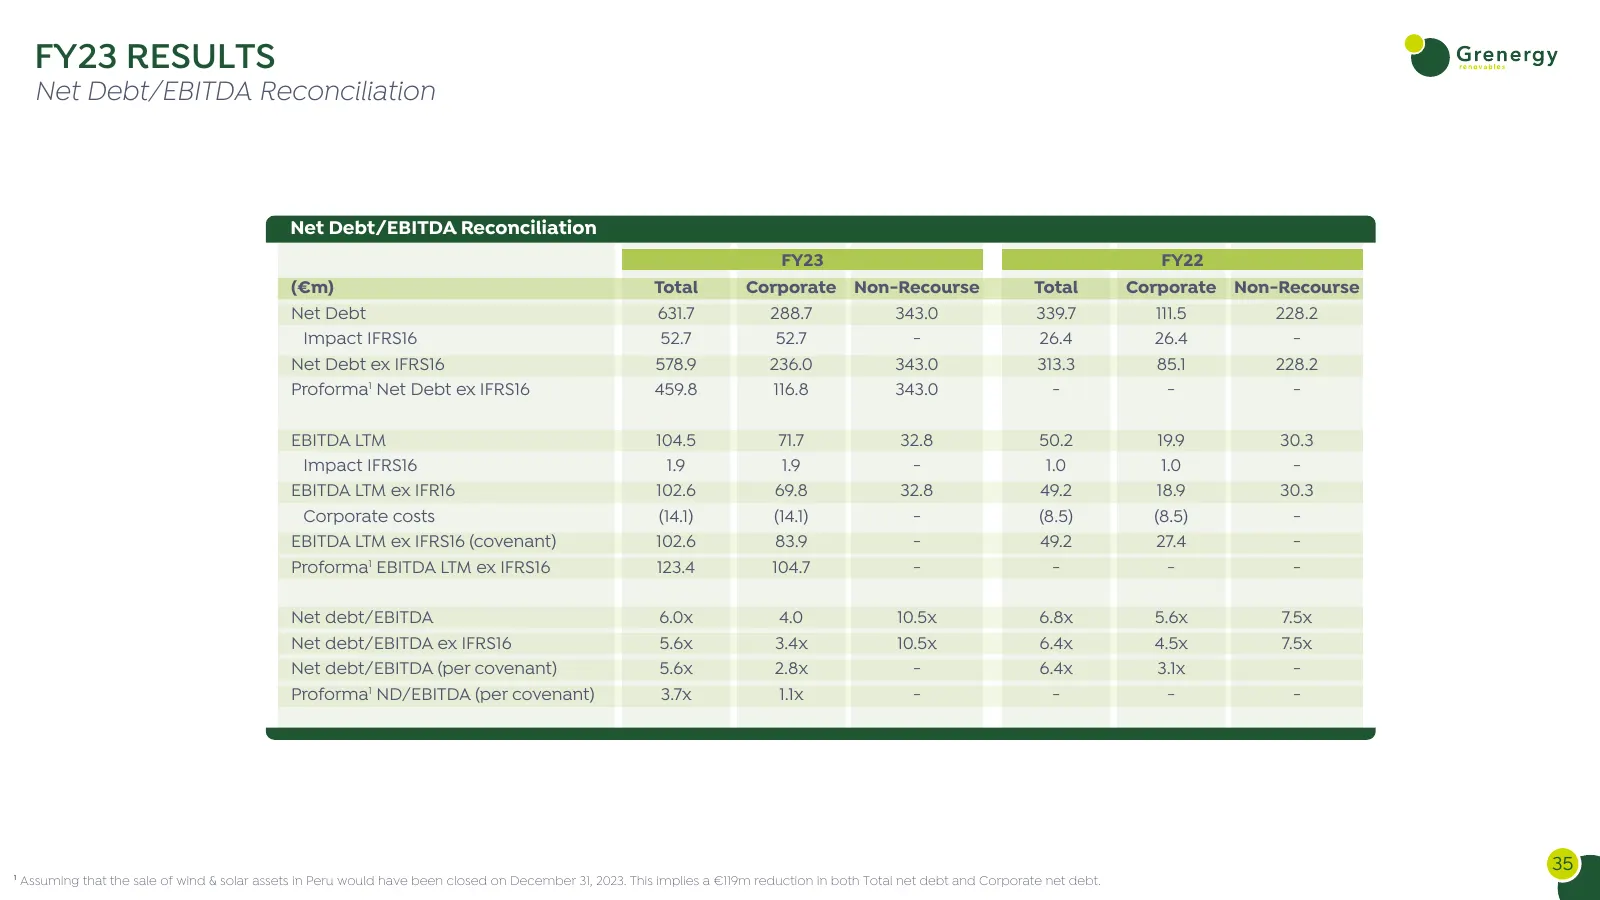
FY23 RESULTS Net Debt/EBITDA Reconciliation Net Debt/EBITDA Reconciliation FY23 FY22 (€m) Total Corporate Non-Recourse Total Corporate Non-Recourse Net Debt 631.7 288.7 343.0 339.7 111.5 228.2 Impact IFRS16 52.7 52.7 - 26.4 26.4 - Net Debt ex IFRS16 578.9 236.0 343.0 313.3 85.1 228.2 Proforma1 Net D
Slide 36: Solar PV + Storage
SOLAR PV + STORAGE EUROPE - USA - LATAM
Source: Internet Archive copy of grenergy.eu
More decks from Grenergy Renovables S.A
 H1 2026 Earnings Presentation38 slides · Sep 16, 2026
 Investor Presentation (September 2026)55 slides · September 2026
 Investor Presentation (July 2026)46 slides · July 2026
 Q1 2026 Earnings Presentation50 slides · May 27, 2026
 9M 2025 Earnings Presentation36 slides · Nov 27, 2025
 Investor Day (May 2025)50 slides · May 28, 2025