NHPC Limited · NSE:NHPC
NHPC — Investor Presentation (June 2019)
30 slides from NHPC's investor presentation, June 2019
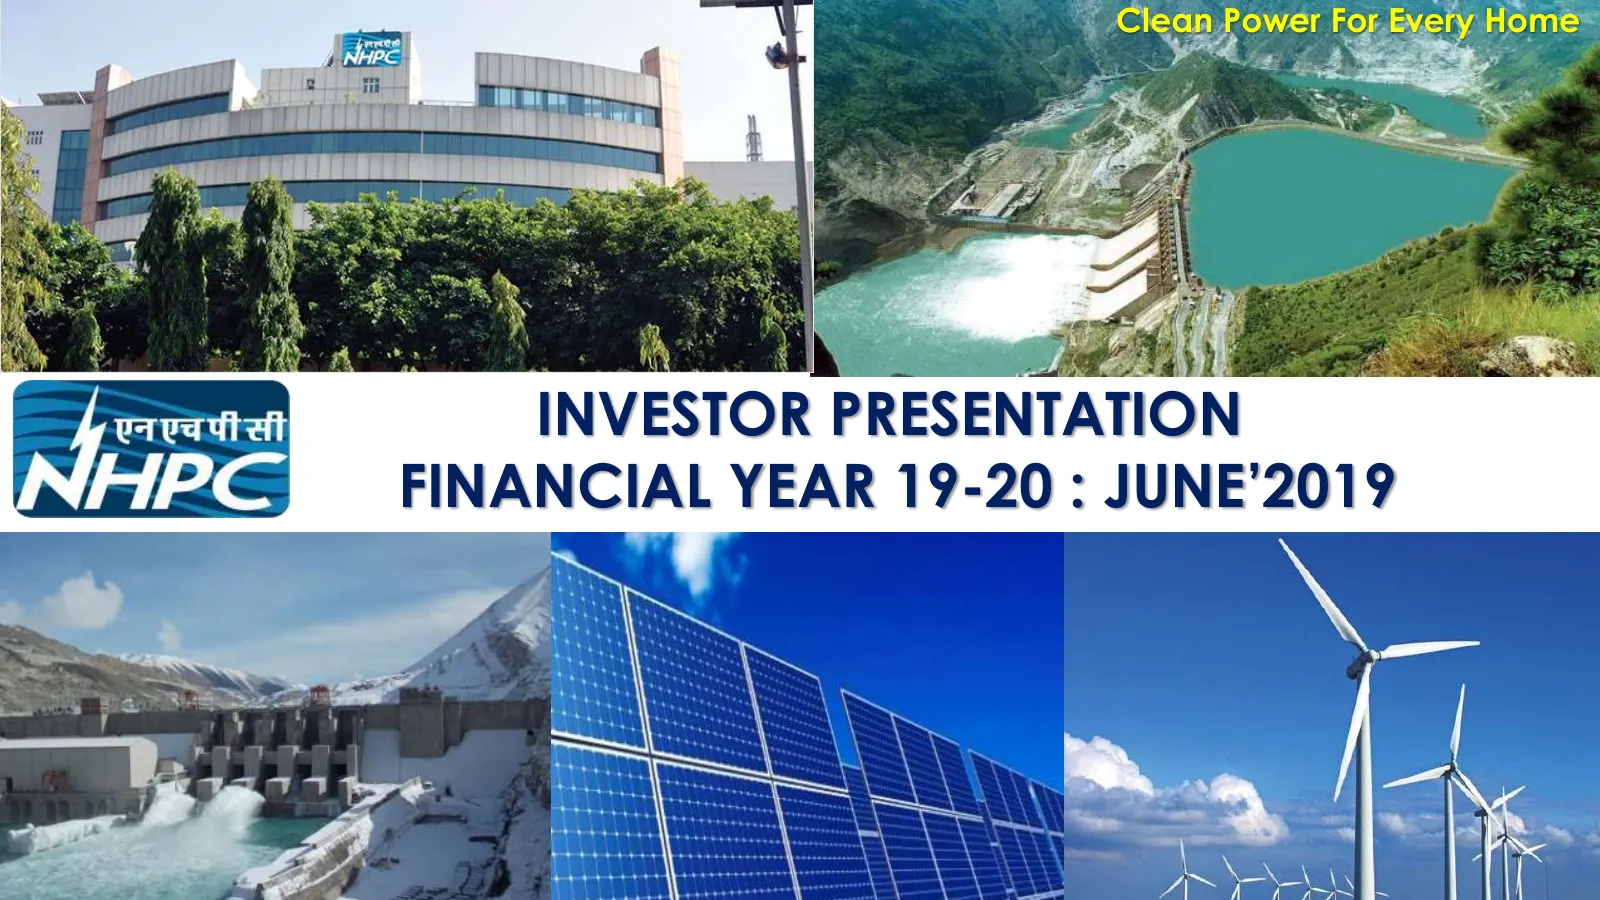
Slide 1: Investor Presentation Financial Year 19-20: June 2019
Clean Power For Every Home INVESTOR PRESENTATION FINANCIAL YEAR 19-20 : JUNE’2019 Salal Power Station, J&K
Slide 2: Presentation Outline
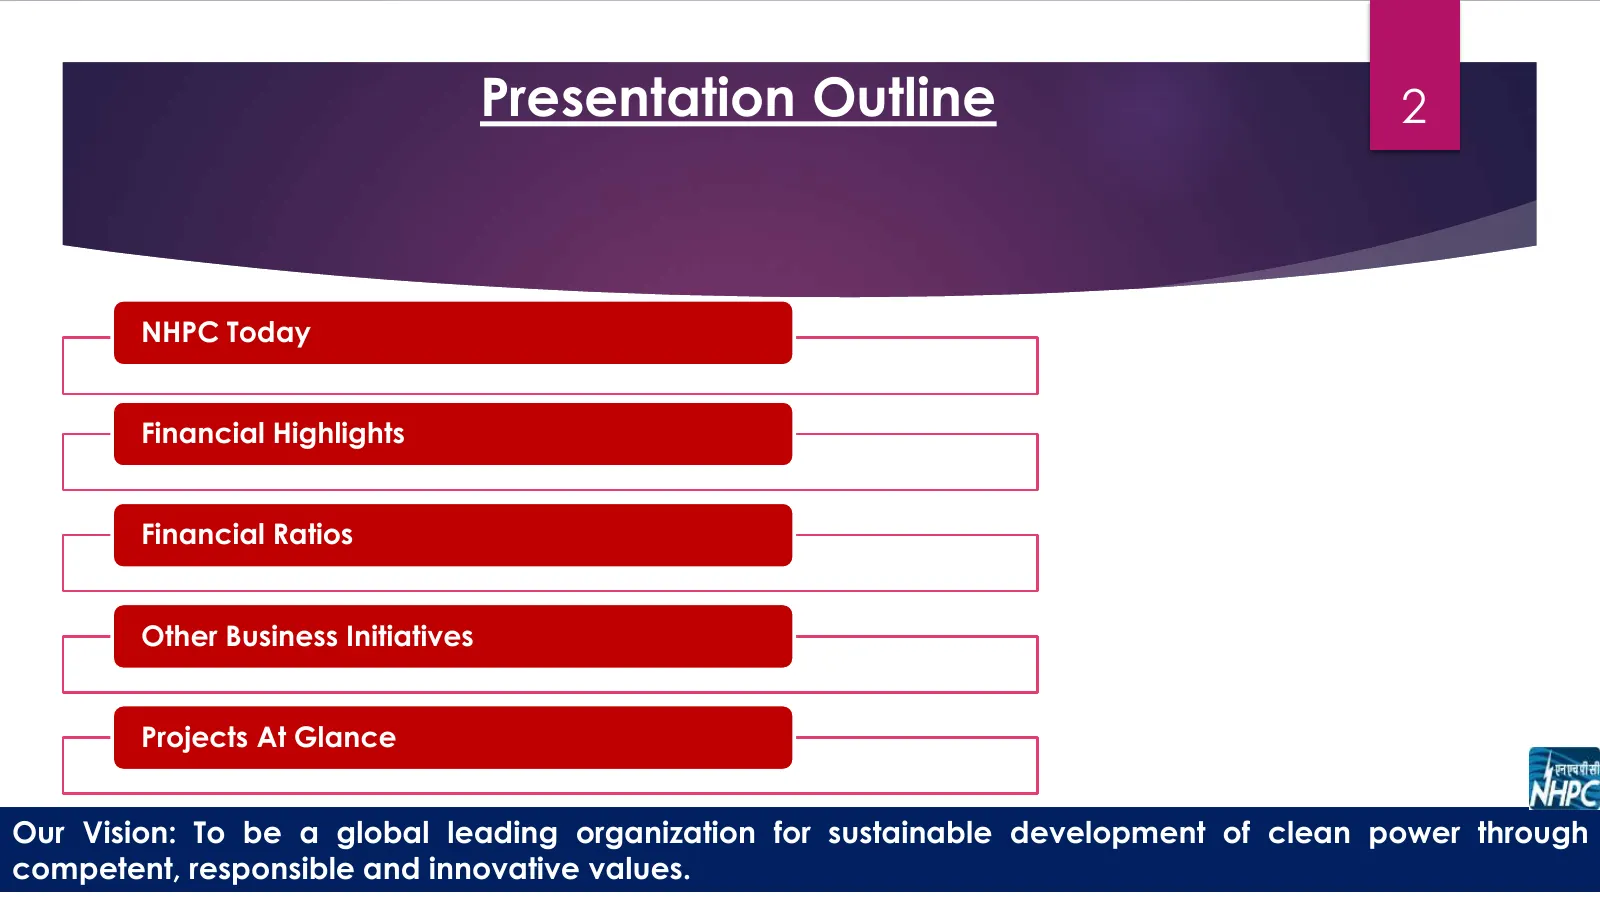
Presentation Outline 2 NHPC Today Financial Highlights Financial Ratios Other Business Initiatives Projects At Glance Our Vision: To be a global leading organization for sustainable development of clean power through competent, responsible and innovative values.
Slide 3: NHPC Today
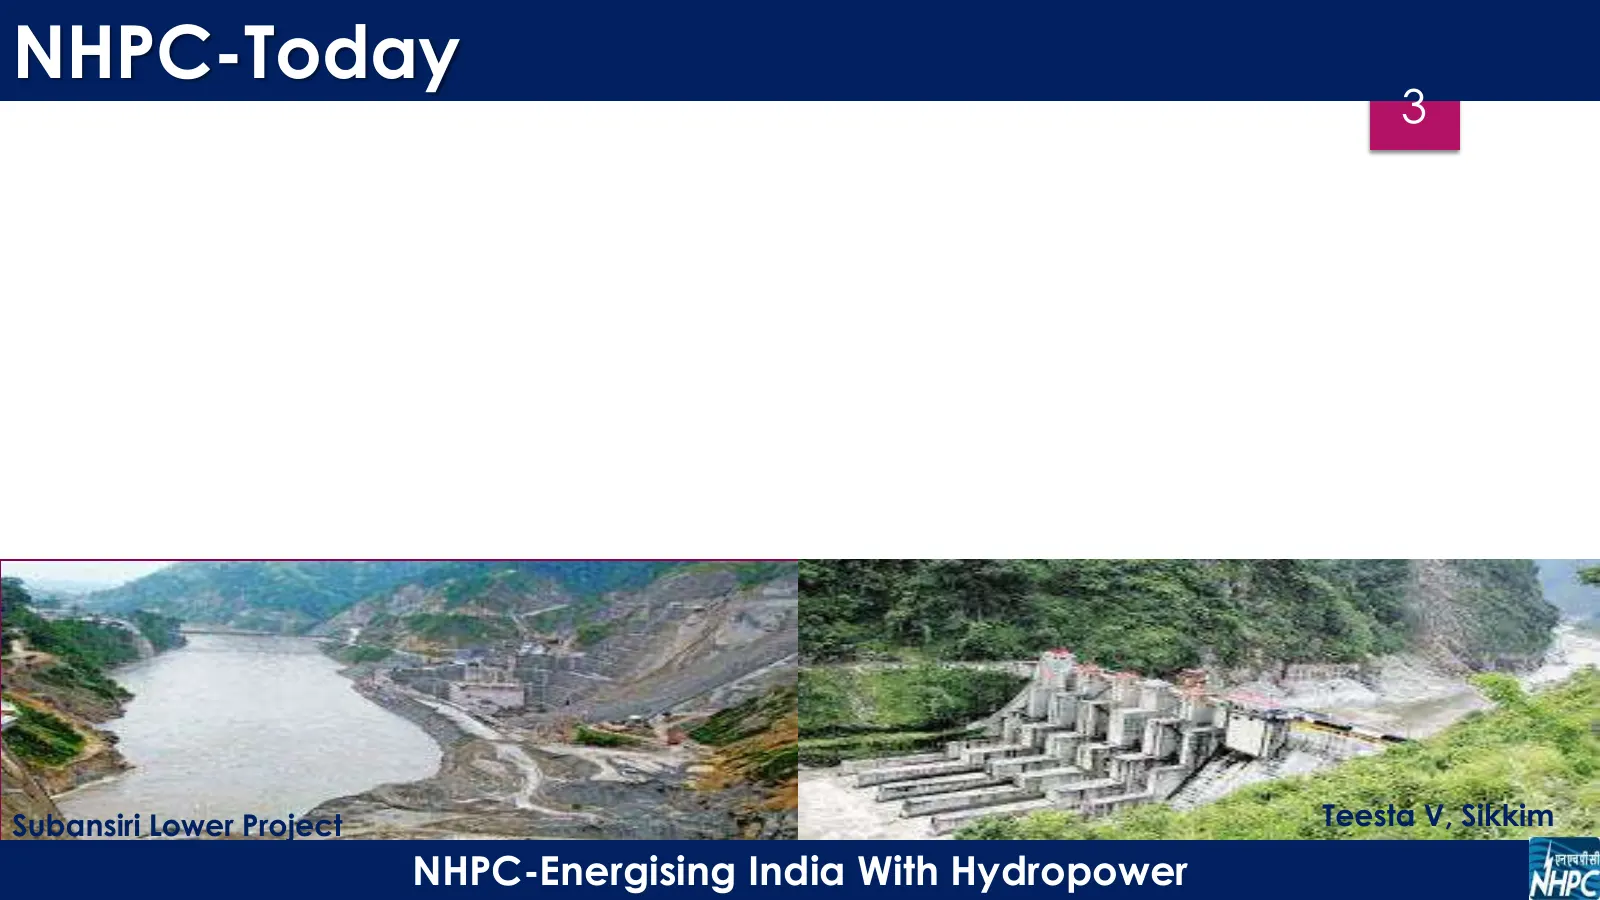
NHPC-Today 3 Subansiri Lower Project Teesta V, Sikkim NHPC-Energising India With Hydropower
Slide 4: Physical Snapshot
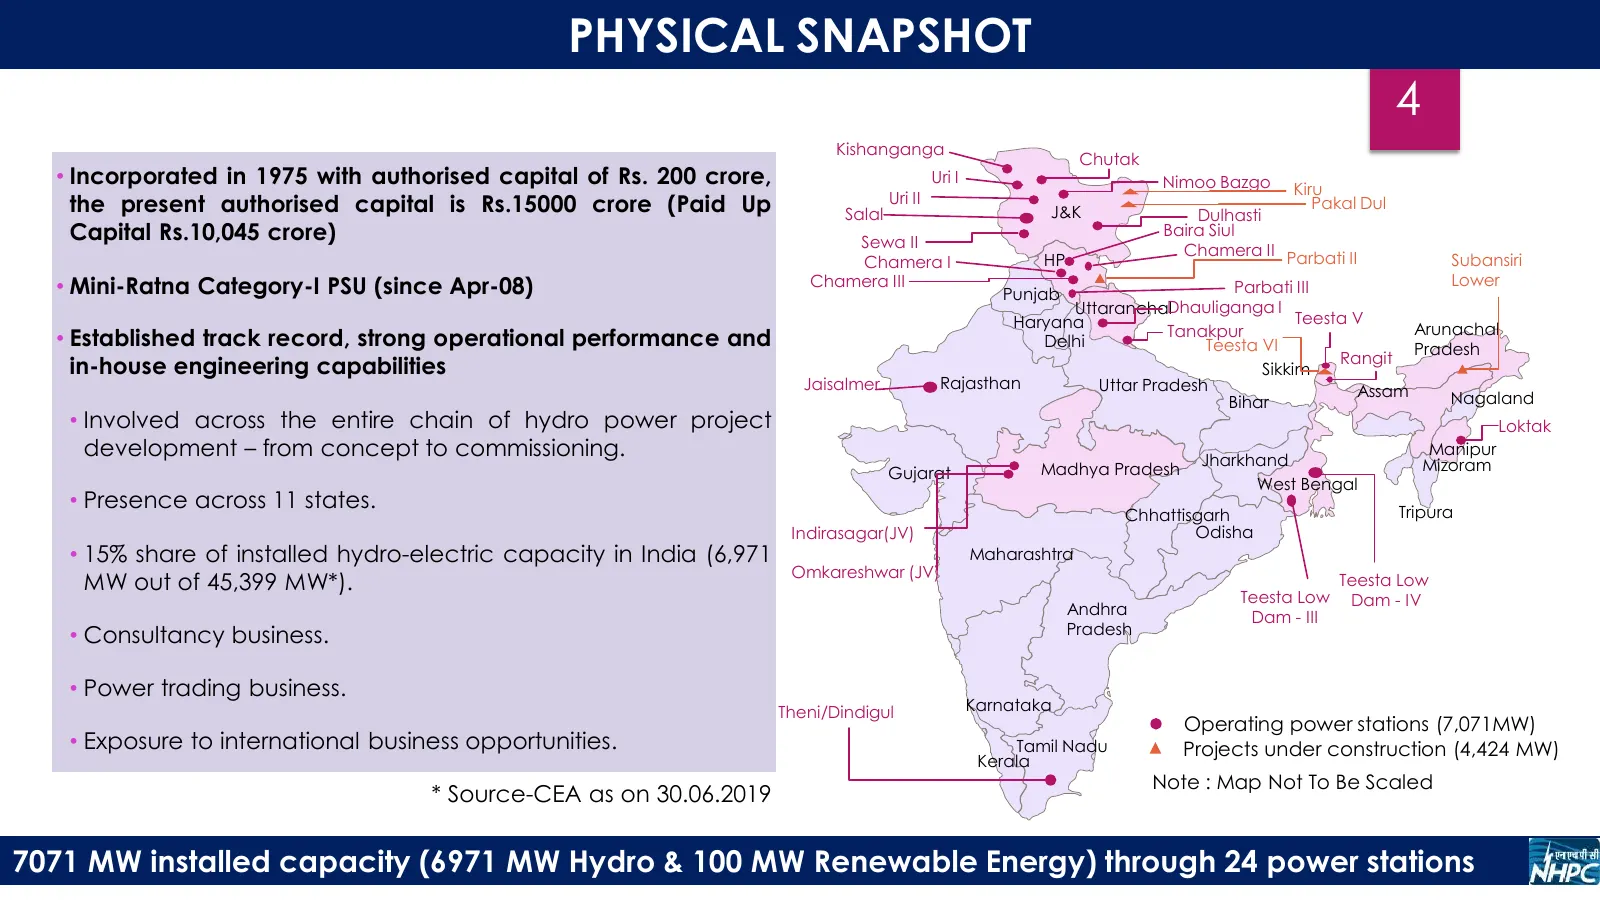
PHYSICAL SNAPSHOT 4 Kishanganga Chutak Installed • Incorporated in 1975 with authorised capital of Rs. 200 crore, Uri II Uri I Nimoo Bazgo Kiru the present authorised capital is Rs.15000 crore (Paid Up Pakal Dul Capacity Salal J&K Dulhasti Capital Rs.10,045 crore) Sewa II Baira Siul Chamera II Parba
Slide 5: Physical Snapshot
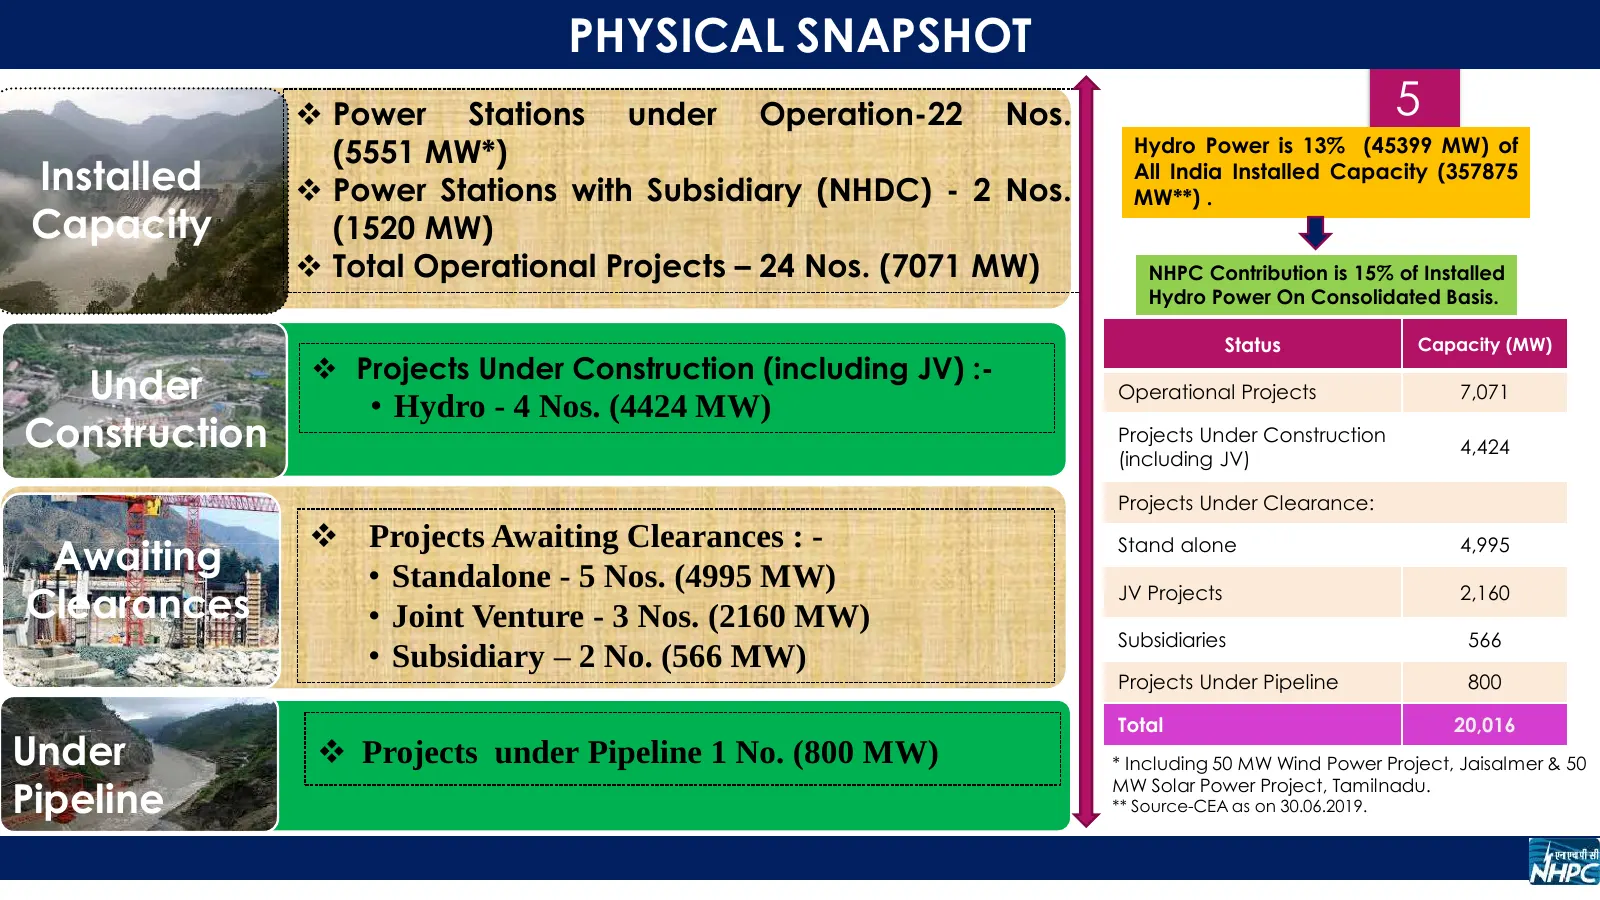
PHYSICAL SNAPSHOT Power Stations under Operation-22 Nos. 5 (5551 MW*) Hydro Power is 13% (45399 MW) of Installed Power Stations with Subsidiary (NHDC) - 2 Nos. All India Installed Capacity (357875 MW**) . Capacity (1520 MW) Total Operational Projects – 24 Nos. (7071 MW) NHPC Contribution is 15
Slide 6: Ten Year Digest of Standalone Generation
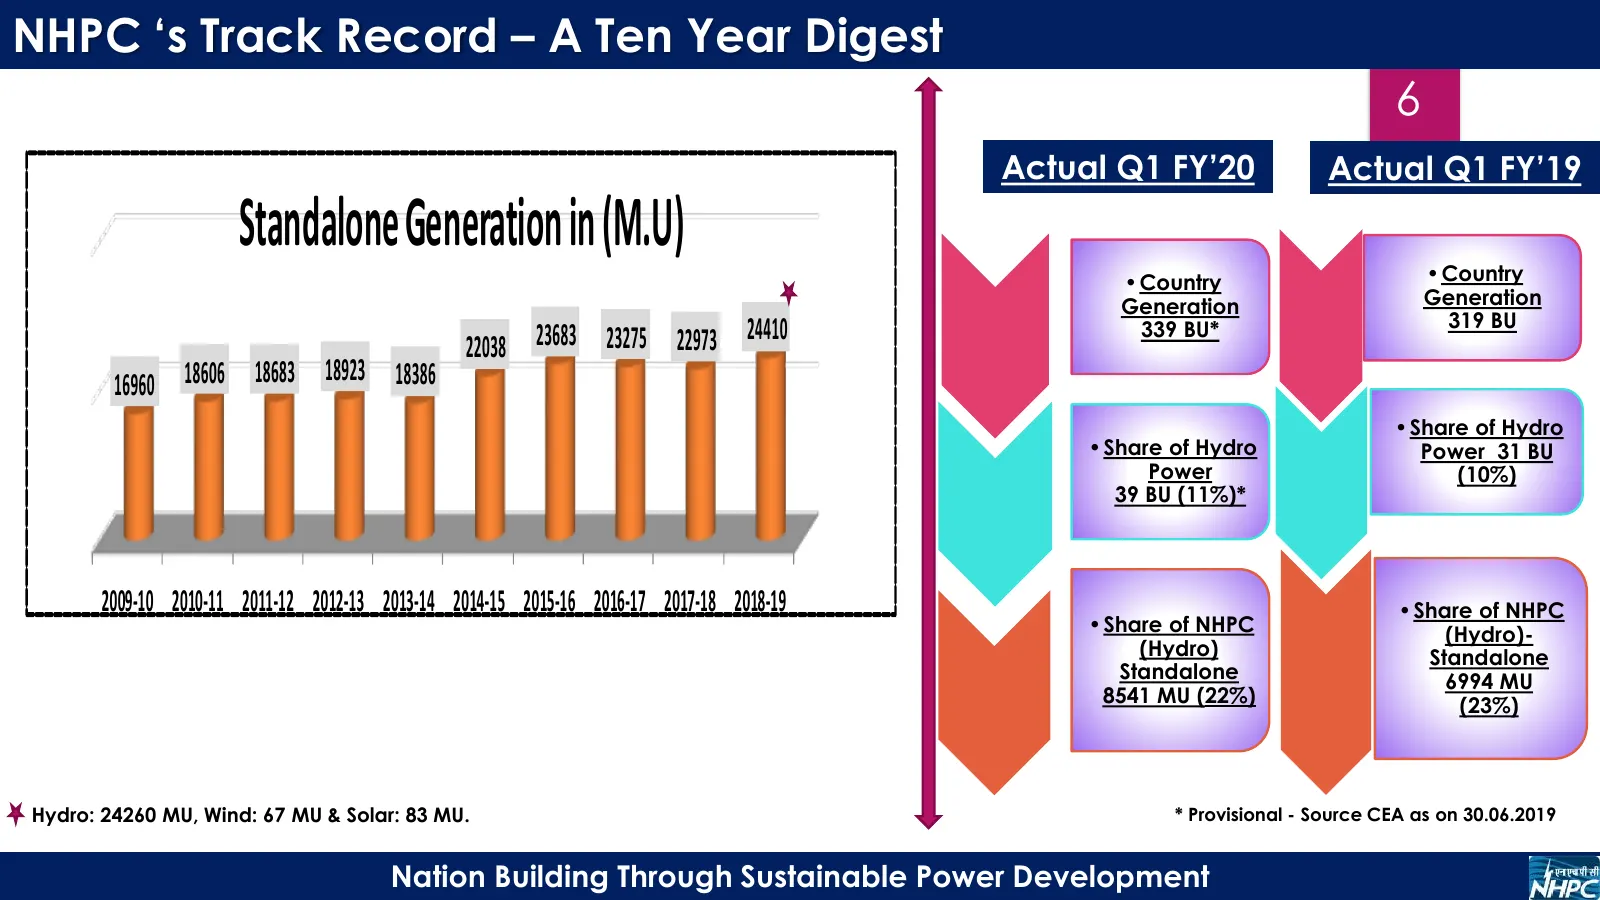
NHPC ‘s Track Record – A Ten Year Digest 6 Installed Actual Q1 FY’20 Actual Q1 FY’19 Capacity Standalone Generation in (M.U) •Country •Country Generation Generation 319 BU 24410 339 BU* 22038 23683 23275 22973 16960 18606 18683 18923 18386 Under Construction •Share of Hydro •Share of Hydro Power 31
Slide 7: Financial Highlights
7 Financial Highlights Sewa II, J&K Chamera I, Himachal Clean Power For Every Home
Slide 8: Financial Highlights: Standalone
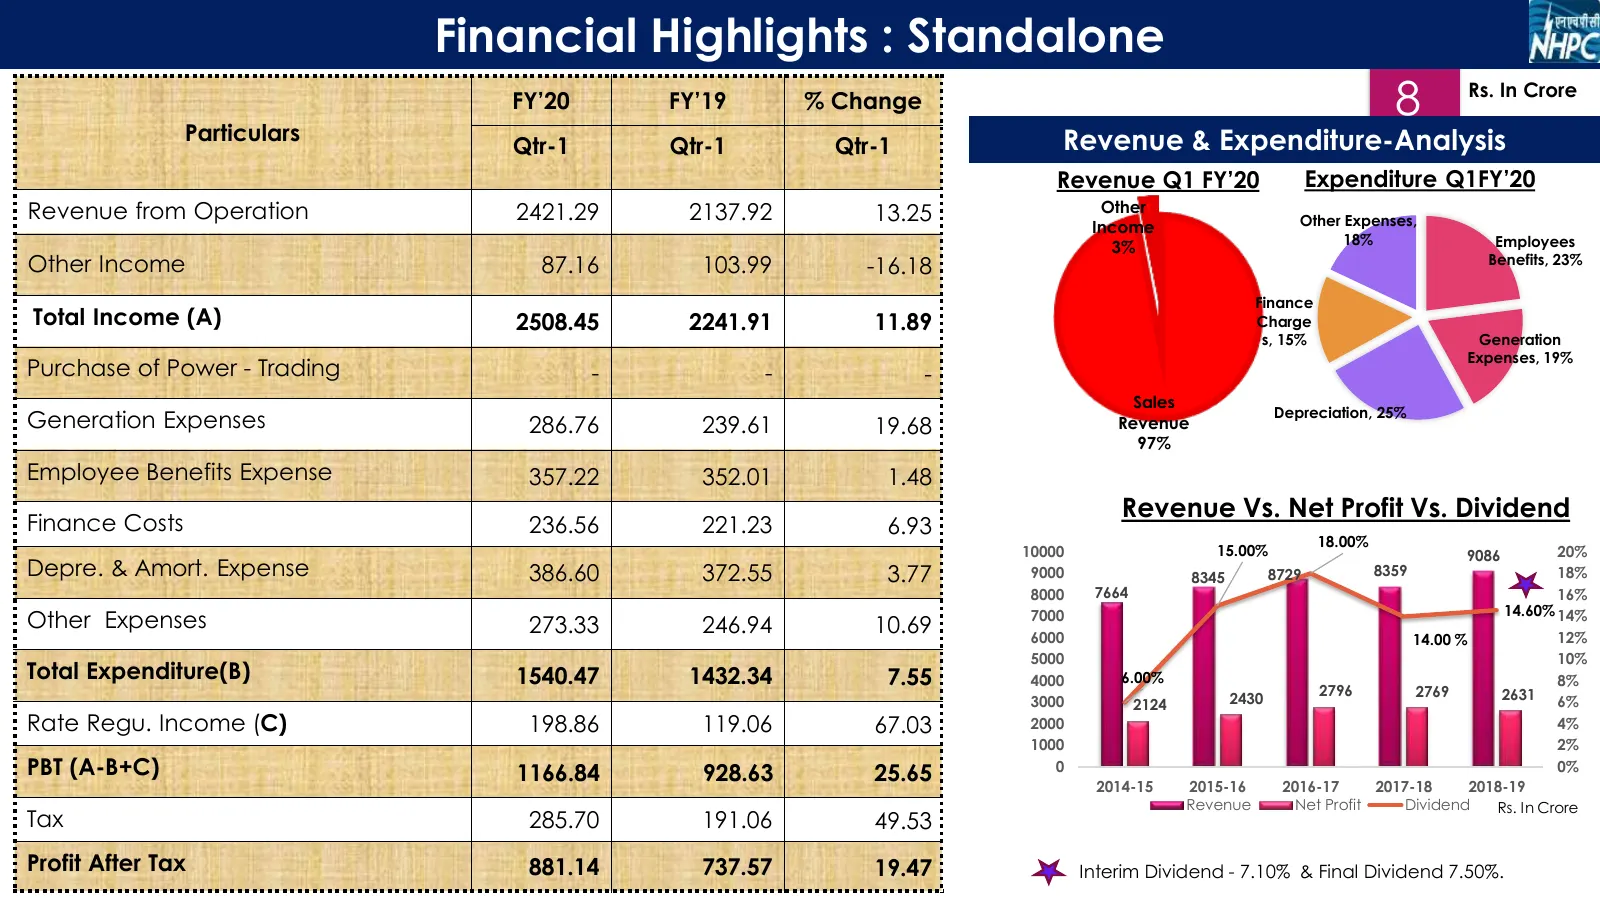
Financial Highlights : Standalone FY’20 FY’19 % Change 8 Rs. In Crore Particulars Revenue & Expenditure-Analysis Qtr-1 Qtr-1 Qtr-1 Revenue Q1 FY’20 Expenditure Q1FY’20 Revenue from Operation 2421.29 2137.92 13.25 Other Other Expenses, Income 18% Employees 3% Other Income 87.16 103.99 -16.18 Benefits
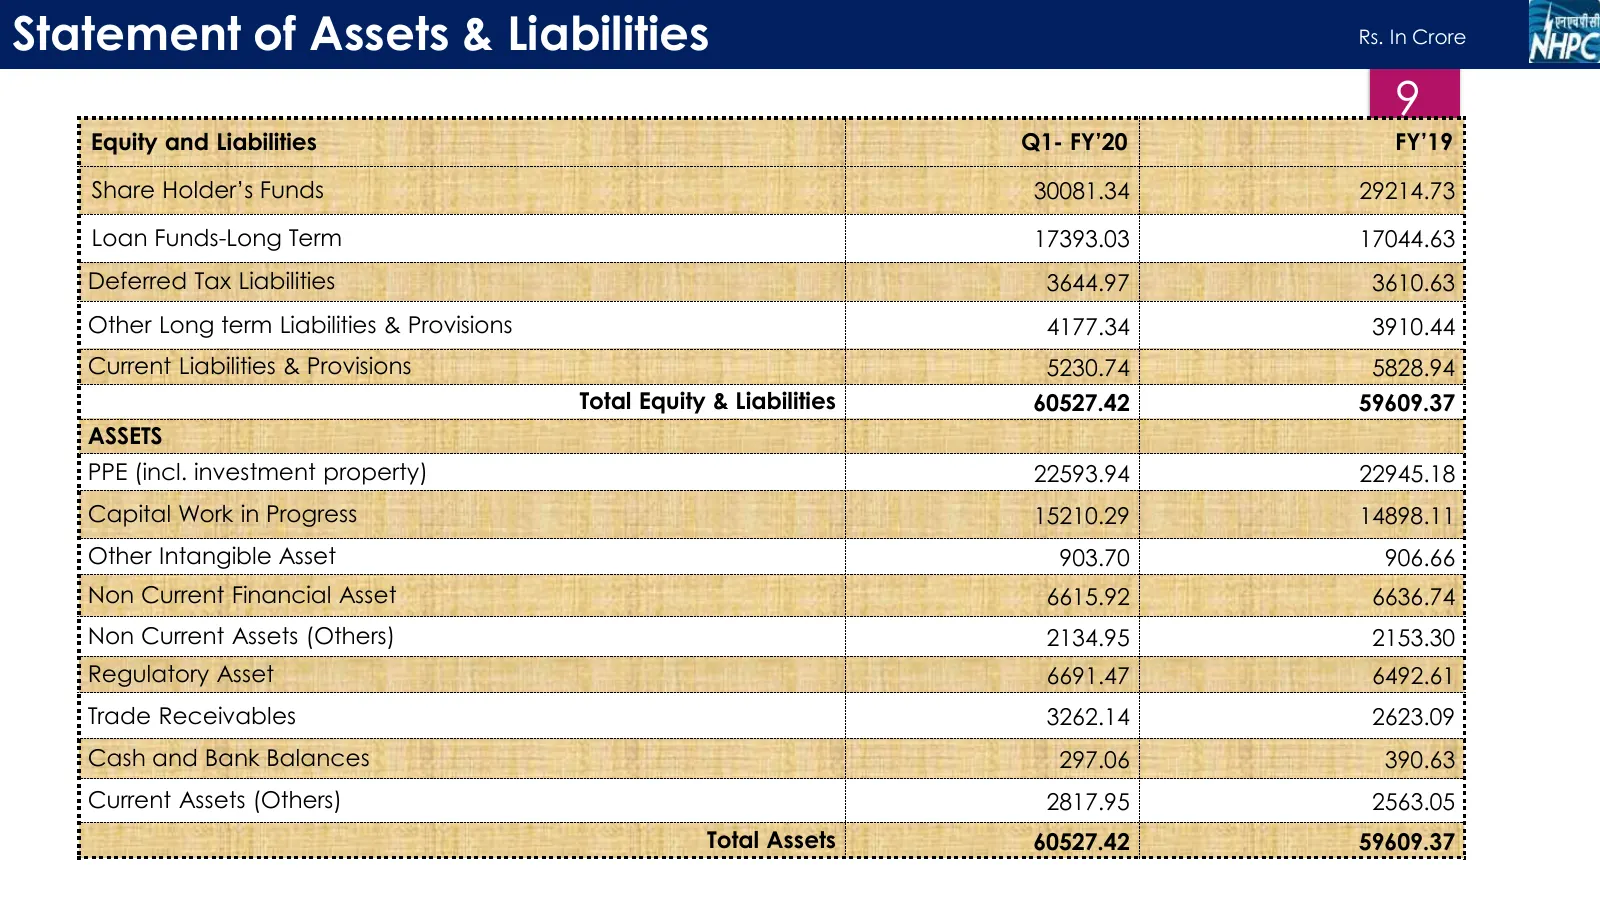
Slide 9: Statement of Assets & Liabilities
Statement of Assets & Liabilities Rs. In Crore 9 Equity and Liabilities Q1- FY’20 FY’19 Share Holder’s Funds 30081.34 29214.73 Loan Funds-Long Term 17393.03 17044.63 Deferred Tax Liabilities 3644.97 3610.63 Other Long term Liabilities & Provisions 4177.34 3910.44 Current Liabilities & Provisions 523
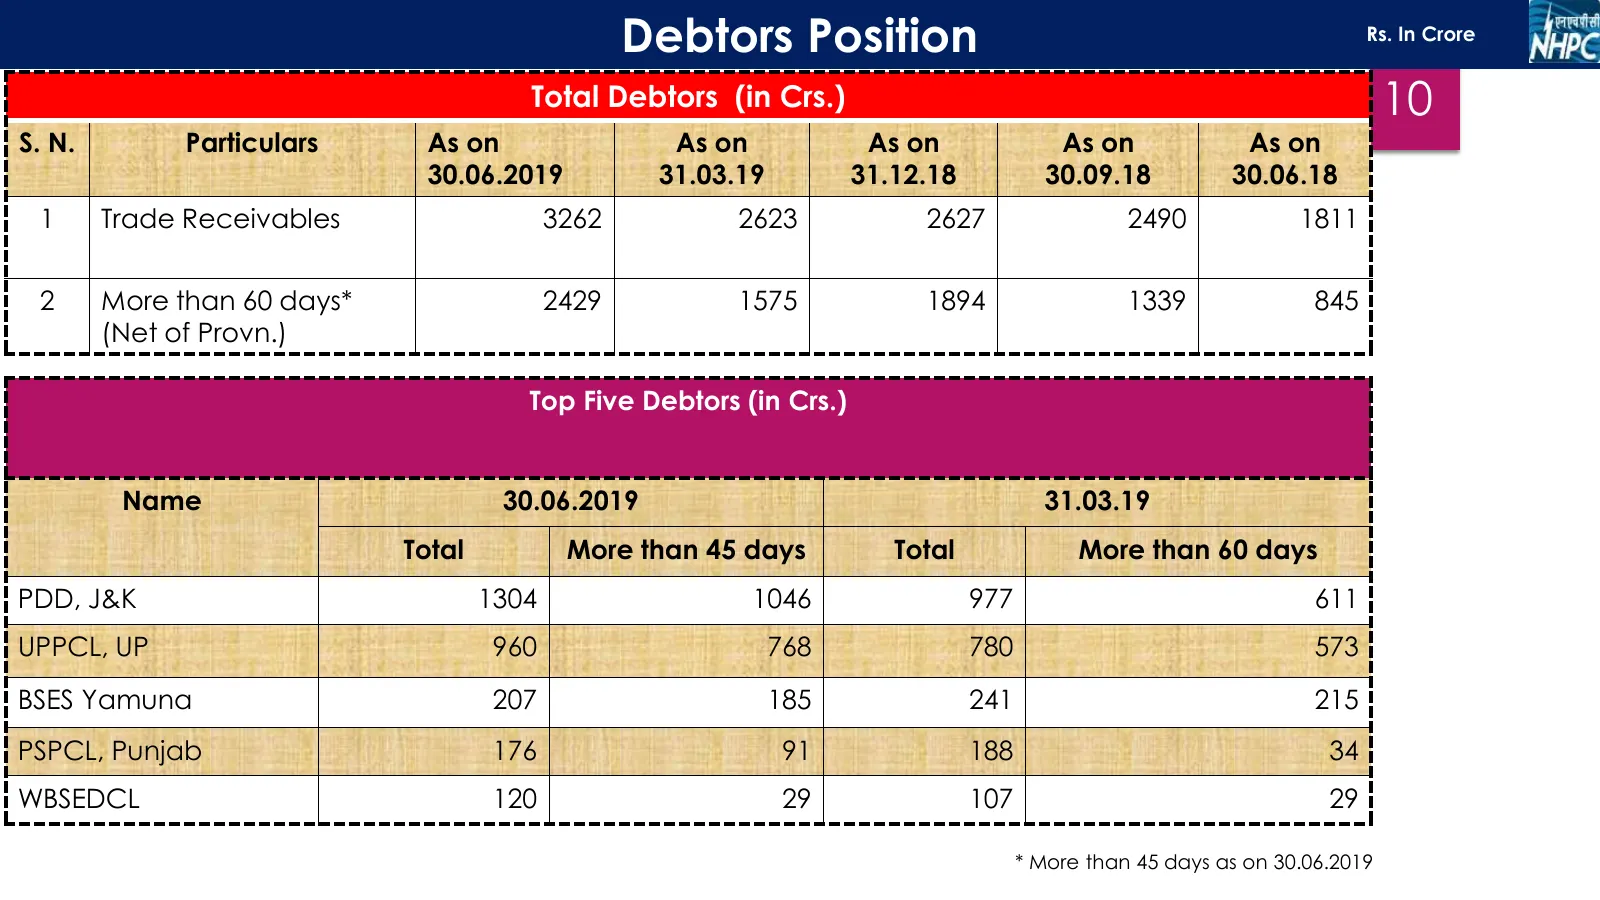
Slide 10: Debtors Position
Debtors Position Rs. In Crore Total Debtors (in Crs.) 10 S. N. Particulars As on As on As on As on As on 30.06.2019 31.03.19 31.12.18 30.09.18 30.06.18 1 Trade Receivables 3262 2623 2627 2490 1811 2 More than 60 days* 2429 1575 1894 1339 845 (Net of Provn.) Top Five Debtors (in Crs.) Name 30.06.2019
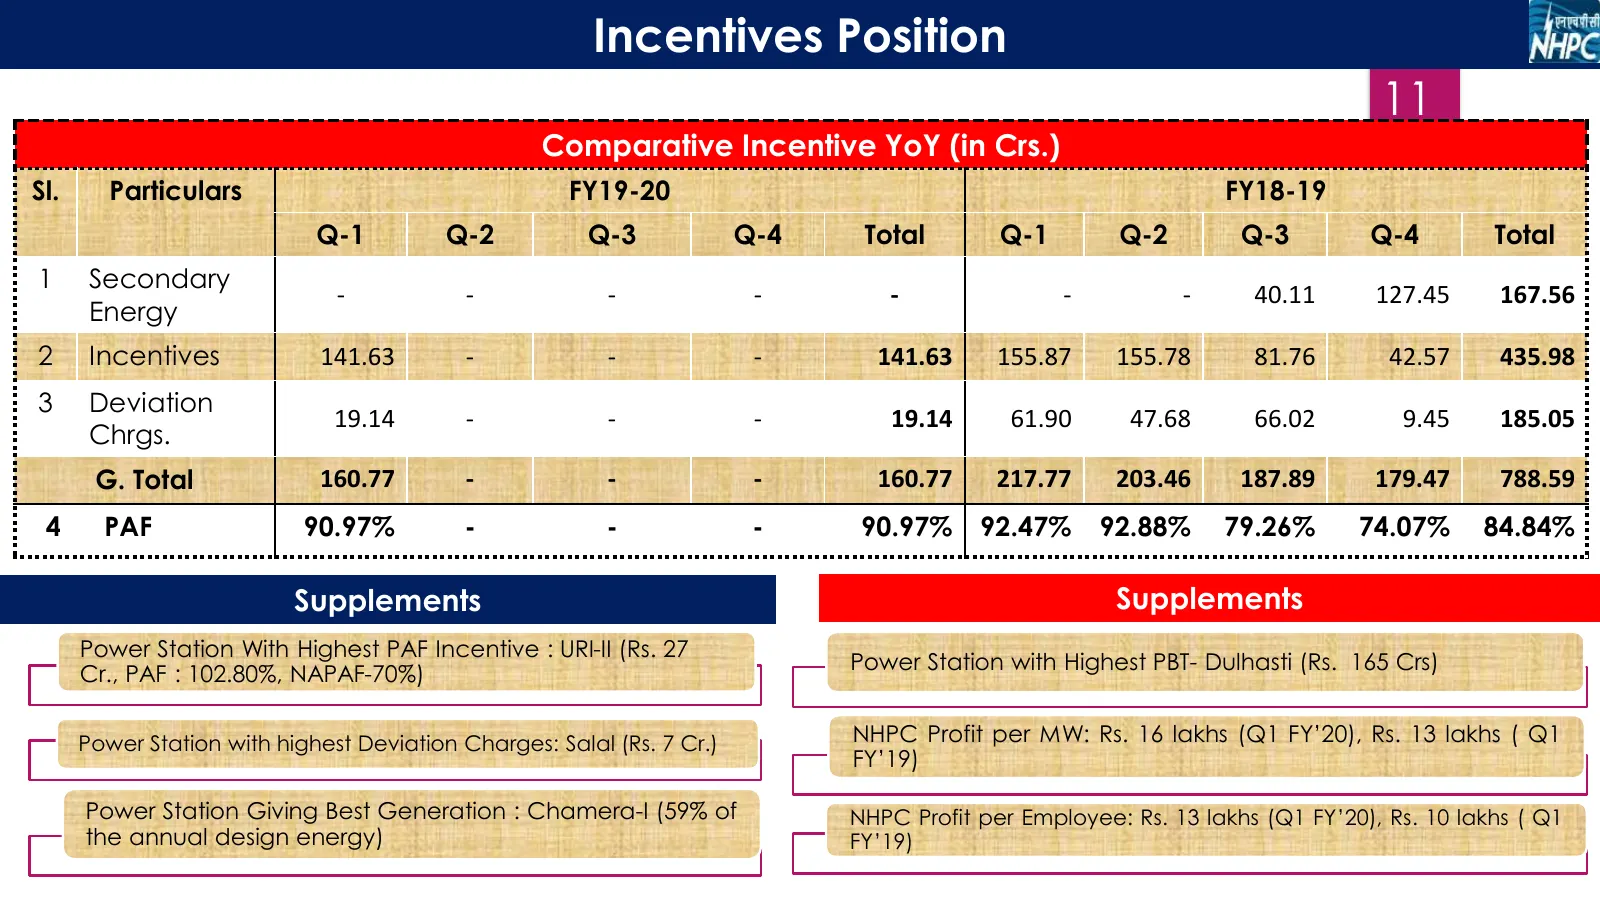
Slide 11: Incentives Position
Incentives Position 11 Comparative Incentive YoY (in Crs.) Rs. In Crore Sl. Particulars FY19-20 FY18-19 Q-1 Q-2 Q-3 Q-4 Total Q-1 Q-2 Q-3 Q-4 Total 1 Secondary - - - - - - - 40.11 127.45 167.56 Energy 2 Incentives 141.63 - - - 141.63 155.87 155.78 81.76 42.57 435.98 3 Deviation 19.14 - - - 19.14 61.
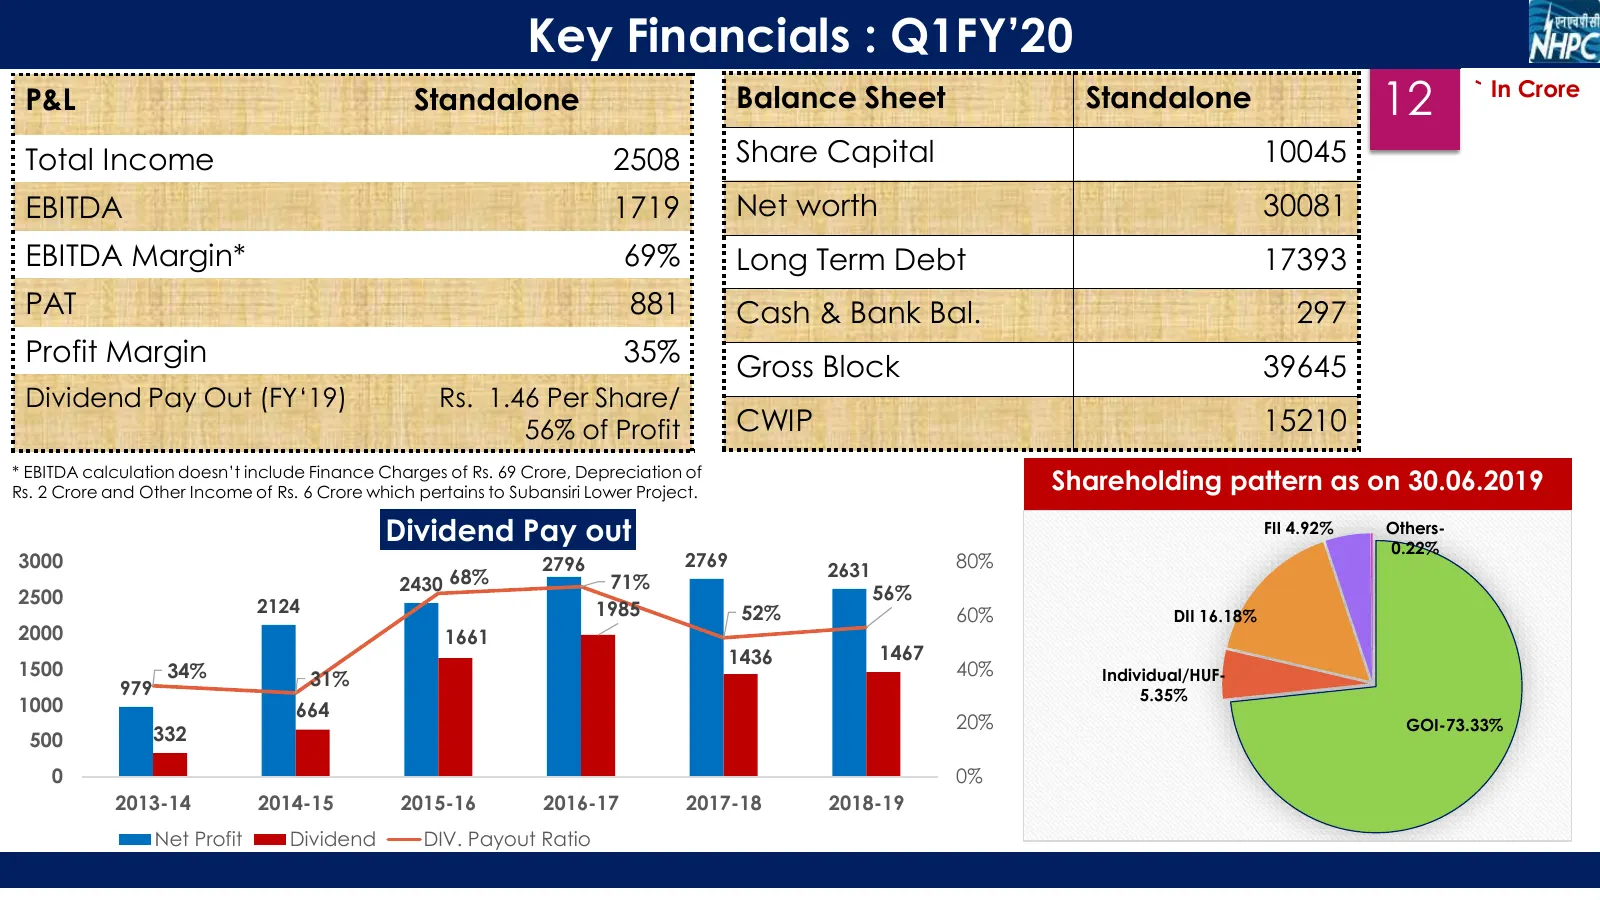
Slide 12: Key Financials: Q1FY'20
Key Financials : Q1FY’20 P&L Standalone Balance Sheet Standalone 12 ` In Crore Total Income 2508 Share Capital 10045 EBITDA 1719 Net worth 30081 EBITDA Margin* 69% Long Term Debt 17393 PAT 881 Cash & Bank Bal. 297 Profit Margin 35% Gross Block 39645 Dividend Pay Out (FY‘19) Rs. 1.46 Per Share/ 56% o
Slide 13: NHPC – Key Ratios
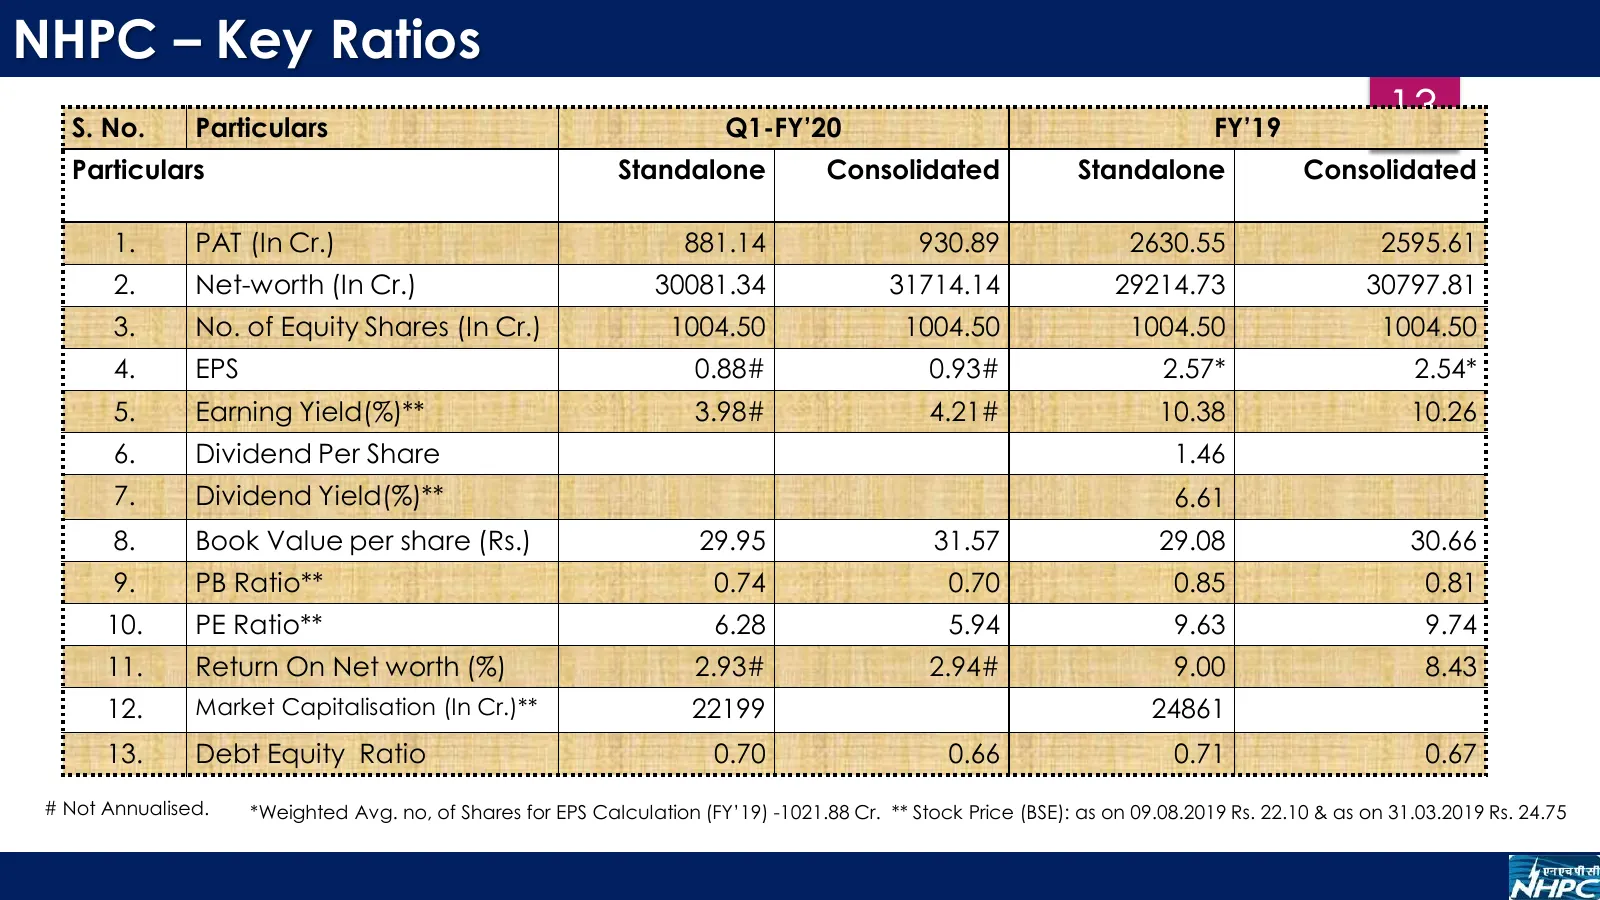
NHPC – Key Ratios S. No. Particulars Q1-FY’20 FY’19 13 Particulars Standalone Consolidated Standalone Consolidated 1. PAT (In Cr.) 881.14 930.89 2630.55 2595.61 2. Net-worth (In Cr.) 30081.34 31714.14 29214.73 30797.81 3. No. of Equity Shares (In Cr.) 1004.50 1004.50 1004.50 1004.50 4. EPS 0.88# 0.9
Slide 14: NHDC Ltd. (Subsidiary) Snapshots: FY18-19
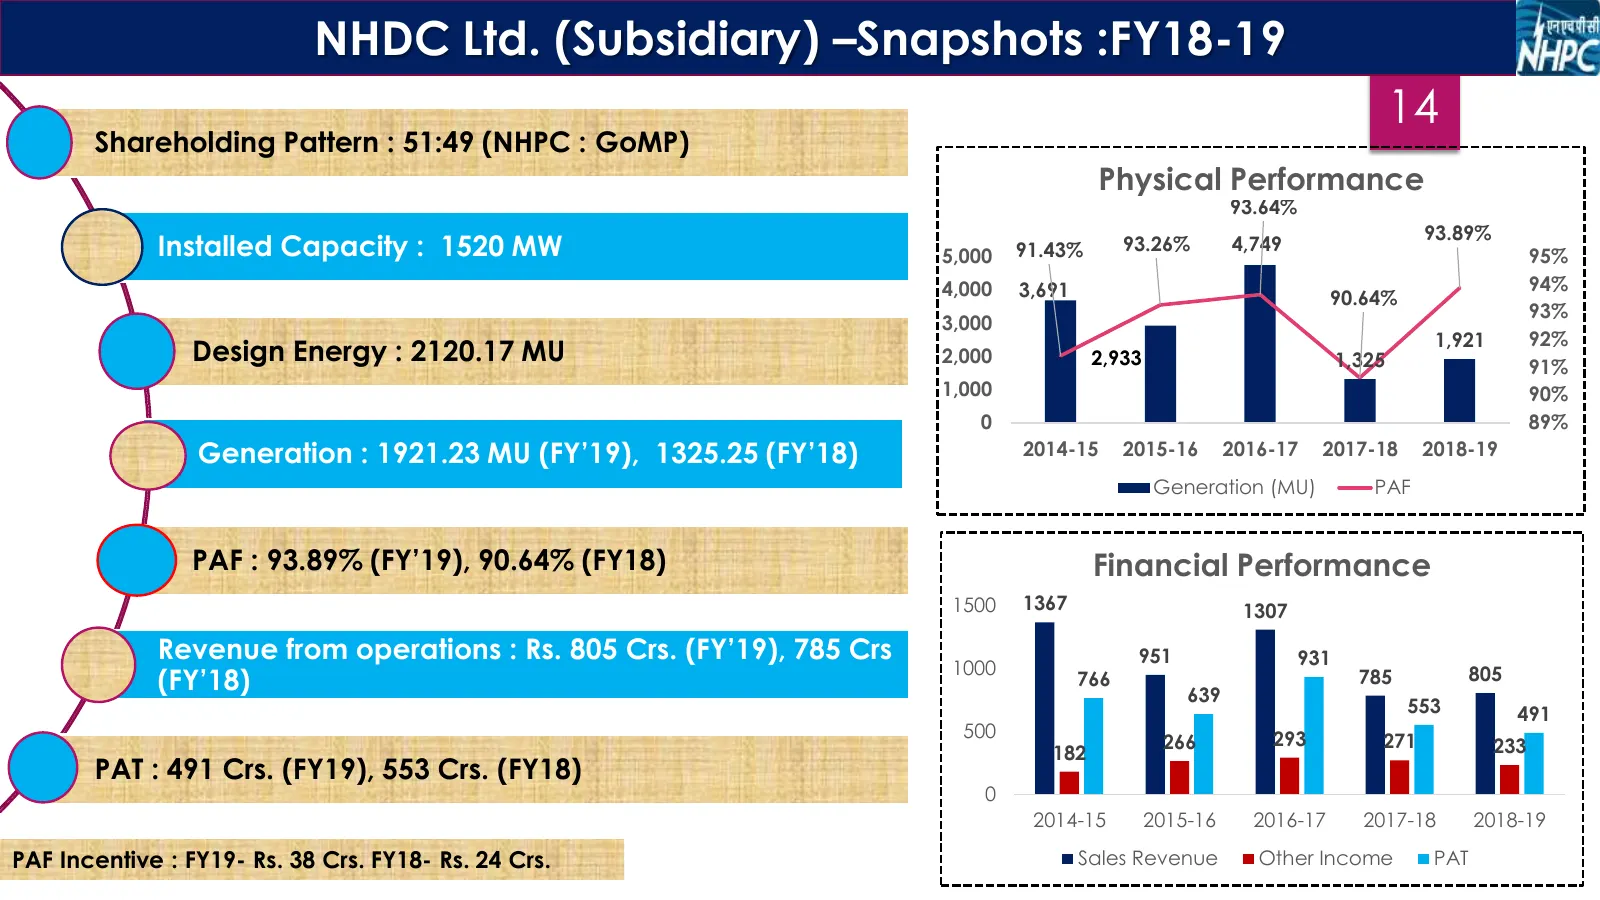
NHDC Ltd. (Subsidiary) –Snapshots :FY18-19 14 Shareholding Pattern : 51:49 (NHPC : GoMP) Physical Performance 93.64% 93.89% Installed Capacity : 1520 MW 5,000 91.43% 93.26% 4,749 95% 4,000 3,691 94% 90.64% 93% 3,000 1,921 92% Design Energy : 2120.17 MU 2,000 2,933 1,325 91% 1,000 90% 0 89% Generatio
Slide 15: Progressive Physical & Financial Schedule (Hydro)
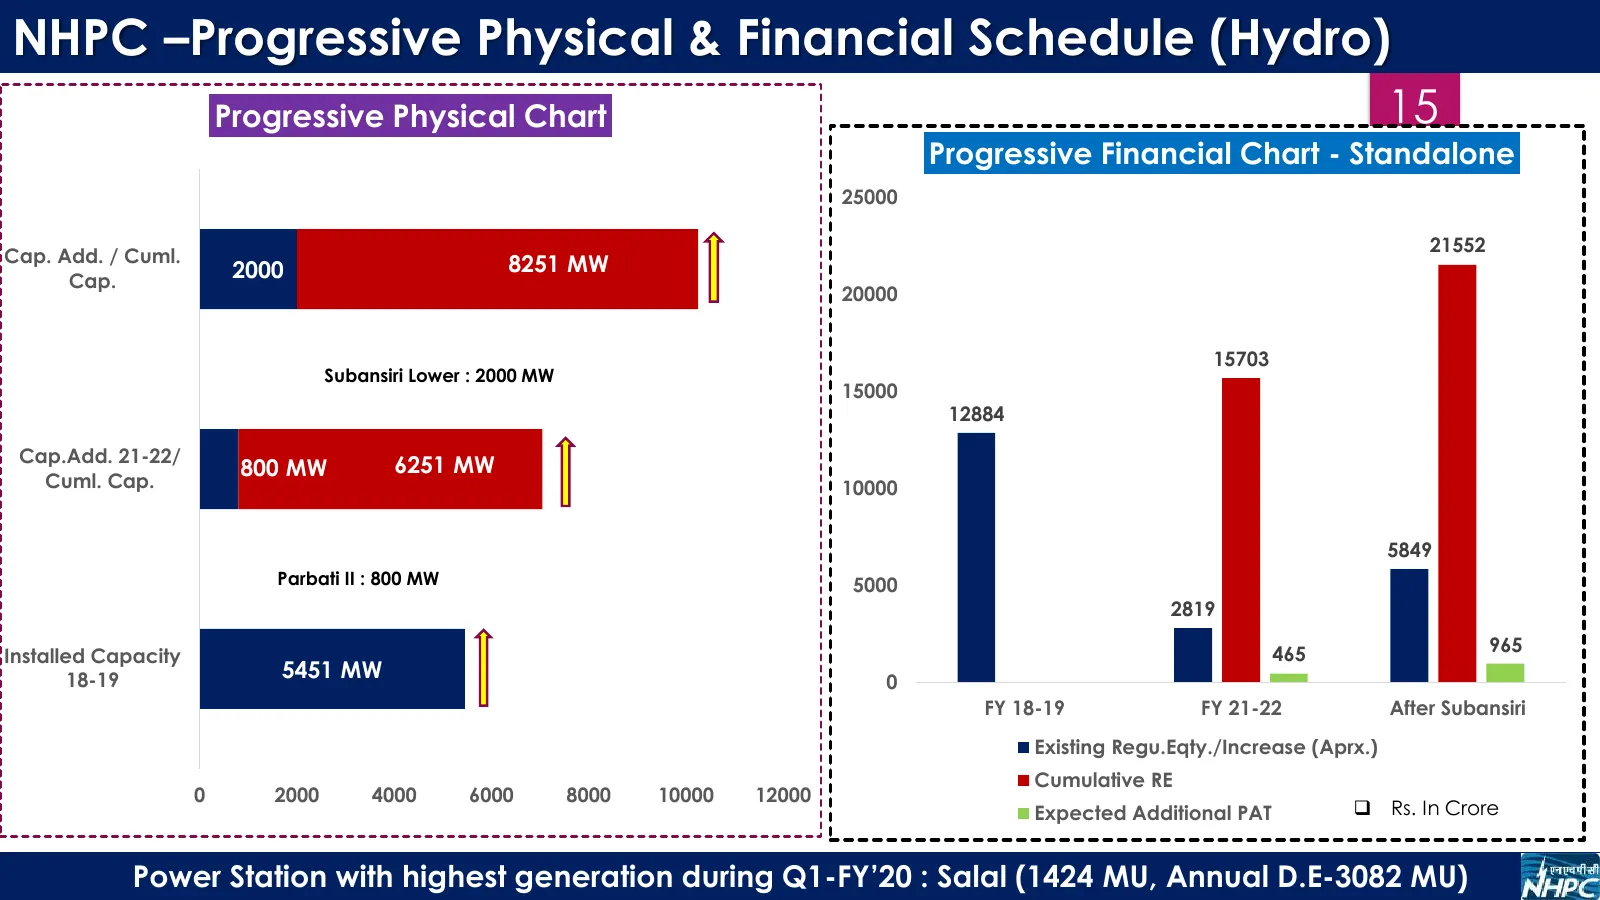
NHPC –Progressive Physical & Financial Schedule (Hydro) Progressive Physical Chart 15 Progressive Financial Chart - Standalone 25000 21552 Cap. Add. / Cuml. 8251 MW Cap. 2000 20000 15703 Subansiri Lower : 2000 MW 15000 12884 Cap.Add. 21-22/ 6251 MW Cuml. Cap. 800 MW 10000 5849 Parbati II : 800 MW 50
Slide 16: NHPC – CAPEX
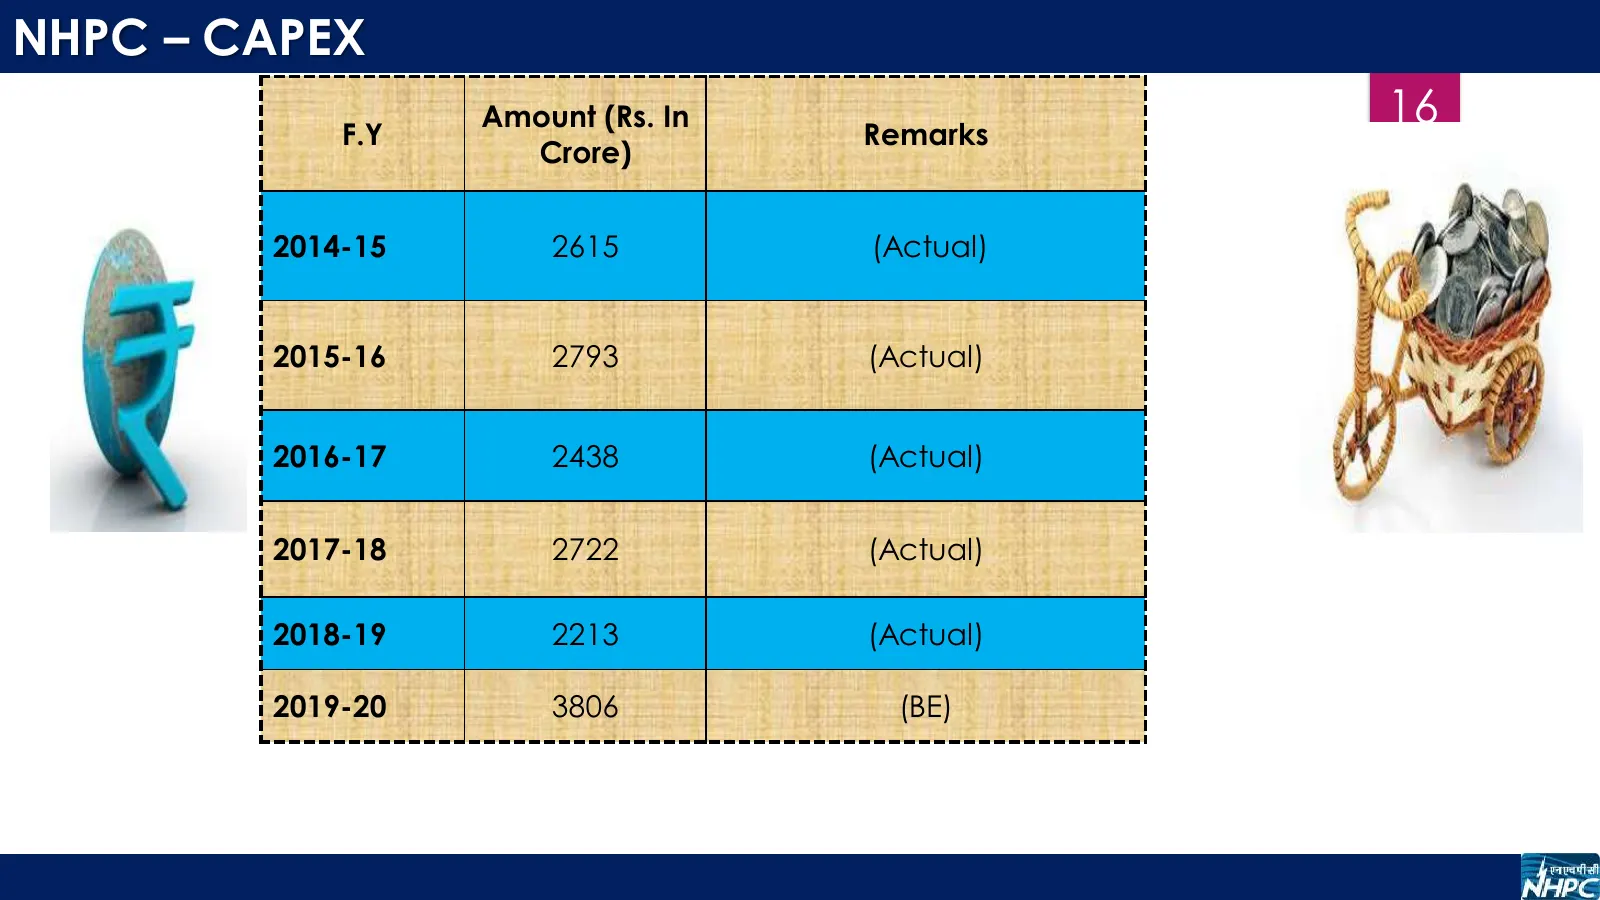
NHPC – CAPEX F.Y Amount (Rs. In Remarks 16 Crore) 2014-15 2615 (Actual) 2015-16 2793 (Actual) 2016-17 2438 (Actual) 2017-18 2722 (Actual) 2018-19 2213 (Actual) 2019-20 3806 (BE)
Slide 17: Major Highlights Q1 FY'20
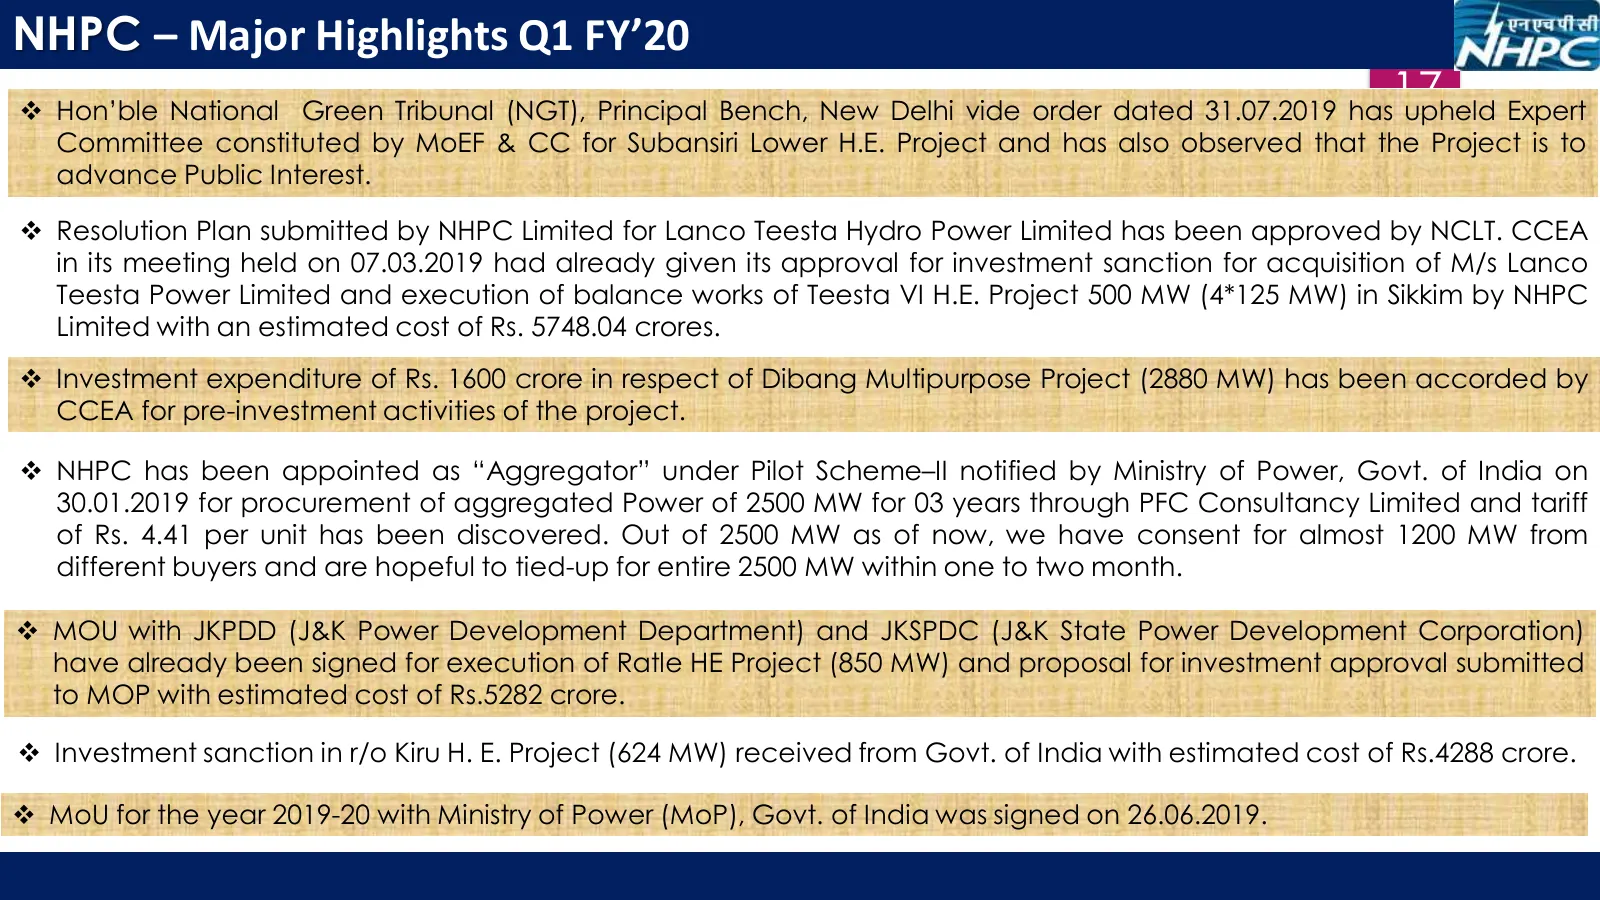
NHPC – Major Highlights Q1 FY’20 17 Hon’ble National Green Tribunal (NGT), Principal Bench, New Delhi vide order dated 31.07.2019 has upheld Expert Committee constituted by MoEF & CC for Subansiri Lower H.E. Project and has also observed that the Project is to advance Public Interest. Resolution
Slide 18: Other Business Initiative
18 Other Business Initiative Solar Energy Wind Energy Clean Power For EVERY HOME
Slide 19: Other Business Initiative: Solar Power
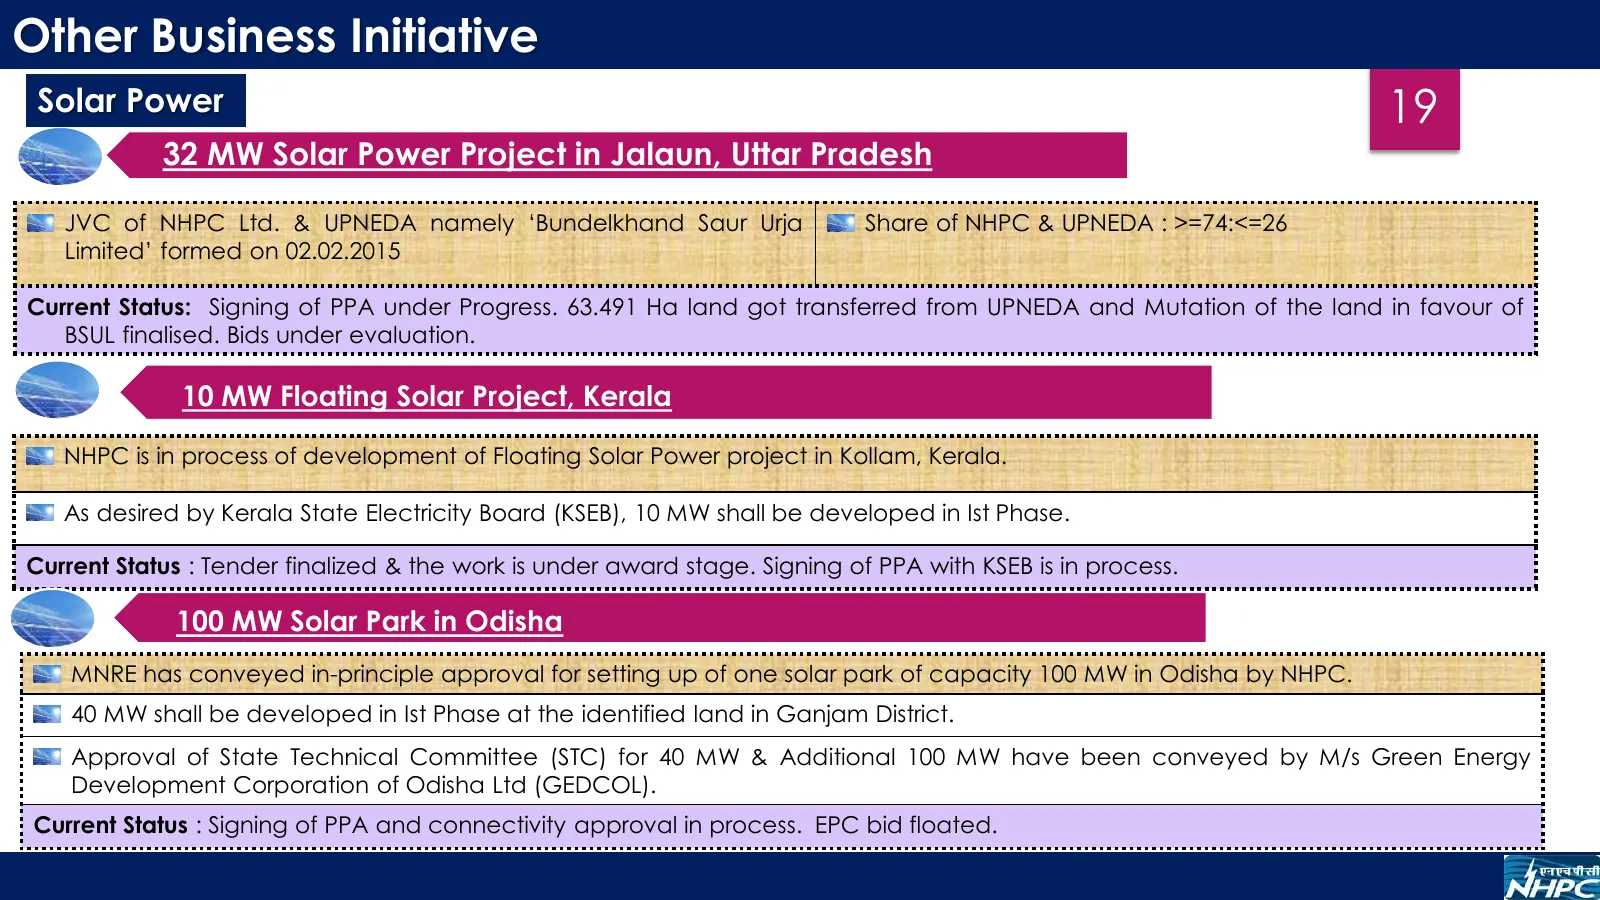
Other Business Initiative Solar Power 19 32 MW Solar Power Project in Jalaun, Uttar Pradesh JVC of NHPC Ltd. & UPNEDA namely ‘Bundelkhand Saur Urja Share of NHPC & UPNEDA : >=74:<=26 Limited’ formed on 02.02.2015 Current Status: Signing of PPA under Progress. 63.491 Ha land got transferred from UPNE
Slide 20: Other Business Initiative: Wind Power
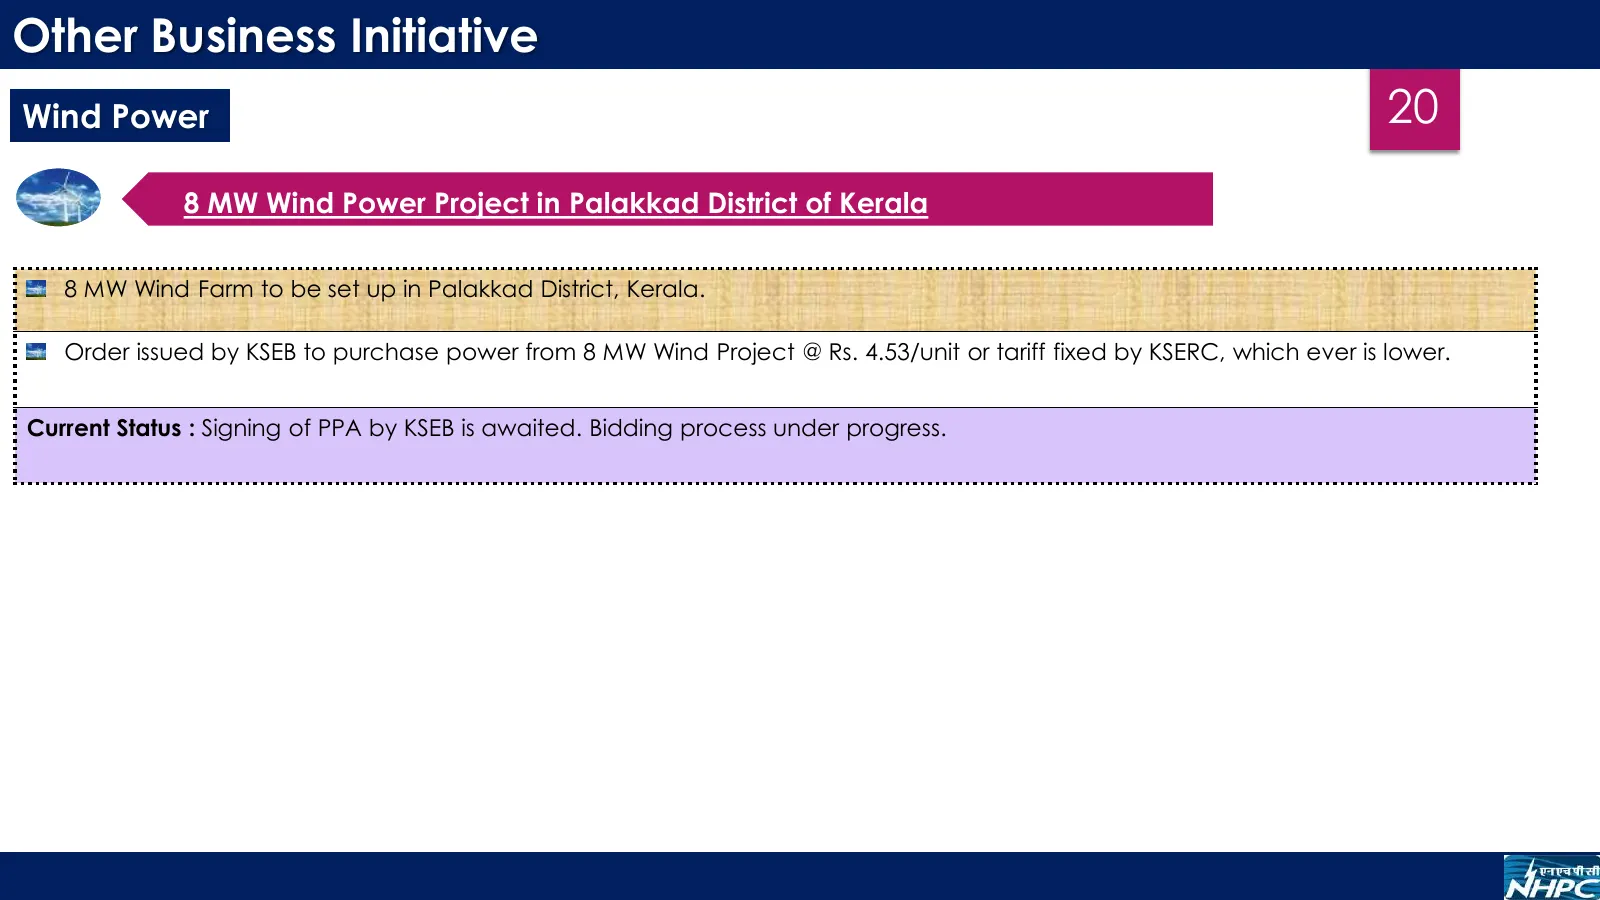
Other Business Initiative Wind Power 20 8 MW Wind Power Project in Palakkad District of Kerala 8 MW Wind Farm to be set up in Palakkad District, Kerala. Order issued by KSEB to purchase power from 8 MW Wind Project @ Rs. 4.53/unit or tariff fixed by KSERC, which ever is lower. Current Status : Signi
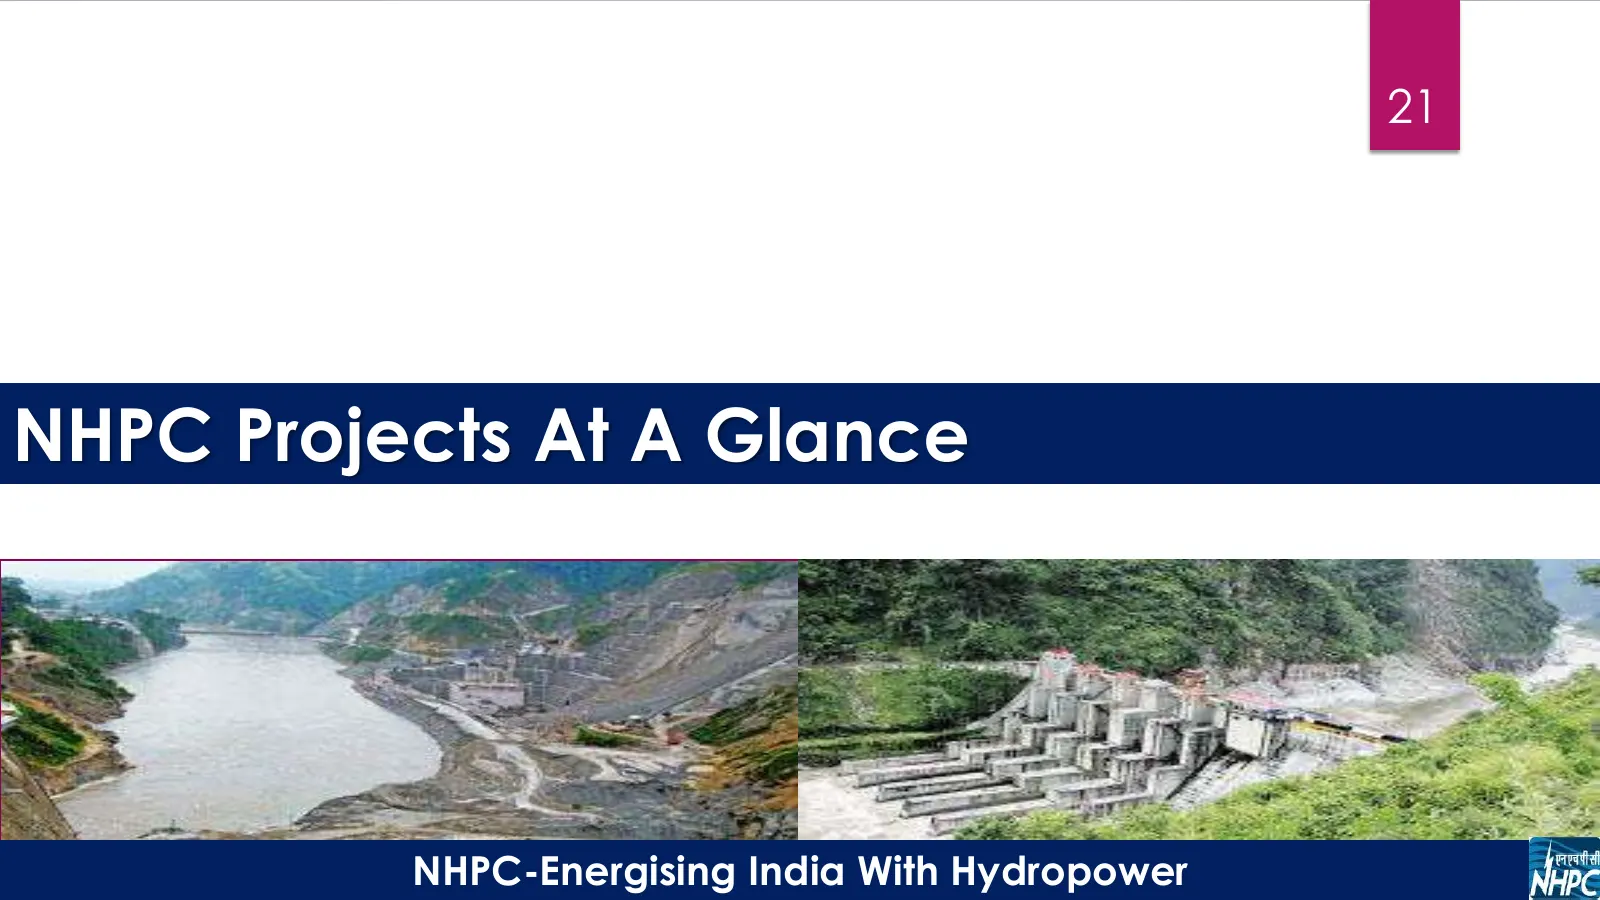
Slide 21: NHPC Projects At A Glance
21 NHPC Projects At A Glance NHPC-Energising India With Hydropower
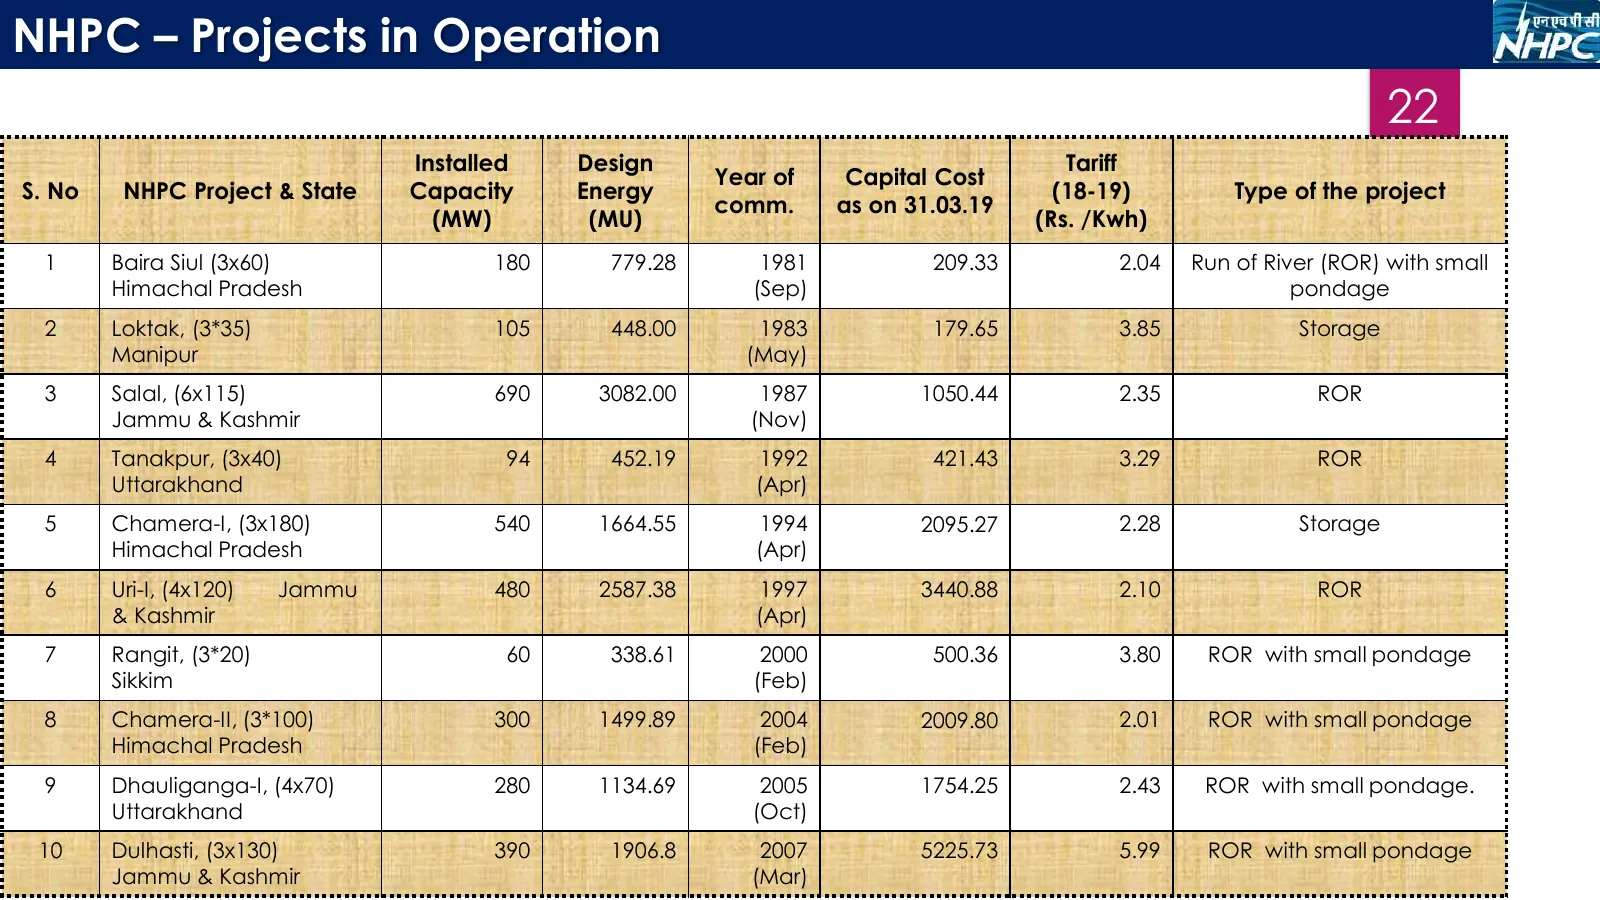
Slide 22: Projects in Operation
NHPC – Projects in Operation 22 Installed Design Tariff Year of Capital Cost S. No NHPC Project & State Capacity Energy (18-19) Type of the project comm. as on 31.03.19 (MW) (MU) (Rs. /Kwh) 1 Baira Siul (3x60) 180 779.28 1981 209.33 2.04 Run of River (ROR) with small Himachal Pradesh (Sep) pondage 2
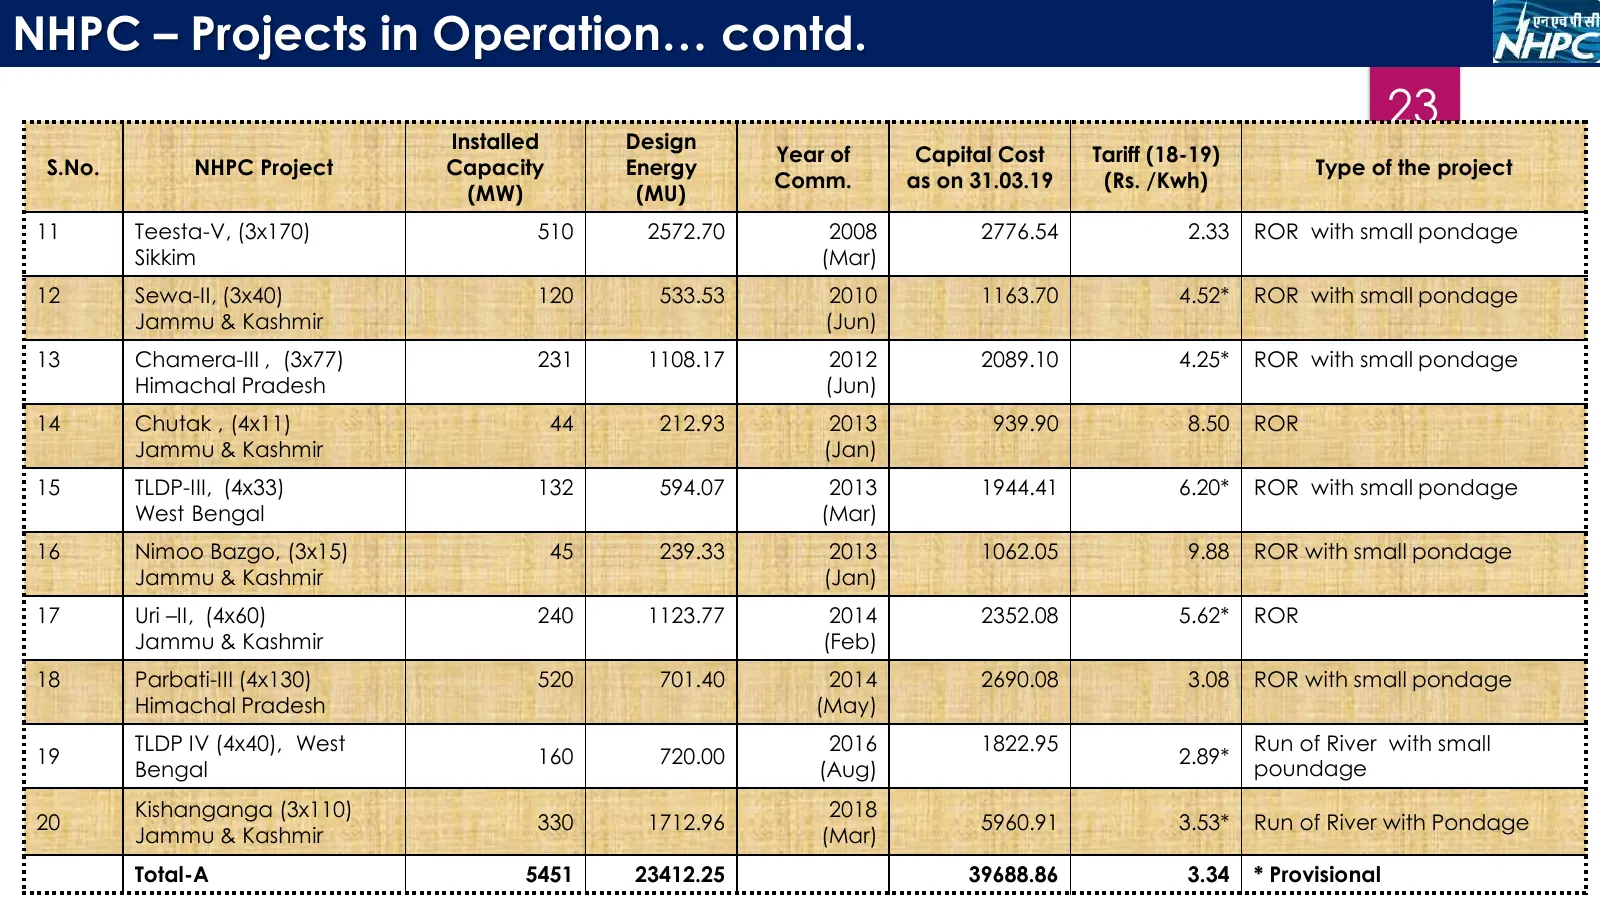
Slide 23: Projects in Operation… contd.
NHPC – Projects in Operation… contd. 23 Installed Design Year of Capital Cost Tariff (18-19) S.No. NHPC Project Capacity Energy Type of the project Comm. as on 31.03.19 (Rs. /Kwh) (MW) (MU) 11 Teesta-V, (3x170) 510 2572.70 2008 2776.54 2.33 ROR with small pondage Sikkim (Mar) 12 Sewa-II, (3x40) 120
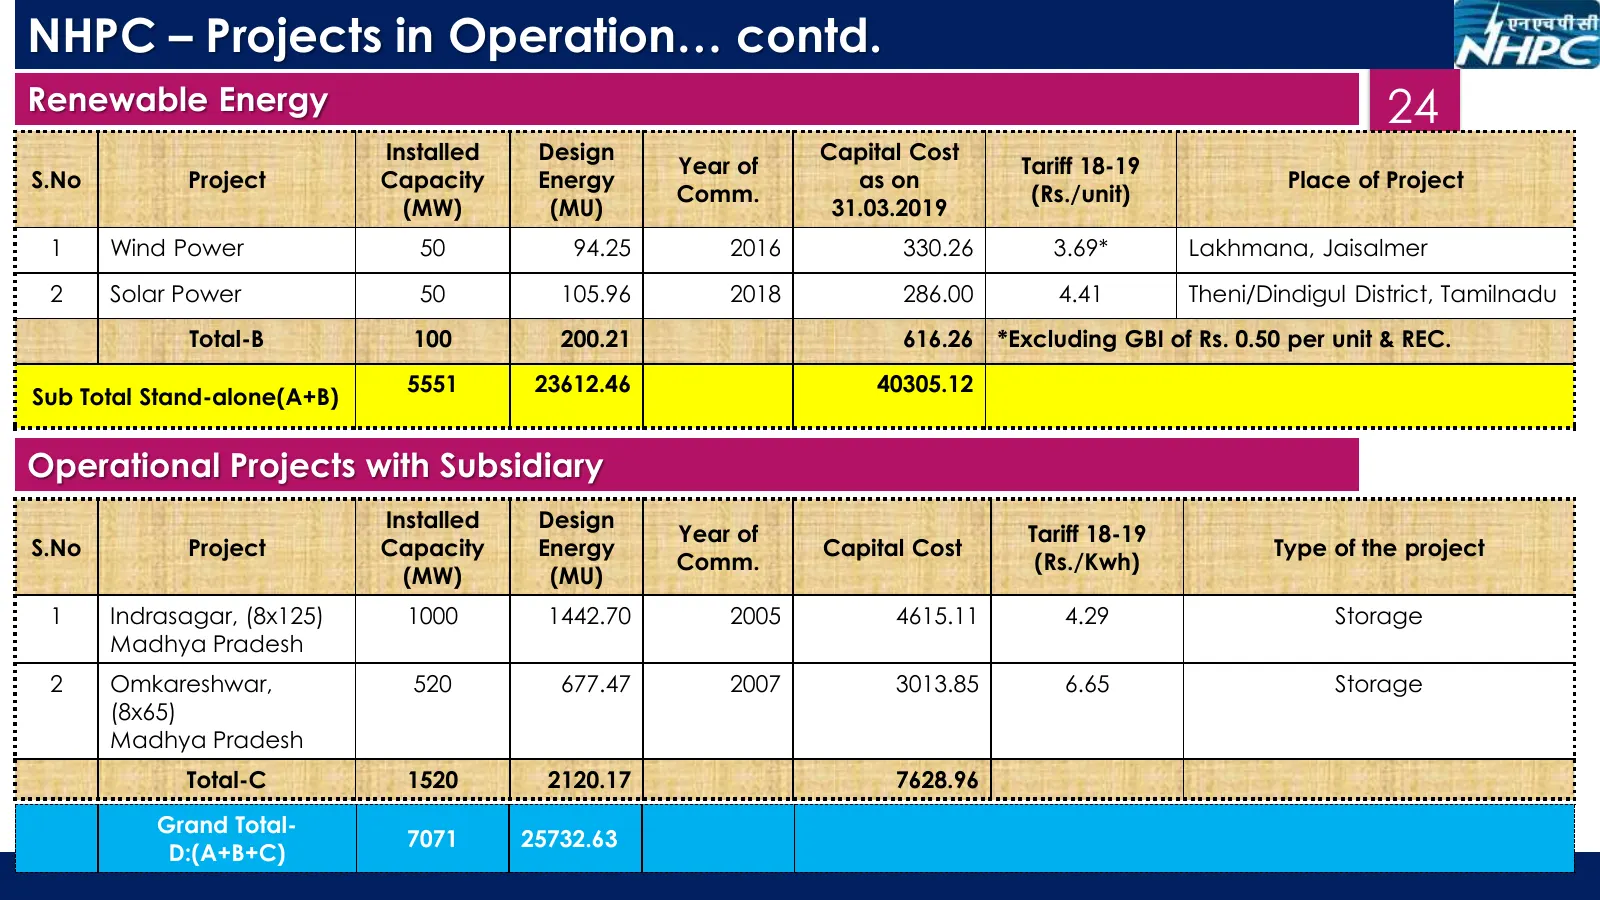
Slide 24: Projects in Operation… contd.
NHPC – Projects in Operation… contd. Renewable Energy 24 Installed Design Capital Cost Year of Tariff 18-19 S.No Project Capacity Energy as on Place of Project Comm. (Rs./unit) (MW) (MU) 31.03.2019 1 Wind Power 50 94.25 2016 330.26 3.69* Lakhmana, Jaisalmer 2 Solar Power 50 105.96 2018 286.00 4.41 T
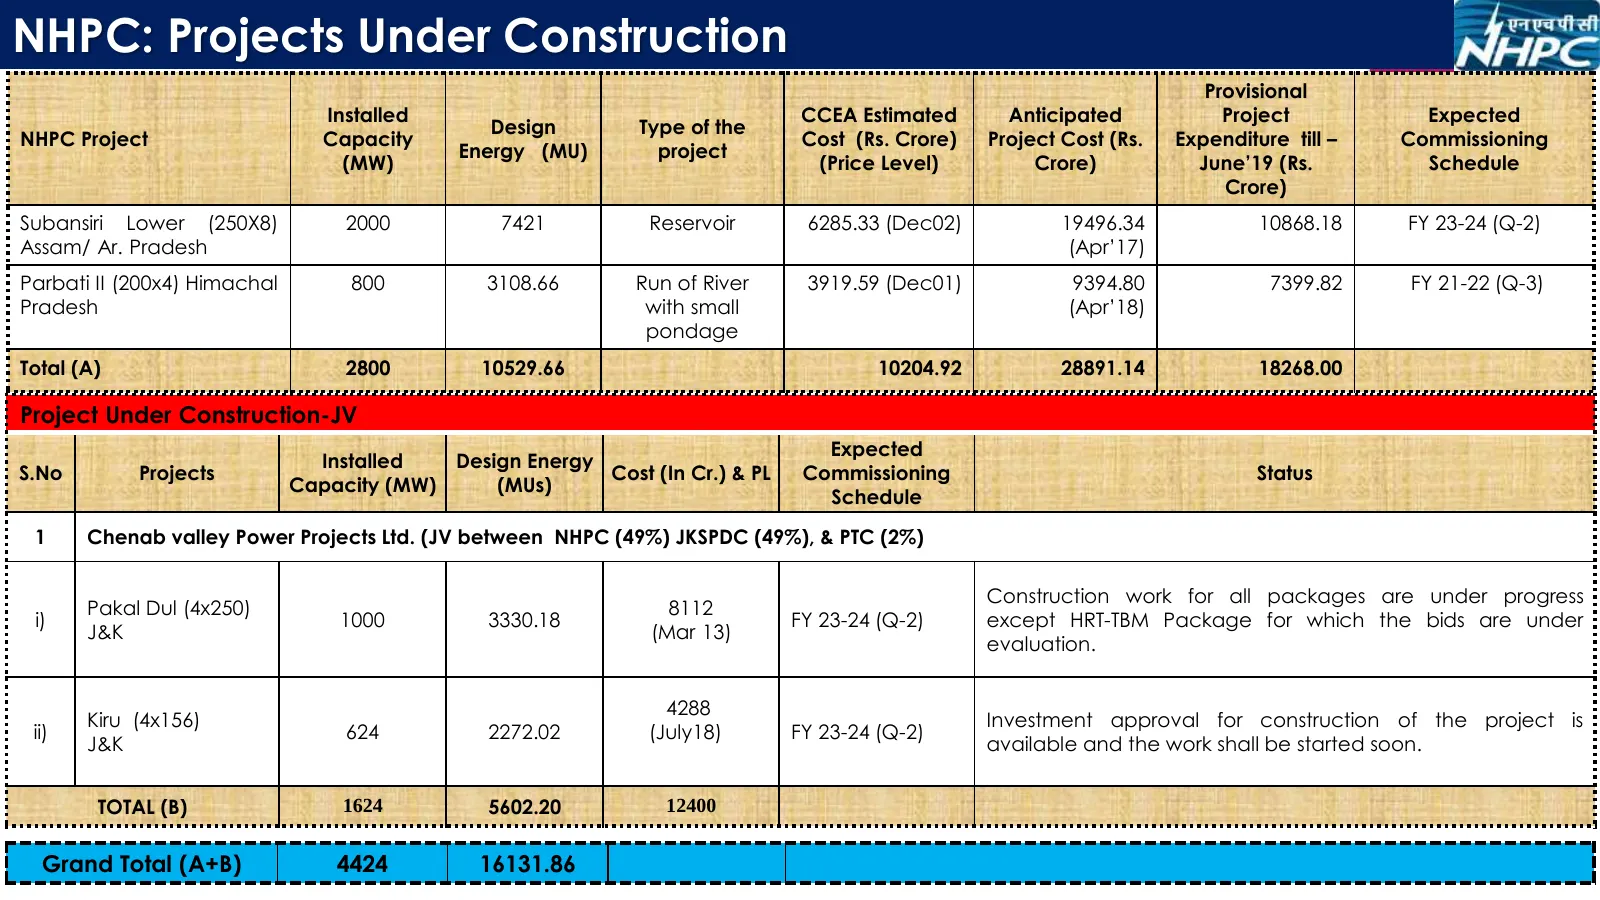
Slide 25: Projects Under Construction
NHPC: Projects Under Construction 25 Provisional Installed CCEA Estimated Anticipated Project Expected Design Type of the NHPC Project Capacity Cost (Rs. Crore) Project Cost (Rs. Expenditure till – Commissioning Energy (MU) project (MW) (Price Level) Crore) June’19 (Rs. Schedule Crore) Subansiri Low
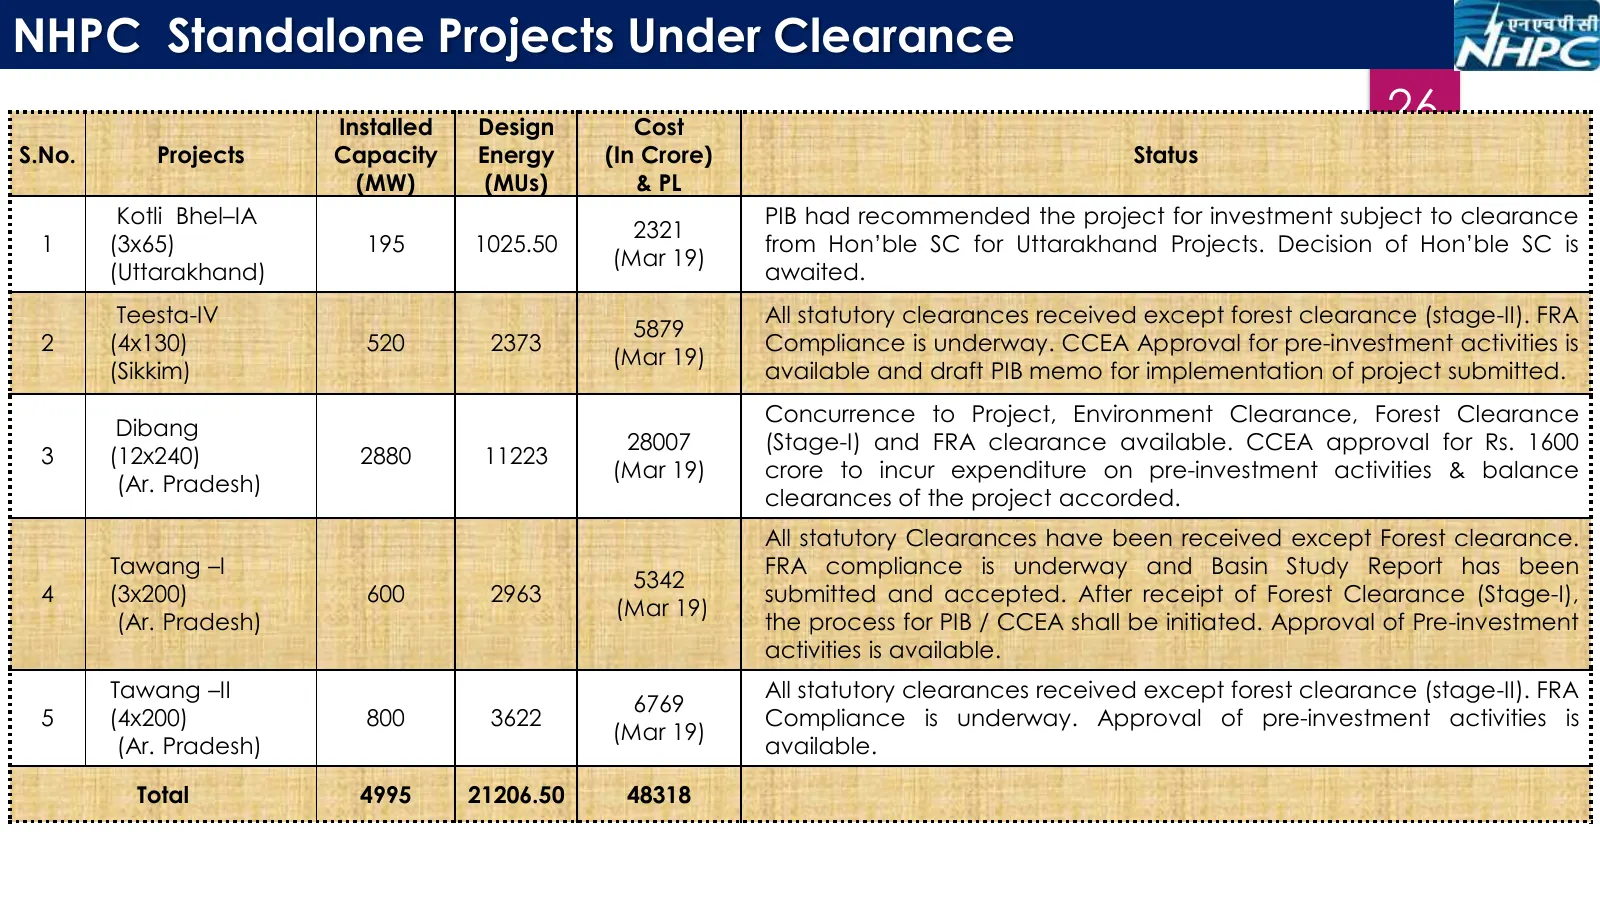
Slide 26: Standalone Projects Under Clearance
NHPC Standalone Projects Under Clearance Installed Design Cost 26 S.No. Projects Capacity Energy (In Crore) Status (MW) (MUs) & PL Kotli Bhel–IA PIB had recommended the project for investment subject to clearance 2321 1 (3x65) 195 1025.50 from Hon’ble SC for Uttarakhand Projects. Decision of Hon’ble
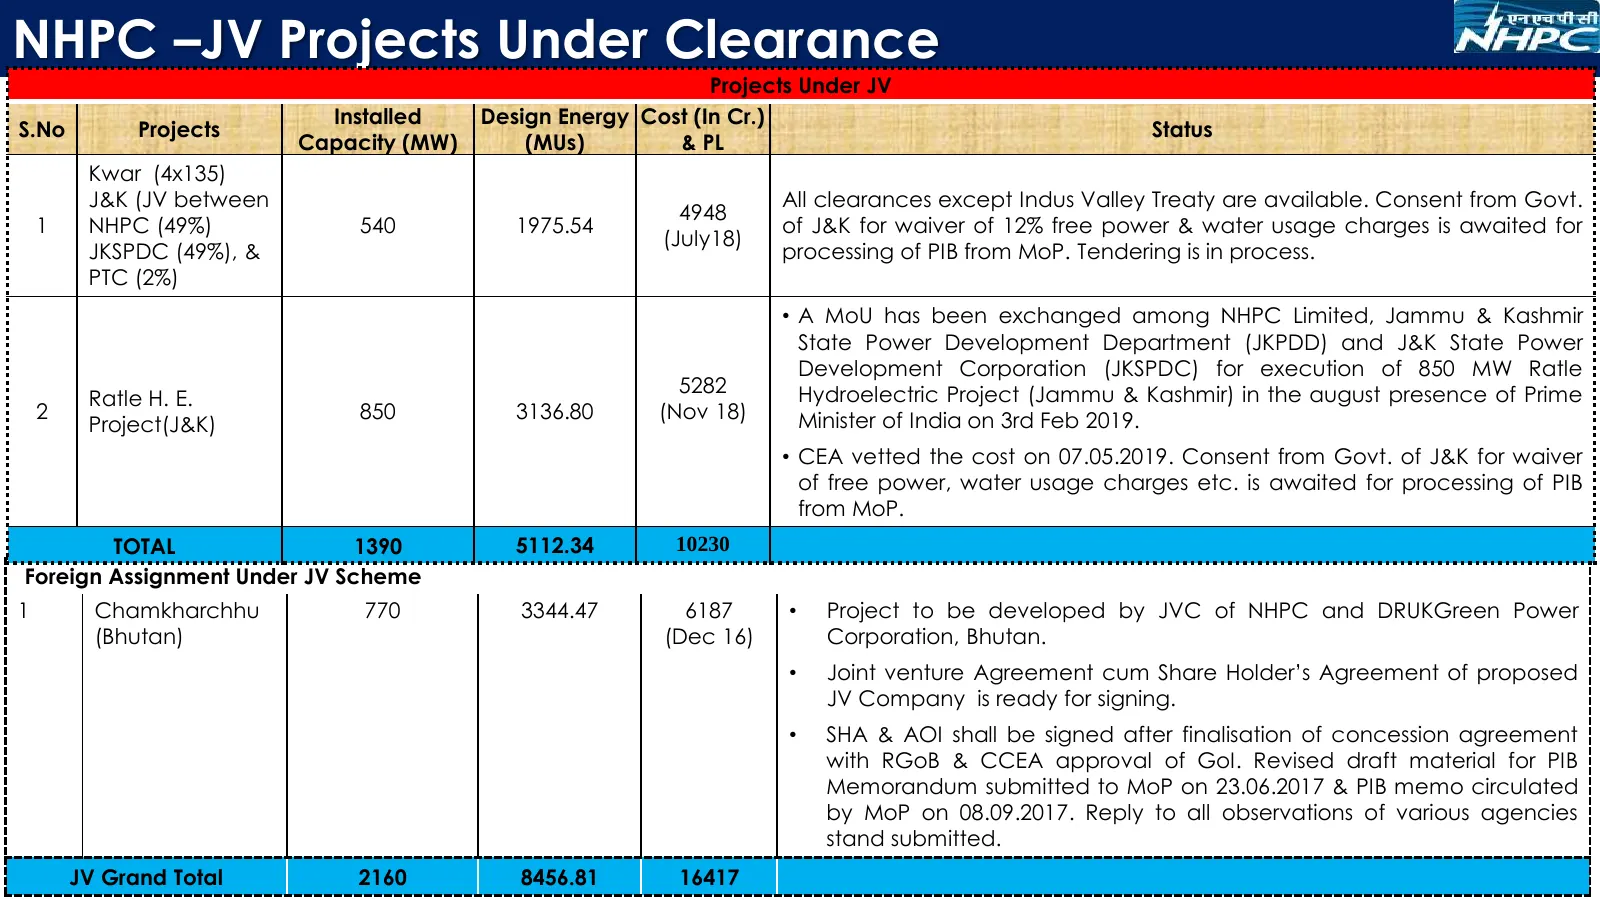
Slide 27: JV Projects Under Clearance
NHPC –JV Projects Under Clearance Projects Under JV S.No Projects Installed Design Energy Cost (In Cr.) Status 27 Capacity (MW) (MUs) & PL Kwar (4x135) J&K (JV between All clearances except Indus Valley Treaty are available. Consent from Govt. 4948 1 NHPC (49%) 540 1975.54 of J&K for waiver of 12% f
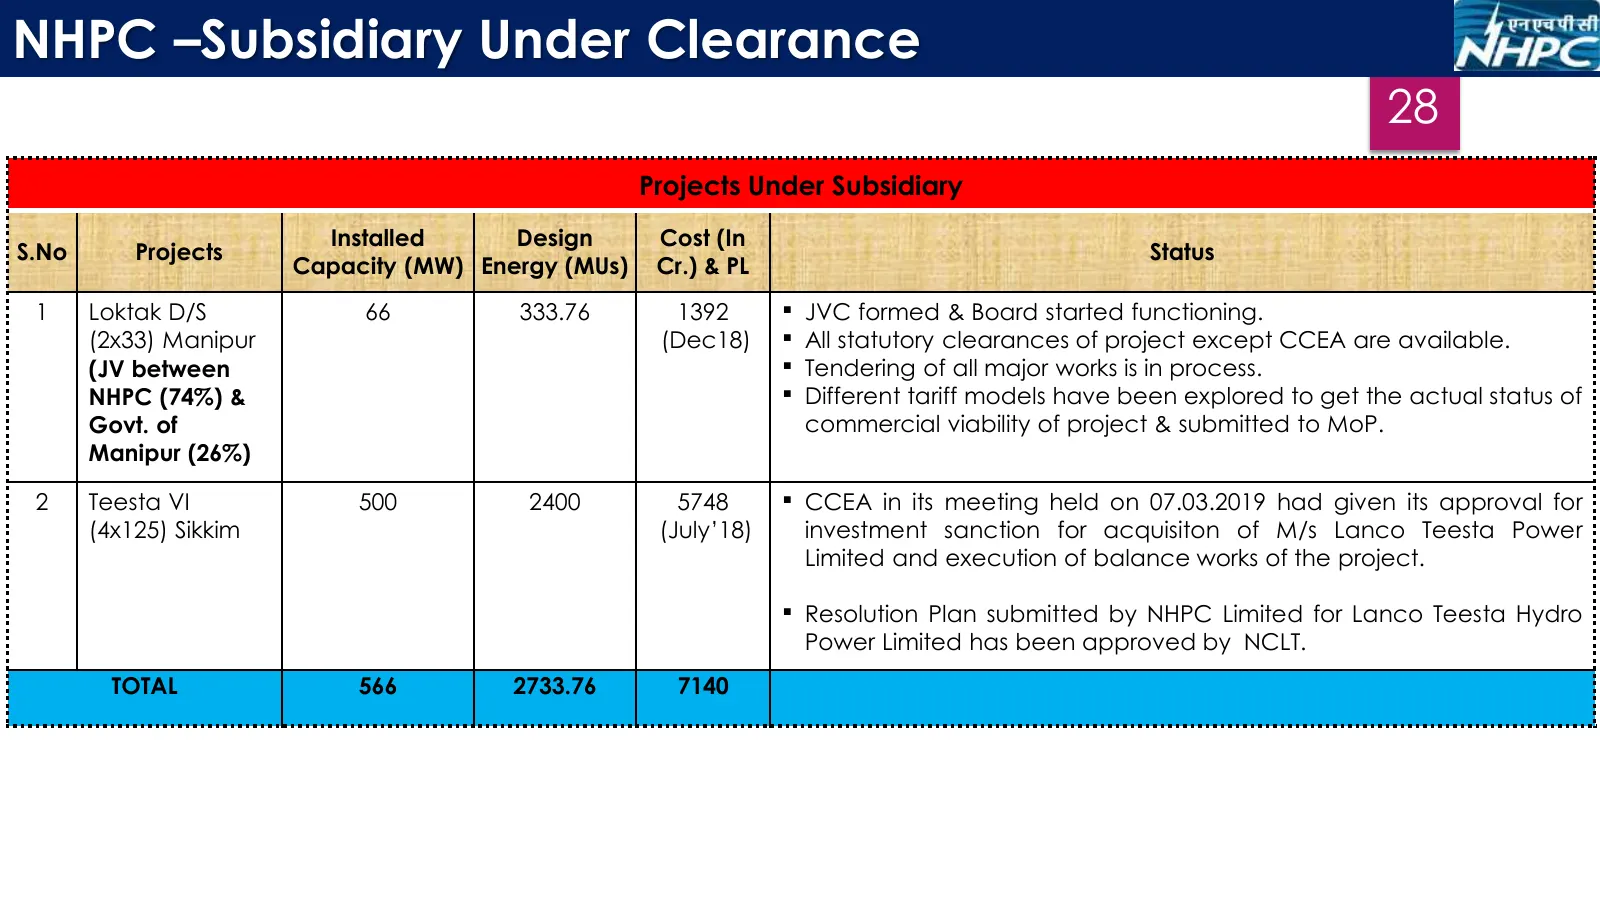
Slide 28: Subsidiary Under Clearance
NHPC –Subsidiary Under Clearance 28 Projects Under Subsidiary Installed Design Cost (In S.No Projects Status Capacity (MW) Energy (MUs) Cr.) & PL 1 Loktak D/S 66 333.76 1392 JVC formed & Board started functioning. (2x33) Manipur (Dec18) All statutory clearances of project except CCEA are availab
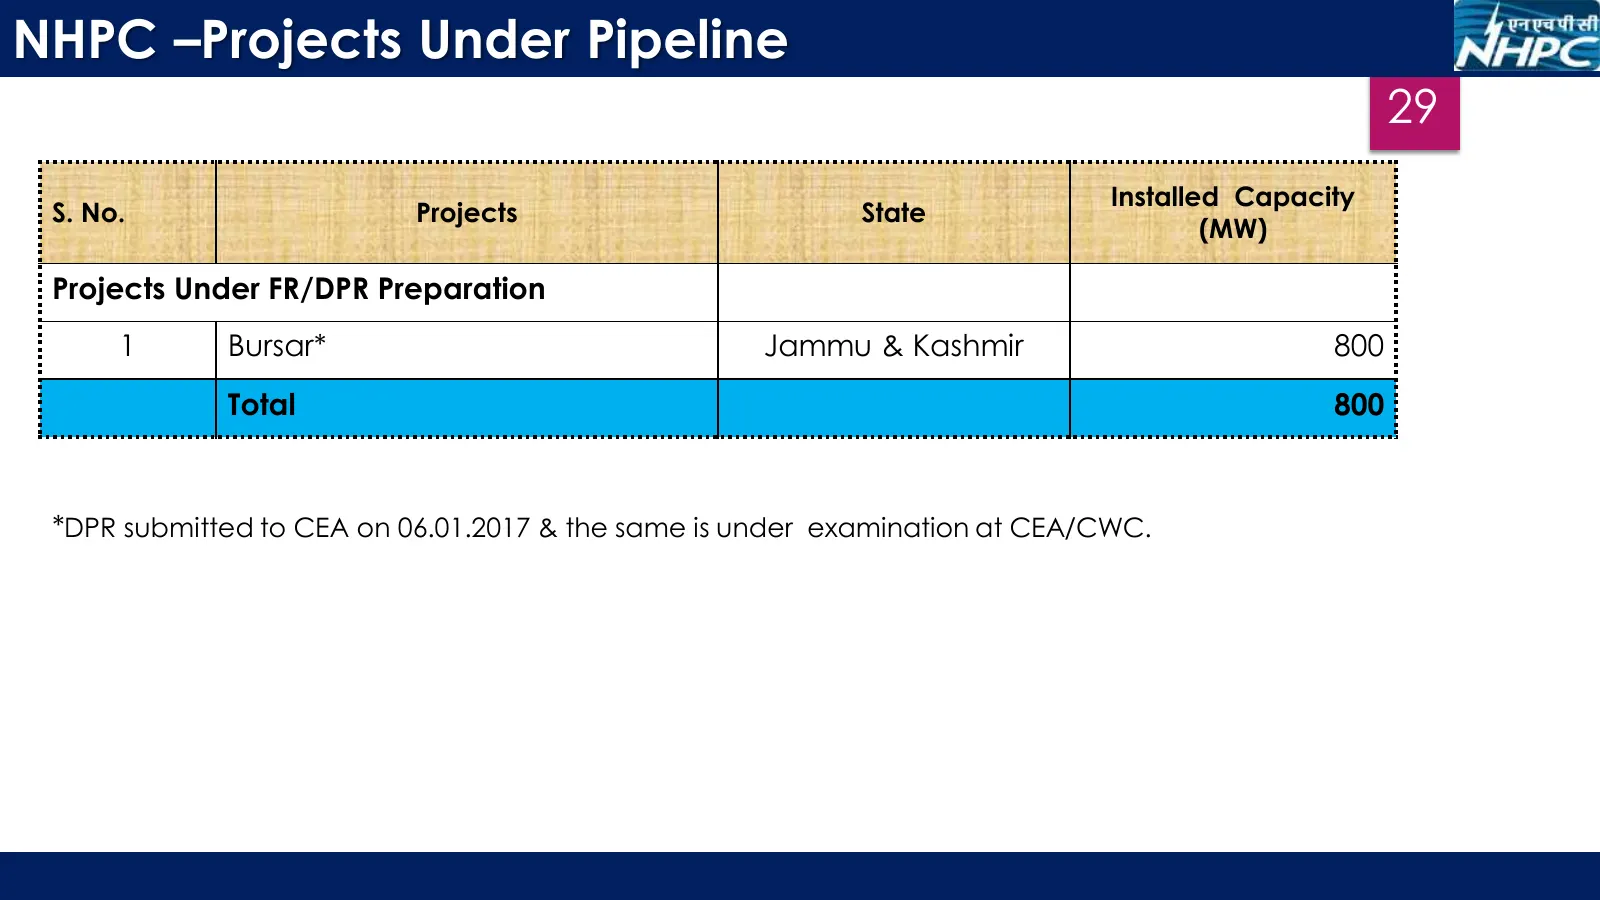
Slide 29: Projects Under Pipeline
NHPC –Projects Under Pipeline 29 Installed Capacity S. No. Projects State (MW) Projects Under FR/DPR Preparation 1 Bursar* Jammu & Kashmir 800 Total 800 *DPR submitted to CEA on 06.01.2017 & the same is under examination at CEA/CWC.
Slide 30: NHPC-Energising India With Hydropower
30 NHPC-Energising India With Hydropower
Source: Internet Archive copy of nhpcindia.com
More decks from NHPC Limited
 Investor Presentation (June 2026)49 slides · June 2026
 Investor Presentation (March 2026)48 slides · March 2026
 Investor Presentation (December 2025)49 slides · December 2025
 Investor Presentation (September 2025)49 slides · September 2025
 Investor Presentation (June 2025)51 slides · June 2025
 Investor Presentation (May 2025)49 slides · May 2025