Tiger Brands Limited · JSE:TBS
Tiger Brands — H1 2014 Earnings Presentation
86 slides from Tiger Brands's earnings presentation, March 2014

Slide 1: Tiger Brands Limited Results Presentation to Investors
www.tigerbrands.com TIGER BRANDS LIMITED RESULTS PRESENTATION TO INVESTORS for the six months ended 31 March 2014
Slide 2: Agenda
2 Agenda Business Strategic Review Financial Analysis Performance Nigeria Business Business Business Performance Performance Performance Grains Consumer Brands International Outlook

Slide 3: Strategic Review
www.tigerbrands.com Strategic Review Peter Matlare Chief Executive Officer
Slide 4: Overview
4 Group Nigeria Grains Consumer Brands Exports and International OVERVIEW • South African trading conditions remain tough – Household income significantly constrained – Highly competitive retail environment as retail sales slow – Escalation in raw material, labour and input costs • Pleasing performa
Slide 5: Global economy recovering slowly but Sub-Saharan Africa growth prospects encouraging
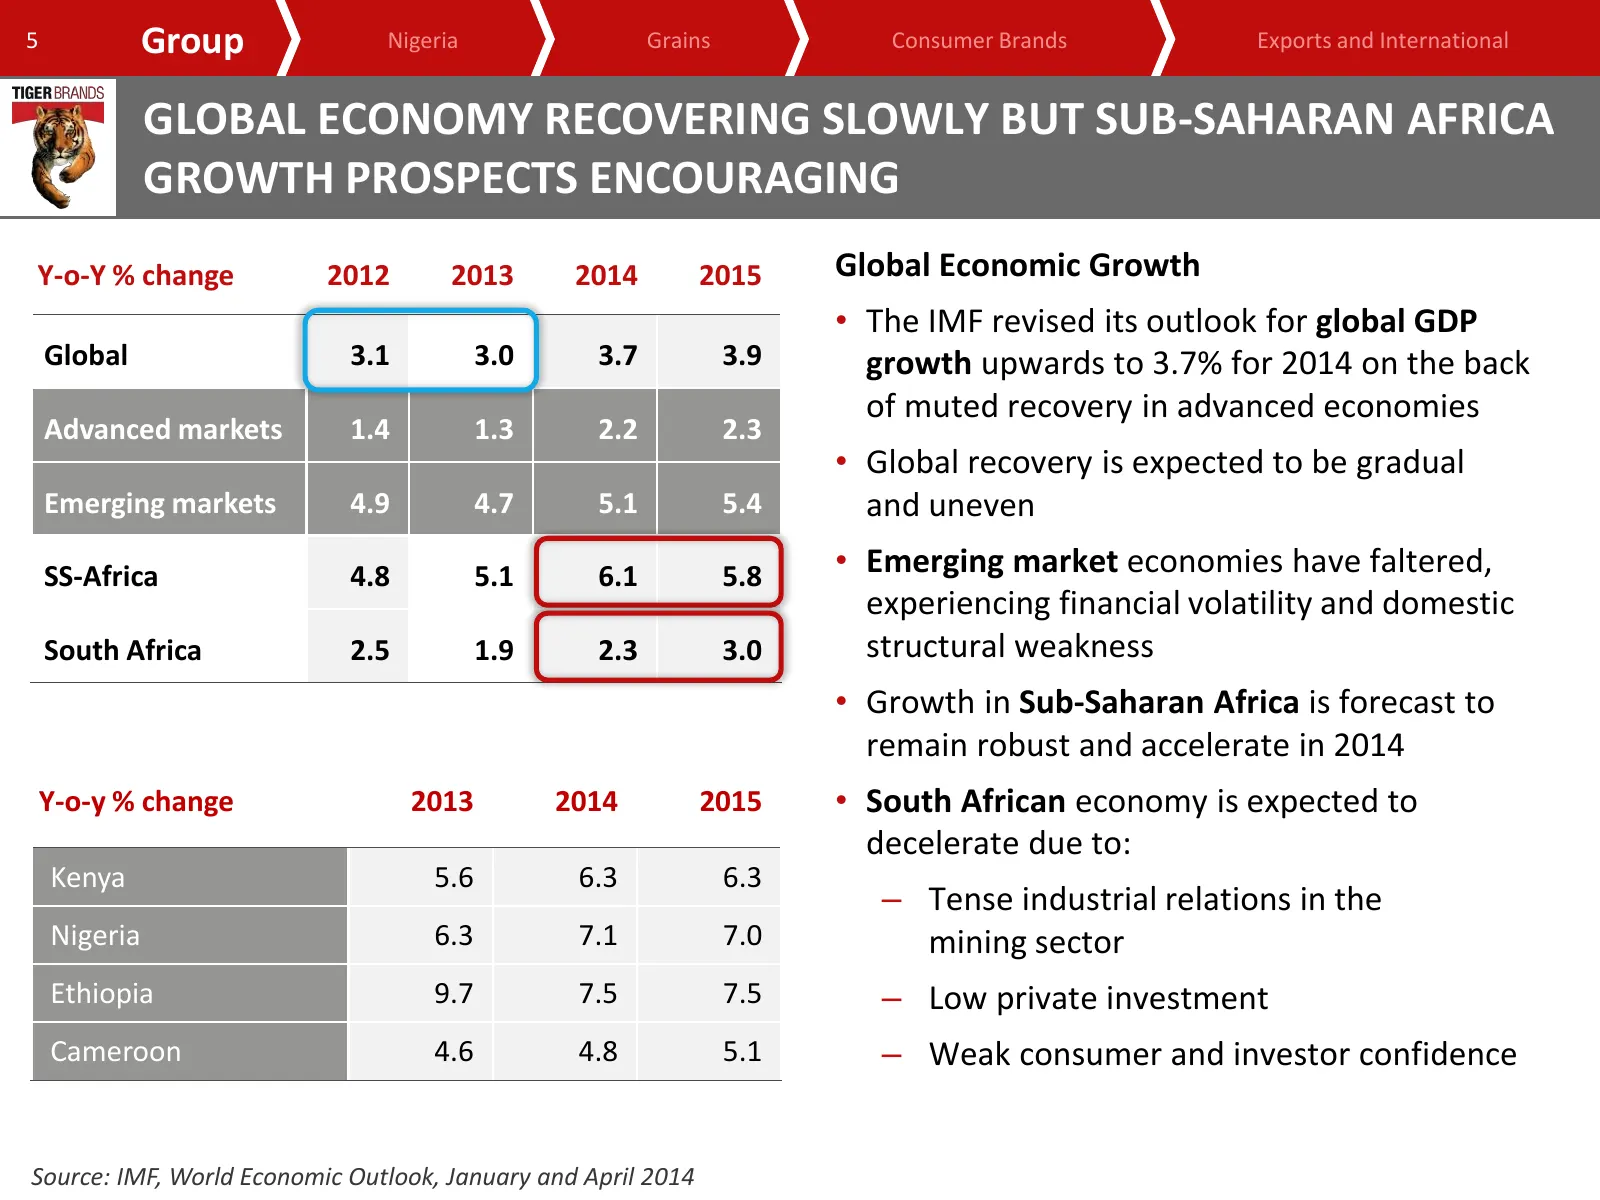
5 Group Nigeria Grains Consumer Brands Exports and International GLOBAL ECONOMY RECOVERING SLOWLY BUT SUB-SAHARAN AFRICA GROWTH PROSPECTS ENCOURAGING Y-o-Y % change 2012 2013 2014 2015 Global Economic Growth • The IMF revised its outlook for global GDP Global 3.1 3.0 3.7 3.9 growth upwards to 3.7% f
Slide 6: Market trends show slow recovery for categories in which Tiger Brands participates
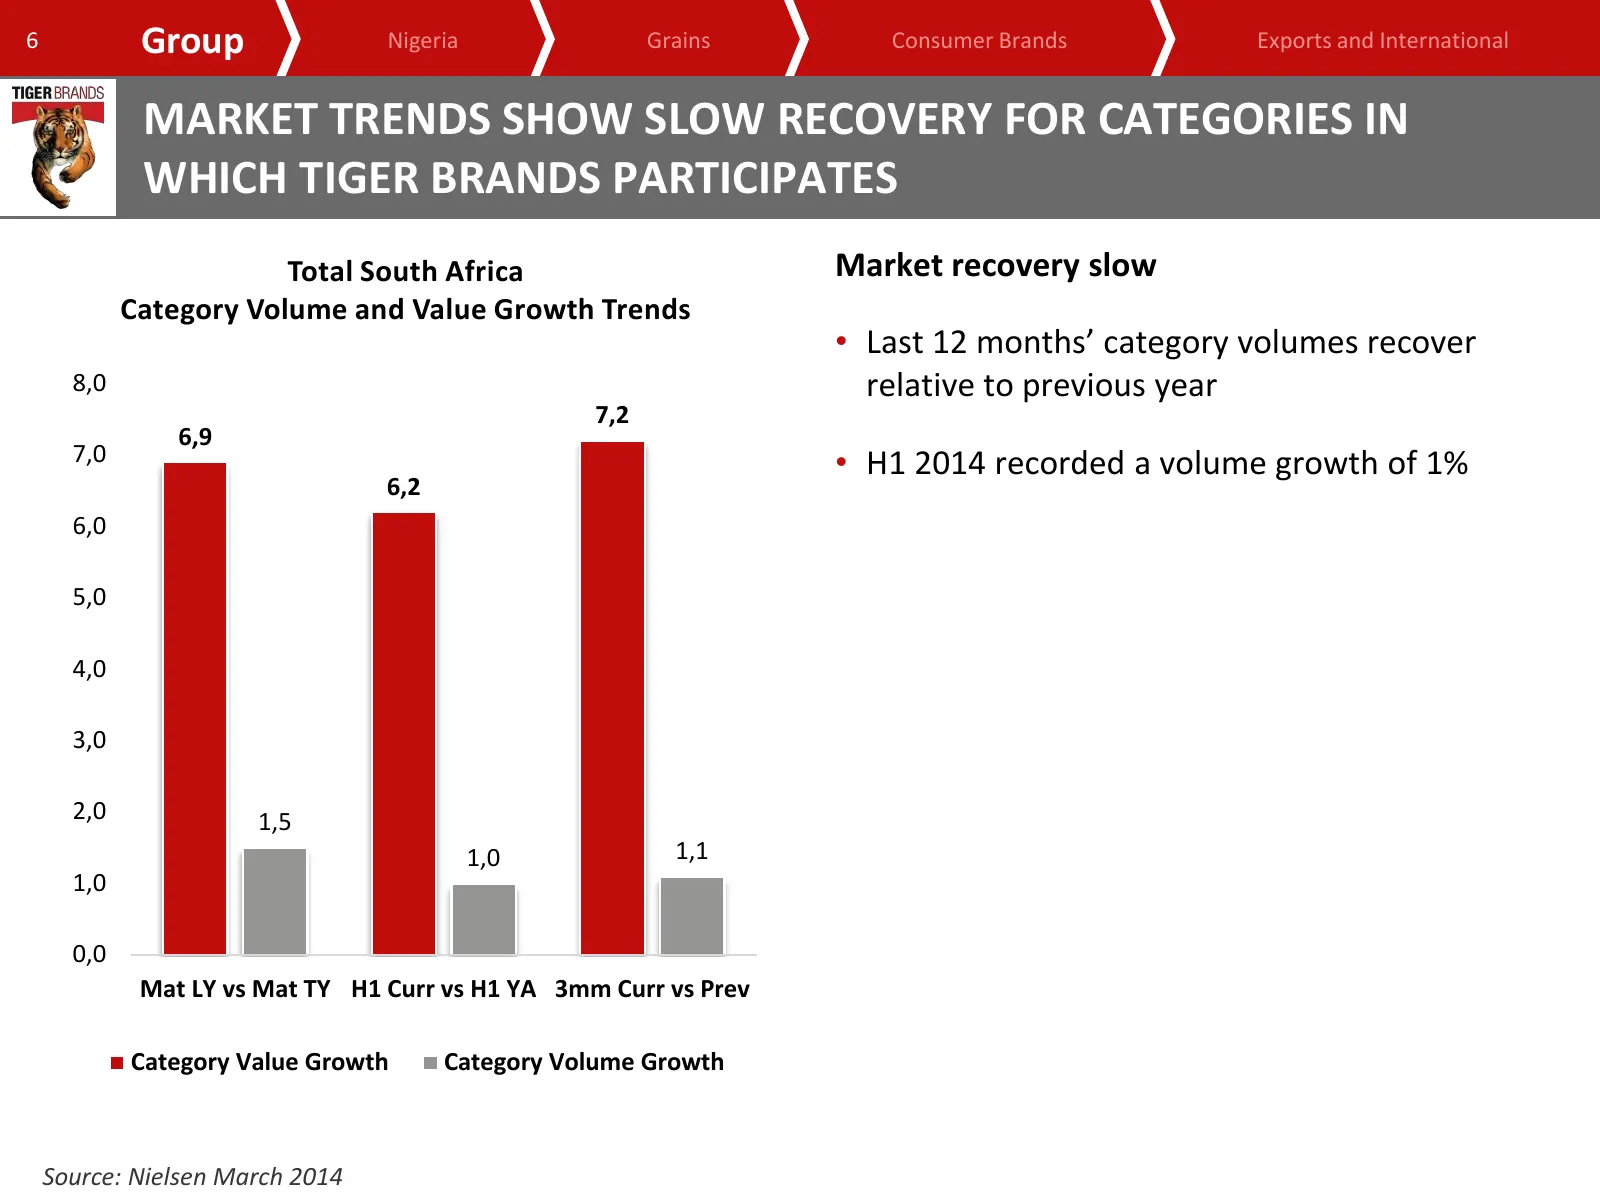
6 Group Nigeria Grains Consumer Brands Exports and International MARKET TRENDS SHOW SLOW RECOVERY FOR CATEGORIES IN WHICH TIGER BRANDS PARTICIPATES Total South Africa Market recovery slow Category Volume and Value Growth Trends • Last 12 months’ category volumes recover 8,0 relative to previous year
Slide 7: Strategic focus and business model
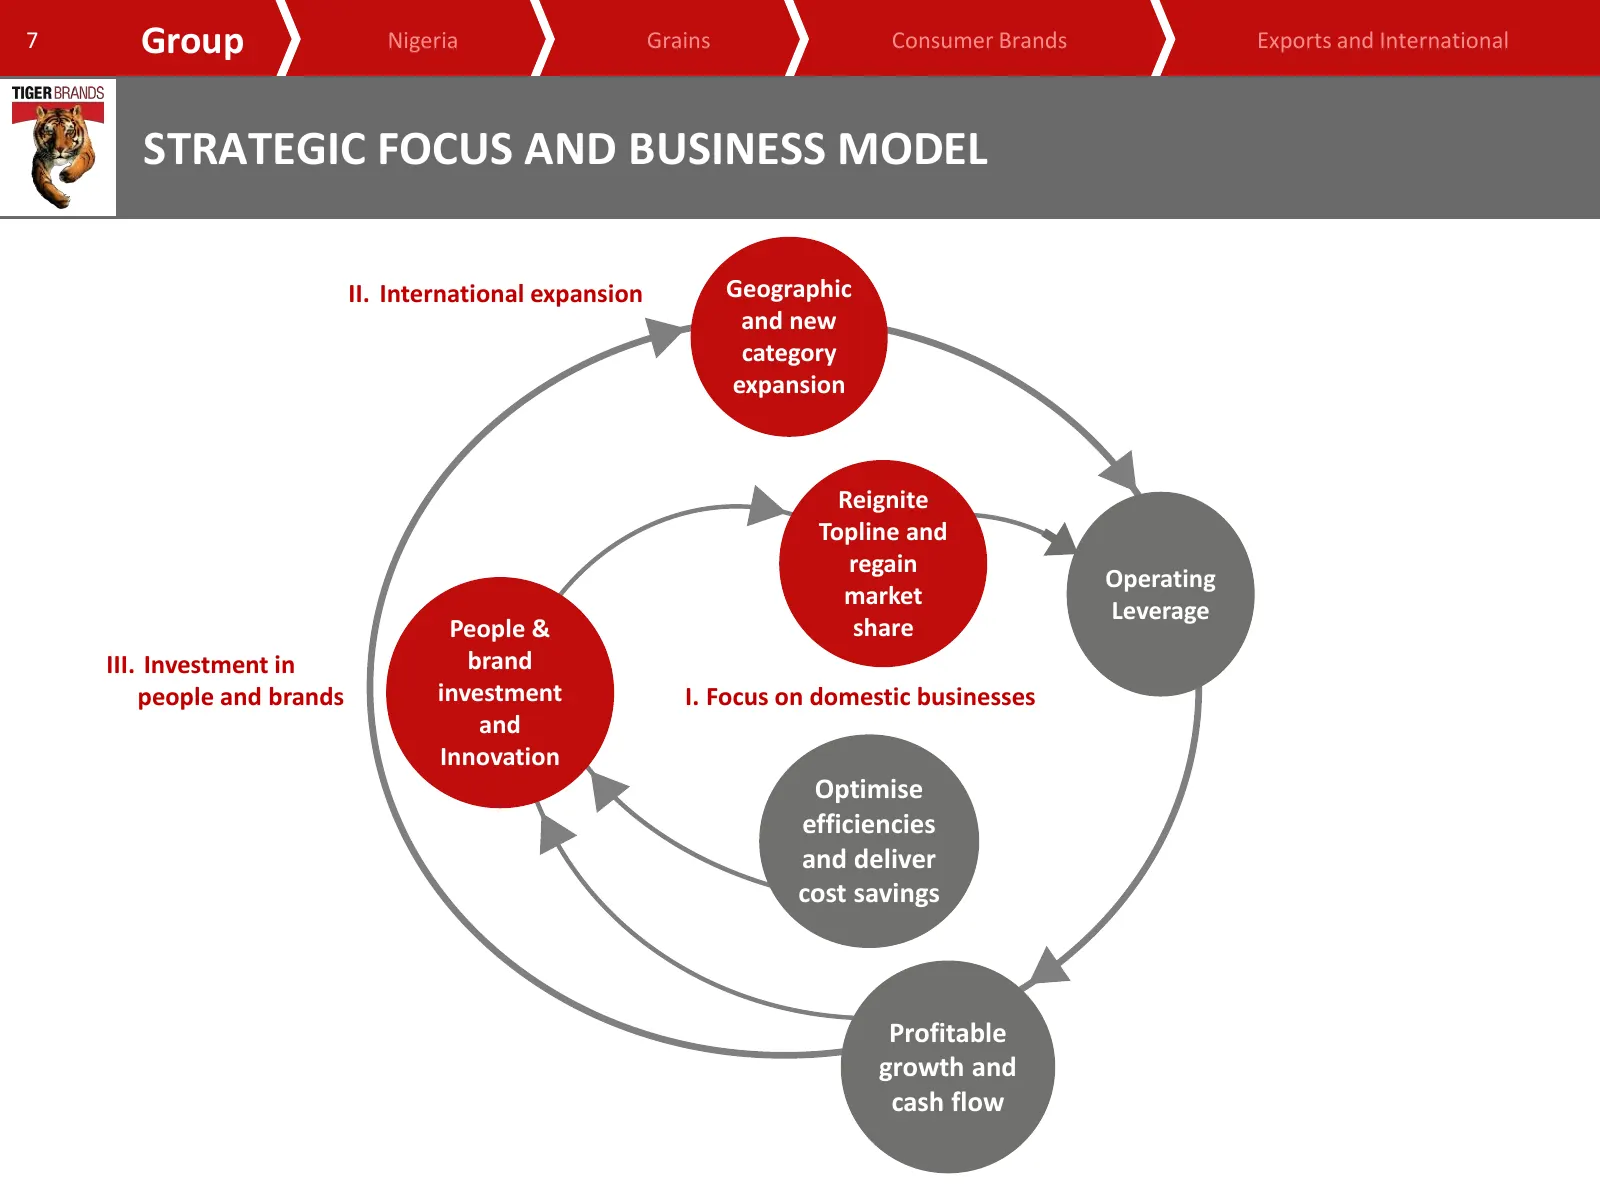
7 Group Nigeria Grains Consumer Brands Exports and International STRATEGIC FOCUS AND BUSINESS MODEL II. International expansion Geographic and new category expansion Reignite Topline and regain Operating market Leverage People & share III. Investment in brand people and brands investment I. Focus on
Slide 8: Strategic thrusts – domestic businesses
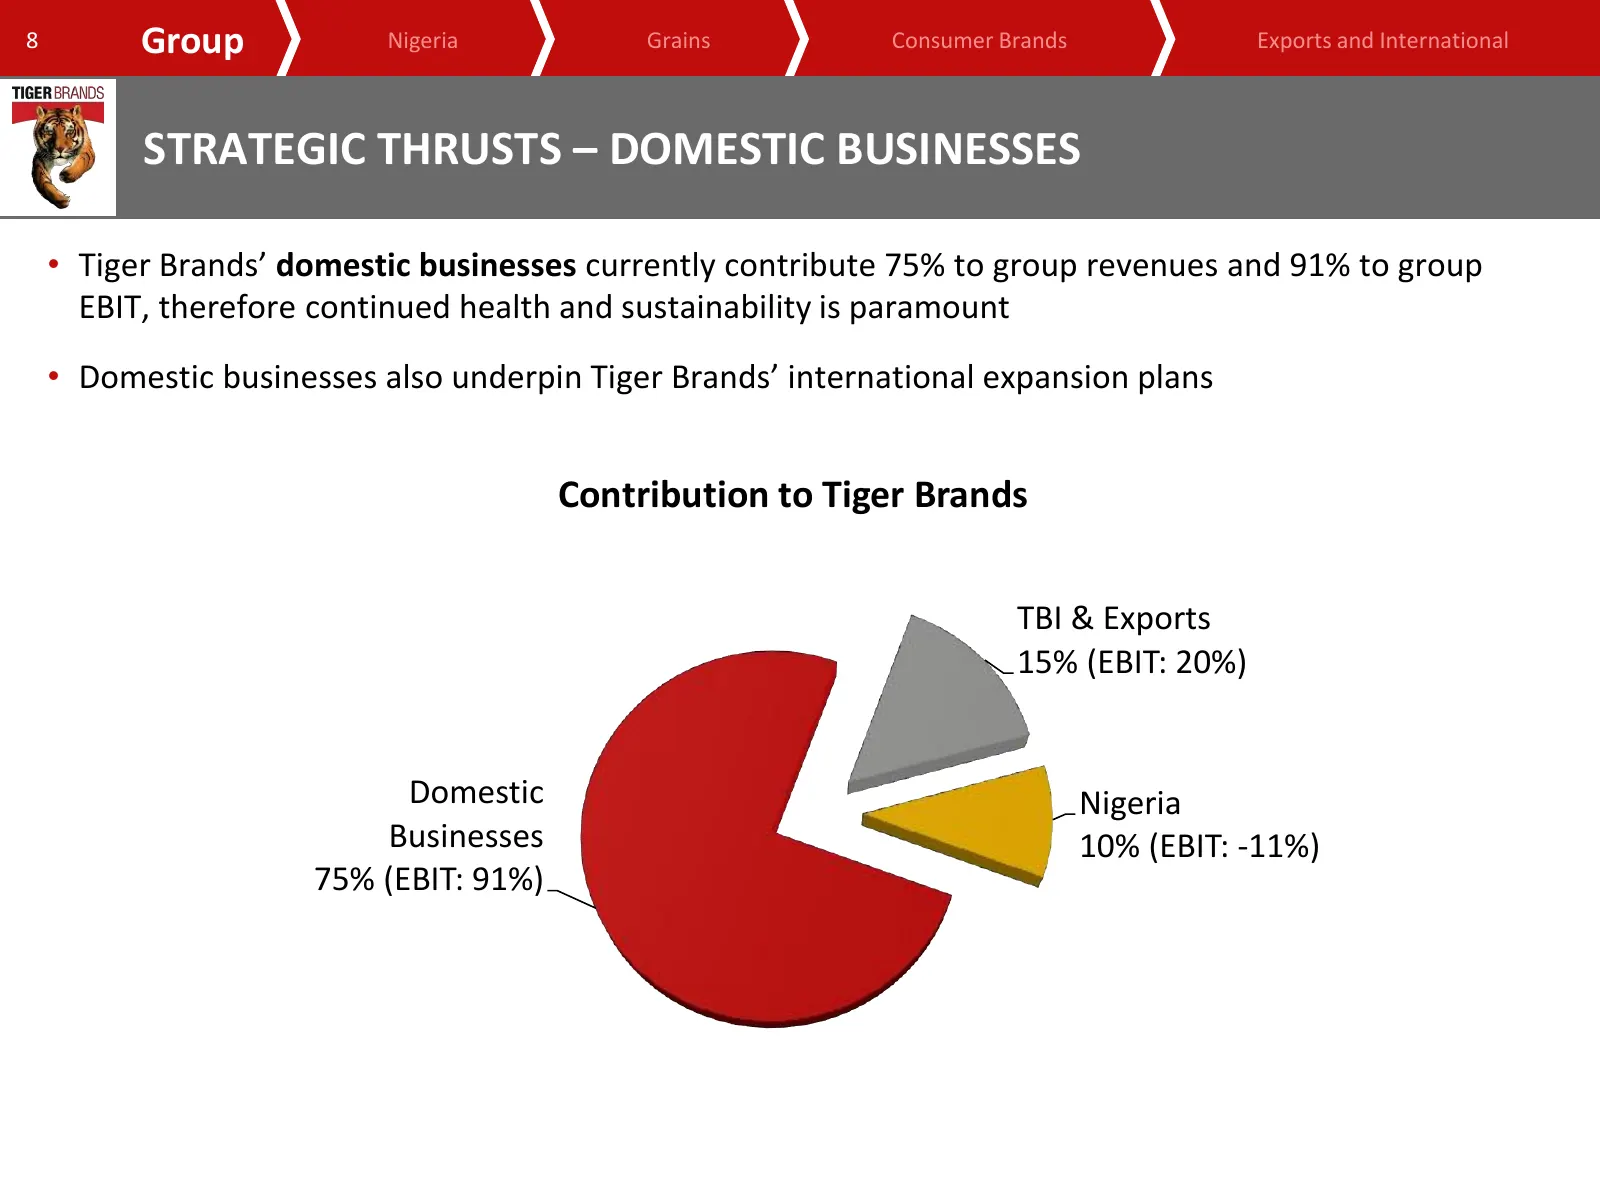
8 Group Nigeria Grains Consumer Brands Exports and International STRATEGIC THRUSTS – DOMESTIC BUSINESSES • Tiger Brands’ domestic businesses currently contribute 75% to group revenues and 91% to group EBIT, therefore continued health and sustainability is paramount • Domestic businesses also underpi
Slide 9: Context for performance
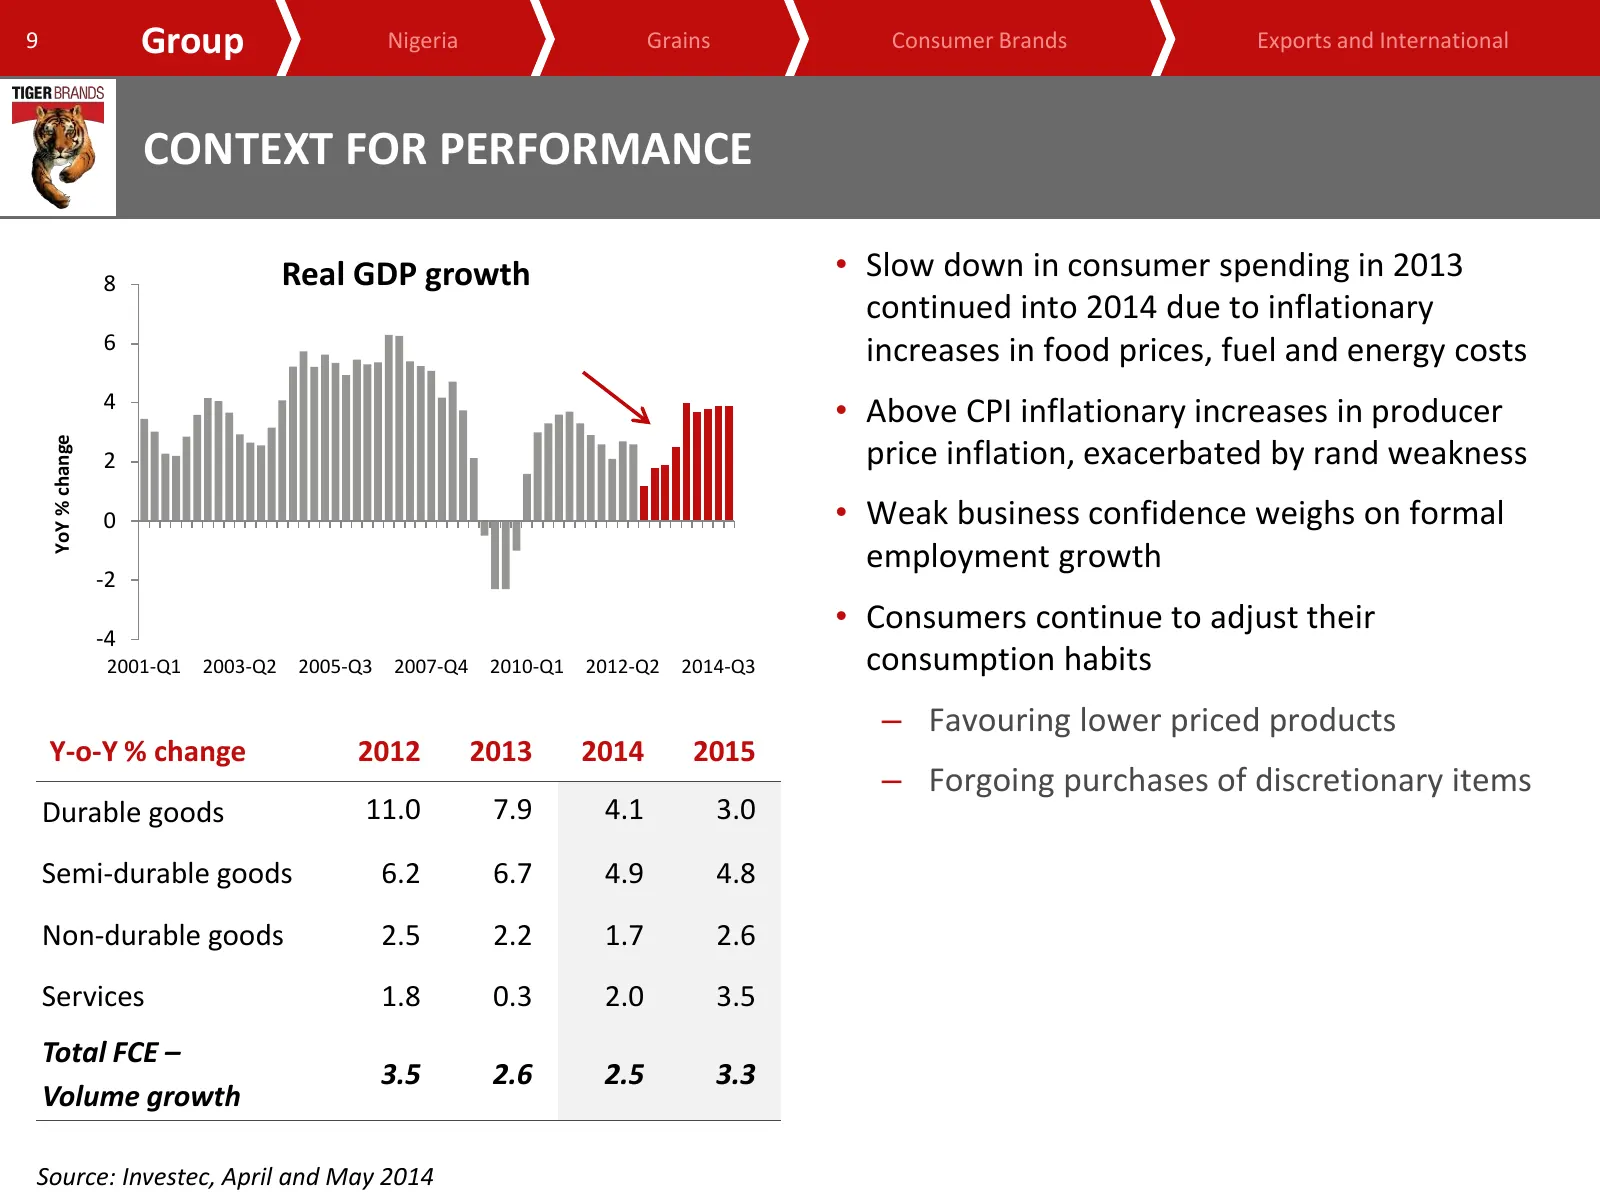
9 Group Nigeria Grains Consumer Brands Exports and International CONTEXT FOR PERFORMANCE 8 Real GDP growth • Slow down in consumer spending in 2013 continued into 2014 due to inflationary 6 increases in food prices, fuel and energy costs 4 • Above CPI inflationary increases in producer YoY % change
Slide 10: Domestic performance characterised by consumer search for value
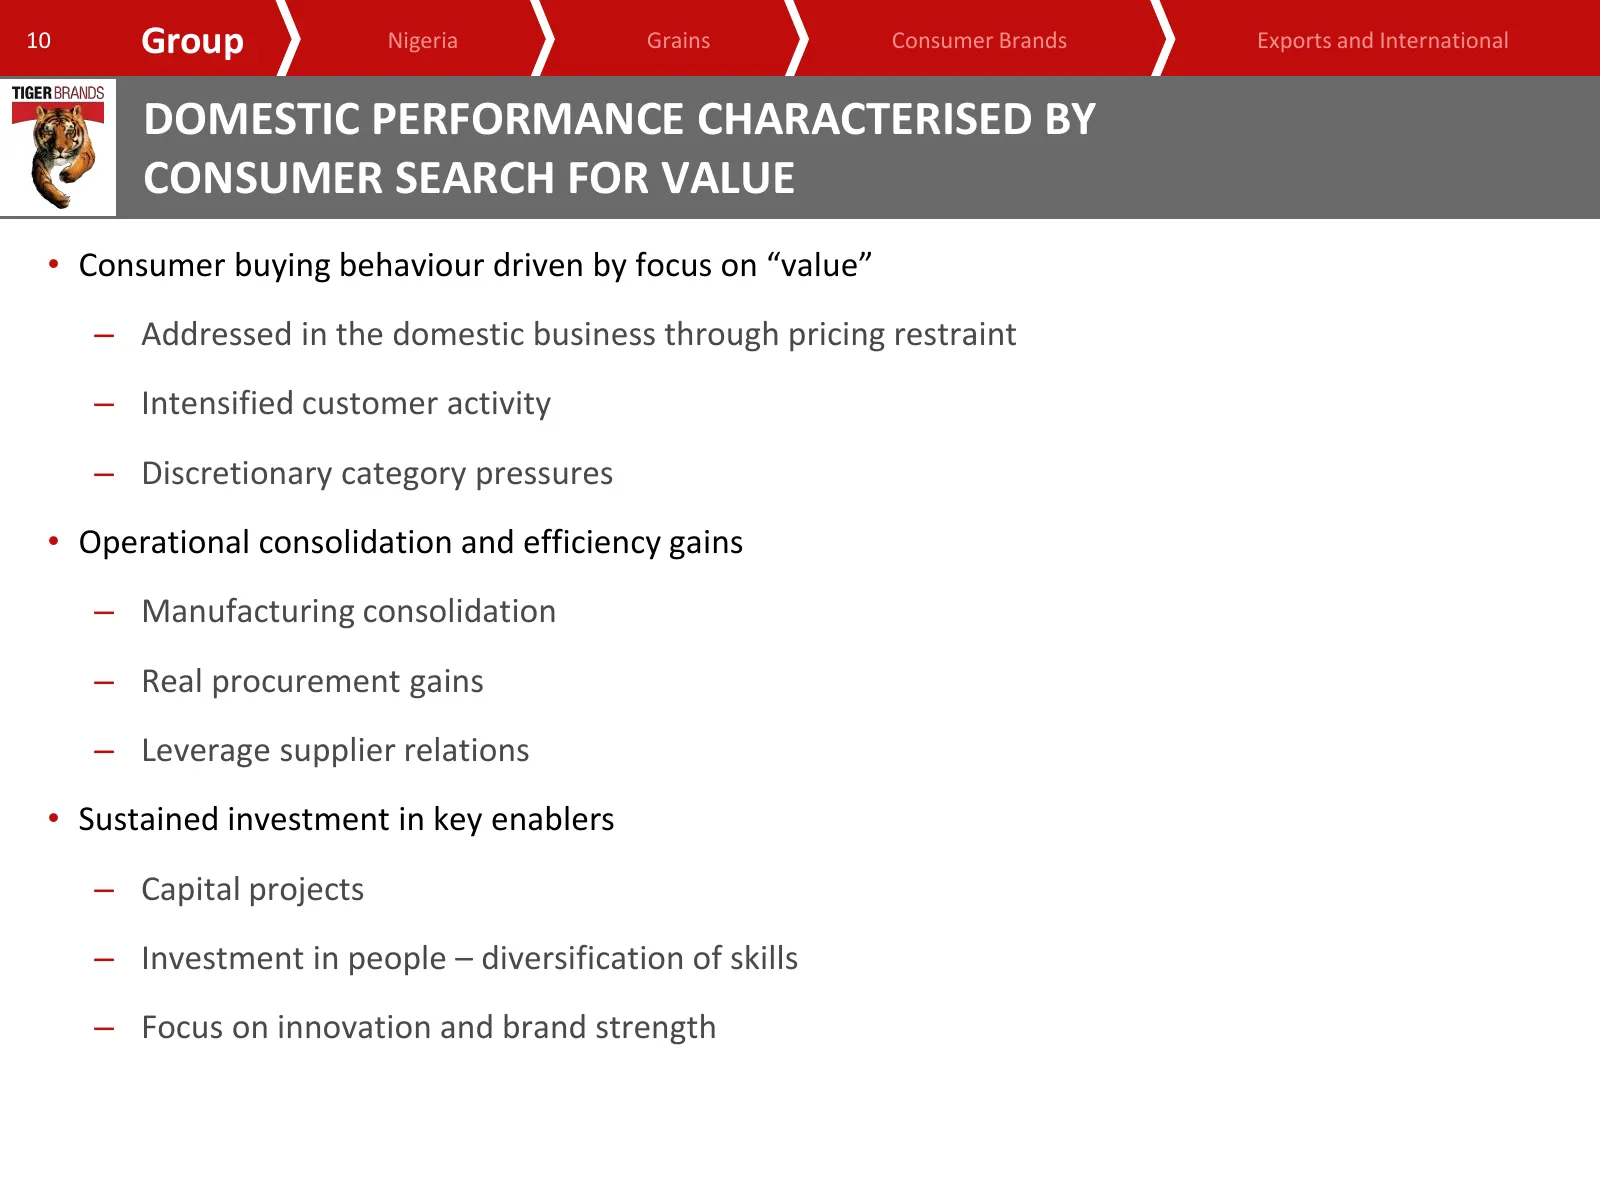
10 Group Nigeria Grains Consumer Brands Exports and International DOMESTIC PERFORMANCE CHARACTERISED BY CONSUMER SEARCH FOR VALUE • Consumer buying behaviour driven by focus on “value” – Addressed in the domestic business through pricing restraint – Intensified customer activity – Discretionary cate
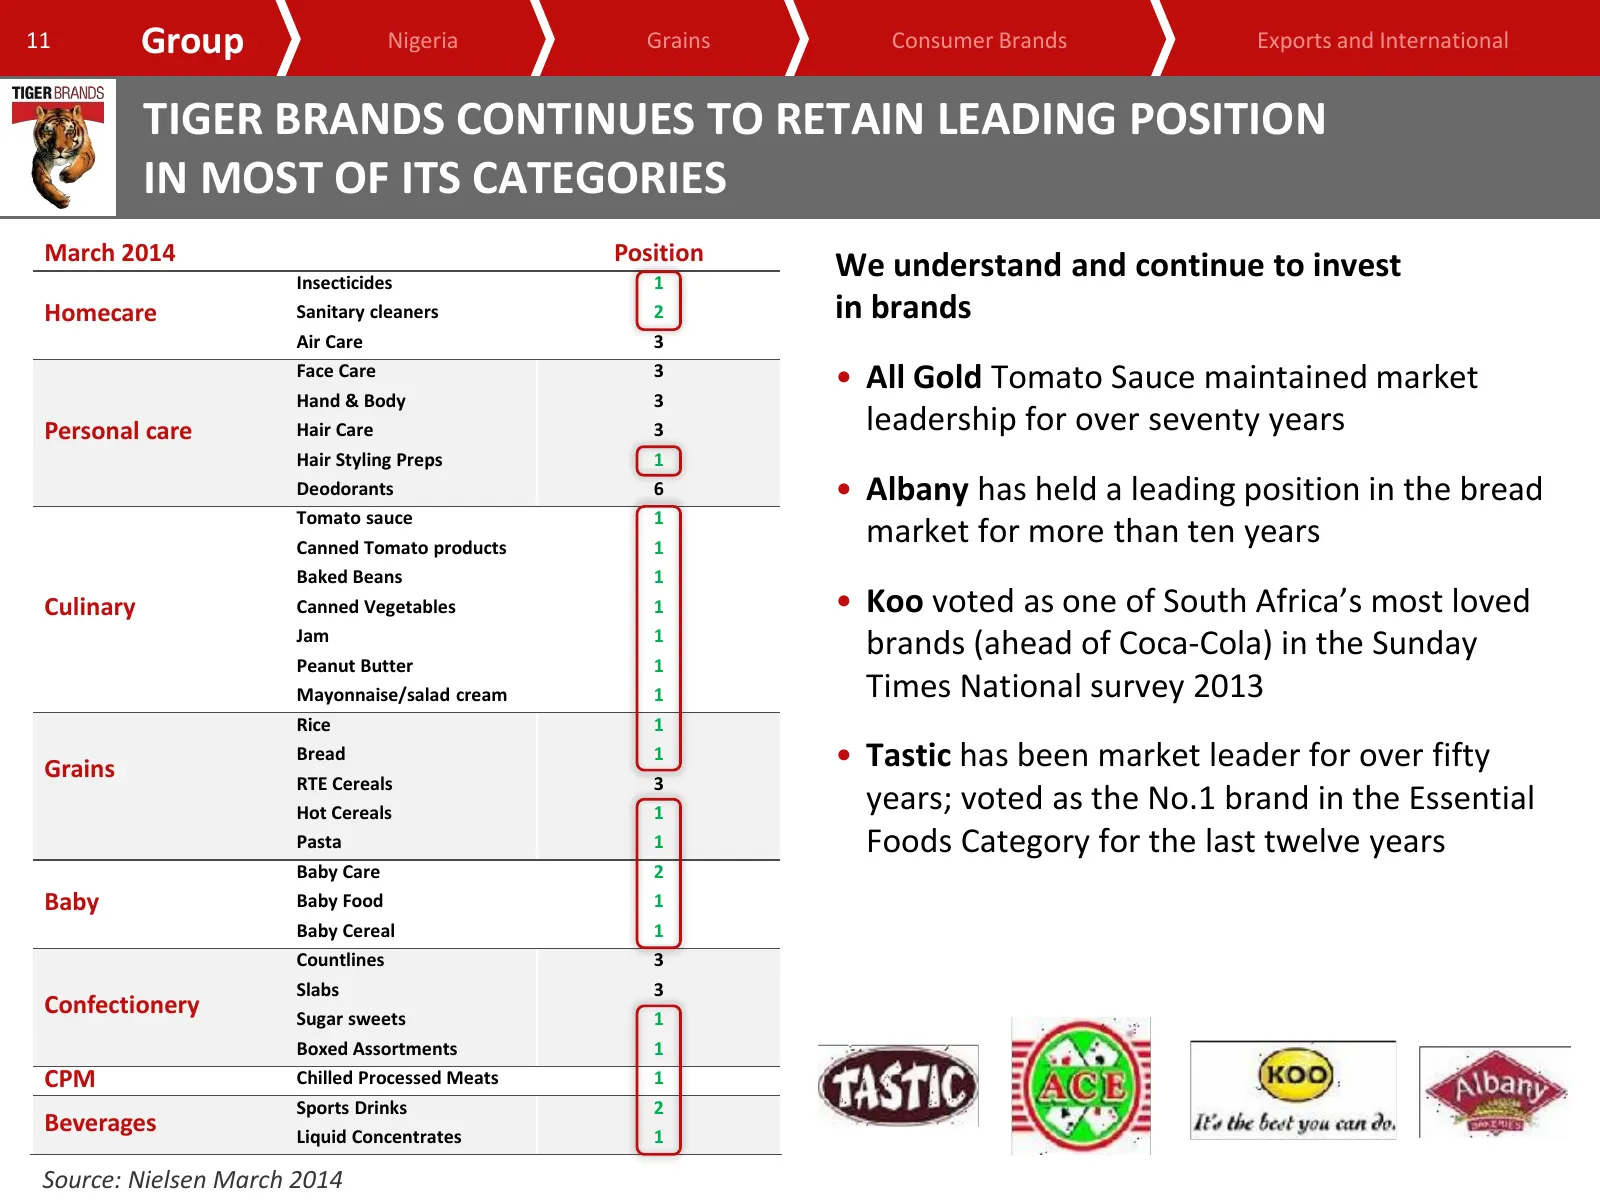
Slide 11: Tiger Brands continues to retain leading position in most of its categories
11 Group Nigeria Grains Consumer Brands Exports and International TIGER BRANDS CONTINUES TO RETAIN LEADING POSITION IN MOST OF ITS CATEGORIES March 2014 Position Insecticides 1 We understand and continue to invest Homecare Sanitary cleaners 2 in brands Air Care 3 Face Care 3 • All Gold Tomato Sauce
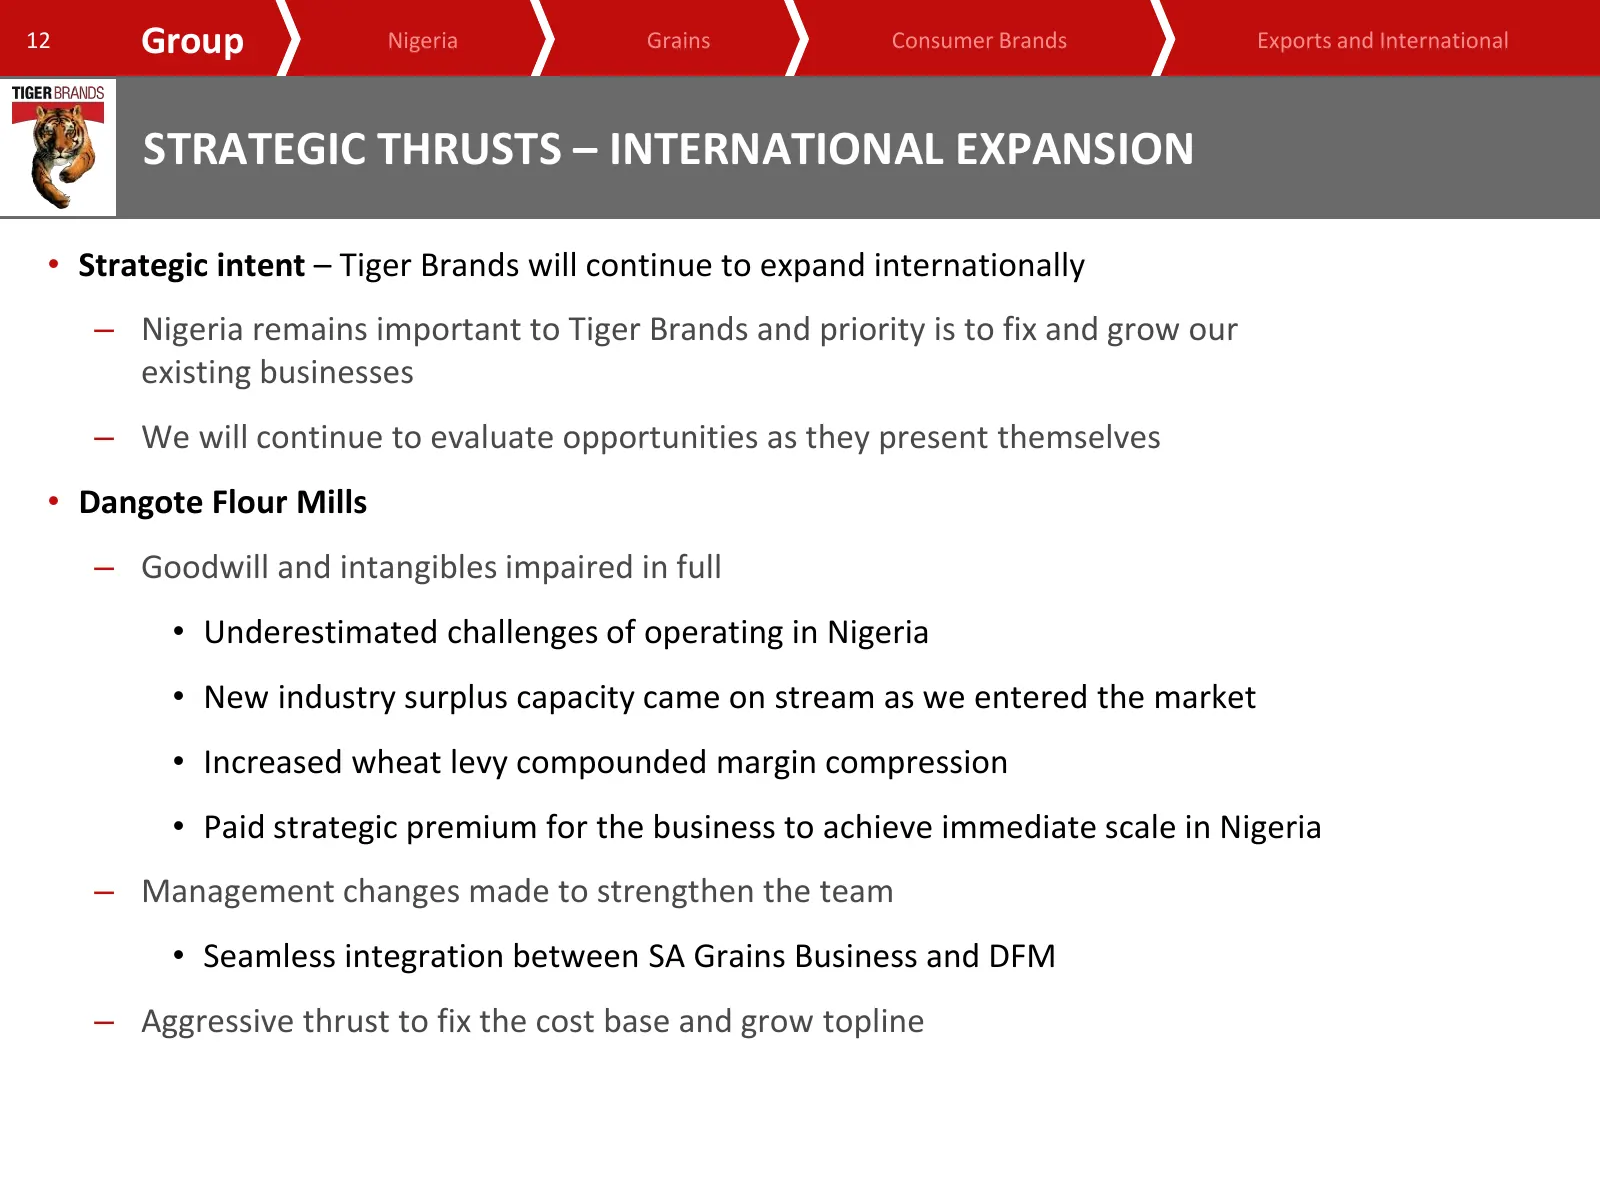
Slide 12: Strategic thrusts – international expansion
12 Group Nigeria Grains Consumer Brands Exports and International STRATEGIC THRUSTS – INTERNATIONAL EXPANSION • Strategic intent – Tiger Brands will continue to expand internationally – Nigeria remains important to Tiger Brands and priority is to fix and grow our existing businesses – We will contin
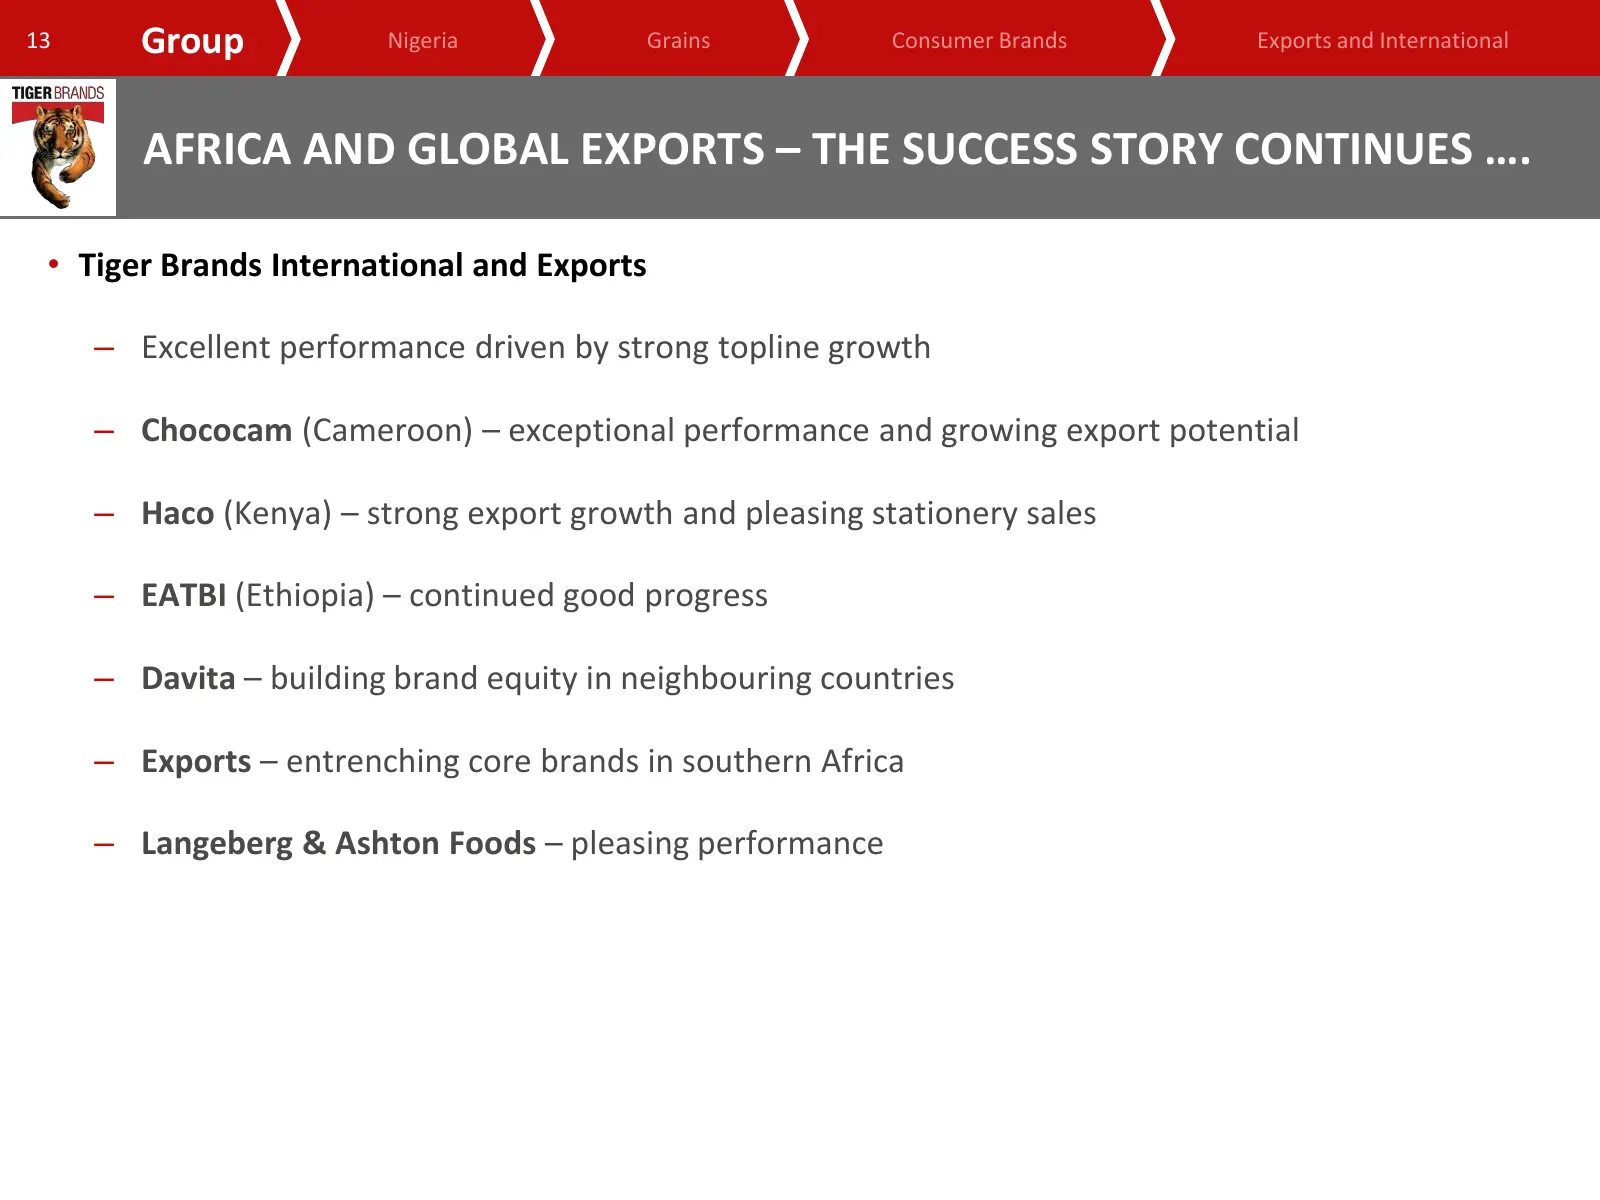
Slide 13: Africa and global exports – the success story continues
13 Group Nigeria Grains Consumer Brands Exports and International AFRICA AND GLOBAL EXPORTS – THE SUCCESS STORY CONTINUES …. • Tiger Brands International and Exports – Excellent performance driven by strong topline growth – Chococam (Cameroon) – exceptional performance and growing export potential –
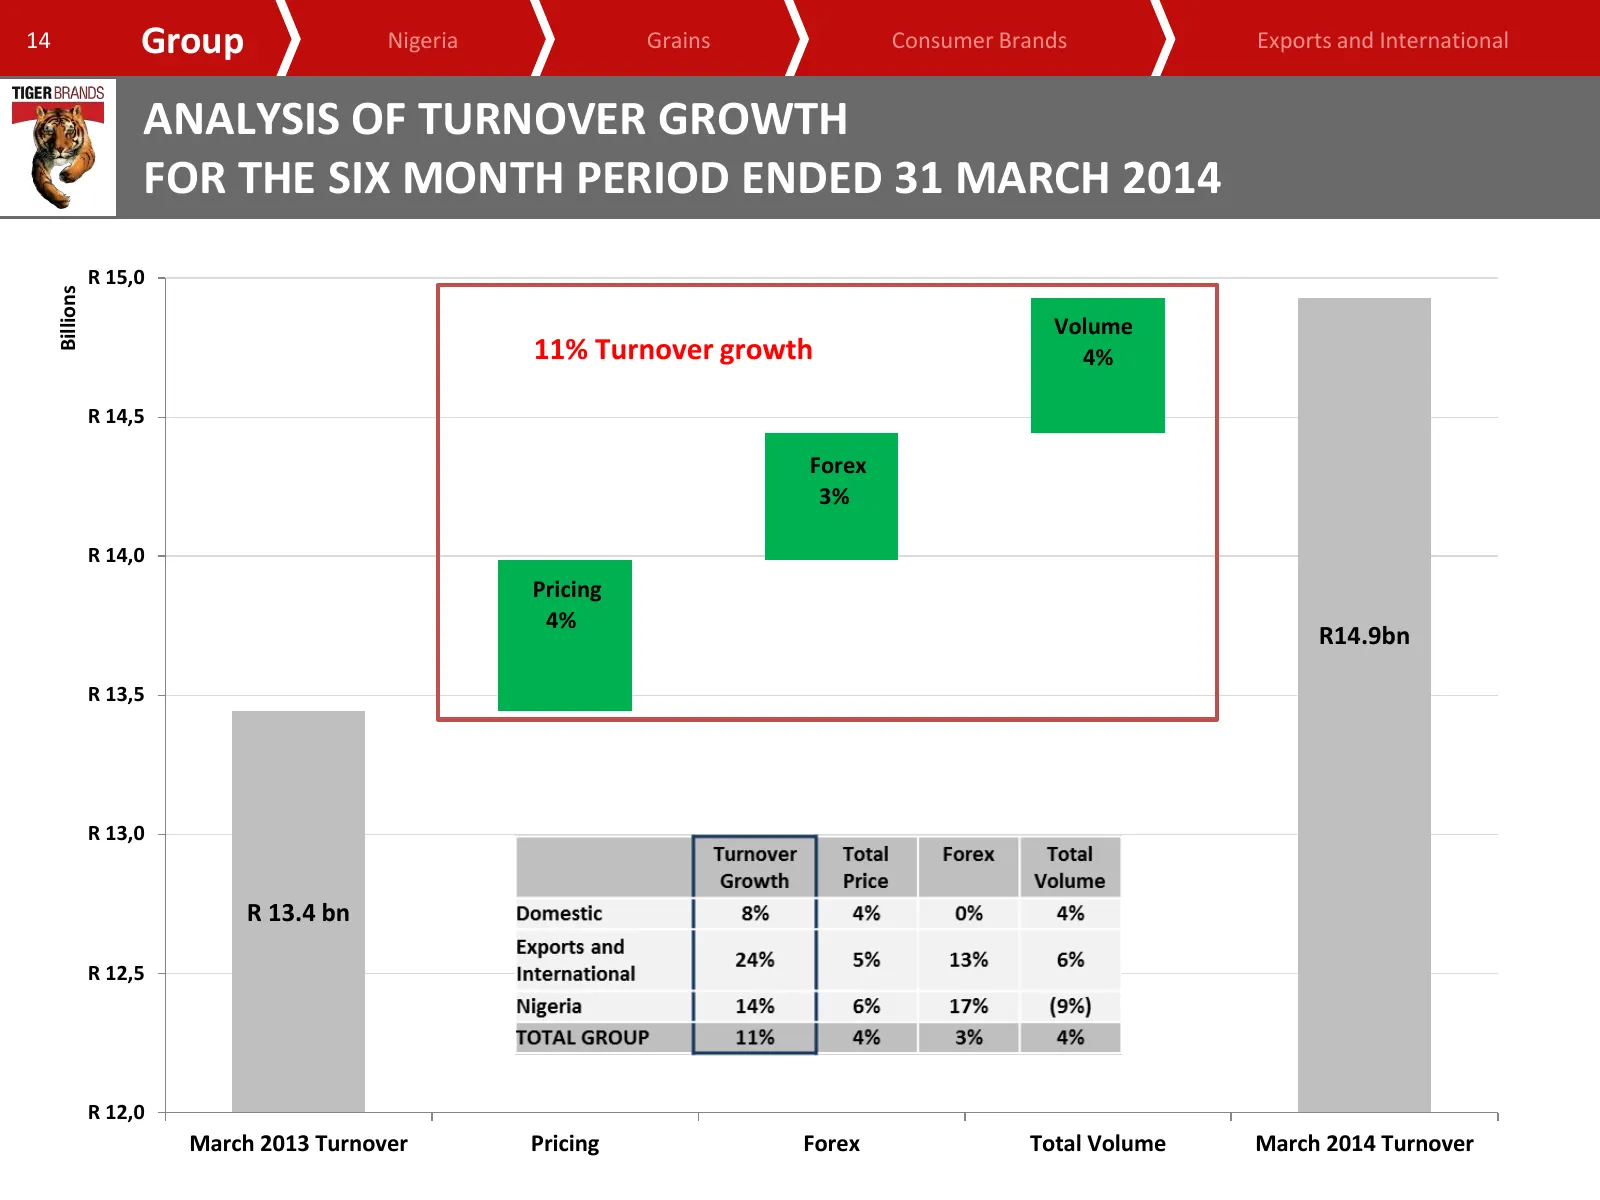
Slide 14: Analysis of turnover growth
14 Group Nigeria Grains Consumer Brands Exports and International ANALYSIS OF TURNOVER GROWTH FOR THE SIX MONTH PERIOD ENDED 31 MARCH 2014 R 15,0 Billions Volume 11% Turnover growth 4% R 14,5 Forex 3% R 14,0 Pricing 4% R14.9bn R 13,5 R 13,0 R 13.4 bn R 12,5 R 12,0 March 2013 Turnover Pricing Forex T
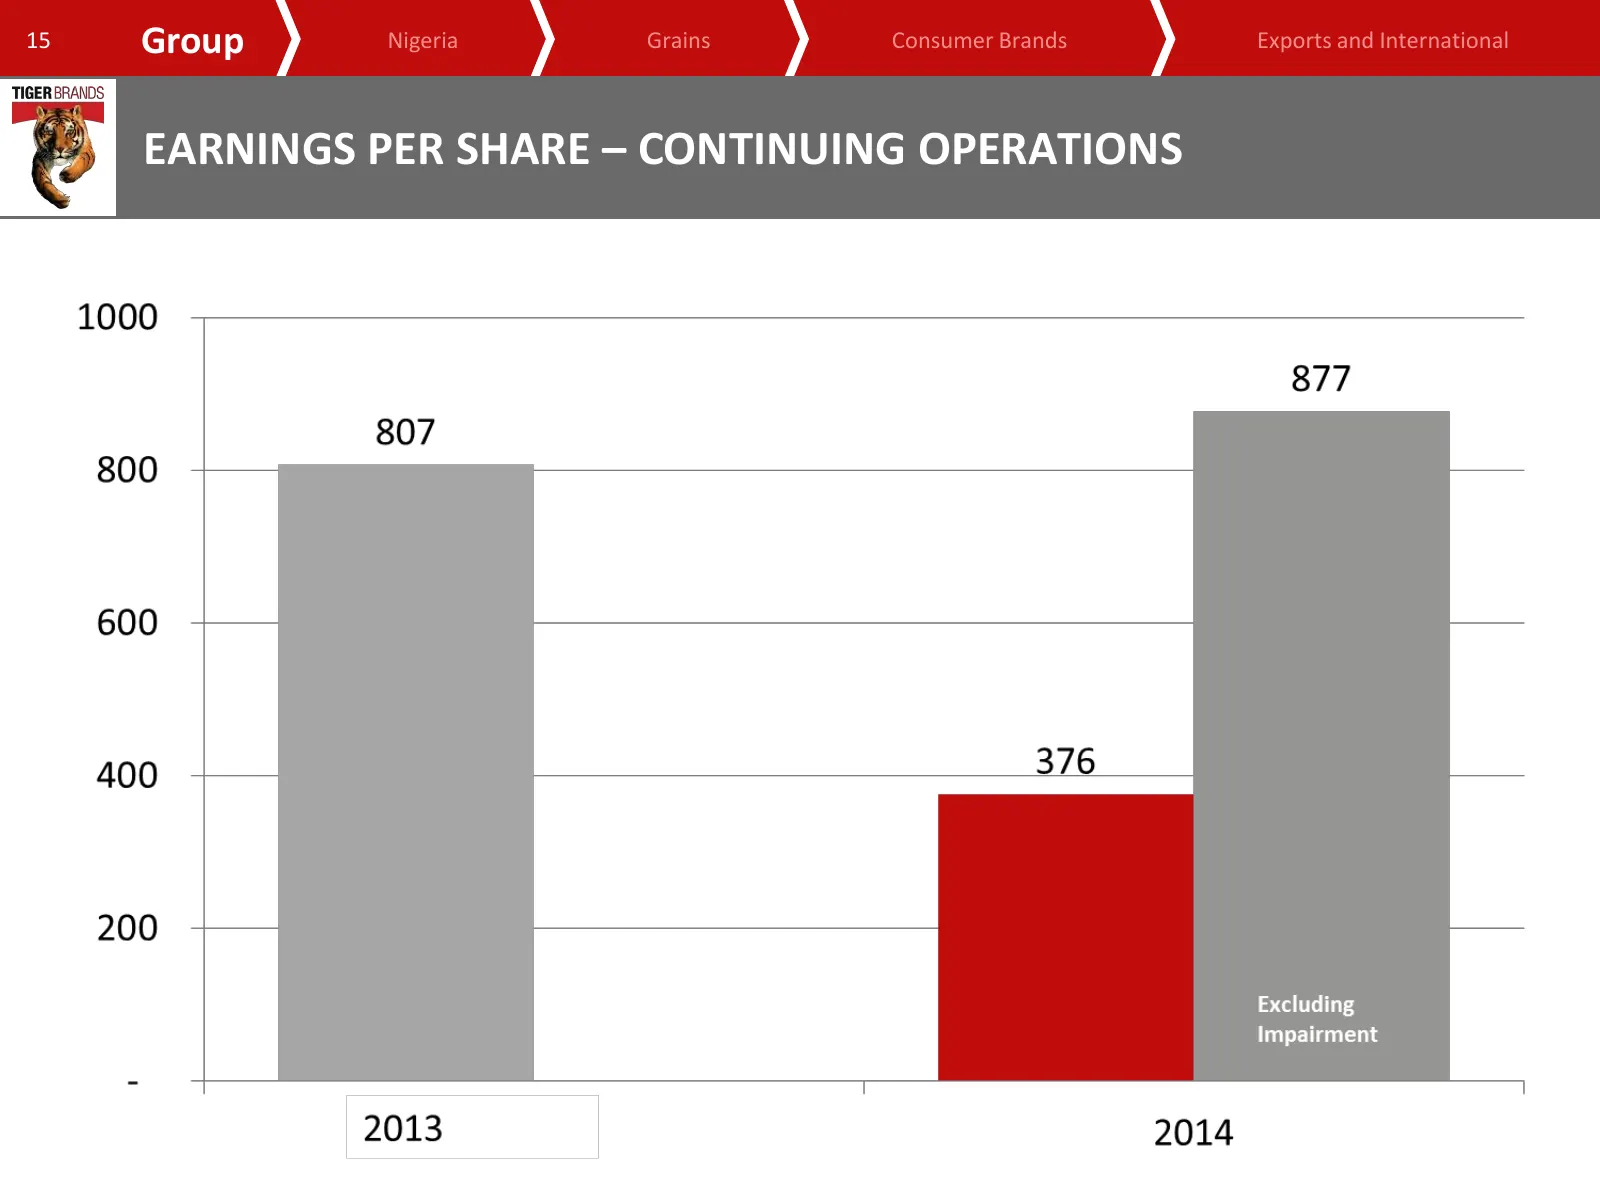
Slide 15: Earnings per share – continuing operations
15 Group Nigeria Grains Consumer Brands Exports and International EARNINGS PER SHARE – CONTINUING OPERATIONS
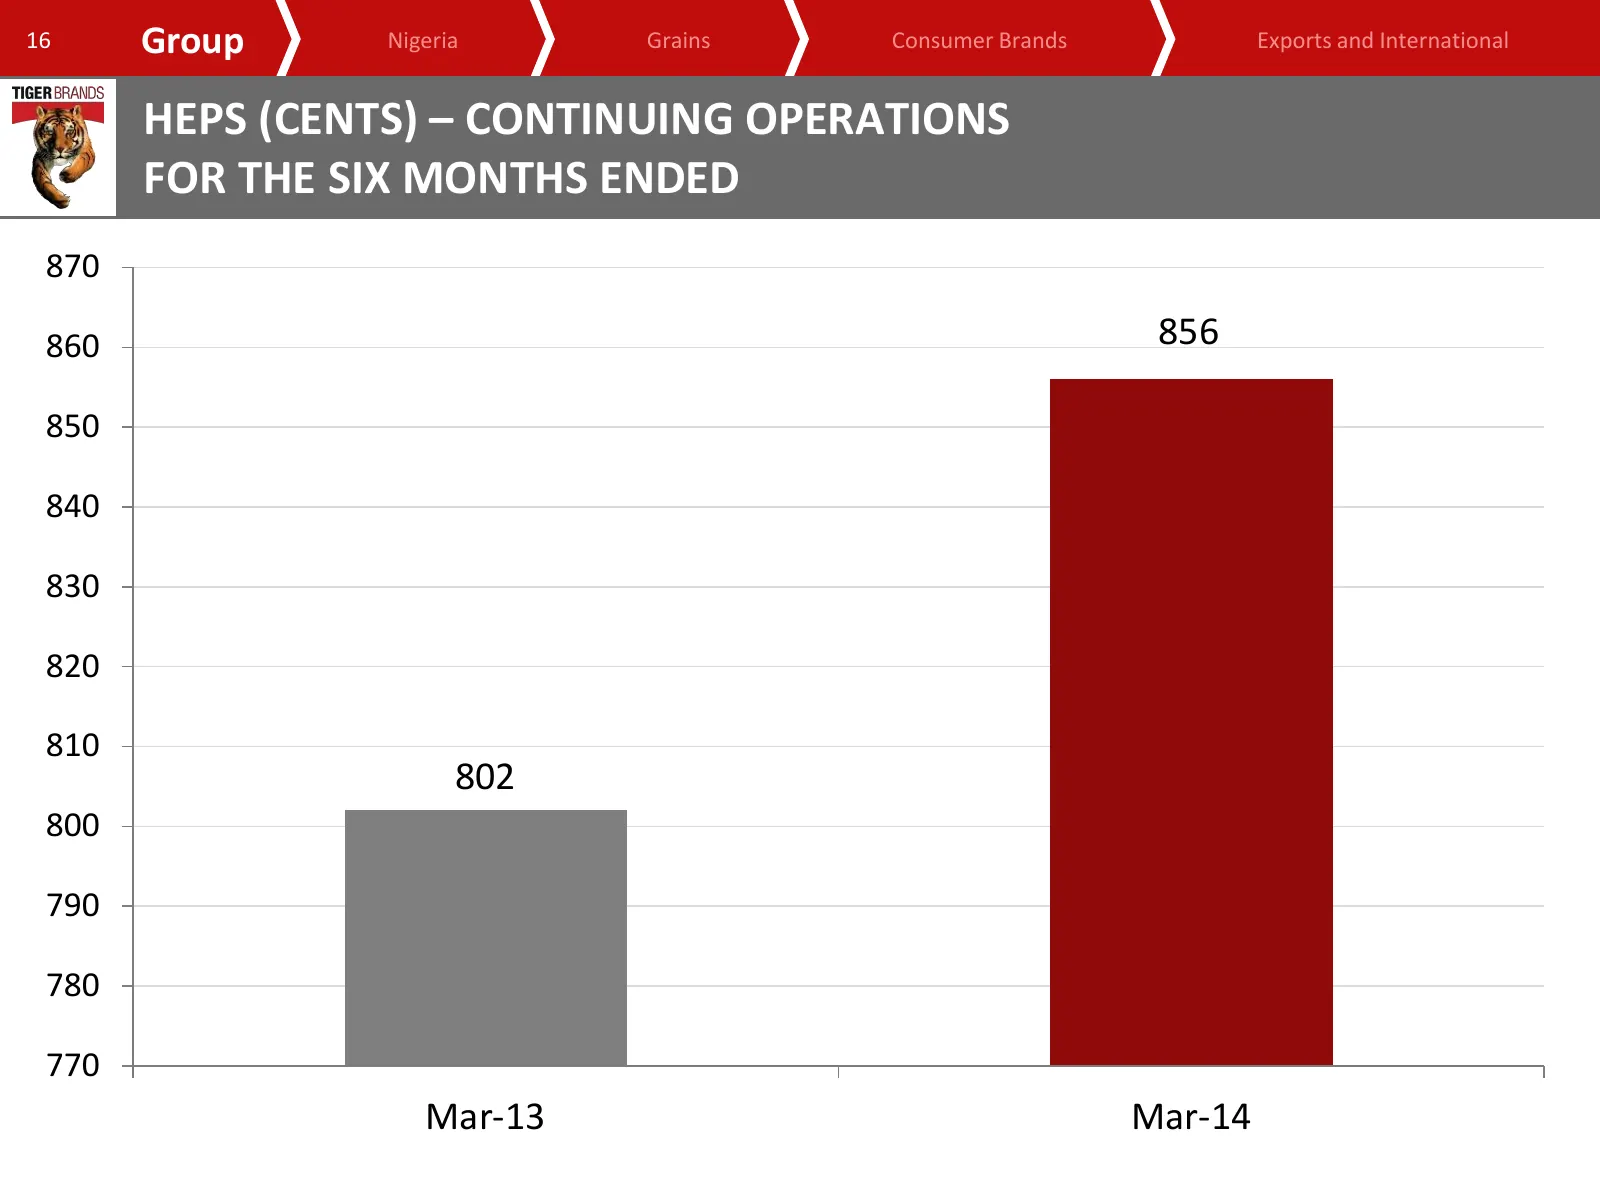
Slide 16: HEPS (cents) – continuing operations
16 Group Nigeria Grains Consumer Brands Exports and International HEPS (CENTS) – CONTINUING OPERATIONS FOR THE SIX MONTHS ENDED 870 860 856 850 840 830 820 810 802 800 790 780 770 Mar-13 Mar-14
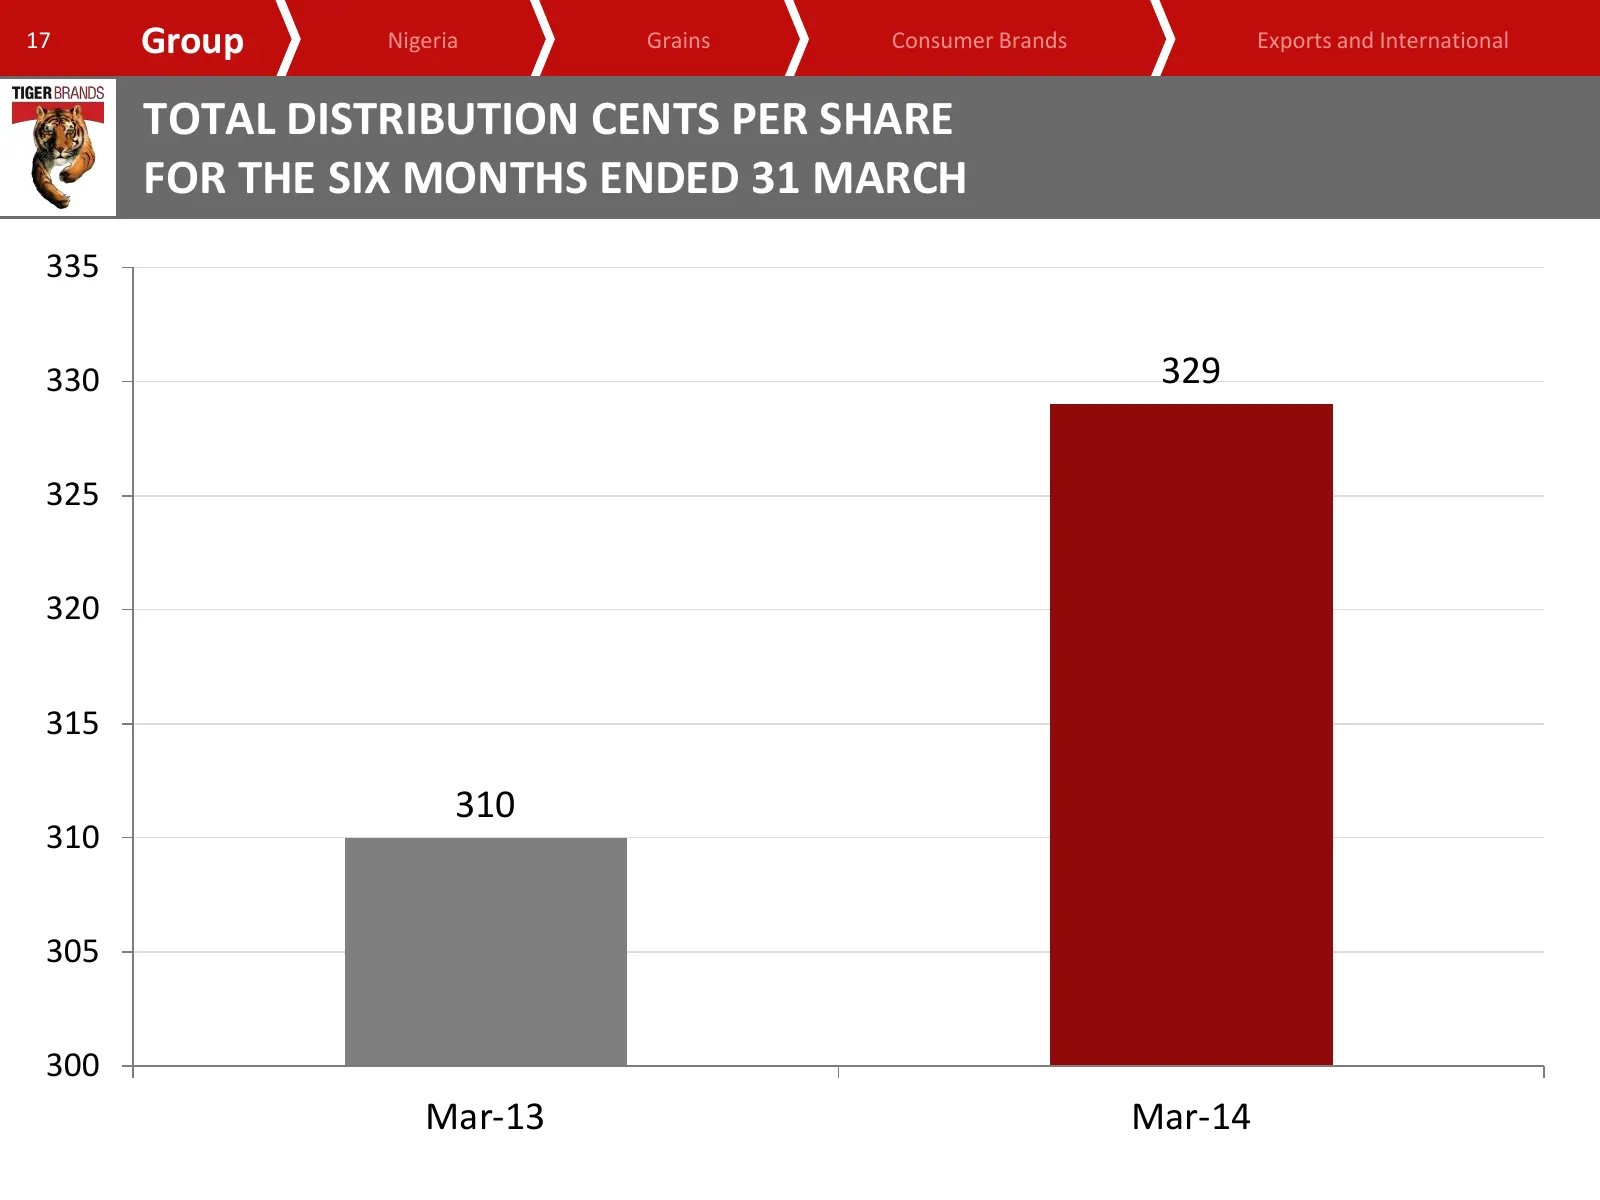
Slide 17: Total distribution cents per share
17 Group Nigeria Grains Consumer Brands Exports and International TOTAL DISTRIBUTION CENTS PER SHARE FOR THE SIX MONTHS ENDED 31 MARCH 335 330 329 325 320 315 310 310 305 300 Mar-13 Mar-14

Slide 18: Financial Analysis
www.tigerbrands.com Financial Analysis Funke Ighodaro Chief Financial Officer
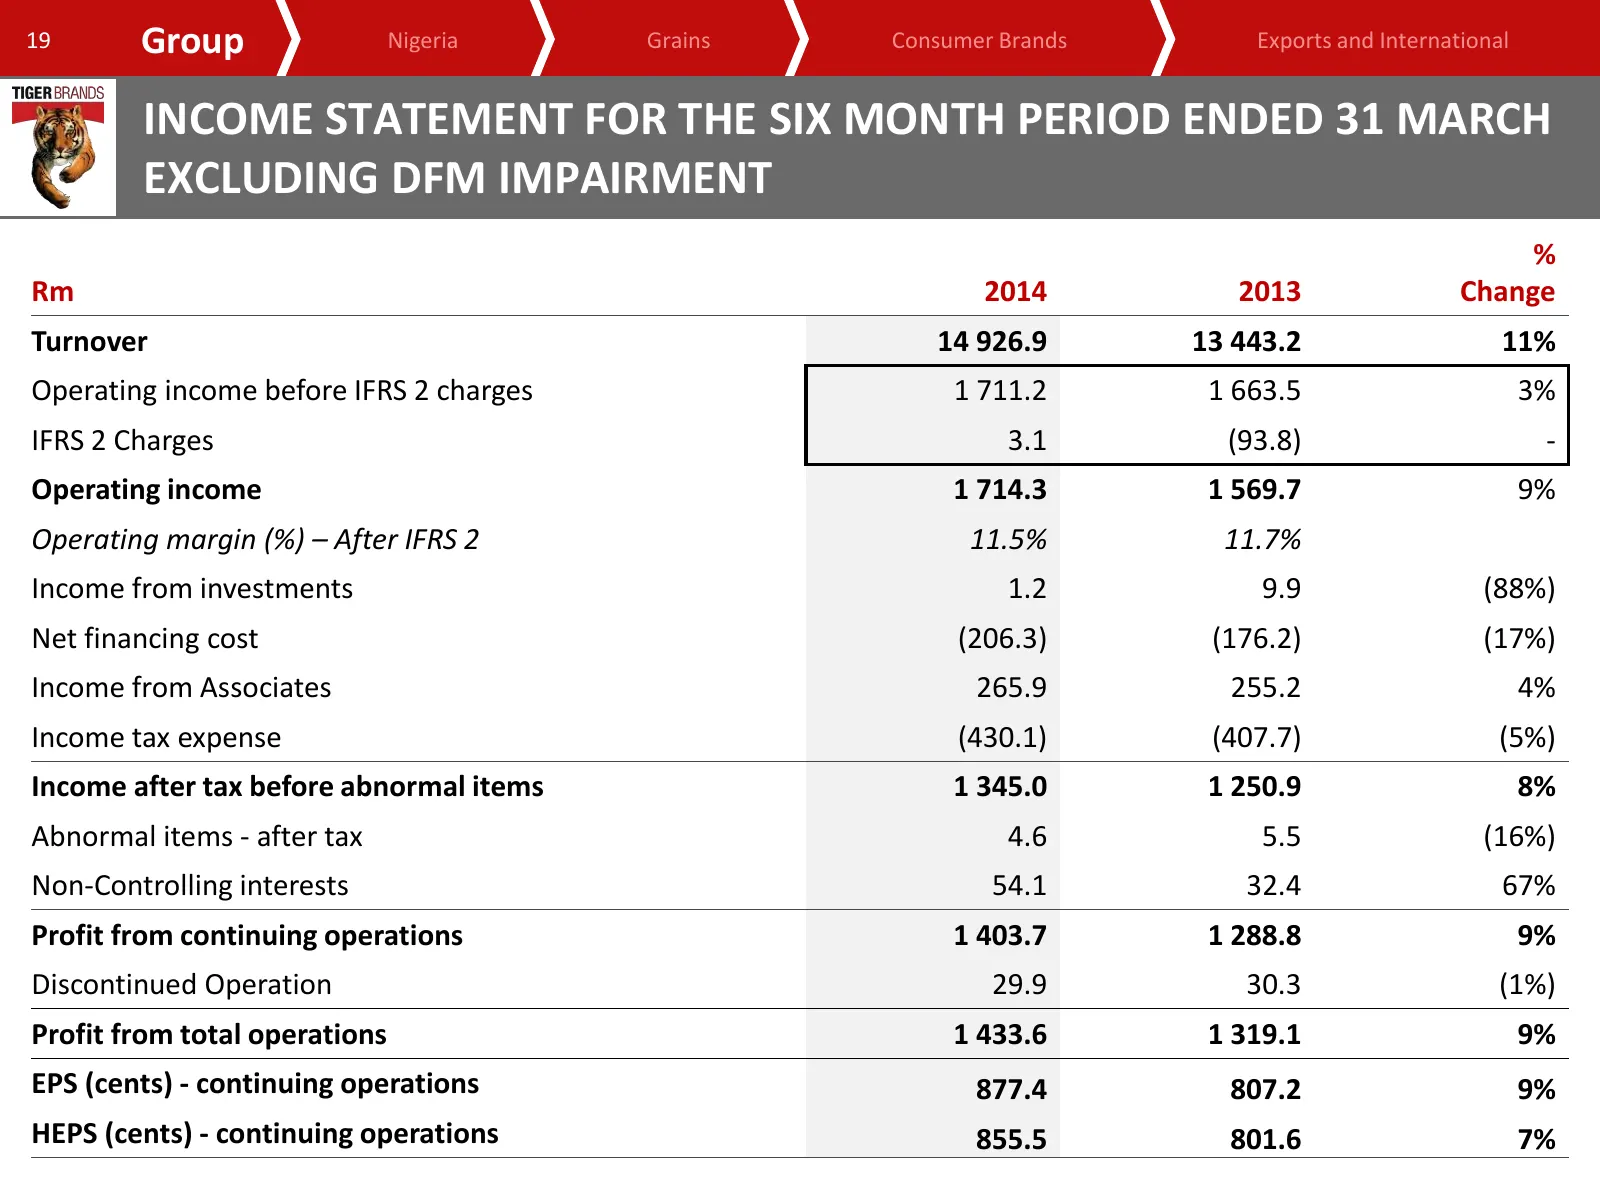
Slide 19: Income statement excluding DFM impairment
19 Group Nigeria Grains Consumer Brands Exports and International INCOME STATEMENT FOR THE SIX MONTH PERIOD ENDED 31 MARCH EXCLUDING DFM IMPAIRMENT % Rm 2014 2013 Change Turnover 14 926.9 13 443.2 11% Operating income before IFRS 2 charges 1 711.2 1 663.5 3% IFRS 2 Charges 3.1 (93.8) - Operating inc
Slide 20: Income statement after DFM impairment
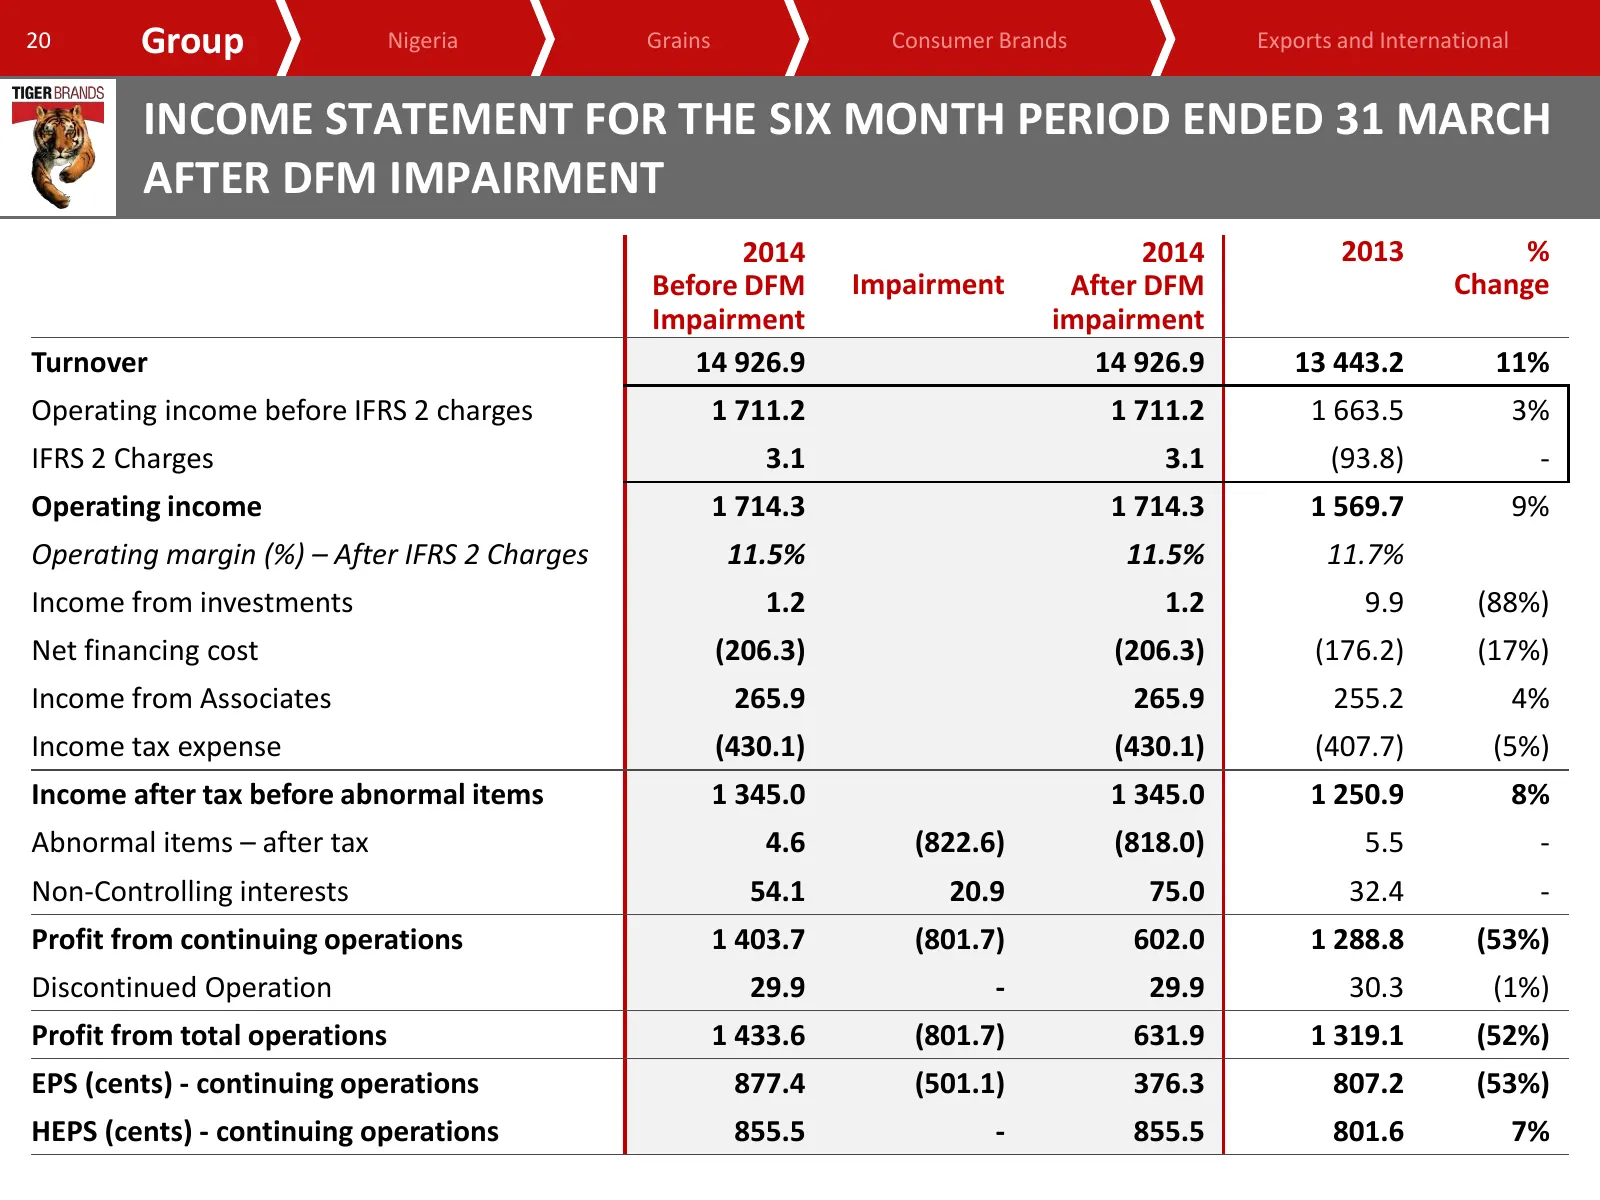
20 Group Nigeria Grains Consumer Brands Exports and International INCOME STATEMENT FOR THE SIX MONTH PERIOD ENDED 31 MARCH AFTER DFM IMPAIRMENT 2014 2014 2013 % Before DFM Impairment After DFM Change Impairment impairment Turnover 14 926.9 14 926.9 13 443.2 11% Operating income before IFRS 2 charges
Slide 21: Analysis of turnover growth
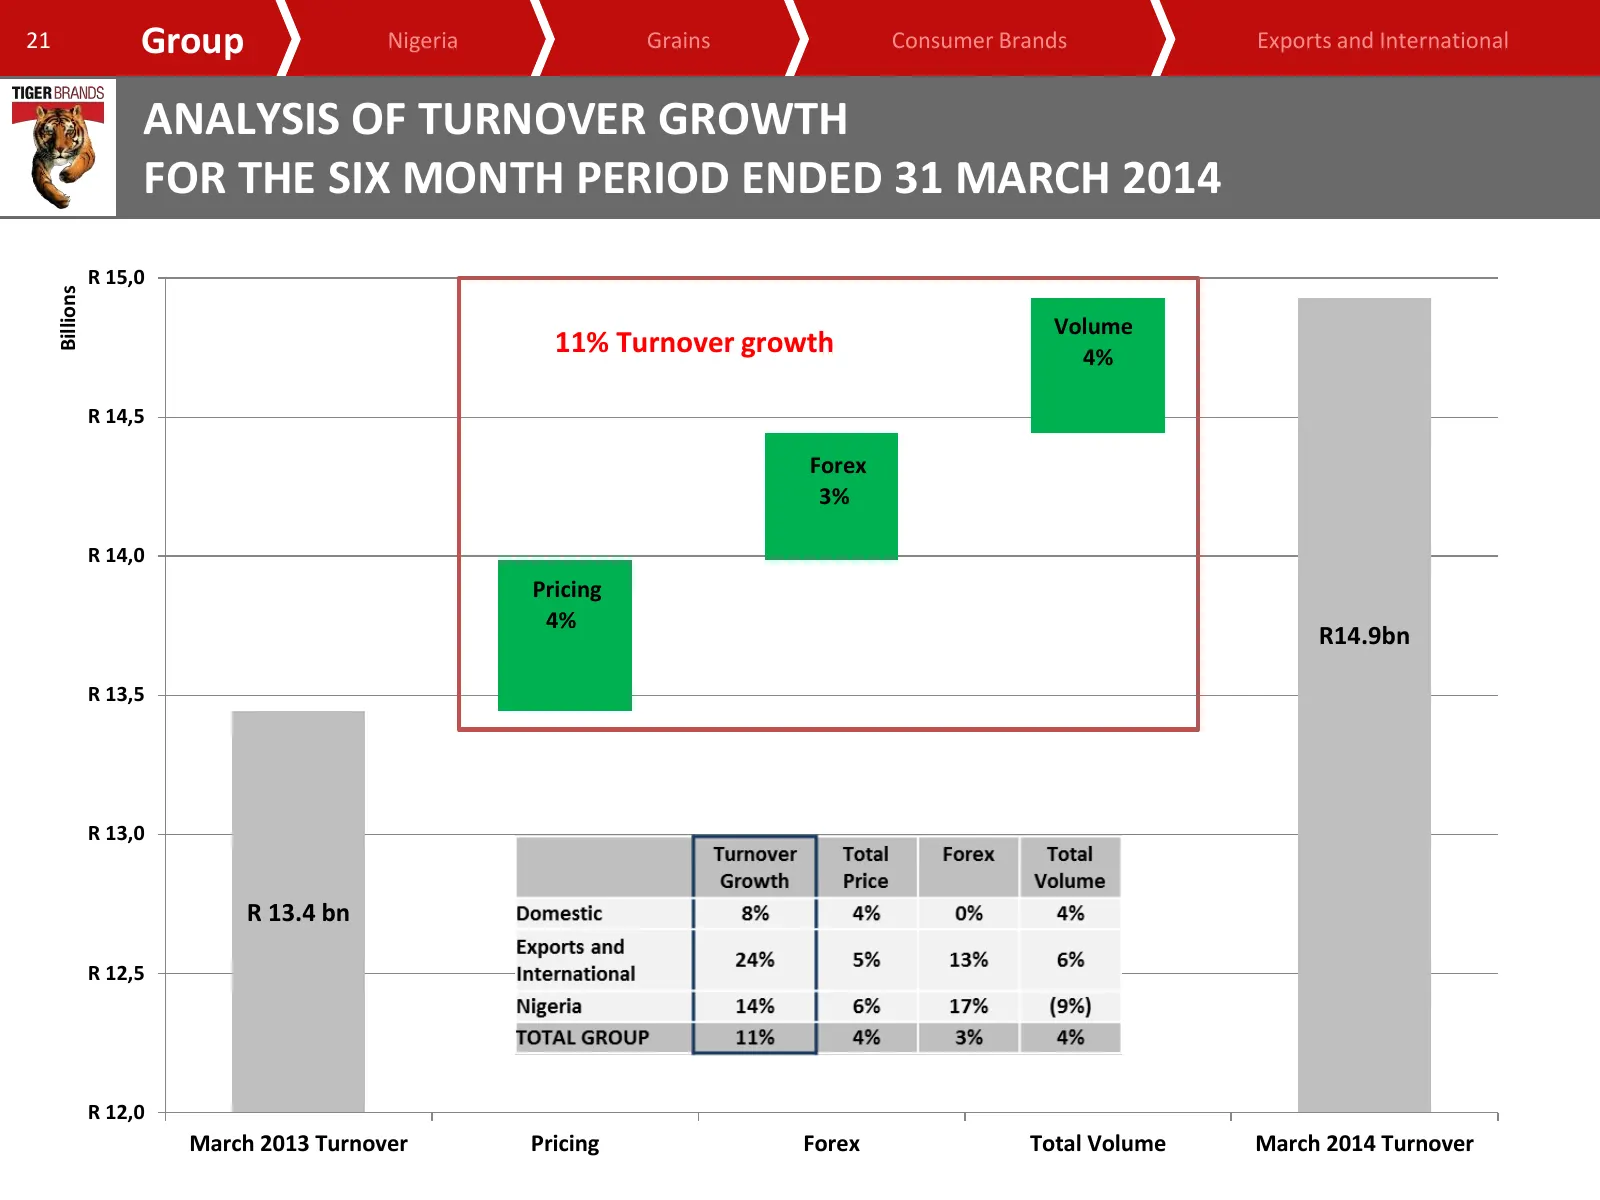
21 Group Nigeria Grains Consumer Brands Exports and International ANALYSIS OF TURNOVER GROWTH FOR THE SIX MONTH PERIOD ENDED 31 MARCH 2014 R 15,0 Billions Volume 11% Turnover growth 4% R 14,5 Forex 3% R 14,0 Pricing 4% R14.9bn R 13,5 R 13,0 R 13.4 bn R 12,5 R 12,0 March 2013 Turnover Pricing Forex T
Slide 22: Trading results for the six month period
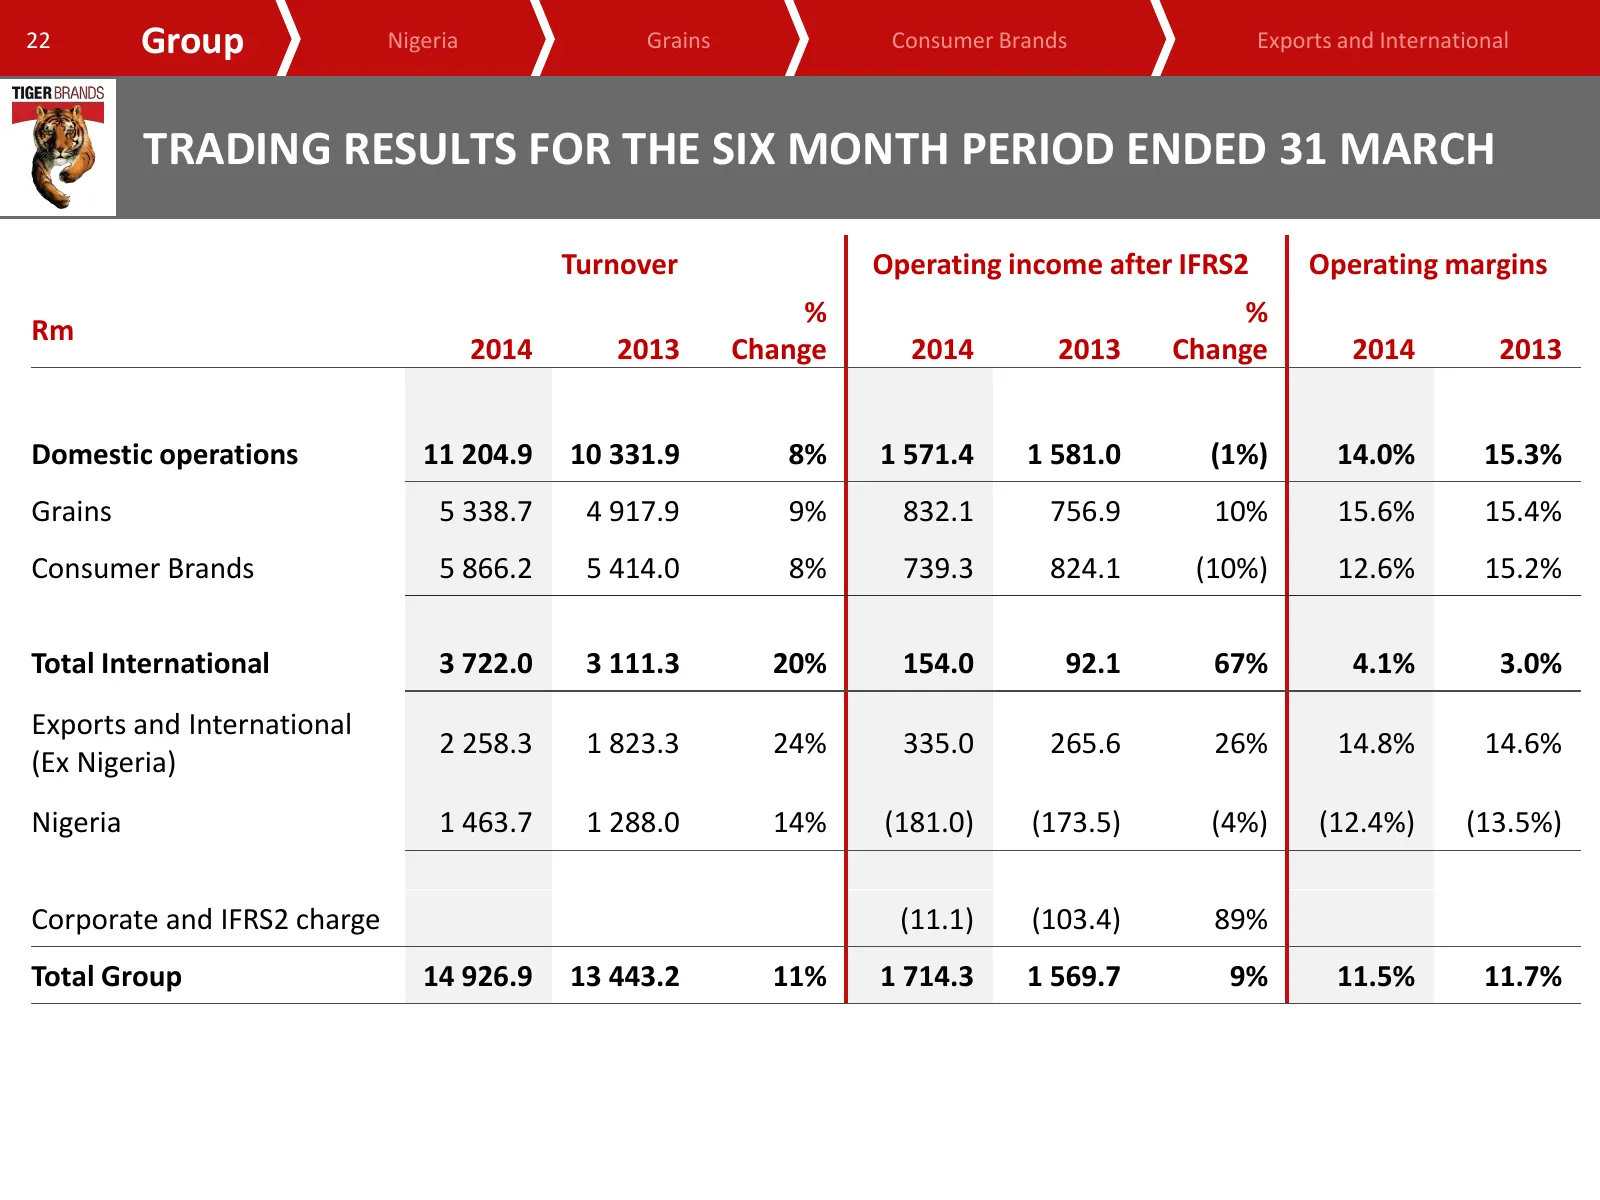
22 Group Nigeria Grains Consumer Brands Exports and International TRADING RESULTS FOR THE SIX MONTH PERIOD ENDED 31 MARCH Turnover Operating income after IFRS2 Operating margins % % Rm 2014 2013 Change 2014 2013 Change 2014 2013 Domestic operations 11 204.9 10 331.9 8% 1 571.4 1 581.0 (1%) 14.0% 15.
Slide 23: Turnover by operating segment
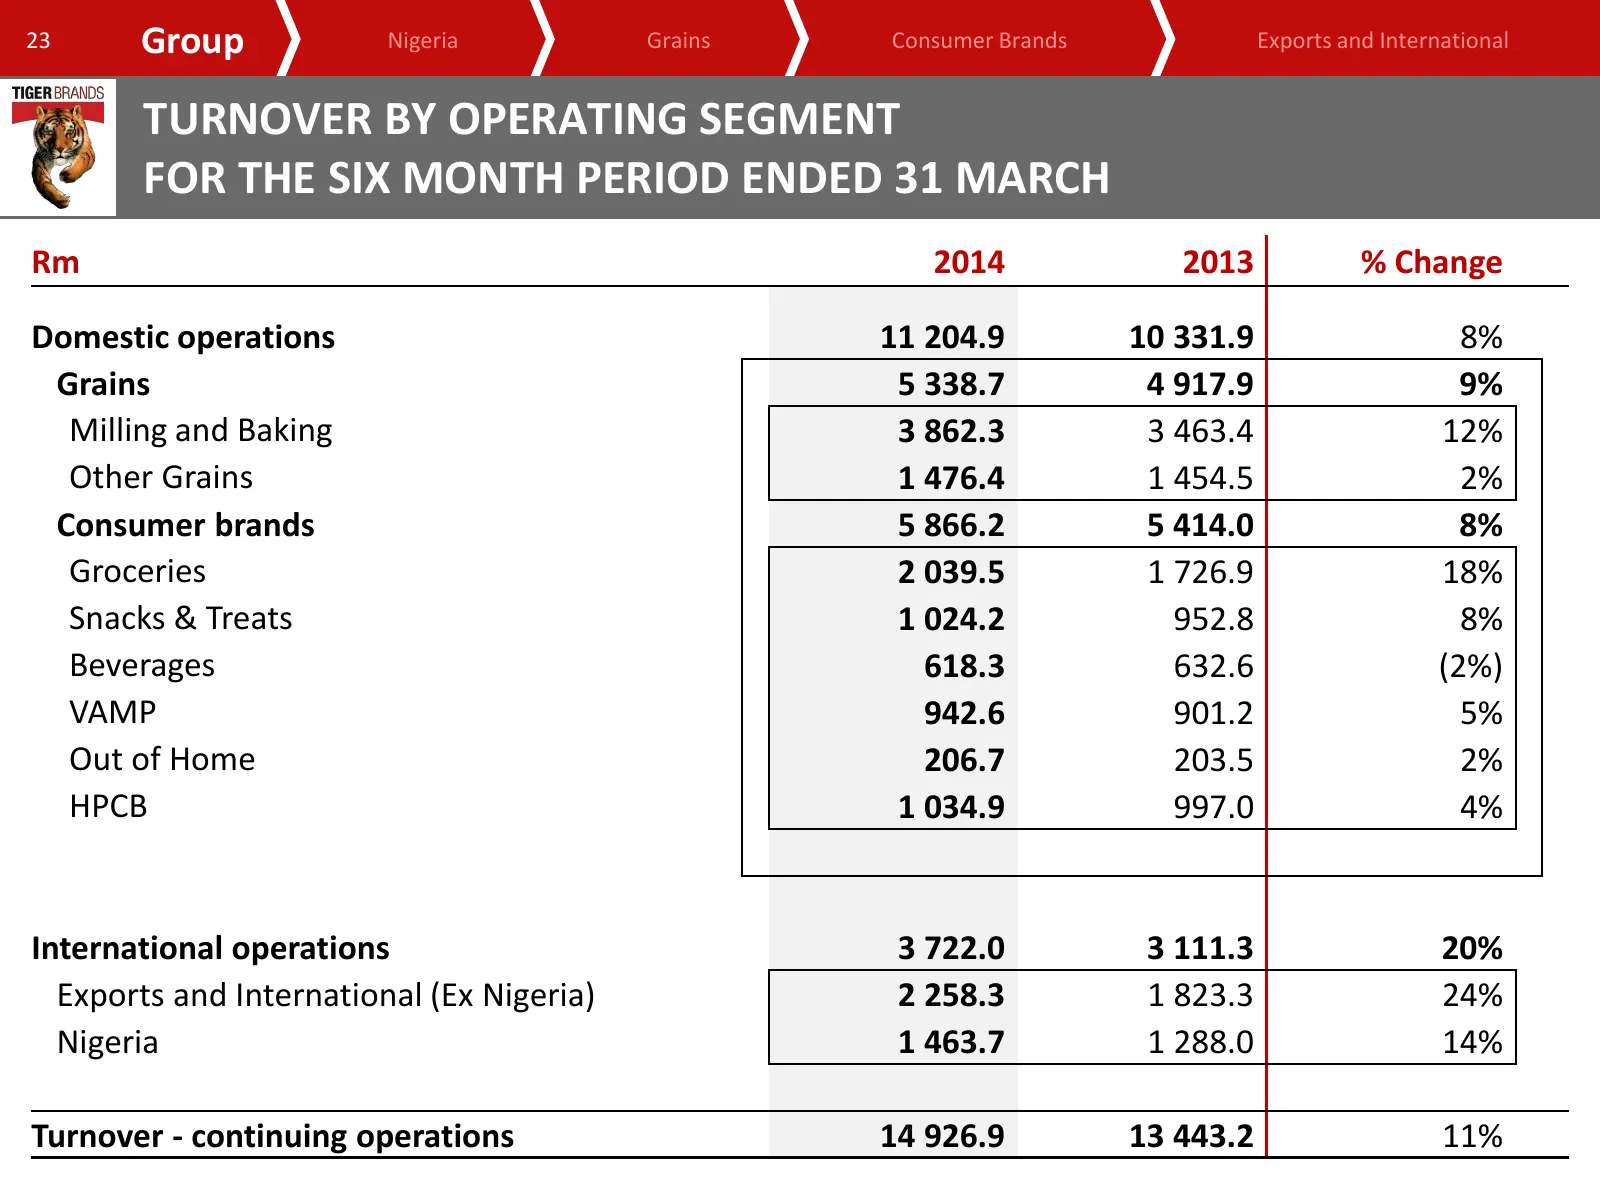
23 Group Nigeria Grains Consumer Brands Exports and International TURNOVER BY OPERATING SEGMENT FOR THE SIX MONTH PERIOD ENDED 31 MARCH Rm 2014 2013 % Change Domestic operations 11 204.9 10 331.9 8% Grains 5 338.7 4 917.9 9% Milling and Baking 3 862.3 3 463.4 12% Other Grains 1 476.4 1 454.5 2% Cons
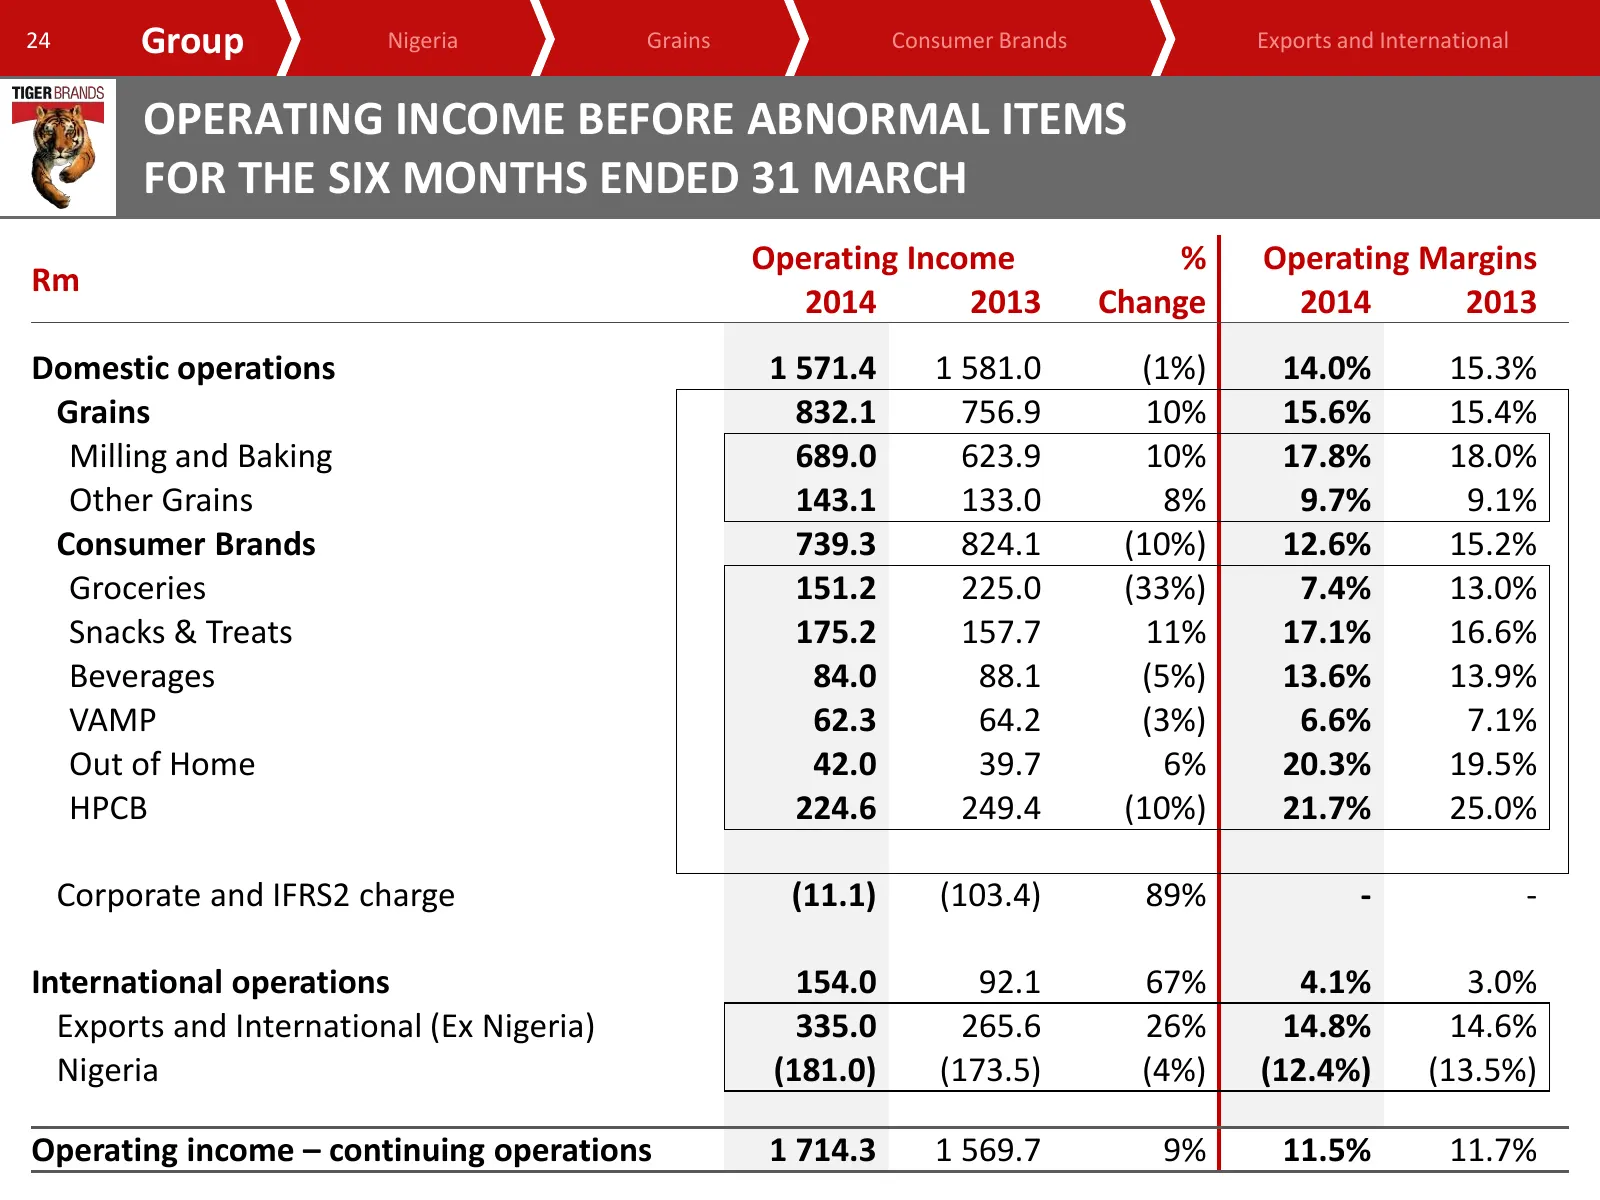
Slide 24: Operating income before abnormal items
24 Group Nigeria Grains Consumer Brands Exports and International OPERATING INCOME BEFORE ABNORMAL ITEMS FOR THE SIX MONTHS ENDED 31 MARCH Operating Income % Operating Margins Rm 2014 2013 Change 2014 2013 Domestic operations 1 571.4 1 581.0 (1%) 14.0% 15.3% Grains 832.1 756.9 10% 15.6% 15.4% Millin
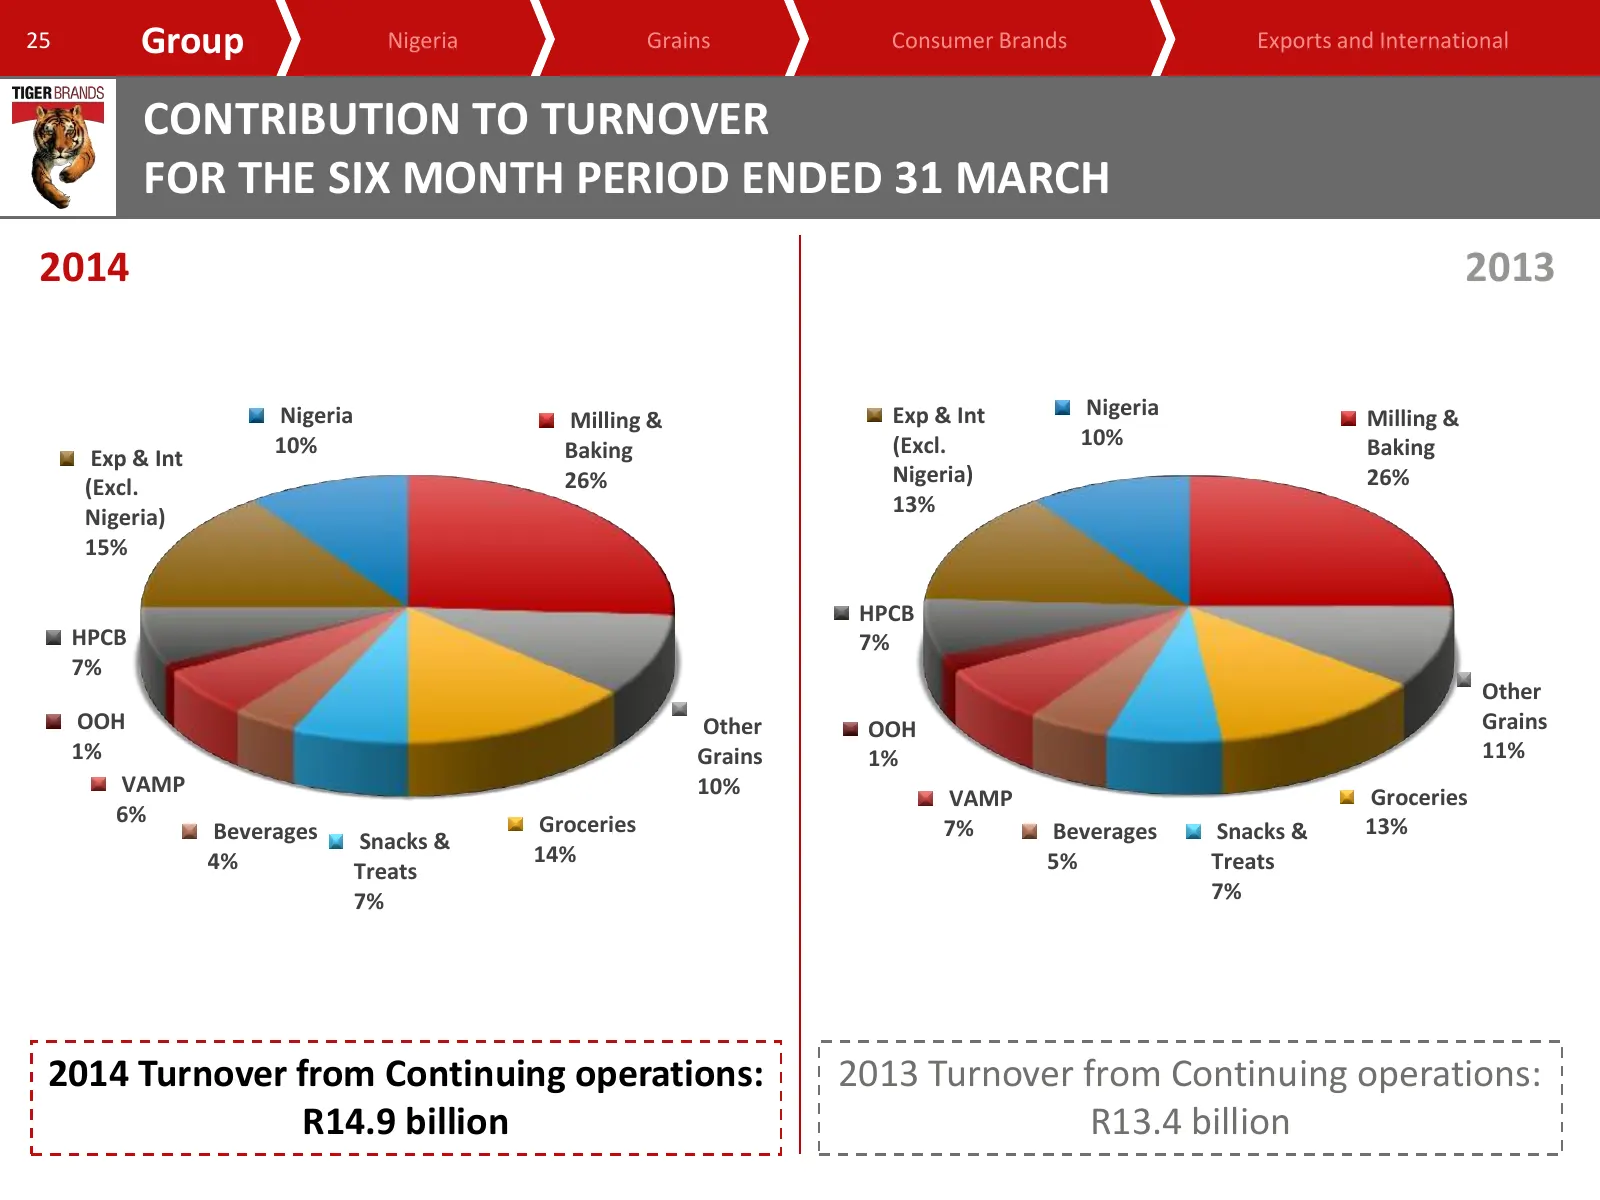
Slide 25: Contribution to turnover
25 Group Nigeria Grains Consumer Brands Exports and International CONTRIBUTION TO TURNOVER FOR THE SIX MONTH PERIOD ENDED 31 MARCH 2014 2013 Nigeria Exp & Int Nigeria Milling & Milling & 10% (Excl. 10% Baking Exp & Int Baking 26% Nigeria) 26% (Excl. 13% Nigeria) 15% HPCB HPCB 7% 7% Other OOH Other O
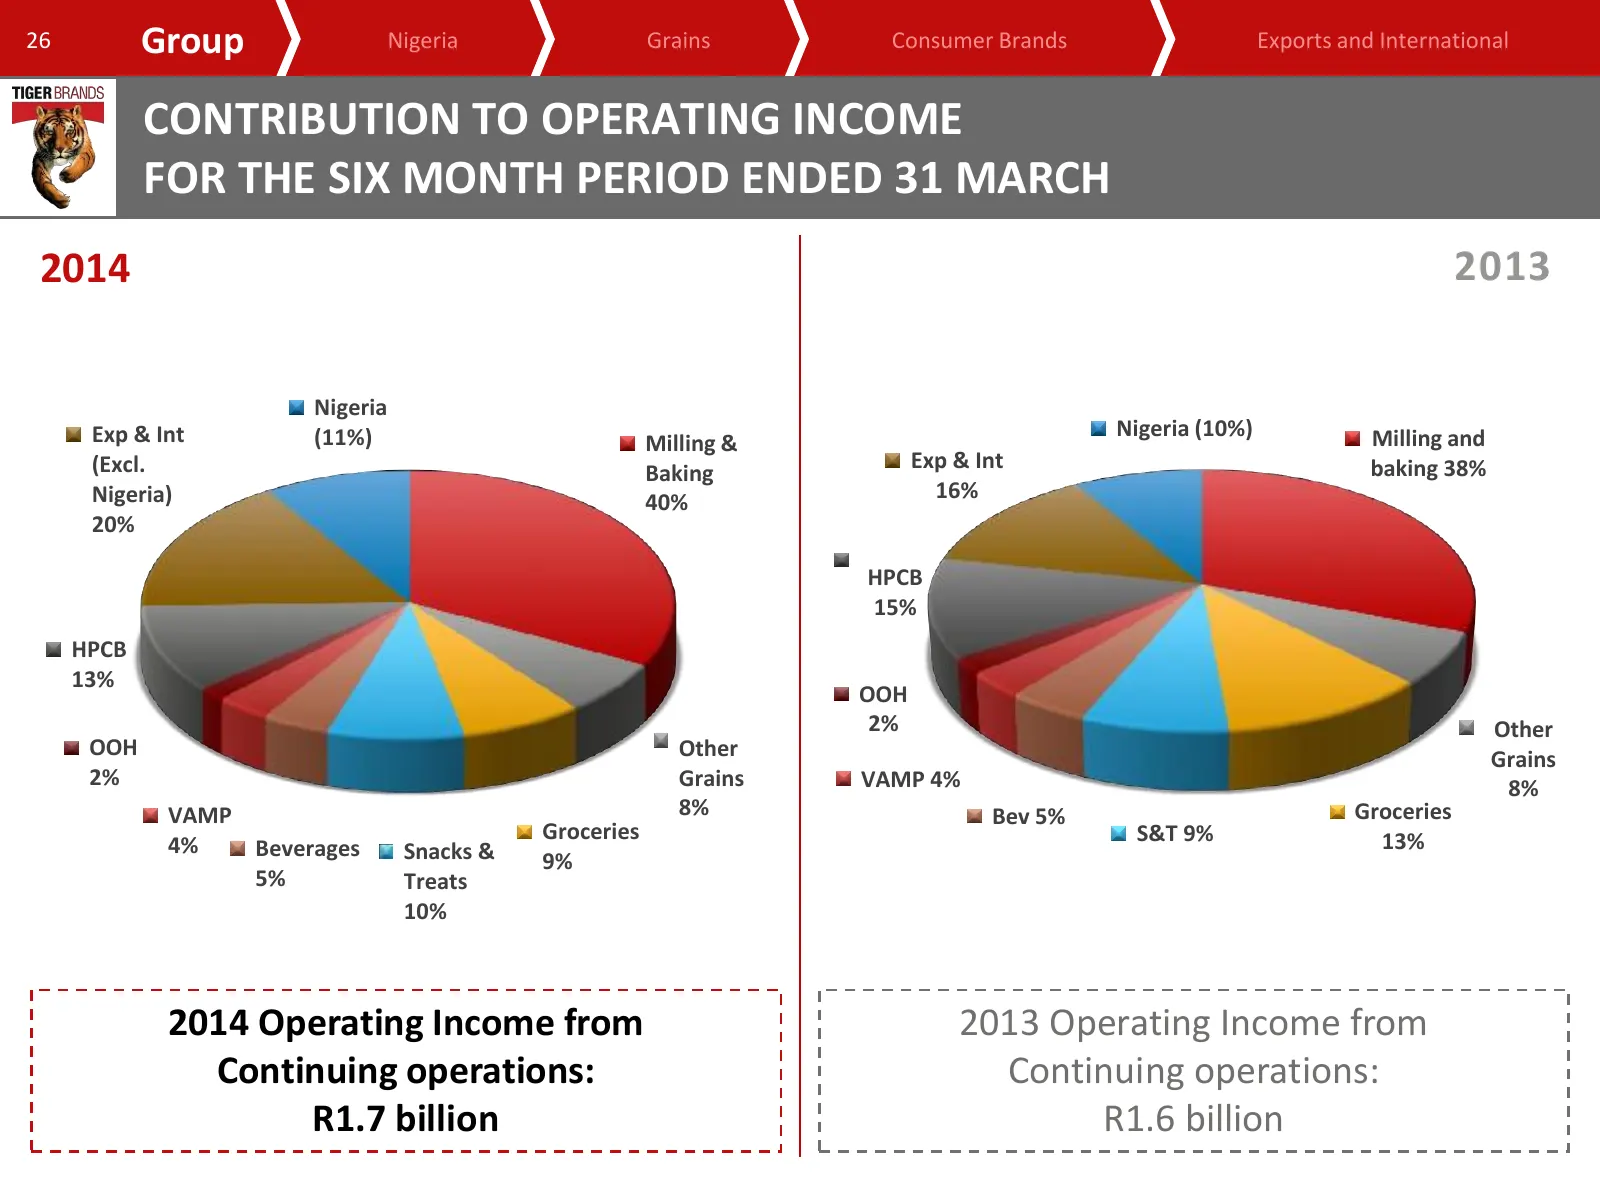
Slide 26: Contribution to operating income
26 Group Nigeria Grains Consumer Brands Exports and International CONTRIBUTION TO OPERATING INCOME FOR THE SIX MONTH PERIOD ENDED 31 MARCH 2014 2013 Nigeria Exp & Int (11%) Nigeria (10%) Milling and Milling & (Excl. Exp & Int baking 38% Baking Nigeria) 16% 40% 20% HPCB 15% HPCB 13% OOH 2% Other OOH
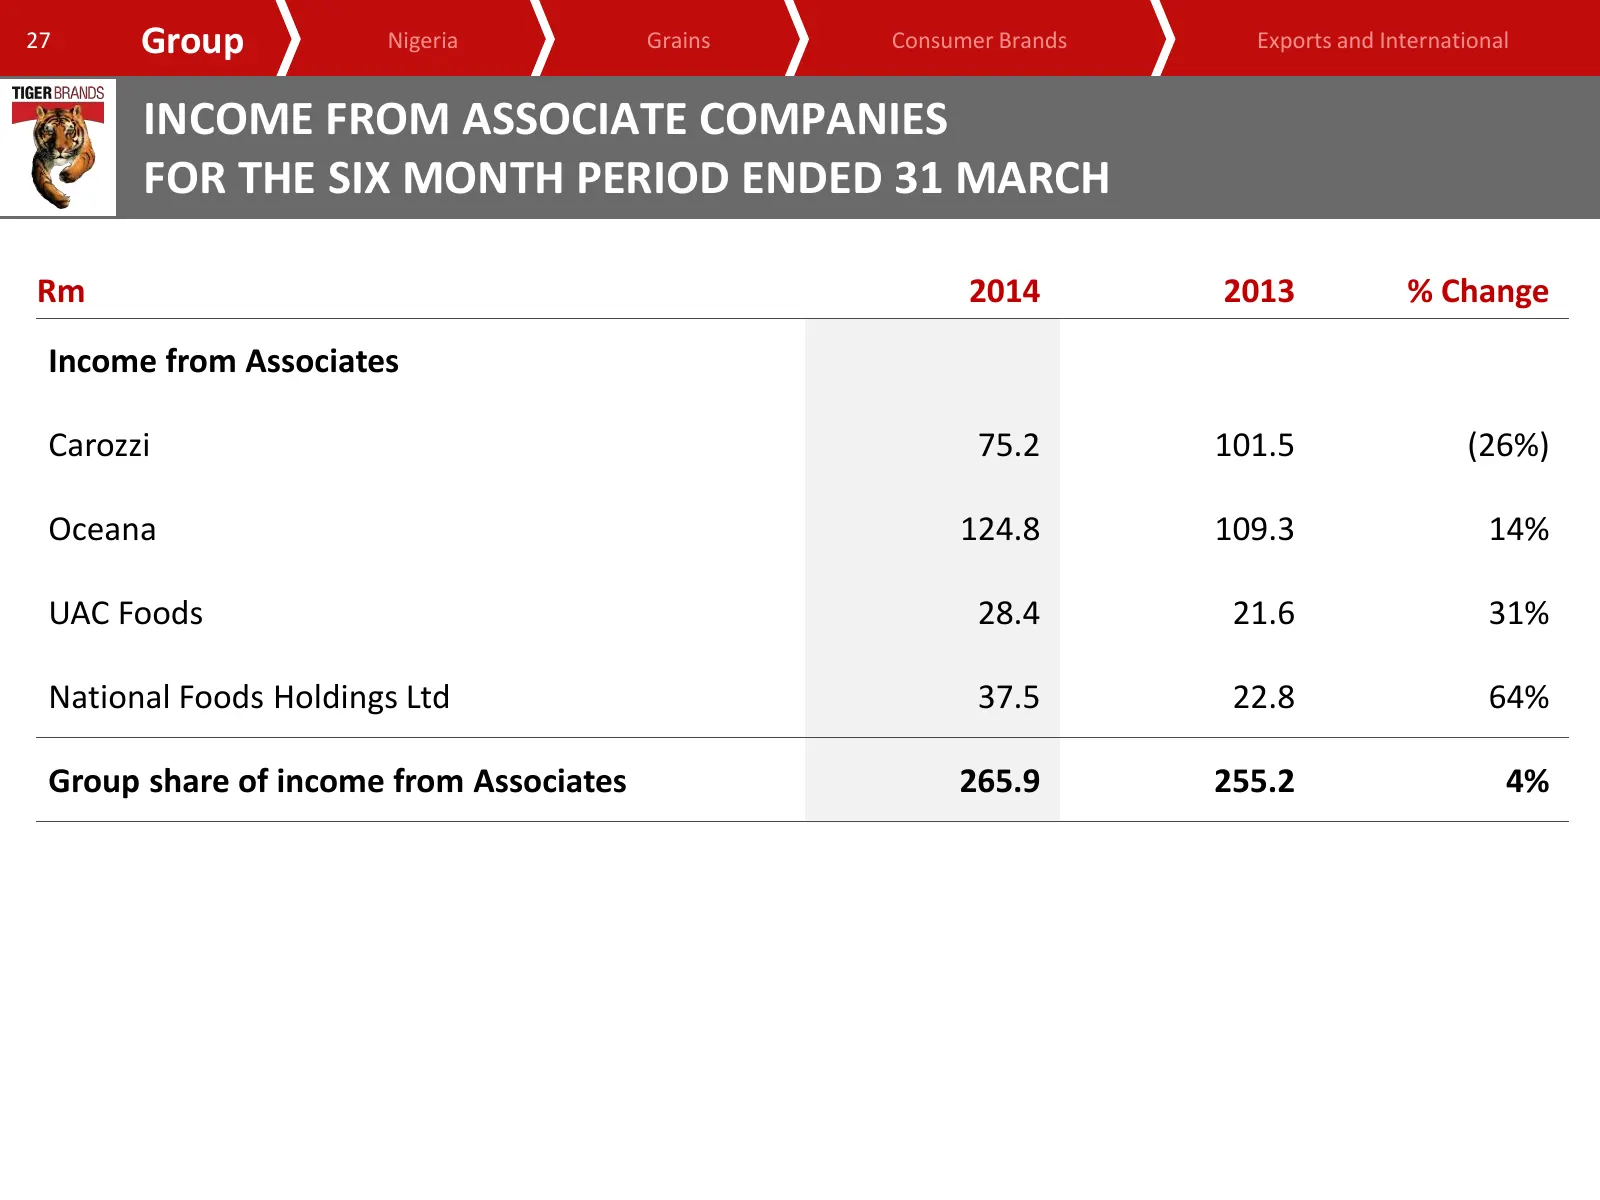
Slide 27: Income from associate companies
27 Group Nigeria Grains Consumer Brands Exports and International INCOME FROM ASSOCIATE COMPANIES FOR THE SIX MONTH PERIOD ENDED 31 MARCH Rm 2014 2013 % Change Income from Associates Carozzi 75.2 101.5 (26%) Oceana 124.8 109.3 14% UAC Foods 28.4 21.6 31% National Foods Holdings Ltd 37.5 22.8 64% Gro
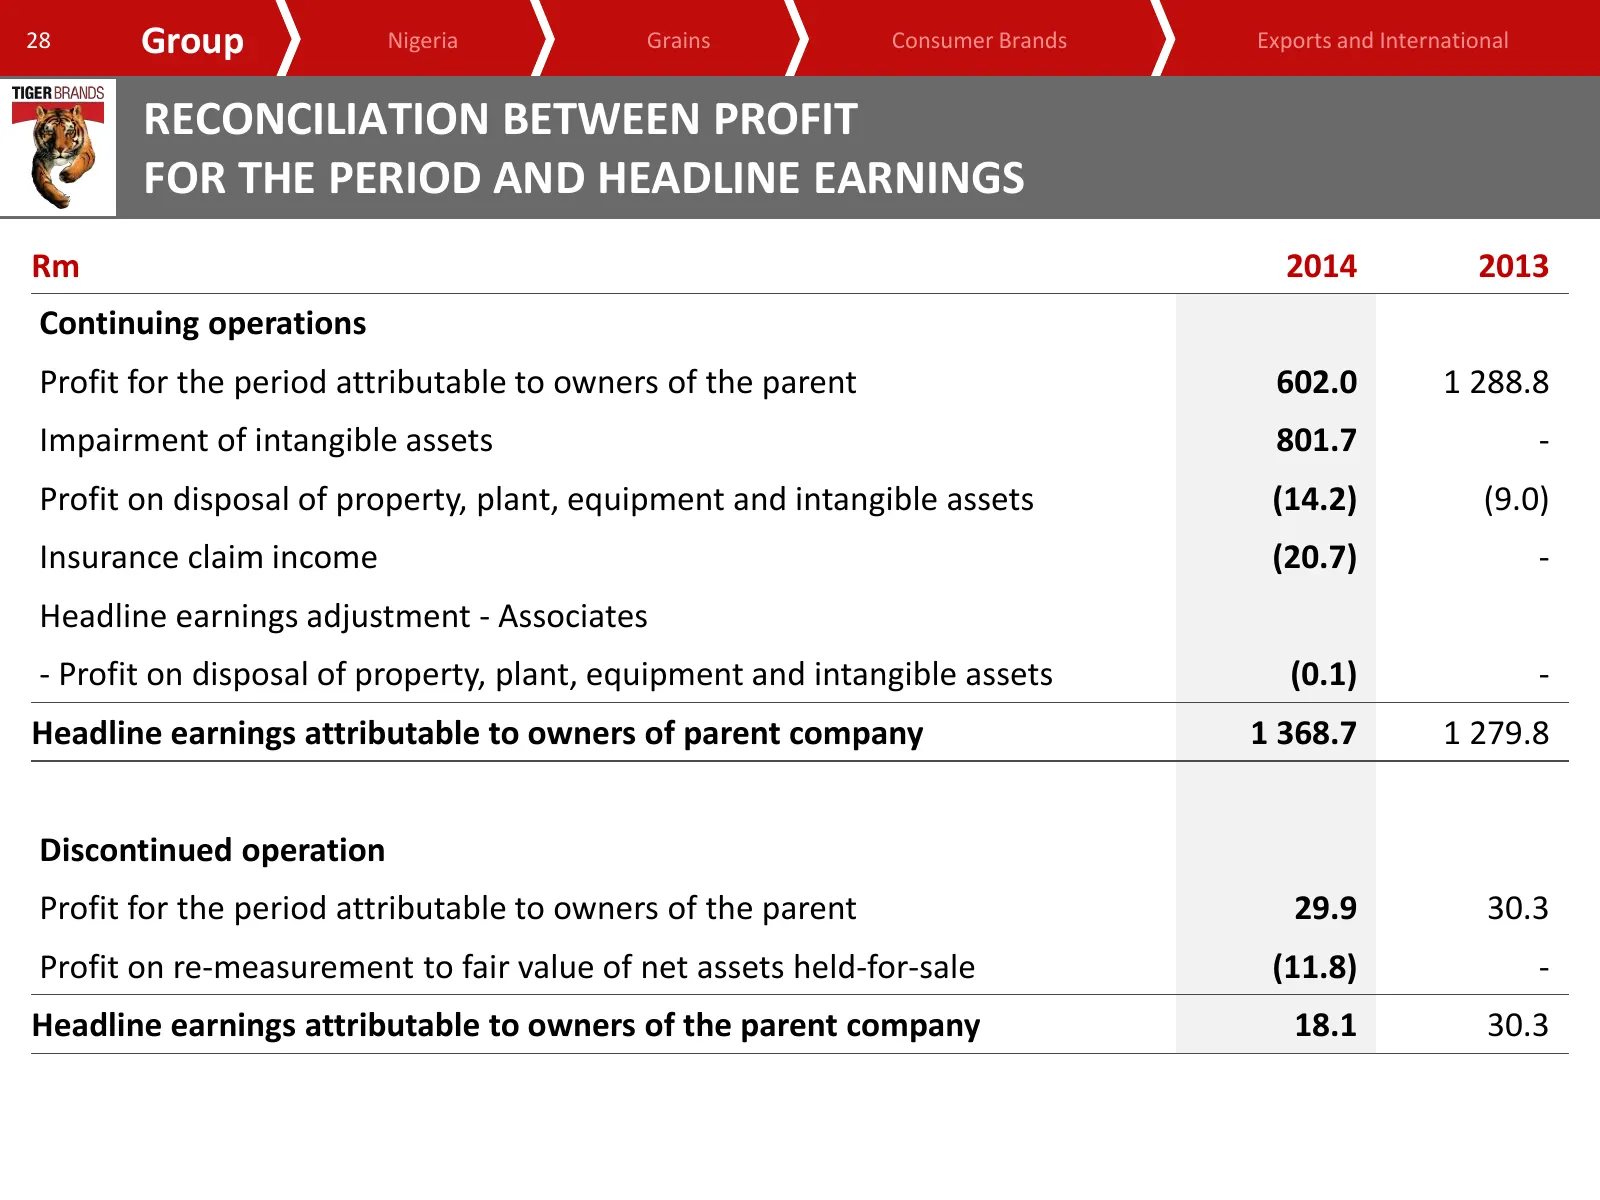
Slide 28: Reconciliation between profit for the period and headline earnings
28 Group Nigeria Grains Consumer Brands Exports and International RECONCILIATION BETWEEN PROFIT FOR THE PERIOD AND HEADLINE EARNINGS Rm 2014 2013 Continuing operations Profit for the period attributable to owners of the parent 602.0 1 288.8 Impairment of intangible assets 801.7 - Profit on disposal
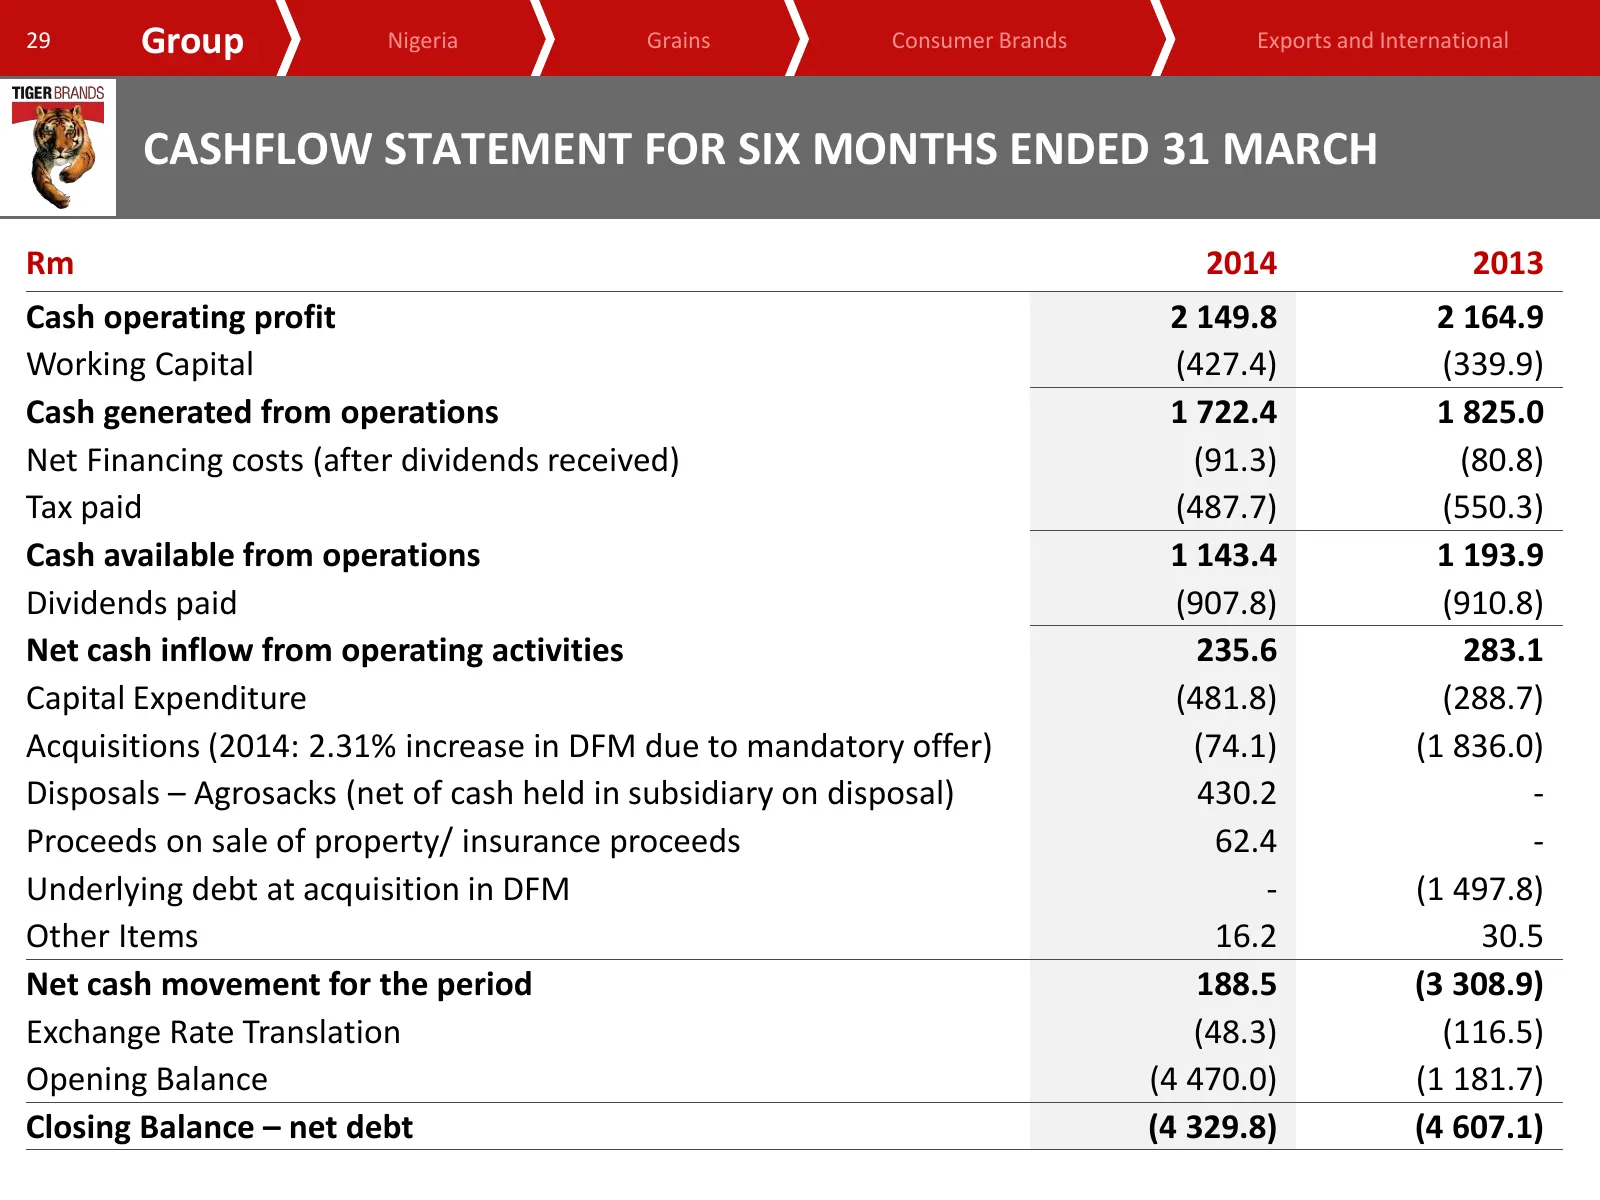
Slide 29: Cashflow statement
29 Group Nigeria Grains Consumer Brands Exports and International CASHFLOW STATEMENT FOR SIX MONTHS ENDED 31 MARCH Rm 2014 2013 Cash operating profit 2 149.8 2 164.9 Working Capital (427.4) (339.9) Cash generated from operations 1 722.4 1 825.0 Net Financing costs (after dividends received) (91.3) (
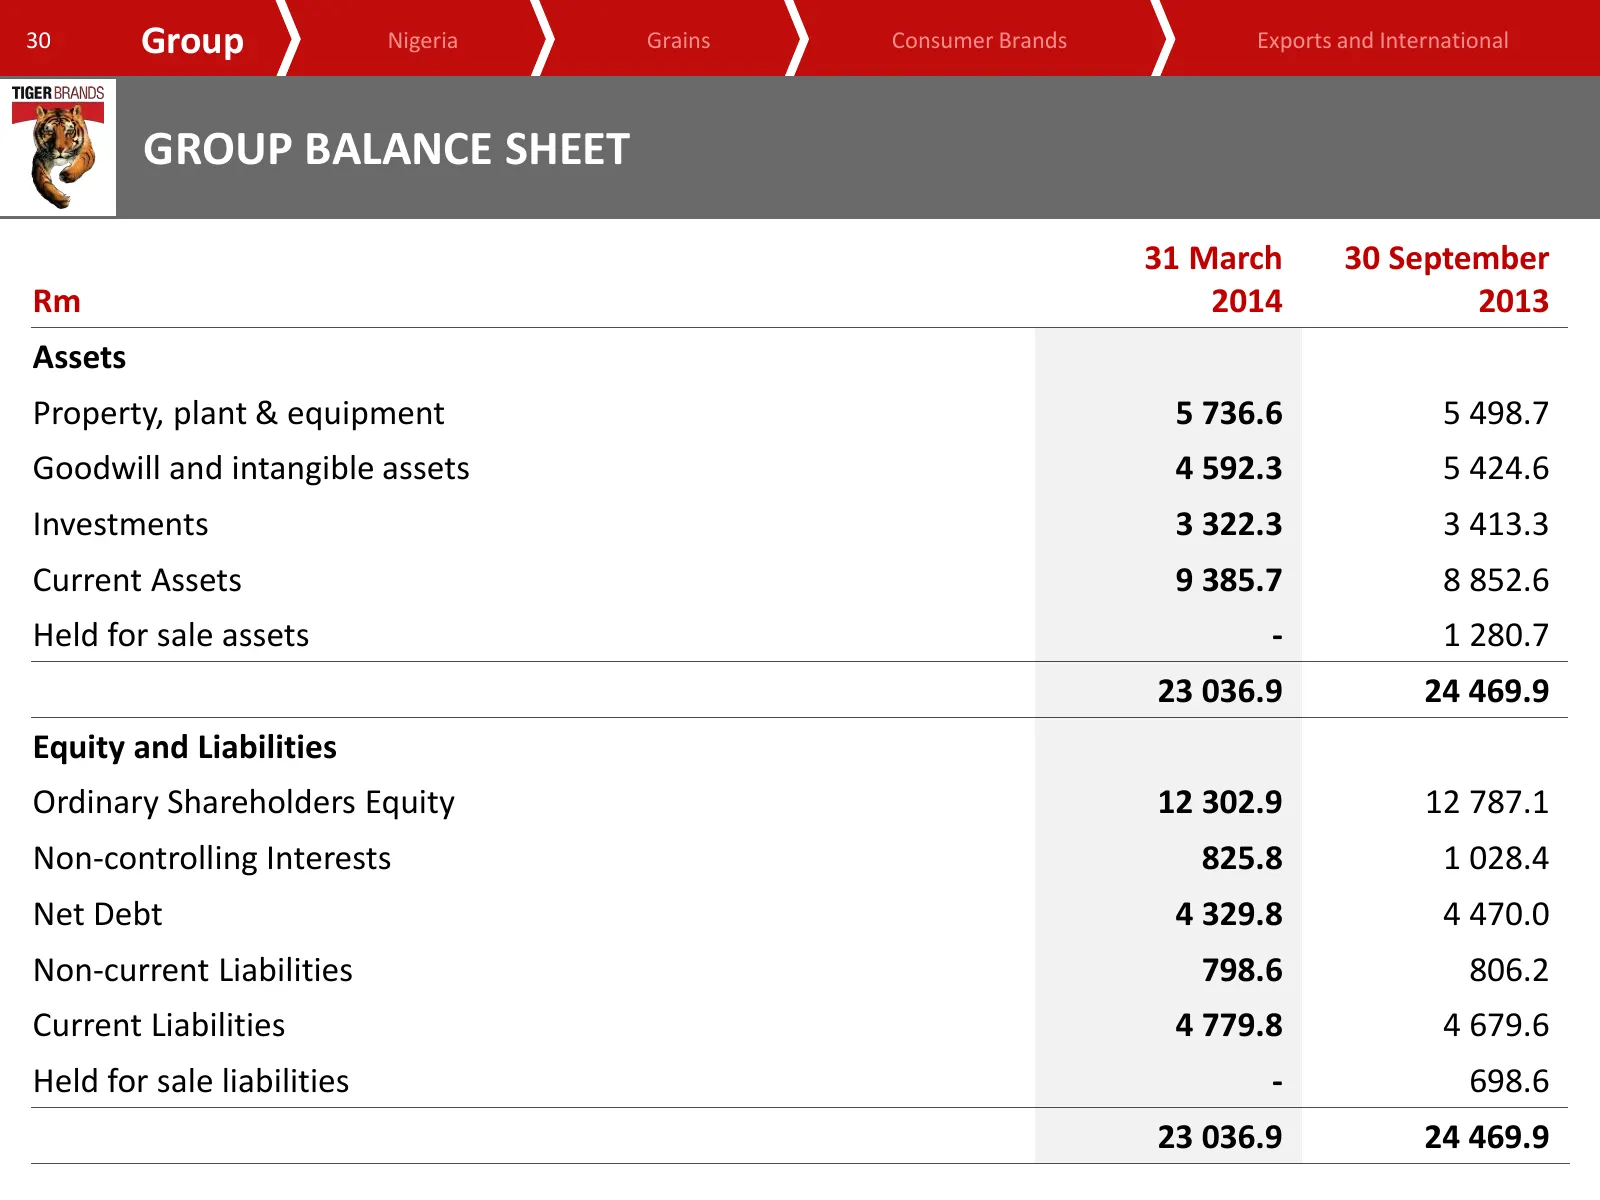
Slide 30: Group balance sheet
30 Group Nigeria Grains Consumer Brands Exports and International GROUP BALANCE SHEET 31 March 30 September Rm 2014 2013 Assets Property, plant & equipment 5 736.6 5 498.7 Goodwill and intangible assets 4 592.3 5 424.6 Investments 3 322.3 3 413.3 Current Assets 9 385.7 8 852.6 Held for sale assets -
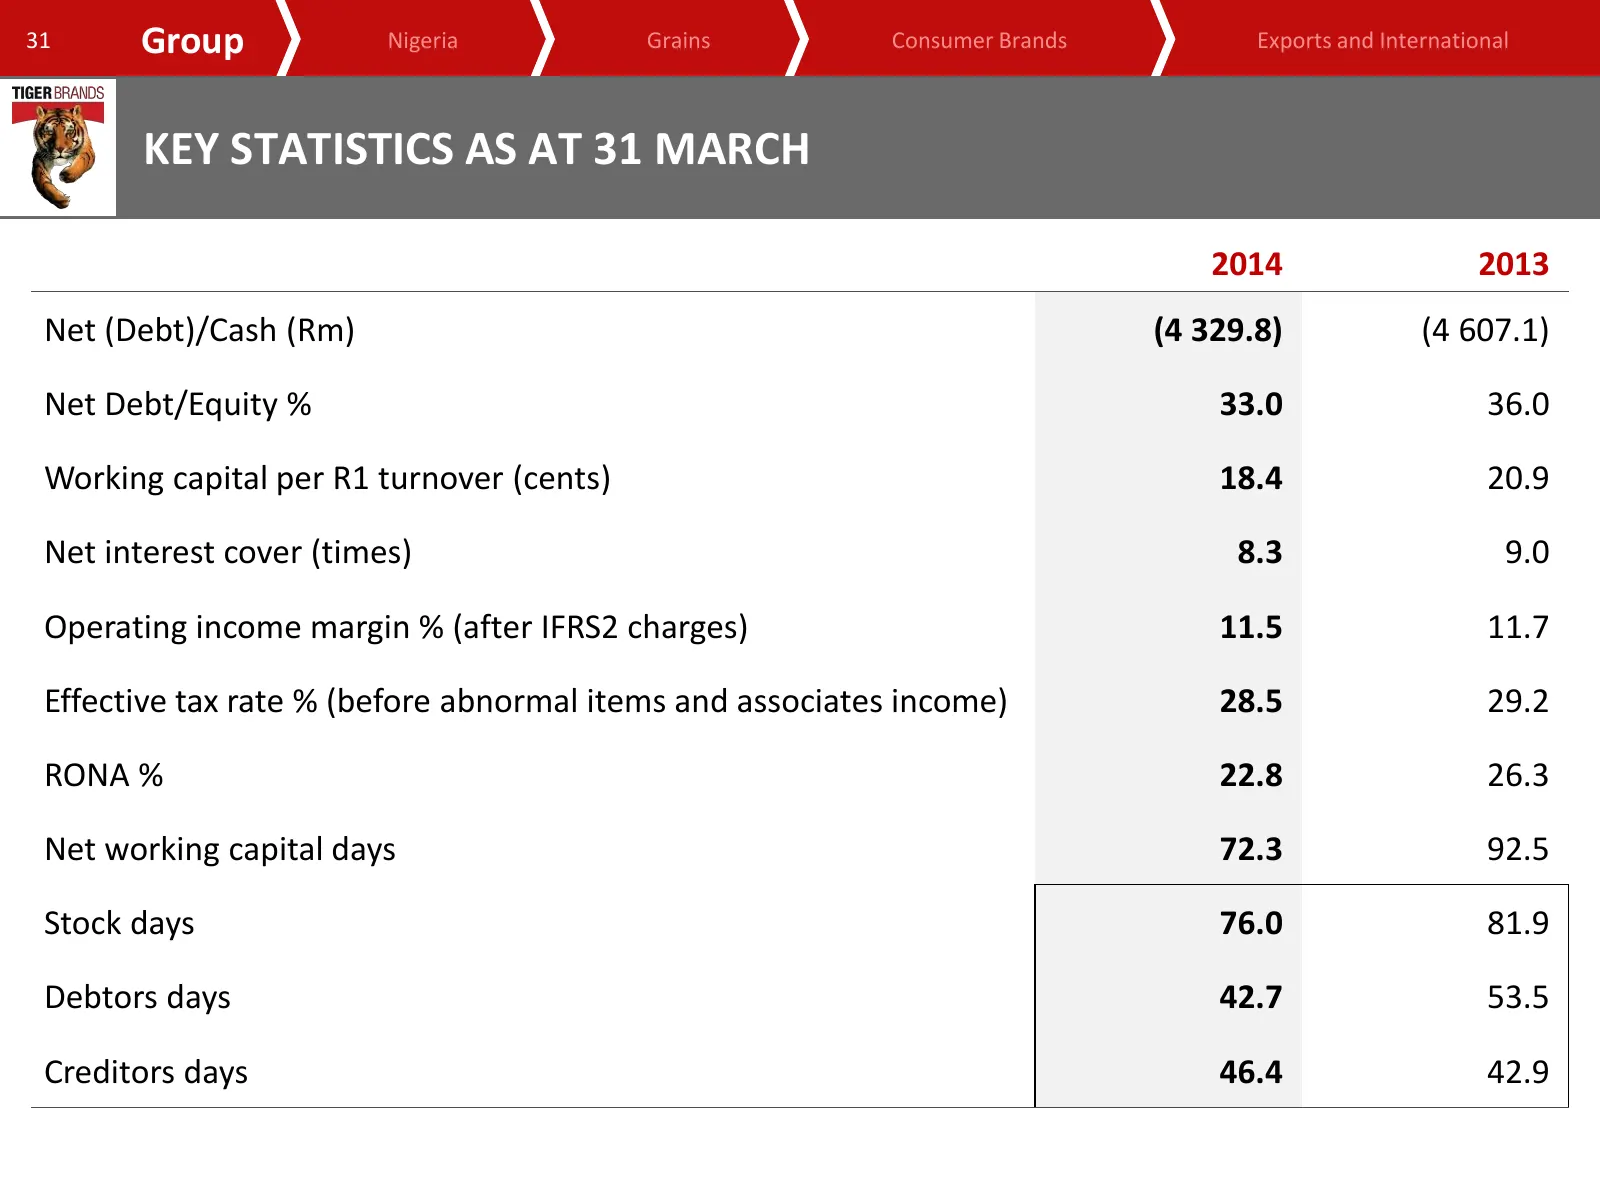
Slide 31: Key statistics as at 31 March
31 Group Nigeria Grains Consumer Brands Exports and International KEY STATISTICS AS AT 31 MARCH 2014 2013 Net (Debt)/Cash (Rm) (4 329.8) (4 607.1) Net Debt/Equity % 33.0 36.0 Working capital per R1 turnover (cents) 18.4 20.9 Net interest cover (times) 8.3 9.0 Operating income margin % (after IFRS2 c
Slide 32: Capital expenditure and commitments
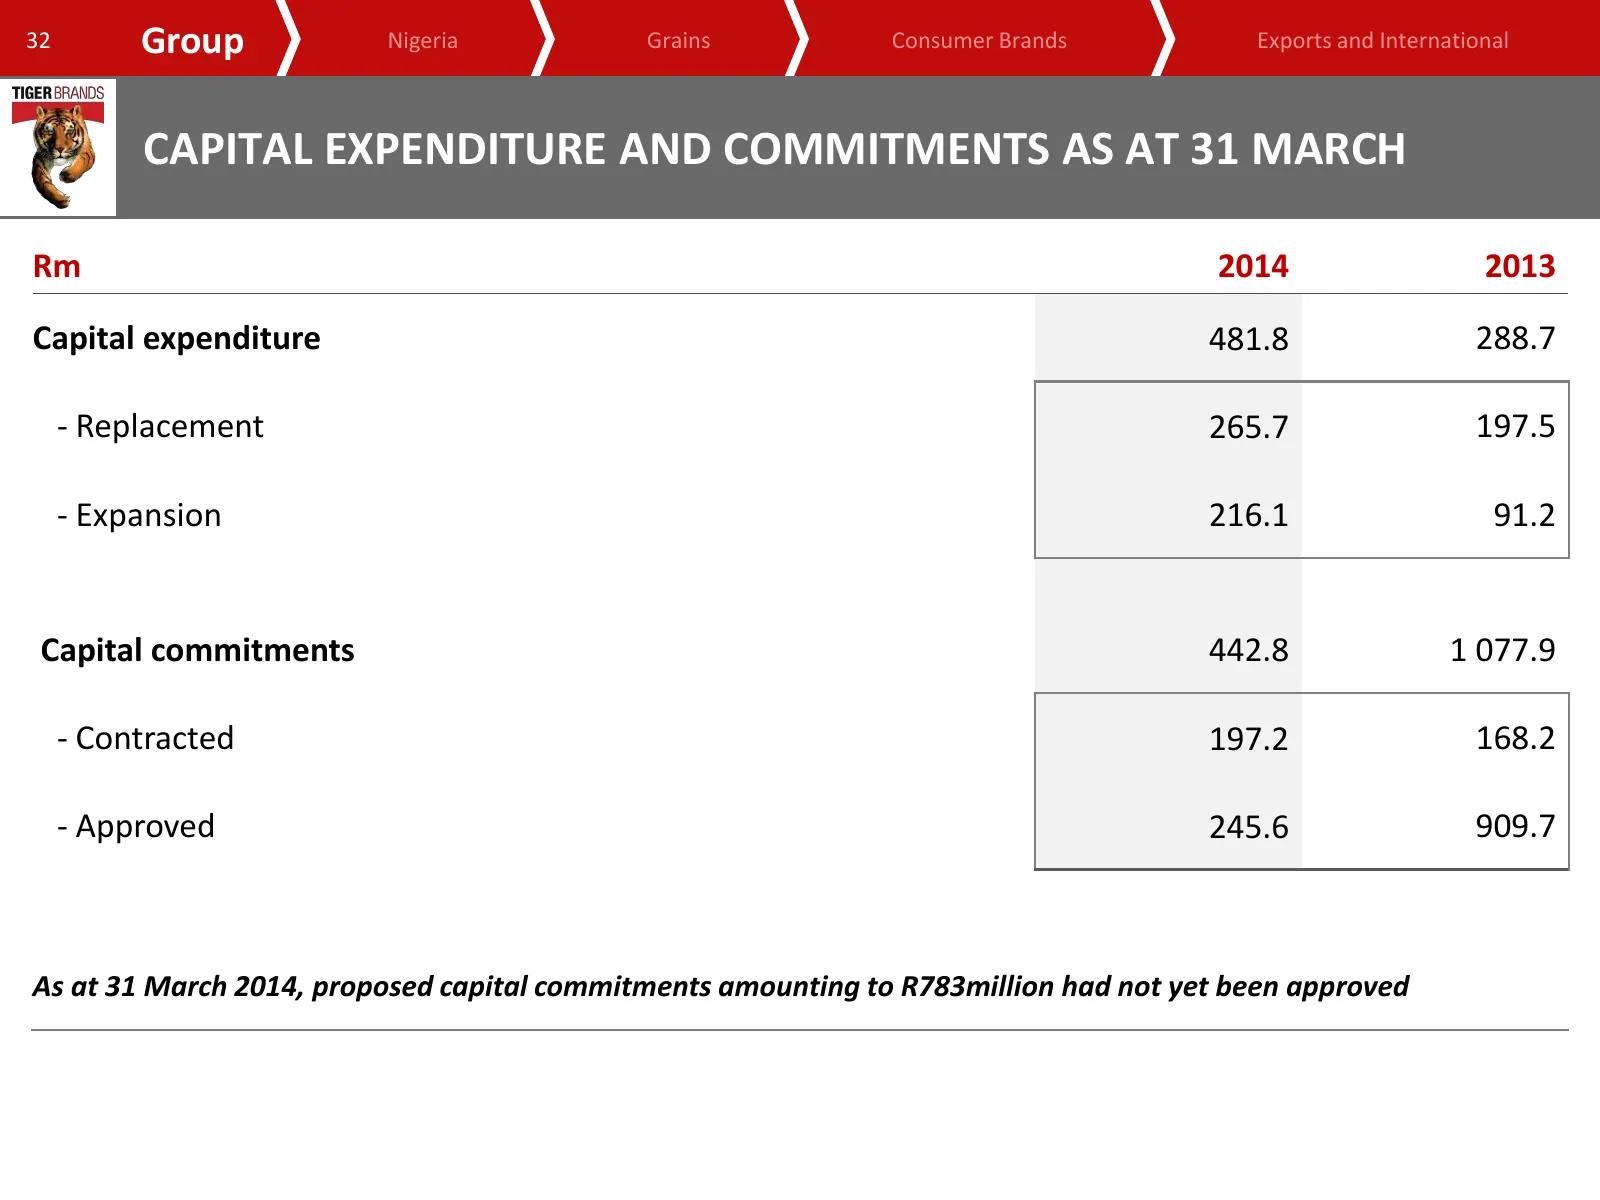
32 Group Nigeria Grains Consumer Brands Exports and International CAPITAL EXPENDITURE AND COMMITMENTS AS AT 31 MARCH Rm 2014 2013 Capital expenditure 481.8 288.7 - Replacement 265.7 197.5 - Expansion 216.1 91.2 Capital commitments 442.8 1 077.9 - Contracted 197.2 168.2 - Approved 245.6 909.7 As at 3

Slide 33: Tiger Brands Nigeria
www.tigerbrands.com Tiger Brands Nigeria Noel Doyle Business Executive
Slide 34: Tiger Brands in Nigeria
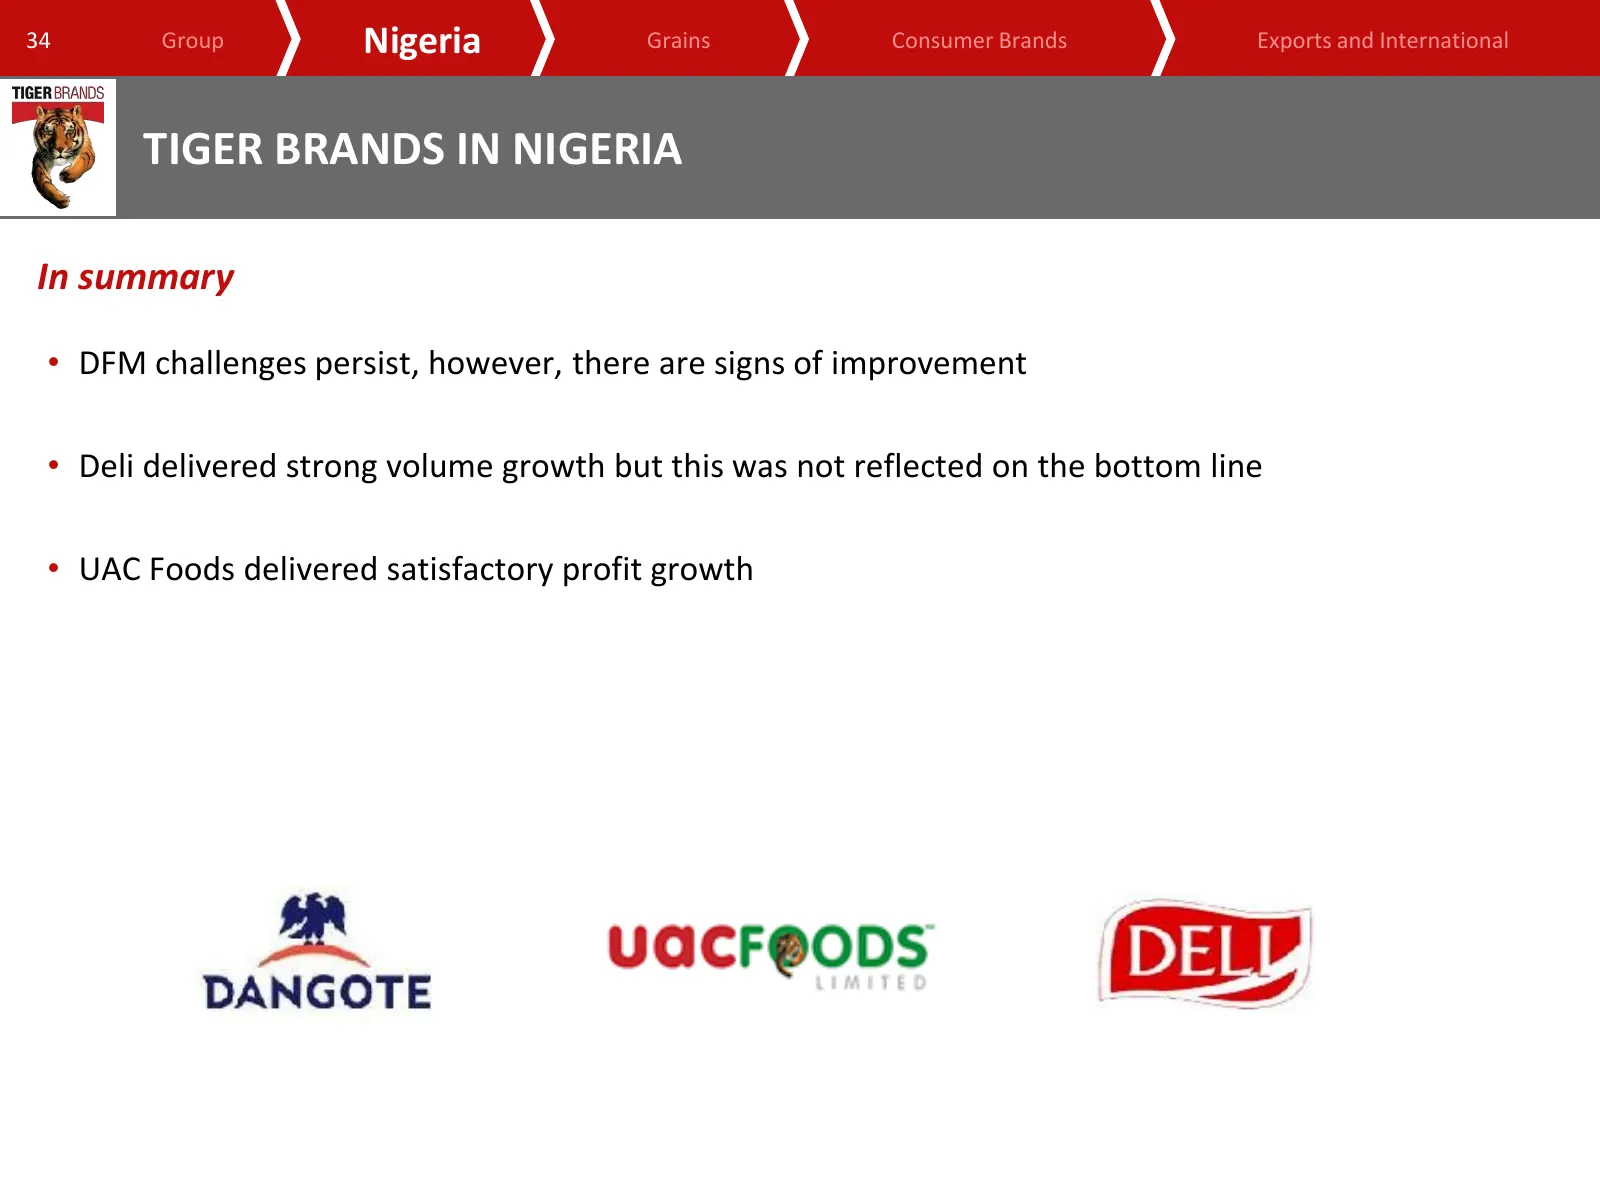
34 Group Nigeria Grains Consumer Brands Exports and International TIGER BRANDS IN NIGERIA In summary • DFM challenges persist, however, there are signs of improvement • Deli delivered strong volume growth but this was not reflected on the bottom line • UAC Foods delivered satisfactory profit growth
Slide 35: DFM
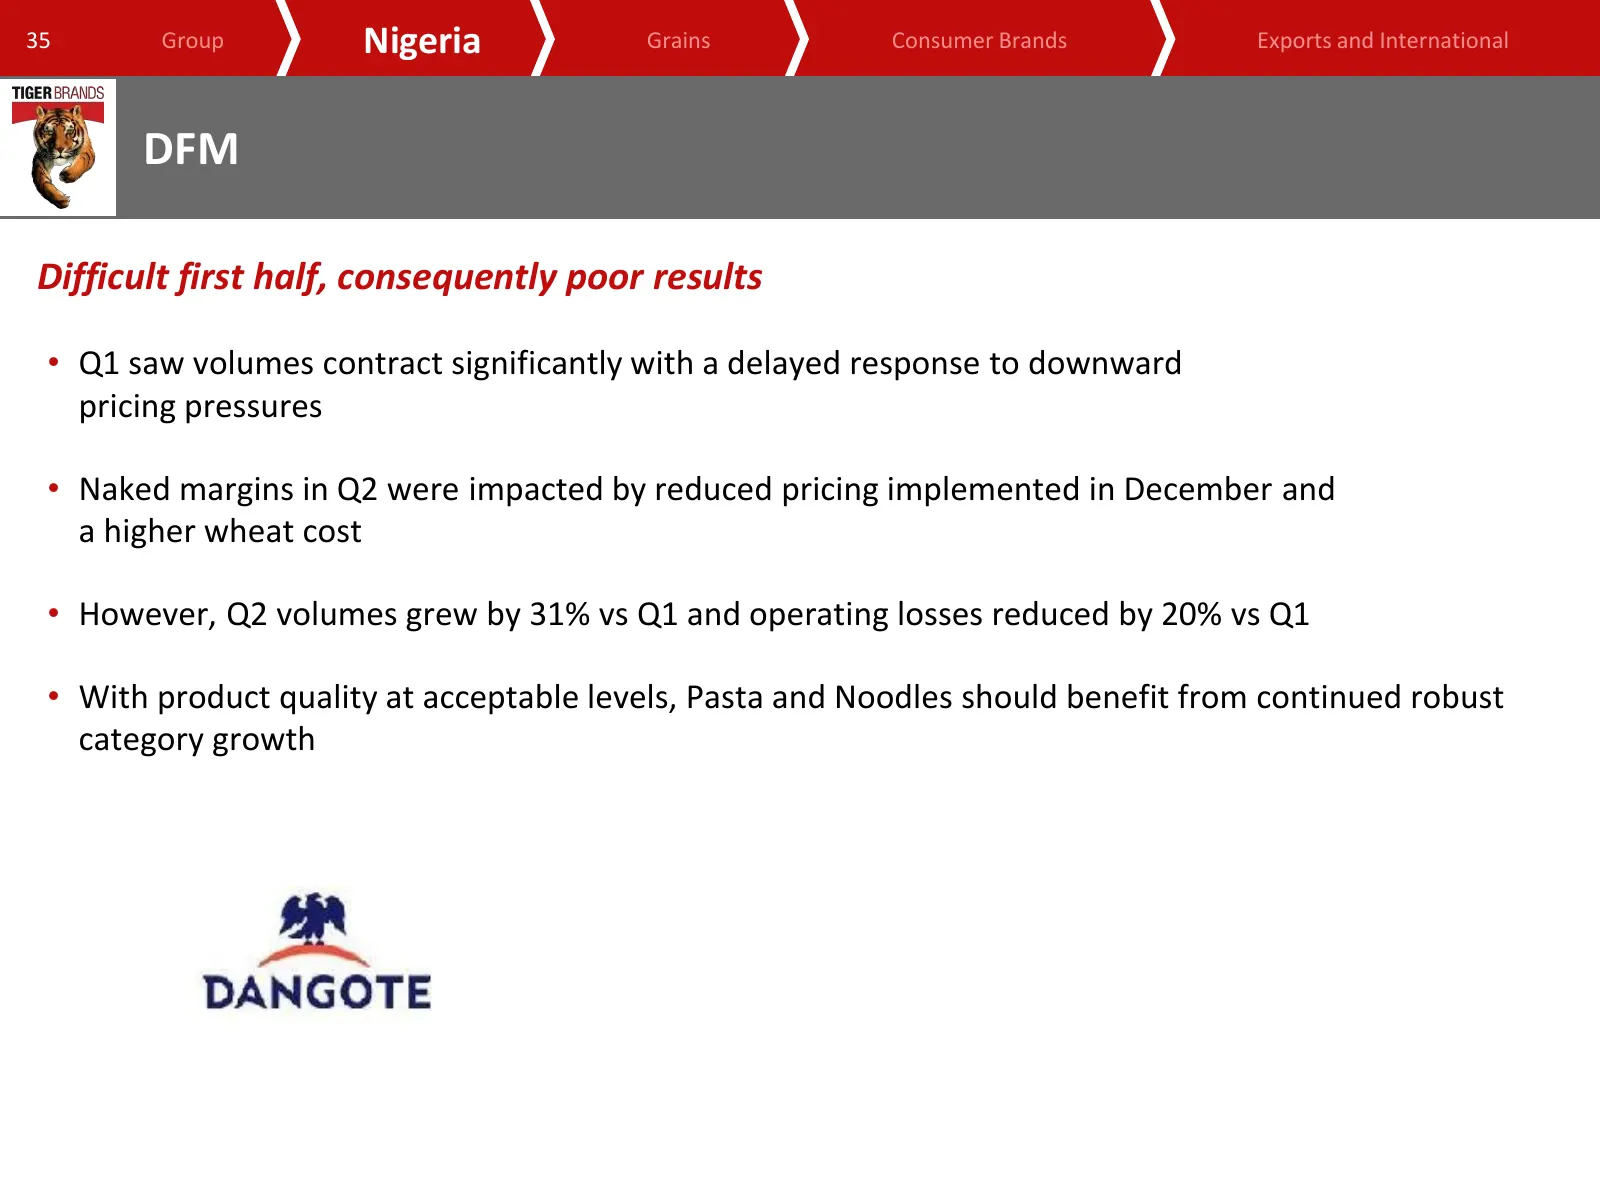
35 Group Nigeria Grains Consumer Brands Exports and International DFM Difficult first half, consequently poor results • Q1 saw volumes contract significantly with a delayed response to downward pricing pressures • Naked margins in Q2 were impacted by reduced pricing implemented in December and a hig
Slide 36: DFM
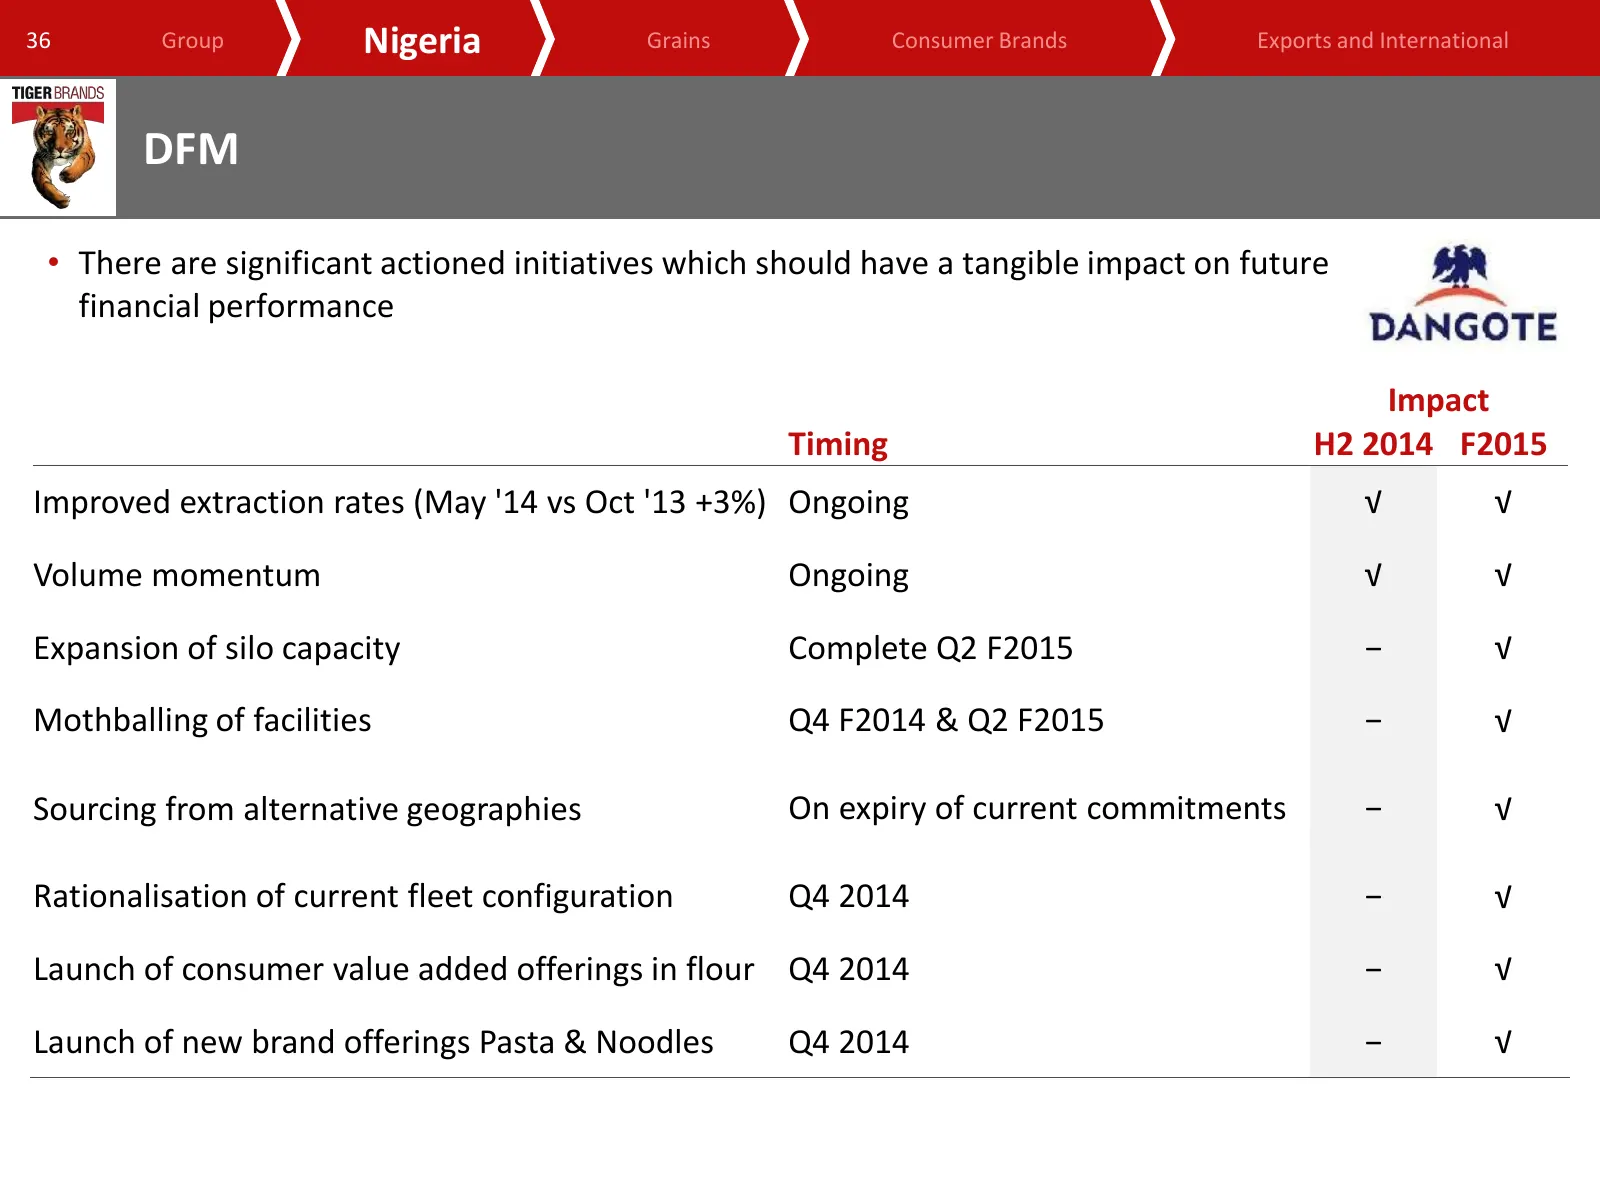
36 Group Nigeria Grains Consumer Brands Exports and International DFM • There are significant actioned initiatives which should have a tangible impact on future financial performance Impact Timing H2 2014 F2015 Improved extraction rates (May '14 vs Oct '13 +3%) Ongoing √ √ Volume momentum Ongoing √
Slide 37: DFM
37 Group Nigeria Grains Consumer Brands Exports and International DFM In Conclusion • Whilst progress is currently being made, the current core DFM business remains challenging in the short term • New CEO for DFM appointed effective 01 July 2014 • Significant opportunities exist to make a significan
Slide 38: UAC Foods
38 Group Nigeria Grains Consumer Brands Exports and International UAC FOODS Satisfactory profit growth, however new entrants have intensified the competitive landscape Salient points • Intensified competitor activity • Pleasing progress in market penetration • Sustained turnaround in dairies and bev

Slide 39: Grains
www.tigerbrands.com Grains Noel Doyle Business Executive
Slide 40: Grains overview
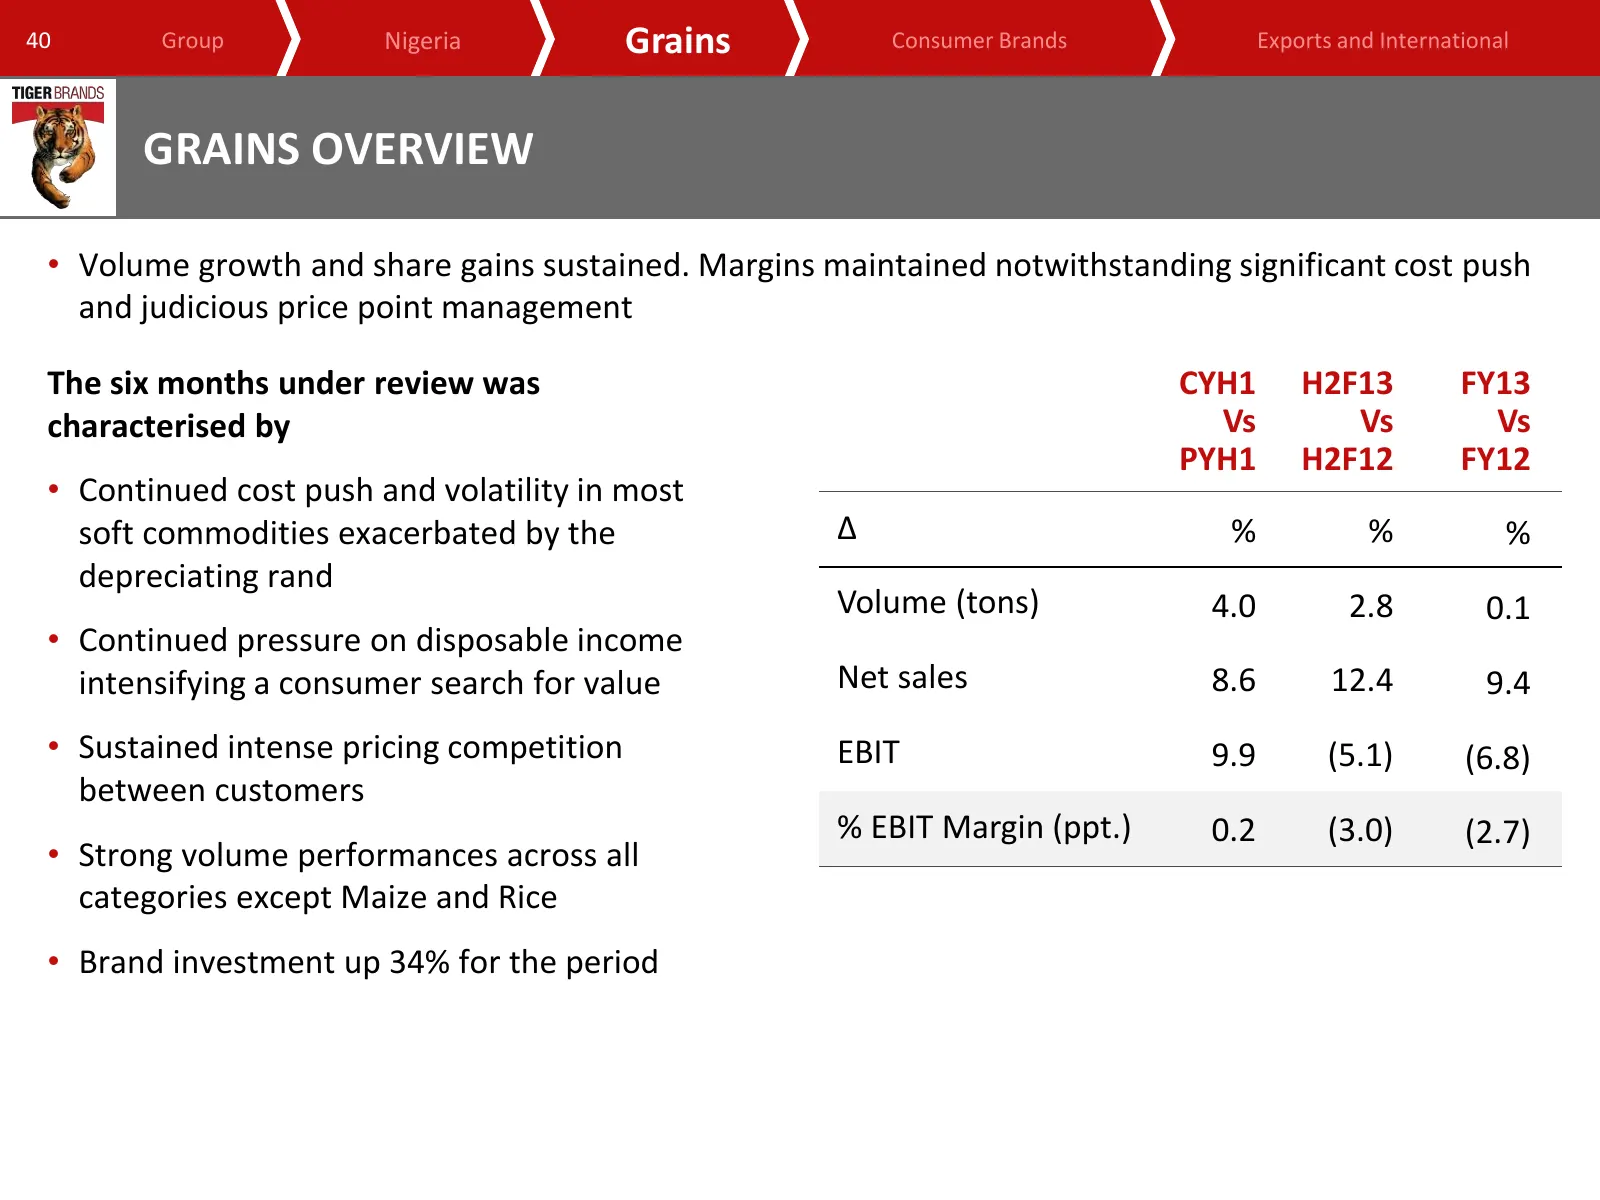
40 Group Nigeria Grains Consumer Brands Exports and International GRAINS OVERVIEW • Volume growth and share gains sustained. Margins maintained notwithstanding significant cost push and judicious price point management The six months under review was CYH1 H2F13 FY13 characterised by Vs Vs Vs PYH1 H2
Slide 41: Market share recoveries sustained in a tough trading environment
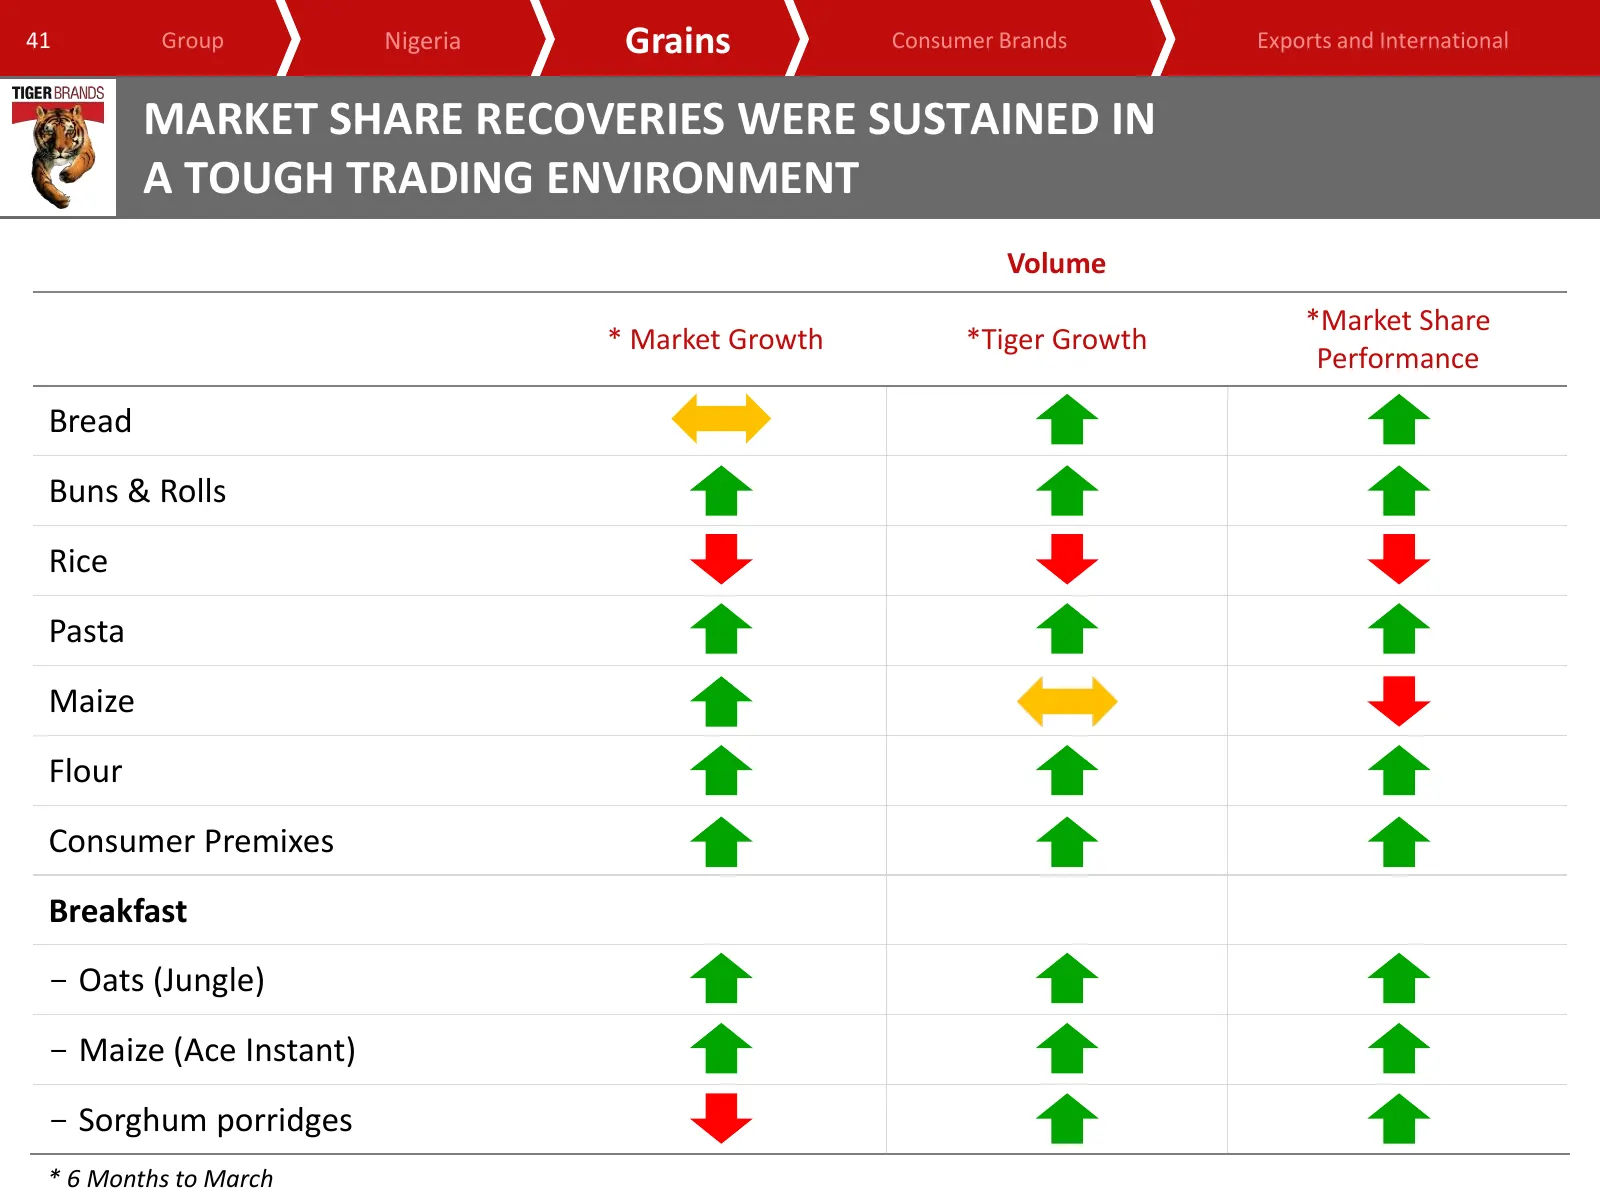
41 Group Nigeria Grains Consumer Brands Exports and International MARKET SHARE RECOVERIES WERE SUSTAINED IN A TOUGH TRADING ENVIRONMENT Volume *Market Share * Market Growth *Tiger Growth Performance Bread Buns & Rolls Rice Pasta Maize Flour Consumer Premixes Breakfast - Oats (Jungle) - Maize (Ace In
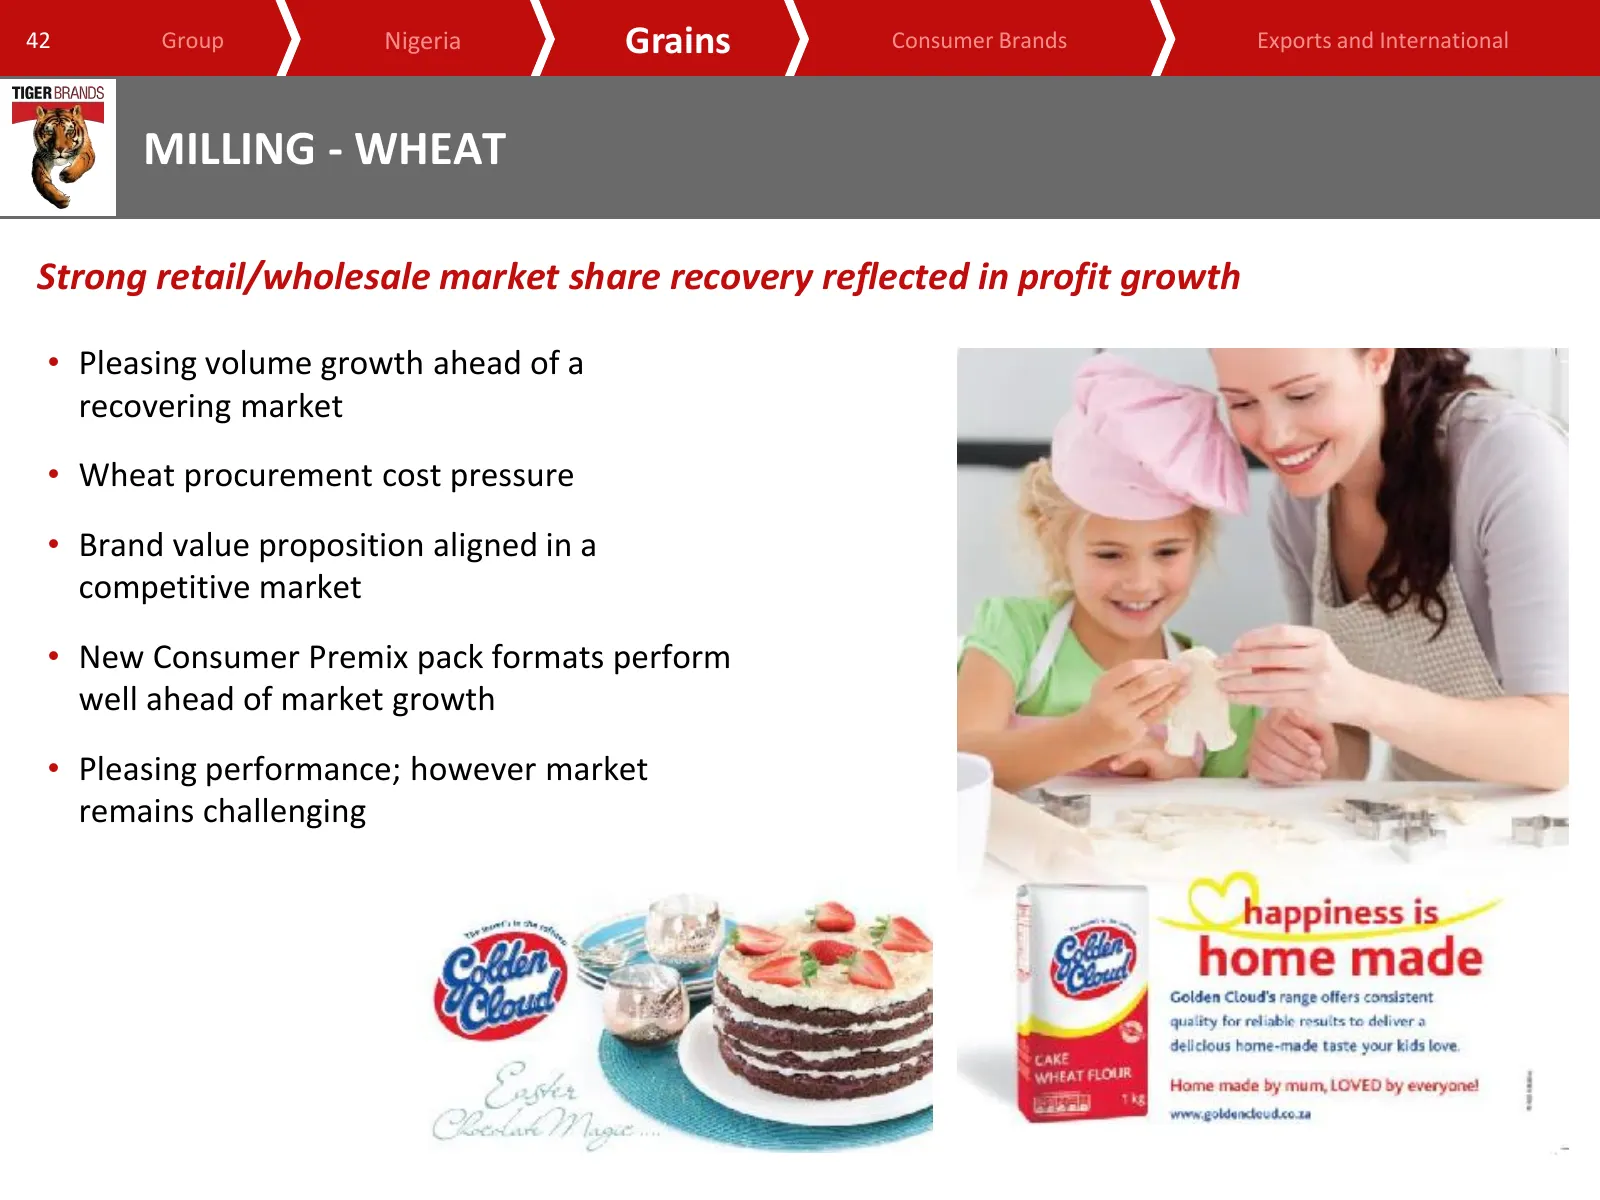
Slide 42: Milling - Wheat
42 Group Nigeria Grains Consumer Brands Exports and International MILLING - WHEAT Strong retail/wholesale market share recovery reflected in profit growth • Pleasing volume growth ahead of a recovering market • Wheat procurement cost pressure • Brand value proposition aligned in a competitive market
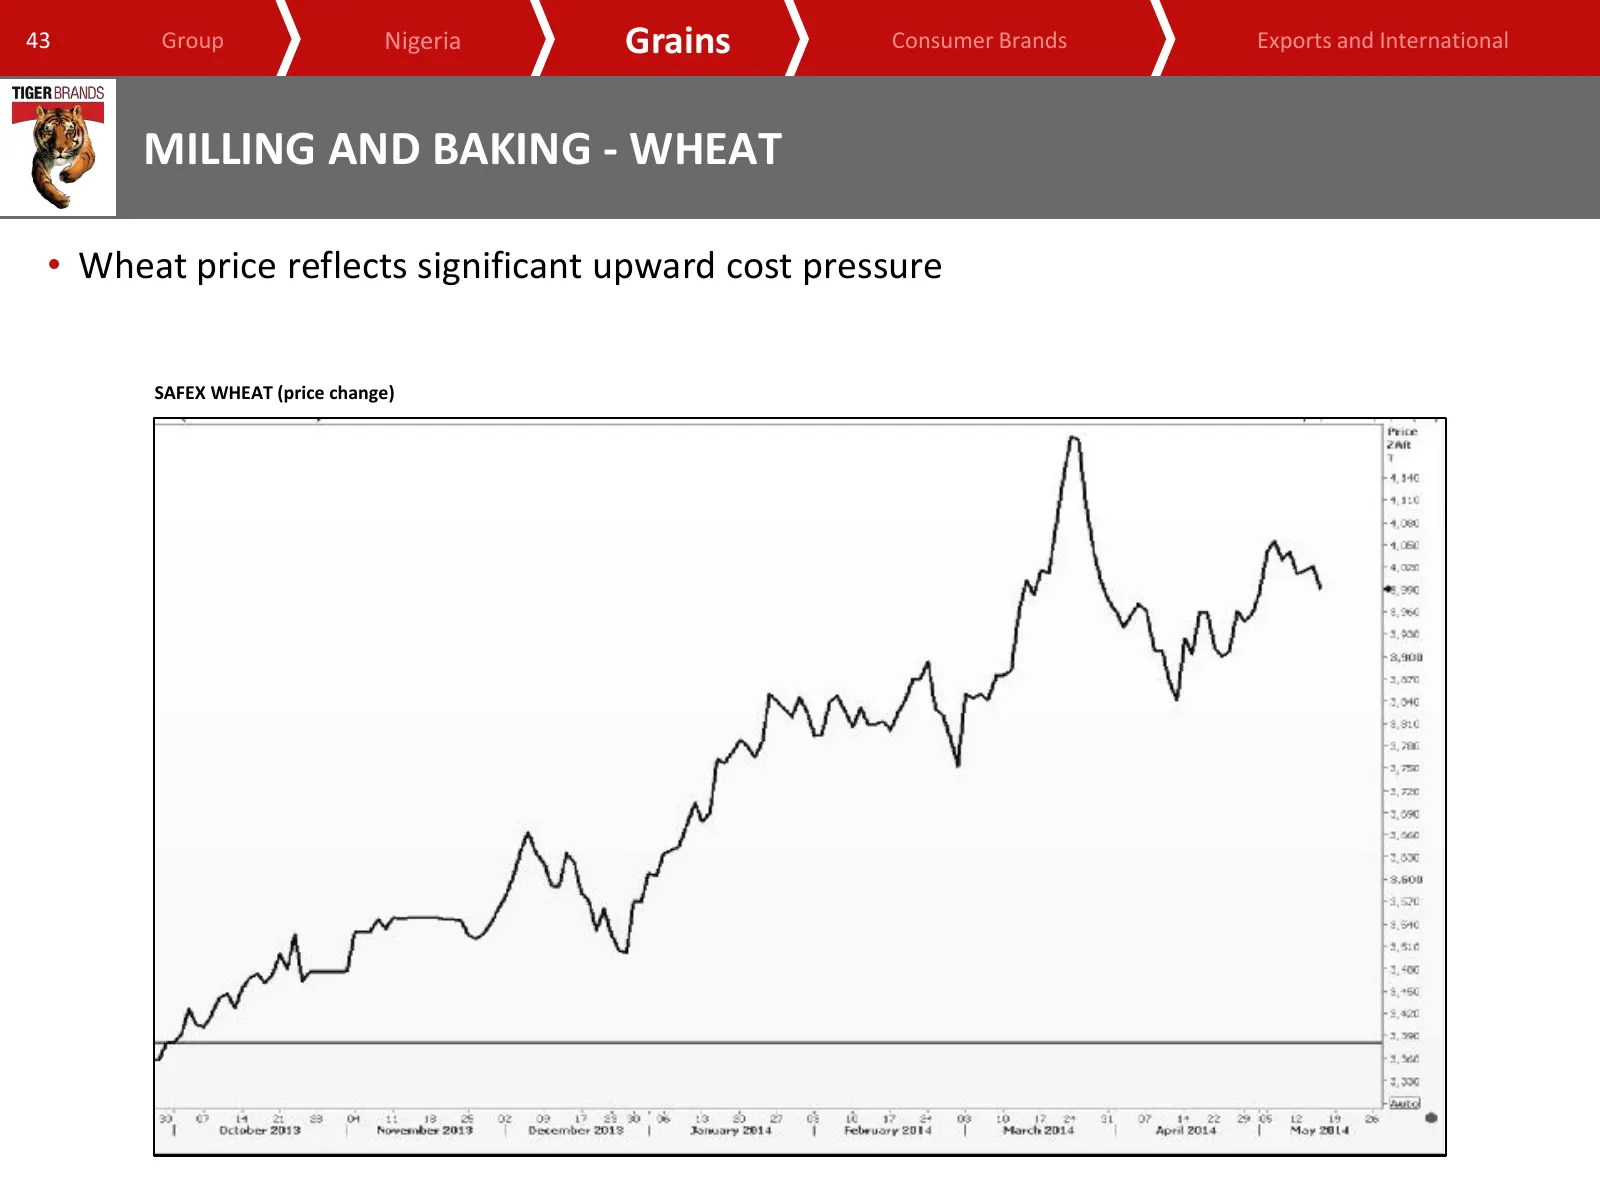
Slide 43: Milling and Baking - Wheat
43 Group Nigeria Grains Consumer Brands Exports and International MILLING AND BAKING - WHEAT • Wheat price reflects significant upward cost pressure SAFEX WHEAT (price change)
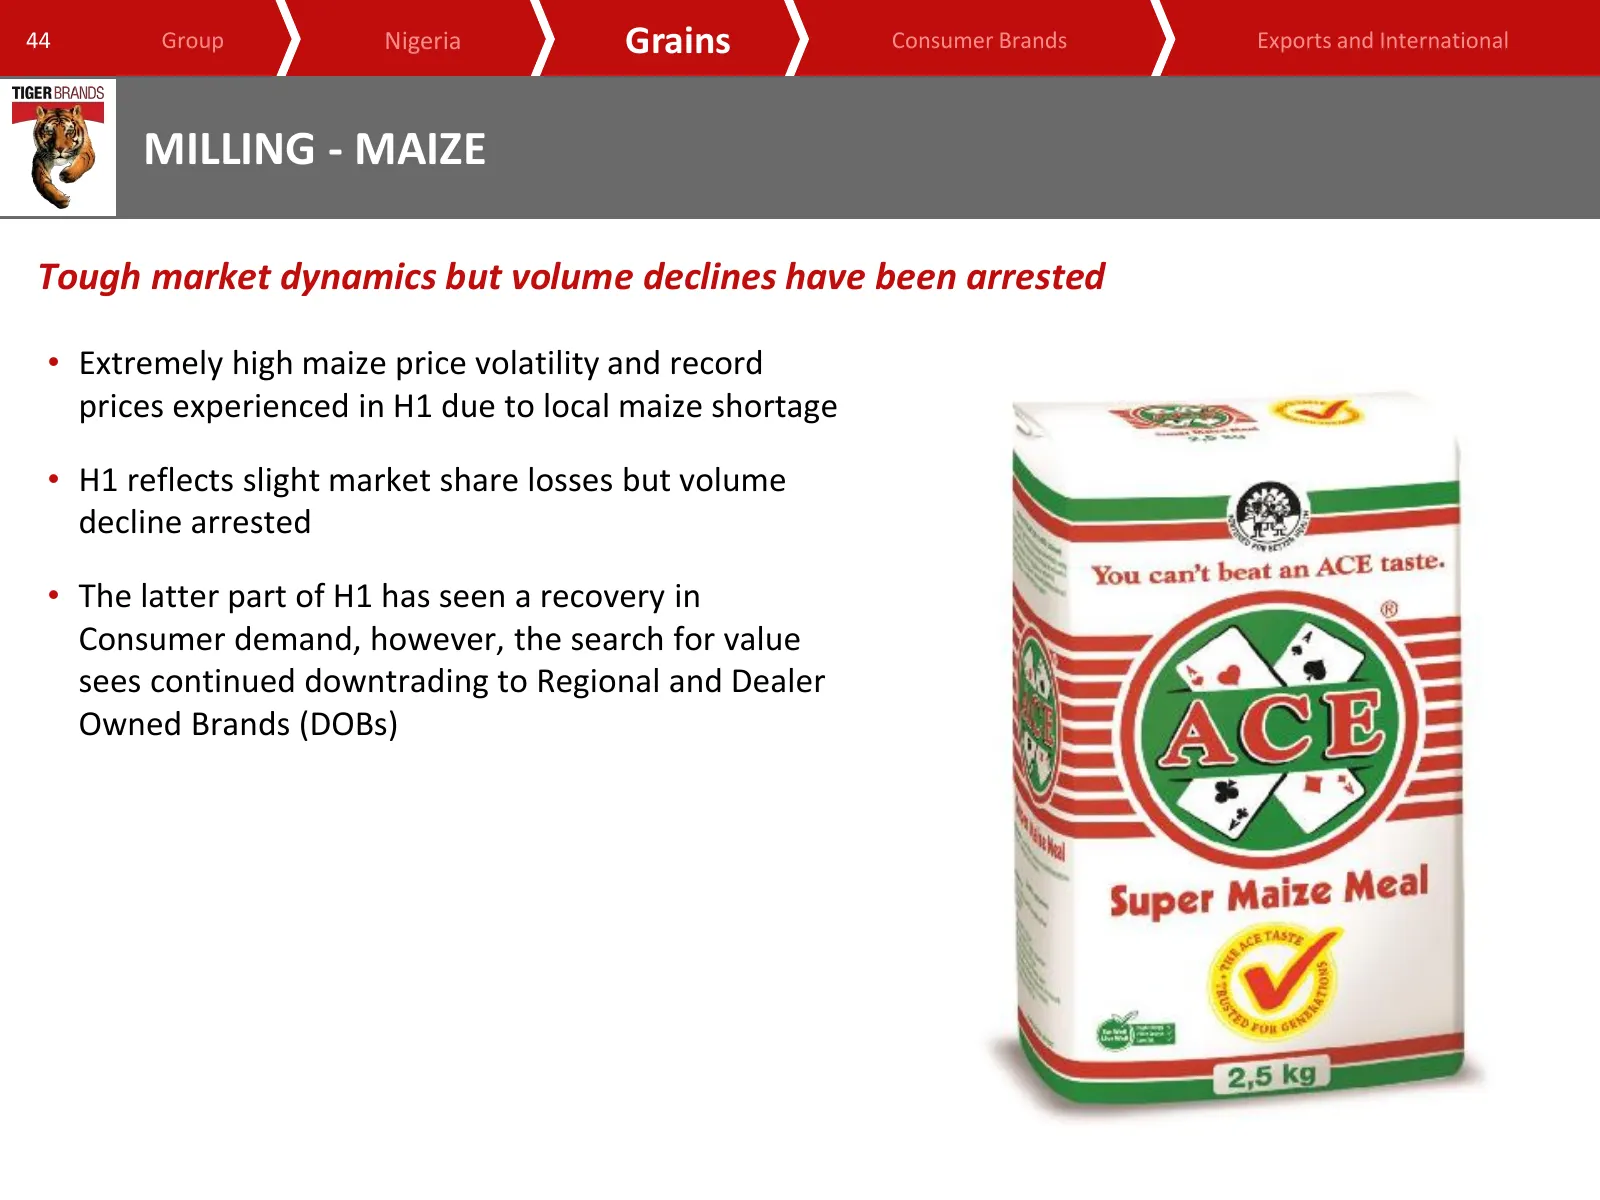
Slide 44: Milling - Maize
44 Group Nigeria Grains Consumer Brands Exports and International MILLING - MAIZE Tough market dynamics but volume declines have been arrested • Extremely high maize price volatility and record prices experienced in H1 due to local maize shortage • H1 reflects slight market share losses but volume d
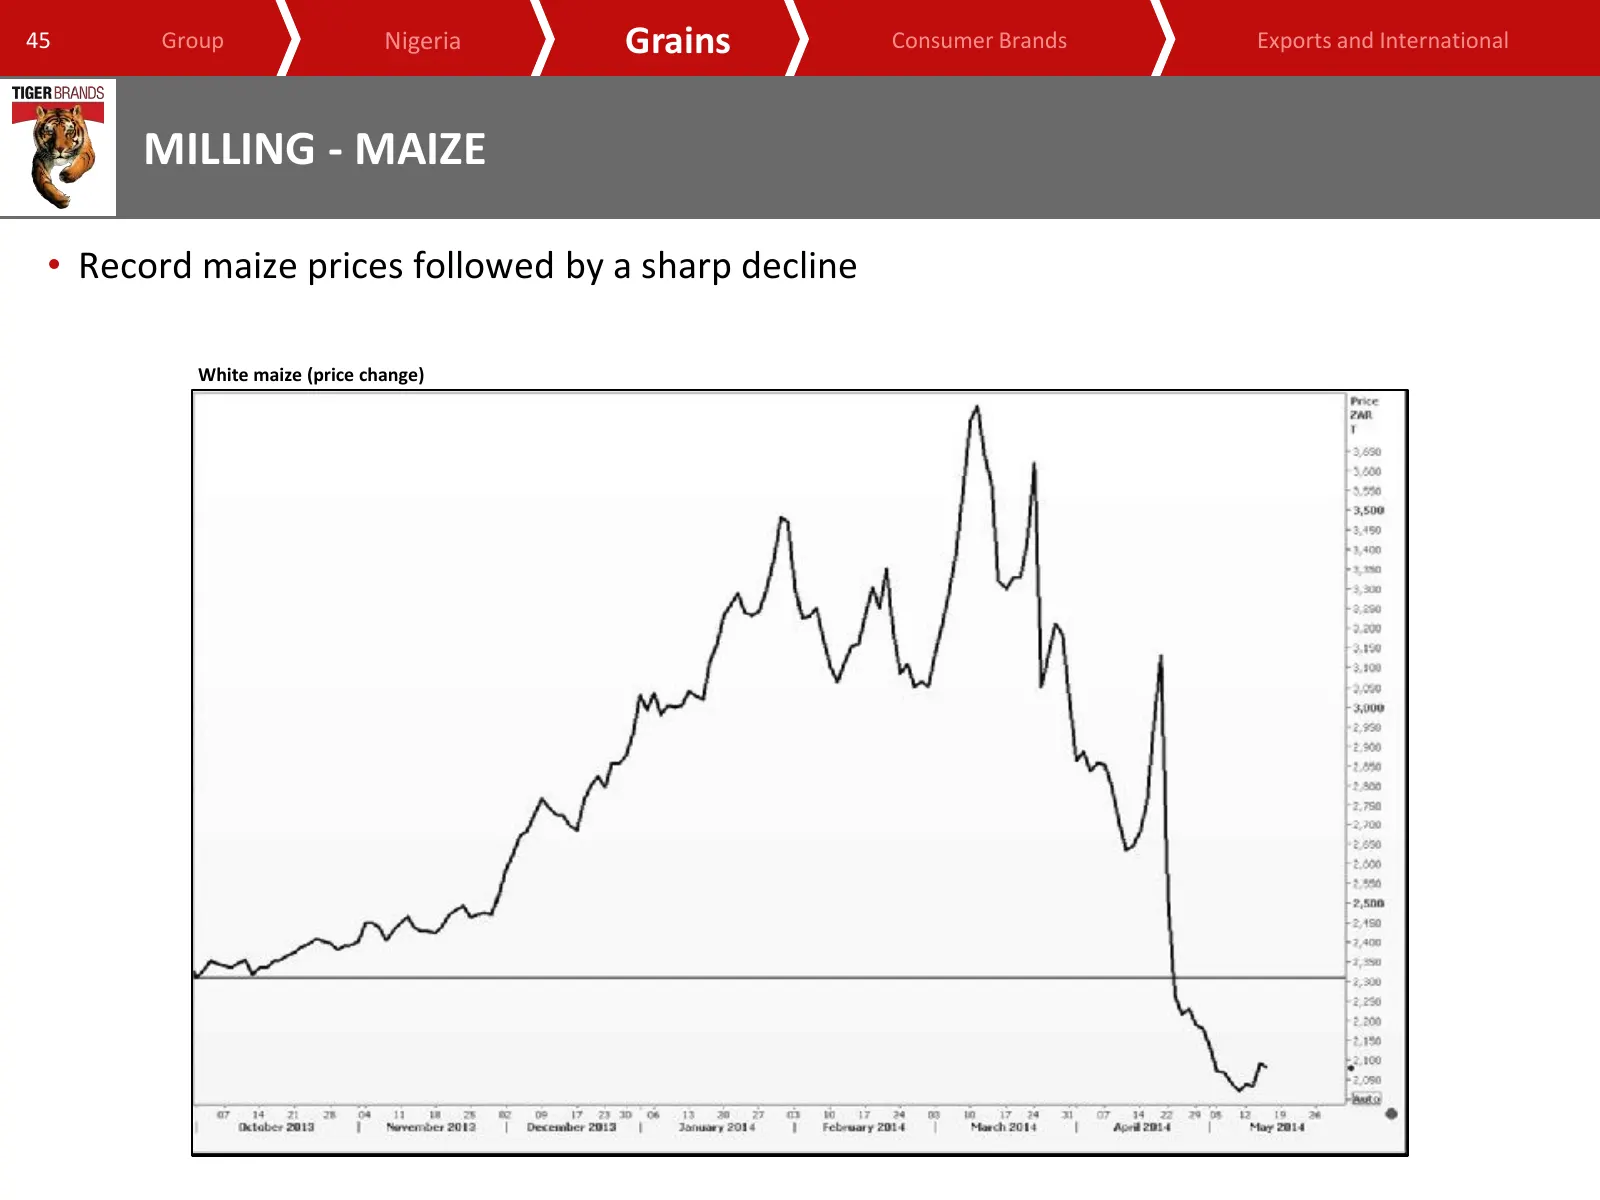
Slide 45: Milling - Maize
45 Group Nigeria Grains Consumer Brands Exports and International MILLING - MAIZE • Record maize prices followed by a sharp decline White maize (price change)
Slide 46: Milling - Bakeries
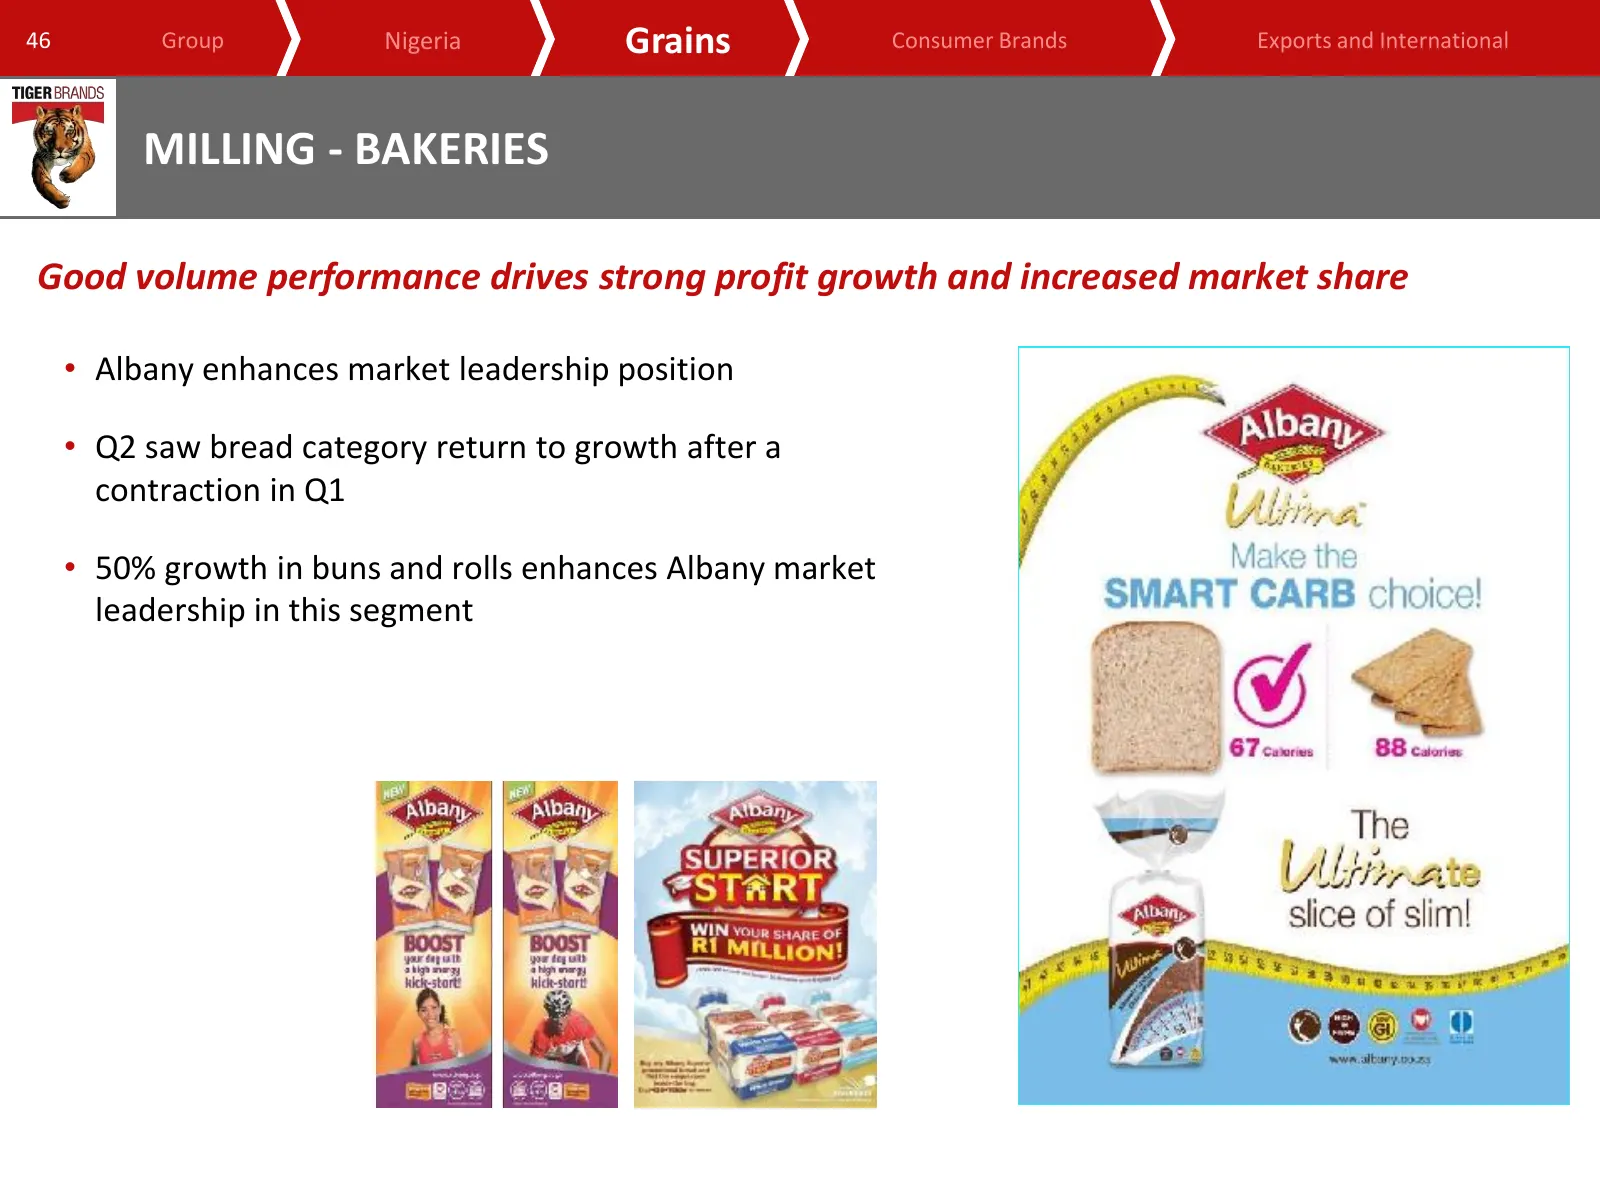
46 Group Nigeria Grains Consumer Brands Exports and International MILLING - BAKERIES Good volume performance drives strong profit growth and increased market share • Albany enhances market leadership position • Q2 saw bread category return to growth after a contraction in Q1 • 50% growth in buns and
Slide 47: Breakfast cereals and sorghum beverages
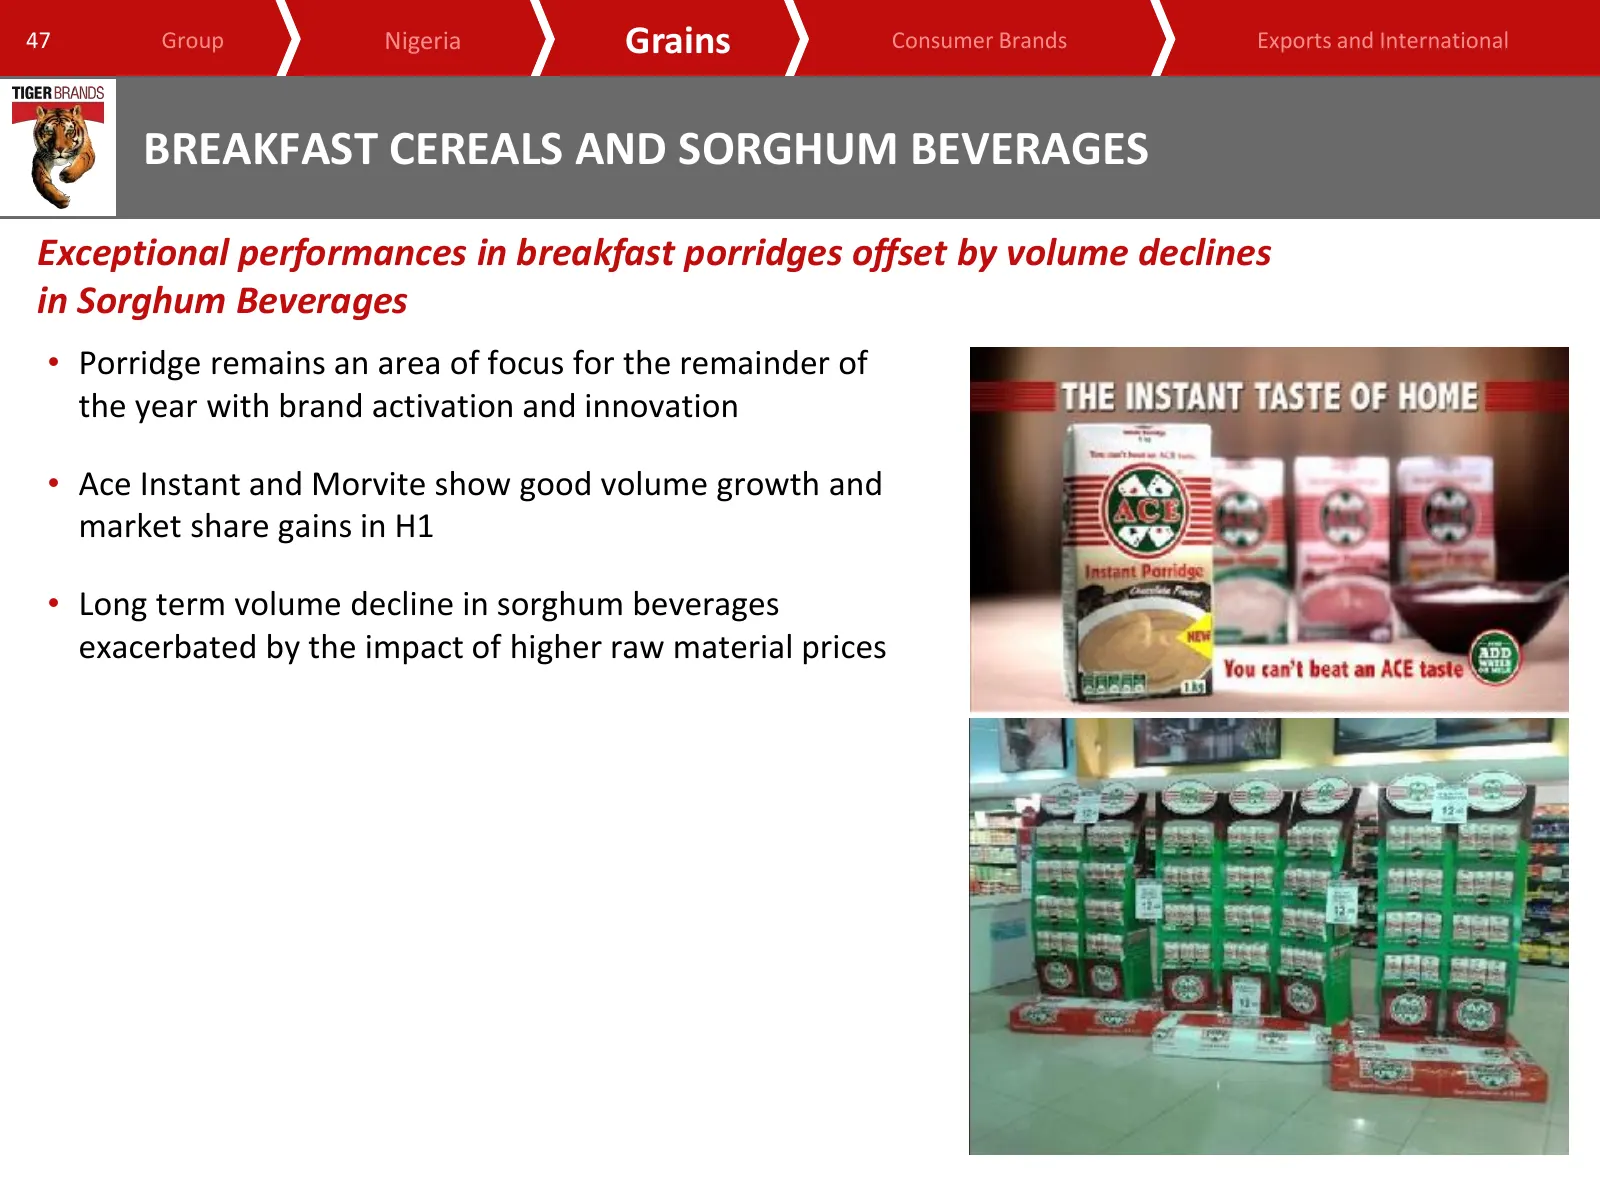
47 Group Nigeria Grains Consumer Brands Exports and International BREAKFAST CEREALS AND SORGHUM BEVERAGES Exceptional performances in breakfast porridges offset by volume declines in Sorghum Beverages • Porridge remains an area of focus for the remainder of the year with brand activation and innovat
Slide 48: Breakfast cereals - Jungle
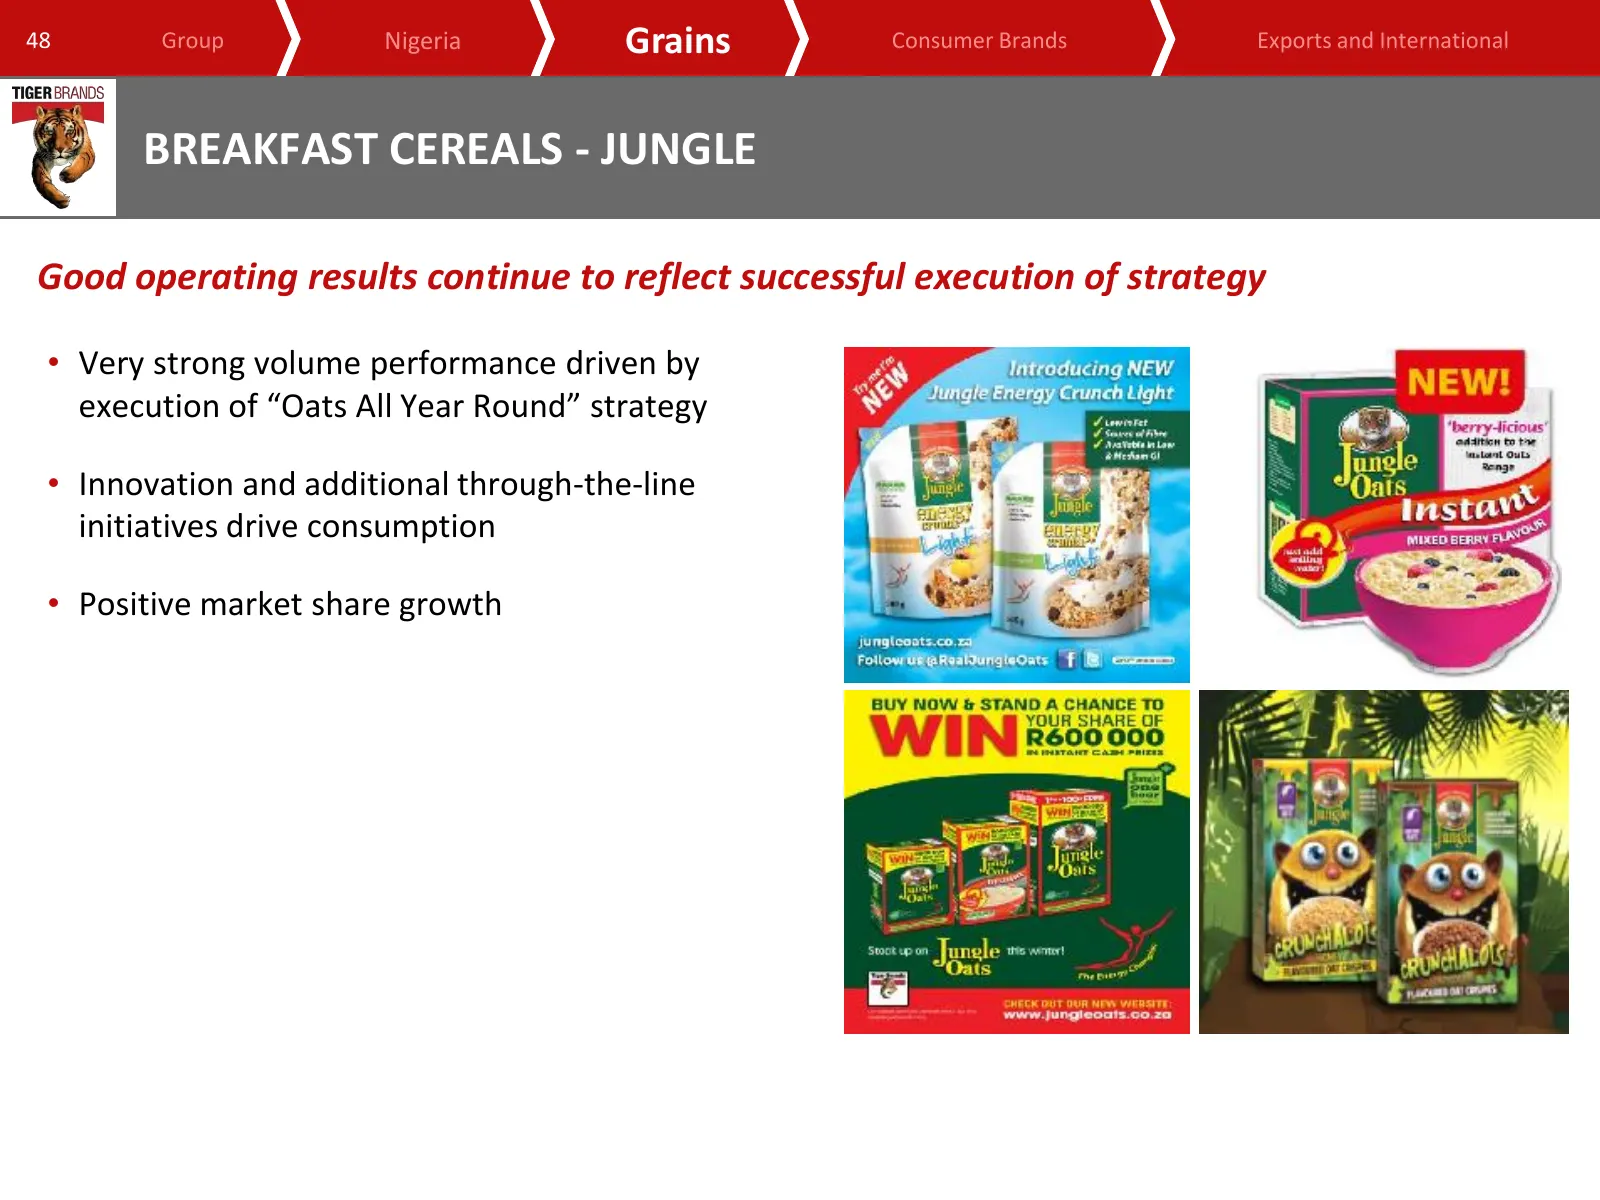
48 Group Nigeria Grains Consumer Brands Exports and International BREAKFAST CEREALS - JUNGLE Good operating results continue to reflect successful execution of strategy • Very strong volume performance driven by execution of “Oats All Year Round” strategy • Innovation and additional through-the-line
Slide 49: Other Grains - Rice
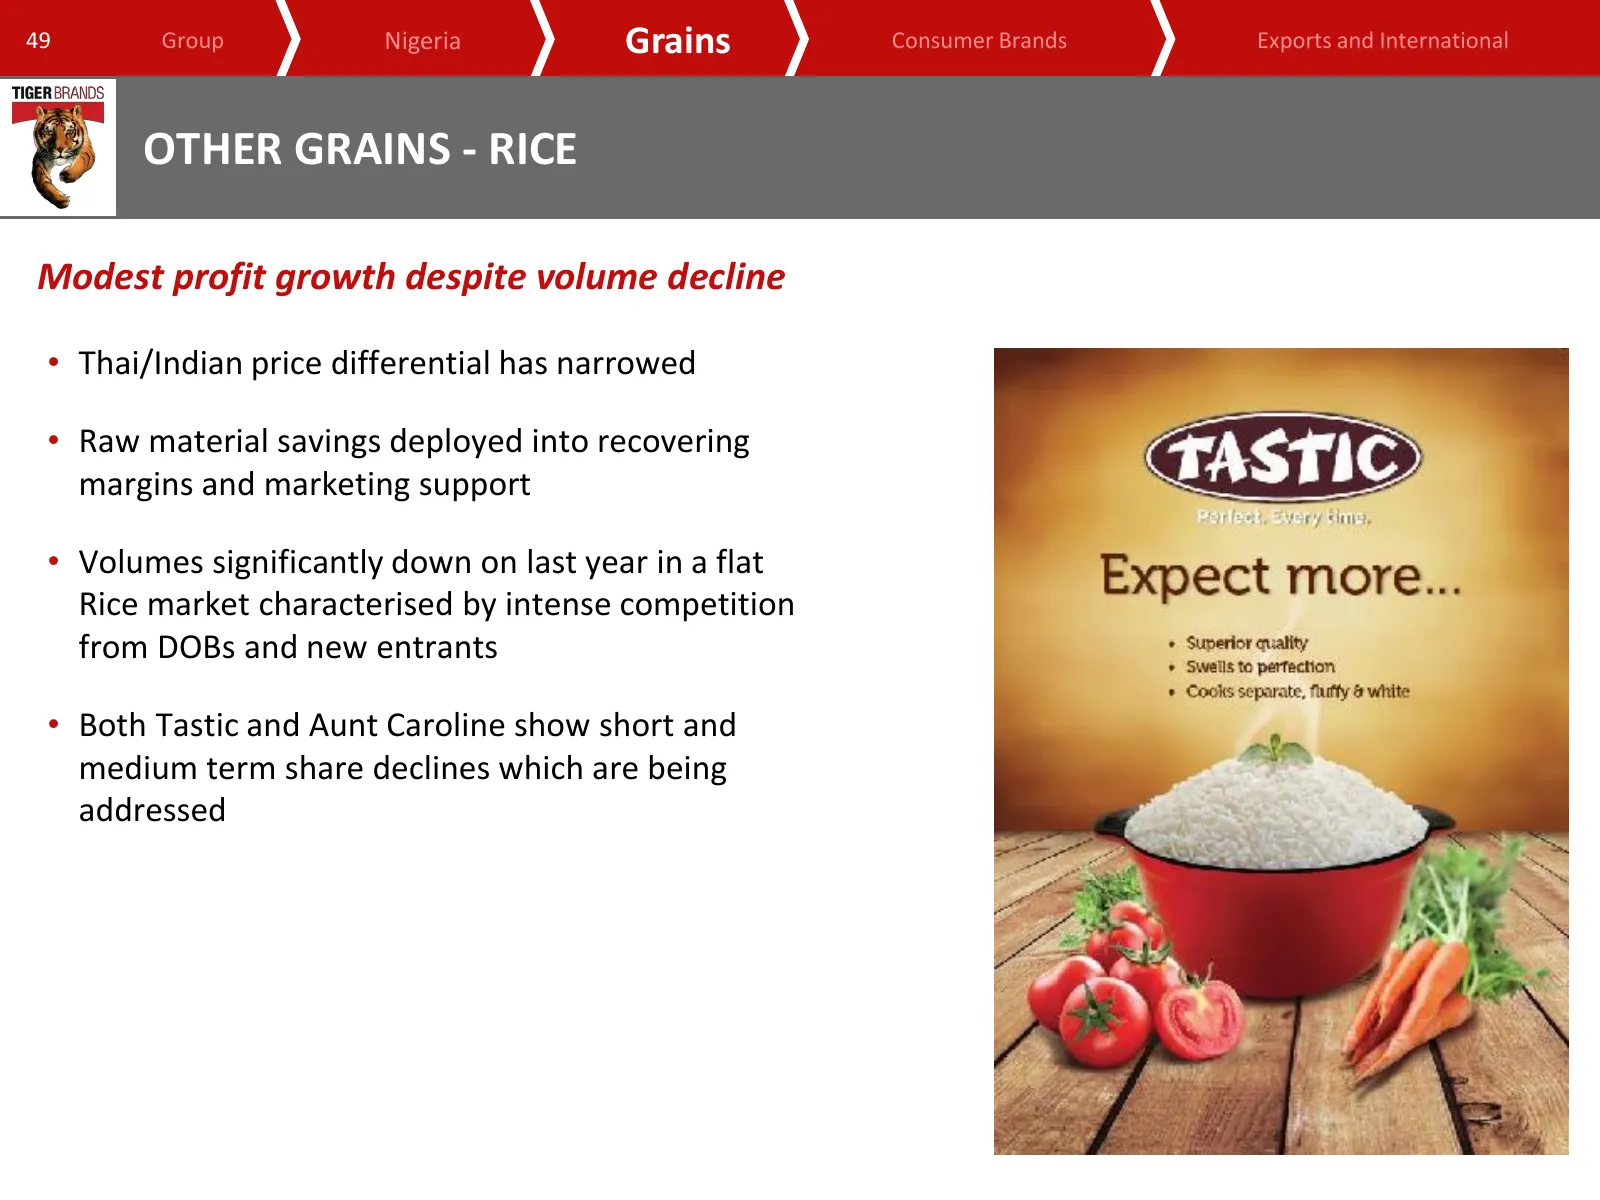
49 Group Nigeria Grains Consumer Brands Exports and International OTHER GRAINS - RICE Modest profit growth despite volume decline • Thai/Indian price differential has narrowed • Raw material savings deployed into recovering margins and marketing support • Volumes significantly down on last year in a
Slide 50: Other Grains - Pasta
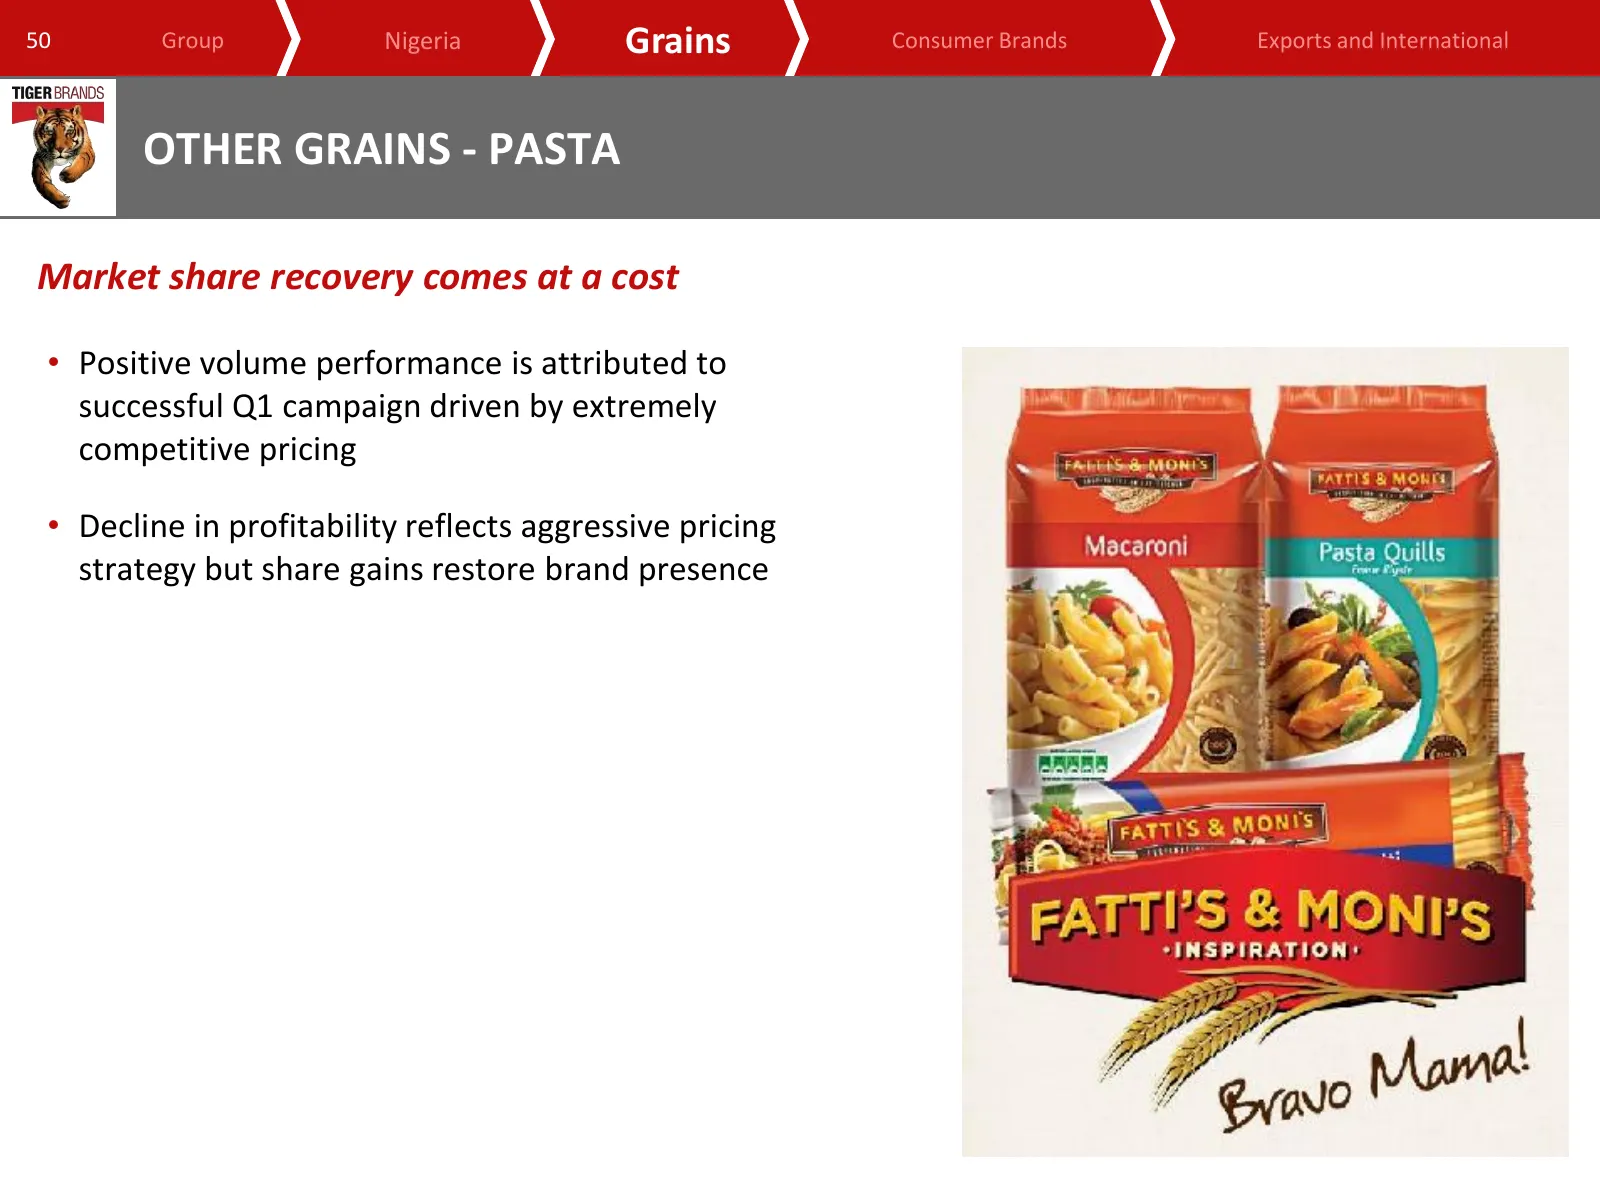
50 Group Nigeria Grains Consumer Brands Exports and International OTHER GRAINS - PASTA Market share recovery comes at a cost • Positive volume performance is attributed to successful Q1 campaign driven by extremely competitive pricing • Decline in profitability reflects aggressive pricing strategy b
Slide 51: Grains summary
51 Group Nigeria Grains Consumer Brands Exports and International GRAINS SUMMARY • Underlying business health metrics continued to improve in H1, reflected in satisfactory volume and EBIT growth • Continued focus on in-market execution and marketing investment behind brands • Full impact on the cons

Slide 52: Consumer Brands
www.tigerbrands.com Consumer Brands Grattan Kirk Business Executive
Slide 53: Groceries – back to basics approach
53 Group Nigeria Grains Consumer Brands Exports and International GROCERIES – BACK TO BASICS APPROACH • Strengthened management team in place • Strategy to recover volume and market share in H1 successful • Price increase implemented in H2 to recover margins • Supply chain optimisation projects on t
Slide 54: Groceries – rebuilding market share
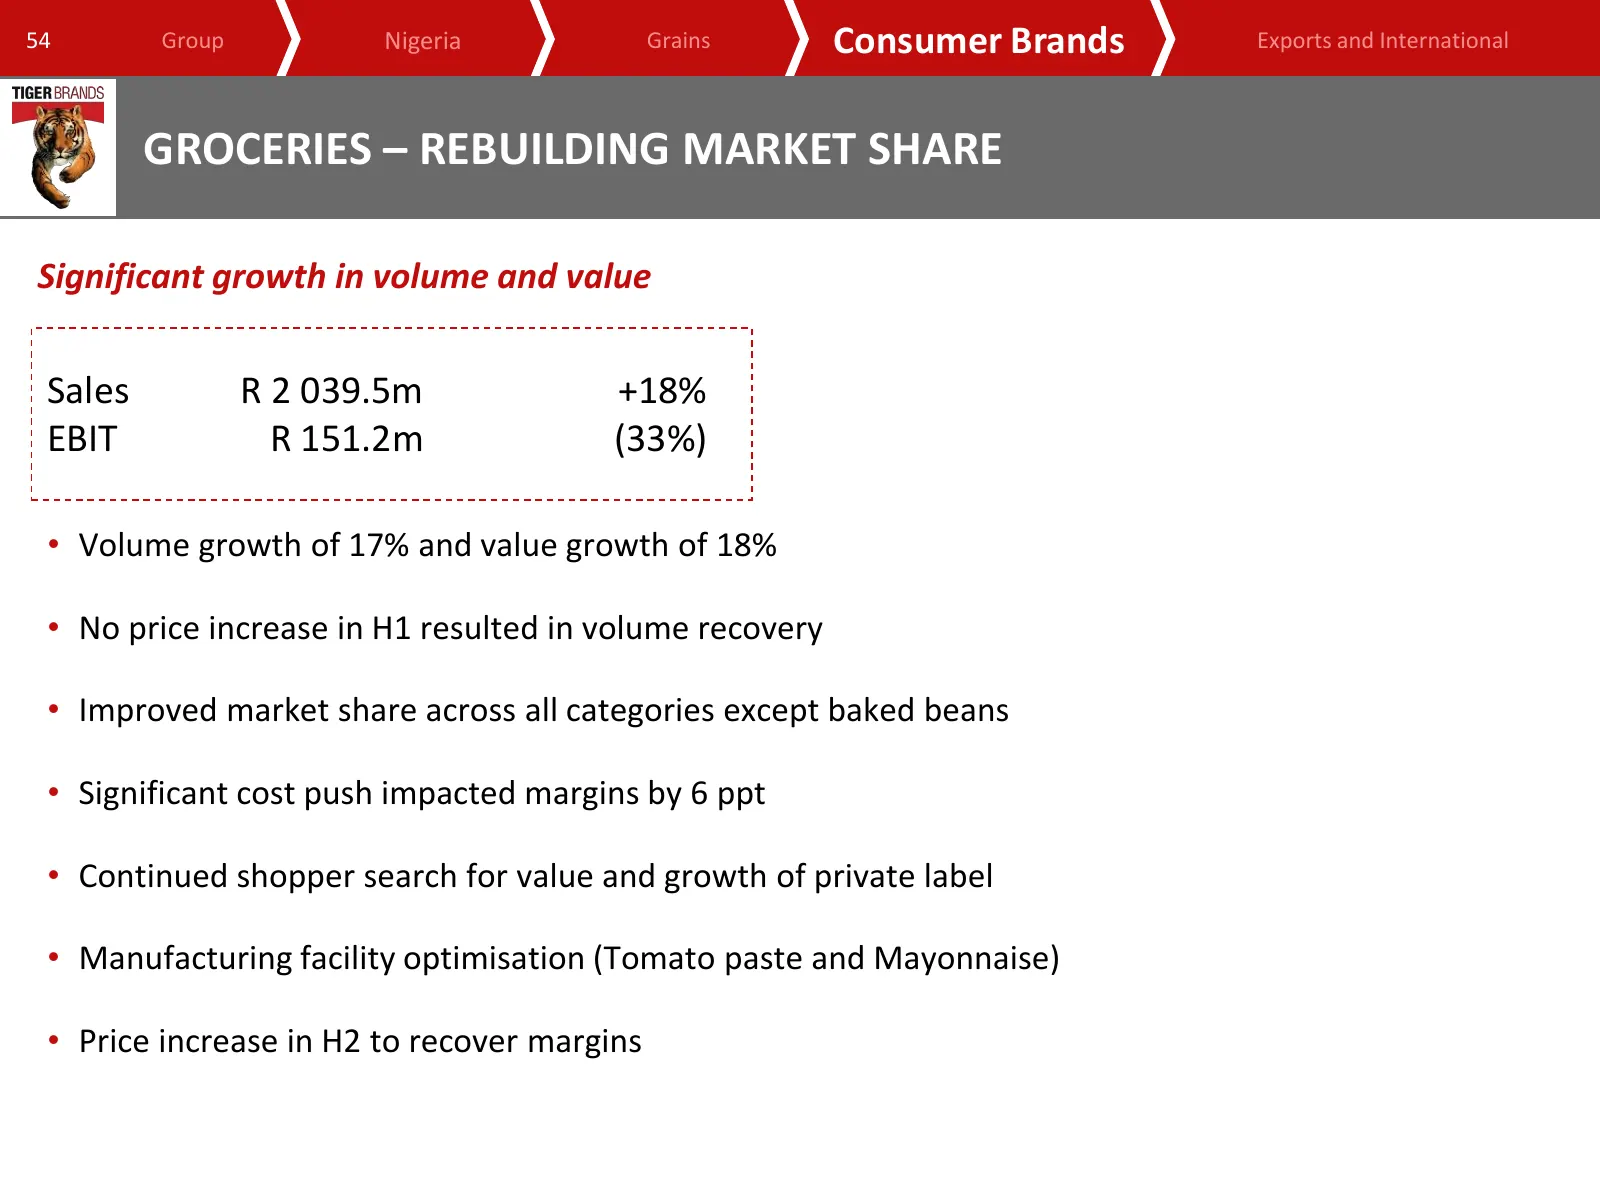
54 Group Nigeria Grains Consumer Brands Exports and International GROCERIES – REBUILDING MARKET SHARE Significant growth in volume and value Sales R 2 039.5m +18% EBIT R 151.2m (33%) • Volume growth of 17% and value growth of 18% • No price increase in H1 resulted in volume recovery • Improved marke
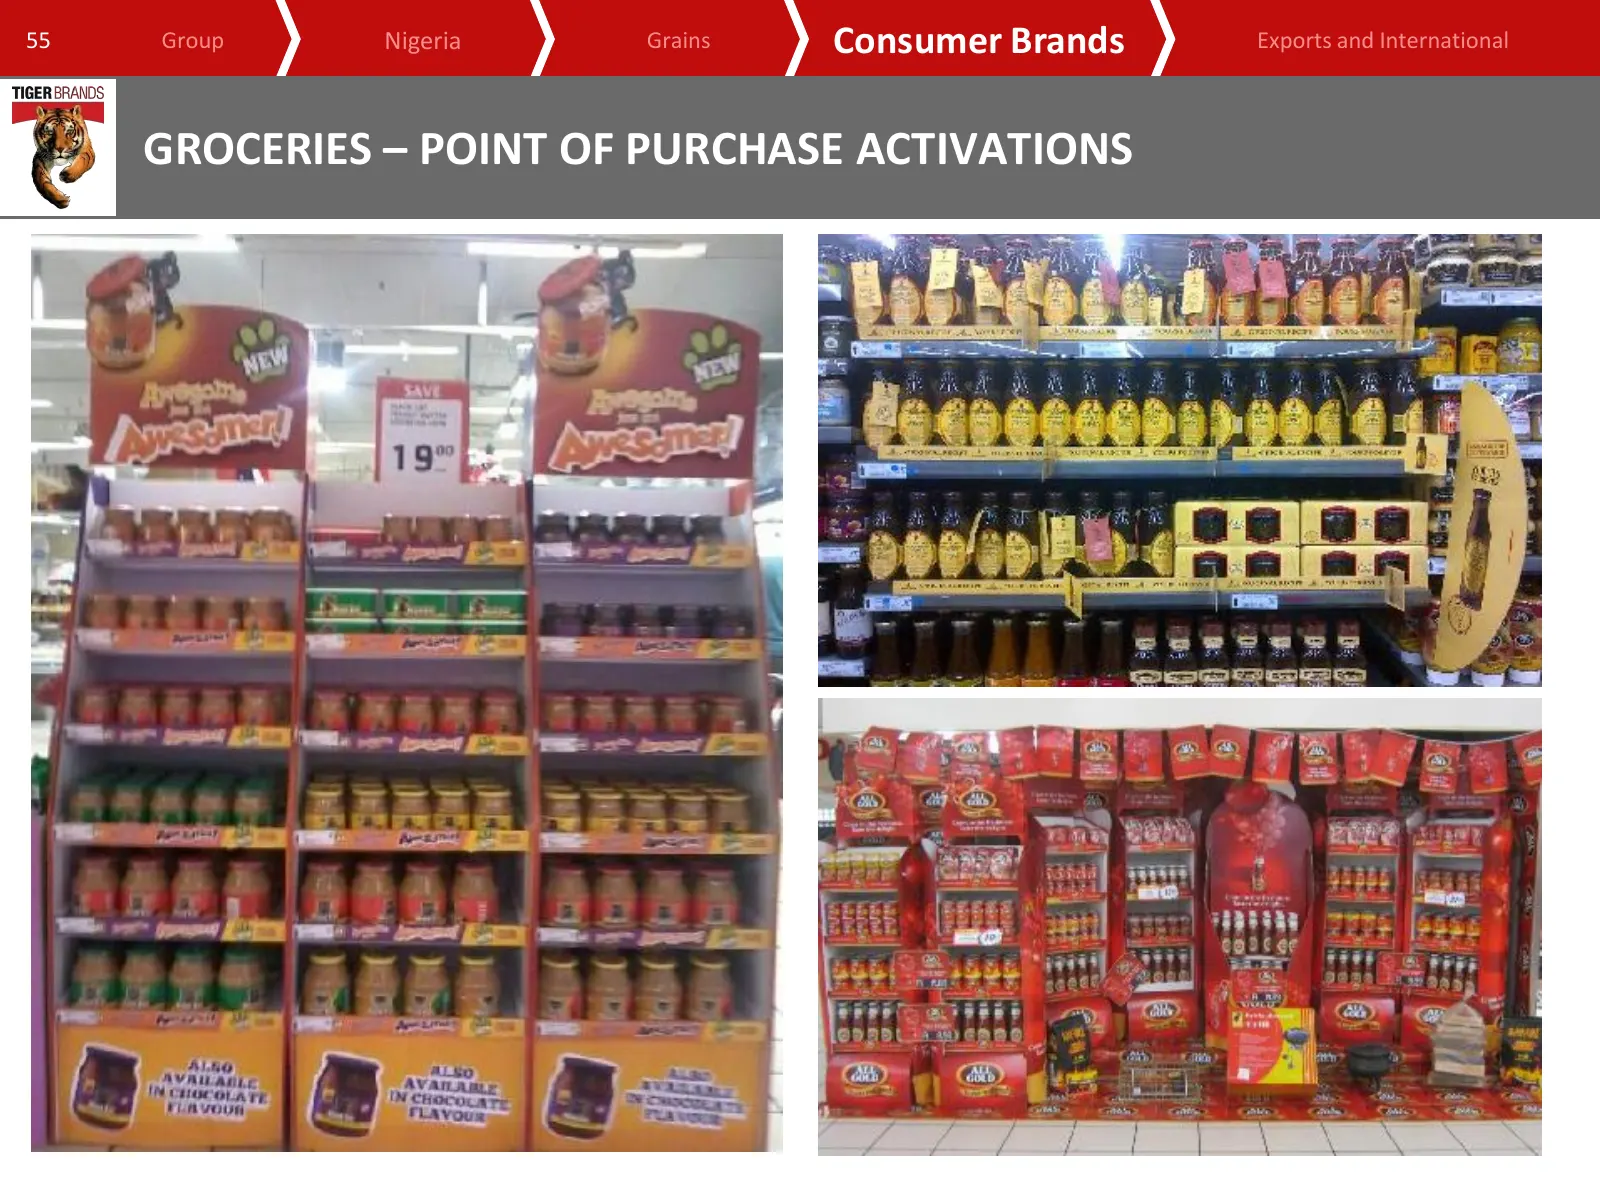
Slide 55: Groceries – point of purchase activations
55 Group Nigeria Grains Consumer Brands Exports and International GROCERIES – POINT OF PURCHASE ACTIVATIONS
Slide 56: Snacks and Treats
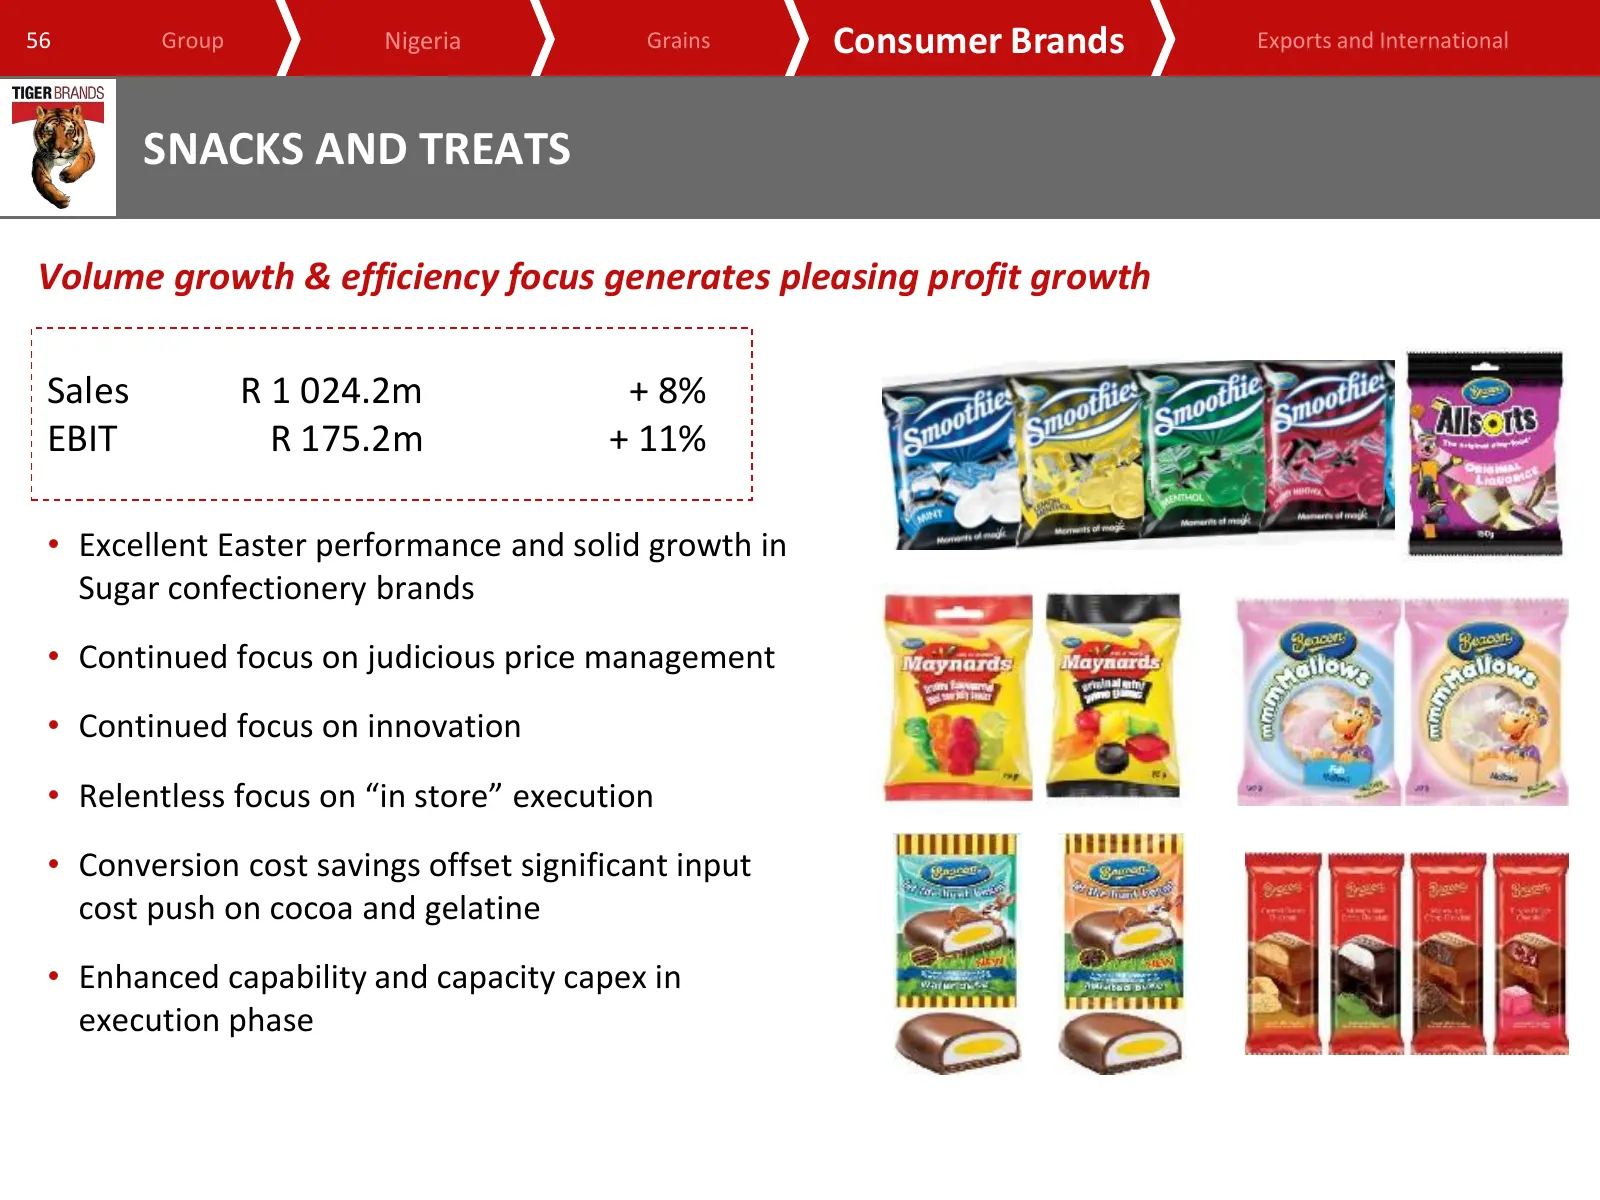
56 Group Nigeria Grains Consumer Brands Exports and International SNACKS AND TREATS Volume growth & efficiency focus generates pleasing profit growth Sales R 1 024.2m + 8% EBIT R 175.2m + 11% • Excellent Easter performance and solid growth in Sugar confectionery brands • Continued focus on judicious
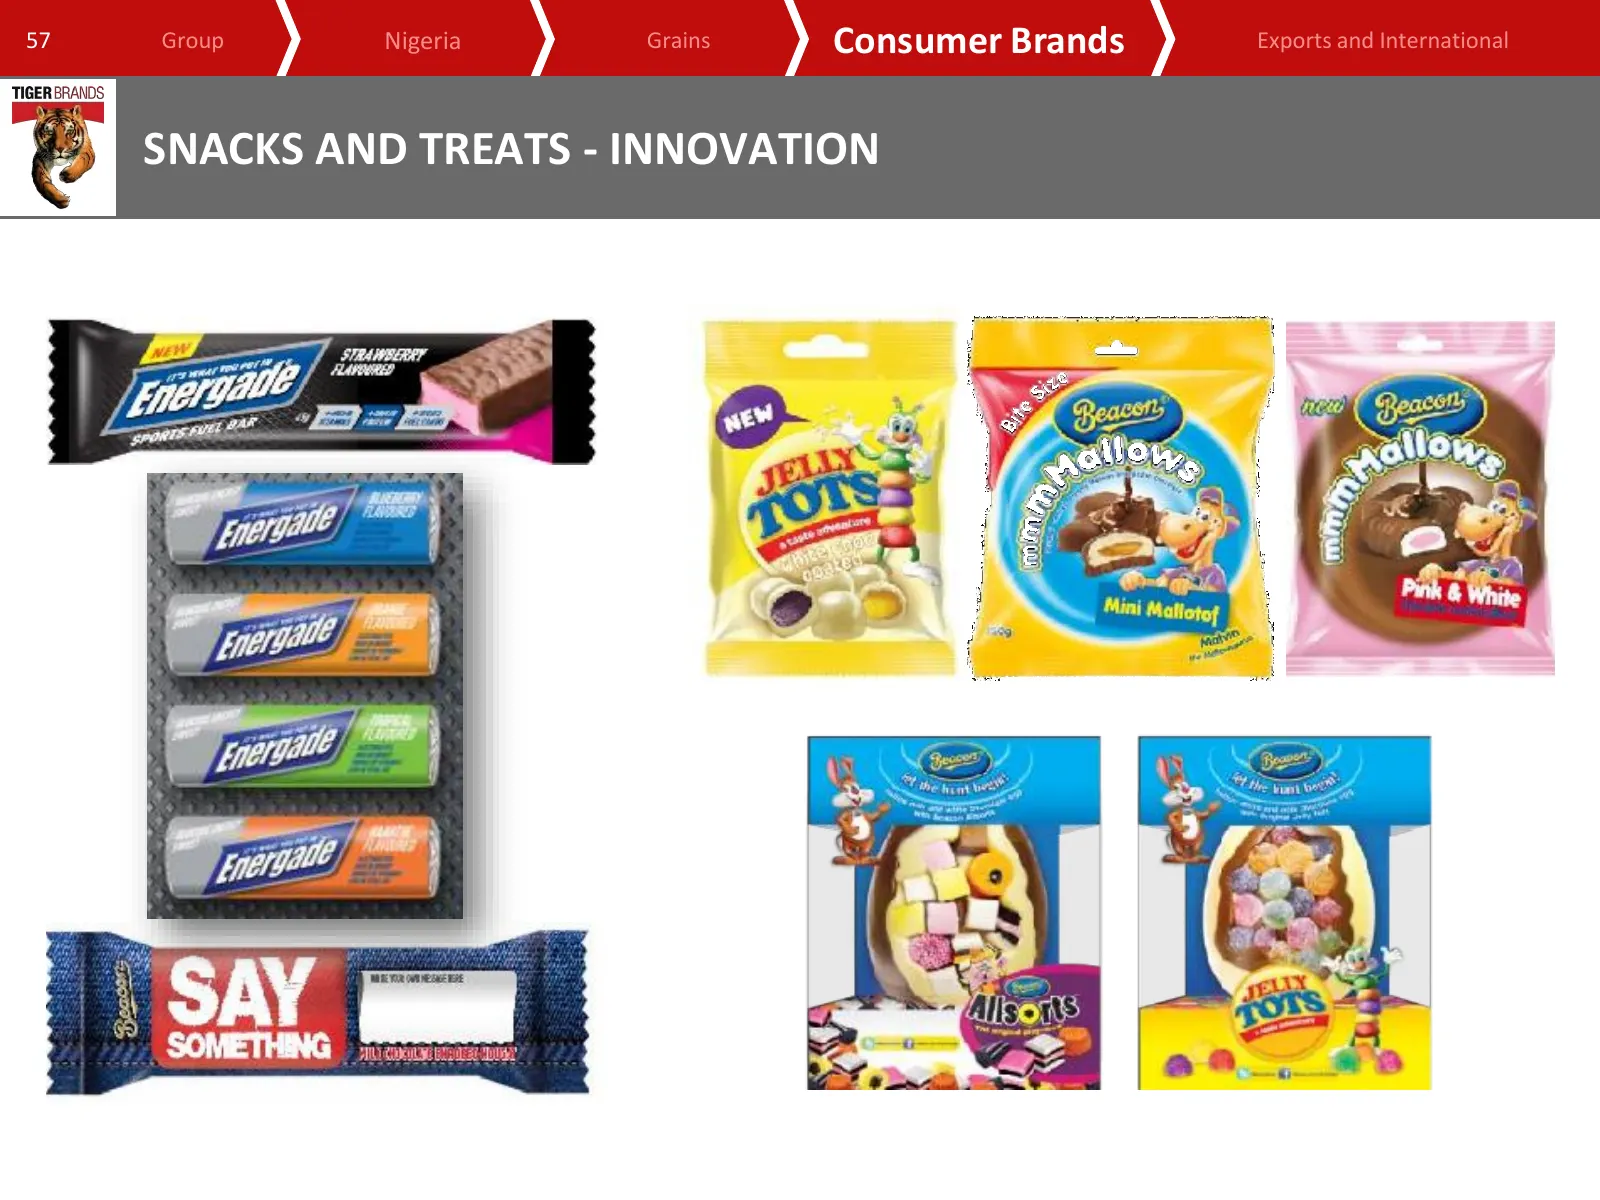
Slide 57: Snacks and Treats - Innovation
57 Group Nigeria Grains Consumer Brands Exports and International SNACKS AND TREATS - INNOVATION
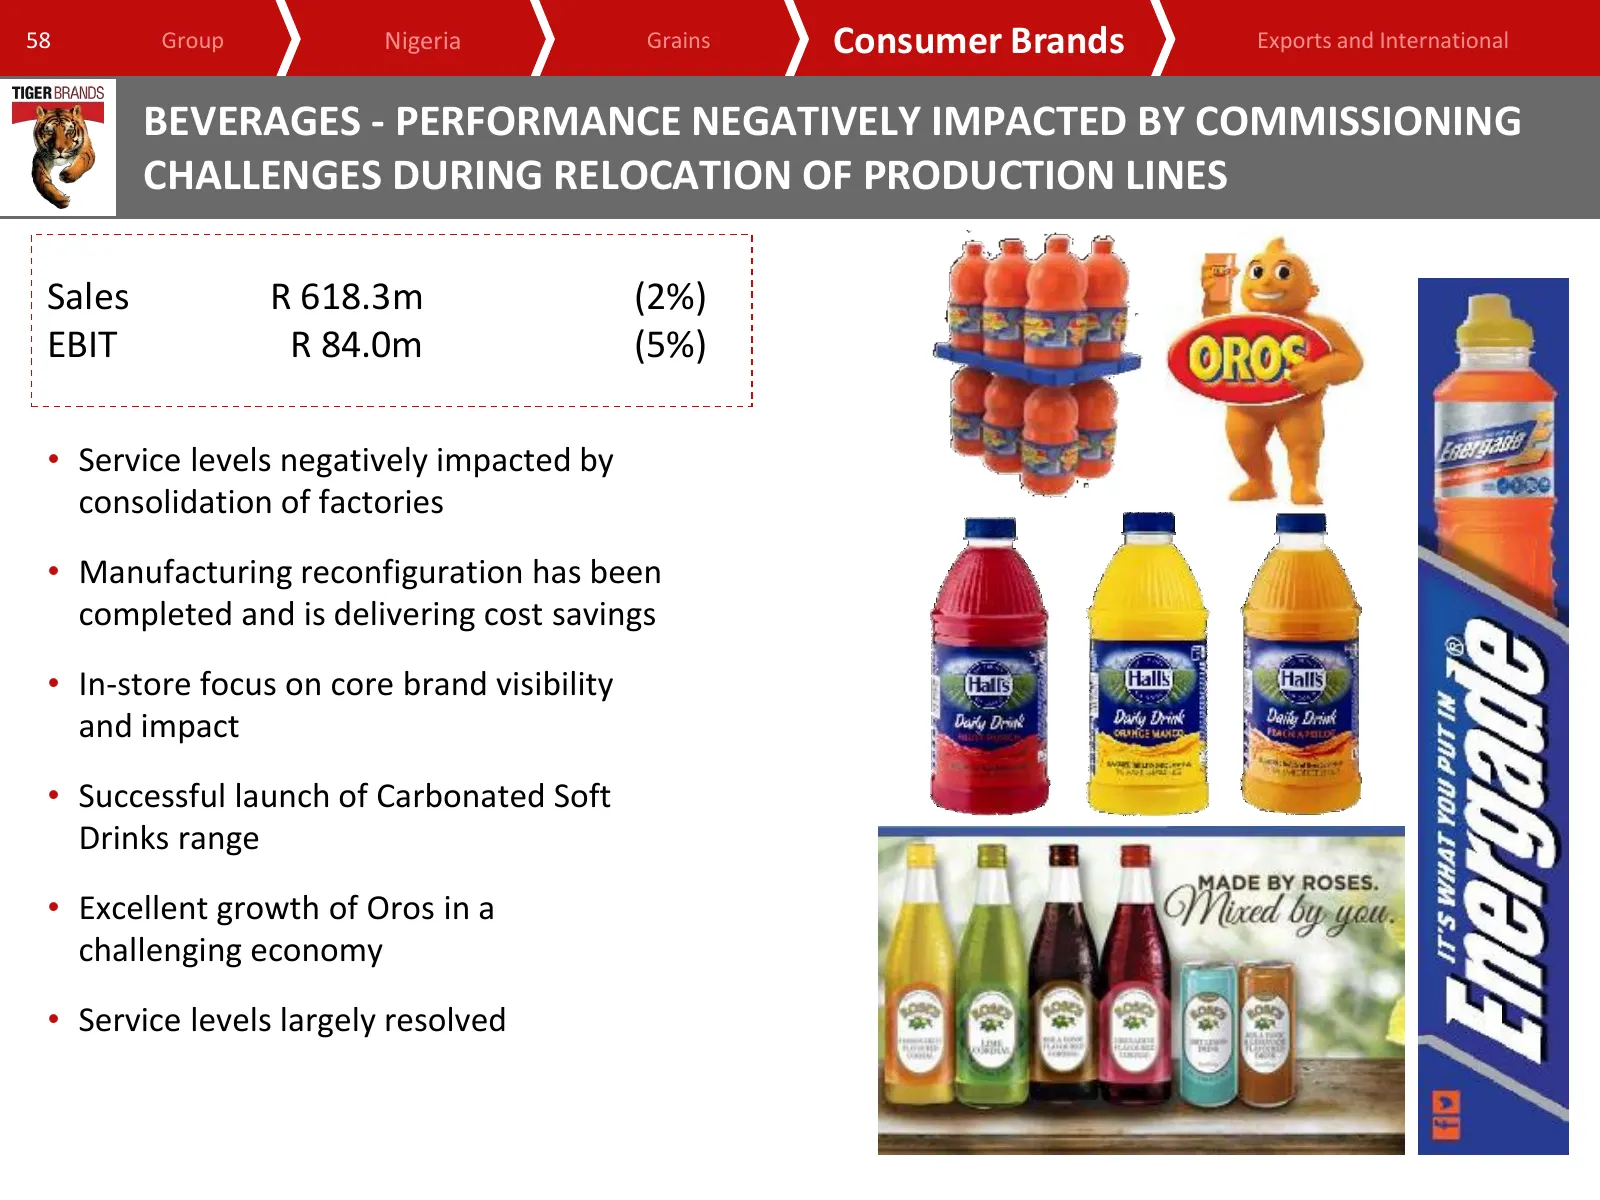
Slide 58: Beverages - performance impacted by commissioning challenges
58 Group Nigeria Grains Consumer Brands Exports and International BEVERAGES - PERFORMANCE NEGATIVELY IMPACTED BY COMMISSIONING CHALLENGES DURING RELOCATION OF PRODUCTION LINES Sales R 618.3m (2%) EBIT R 84.0m (5%) • Service levels negatively impacted by consolidation of factories • Manufacturing rec
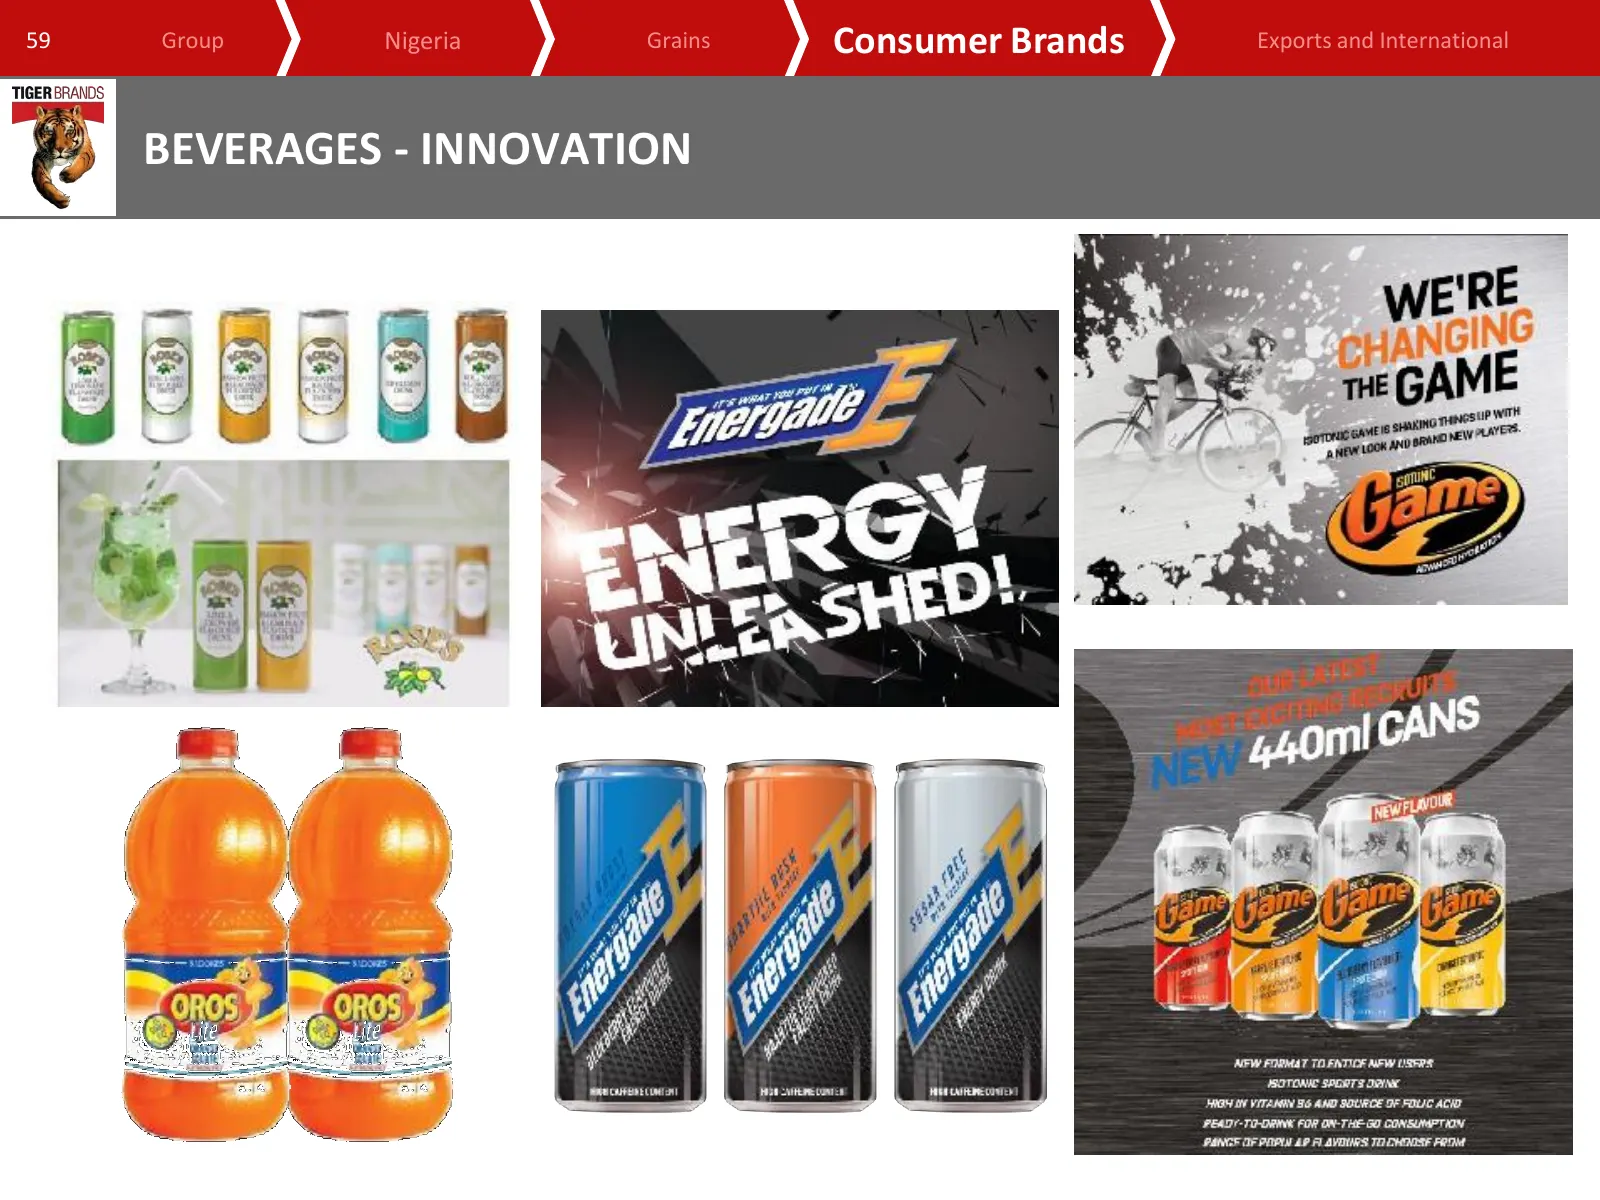
Slide 59: Beverages - Innovation
59 Group Nigeria Grains Consumer Brands Exports and International BEVERAGES - INNOVATION
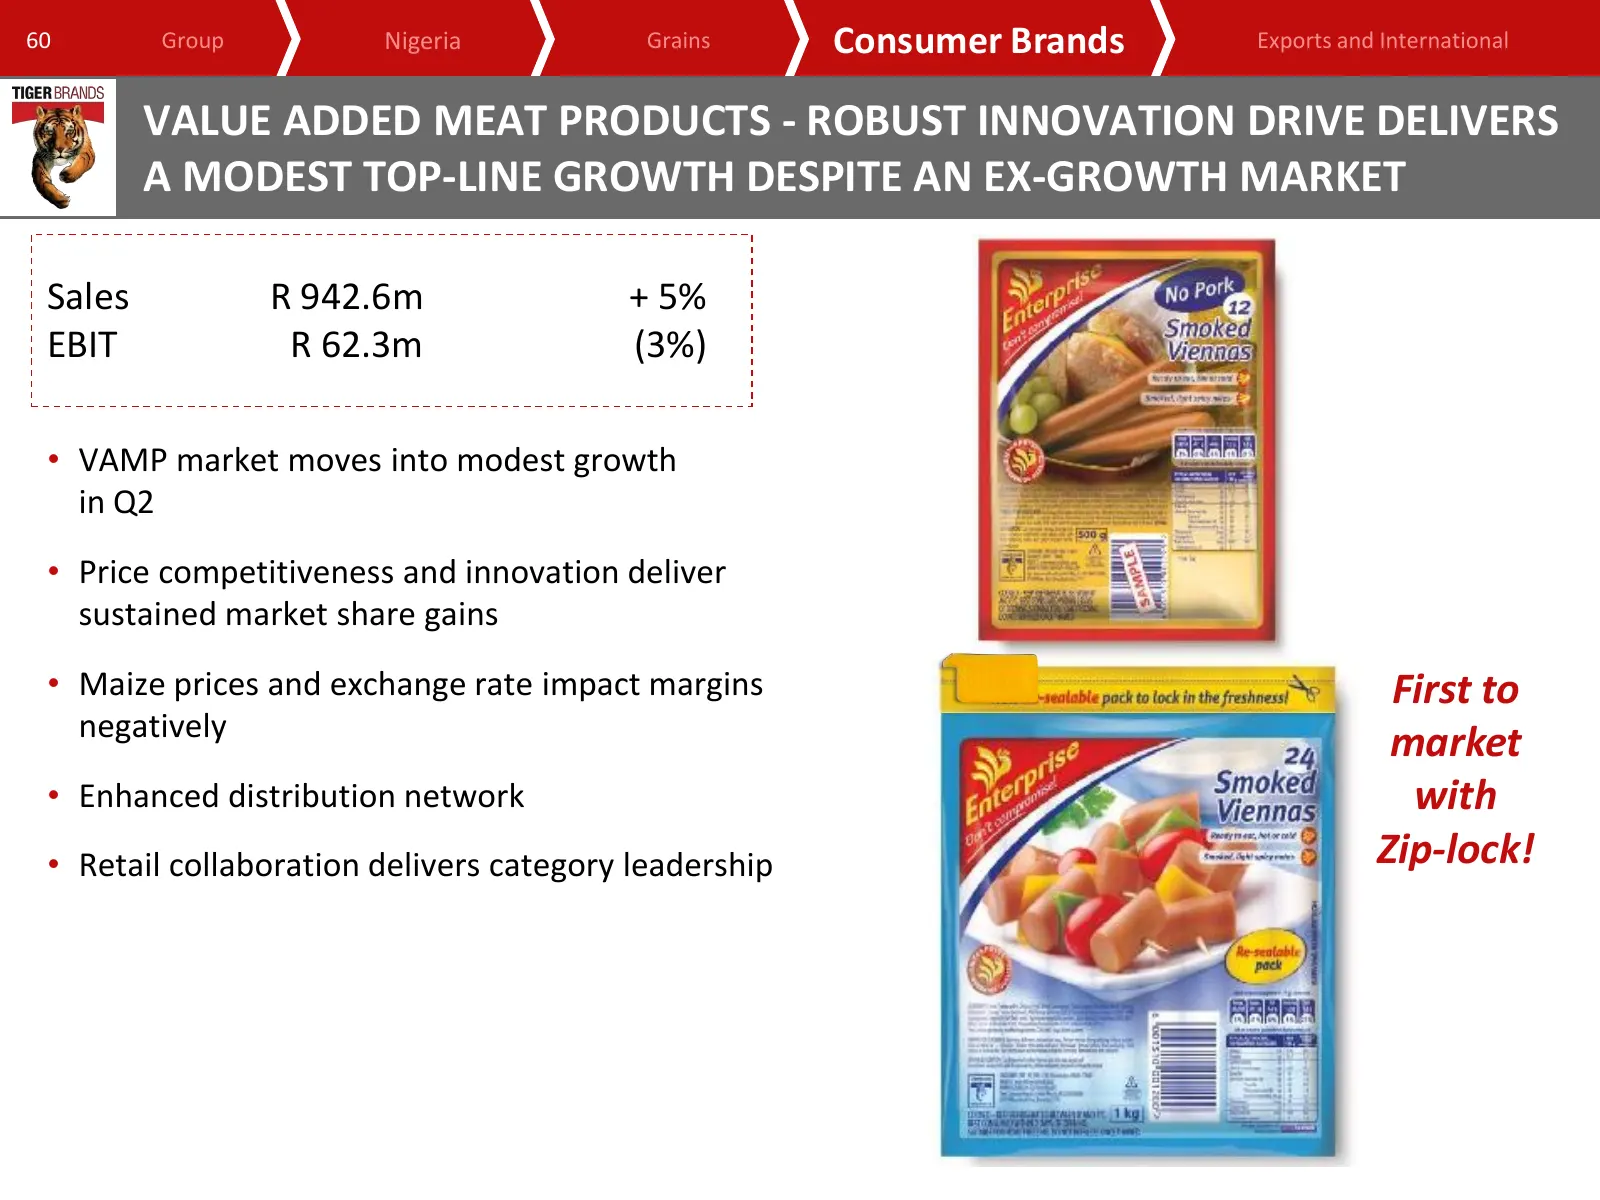
Slide 60: Value added meat products
60 Group Nigeria Grains Consumer Brands Exports and International VALUE ADDED MEAT PRODUCTS - ROBUST INNOVATION DRIVE DELIVERS A MODEST TOP-LINE GROWTH DESPITE AN EX-GROWTH MARKET Sales R 942.6m + 5% EBIT R 62.3m (3%) • VAMP market moves into modest growth in Q2 • Price competitiveness and innovatio
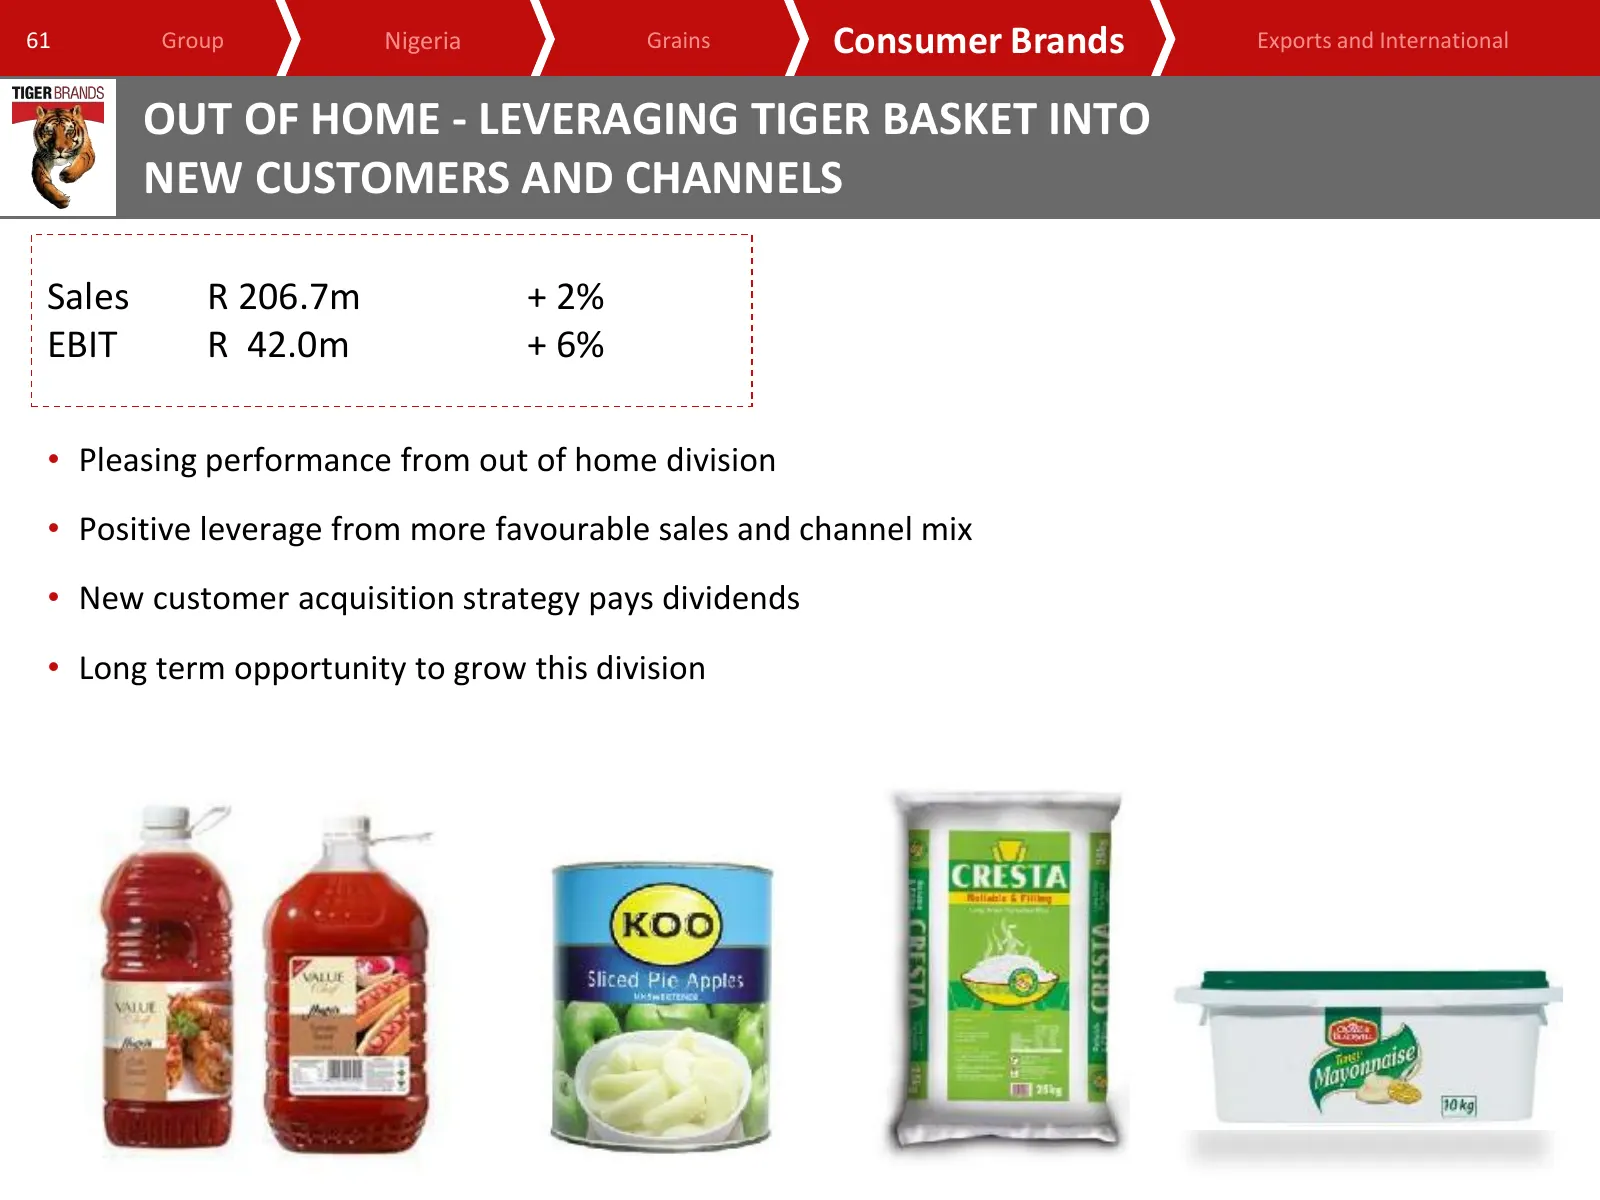
Slide 61: Out of Home - leveraging Tiger Basket
61 Group Nigeria Grains Consumer Brands Exports and International OUT OF HOME - LEVERAGING TIGER BASKET INTO NEW CUSTOMERS AND CHANNELS Sales R 206.7m + 2% EBIT R 42.0m + 6% • Pleasing performance from out of home division • Positive leverage from more favourable sales and channel mix • New customer
Slide 62: In summary
62 Group Nigeria Grains Consumer Brands Exports and International IN SUMMARY • Tough trading conditions are likely to persist • Relentless focus on innovation and renovation • Fixation on cost control • Deliver on supply chain optimisation projects • Continue with the momentum achieved in Groceries

Slide 63: Consumer Brands (HPCB)
www.tigerbrands.com Consumer Brands (HPCB) Neil Brimacombe Business Executive
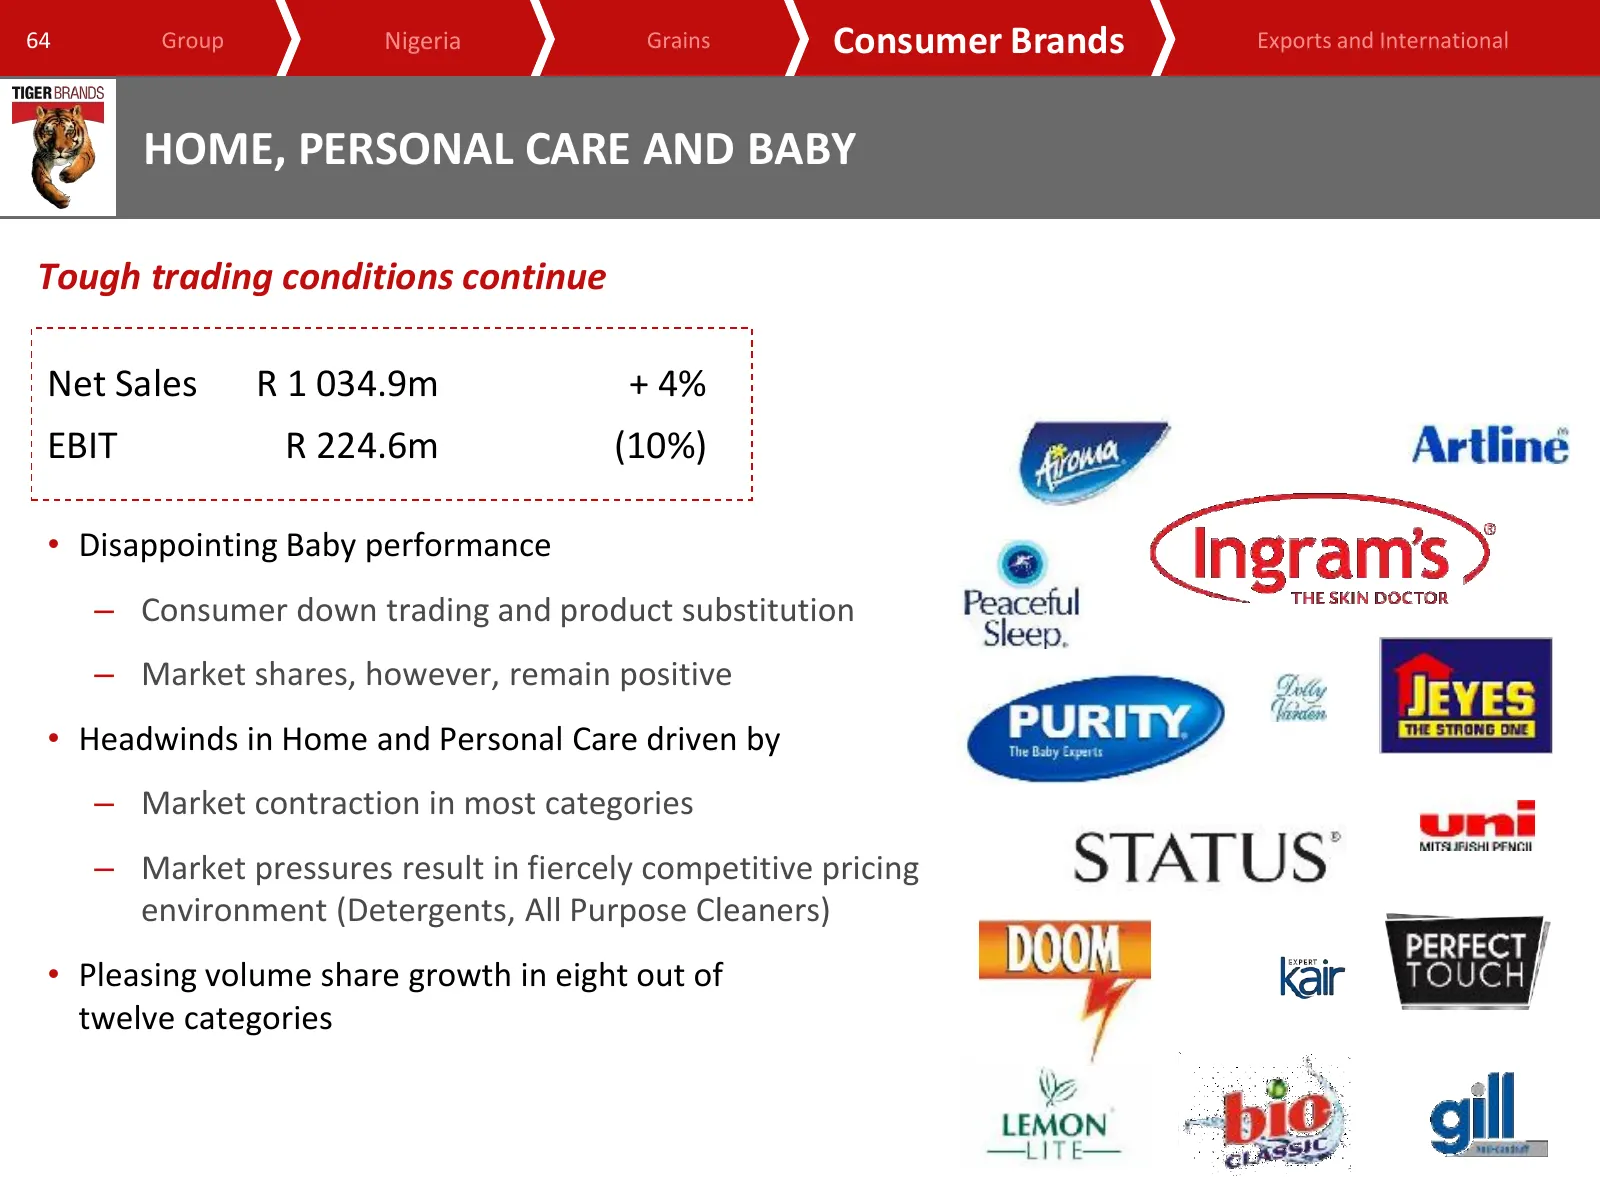
Slide 64: Home, Personal Care and Baby
64 Group Nigeria Grains Consumer Brands Exports and International HOME, PERSONAL CARE AND BABY Tough trading conditions continue Net Sales R 1 034.9m + 4% EBIT R 224.6m (10%) • Disappointing Baby performance – Consumer down trading and product substitution – Market shares, however, remain positive •
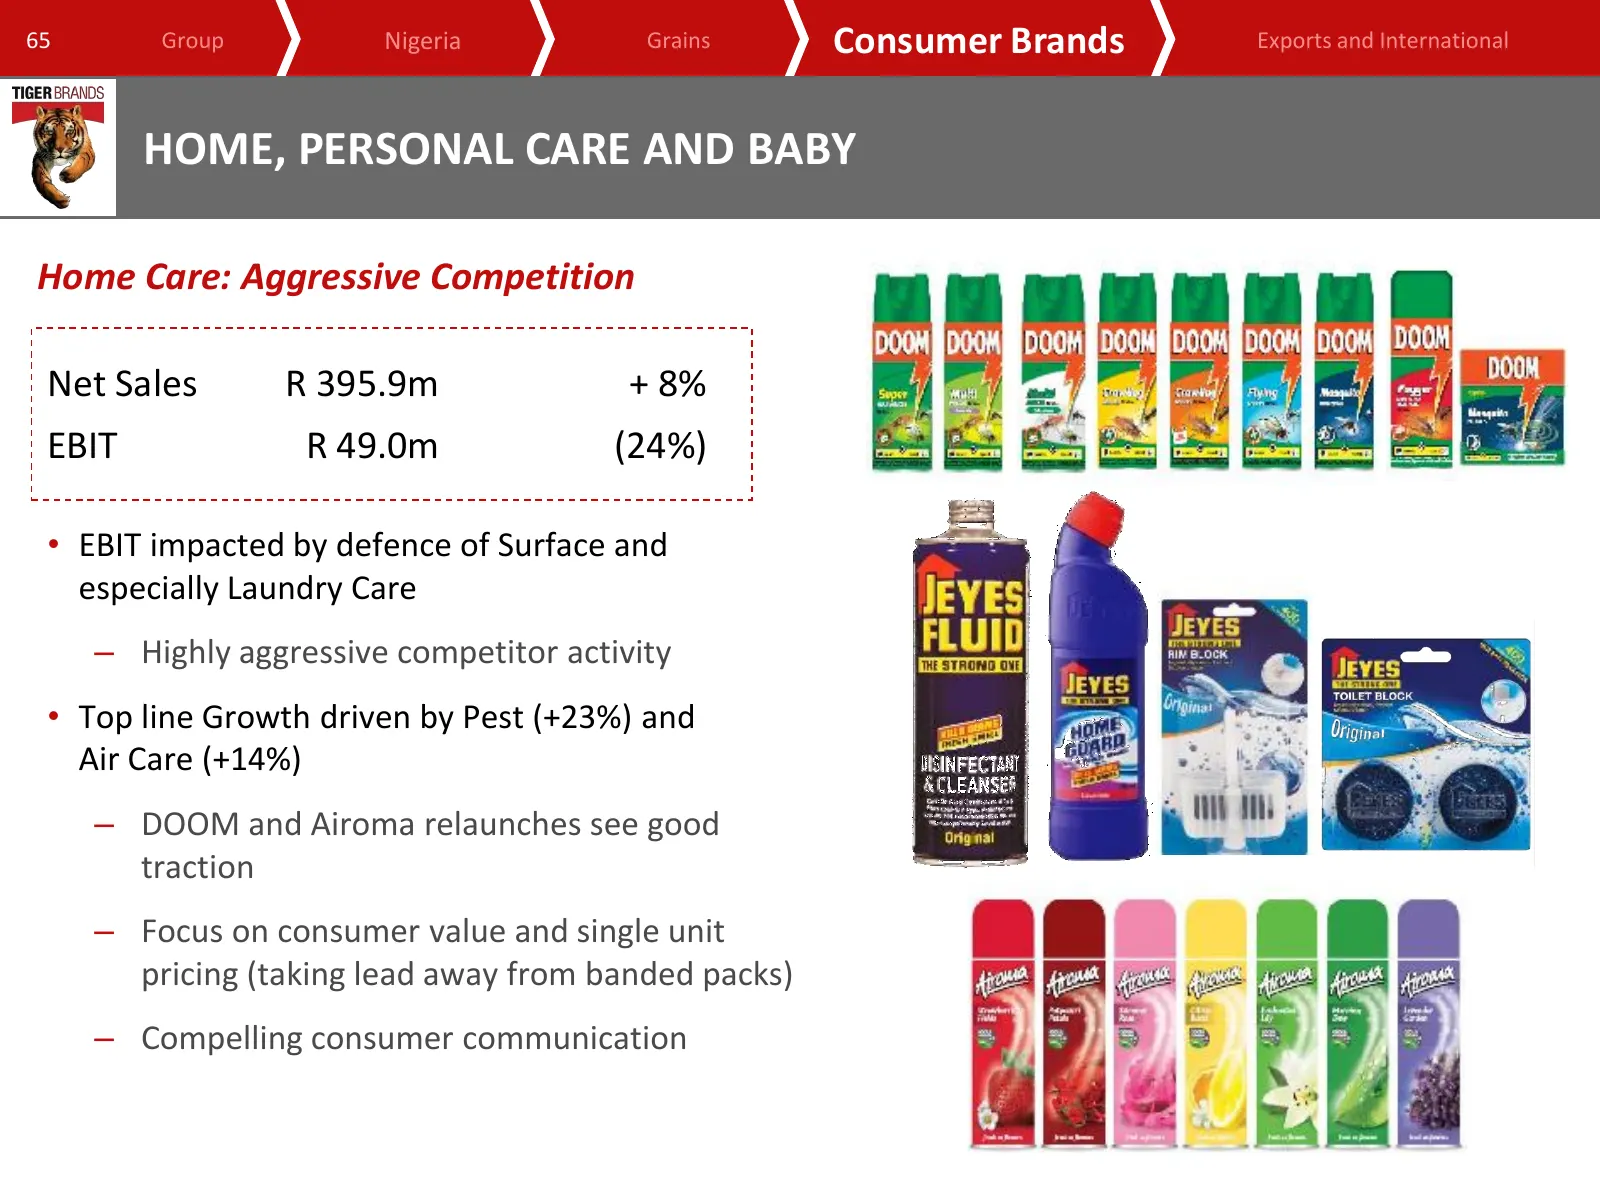
Slide 65: Home Care: Aggressive Competition
65 Group Nigeria Grains Consumer Brands Exports and International HOME, PERSONAL CARE AND BABY Home Care: Aggressive Competition Net Sales R 395.9m + 8% EBIT R 49.0m (24%) • EBIT impacted by defence of Surface and especially Laundry Care – Highly aggressive competitor activity • Top line Growth driv
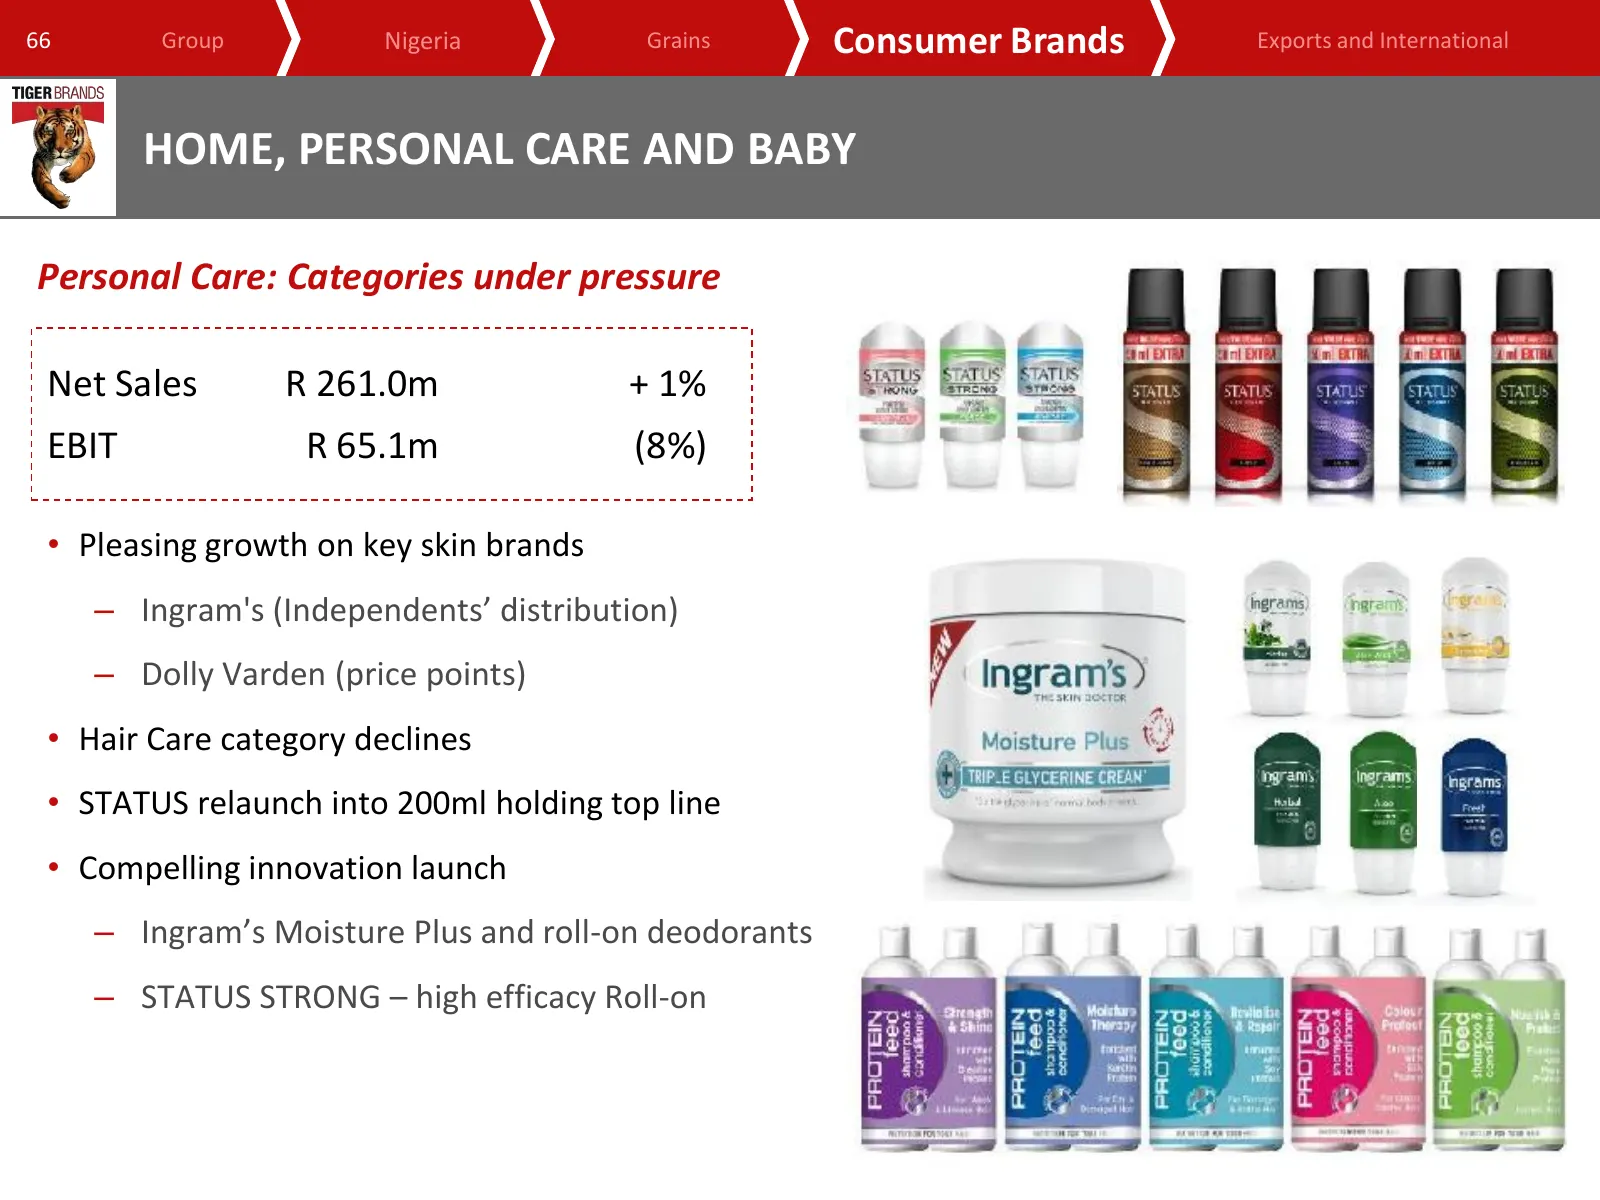
Slide 66: Personal Care: Categories under pressure
66 Group Nigeria Grains Consumer Brands Exports and International HOME, PERSONAL CARE AND BABY Personal Care: Categories under pressure Net Sales R 261.0m + 1% EBIT R 65.1m (8%) • Pleasing growth on key skin brands – Ingram's (Independents’ distribution) – Dolly Varden (price points) • Hair Care cat
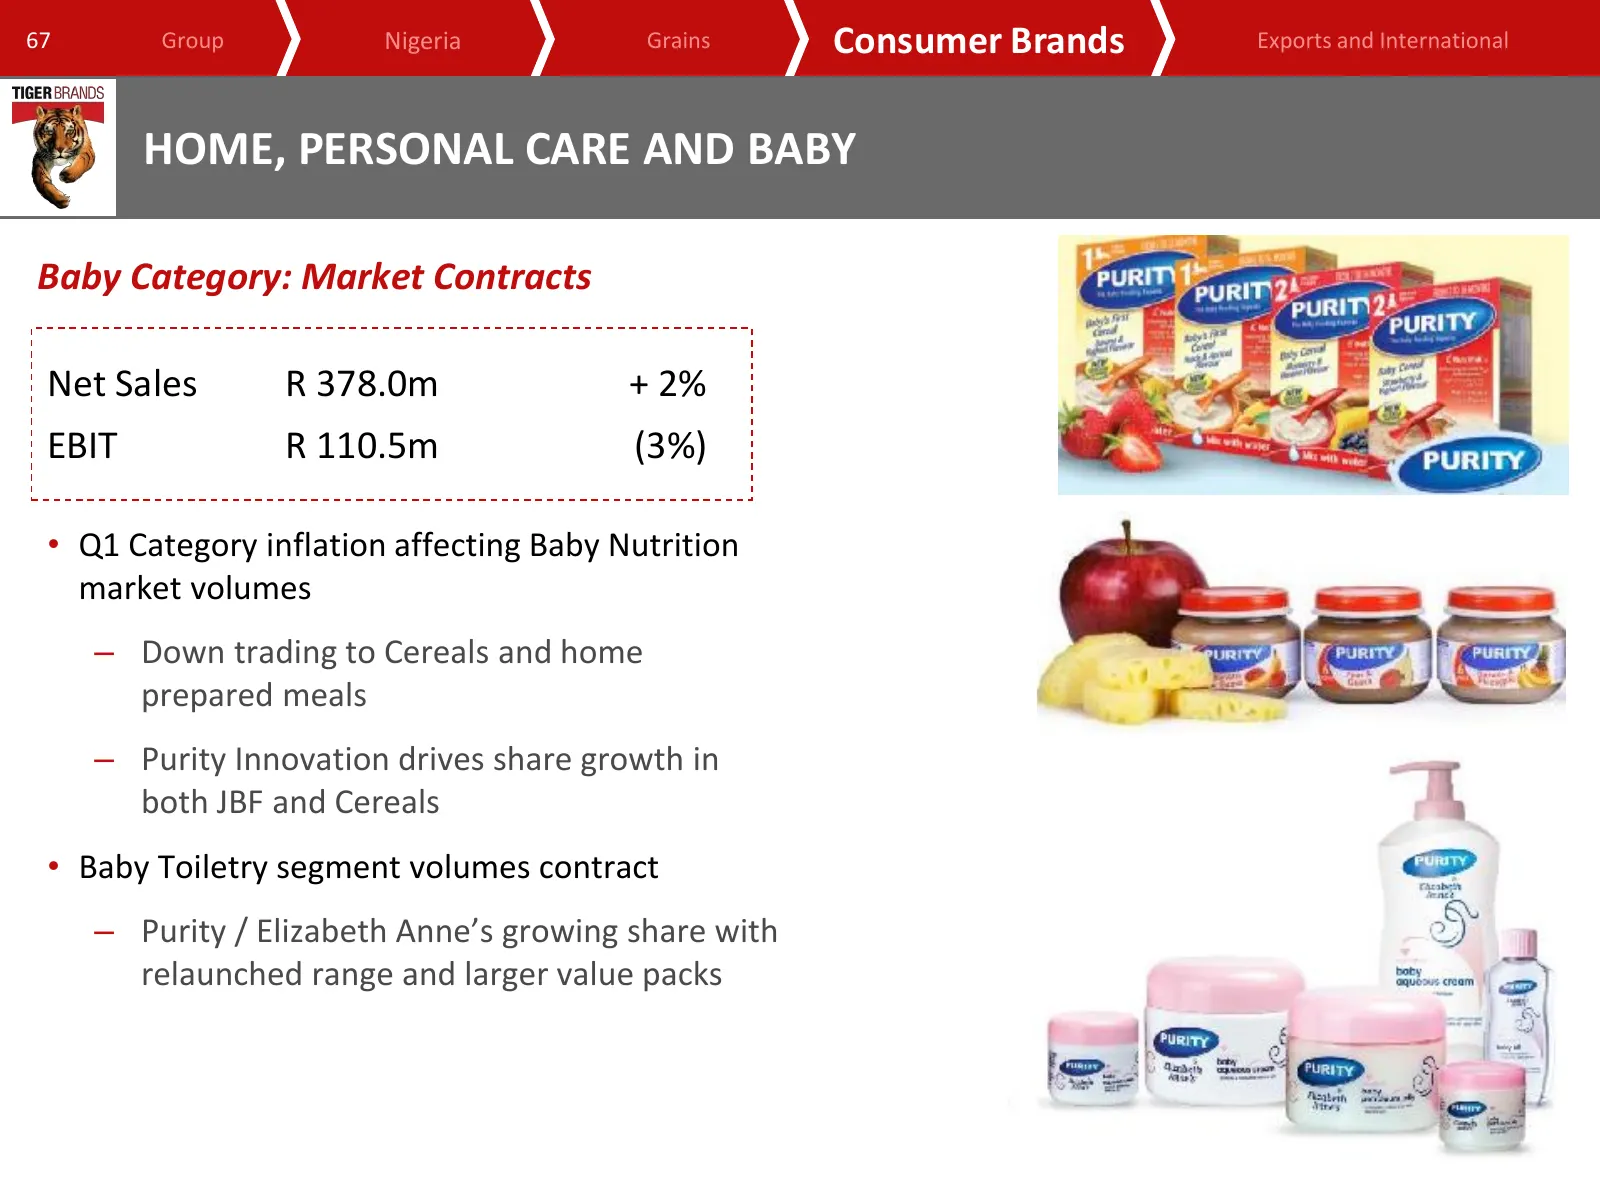
Slide 67: Baby Category: Market Contracts
67 Group Nigeria Grains Consumer Brands Exports and International HOME, PERSONAL CARE AND BABY Baby Category: Market Contracts Net Sales R 378.0m + 2% EBIT R 110.5m (3%) • Q1 Category inflation affecting Baby Nutrition market volumes – Down trading to Cereals and home prepared meals – Purity Innovat
Slide 68: Home, Personal Care and Baby: In Summary
68 Group Nigeria Grains Consumer Brands Exports and International HOME, PERSONAL CARE AND BABY In Summary • Tough trading conditions and highly competitive environment to persist • Emphasis on Innovation execution • Management of critical price points • HPCB remains an important investment vector fo

Slide 69: Tiger Brands International (excluding Nigeria)
www.tigerbrands.com Tiger Brands International (excluding Nigeria) Neil Brimacombe Business Executive
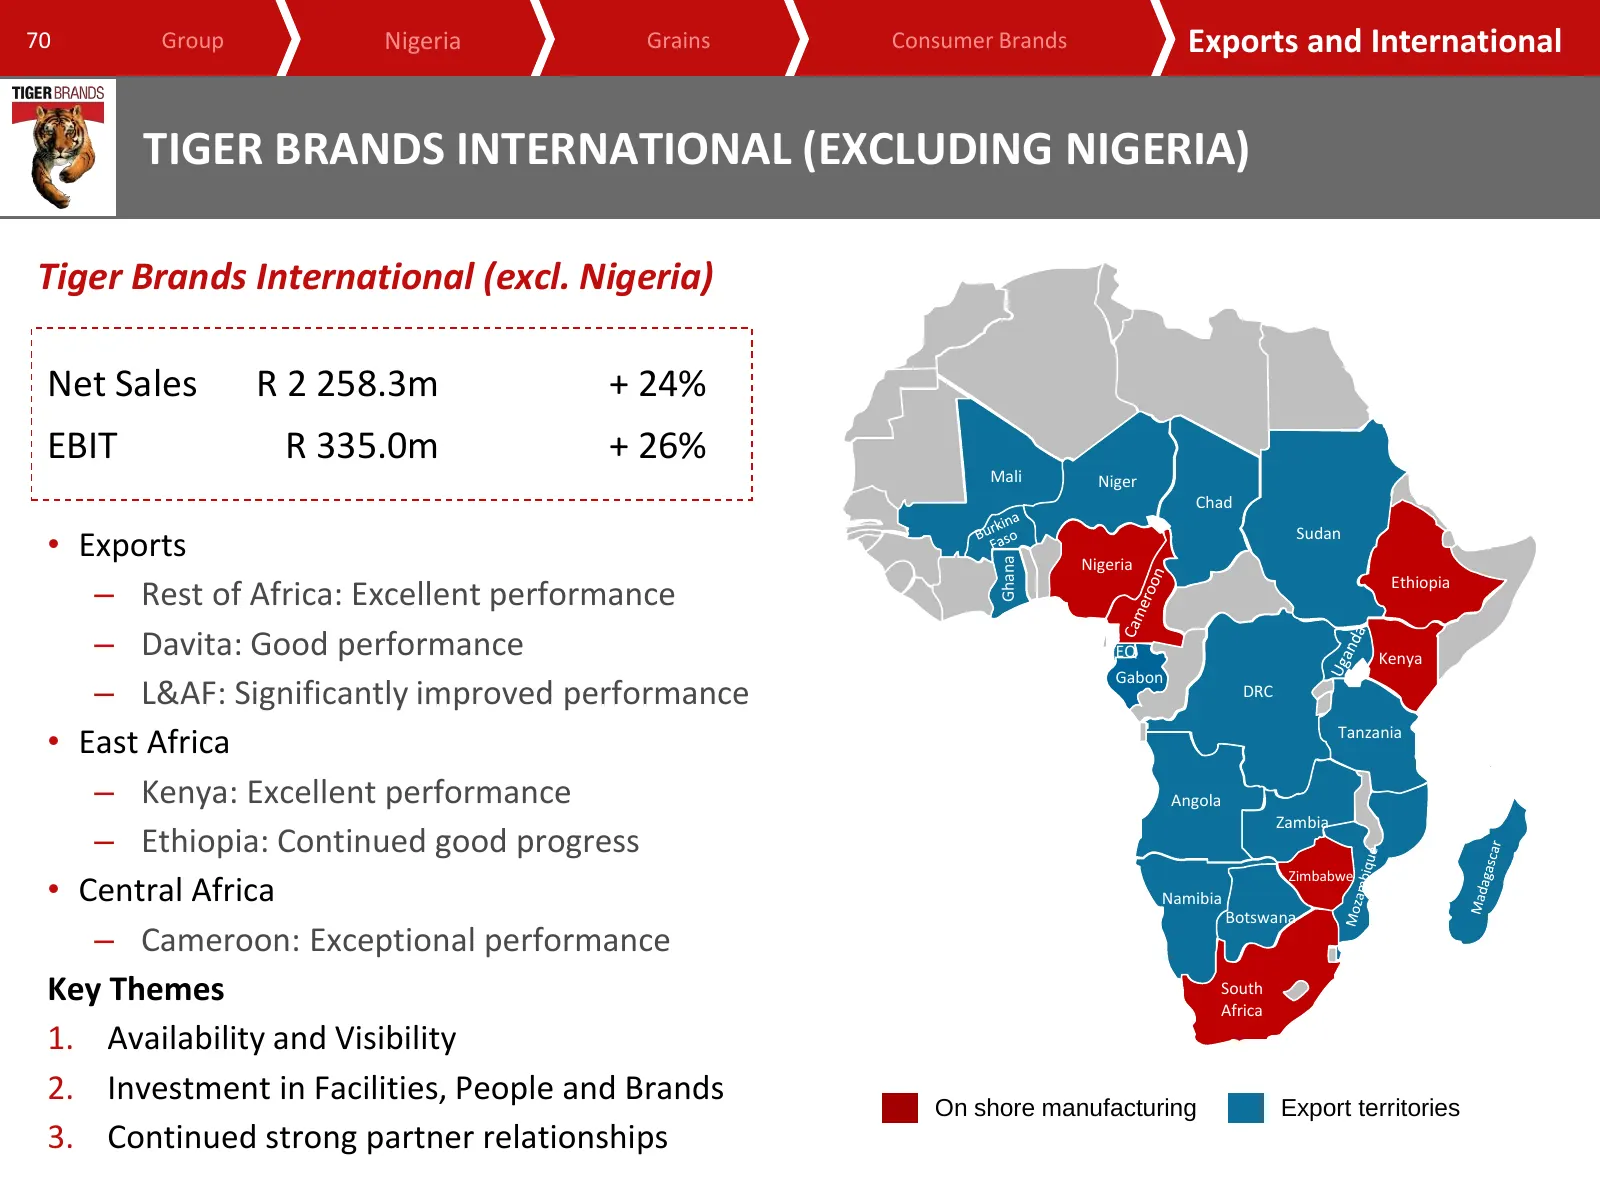
Slide 70: Tiger Brands International (excluding Nigeria)
70 Group Nigeria Grains Consumer Brands Exports and International TIGER BRANDS INTERNATIONAL (EXCLUDING NIGERIA) Tiger Brands International (excl. Nigeria) Net Sales R 2 258.3m + 24% EBIT R 335.0m + 26% Mali Niger Chad • Exports Sudan Ghana Nigeria – Rest of Africa: Excellent performance Ethiopia –
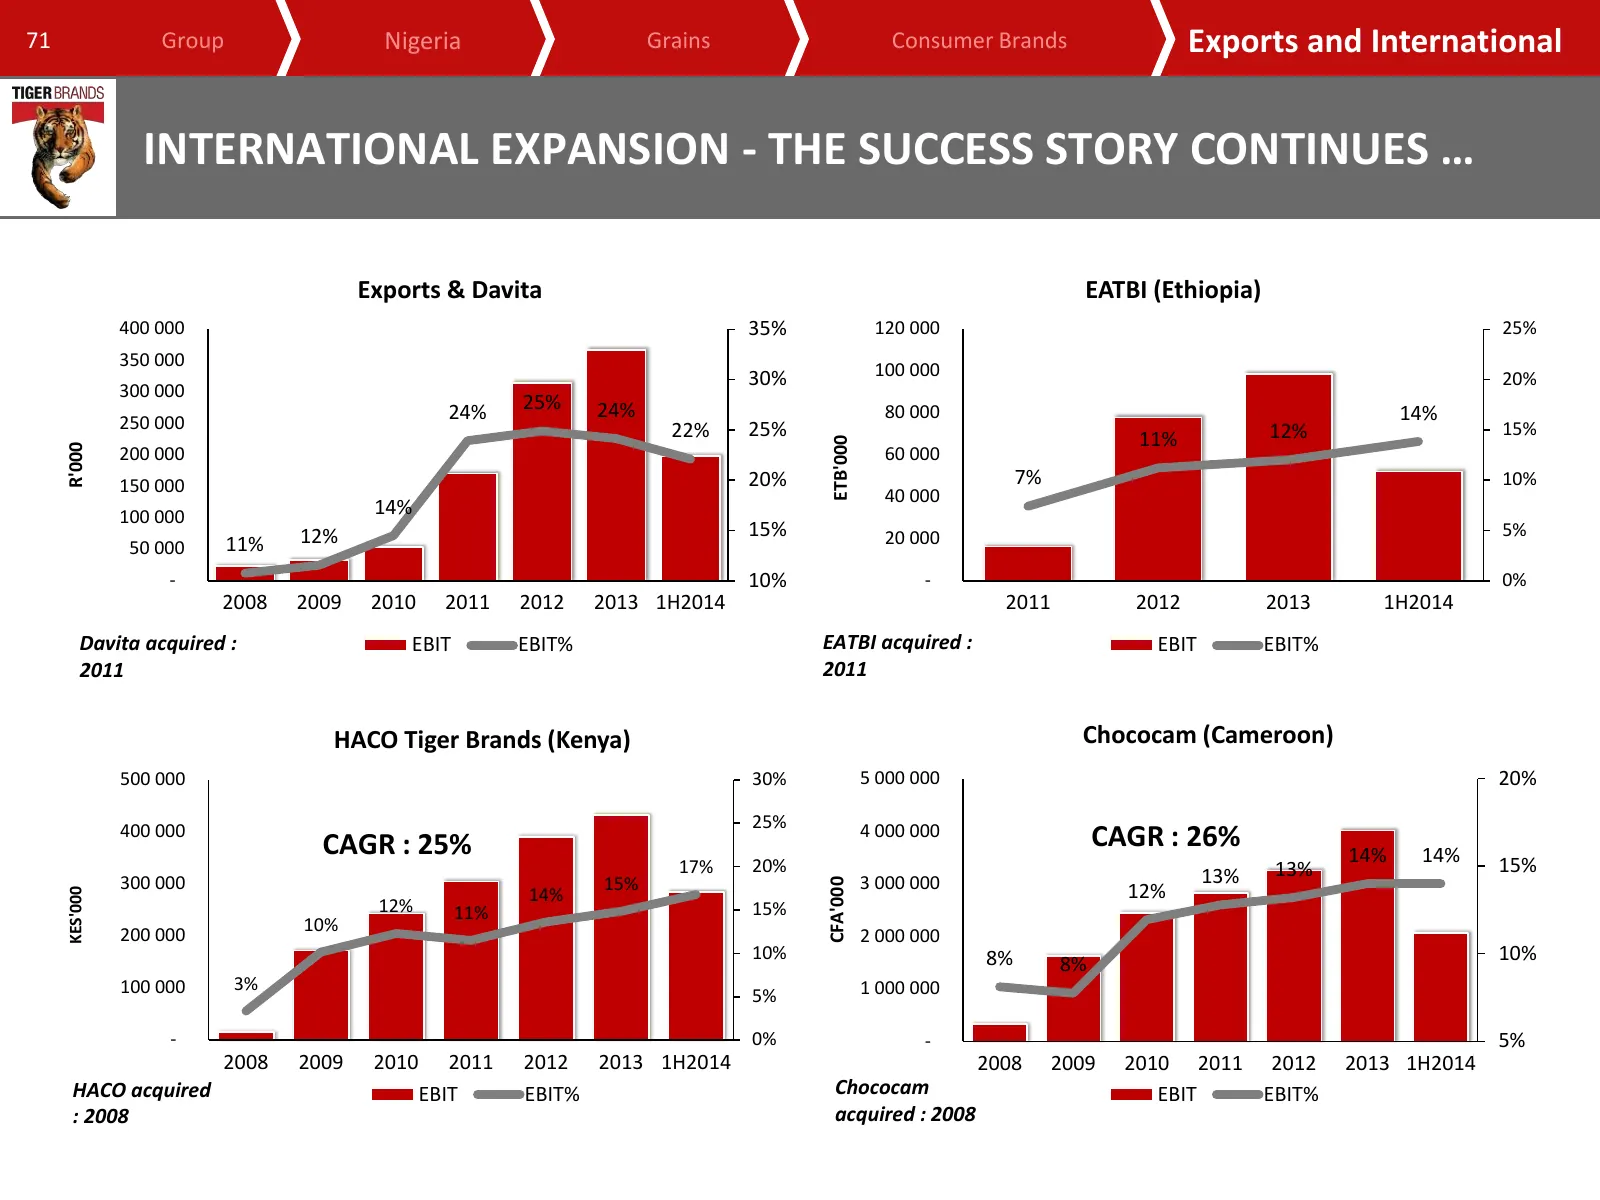
Slide 71: International expansion - the success story continues
71 Group Nigeria Grains Consumer Brands Exports and International INTERNATIONAL EXPANSION - THE SUCCESS STORY CONTINUES … Exports & Davita EATBI (Ethiopia) 400 000 35% 120 000 25% 350 000 30% 100 000 20% 300 000 24% 25% 24% 80 000 14% 250 000 22% 25% 12% 15% 11% ETB'000 R'000 200 000 60 000 150 000
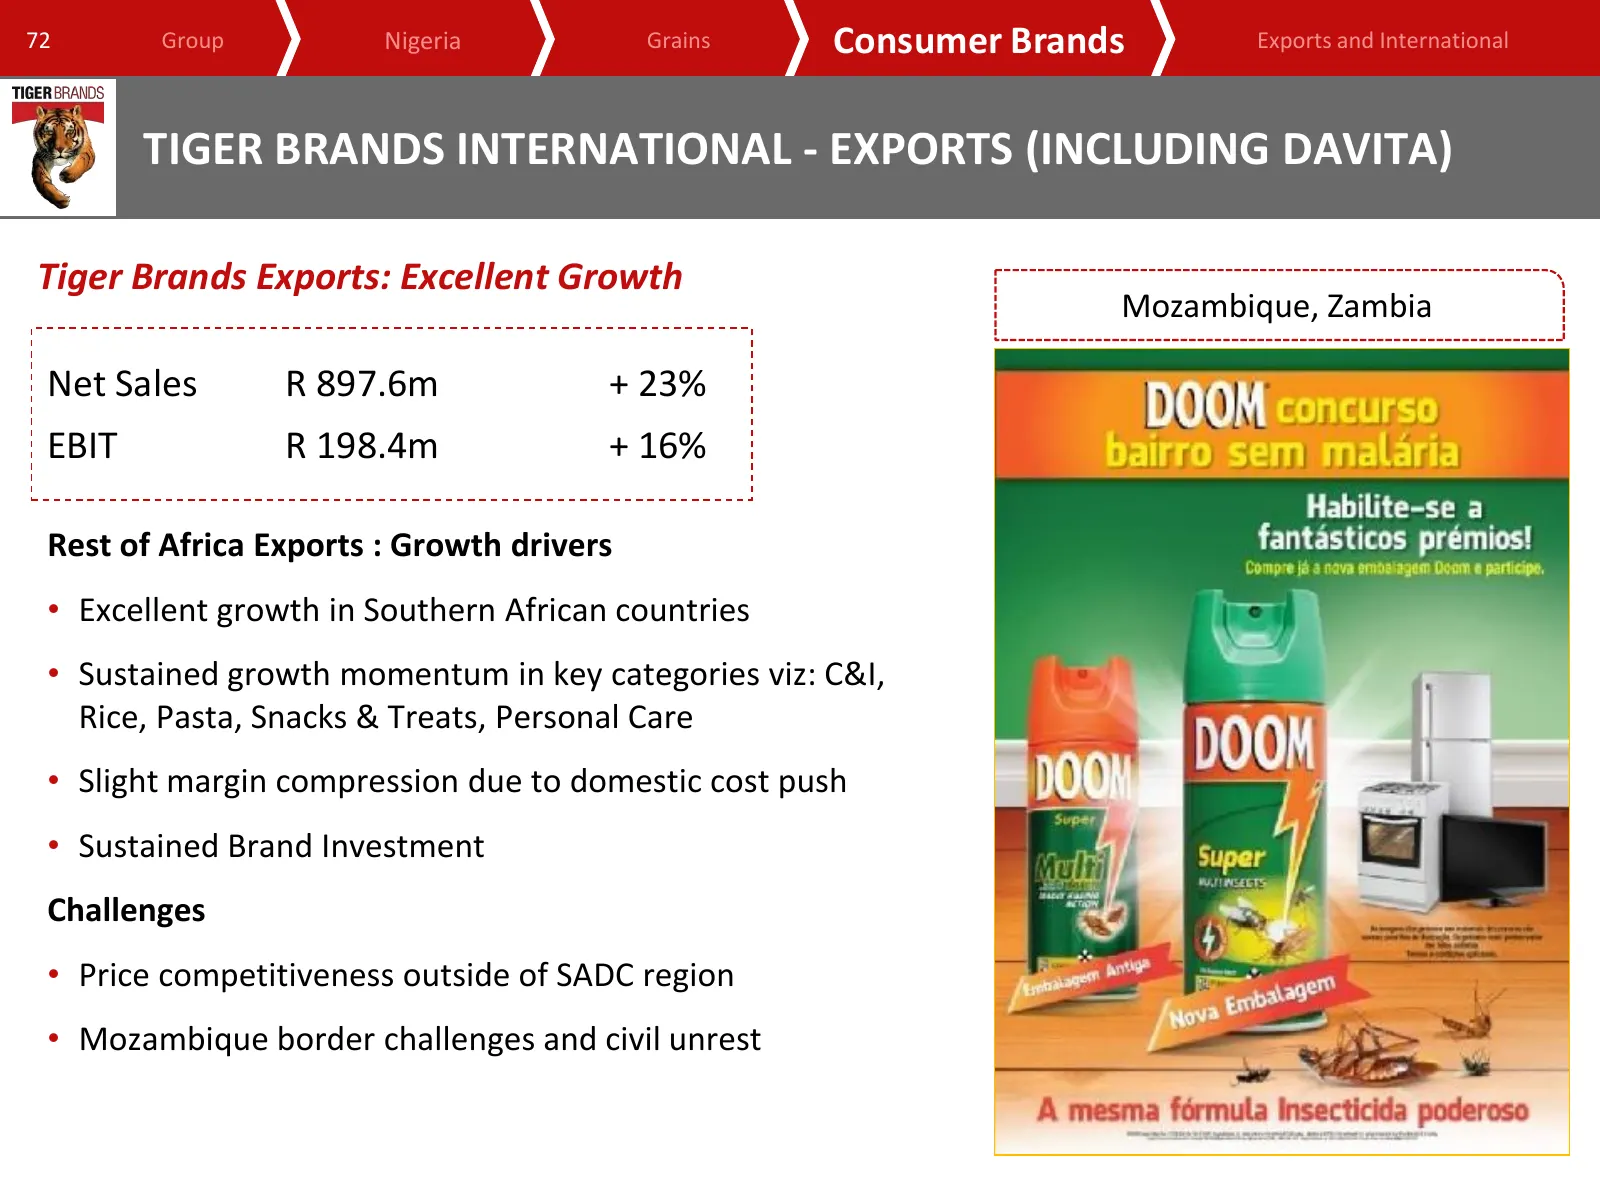
Slide 72: Tiger Brands International - Exports (including Davita)
72 Group Nigeria Grains Consumer Brands Exports and International TIGER BRANDS INTERNATIONAL - EXPORTS (INCLUDING DAVITA) Tiger Brands Exports: Excellent Growth Mozambique, Zambia Net Sales R 897.6m + 23% EBIT R 198.4m + 16% Rest of Africa Exports : Growth drivers • Excellent growth in Southern Afri
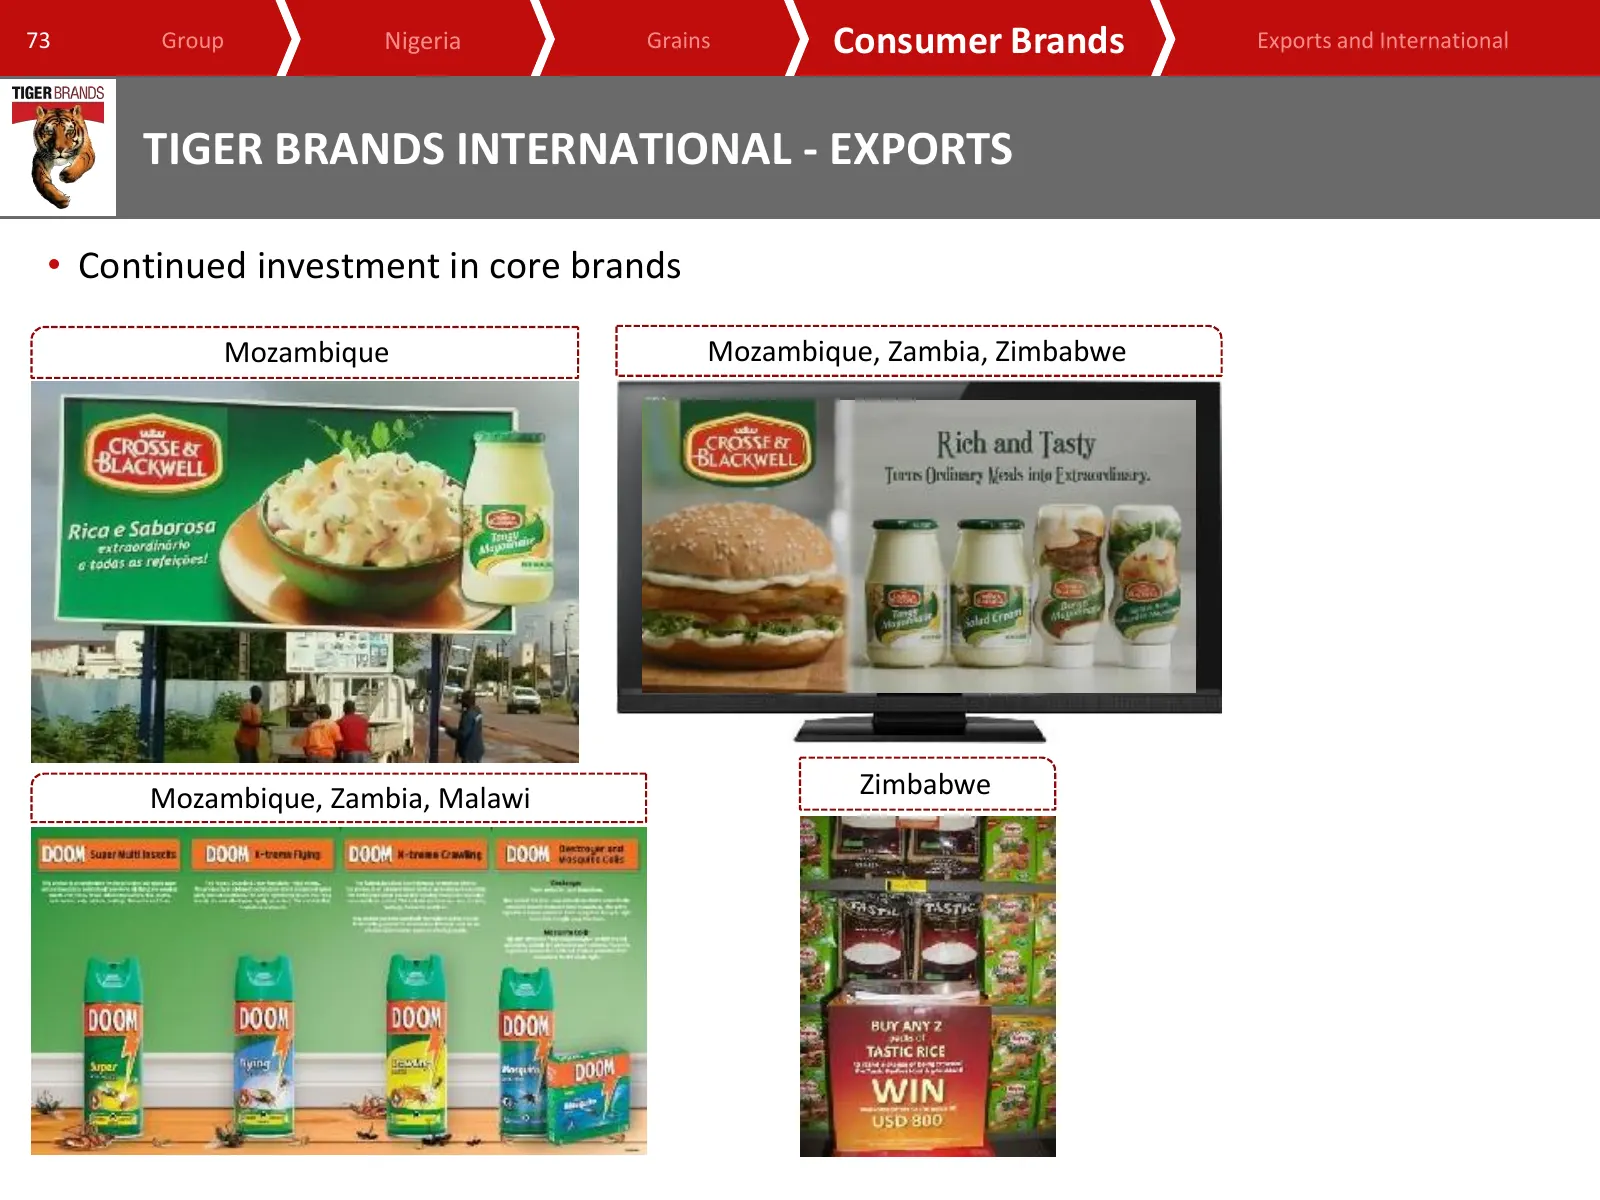
Slide 73: Tiger Brands International - Exports
73 Group Nigeria Grains Consumer Brands Exports and International TIGER BRANDS INTERNATIONAL - EXPORTS • Continued investment in core brands Mozambique Mozambique, Zambia, Zimbabwe Mozambique, Zambia, Malawi Zimbabwe
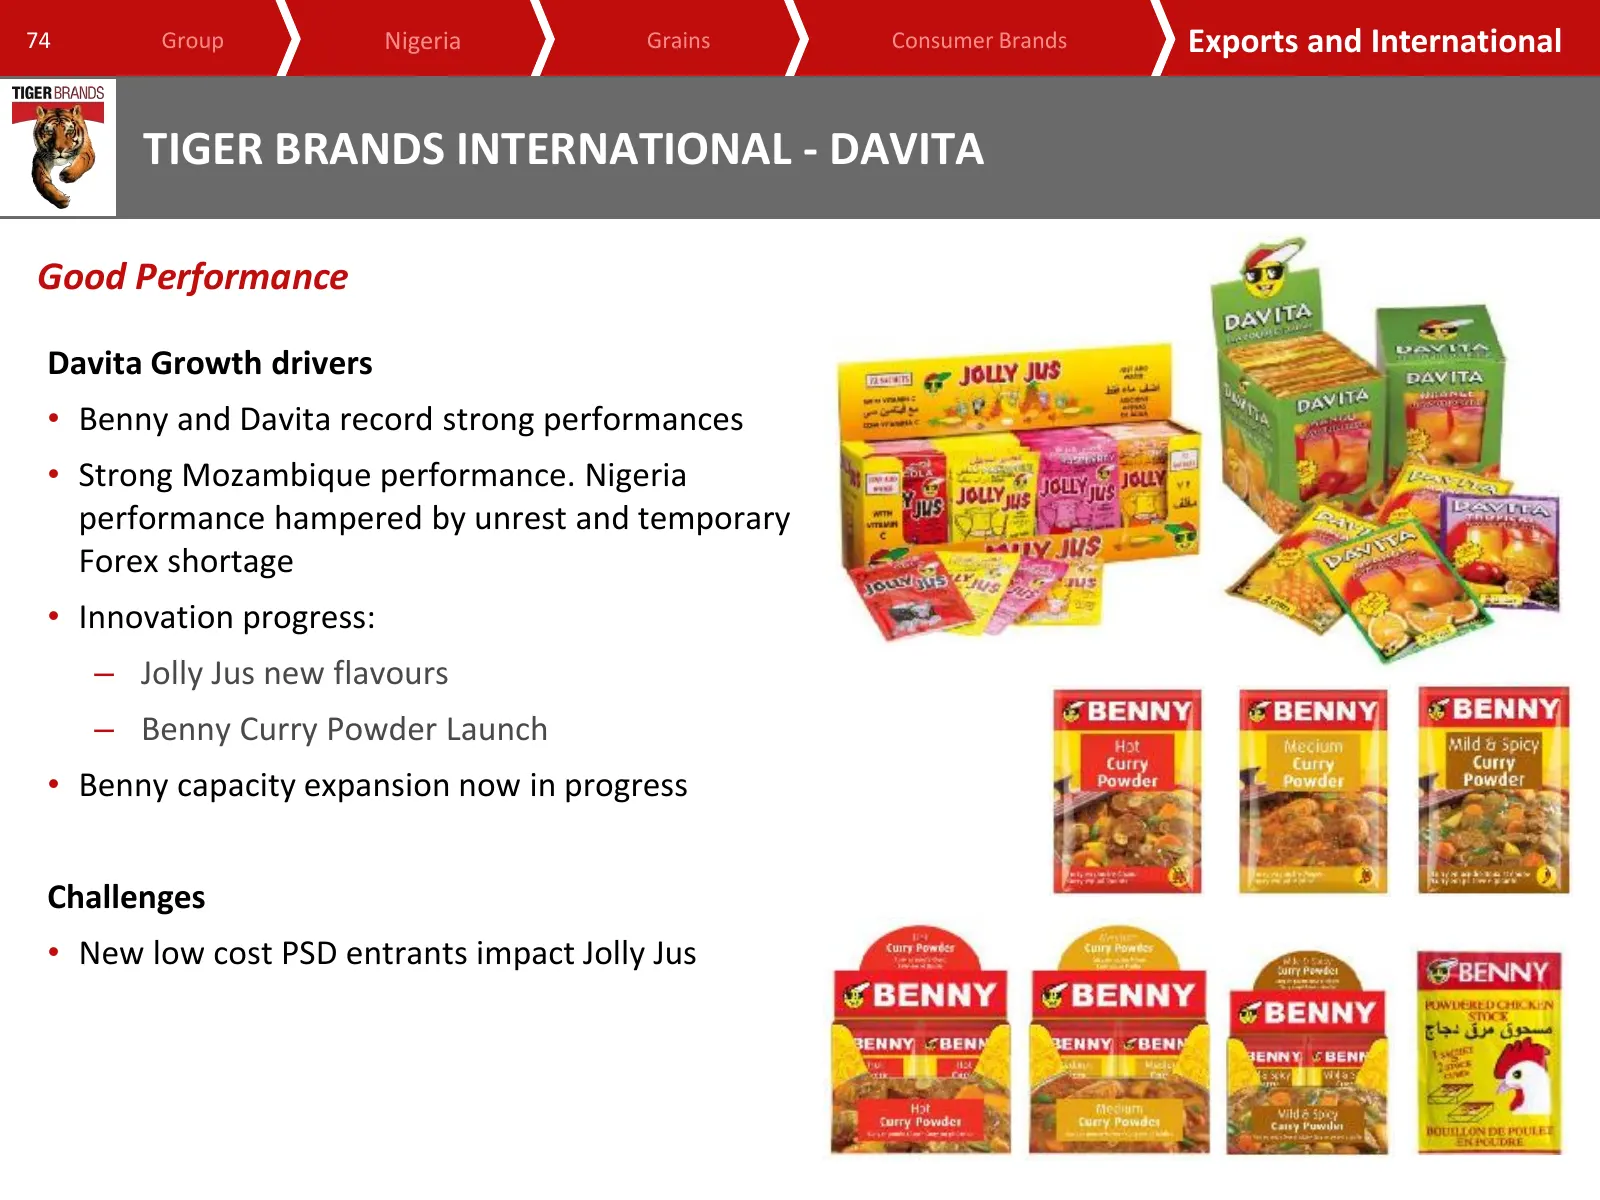
Slide 74: Tiger Brands International - Davita
74 Group Nigeria Grains Consumer Brands Exports and International TIGER BRANDS INTERNATIONAL - DAVITA Good Performance Davita Growth drivers • Benny and Davita record strong performances • Strong Mozambique performance. Nigeria performance hampered by unrest and temporary Forex shortage • Innovation
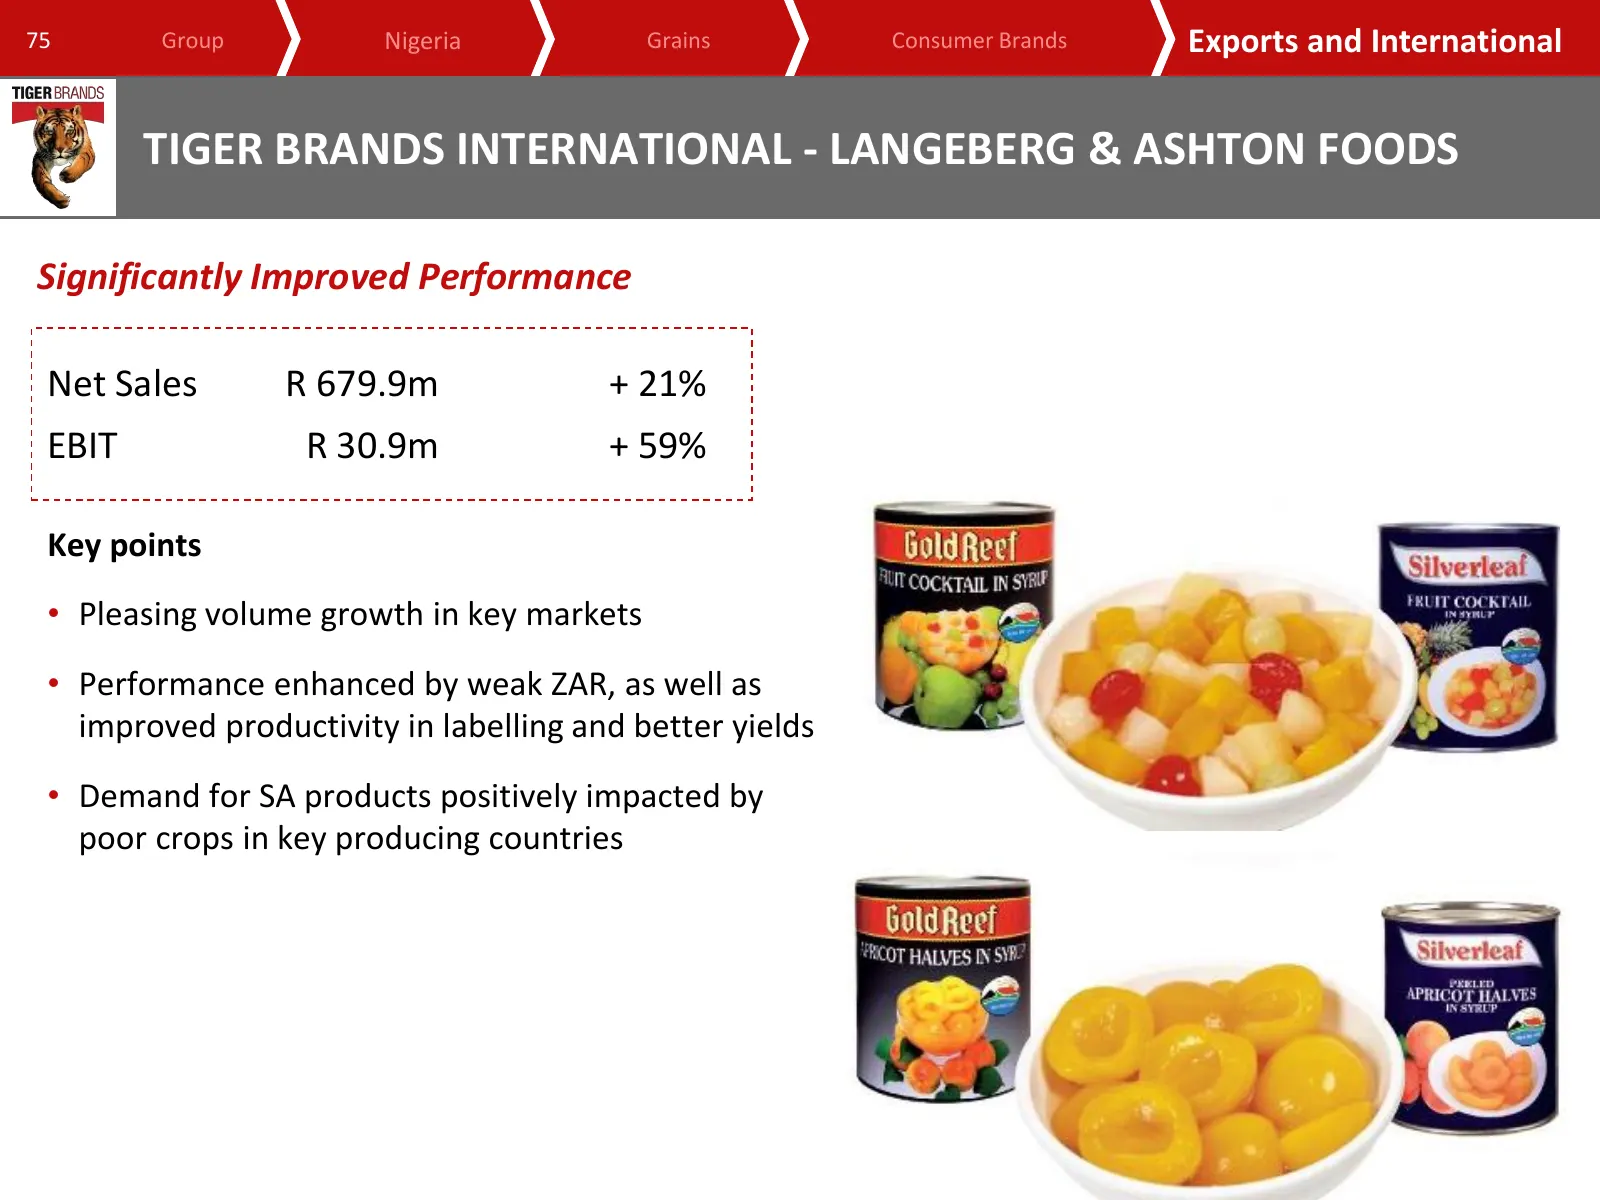
Slide 75: Tiger Brands International - Langeberg & Ashton Foods
75 Group Nigeria Grains Consumer Brands Exports and International TIGER BRANDS INTERNATIONAL - LANGEBERG & ASHTON FOODS Significantly Improved Performance Net Sales R 679.9m + 21% EBIT R 30.9m + 59% Key points • Pleasing volume growth in key markets • Performance enhanced by weak ZAR, as well as imp
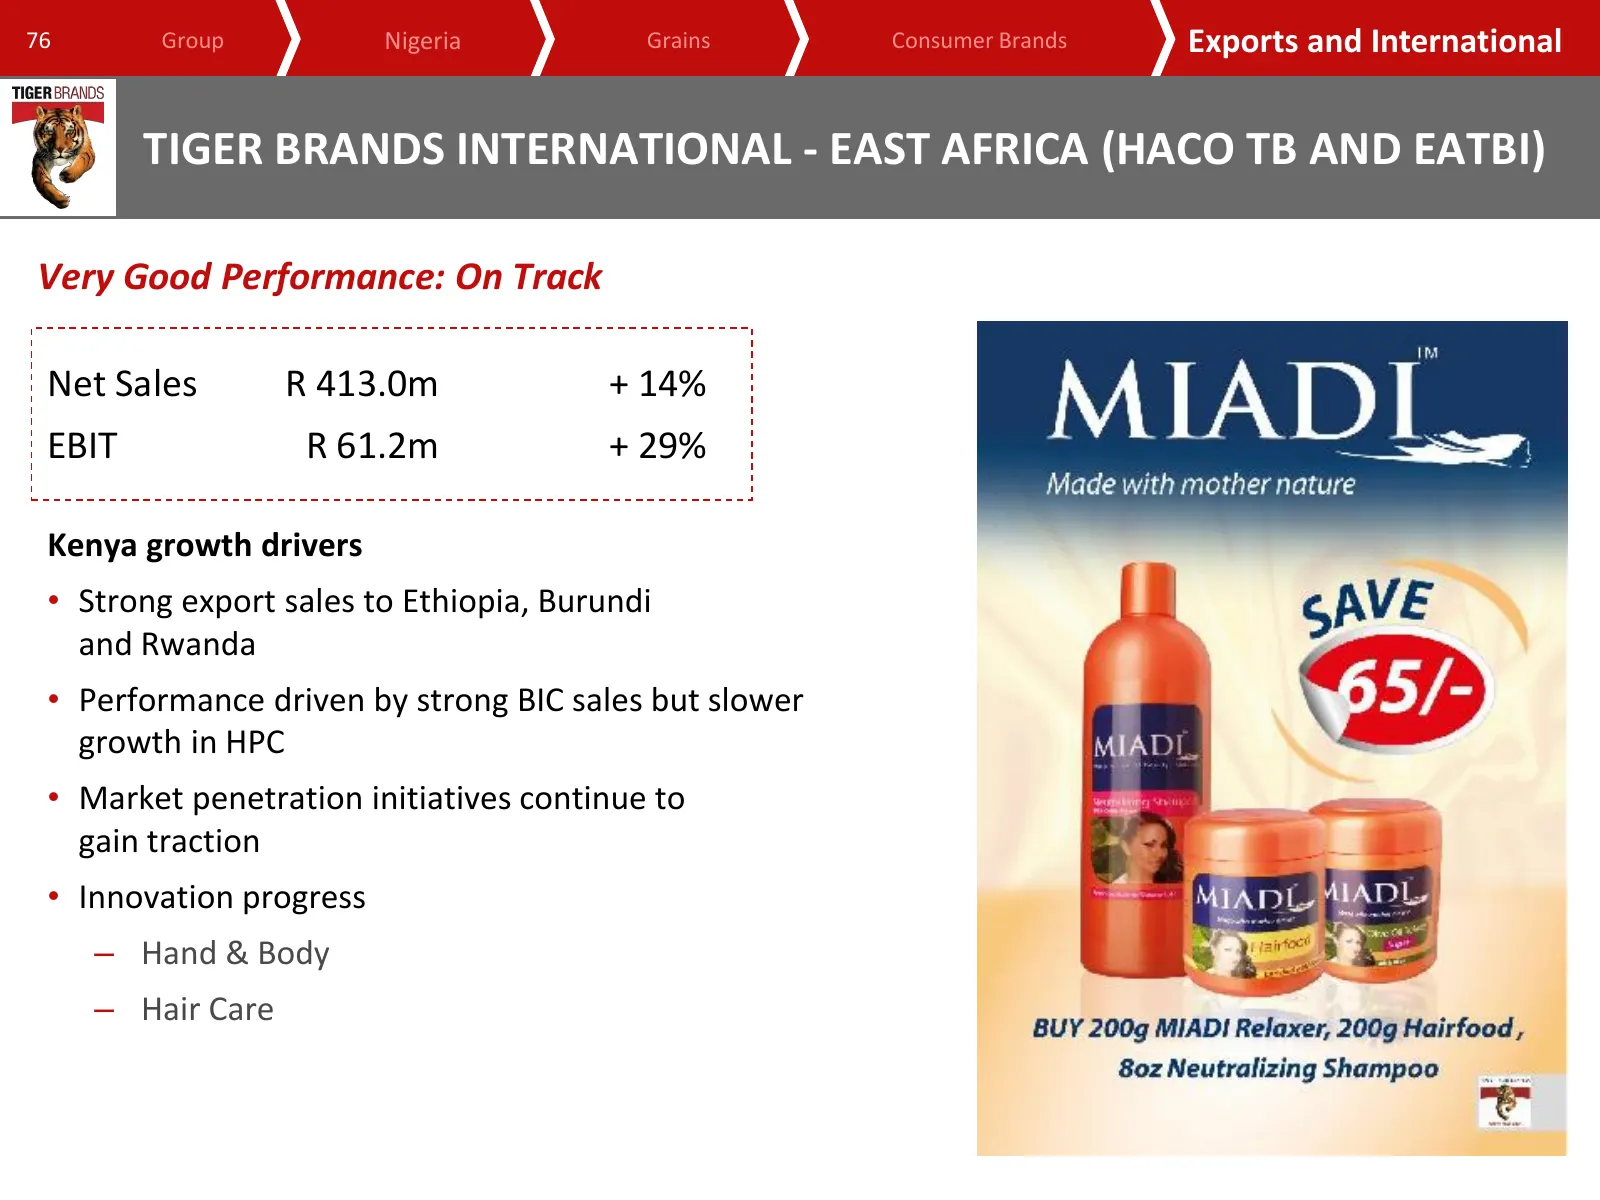
Slide 76: Tiger Brands International - East Africa
76 Group Nigeria Grains Consumer Brands Exports and International TIGER BRANDS INTERNATIONAL - EAST AFRICA (HACO TB AND EATBI) Very Good Performance: On Track Net Sales R 413.0m + 14% EBIT R 61.2m + 29% Kenya growth drivers • Strong export sales to Ethiopia, Burundi and Rwanda • Performance driven b
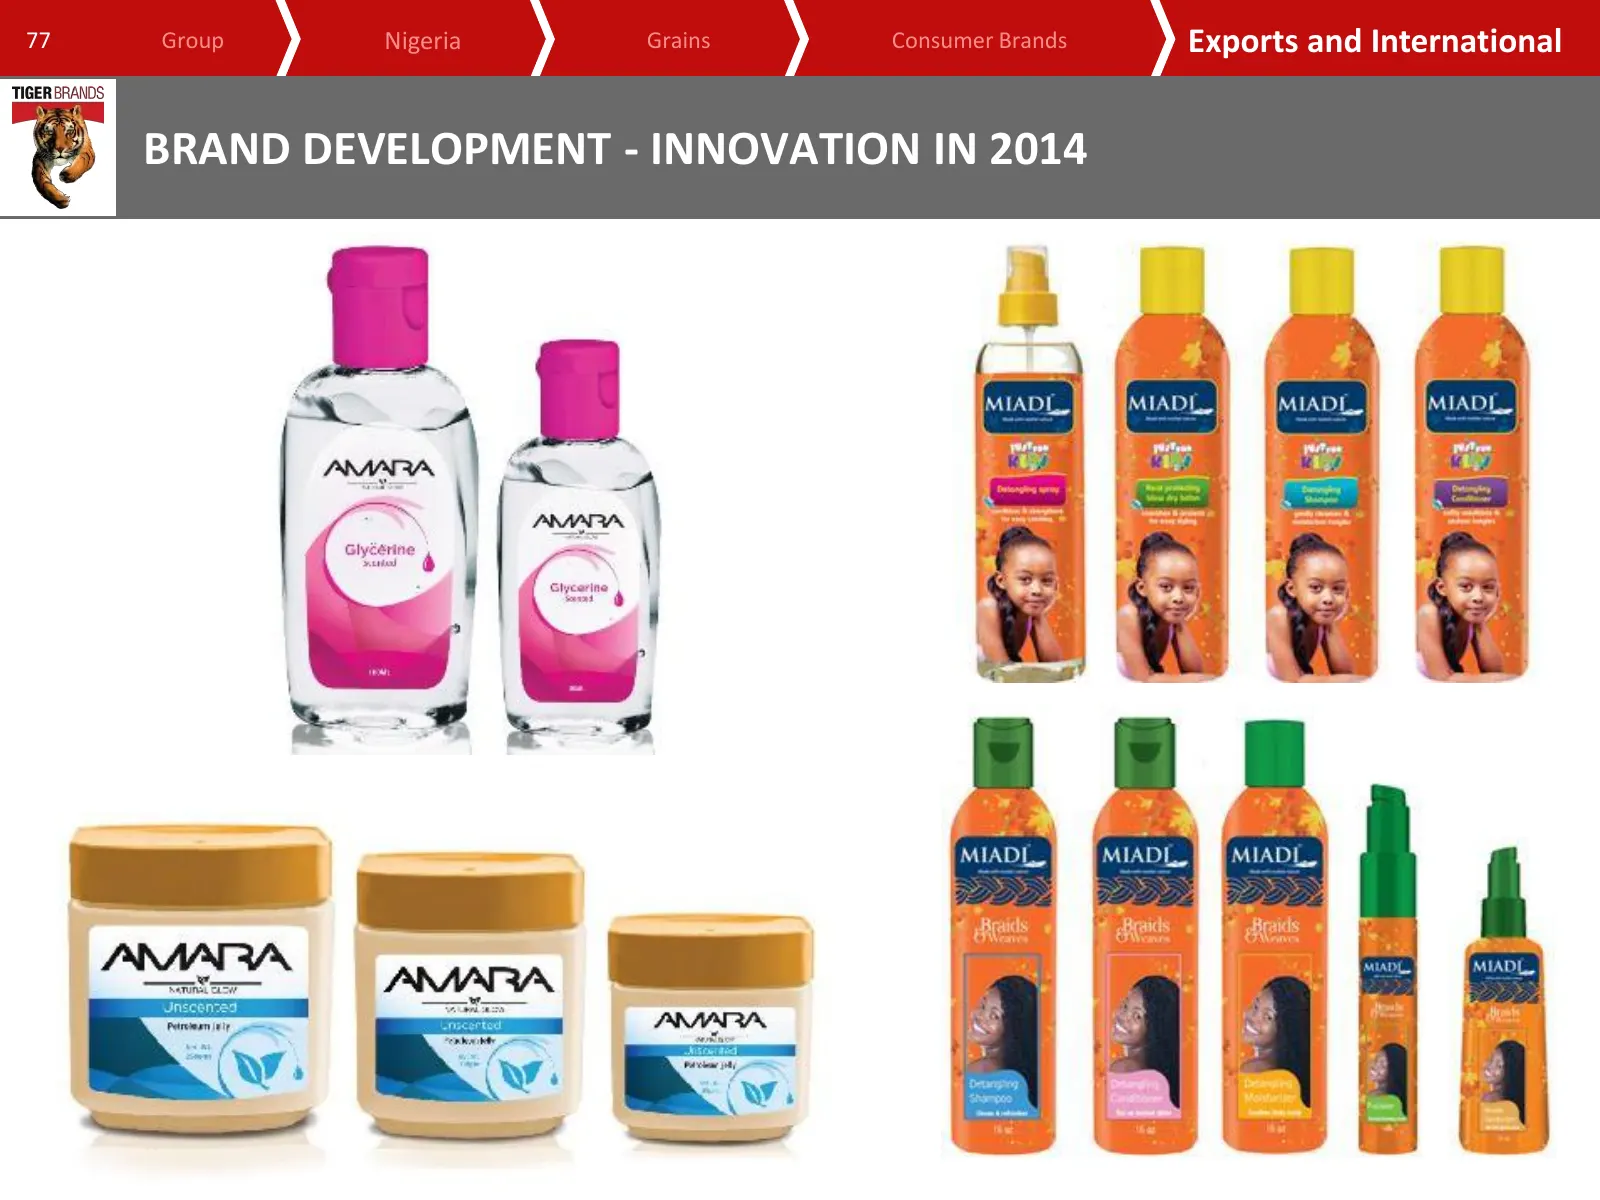
Slide 77: Brand development - innovation in 2014
77 Group Nigeria Grains Consumer Brands Exports and International BRAND DEVELOPMENT - INNOVATION IN 2014
Slide 78: Tiger Brands International - EATBI, Ethiopia
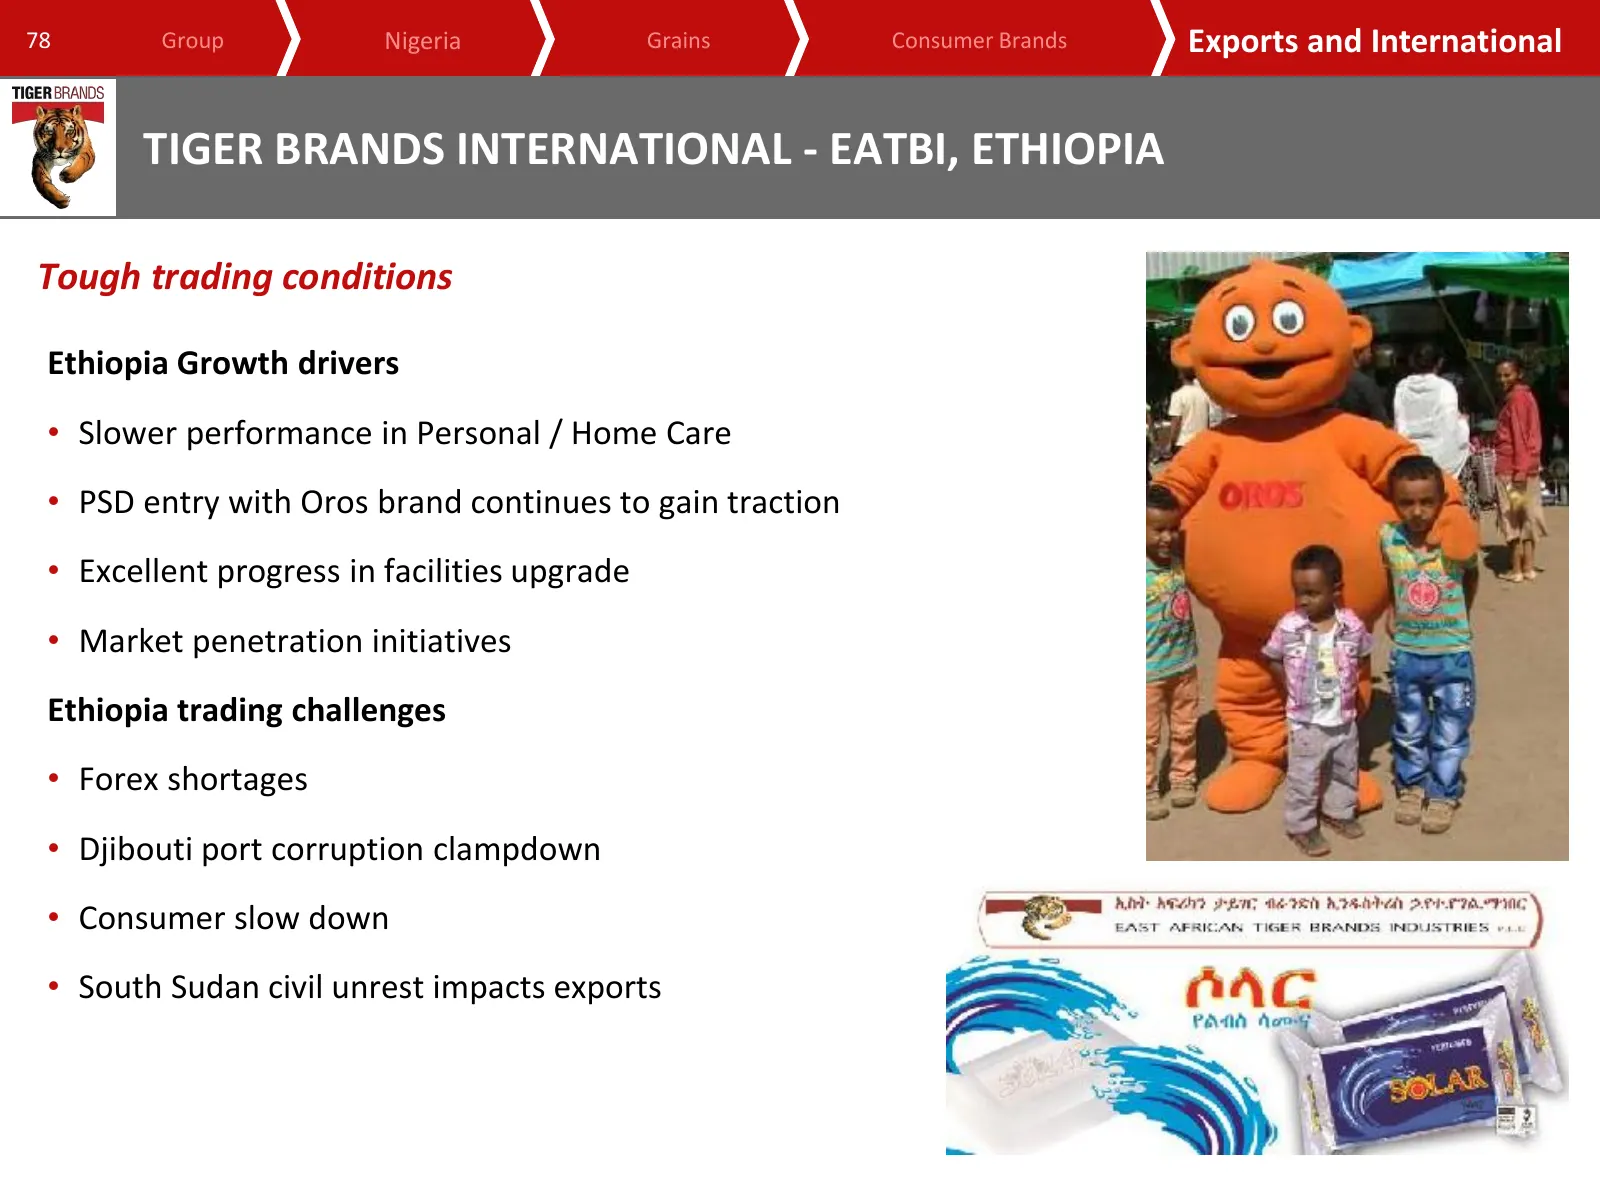
78 Group Nigeria Grains Consumer Brands Exports and International TIGER BRANDS INTERNATIONAL - EATBI, ETHIOPIA Tough trading conditions Ethiopia Growth drivers • Slower performance in Personal / Home Care • PSD entry with Oros brand continues to gain traction • Excellent progress in facilities upgra
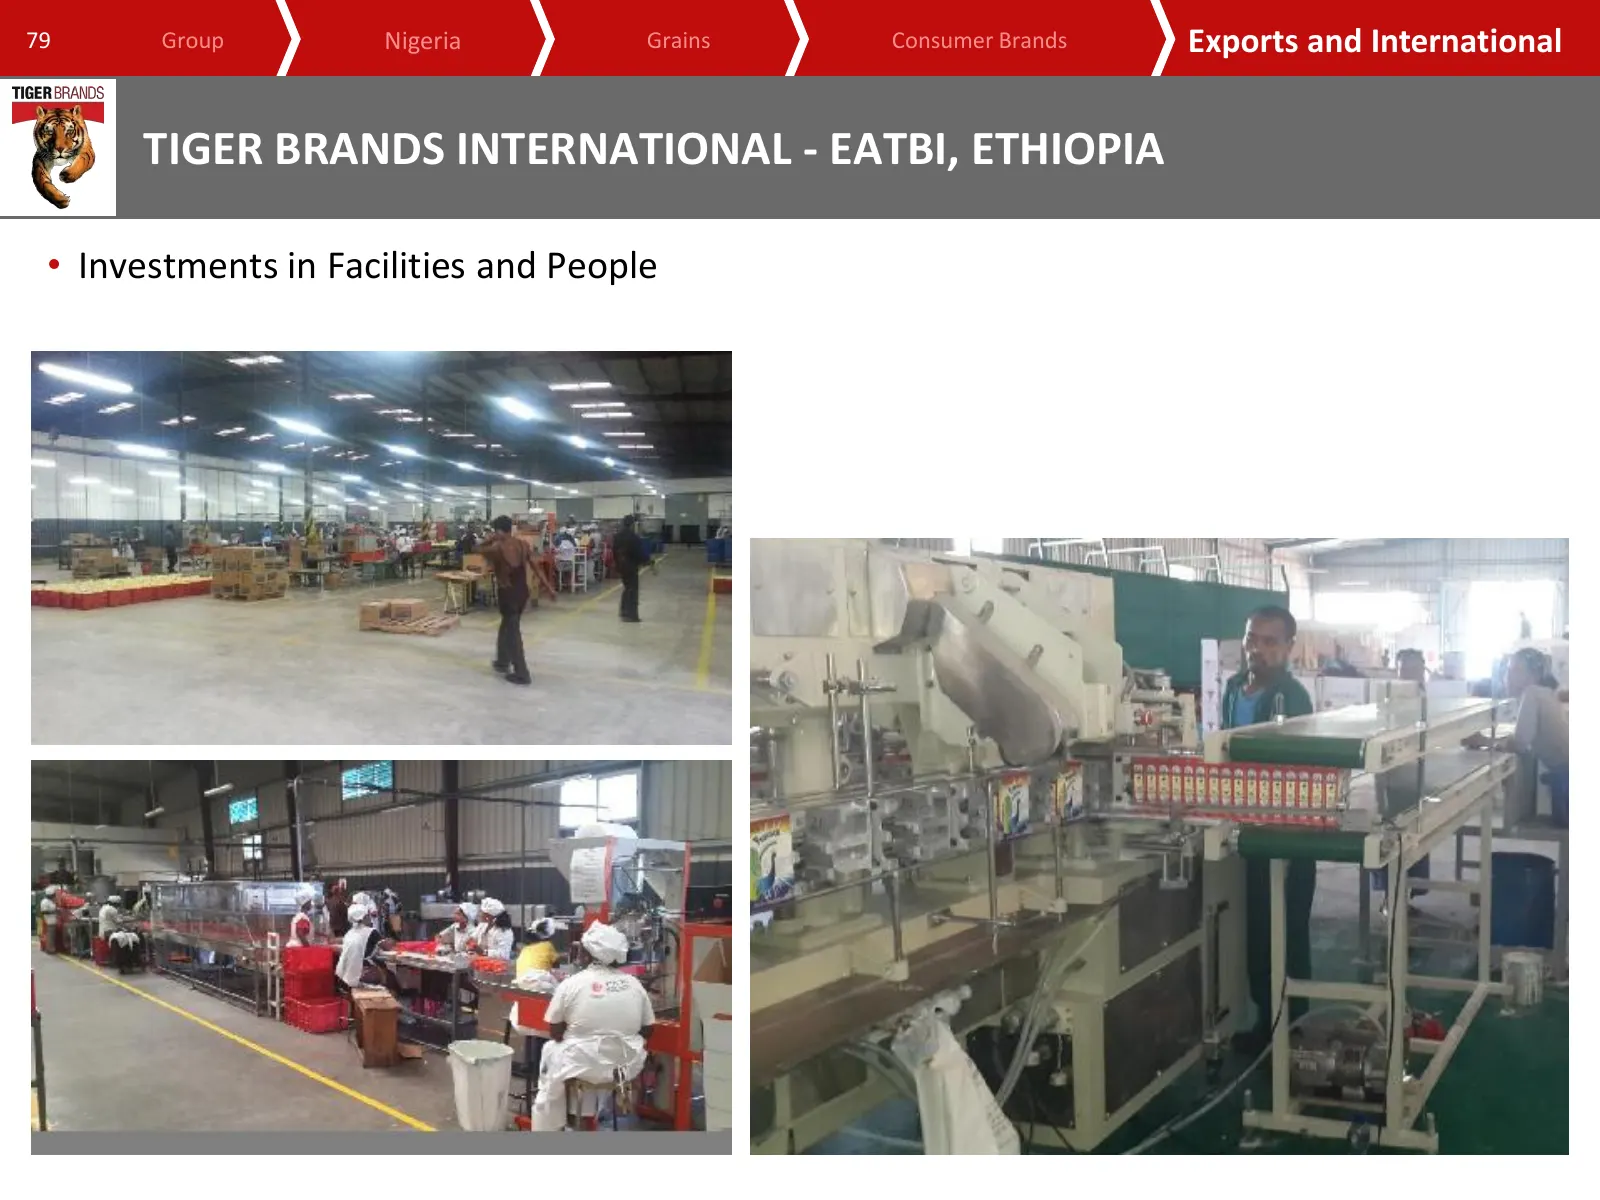
Slide 79: EATBI, Ethiopia - Investments in facilities and people
79 Group Nigeria Grains Consumer Brands Exports and International TIGER BRANDS INTERNATIONAL - EATBI, ETHIOPIA • Investments in Facilities and People
Slide 80: Tiger Brands International - Central Africa
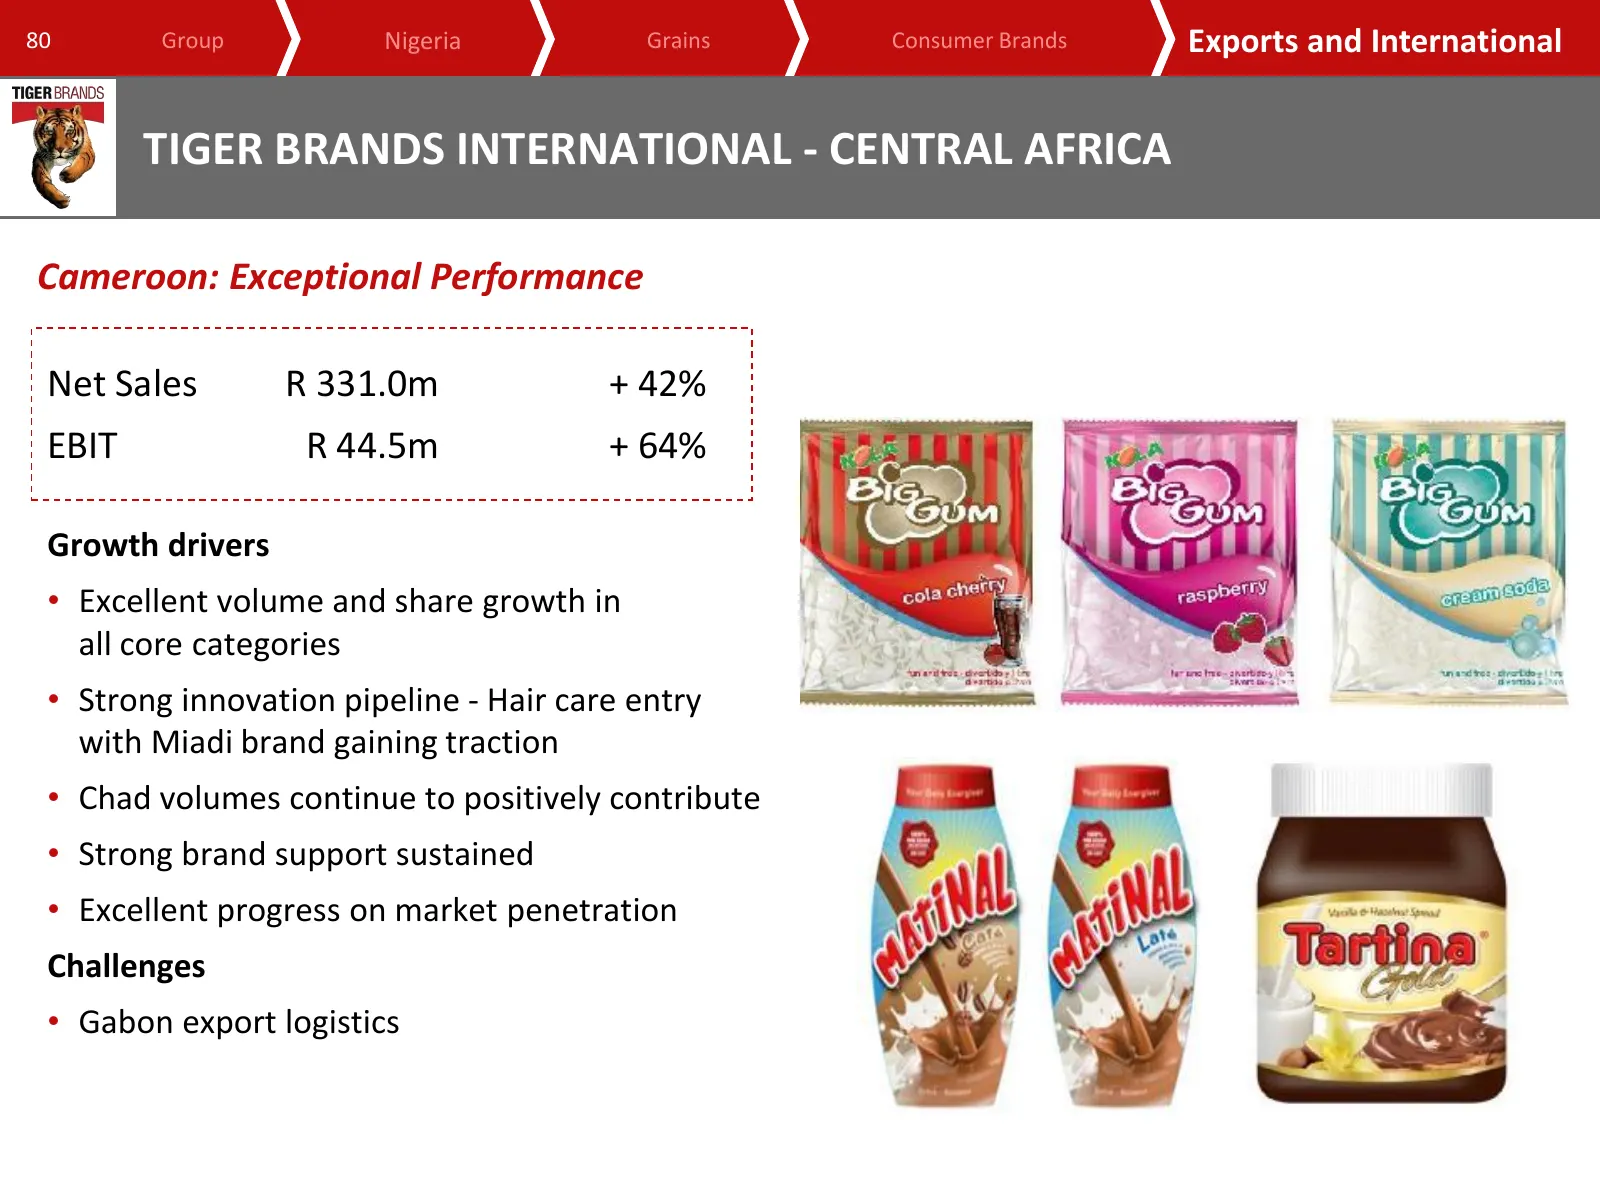
80 Group Nigeria Grains Consumer Brands Exports and International TIGER BRANDS INTERNATIONAL - CENTRAL AFRICA Cameroon: Exceptional Performance Net Sales R 331.0m + 42% EBIT R 44.5m + 64% Growth drivers • Excellent volume and share growth in all core categories • Strong innovation pipeline - Hair ca
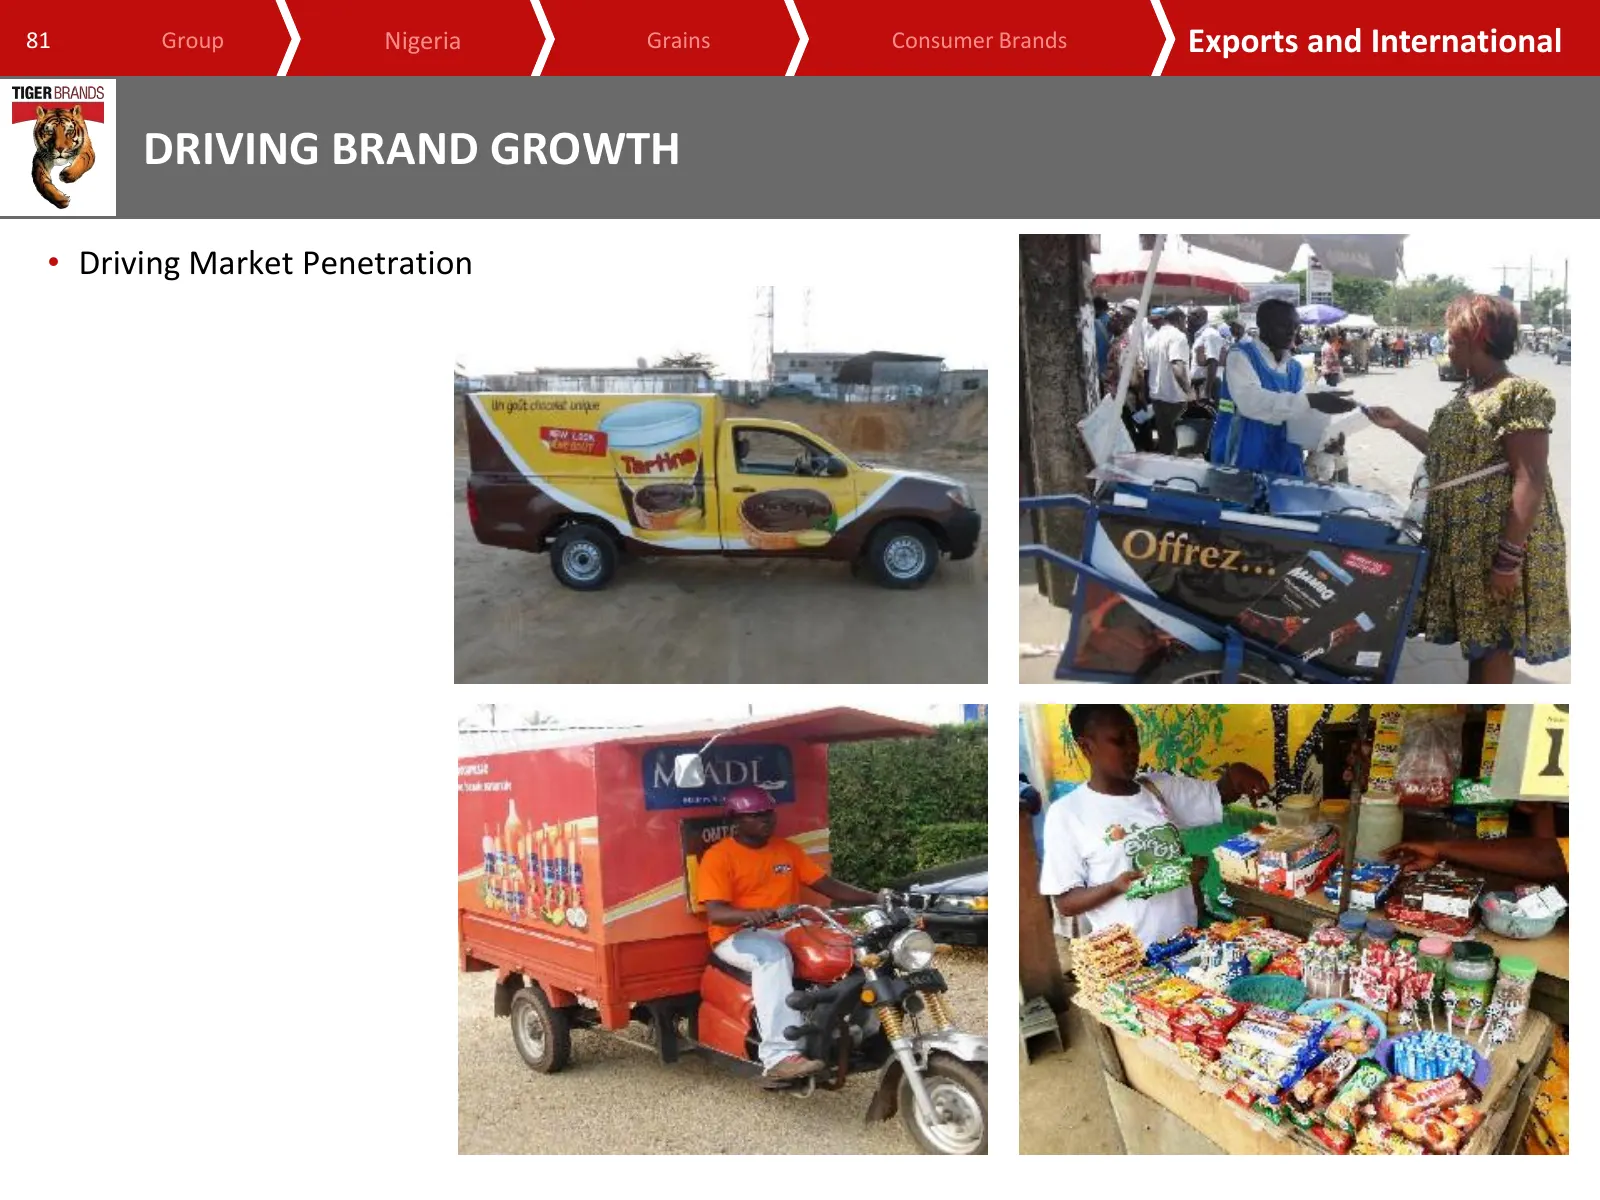
Slide 81: Driving brand growth
81 Group Nigeria Grains Consumer Brands Exports and International DRIVING BRAND GROWTH • Driving Market Penetration
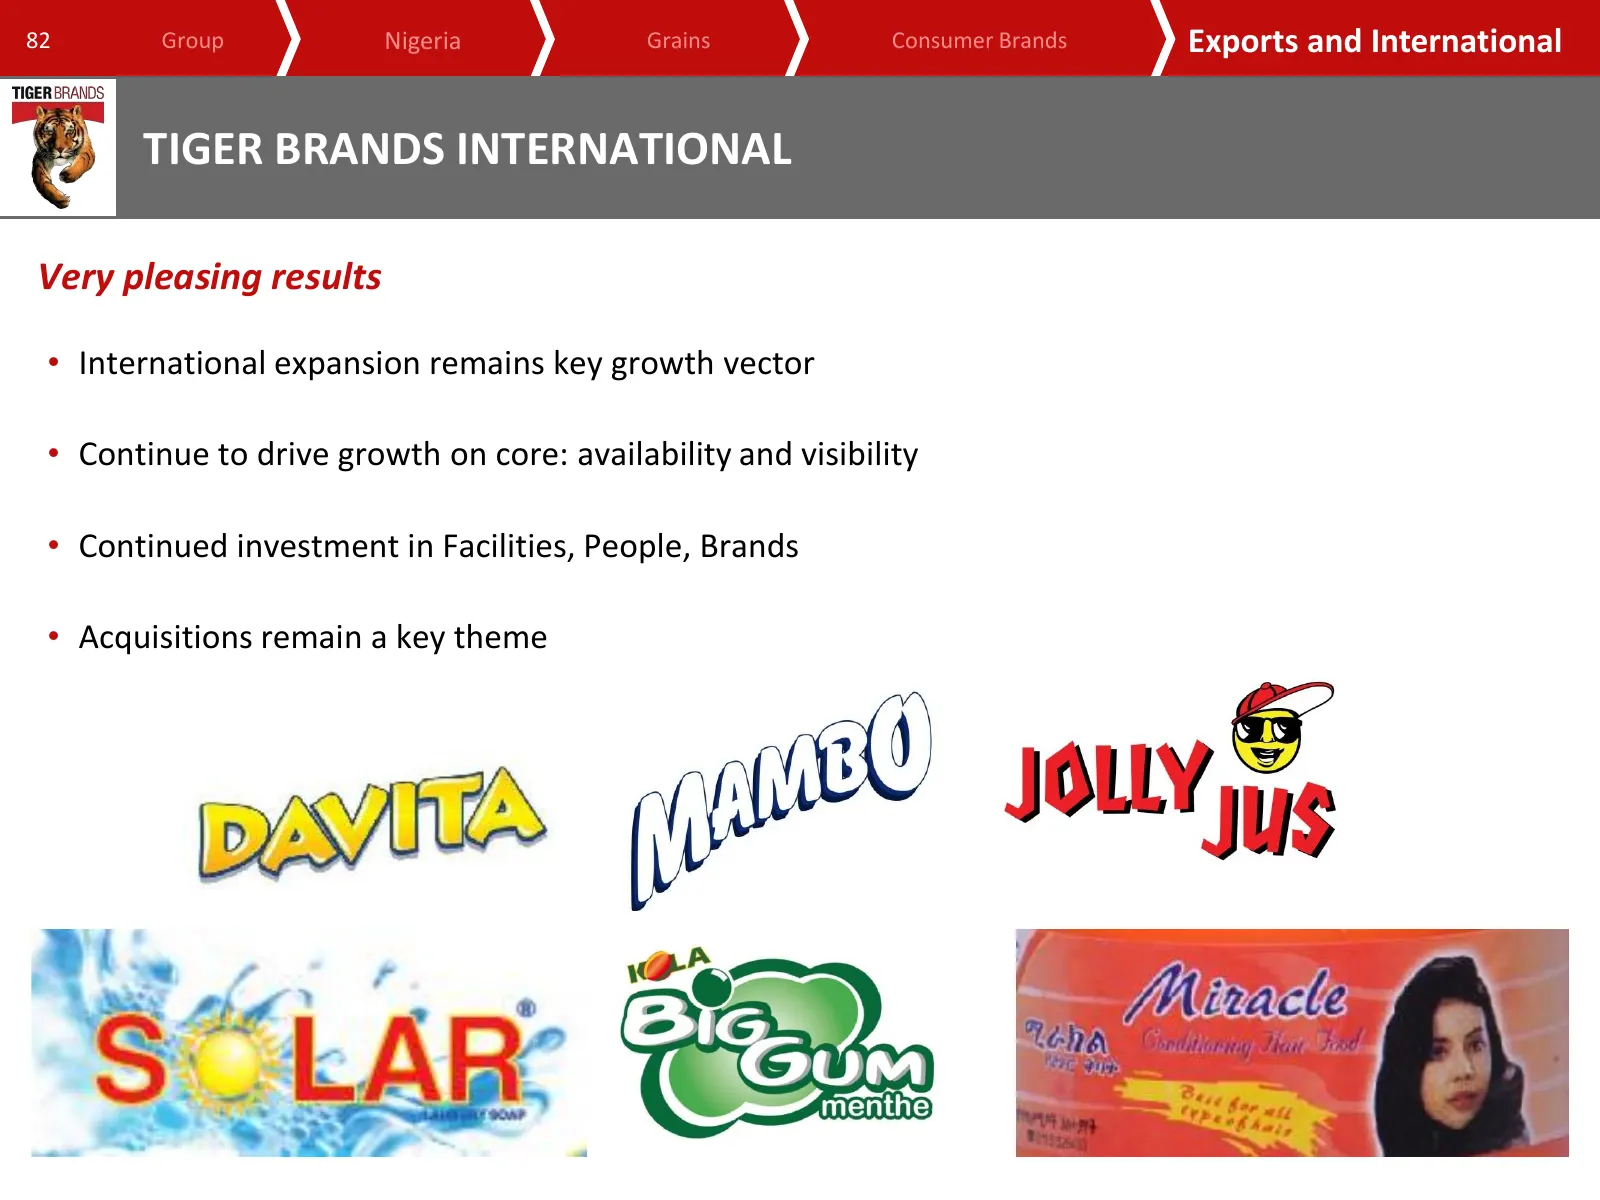
Slide 82: Tiger Brands International
82 Group Nigeria Grains Consumer Brands Exports and International TIGER BRANDS INTERNATIONAL Very pleasing results • International expansion remains key growth vector • Continue to drive growth on core: availability and visibility • Continued investment in Facilities, People, Brands • Acquisitions r

Slide 83: Conclusion
www.tigerbrands.com Conclusion Peter Matlare Chief Executive Officer
Slide 84: Outlook
84 Group Nigeria Grains Consumer Brands Exports and International OUTLOOK • Tough market conditions will prevail in all territories • International businesses expected to continue to contribute positively to the Group’s performance • DFM continues to receive urgent management attention • Strategic e
Slide 85: Disclaimer
85 Group Nigeria Grains Consumer Brands Exports and International DISCLAIMER Certain statements in this presentation may be defined as forward looking within the meaning of the United States Securities legislation. Forward-looking statements involve known and unknown risks, uncertainties and other i

Slide 86: Tiger Brands Limited
www.tigerbrands.com TIGER BRANDS LIMITED RESULTS PRESENTATION TO INVESTORS for the six months ended 31 March 2014
Source: Internet Archive copy of tigerbrands.com
More decks from Tiger Brands Limited
 H1 2026 Earnings Presentation37 slides · Jun 1, 2026
 H1 2026 Earnings Presentation38 slides · Jun 1, 2026
 FY2025 Earnings Presentation38 slides · Nov 26, 2025
 H1 2025 Earnings Presentation43 slides · May 28, 2025
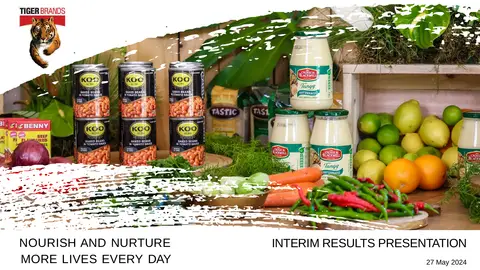 H1 FY2024 Earnings Presentation38 slides · May 27, 2024
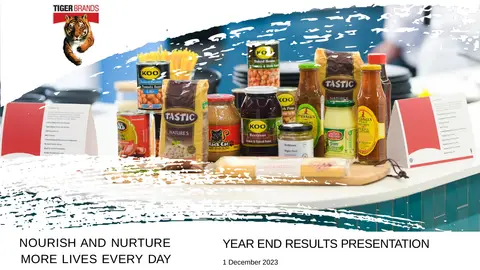 FY2023 Earnings Presentation45 slides · Dec 1, 2023