Durr AG · XETR:DUE
Durr — Q1 2012 Earnings Presentation
25 slides from Durr's earnings presentation, May 10, 2012
Slide 1: Conference Call Results January - March 2012
Conference Call Results January - March 2012 Dürr Group Ralf W. Dieter, CEO / Ralph Heuwing, CFO Bietigheim-Bissingen, May 10, 2012 www.durr.com -1-
Slide 2: Disclaimer
Disclaimer This presentation has been prepared independently by Dürr AG (“Dürr”). The presentation contains statements which address such key issues as Dürr´s strategy, future financial results, market positions and product development. Such statements should be carefully considered, and it should b
Slide 3: Ongoing strong demand
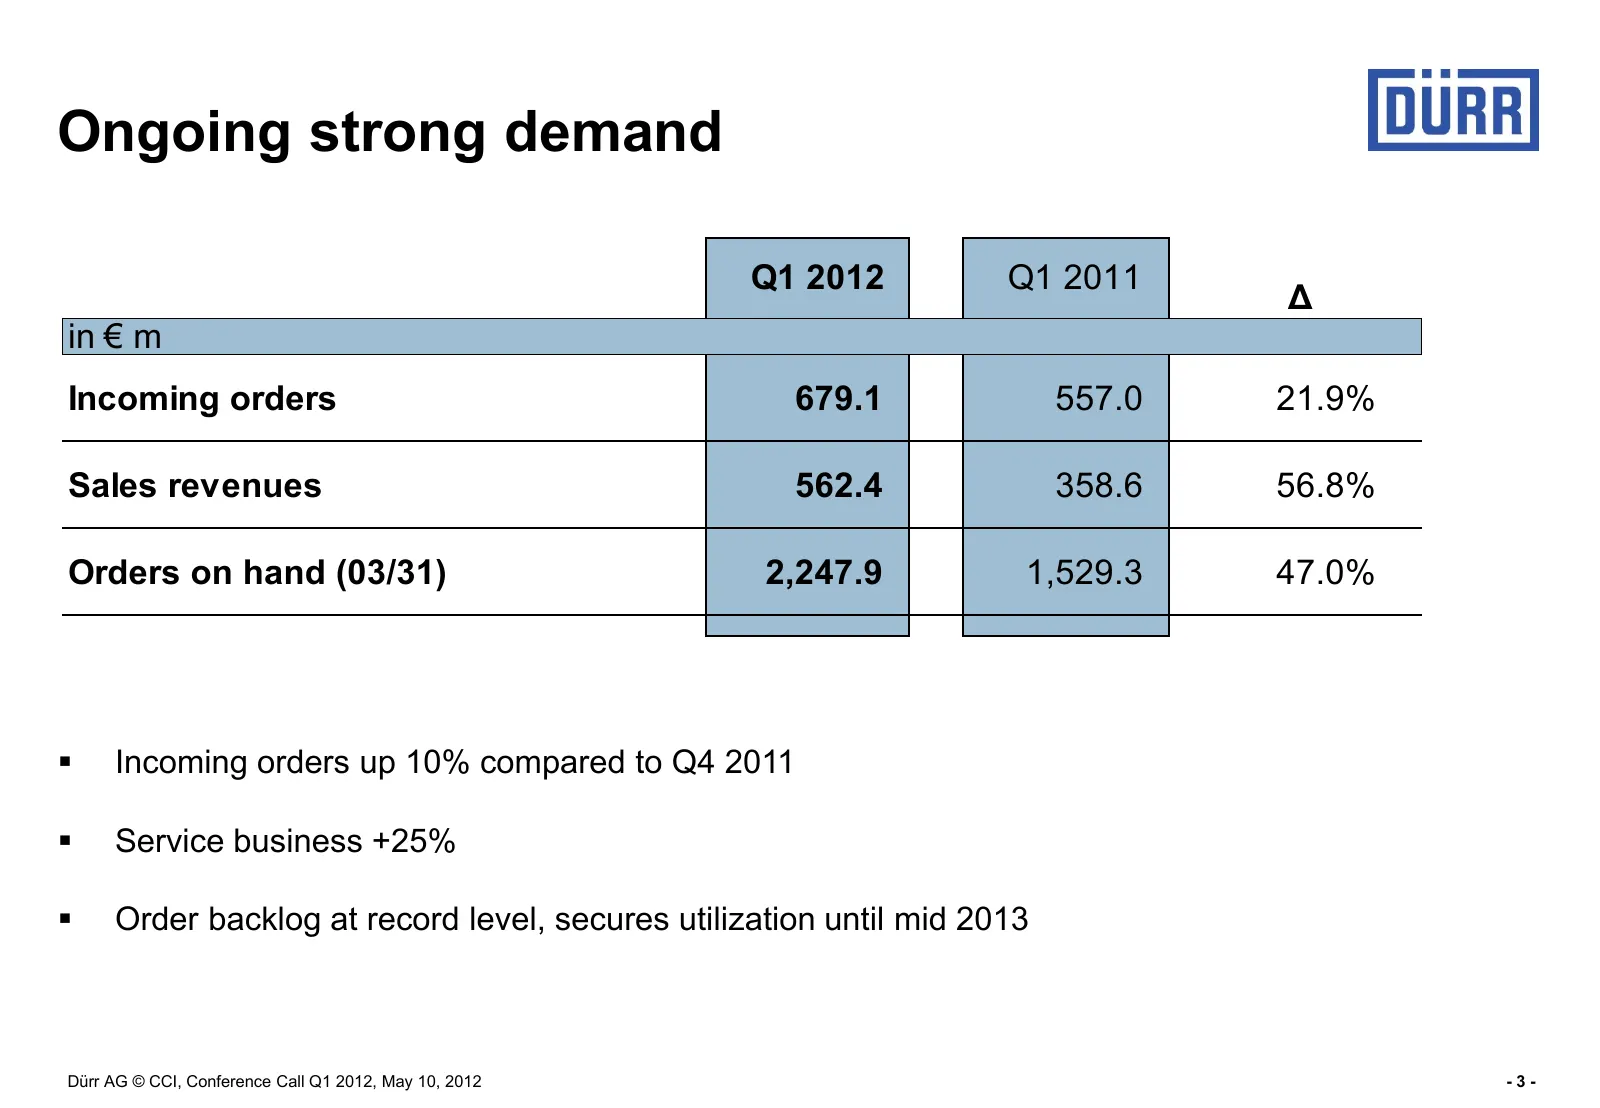
Ongoing strong demand Q1 2012 Q1 2011 Δ in € m Incoming orders 679.1 557.0 21.9% Sales revenues 562.4 358.6 56.8% Orders on hand (03/31) 2,247.9 1,529.3 47.0% Incoming orders up 10% compared to Q4 2011 Service business +25% Order backlog at record level, secures utilization until mid 2013 Dürr
Slide 4: Incoming orders in the last quarters: € 2.8 bn
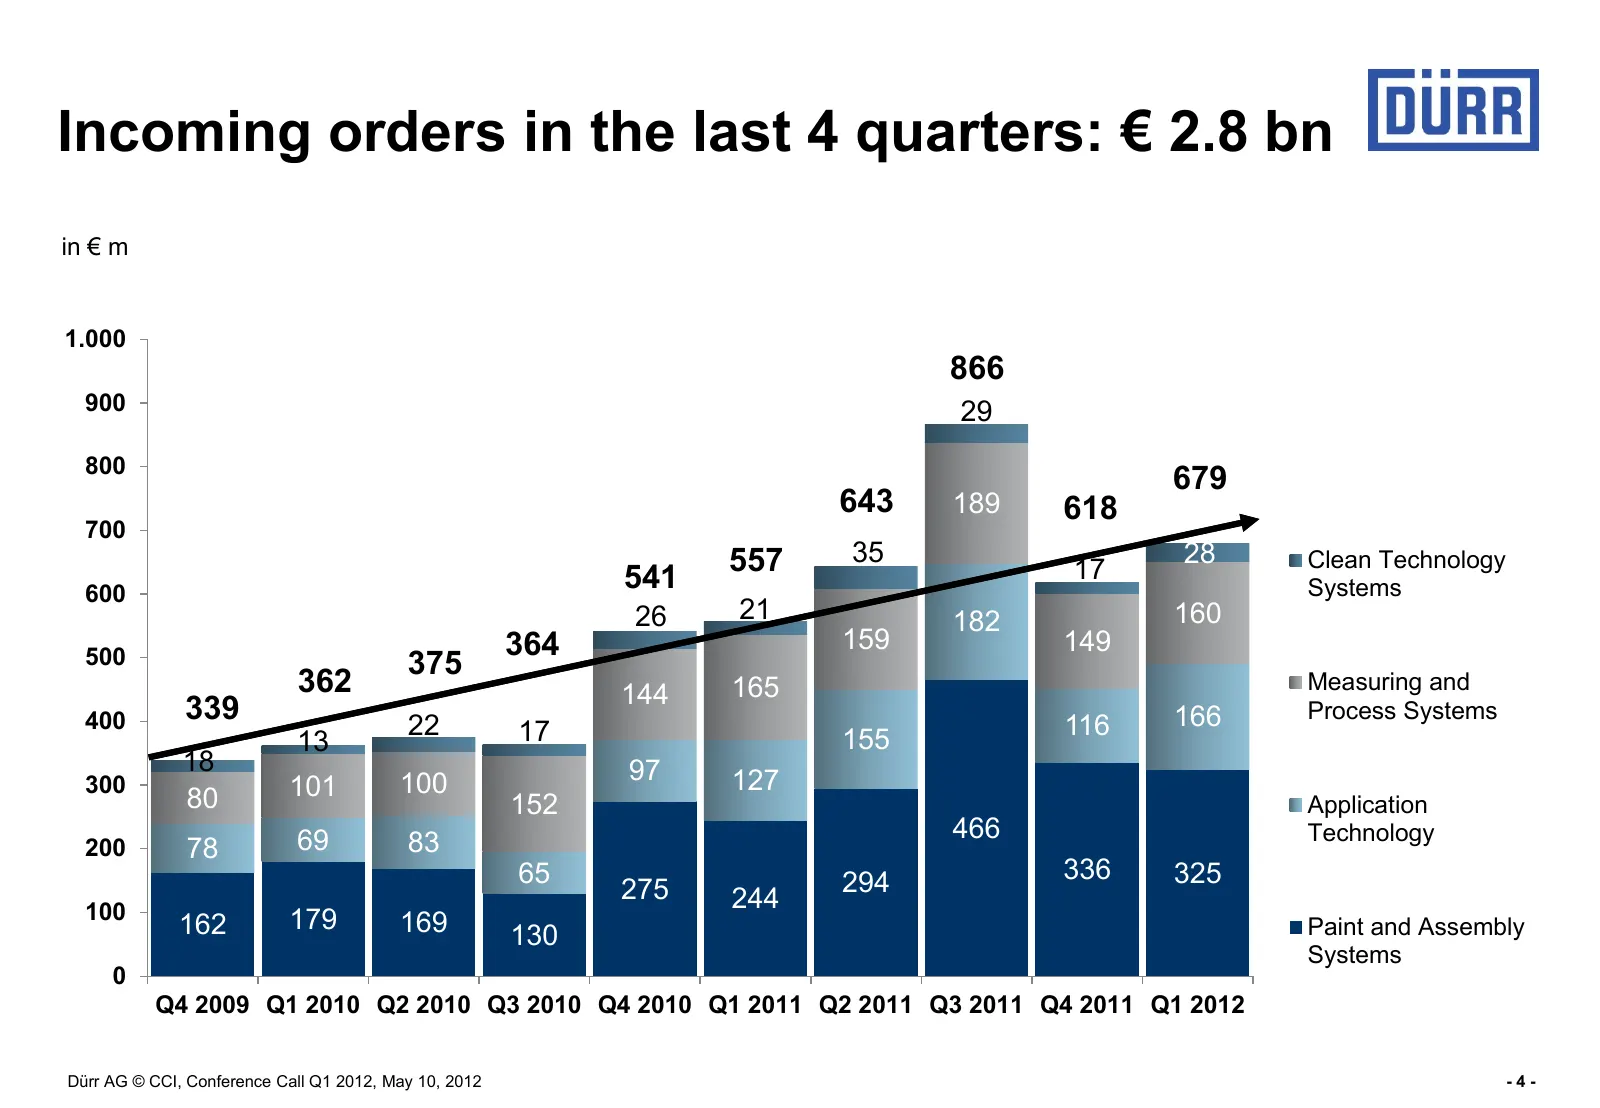
Incoming orders in the last 4 quarters: € 2.8 bn in € m 1.000 866 900 29 800 679 643 189 618 700 557 35 28 Clean Technology 541 17 600 Systems 26 21 182 160 364 159 149 500 375 362 144 165 Measuring and 400 339 116 166 Process Systems 22 17 155 13 18 97 300 101 100 127 80 152 Application 69 83 466 T
Slide 5: Incoming orders Jan. - March 2012 vs. 2011
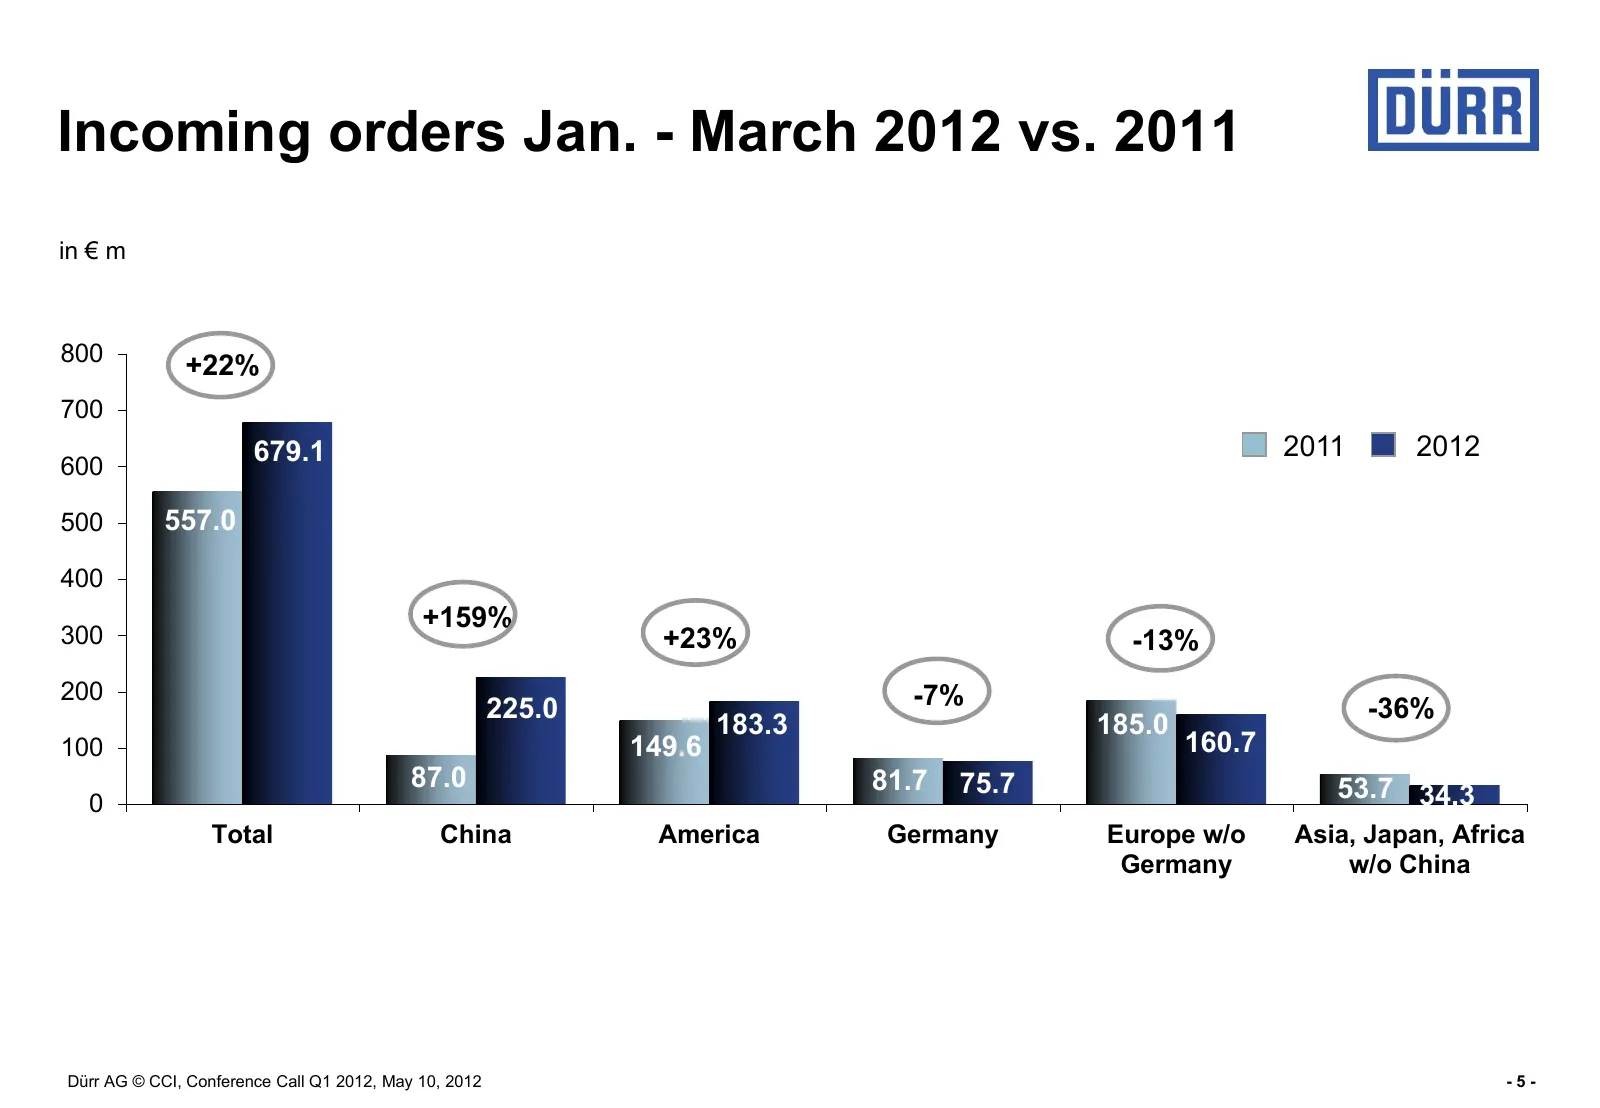
Incoming orders Jan. - March 2012 vs. 2011 in € m 800 +22% 700 679.1 2011 2012 600 500 557.0 400 +159% 300 +23% -13% 200 -7% 225.0 -36% 183.3 185.0 100 149.6 160.7 87.0 81.7 75.7 53.7 34.3 0 Total China America Germany Europe w/o Asia, Japan, Africa Germany w/o China Dürr AG © CCI, Conference Call Q
Slide 6: Increasing number of employees to match higher demand
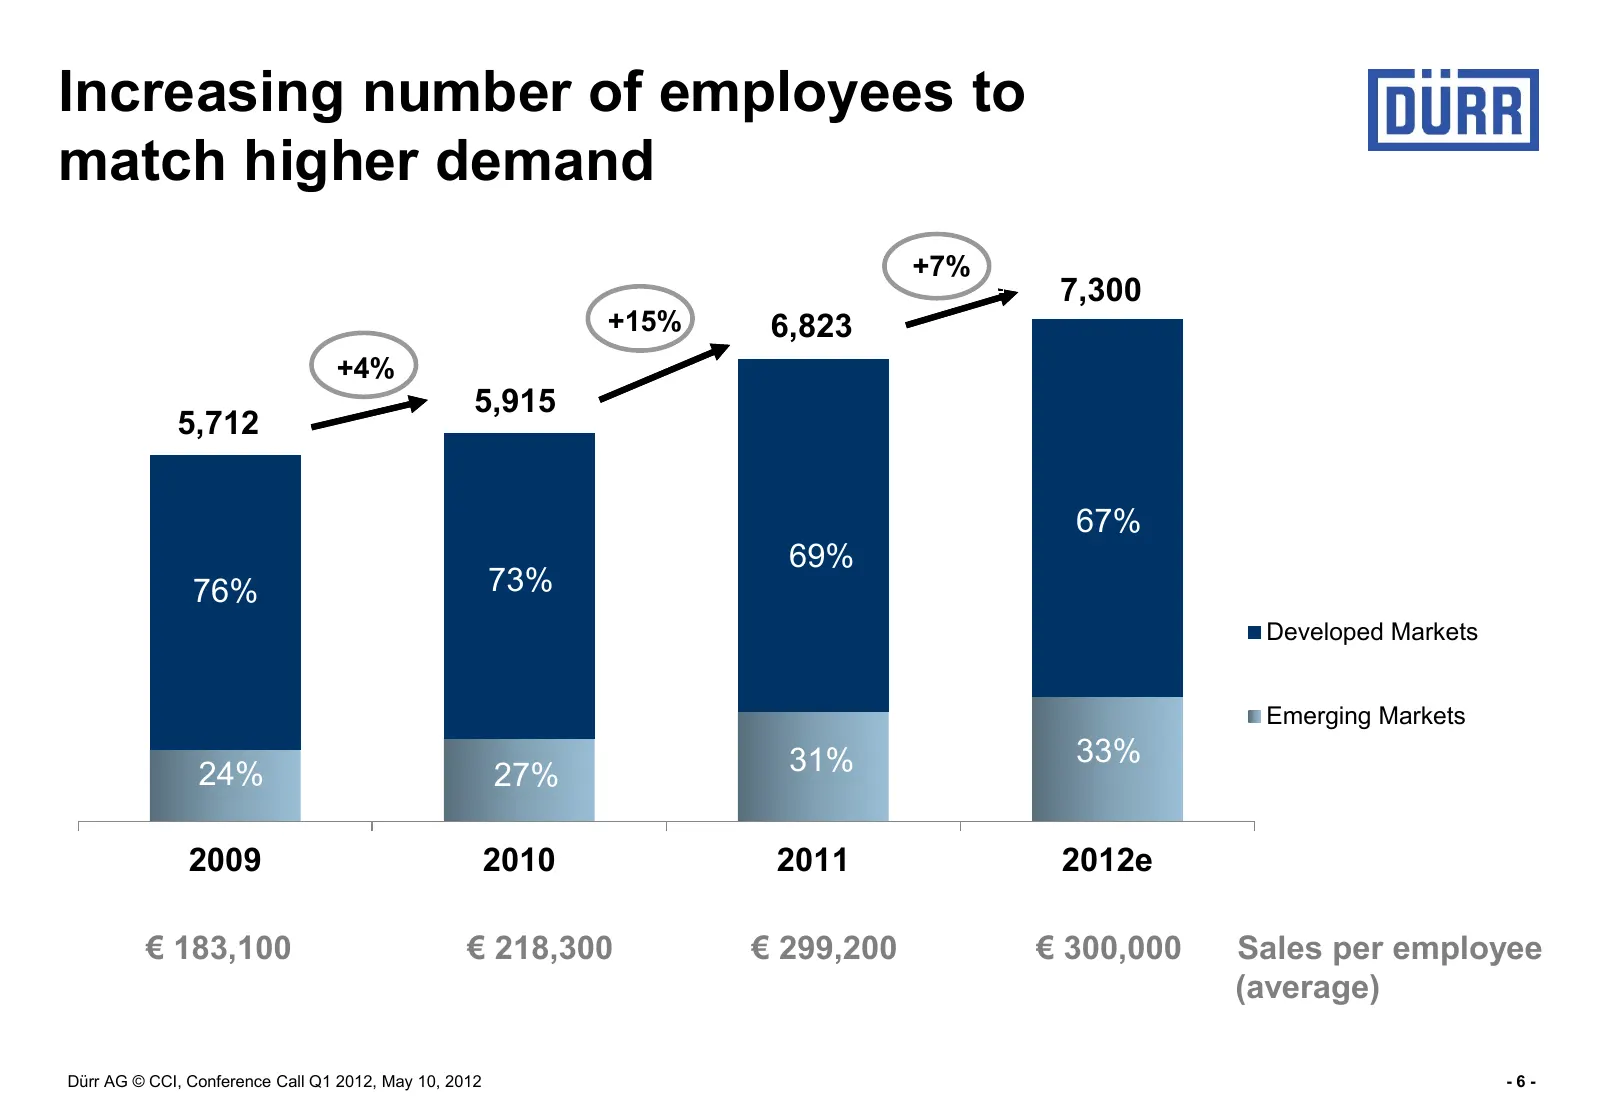
Increasing number of employees to match higher demand +7% 7,300 +15% 6,823 +4% 5,915 5,712 67% 69% 76% 73% Developed Markets Emerging Markets 31% 33% 24% 27% 2009 2010 2011 2012e € 183,100 € 218,300 € 299,200 € 300,000 Sales per employee (average) Dürr AG © CCI, Conference Call Q1 2012, May 10, 2012
Slide 7: Increase of capacities to match higher demand
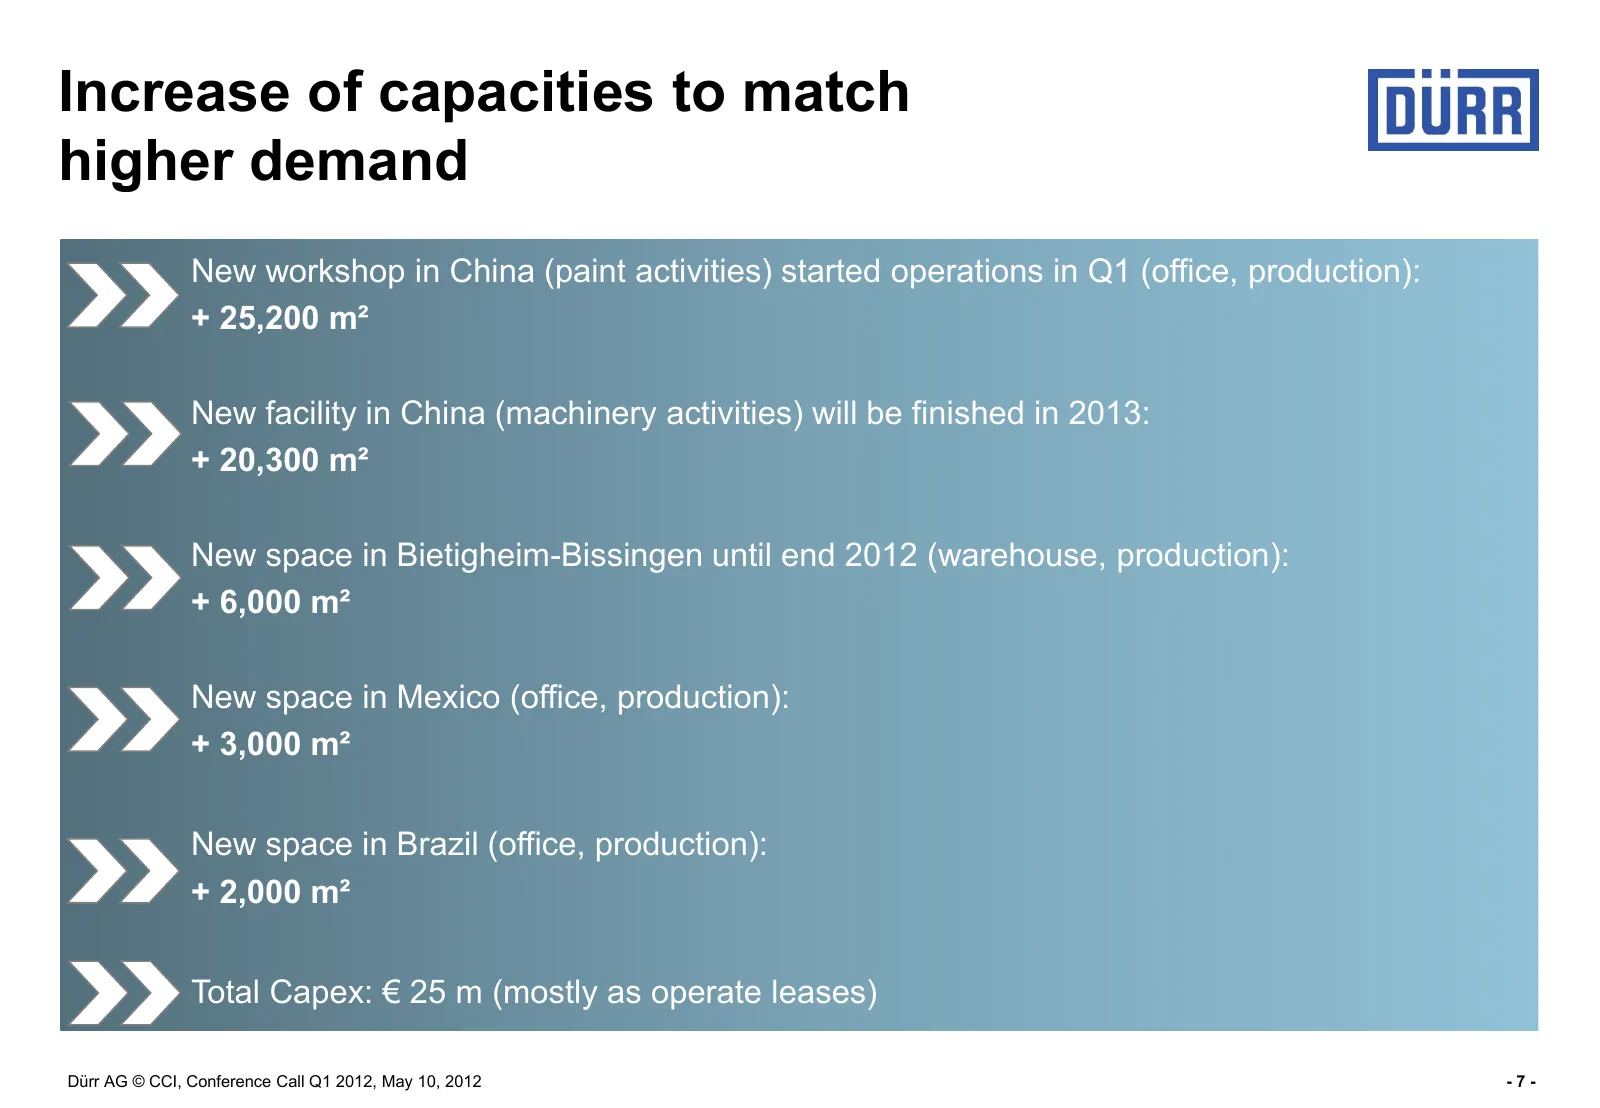
Increase of capacities to match higher demand New workshop in China (paint activities) started operations in Q1 (office, production): + 25,200 m² New facility in China (machinery activities) will be finished in 2013: + 20,300 m² New space in Bietigheim-Bissingen until end 2012 (warehouse, production
Slide 8: Incoming orders: Healthy split across regions
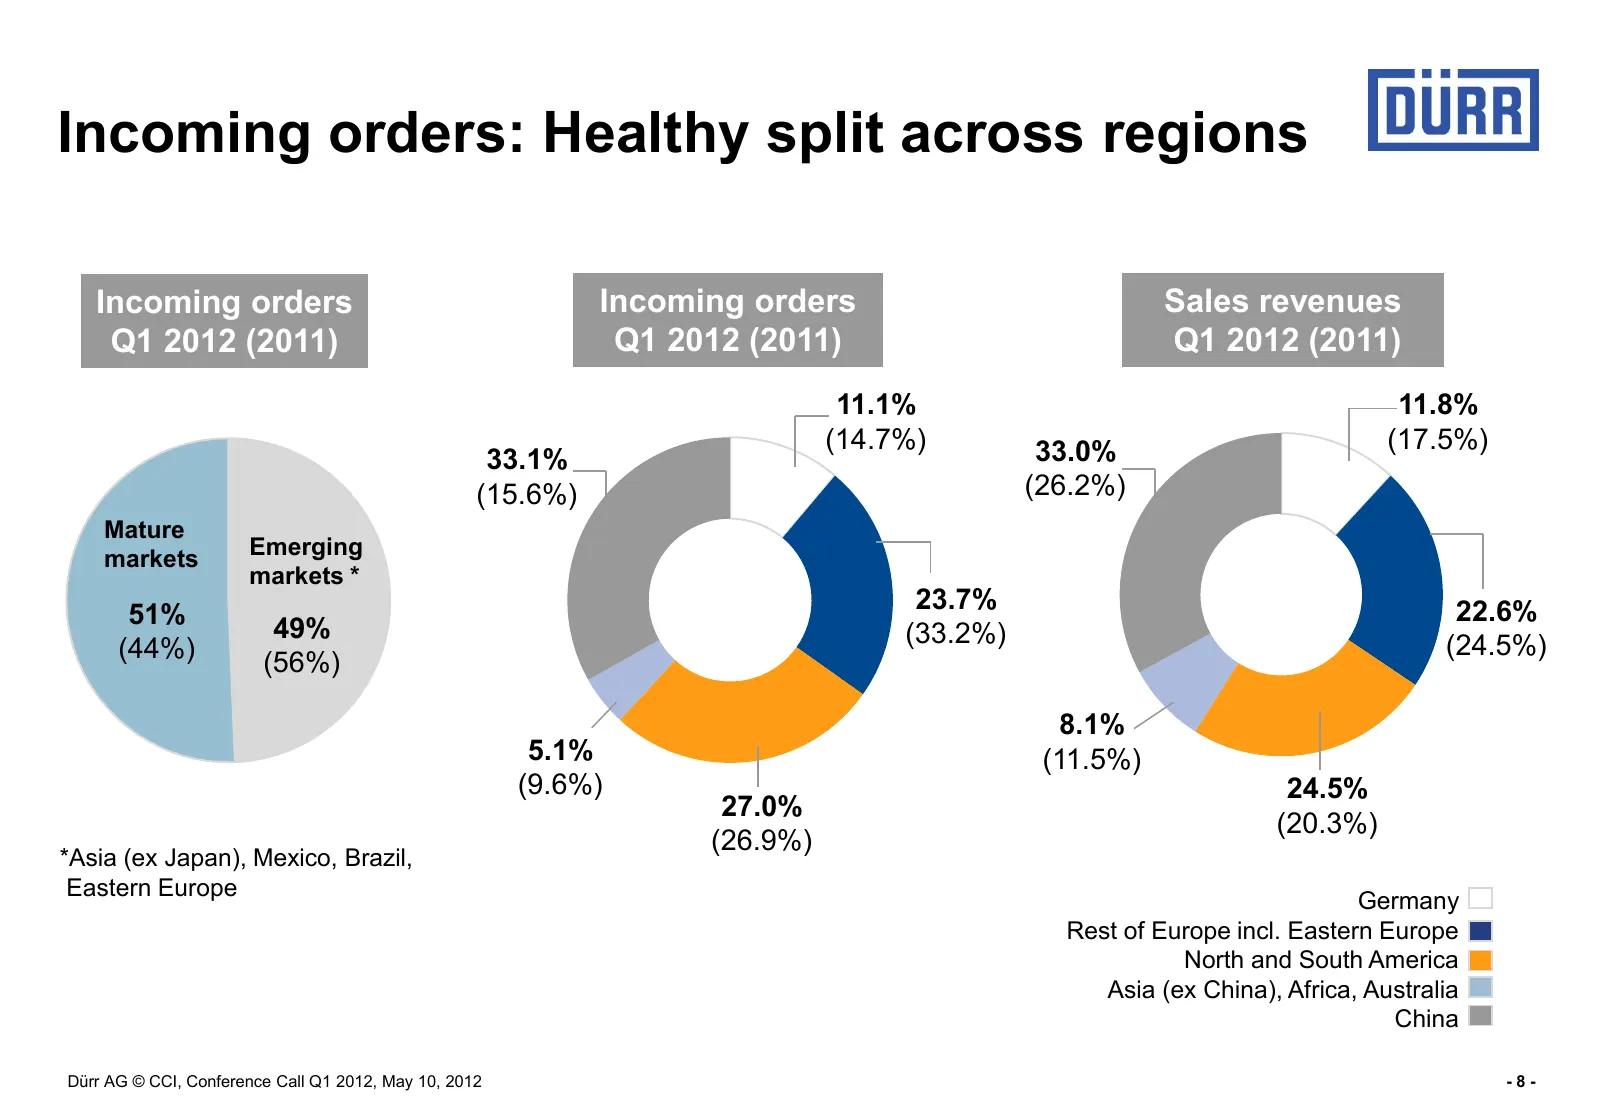
Incoming orders: Healthy split across regions Incoming orders Incoming orders Sales revenues Q1 2012 (2011) Q1 2012 (2011) Q1 2012 (2011) 11.1% 11.8% (14.7%) 33.0% (17.5%) 33.1% (15.6%) (26.2%) Mature Emerging markets markets * 23.7% 22.6% 51% 49% (33.2%) (24.5%) (44%) (56%) 8.1% 5.1% (11.5%) (9.6%)
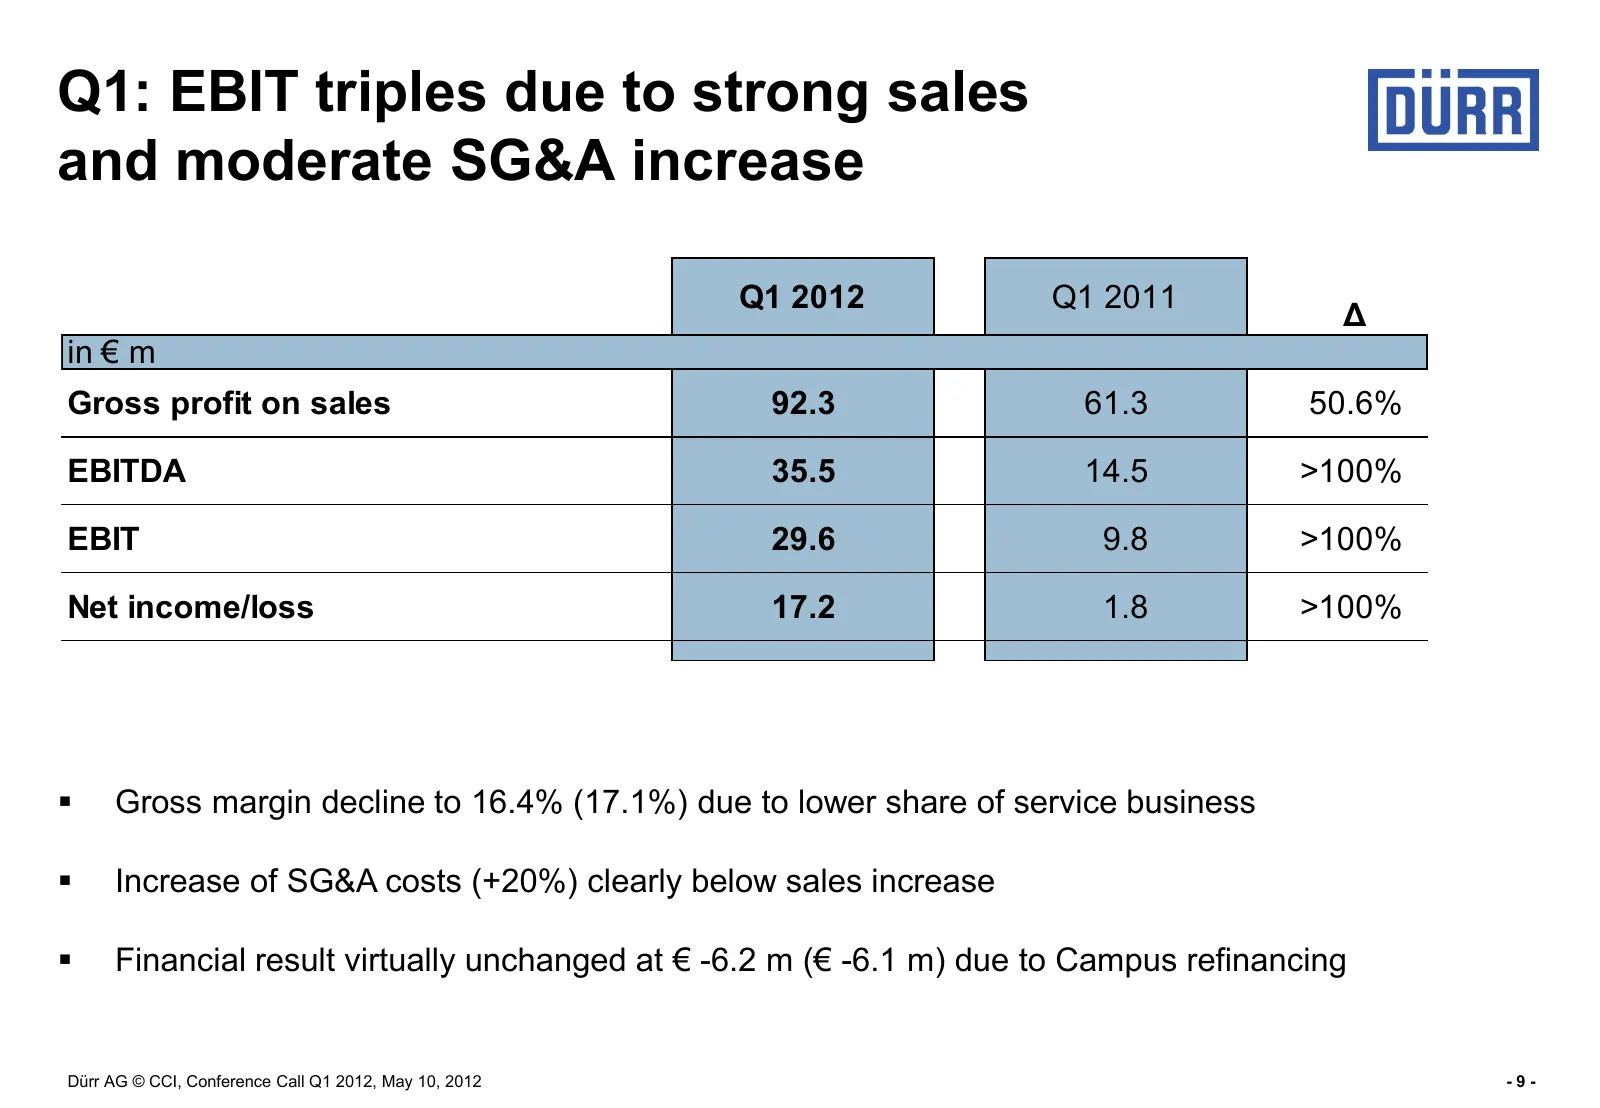
Slide 9: Q1: EBIT triples due to strong sales and moderate SG&A increase
Q1: EBIT triples due to strong sales and moderate SG&A increase Q1 2012 Q1 2011 Δ in € m Gross profit on sales 92.3 61.3 50.6% EBITDA 35.5 14.5 >100% EBIT 29.6 9.8 >100% Net income/loss 17.2 1.8 >100% Gross margin decline to 16.4% (17.1%) due to lower share of service business Increase of SG&A c
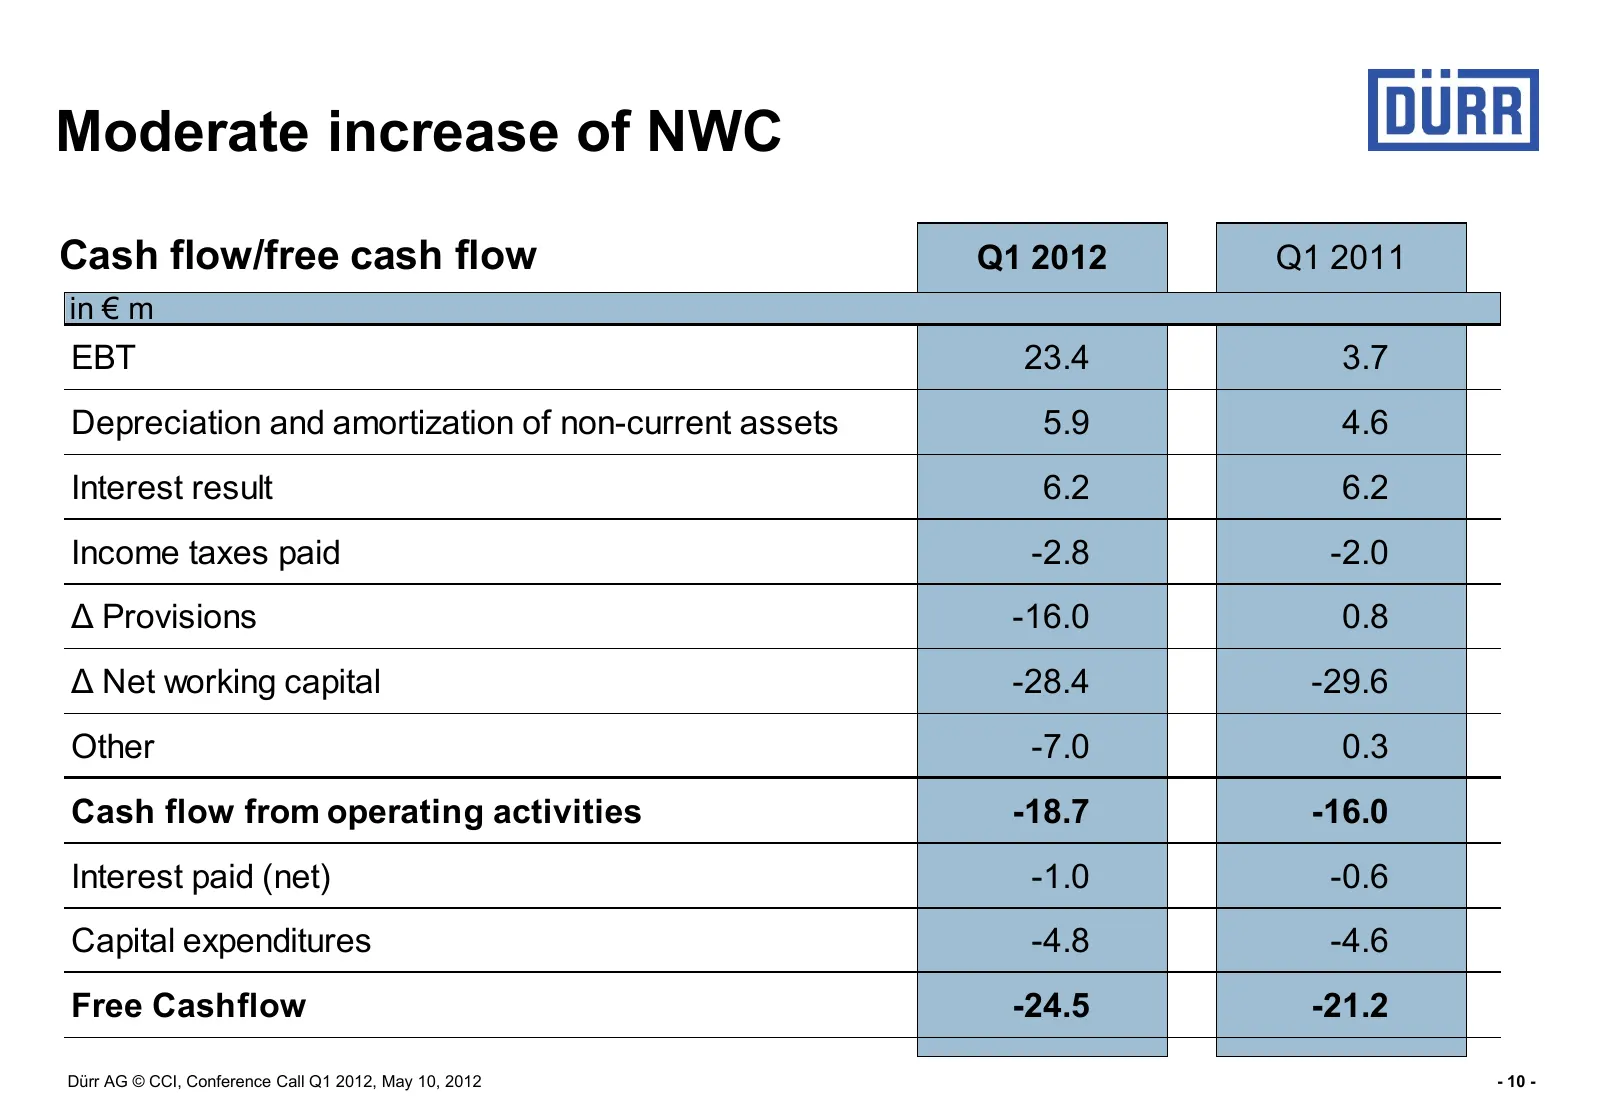
Slide 10: Moderate increase of NWC
Moderate increase of NWC Cash flow/free cash flow Q1 2012 Q1 2011 in € m EBT 23.4 3.7 Depreciation and amortization of non-current assets 5.9 4.6 Interest result 6.2 6.2 Income taxes paid -2.8 -2.0 Δ Provisions -16.0 0.8 Δ Net working capital -28.4 -29.6 Other -7.0 0.3 Cash flow from operating activ
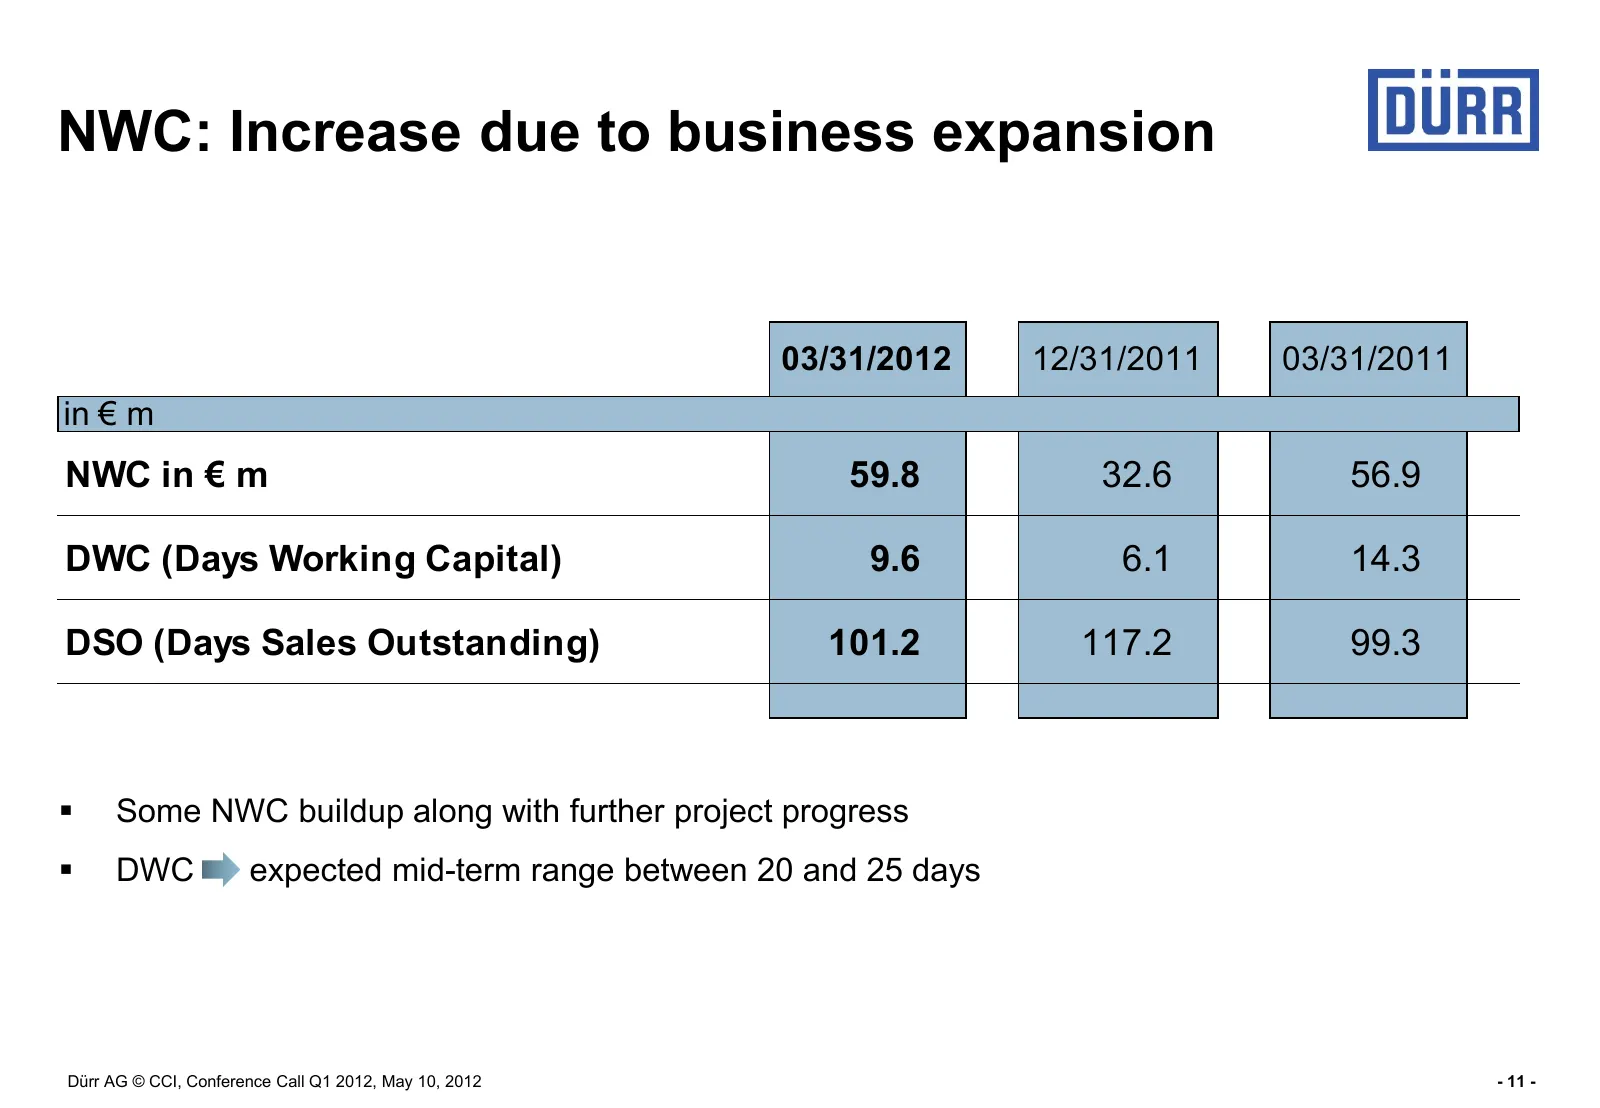
Slide 11: NWC: Increase due to business expansion
NWC: Increase due to business expansion 03/31/2012 12/31/2011 03/31/2011 in € m NWC in € m 59.8 32.6 56.9 DWC (Days Working Capital) 9.6 6.1 14.3 DSO (Days Sales Outstanding) 101.2 117.2 99.3 Some NWC buildup along with further project progress DWC expected mid-term range between 20 and 25 days
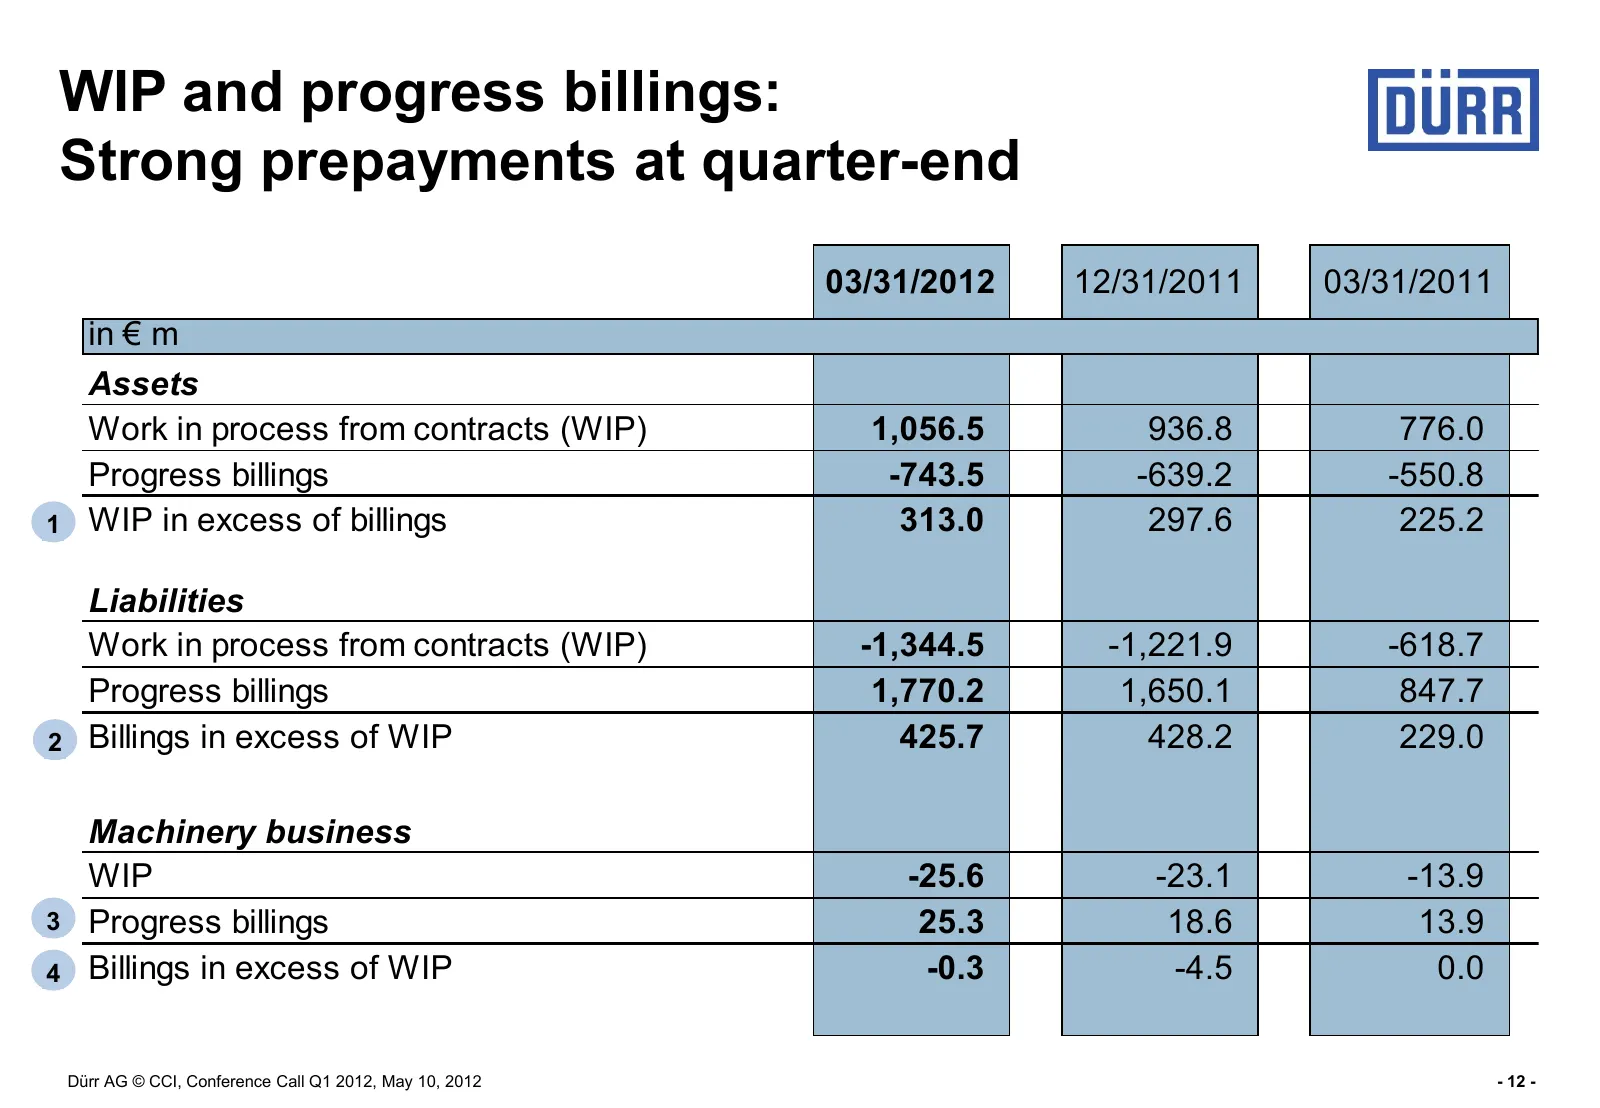
Slide 12: WIP and progress billings: Strong prepayments at quarter-end
WIP and progress billings: Strong prepayments at quarter-end 03/31/2012 12/31/2011 03/31/2011 in € m Assets Work in process from contracts (WIP) 1,056.5 936.8 776.0 Progress billings -743.5 -639.2 -550.8 1 WIP in excess of billings 313.0 297.6 225.2 Liabilities Work in process from contracts (WIP) -
Slide 13: WIP and progress billings
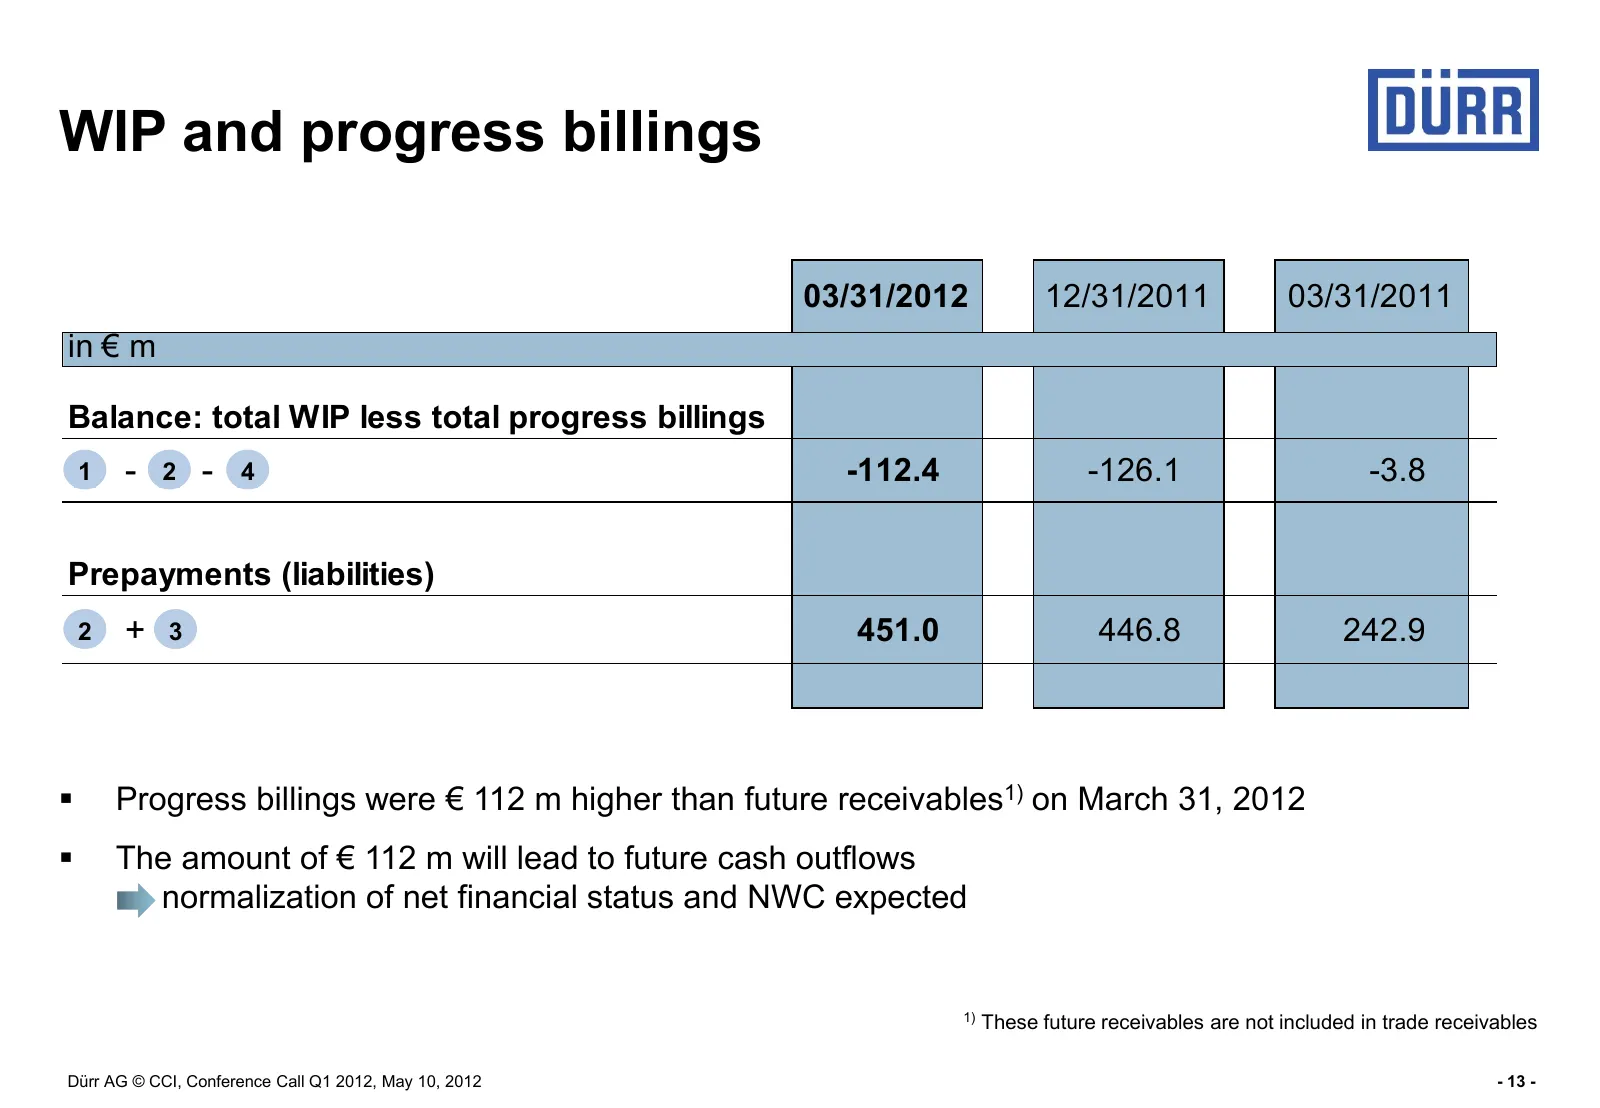
WIP and progress billings 03/31/2012 12/31/2011 03/31/2011 in € m Balance: total WIP less total progress billings 1 - 2 - 4 -112.4 -126.1 -3.8 Prepayments (liabilities) 2 + 3 451.0 446.8 242.9 Progress billings were € 112 m higher than future receivables1) on March 31, 2012 The amount of € 112 m
Slide 14: Financial ratios further improving
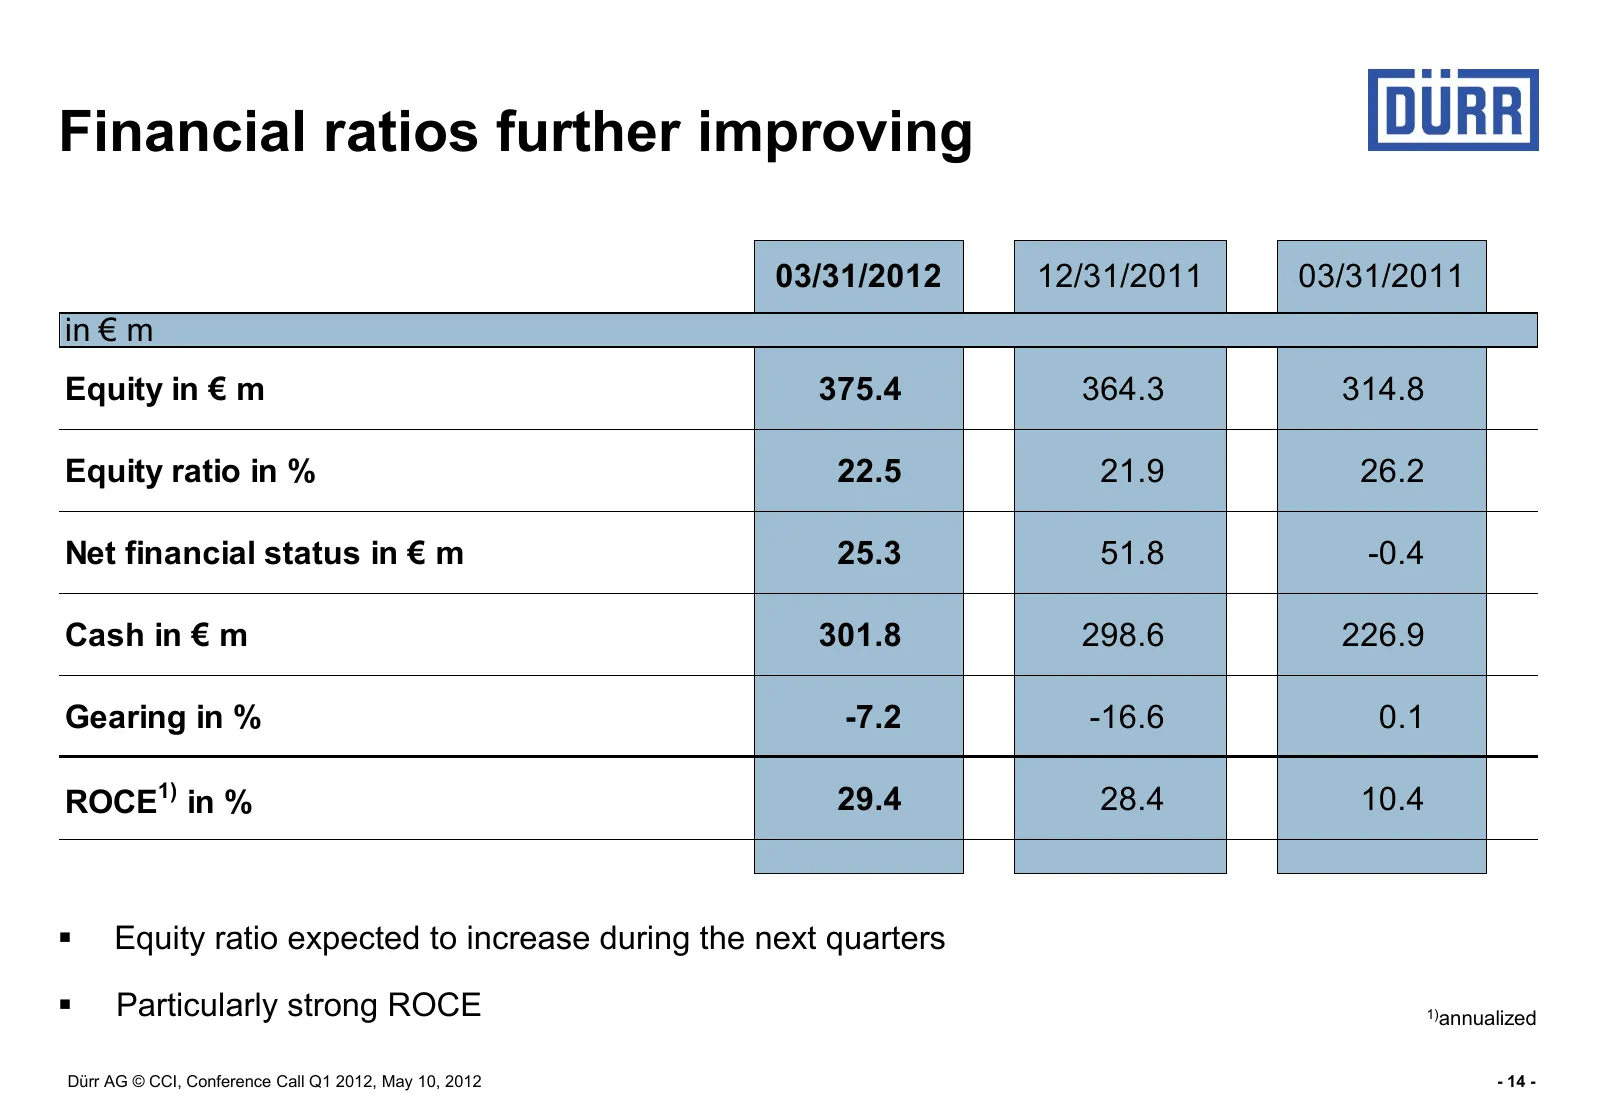
Financial ratios further improving 03/31/2012 12/31/2011 03/31/2011 in € m Equity in € m 375.4 364.3 314.8 Equity ratio in % 22.5 21.9 26.2 Net financial status in € m 25.3 51.8 -0.4 Cash in € m 301.8 298.6 226.9 Gearing in % -7.2 -16.6 0.1 ROCE1) in % 29.4 28.4 10.4 Equity ratio expected to incre
Slide 15: Paint and Assembly Systems: Continued strong order growth in Q1
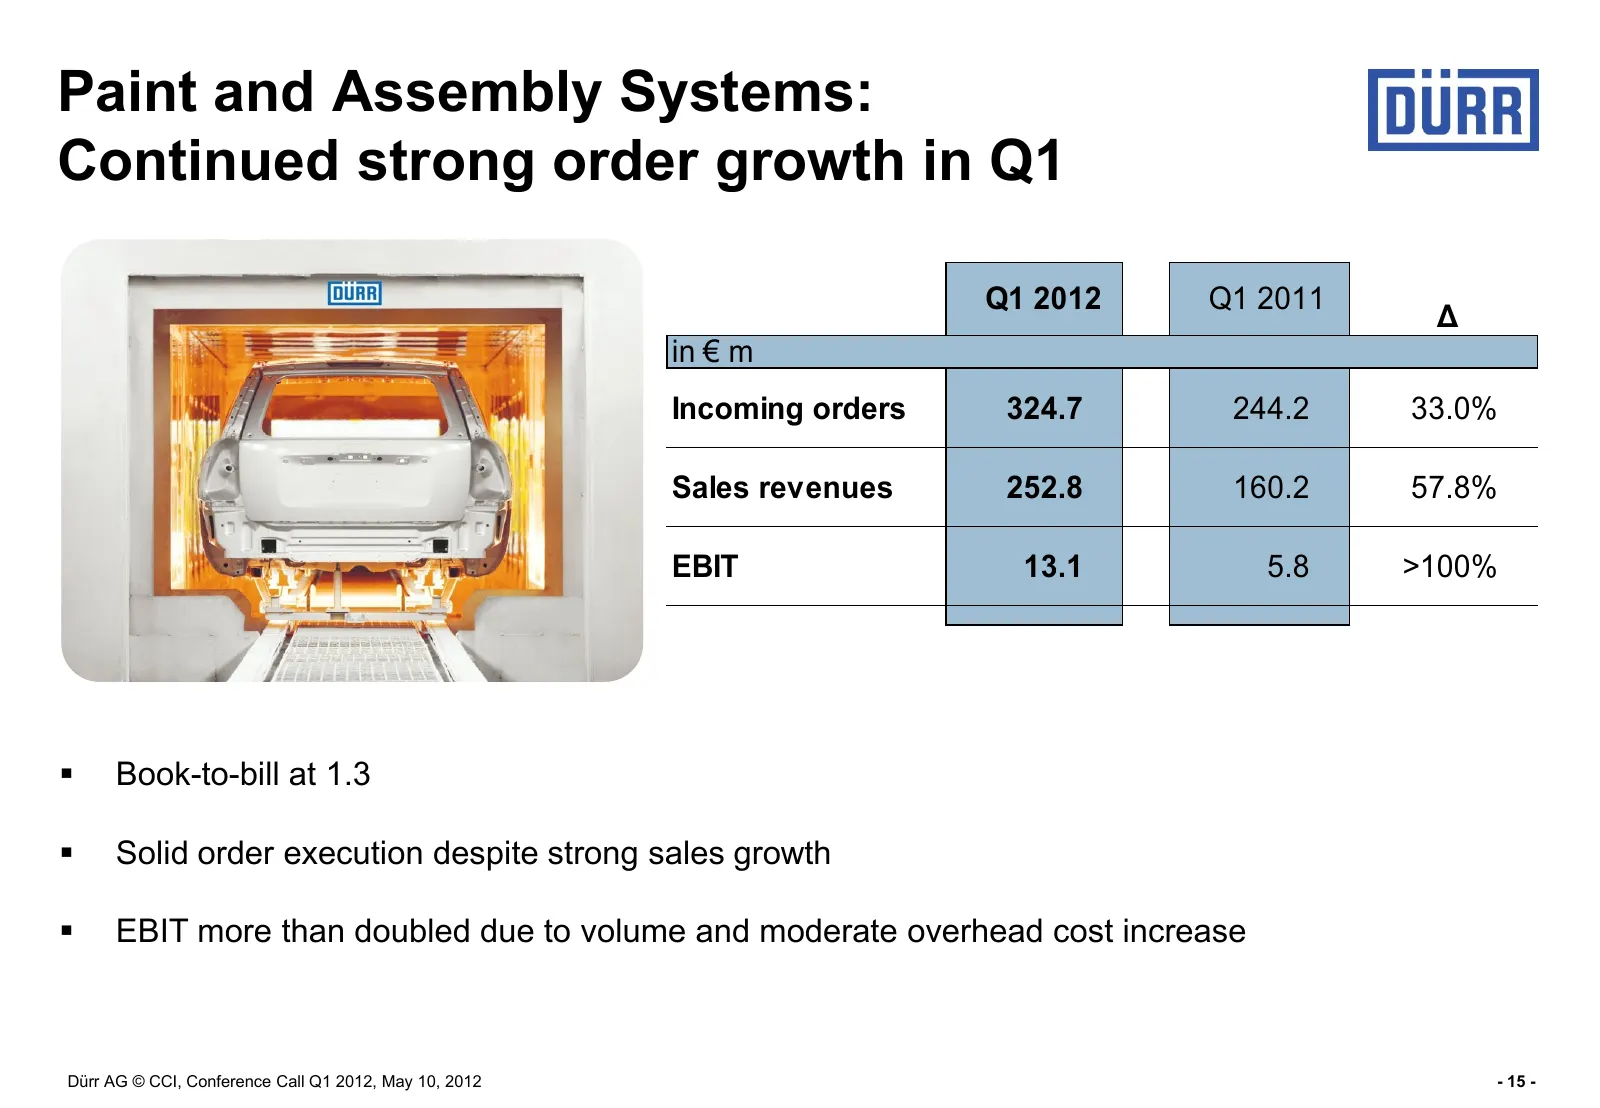
Paint and Assembly Systems: Continued strong order growth in Q1 Q1 2012 Q1 2011 Δ in € m Incoming orders 324.7 244.2 33.0% Sales revenues 252.8 160.2 57.8% EBIT 13.1 5.8 >100% Book-to-bill at 1.3 Solid order execution despite strong sales growth EBIT more than doubled due to volume and moderat
Slide 16: Application Technology: Jump in earnings in Q1
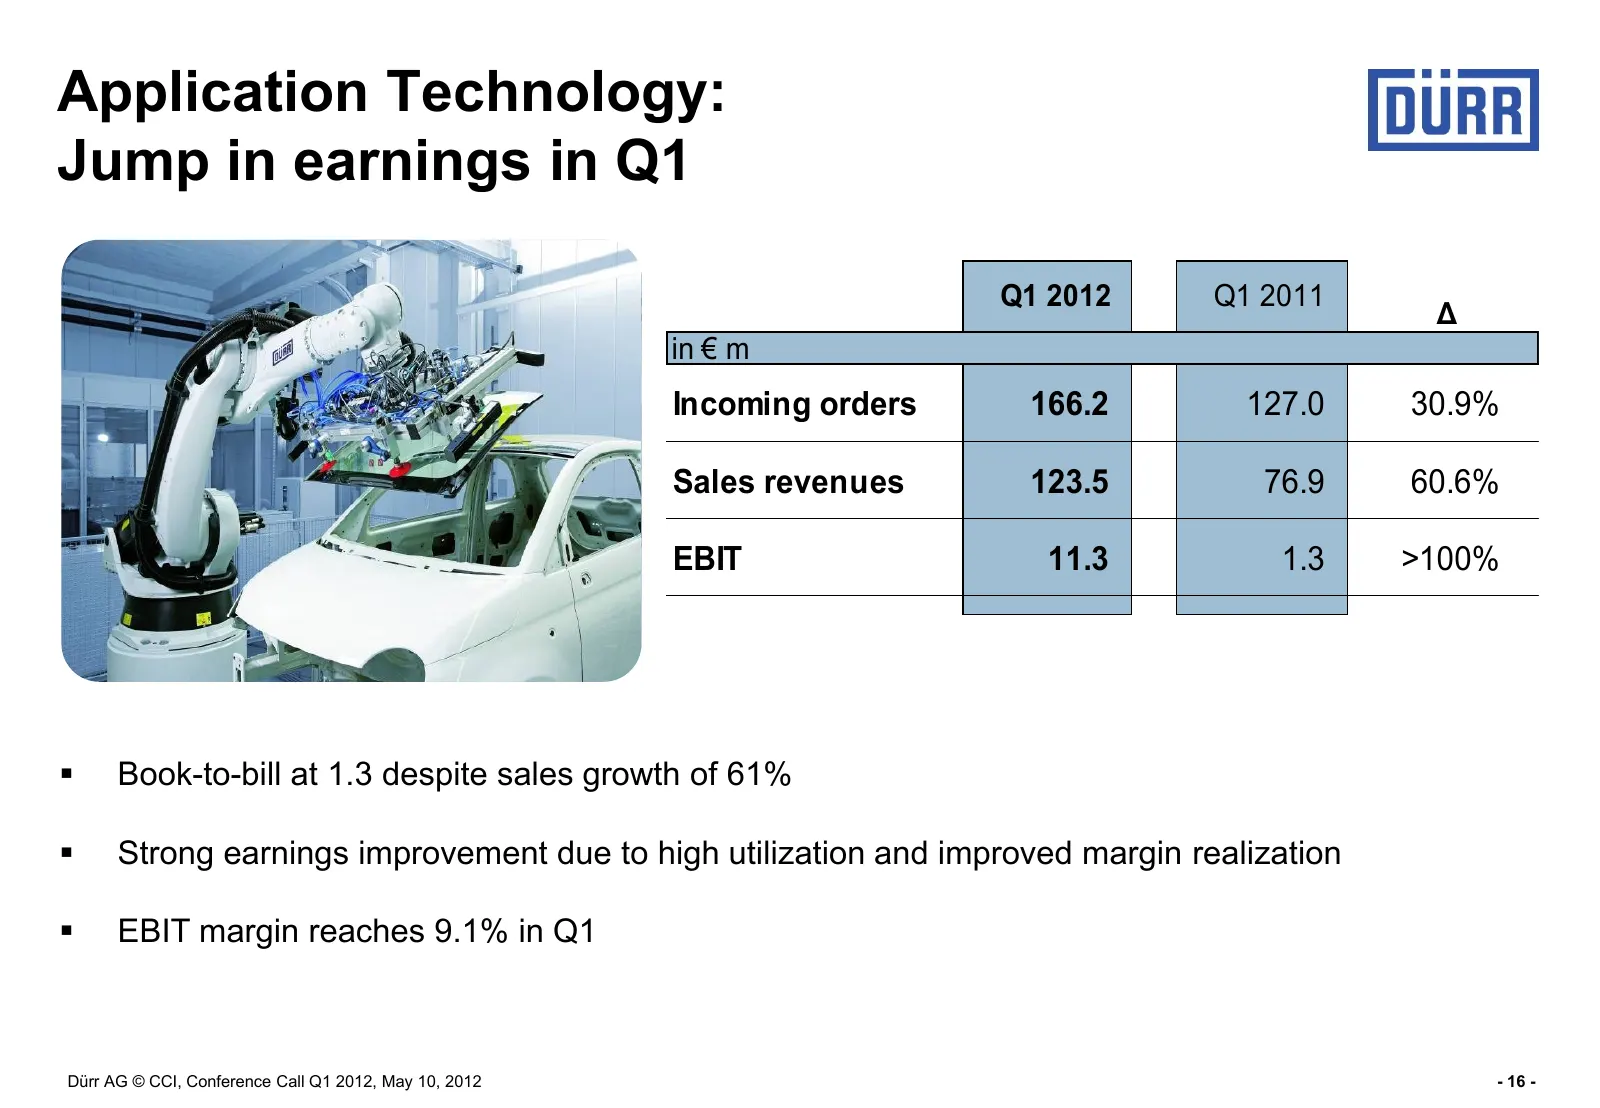
Application Technology: Jump in earnings in Q1 Q1 2012 Q1 2011 Δ in € m Incoming orders 166.2 127.0 30.9% Sales revenues 123.5 76.9 60.6% EBIT 11.3 1.3 >100% Book-to-bill at 1.3 despite sales growth of 61% Strong earnings improvement due to high utilization and improved margin realization EBIT
Slide 17: Measuring and Process Systems: Strong revenue and earnings growth
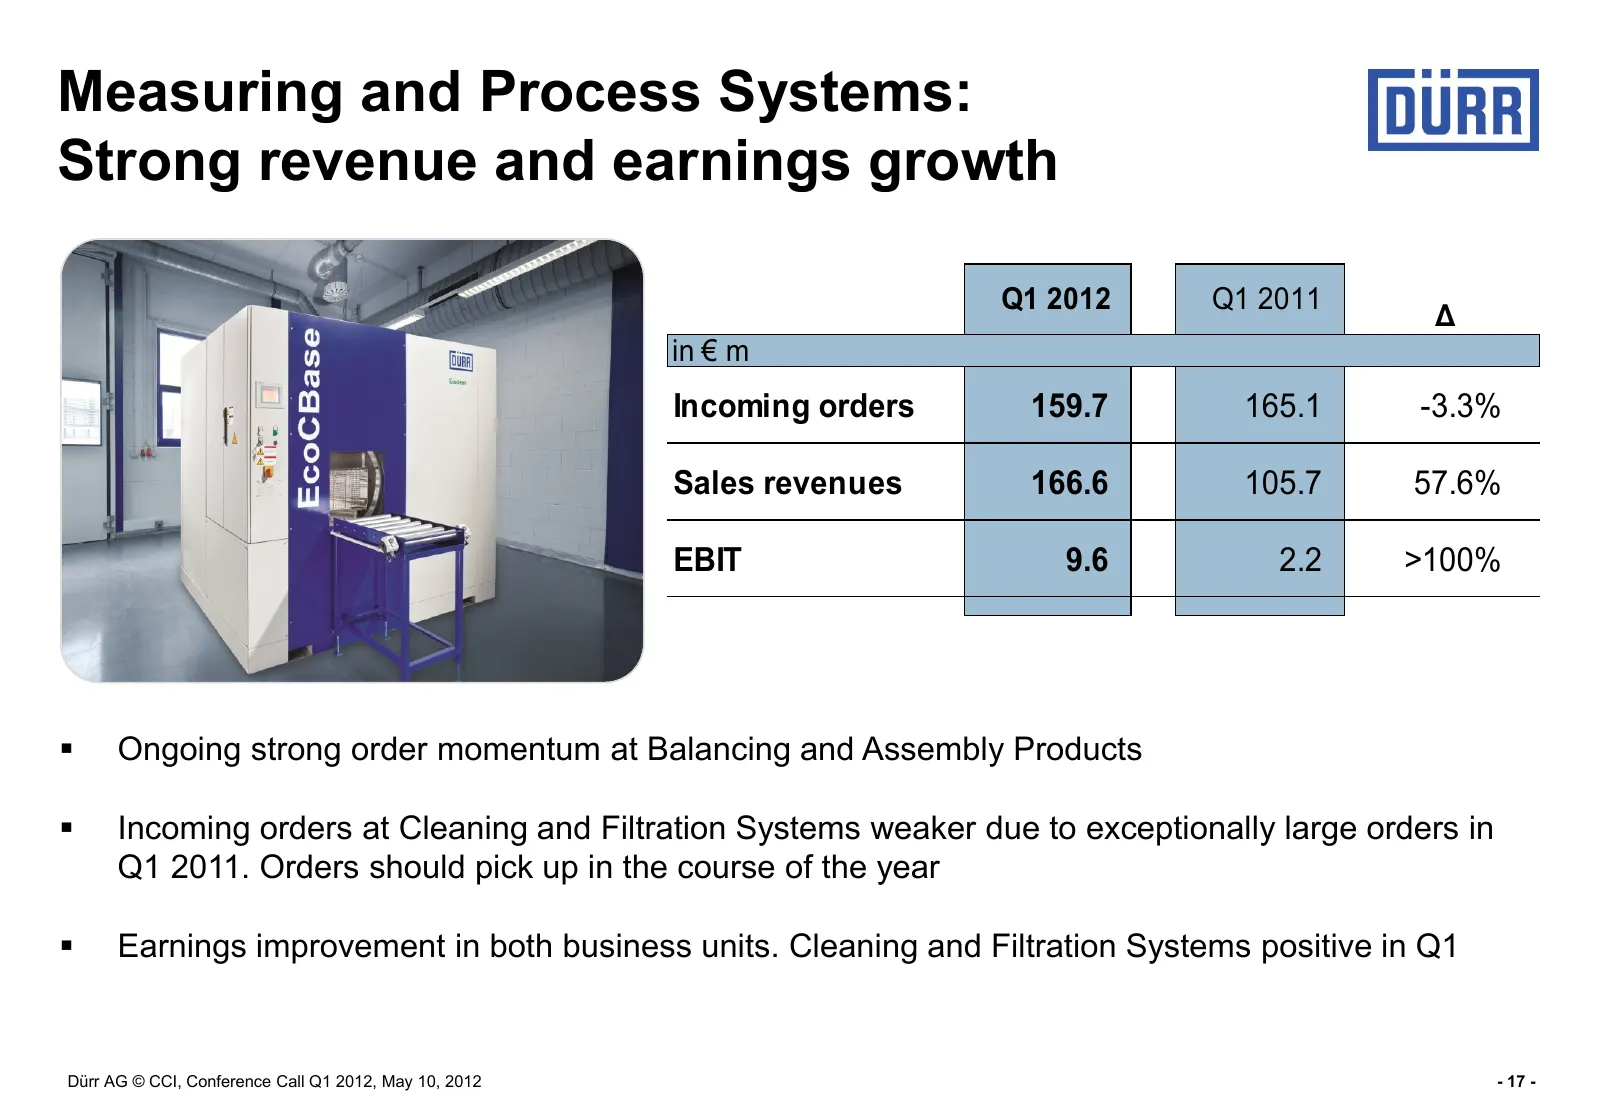
Measuring and Process Systems: Strong revenue and earnings growth Q1 2012 Q1 2011 Δ in € m Incoming orders 159.7 165.1 -3.3% Sales revenues 166.6 105.7 57.6% EBIT 9.6 2.2 >100% Ongoing strong order momentum at Balancing and Assembly Products Incoming orders at Cleaning and Filtration Systems wea
Slide 18: Clean Technology Systems: Steady growth, investments in Q1
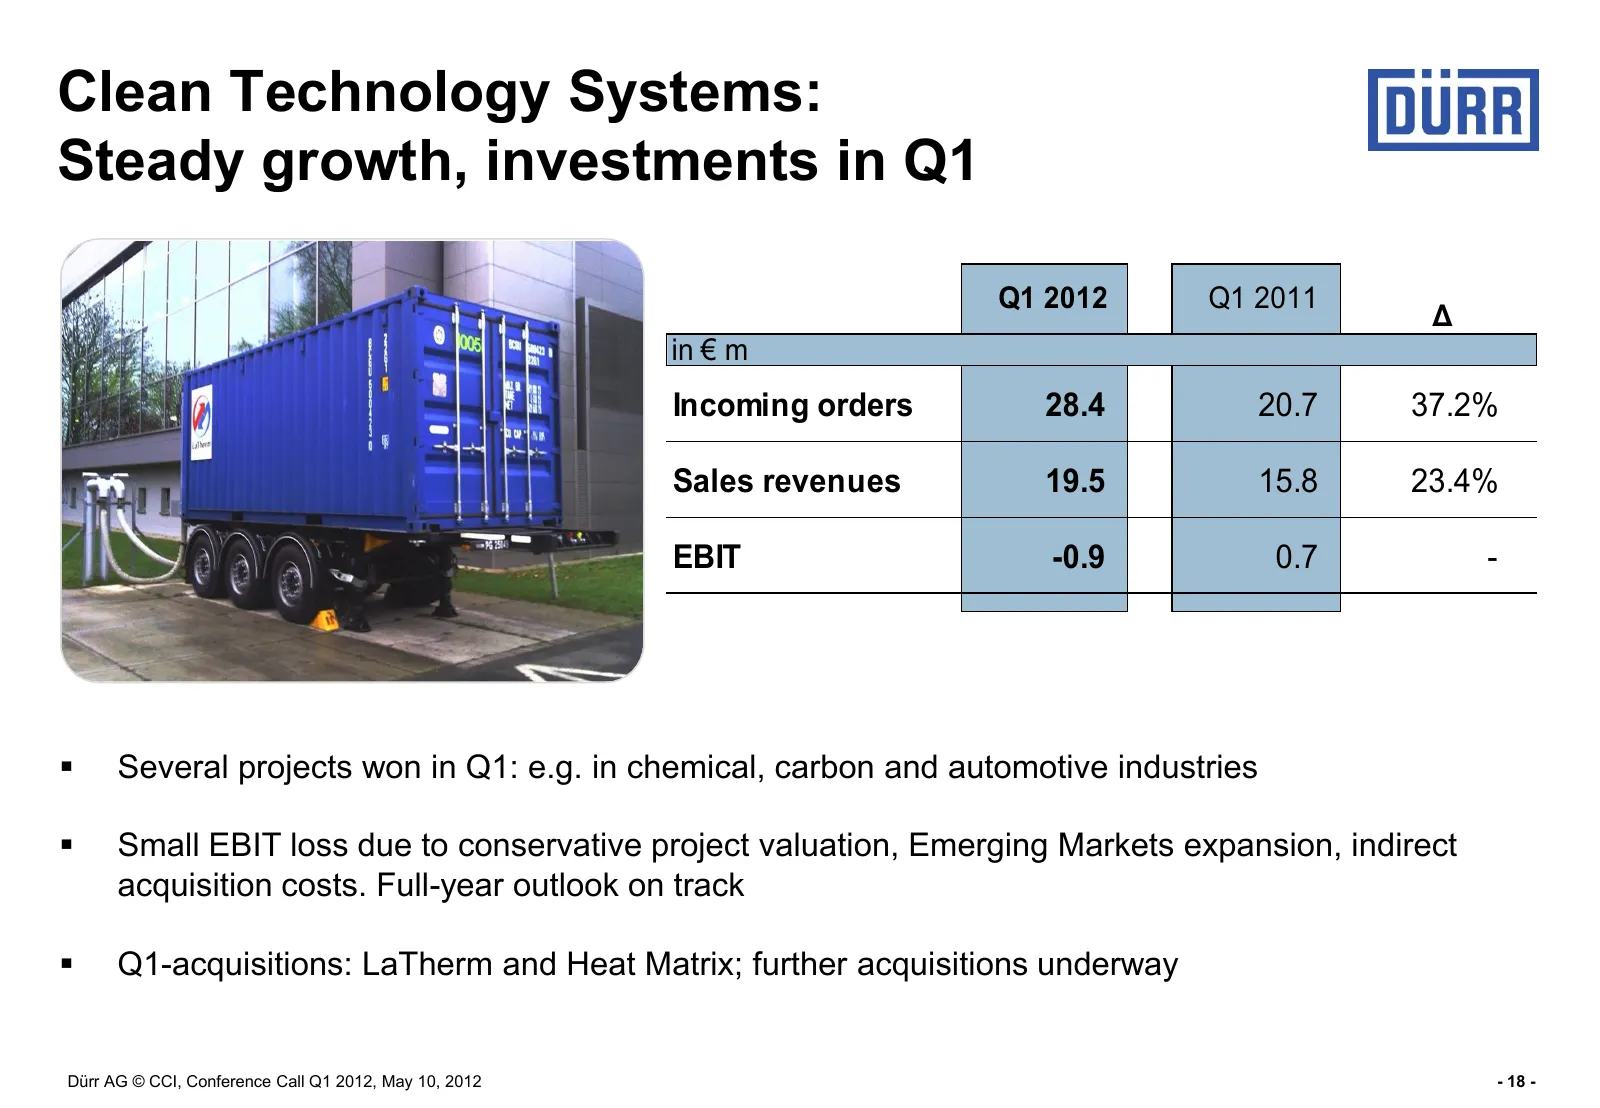
Clean Technology Systems: Steady growth, investments in Q1 Q1 2012 Q1 2011 Δ in € m Incoming orders 28.4 20.7 37.2% Sales revenues 19.5 15.8 23.4% EBIT -0.9 0.7 - Several projects won in Q1: e.g. in chemical, carbon and automotive industries Small EBIT loss due to conservative project valuation,
Slide 19: Market: Change of passenger car sales Q1 2012/Q1 2011
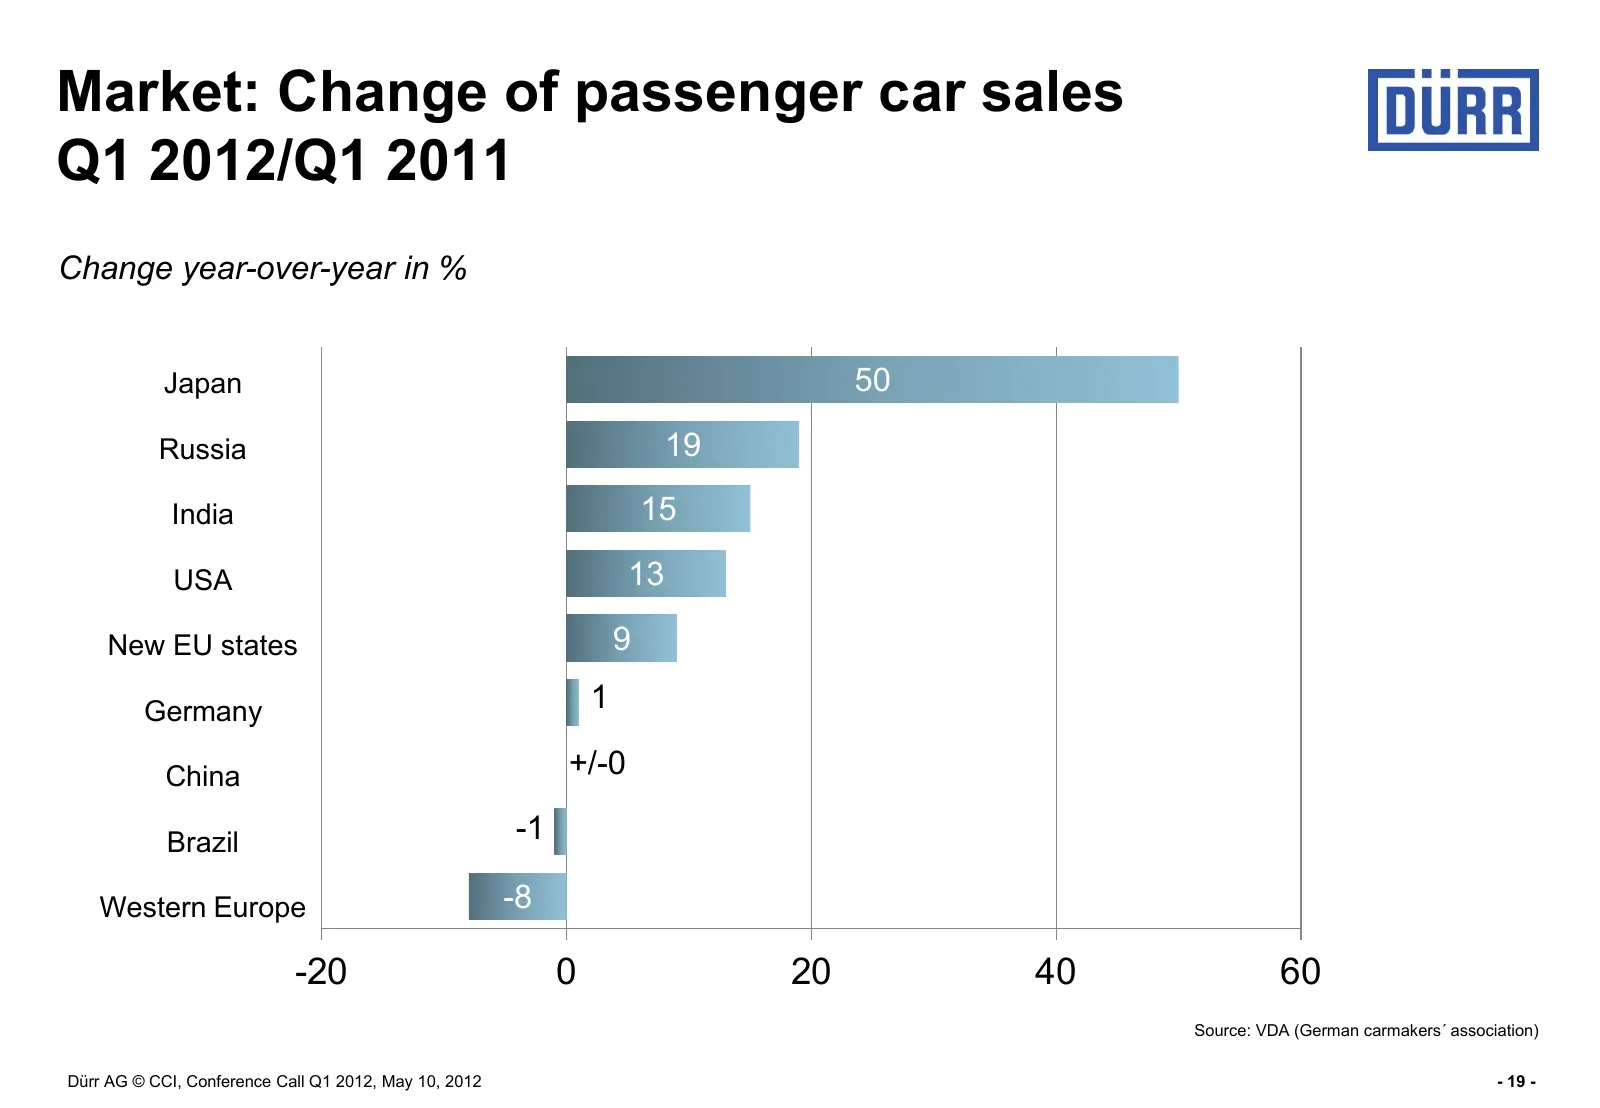
Market: Change of passenger car sales Q1 2012/Q1 2011 Change year-over-year in % Japan 50 Russia 19 India 15 USA 13 New EU states 9 Germany 1 China +/-0 Brazil -1 Western Europe -8 -20 0 20 40 60 Source: VDA (German carmakers´ association) Dürr AG © CCI, Conference Call Q1 2012, May 10, 2012 - 19 -
Slide 20: Continued strong EM growth expected
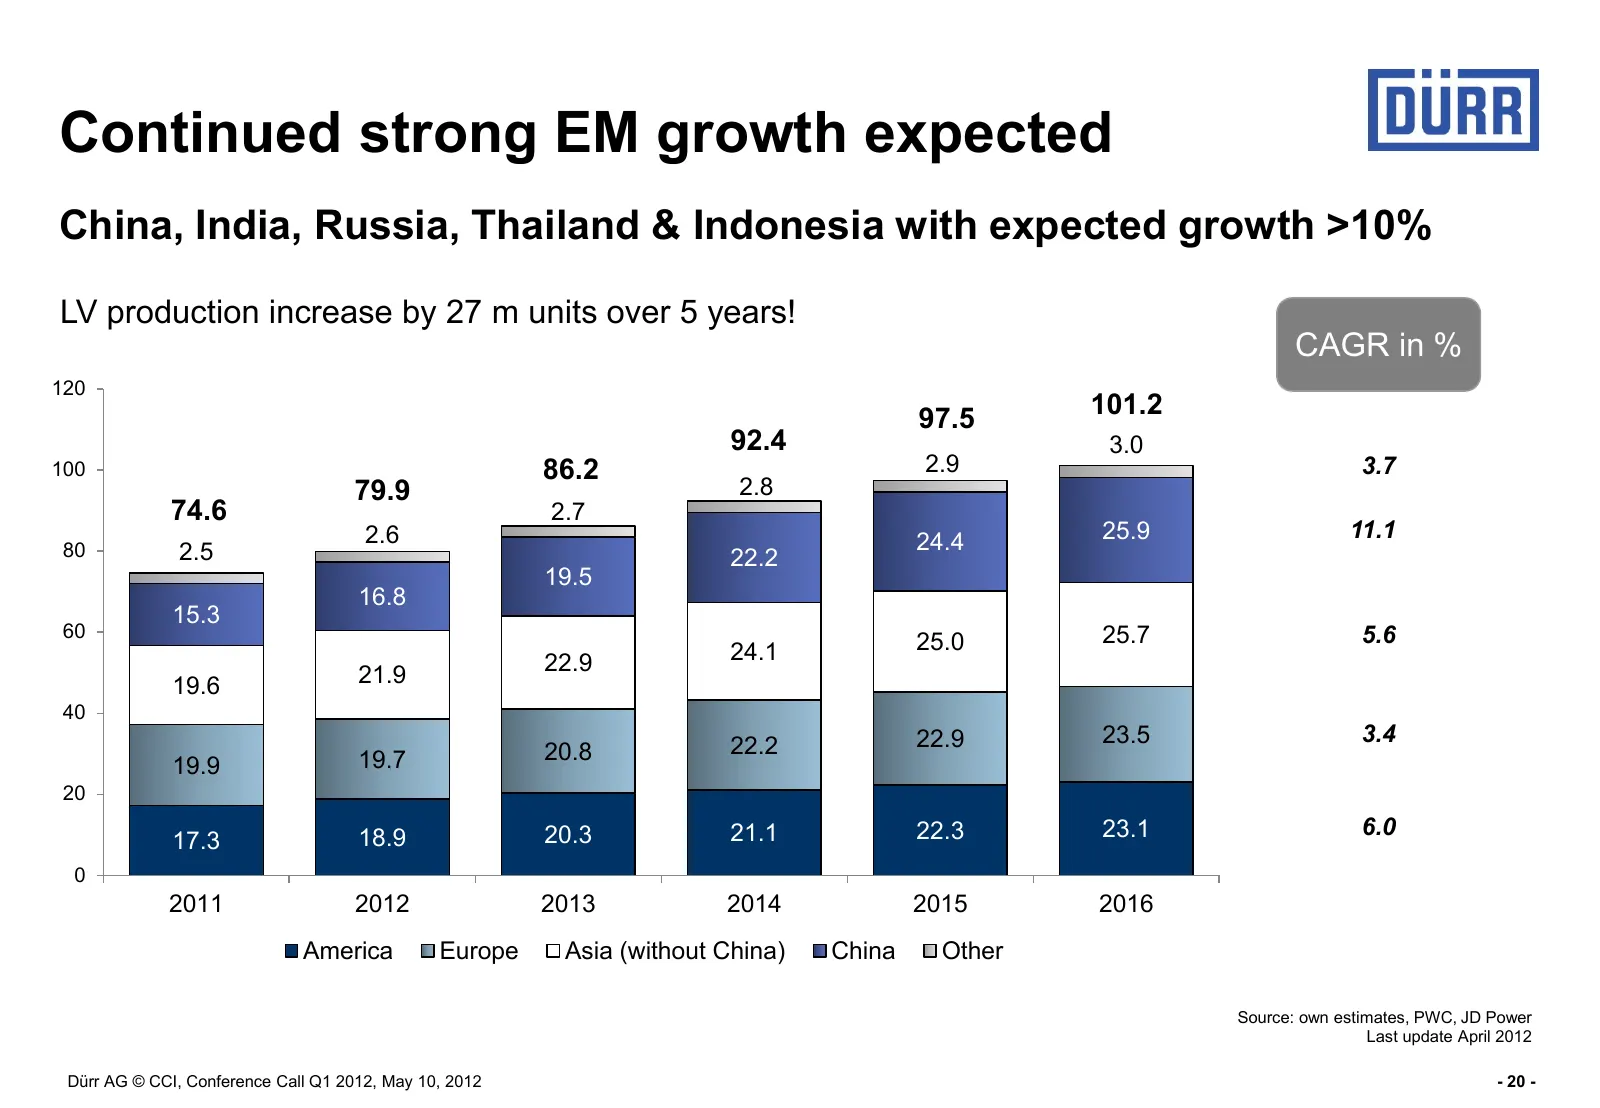
Continued strong EM growth expected China, India, Russia, Thailand & Indonesia with expected growth >10% LV production increase by 27 m units over 5 years! CAGR in % 120 97.5 101.2 92.4 3.0 100 86.2 2.9 3.7 79.9 2.8 74.6 2.7 2.6 24.4 25.9 11.1 80 2.5 22.2 19.5 16.8 15.3 60 25.7 5.6 24.1 25.0 21.9 22
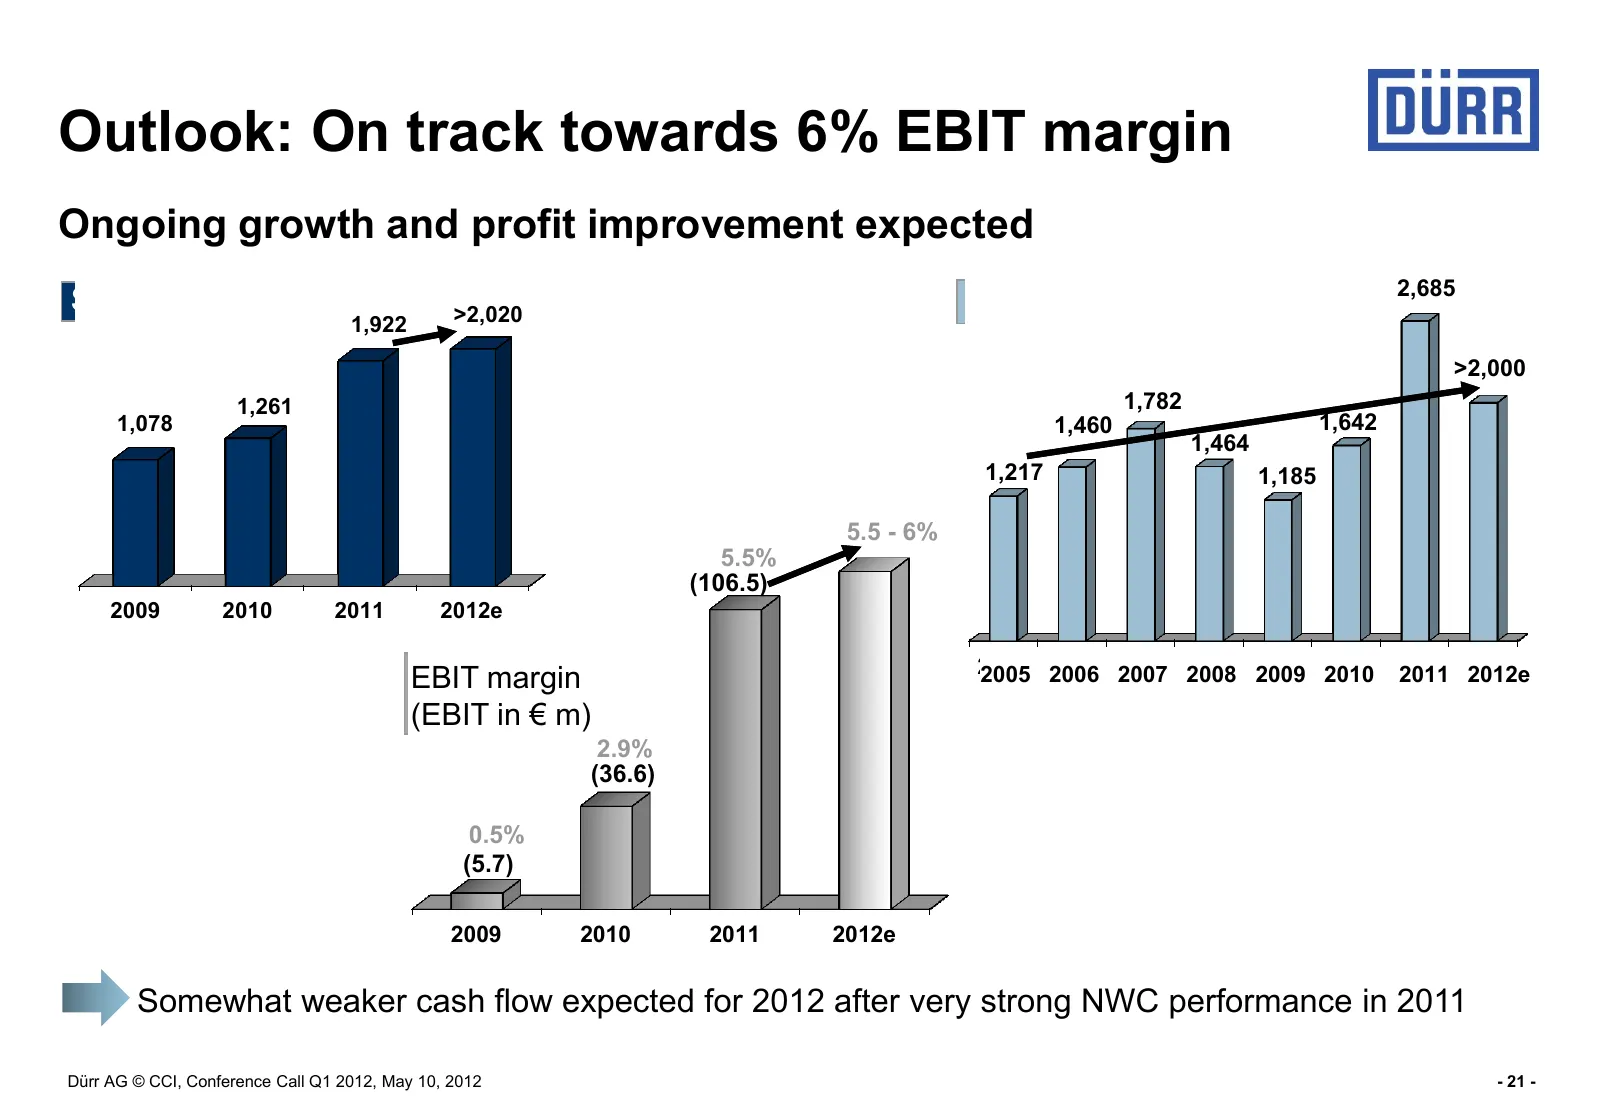
Slide 21: Outlook: On track towards 6% EBIT margin
Outlook: On track towards 6% EBIT margin Ongoing growth and profit improvement expected >+5% 2,685 Sales in € m >2,020 Incoming orders in € m 1,922 >2,000 1,261 1,782 1,078 1,460 1,642 1,464 1,217 1,185 5.5 - 6% 5.5% (106.5) 2009 2010 2011 2012e 2005 2005 2006 2007 2007 2008 2009 2009 2010 2011 EBIT
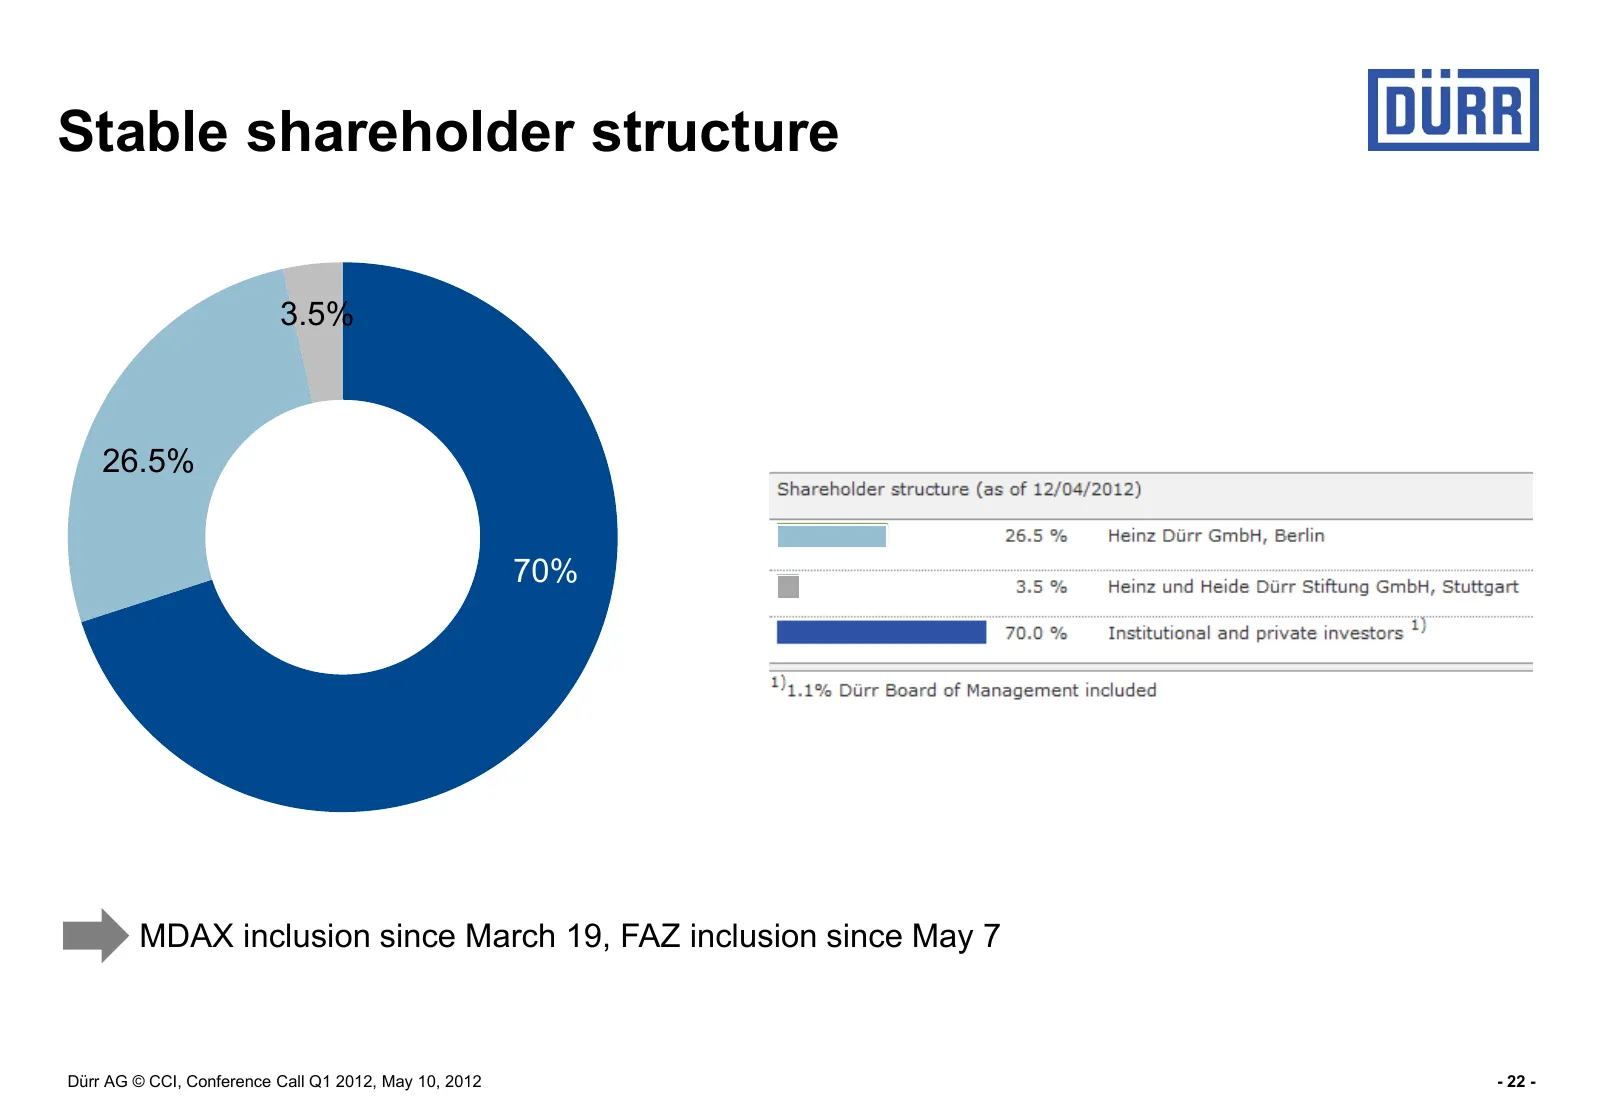
Slide 22: Stable shareholder structure
Stable shareholder structure 3.5% 26.5% 70% MDAX inclusion since March 19, FAZ inclusion since May 7 Dürr AG © CCI, Conference Call Q1 2012, May 10, 2012 - 22 -
Slide 23: Summary
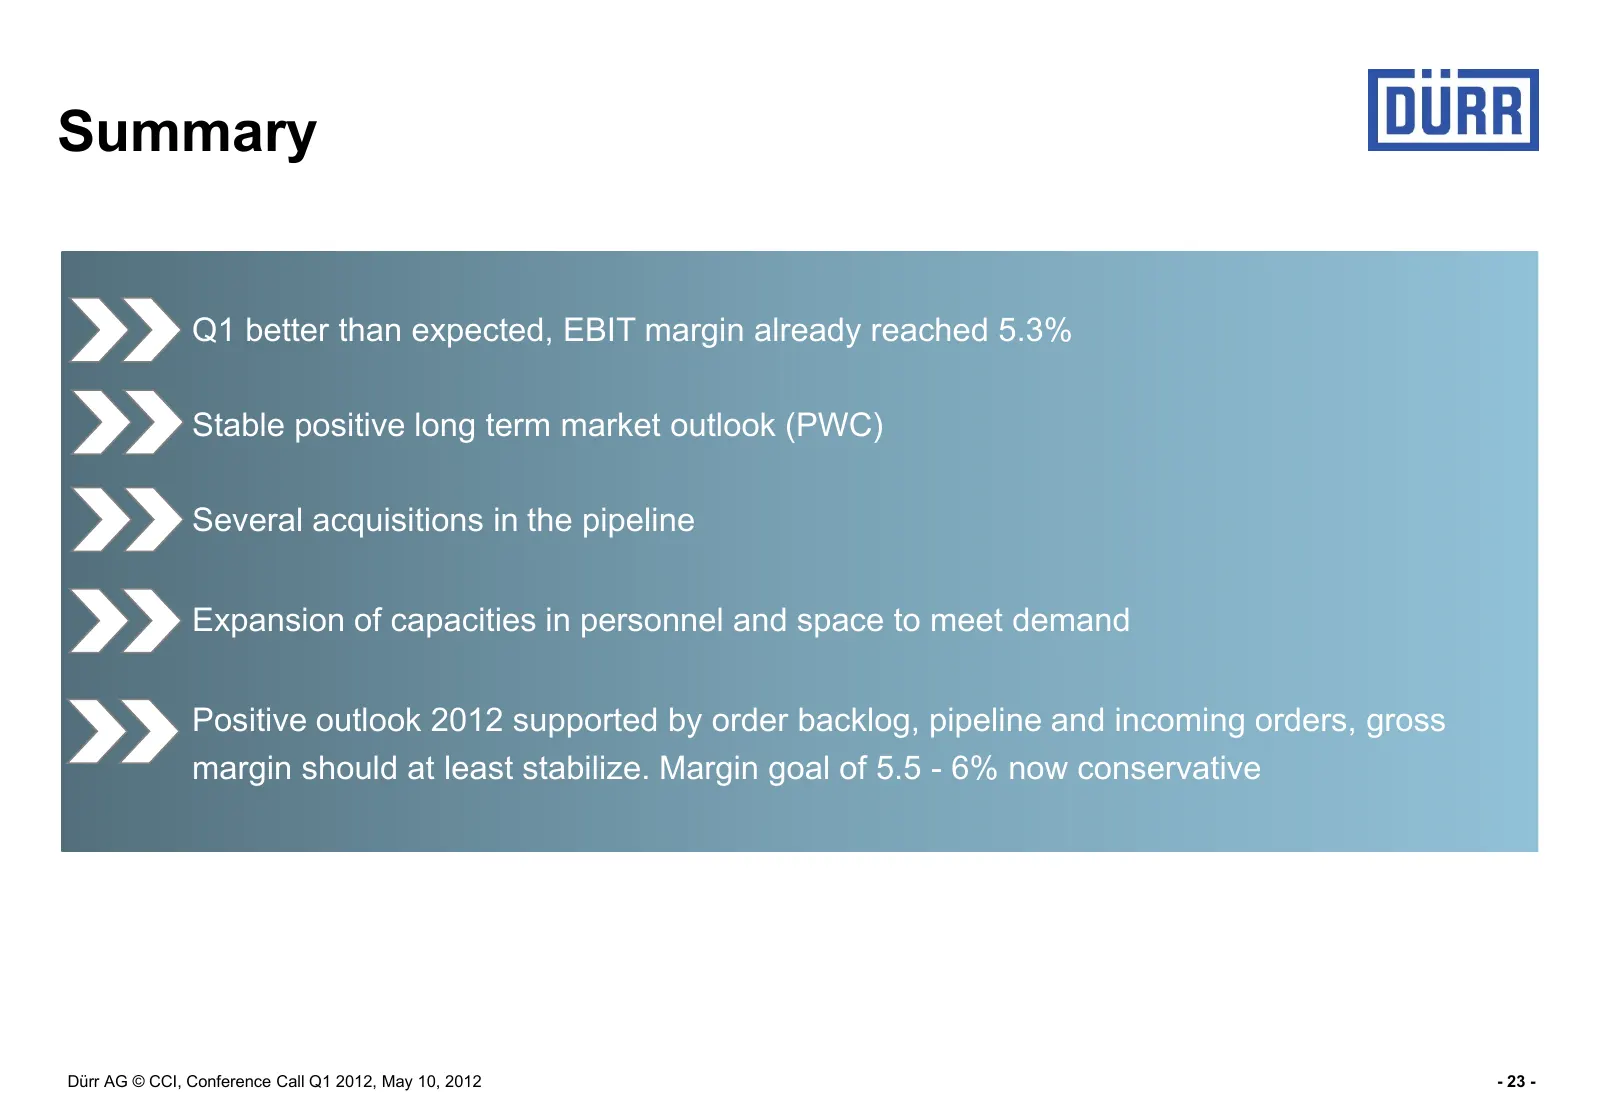
Summary Q1 better than expected, EBIT margin already reached 5.3% Stable positive long term market outlook (PWC) Several acquisitions in the pipeline Expansion of capacities in personnel and space to meet demand Positive outlook 2012 supported by order backlog, pipeline and incoming orders, gross ma
Slide 24: Financial calendar
Financial calendar 08/01/2012 Interim financial report for the first half of 2012 11/06/2012 Interim report for the first nine months of 2012 Contact: Dürr Aktiengesellschaft Günter Dielmann Corporate Communications & Investor Relations Carl-Benz-Str. 34 74321 Bietigheim-Bissingen Germany Phone: +49
Slide 25: Conference Call
Conference Call Results January - March 2012 Dürr Group Ralf W. Dieter, CEO | Ralph Heuwing, CFO Bietigheim-Bissingen, May, 10 2012 Dürr AG © CCI, Conference Call Q1 2012, May 10, 2012 - 25 -
Source: Internet Archive copy of durr.com
More decks from Durr AG
 Q3 2026 Earnings Presentation33 slides · Nov 12, 2026
 Q2 2026 Earnings Presentation39 slides · Aug 6, 2026
 Q1 2026 Earnings Presentation35 slides · May 12, 2026
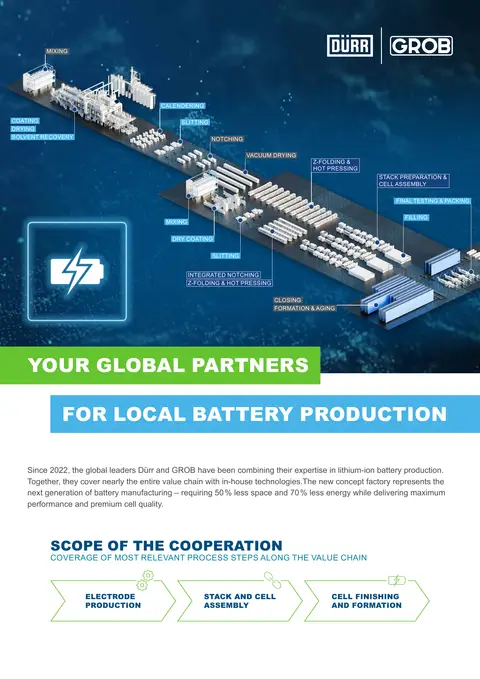 Fact Sheet (2025)2 slides · Dec 2, 2025
 Q3 2025 Earnings Presentation46 slides · Nov 13, 2025
 Q2 2025 Earnings Presentation31 slides · Jul 24, 2025