MA Financial Group Limited · ASX:MAF
MA Financial — Investor Day (June 2022)
70 slides from MA Financial's investor day presentation, Jun 9, 2022
Slide 1: MA Financial Group Investor Day Presentation and Operational Update
Level 27, Brookfield Place 10 Carrington Street Sydney NSW 2000 ASX ANNOUNCEMENT 9 June 2022 MA Financial Group Investor Day Presentation and Operational Update MA Financial Group Limited (“MA Financial” or “the Group”; ASX:MAF) is today hosting an investor day meeting in Sydney to provide a strateg
Slide 2: Guidance
guidance. This change considers the increased impact of unrealised valuation gains as the business has grown, highlighted by the material valuation gains in Group’s hospitality assets in FY21 and those anticipated again in FY22. The Group will continue to report unrealised mark to market movements s
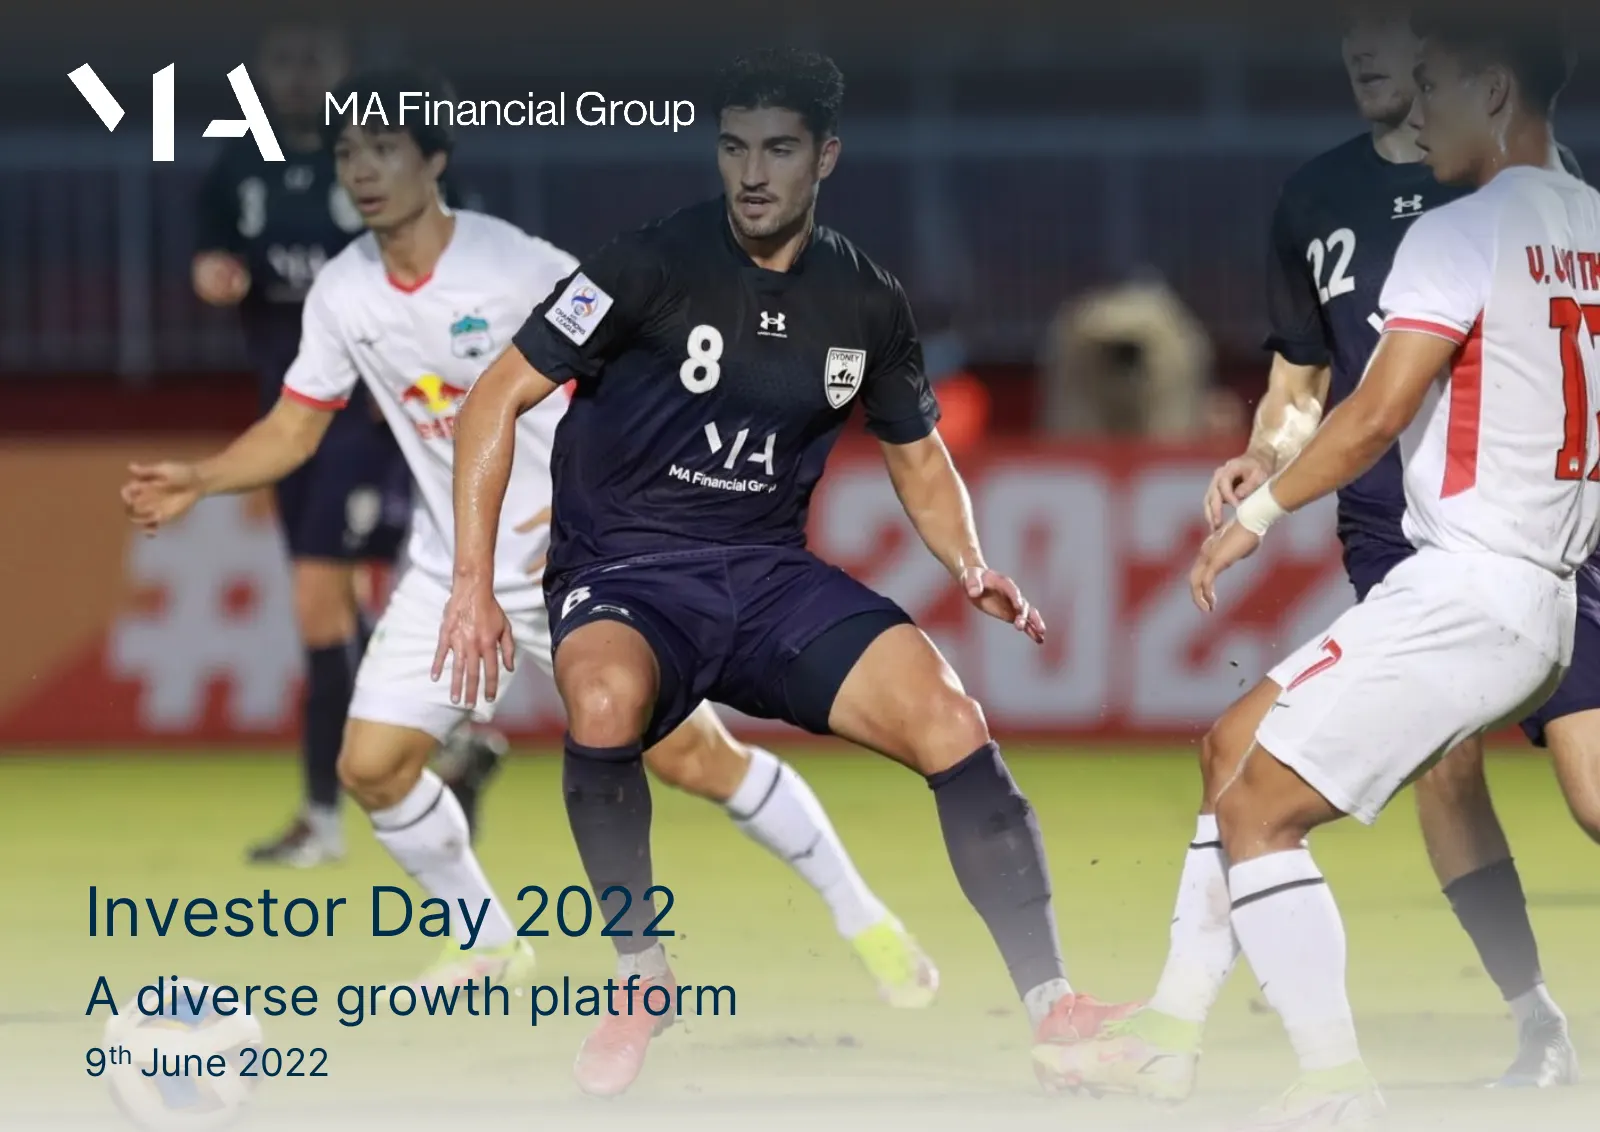
Slide 3: Investor Day 2022: A diverse growth platform
Investor Day 2022 A diverse growth platform 9th June 2022
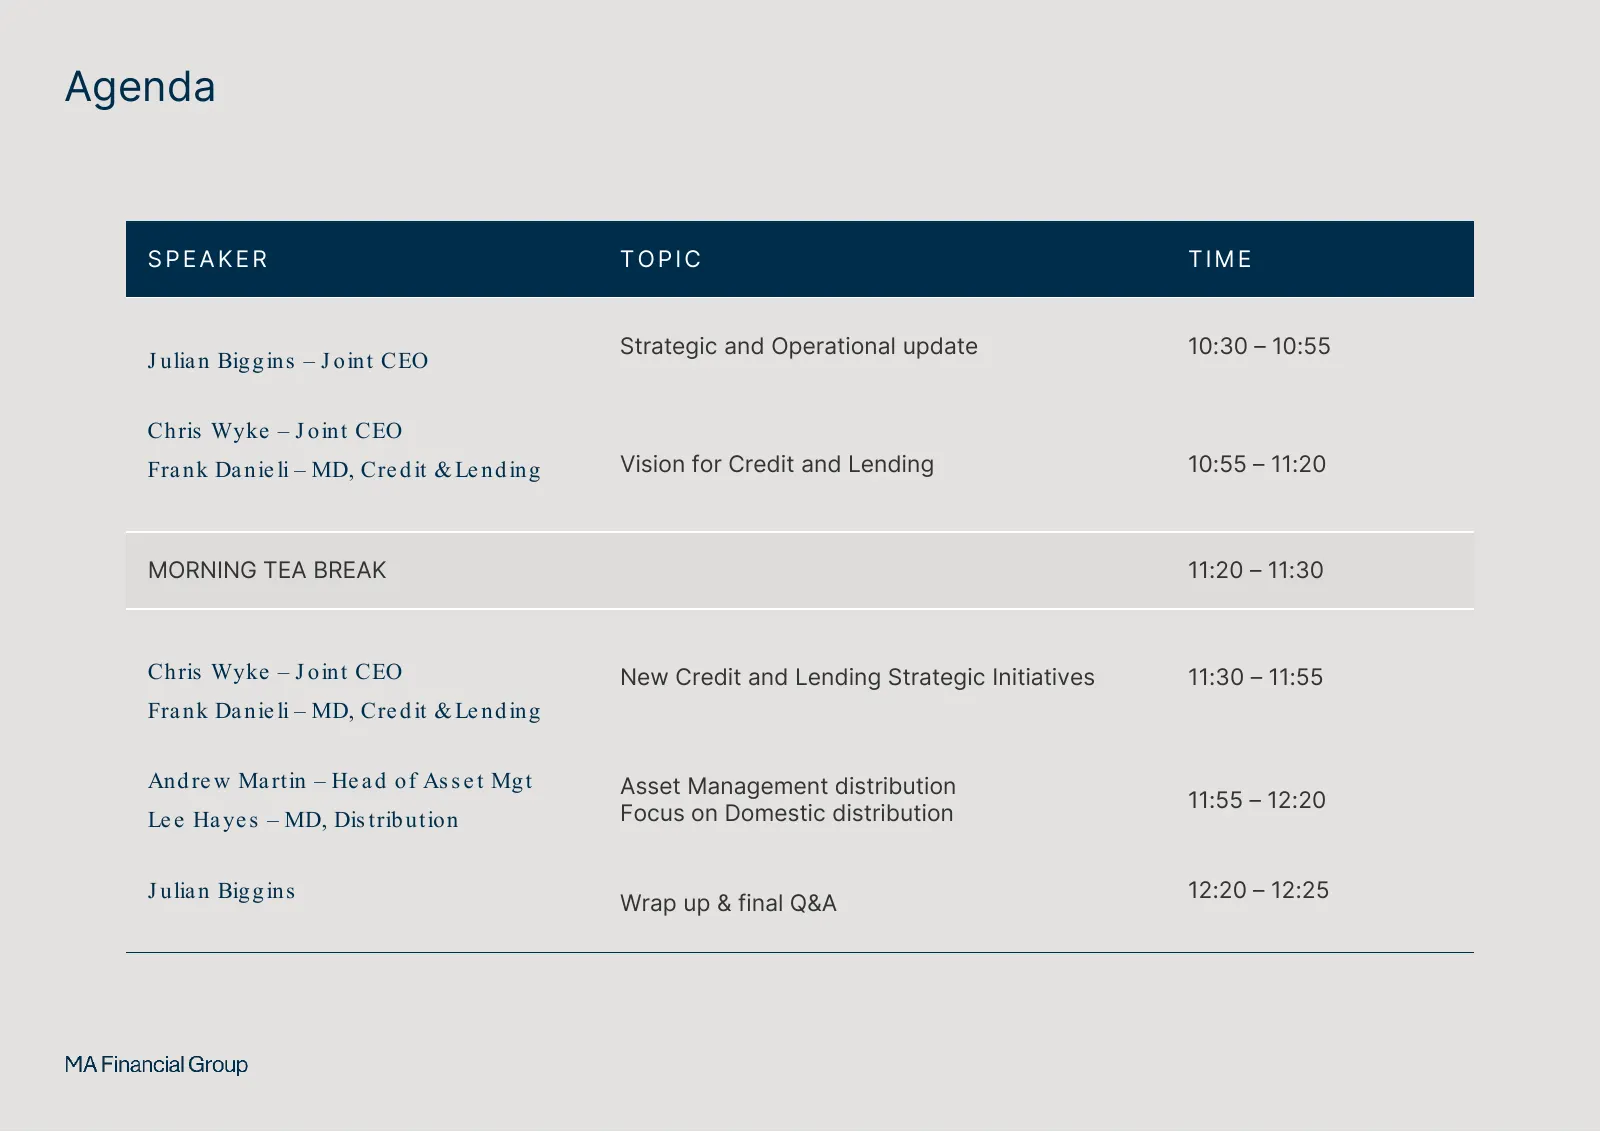
Slide 4: Agenda
Agenda SPEAKER TOPIC TIME Strategic and Operational update 10:30 – 10:55 J ulia n Big g ins – J oint CEO Ch ris Wyke – J oint CEO Fra n k Da nie li – MD, Cre d it & Le n d ing Vision for Credit and Lending 10:55 – 11:20 MORNING TEA BREAK 11:20 – 11:30 Ch ris Wyke – J oint CEO New Credit and Lending
Slide 5: Strategic and Operational update
Strategic and Operational update Diverse platform well positioned for growth Julian Biggins Joint Chief Executive Officer
Slide 6: MA Financial Group at a glance
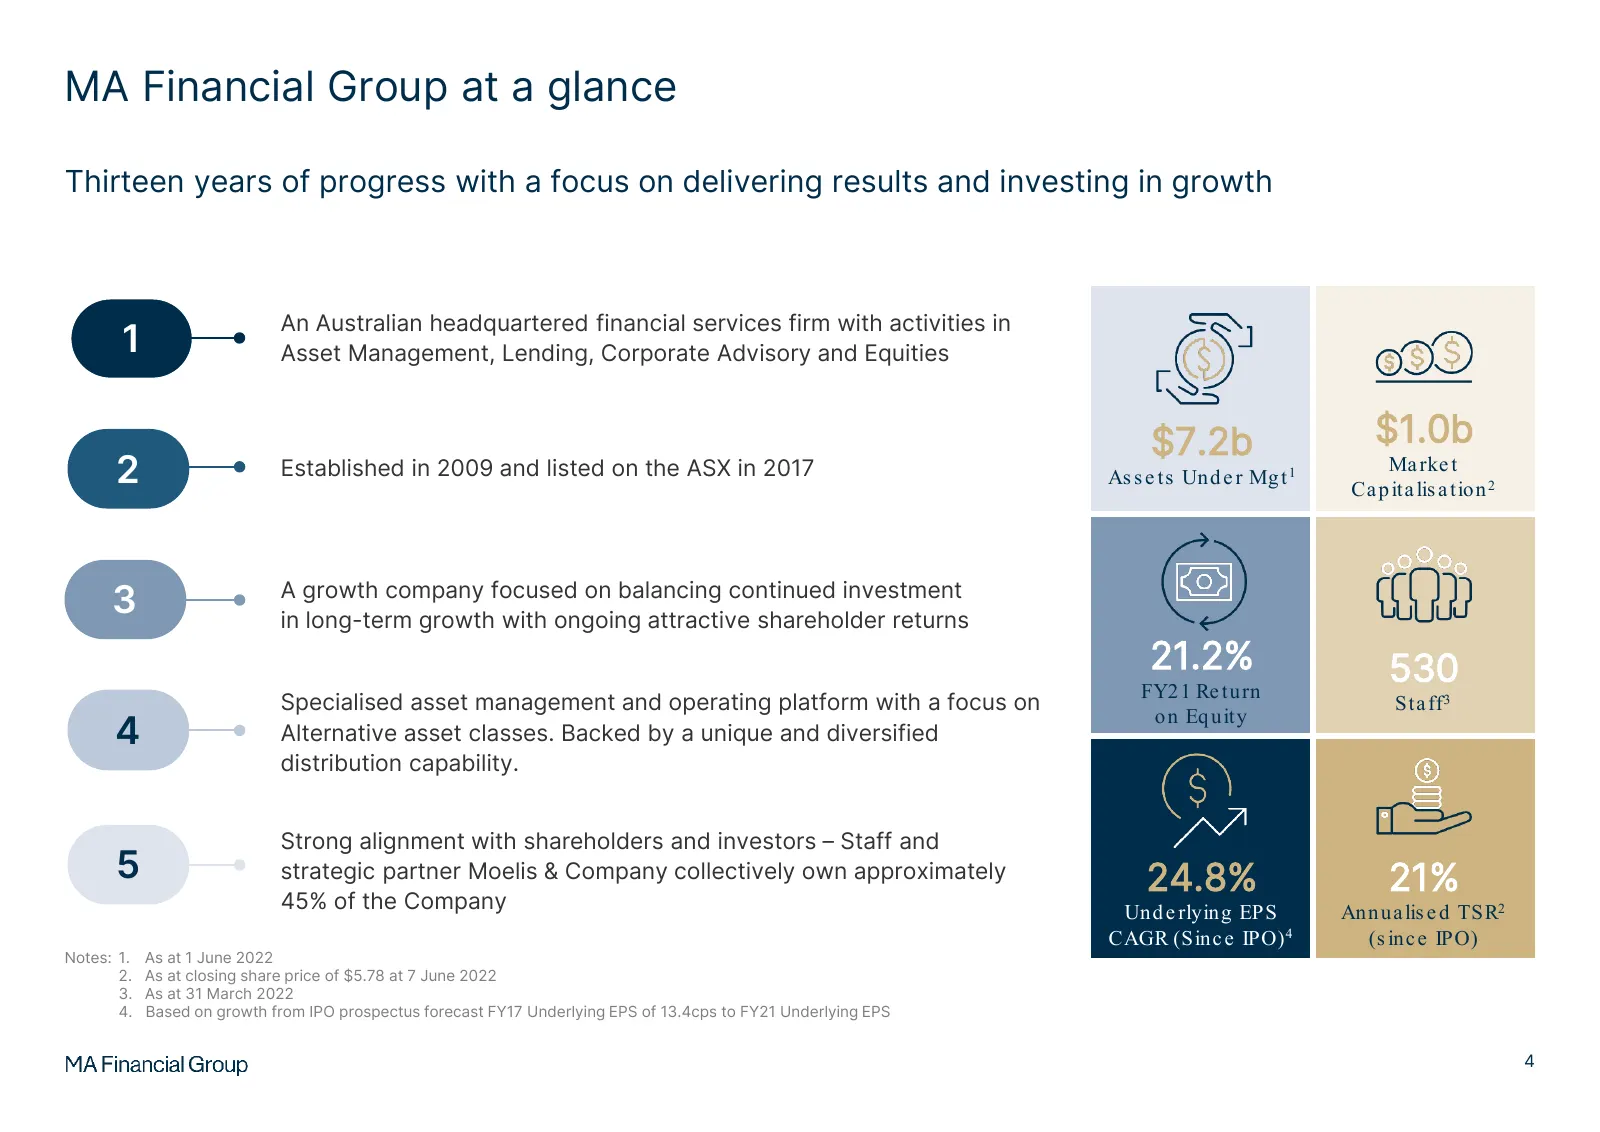
MA Financial Group at a glance Thirteen years of progress with a focus on delivering results and investing in growth An Australian headquartered financial services firm with activities in 1 Asset Management, Lending, Corporate Advisory and Equities $7.2b $1.0b 2 Established in 2009 and listed on the
Slide 7: Strategic update
01 Strategic update Julian Biggins – Joint CEO 5
Slide 8: Business well positioned for growth through the cycle
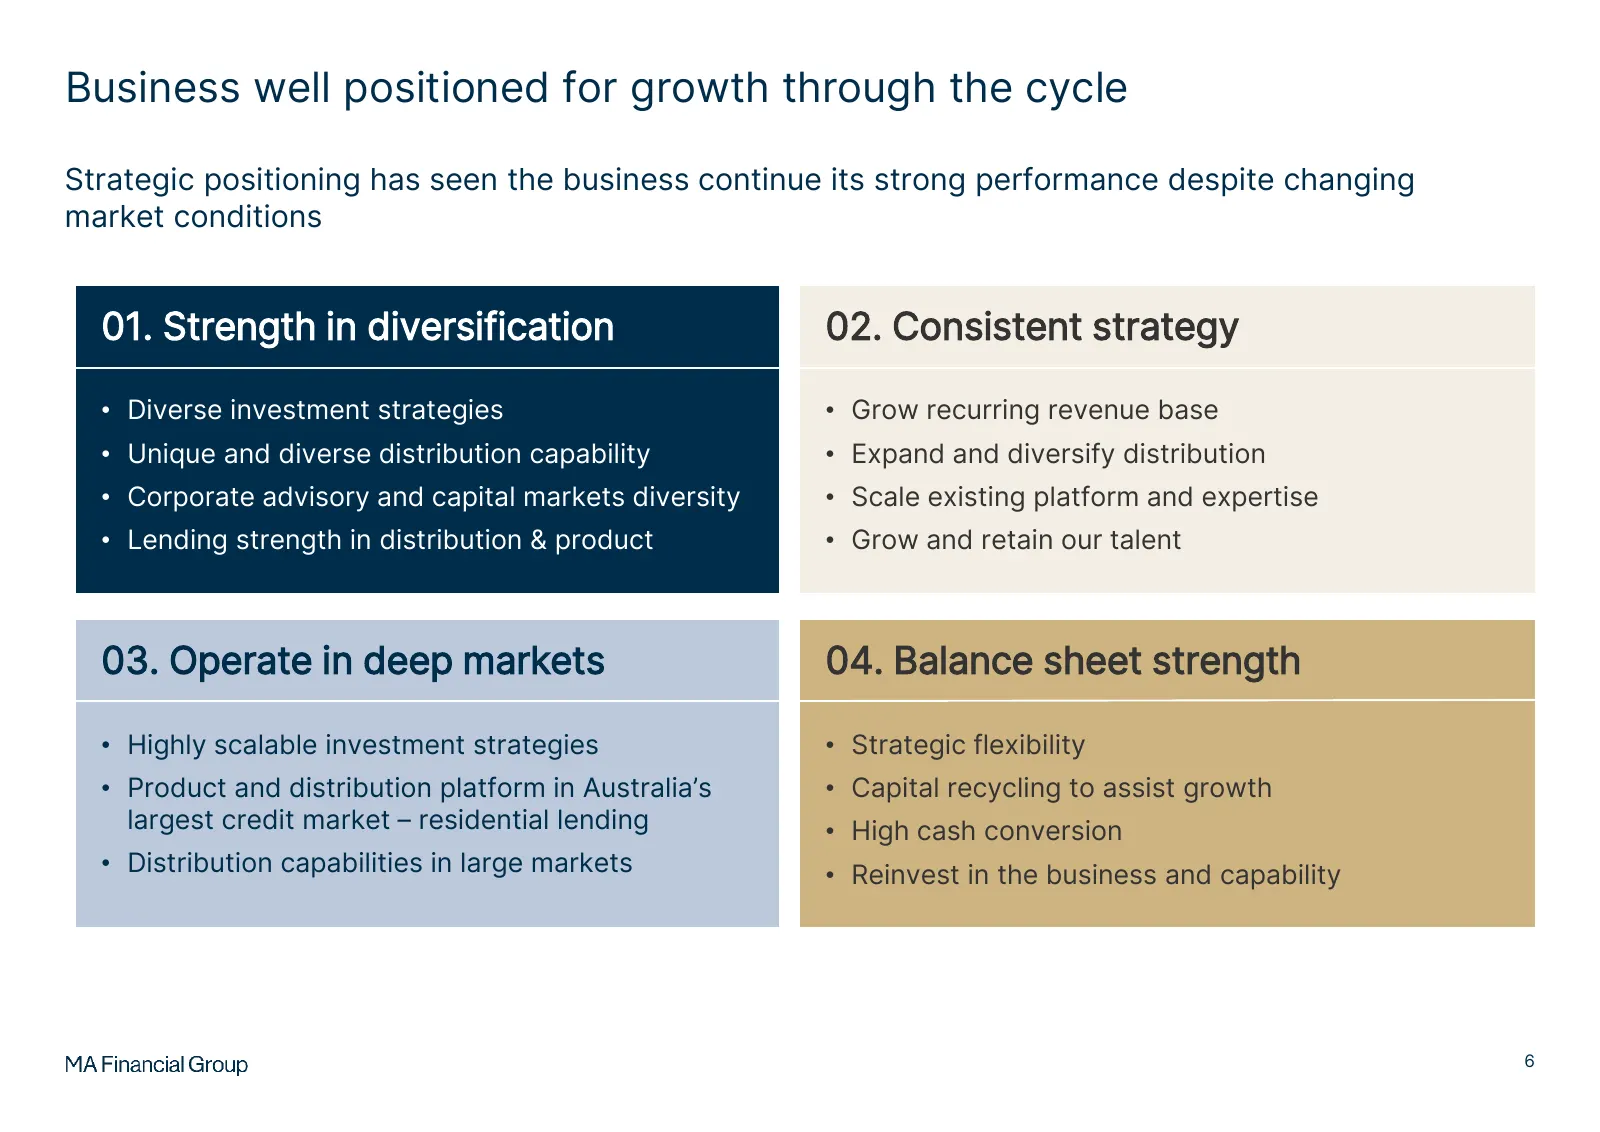
Business well positioned for growth through the cycle Strategic positioning has seen the business continue its strong performance despite changing market conditions 01. Strength in diversification 02. Consistent strategy • Diverse investment strategies • Grow recurring revenue base • Unique and dive
Slide 9: Our growth philosophy
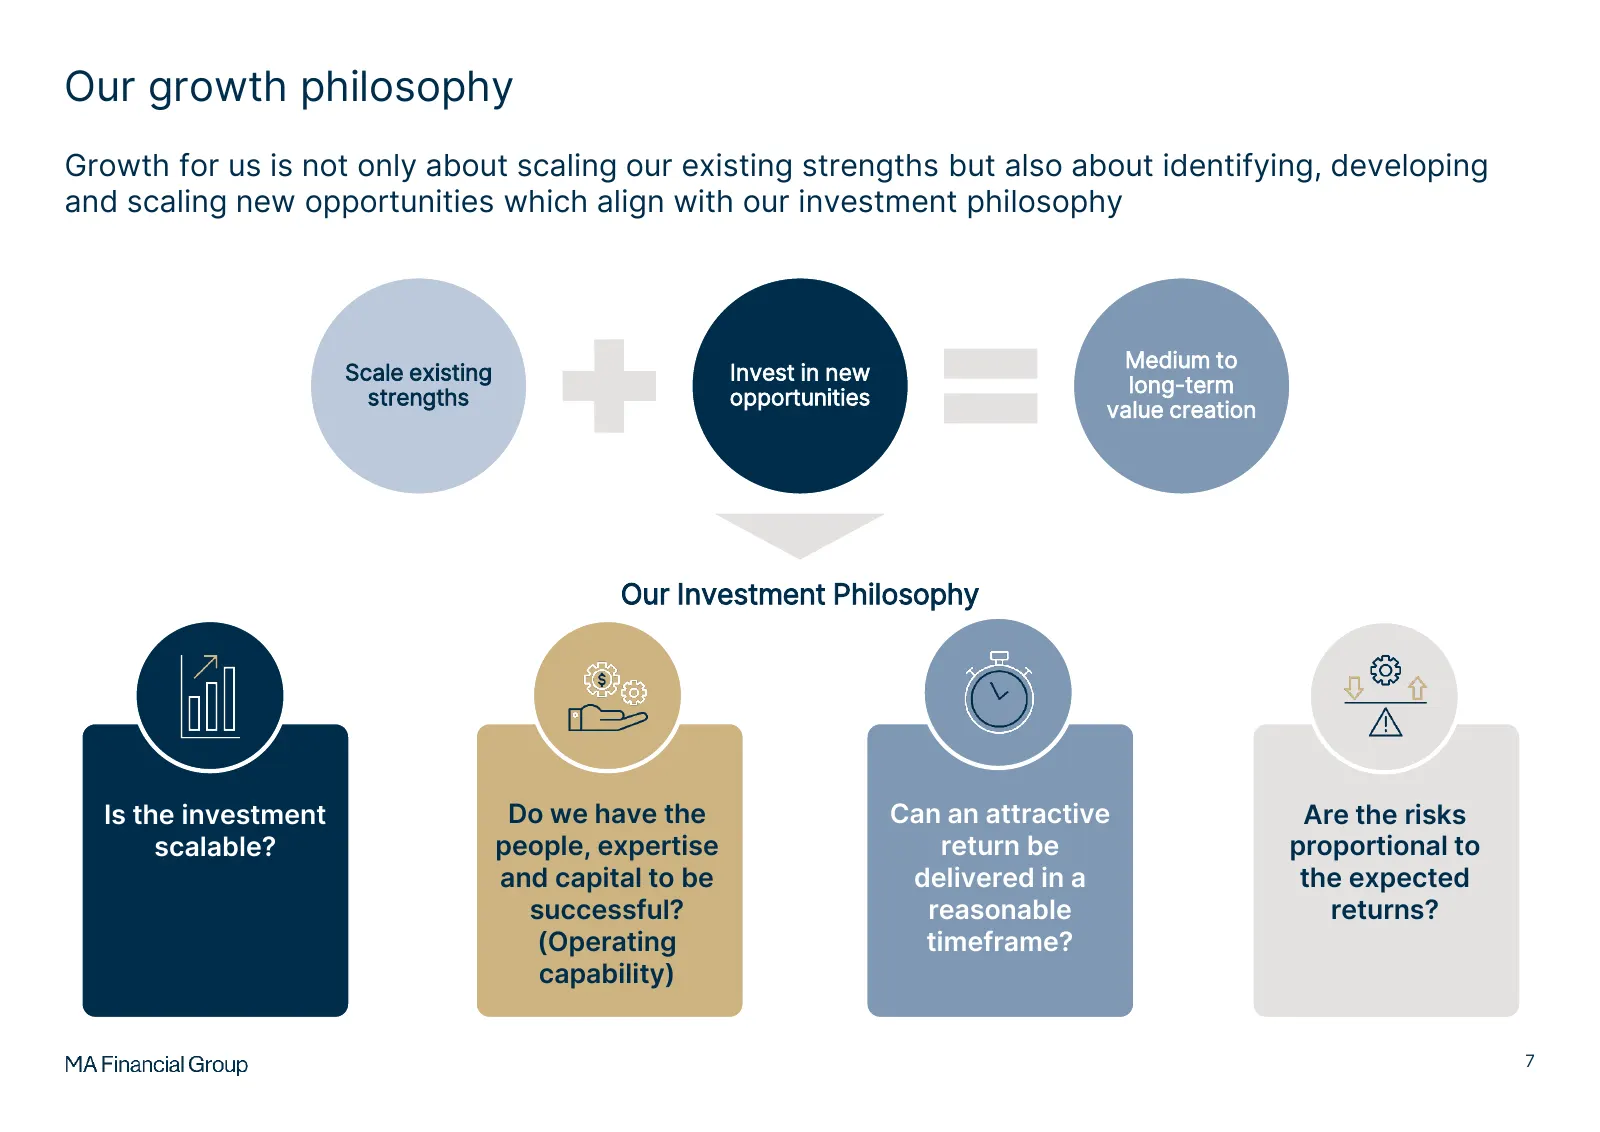
Our growth philosophy Growth for us is not only about scaling our existing strengths but also about identifying, developing and scaling new opportunities which align with our investment philosophy Medium to Scale existing Invest in new long-term strengths opportunities value creation Our Investment
Slide 10: Focus on deep markets in our distribution channels
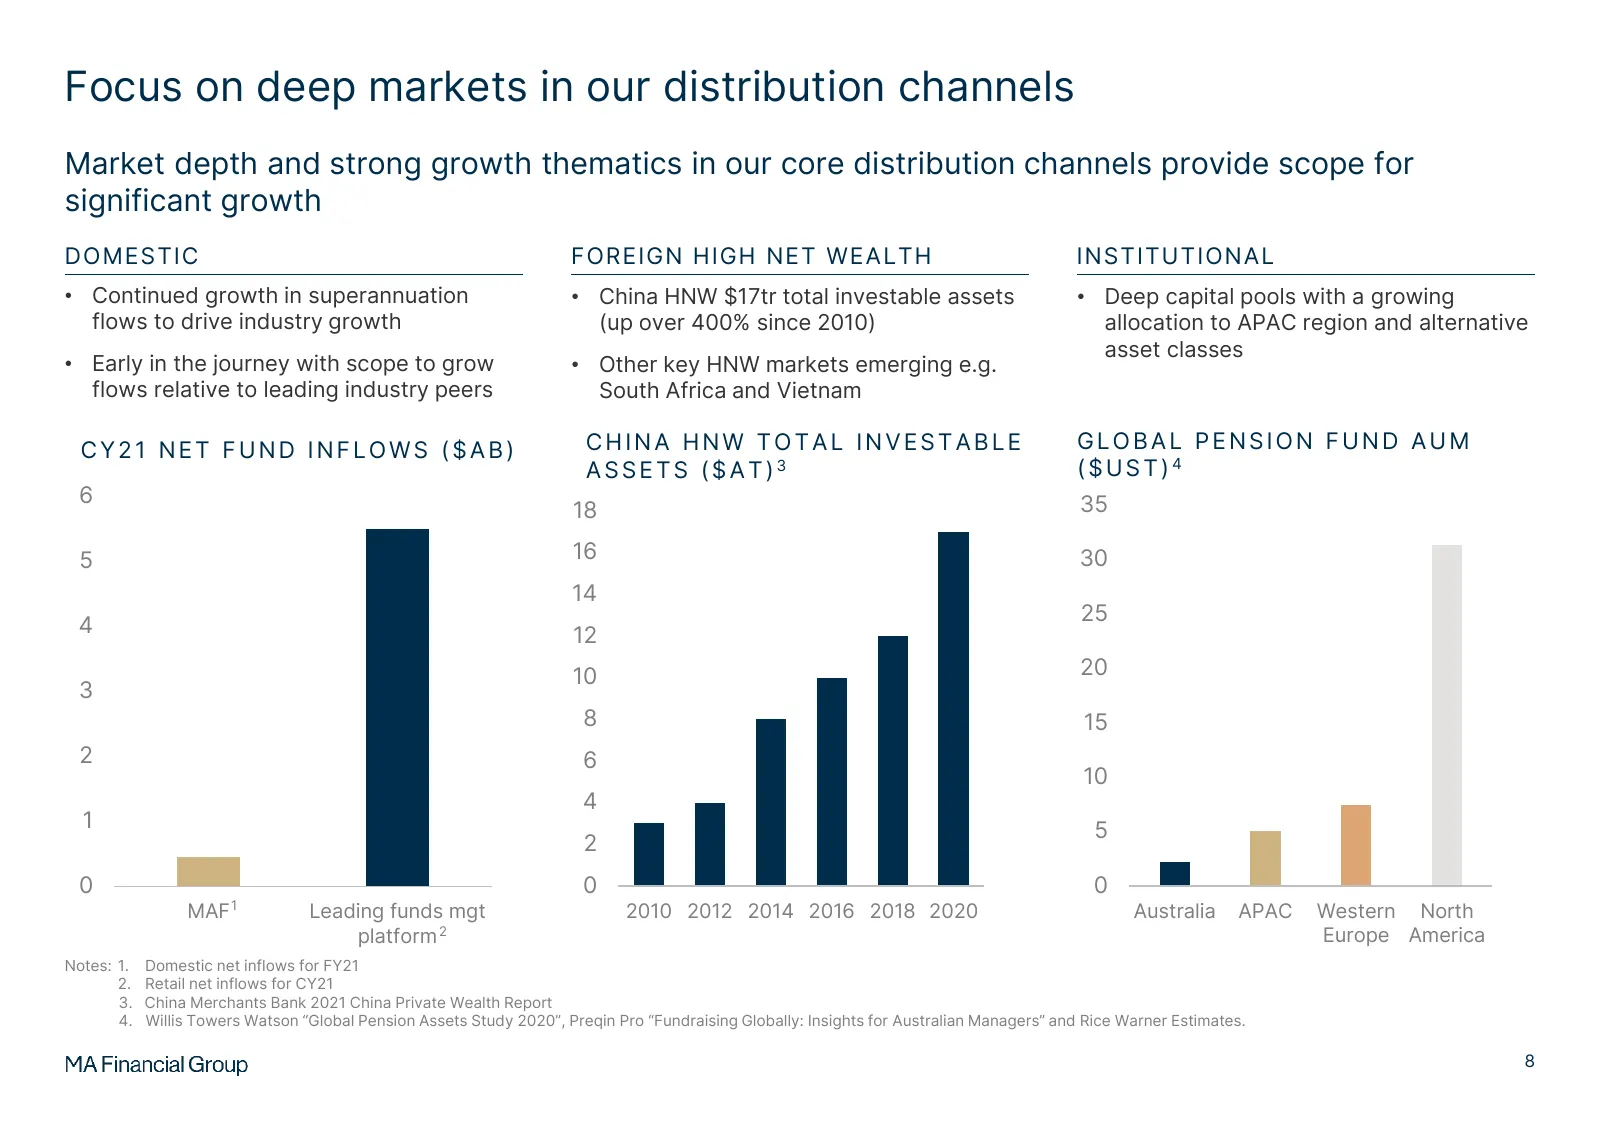
Focus on deep markets in our distribution channels Market depth and strong growth thematics in our core distribution channels provide scope for significant growth DOMESTIC FOREIGN HIGH NET WEALTH INSTITUTIONAL • Continued growth in superannuation • China HNW $17tr total investable assets • Deep capi
Slide 11: Focus on deep markets in our investment strategies
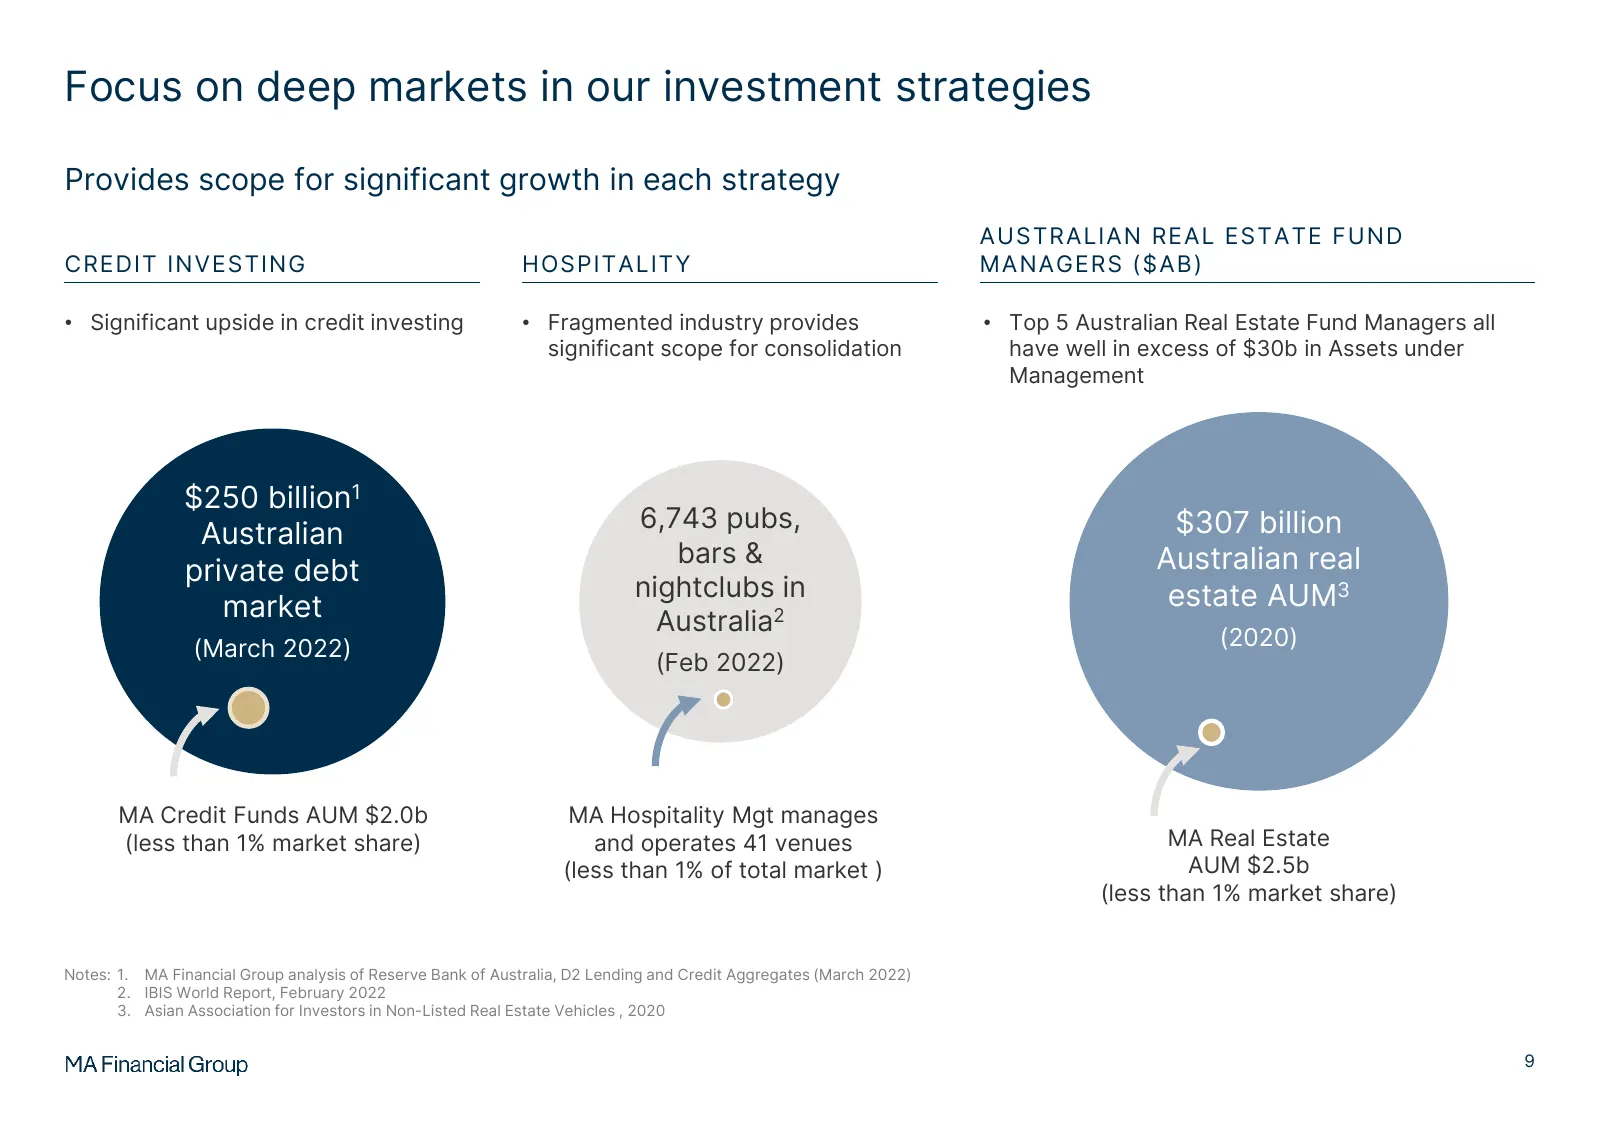
Focus on deep markets in our investment strategies Provides scope for significant growth in each strategy AUSTRALIAN REAL ESTATE FUND CREDIT INVESTING HOSPITALITY MANAGERS ($AB) • Significant upside in credit investing • Fragmented industry provides • Top 5 Australian Real Estate Fund Managers all s
Slide 12: Focus on deep markets in our Lending strategy
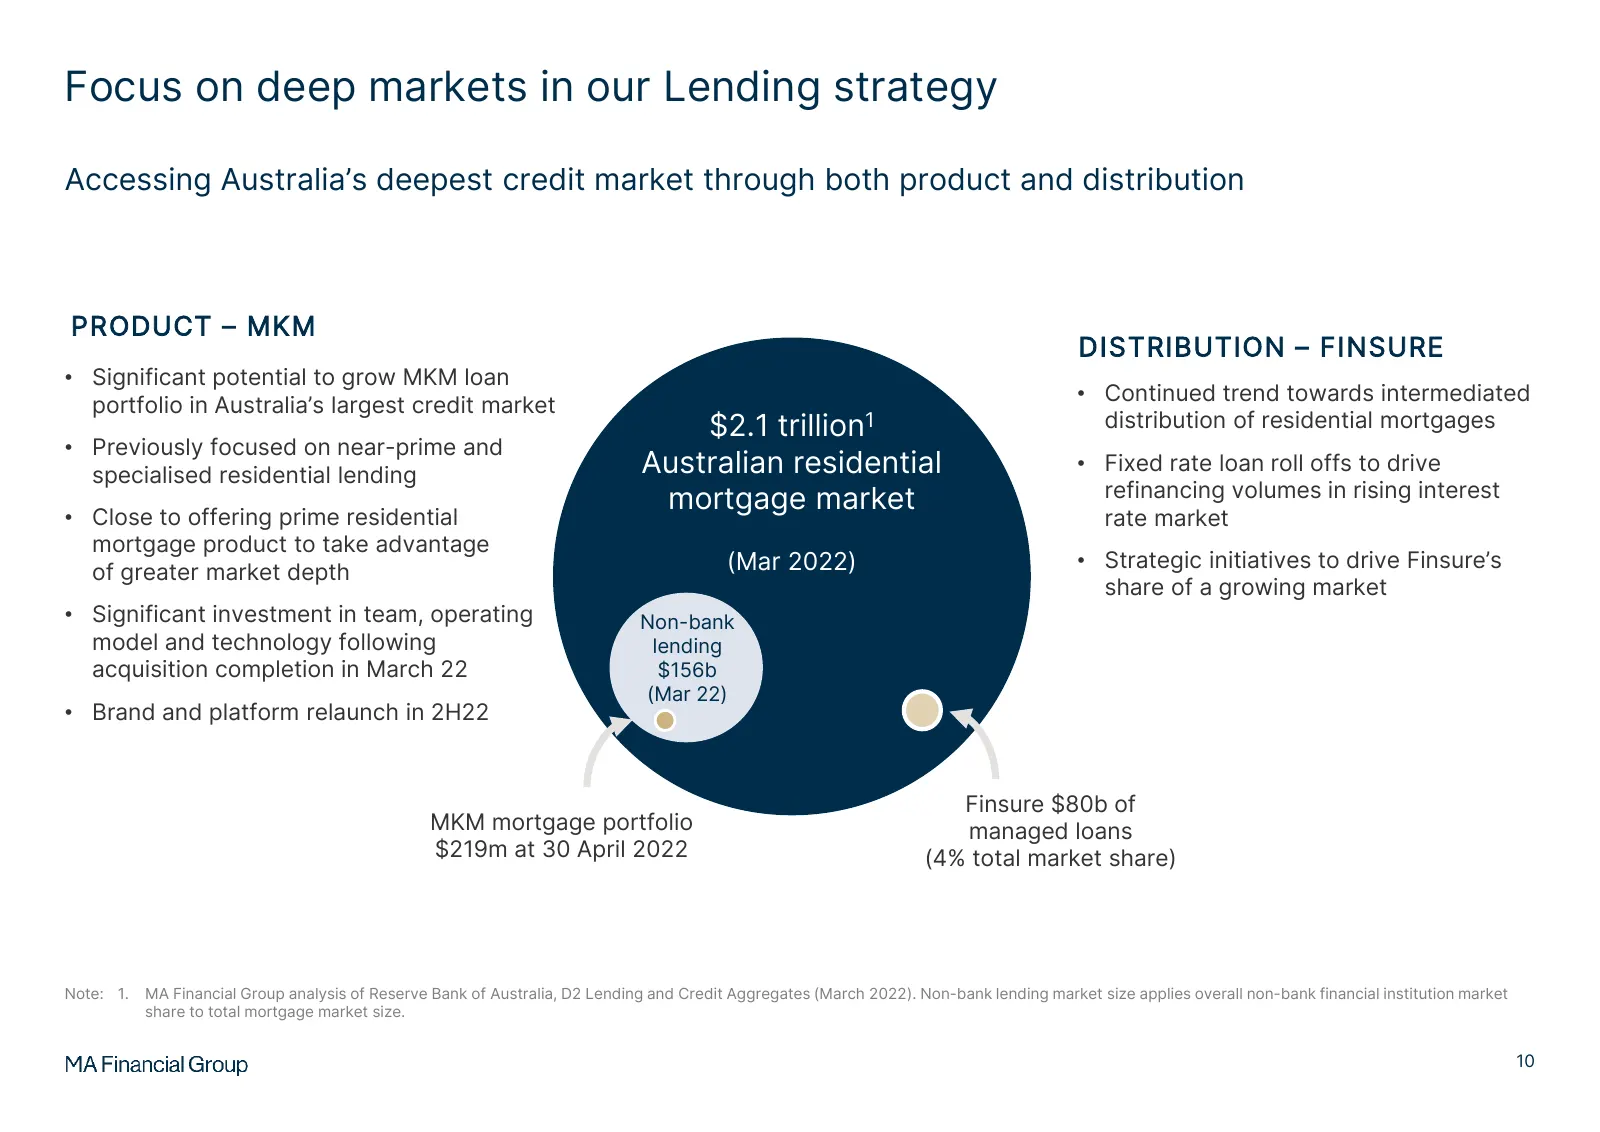
Focus on deep markets in our Lending strategy Accessing Australia’s deepest credit market through both product and distribution PRODUCT – MKM DISTRIBUTION – FINSURE • Significant potential to grow MKM loan • Continued trend towards intermediated portfolio in Australia’s largest credit market $2.1 tr
Slide 13: Investing in our people for growth
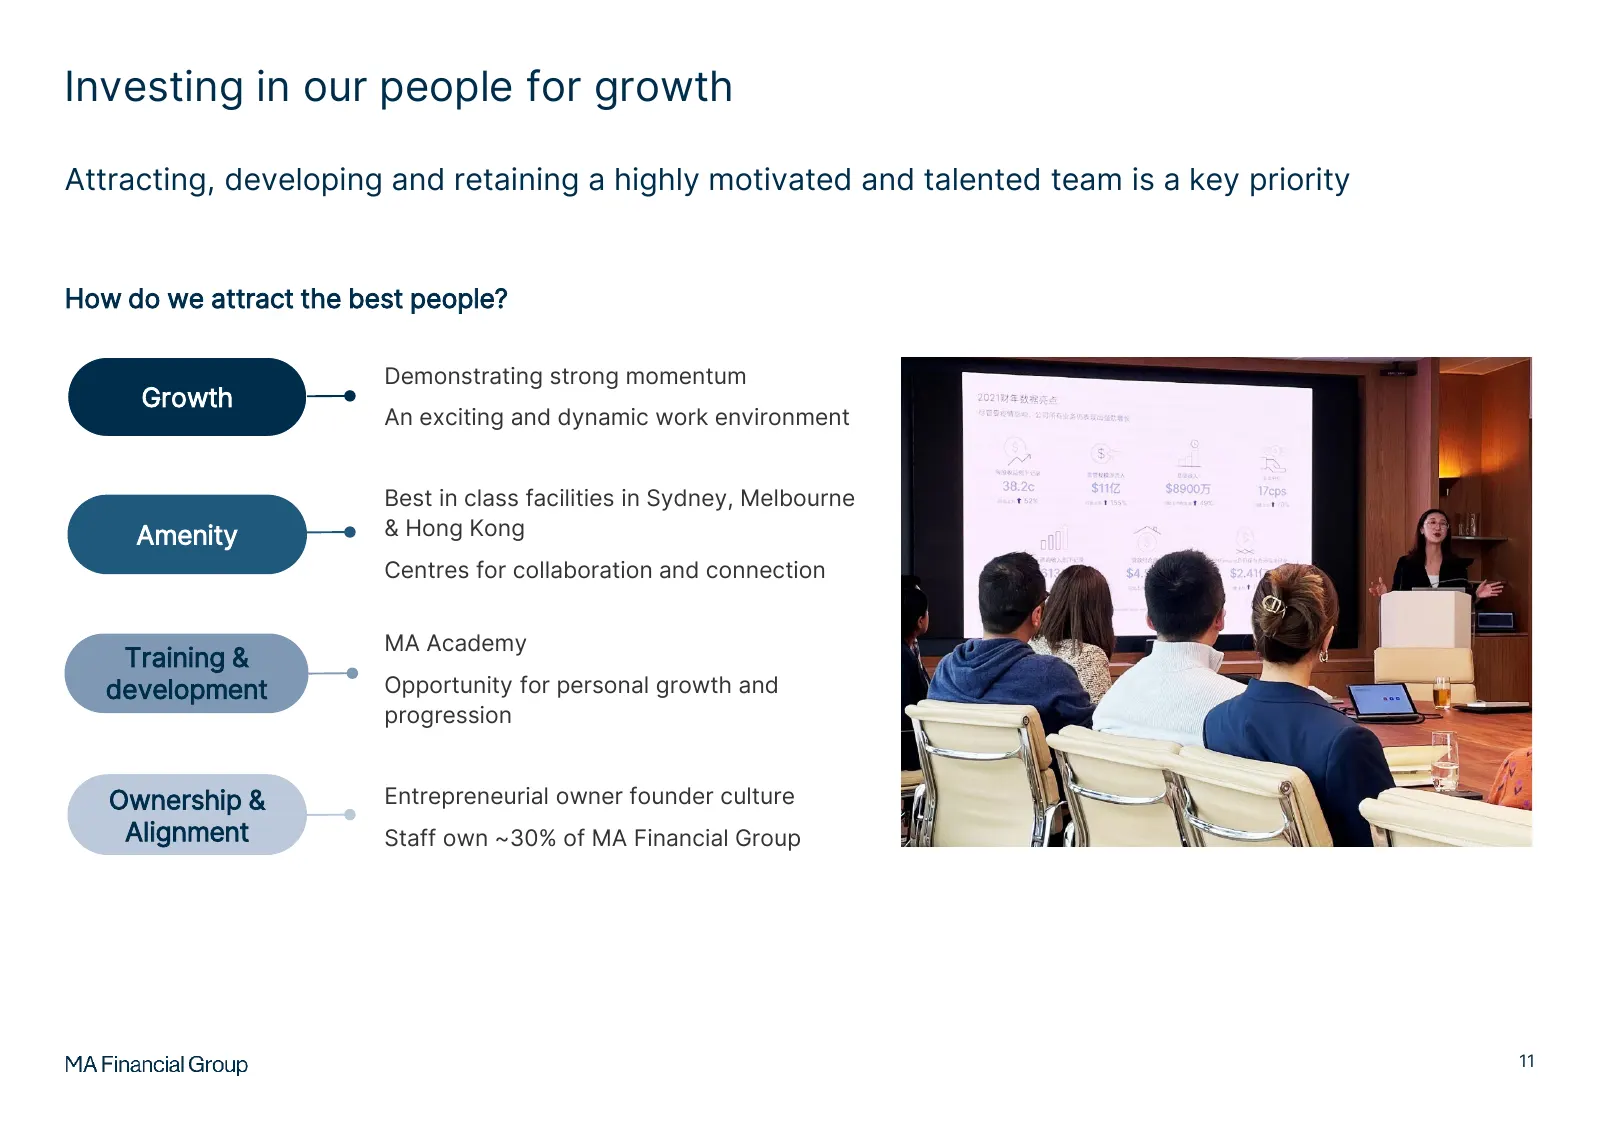
Investing in our people for growth Attracting, developing and retaining a highly motivated and talented team is a key priority How do we attract the best people? Demonstrating strong momentum Growth An exciting and dynamic work environment Best in class facilities in Sydney, Melbourne Amenity & Hong
Slide 14: Operational update
02 Operational update Julian Biggins – Joint CEO 12
Slide 15: Operational update
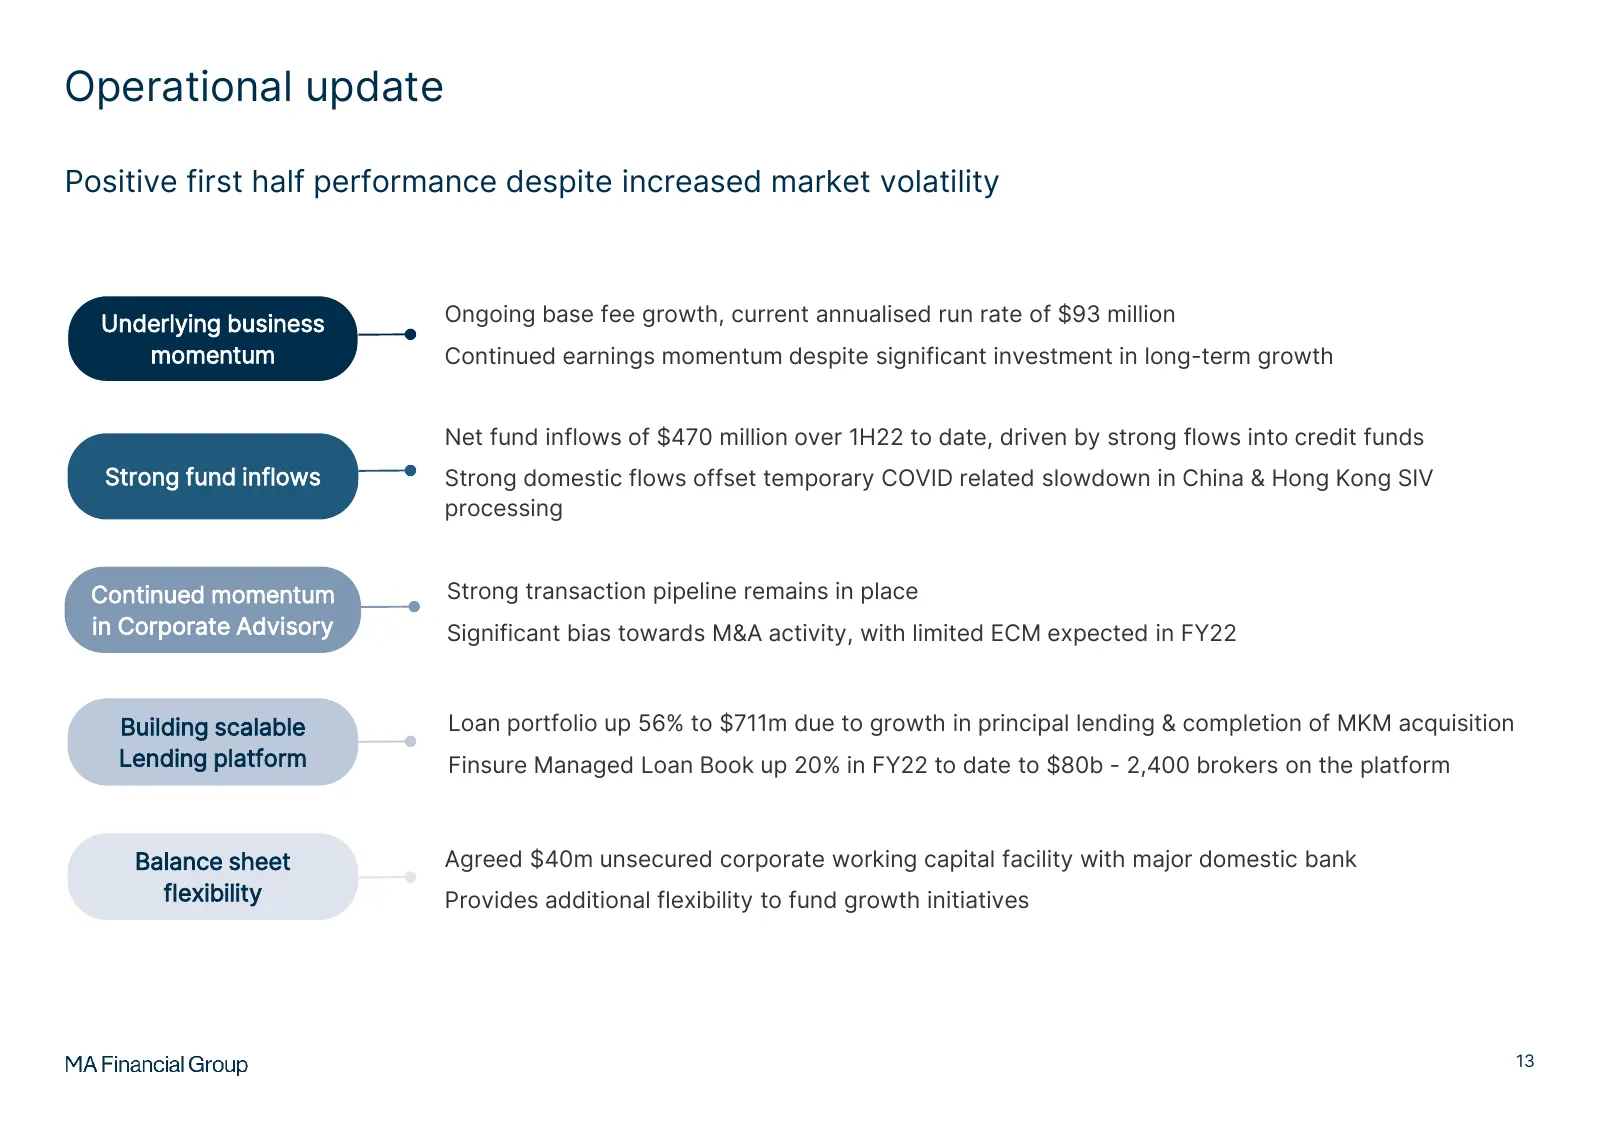
Operational update Positive first half performance despite increased market volatility Underlying business Ongoing base fee growth, current annualised run rate of $93 million momentum Continued earnings momentum despite significant investment in long-term growth Net fund inflows of $470 million over
Slide 16: FY22 outlook
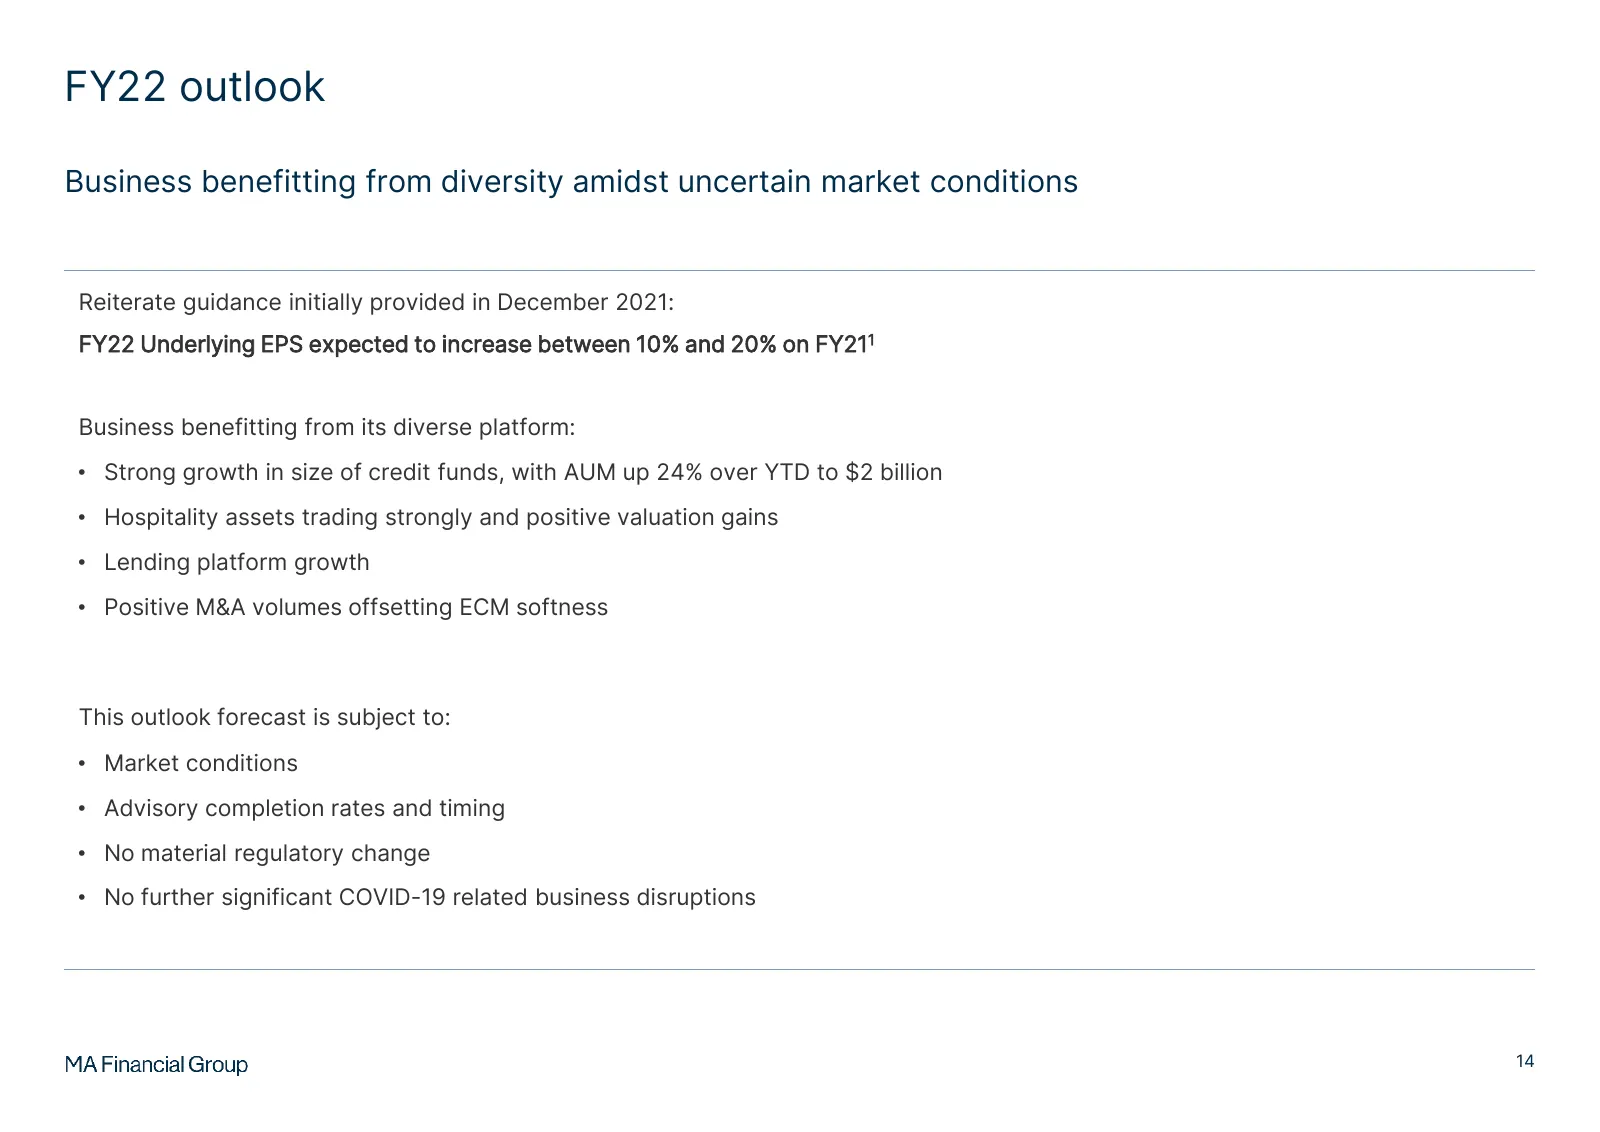
FY22 outlook Business benefitting from diversity amidst uncertain market conditions Reiterate guidance initially provided in December 2021: FY22 Underlying EPS expected to increase between 10% and 20% on FY211 Business benefitting from its diverse platform: • Strong growth in size of credit funds, w
Slide 17: Underlying earnings methodology change
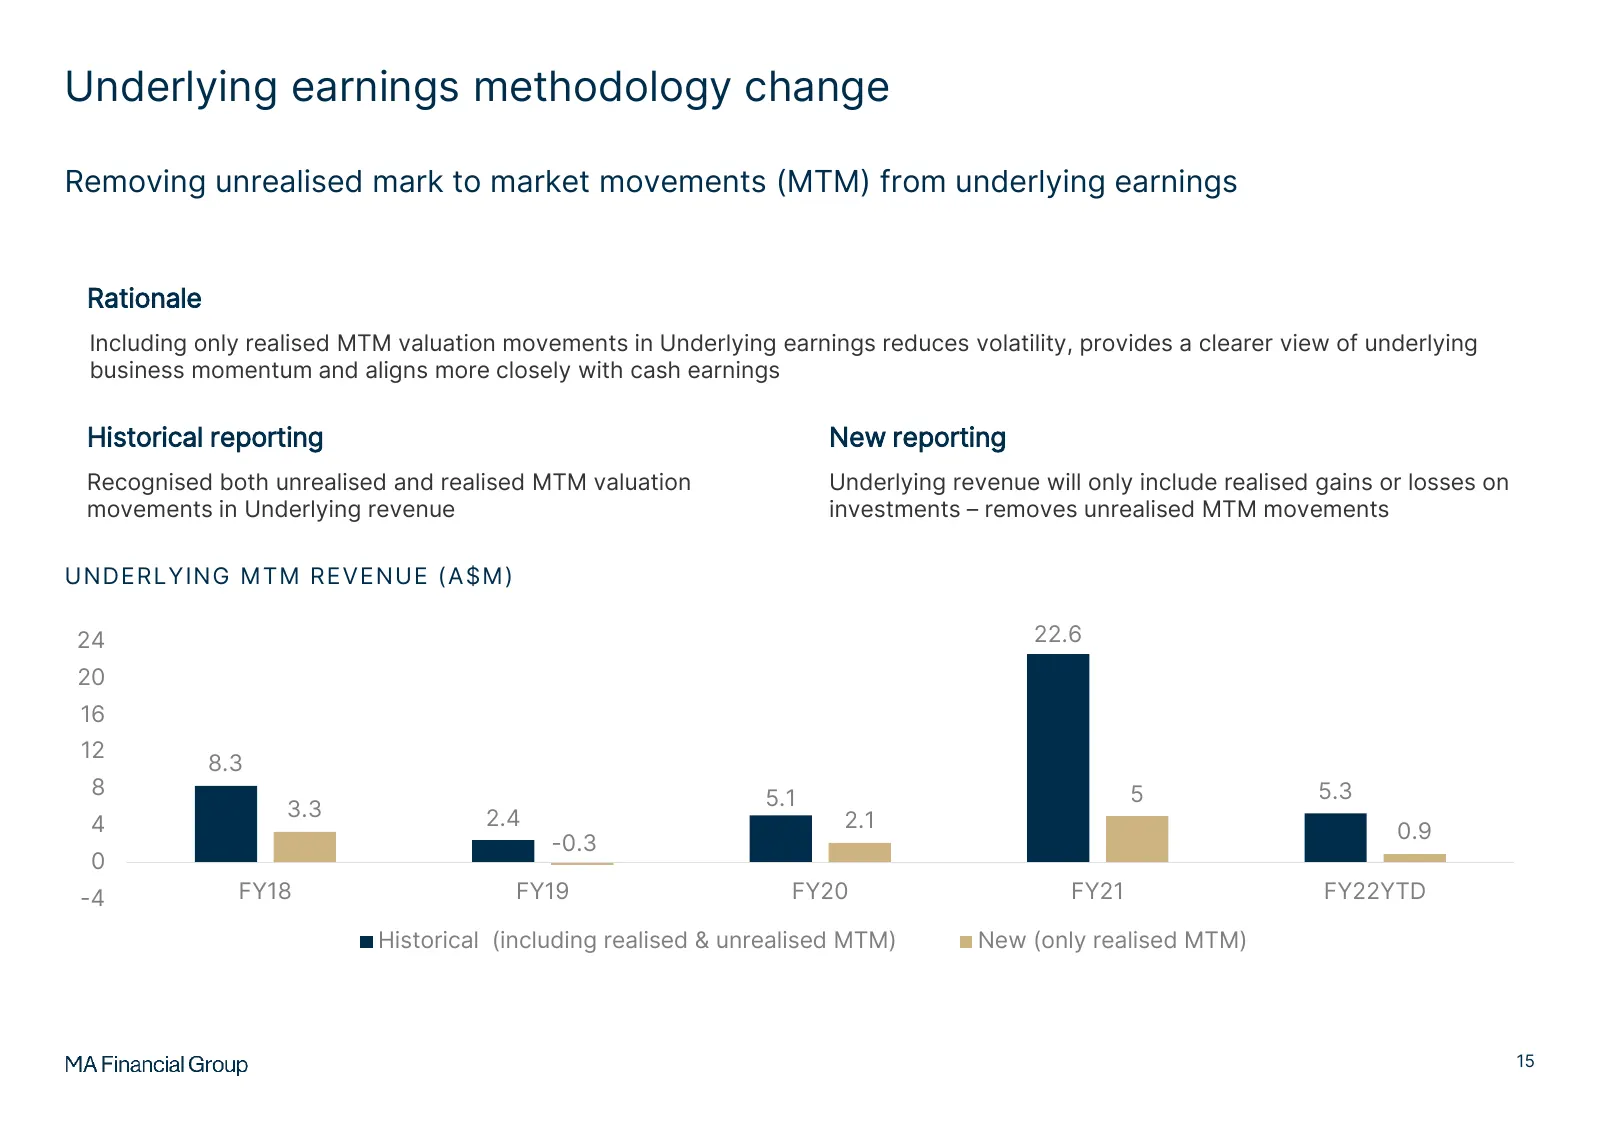
Underlying earnings methodology change Removing unrealised mark to market movements (MTM) from underlying earnings Rationale Including only realised MTM valuation movements in Underlying earnings reduces volatility, provides a clearer view of underlying business momentum and aligns more closely with
Slide 18: New Underlying EPS measure highlights strong business momentum
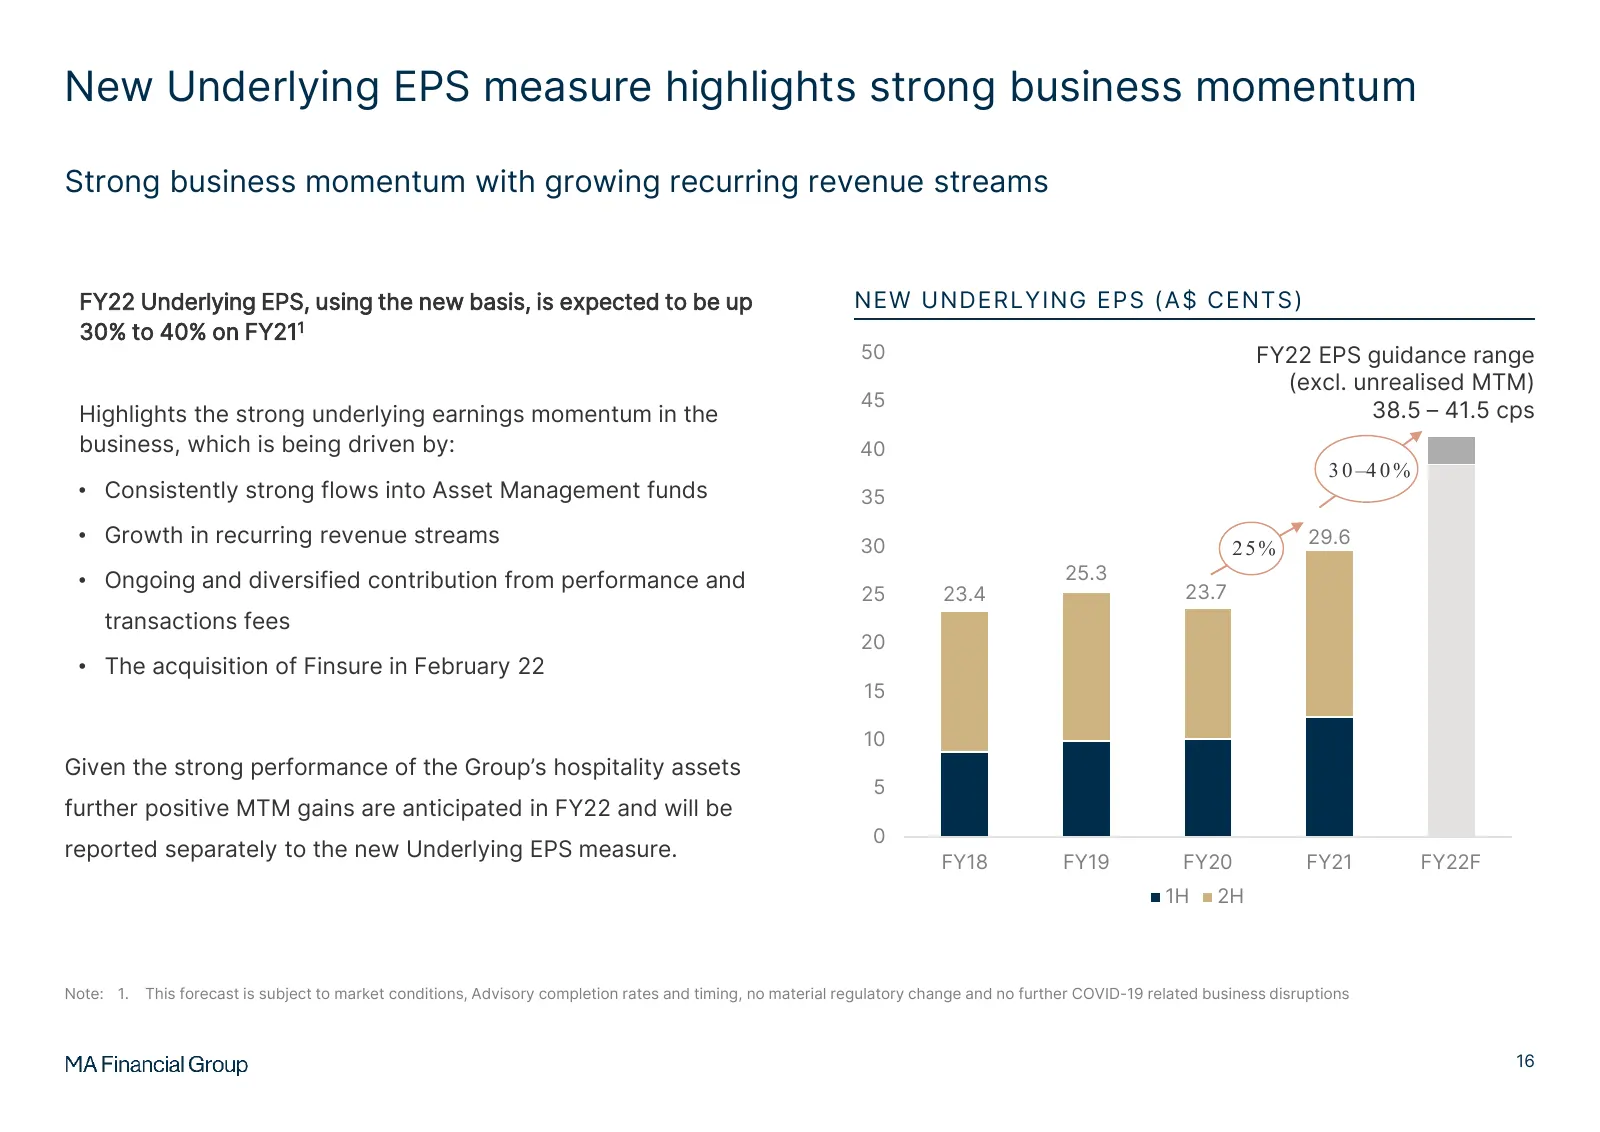
New Underlying EPS measure highlights strong business momentum Strong business momentum with growing recurring revenue streams FY22 Underlying EPS, using the new basis, is expected to be up NEW UNDERLYING EPS (A$ CENTS) 30% to 40% on FY211 50 FY22 EPS guidance range (excl. unrealised MTM) 45 Highlig
Slide 19: Questions
Questions Julian Biggins – Joint CEO 17
Slide 20: Vision for Lending & Credit
Vision for Lending & Credit Chris Wyke Joint Chief Executive Officer Frank Danieli Managing Director, Credit & Lending
Slide 21: Vision for Lending & Credit
01 Vision for Lending & Credit
Slide 22: MA's Lending & Credit platform
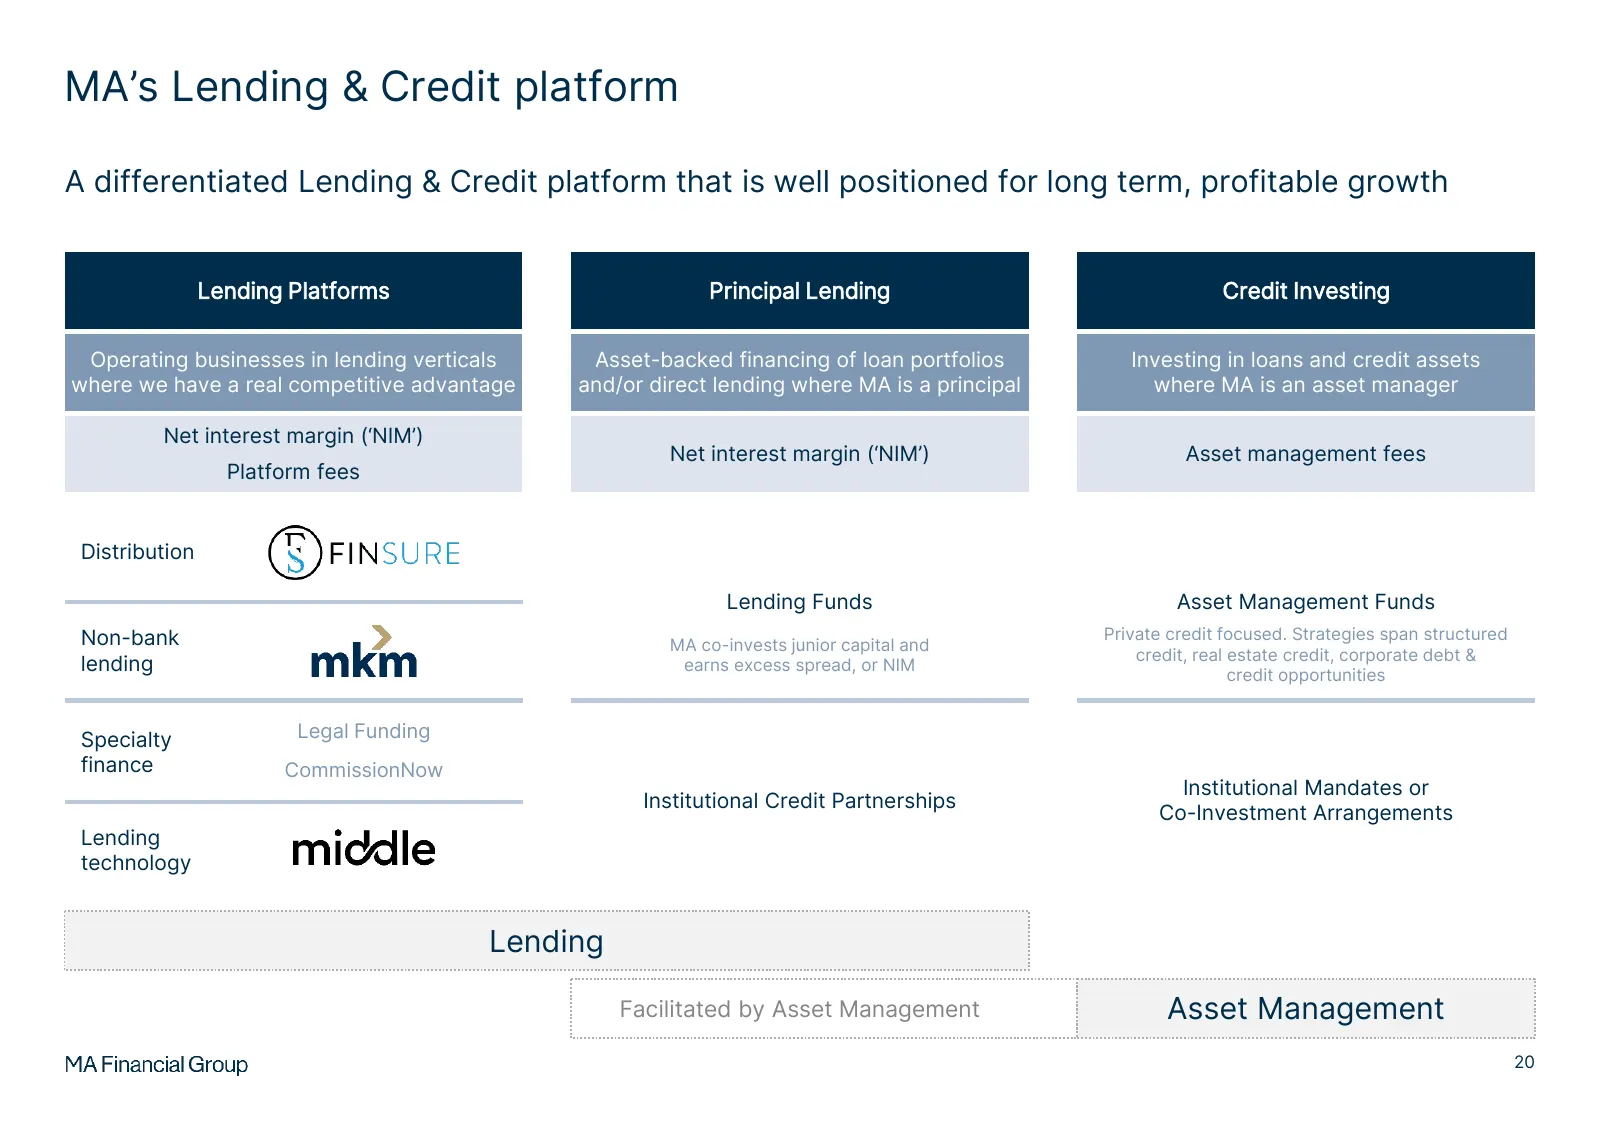
MA’s Lending & Credit platform A differentiated Lending & Credit platform that is well positioned for long term, profitable growth Lending Platforms Principal Lending Credit Investing Operating businesses in lending verticals Asset-backed financing of loan portfolios Investing in loans and credit as
Slide 23: Why building Lending & Credit was logical for MA
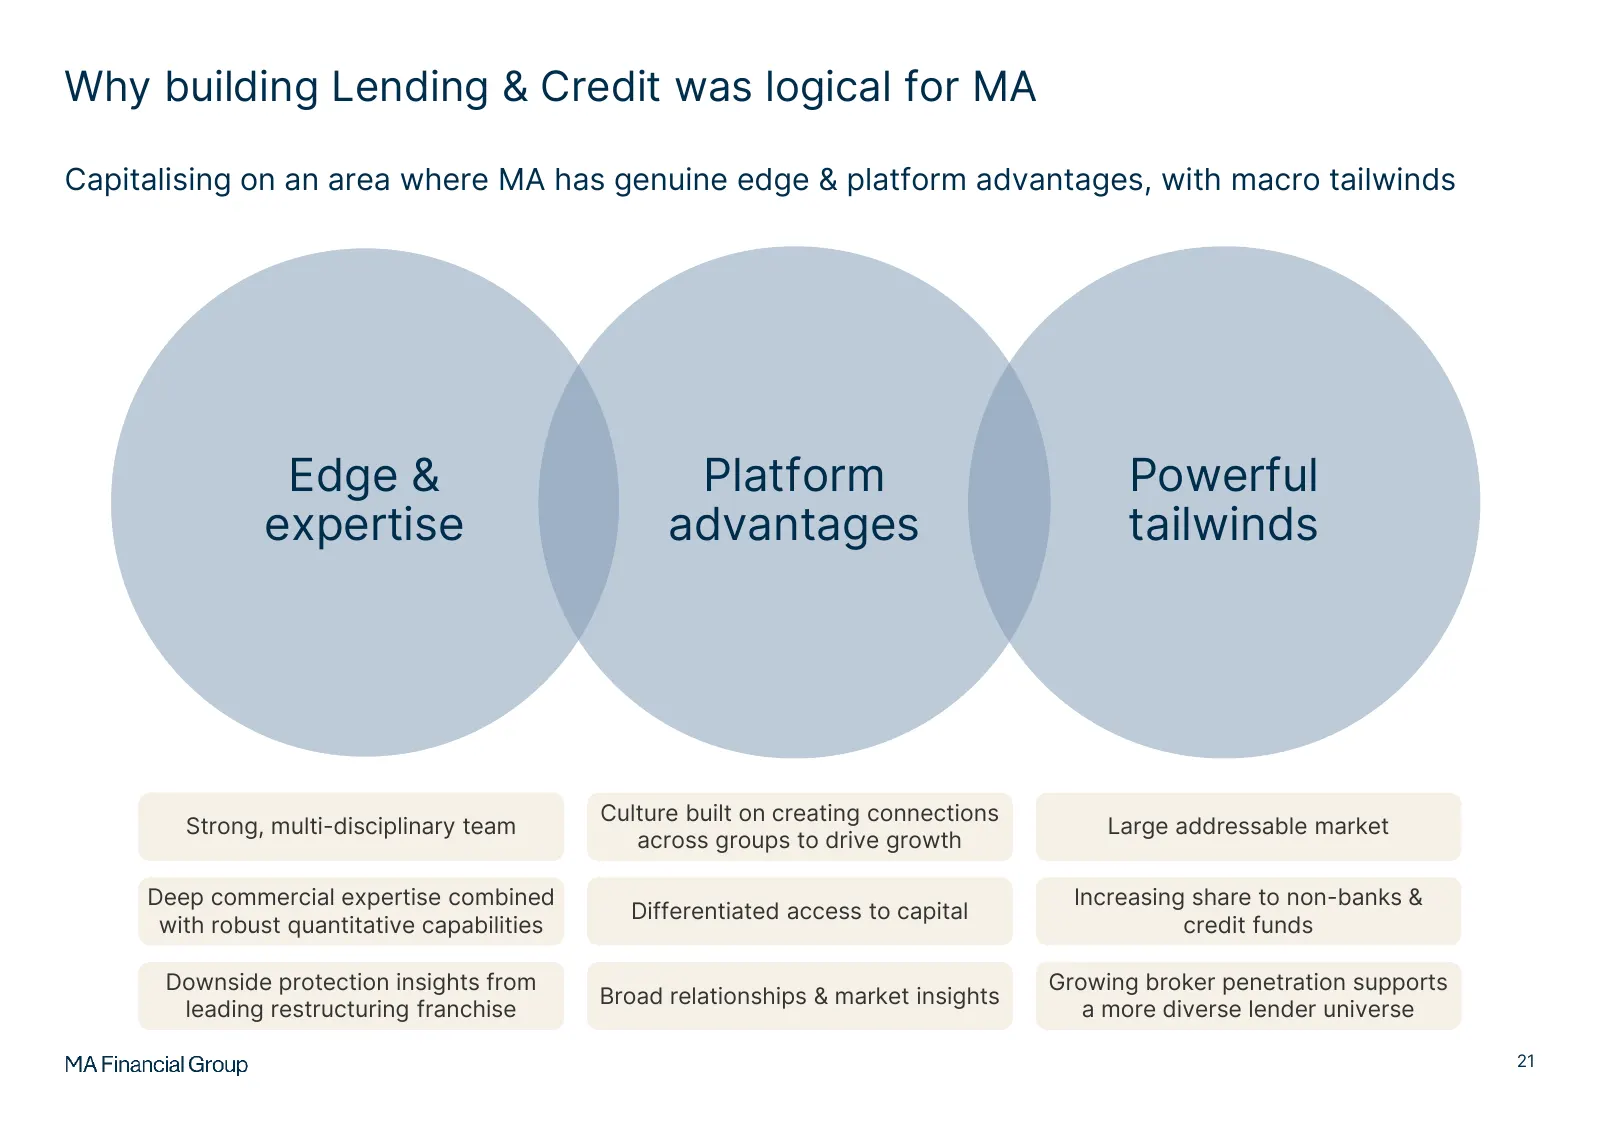
Why building Lending & Credit was logical for MA Capitalising on an area where MA has genuine edge & platform advantages, with macro tailwinds Edge & Platform Powerful expertise advantages tailwinds Culture built on creating connections Strong, multi-disciplinary team Large addressable market across
Slide 24: Powerful tailwinds: A large addressable market
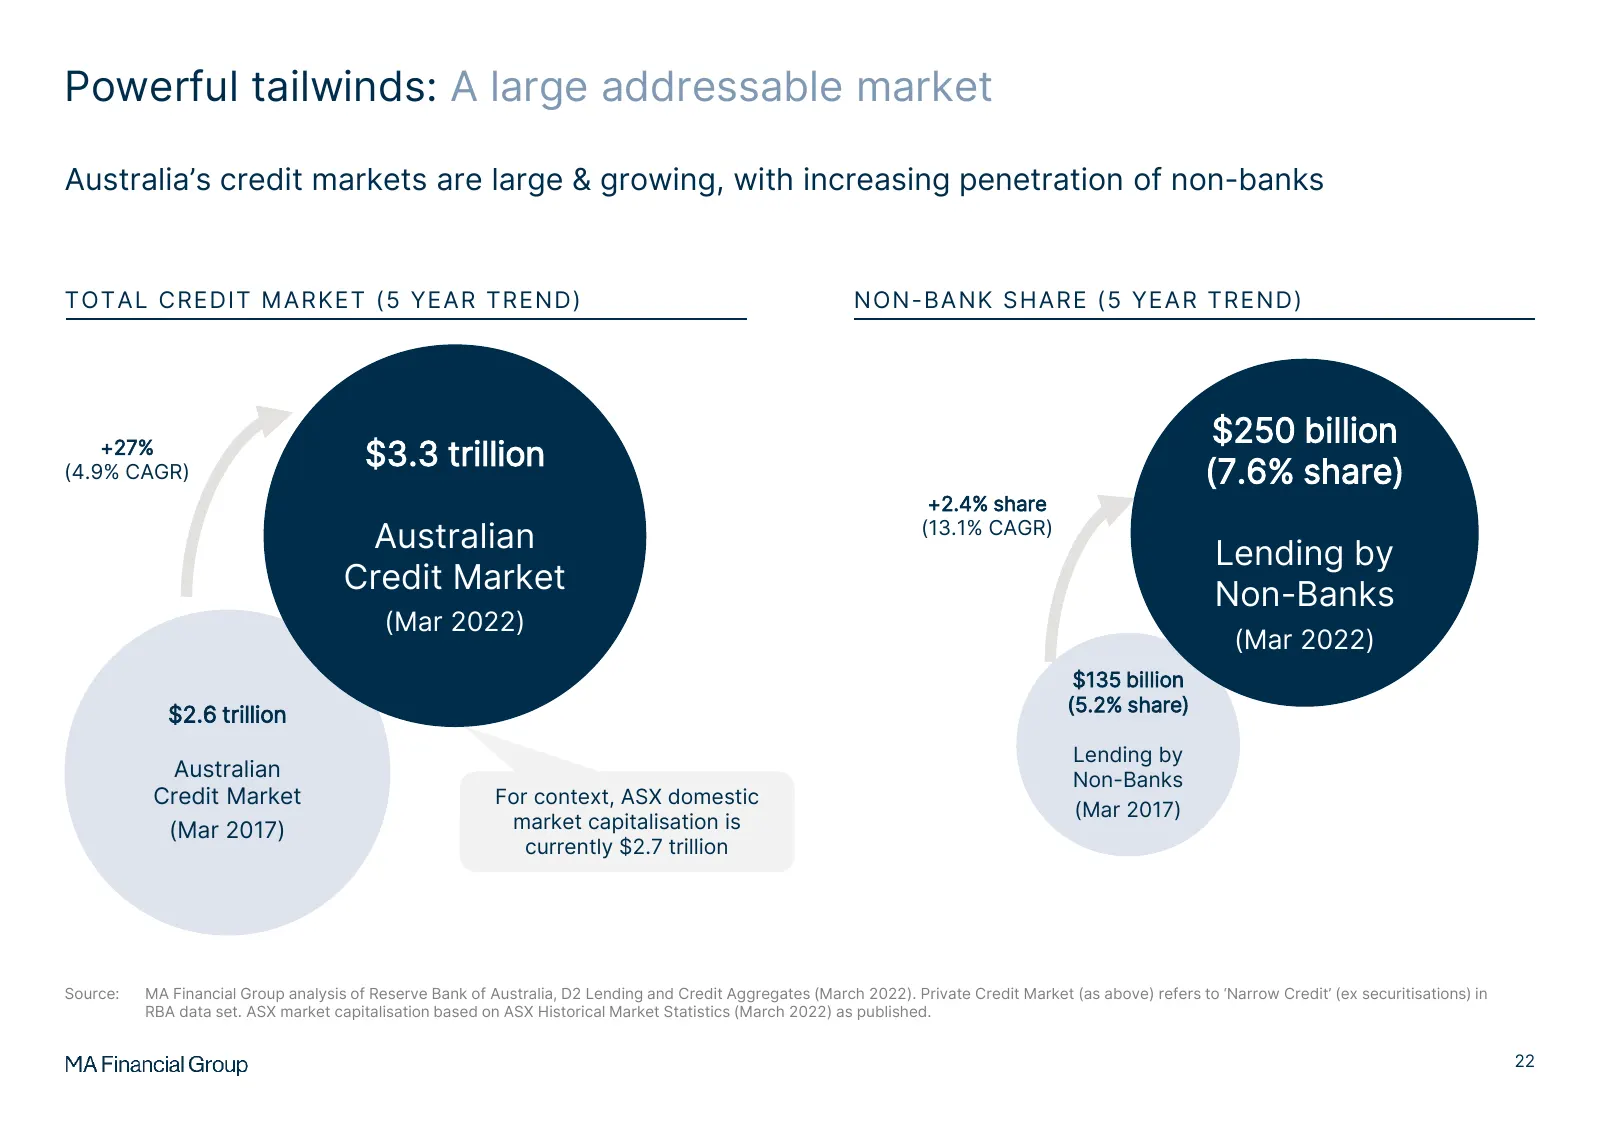
Powerful tailwinds: A large addressable market Australia’s credit markets are large & growing, with increasing penetration of non-banks TOTAL CREDIT MARKET (5 YEAR TREND) NON-BANK SHARE (5 YEAR TREND) $250 billion +27% $3.3 trillion (4.9% CAGR) (7.6% share) +2.4% share Australian (13.1% CAGR) Lendin
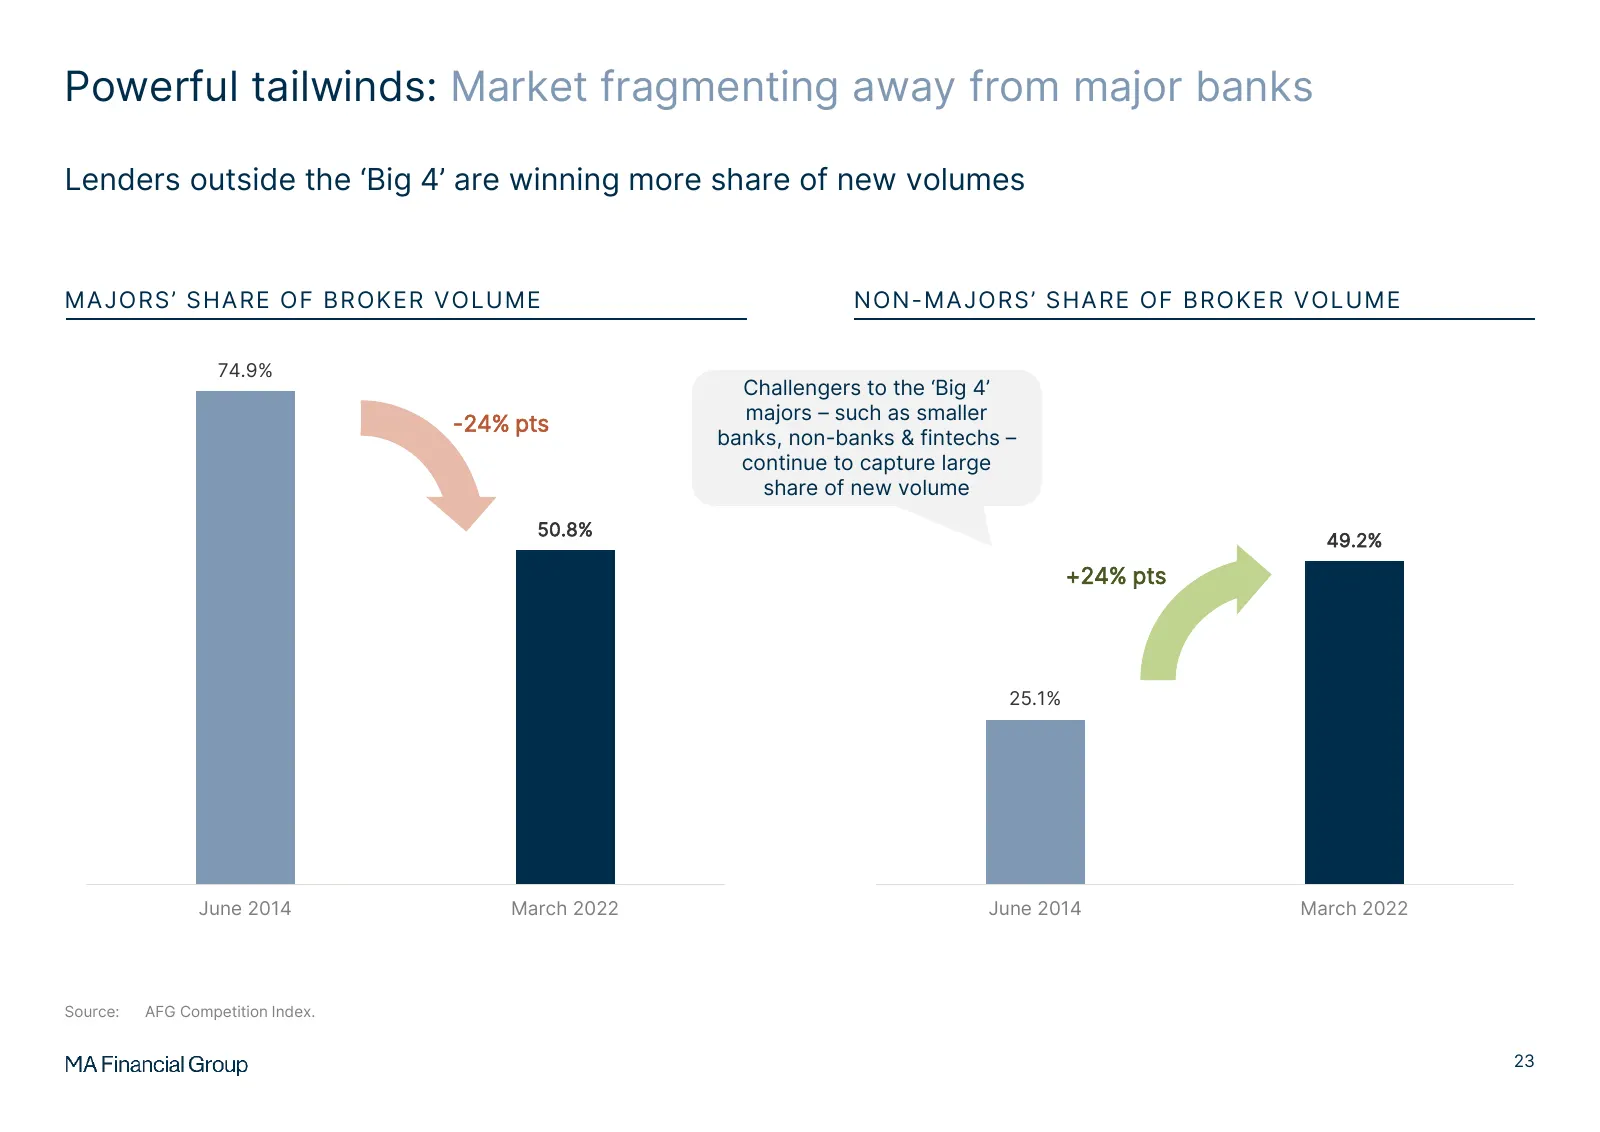
Slide 25: Powerful tailwinds: Market fragmenting away from major banks
Powerful tailwinds: Market fragmenting away from major banks Lenders outside the ‘Big 4’ are winning more share of new volumes MAJORS’ SHARE OF BROKER VOLUME NON-MAJORS’ SHARE OF BROKER VOLUME 74.9% Challengers to the ‘Big 4’ majors – such as smaller -24% pts banks, non-banks & fintechs – continue t
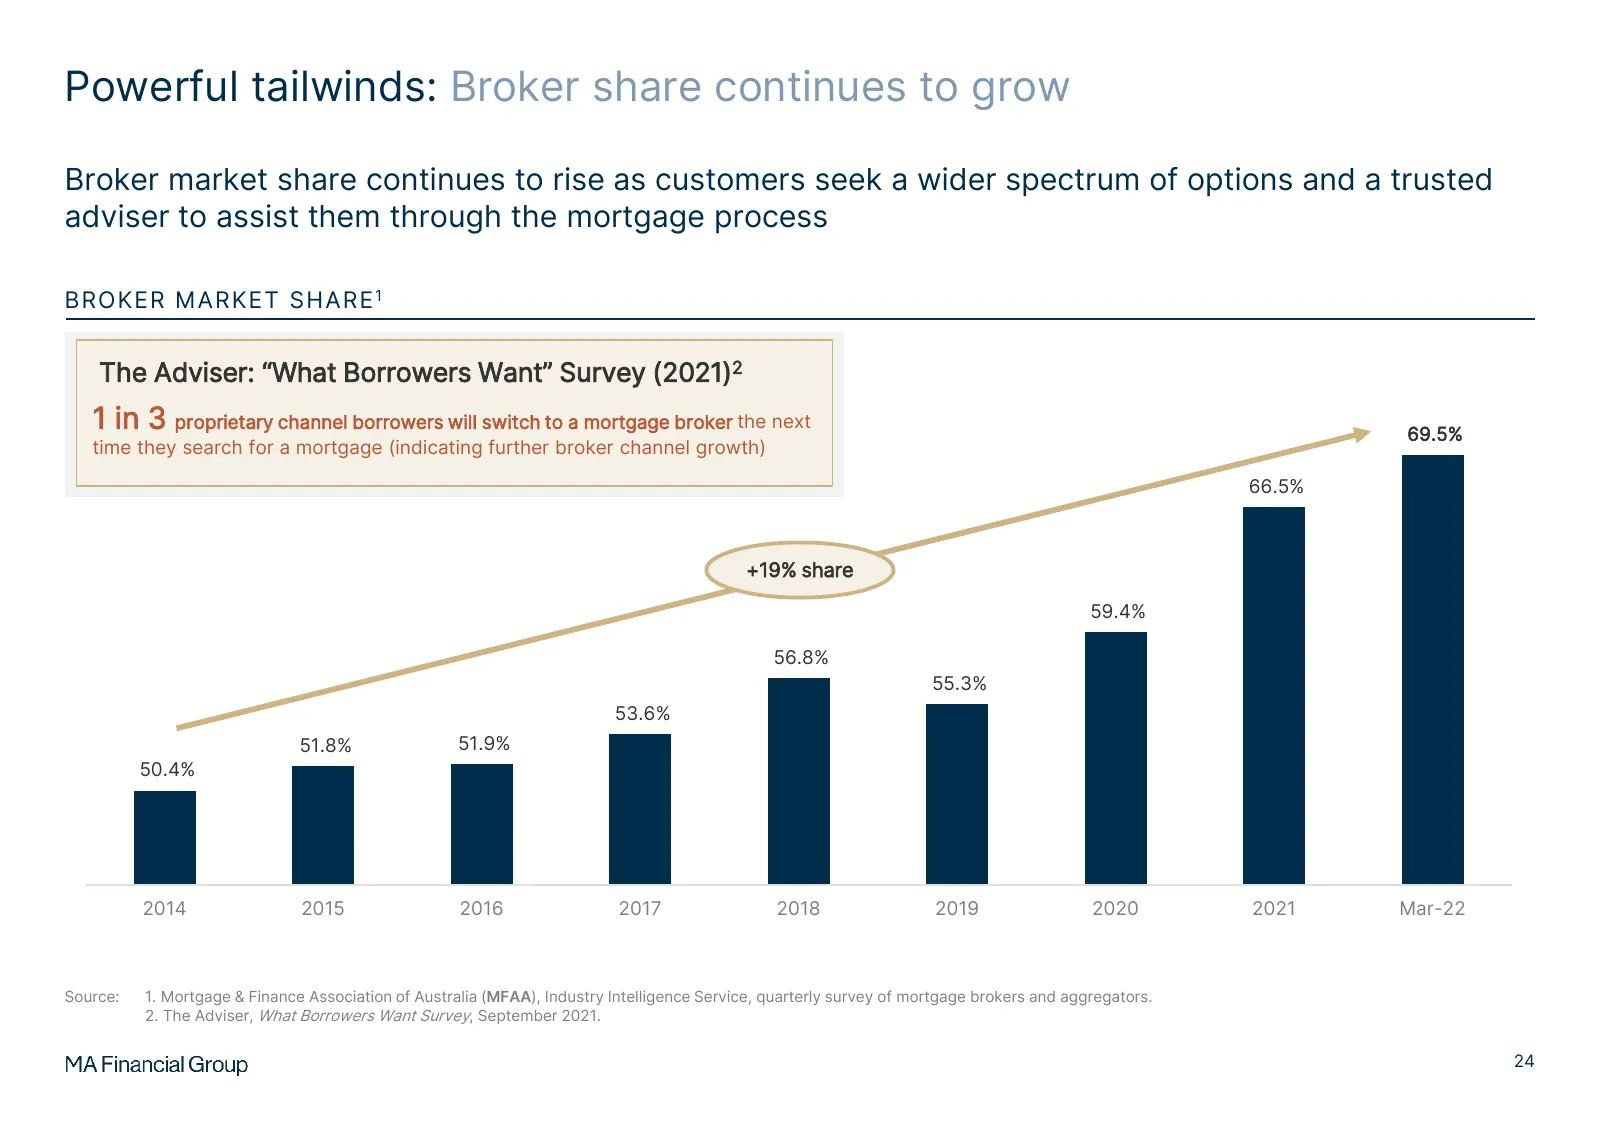
Slide 26: Powerful tailwinds: Broker share continues to grow
Powerful tailwinds: Broker share continues to grow Broker market share continues to rise as customers seek a wider spectrum of options and a trusted adviser to assist them through the mortgage process BROKER MARKET SHARE 1 The Adviser: “What Borrowers Want” Survey (2021)2 1 in 3 proprietary channel
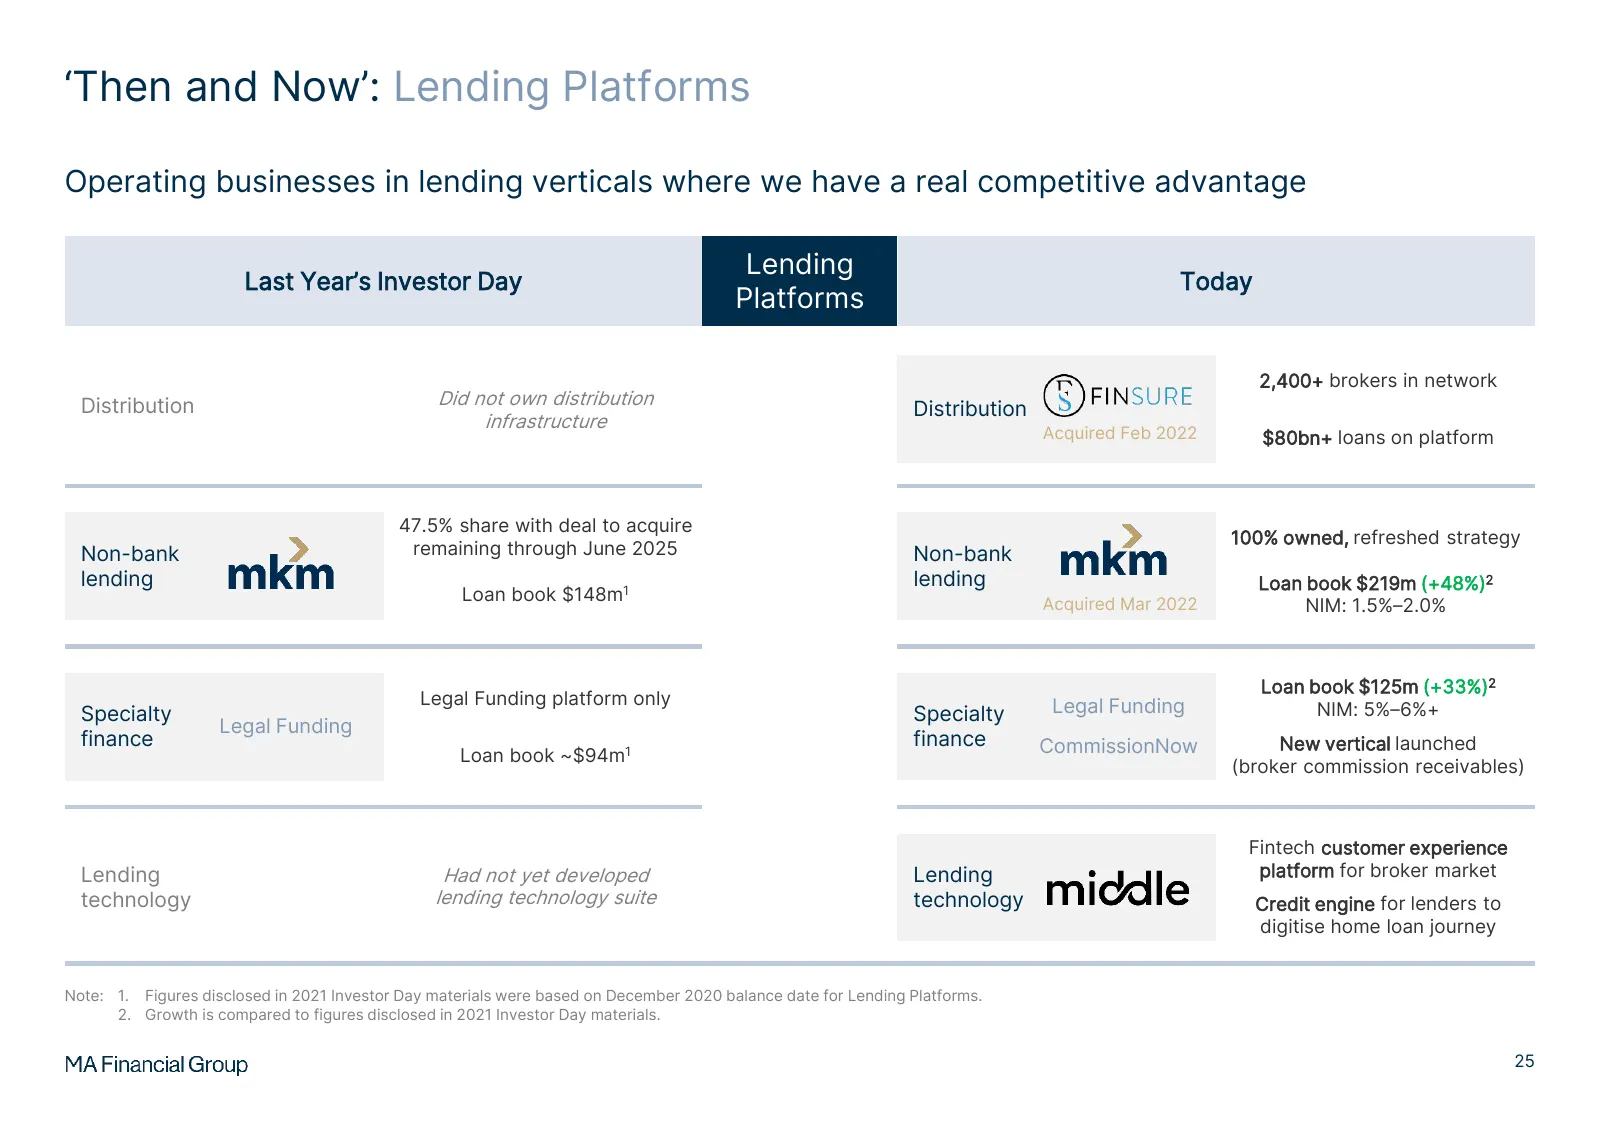
Slide 27: 'Then and Now': Lending Platforms
‘Then and Now’: Lending Platforms Operating businesses in lending verticals where we have a real competitive advantage Lending Last Year’s Investor Day Today Platforms 2,400+ brokers in network Distribution Did not own distribution Distribution infrastructure Acquired Feb 2022 $80bn+ loans on platfo
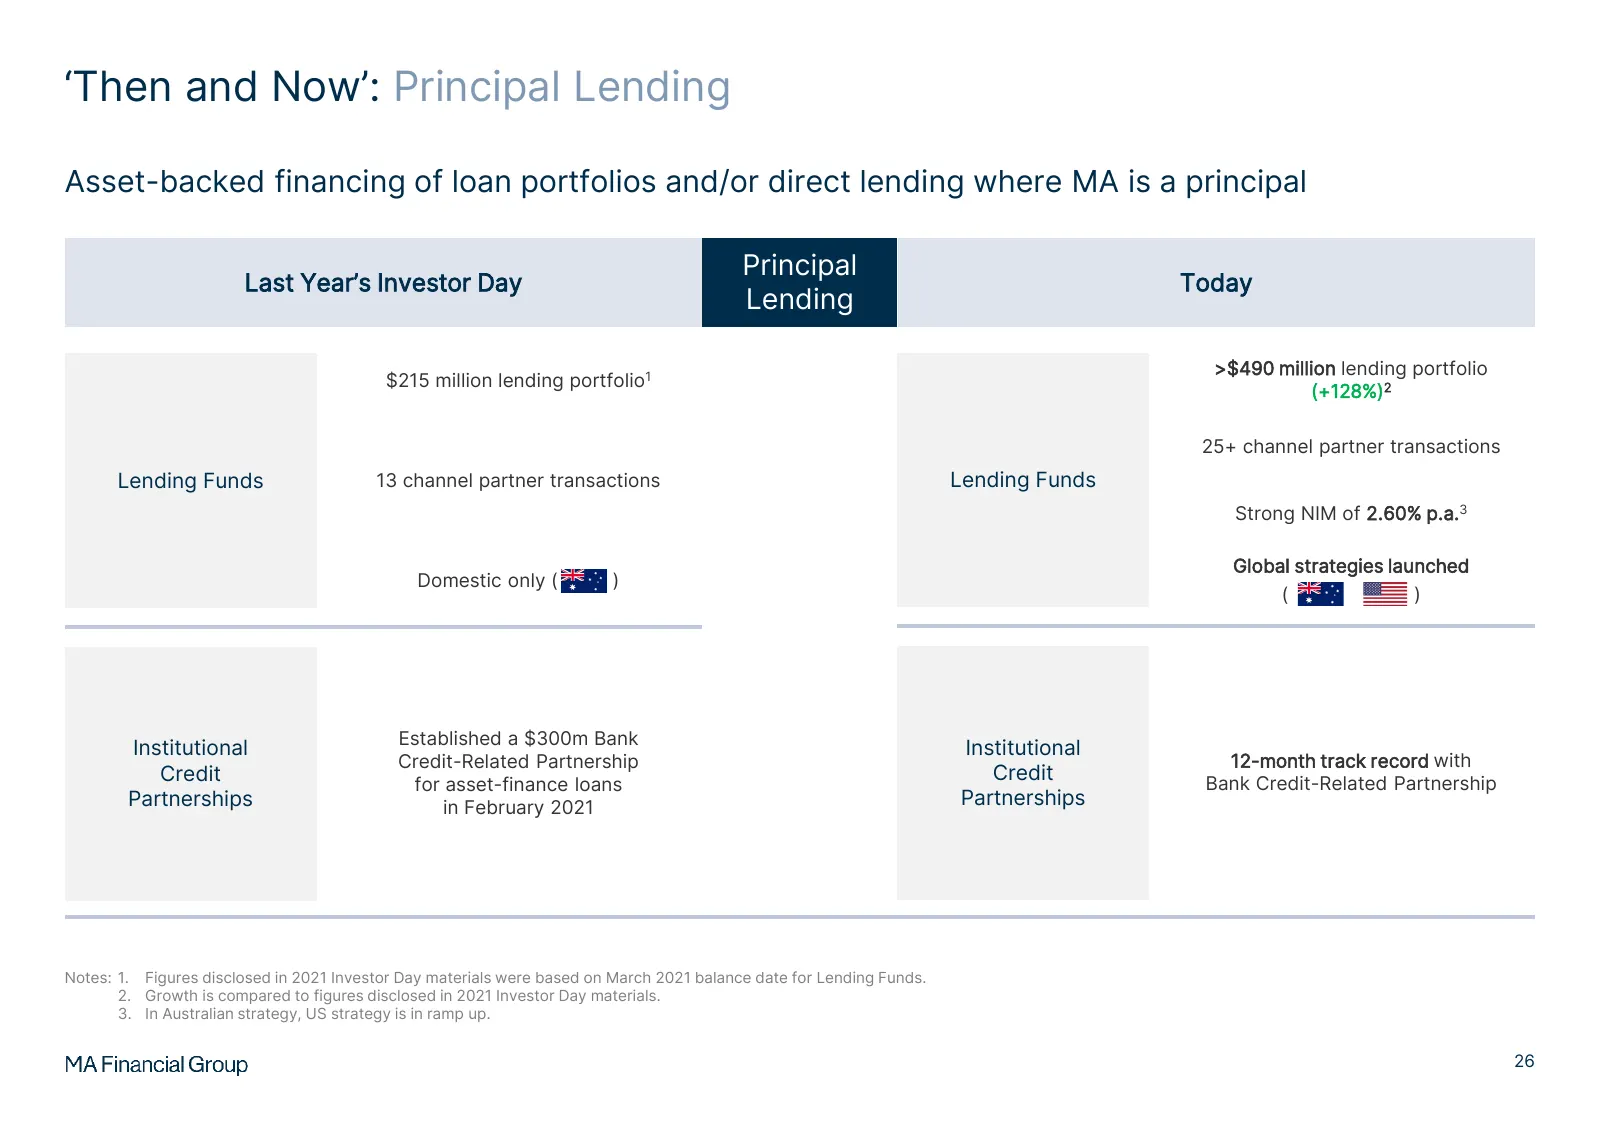
Slide 28: 'Then and Now': Principal Lending
‘Then and Now’: Principal Lending Asset-backed financing of loan portfolios and/or direct lending where MA is a principal Principal Last Year’s Investor Day Today Lending >$490 million lending portfolio $215 million lending portfolio1 (+128%)2 25+ channel partner transactions Lending Funds 13 channe
Slide 29: Lending loan portfolio and invested capital
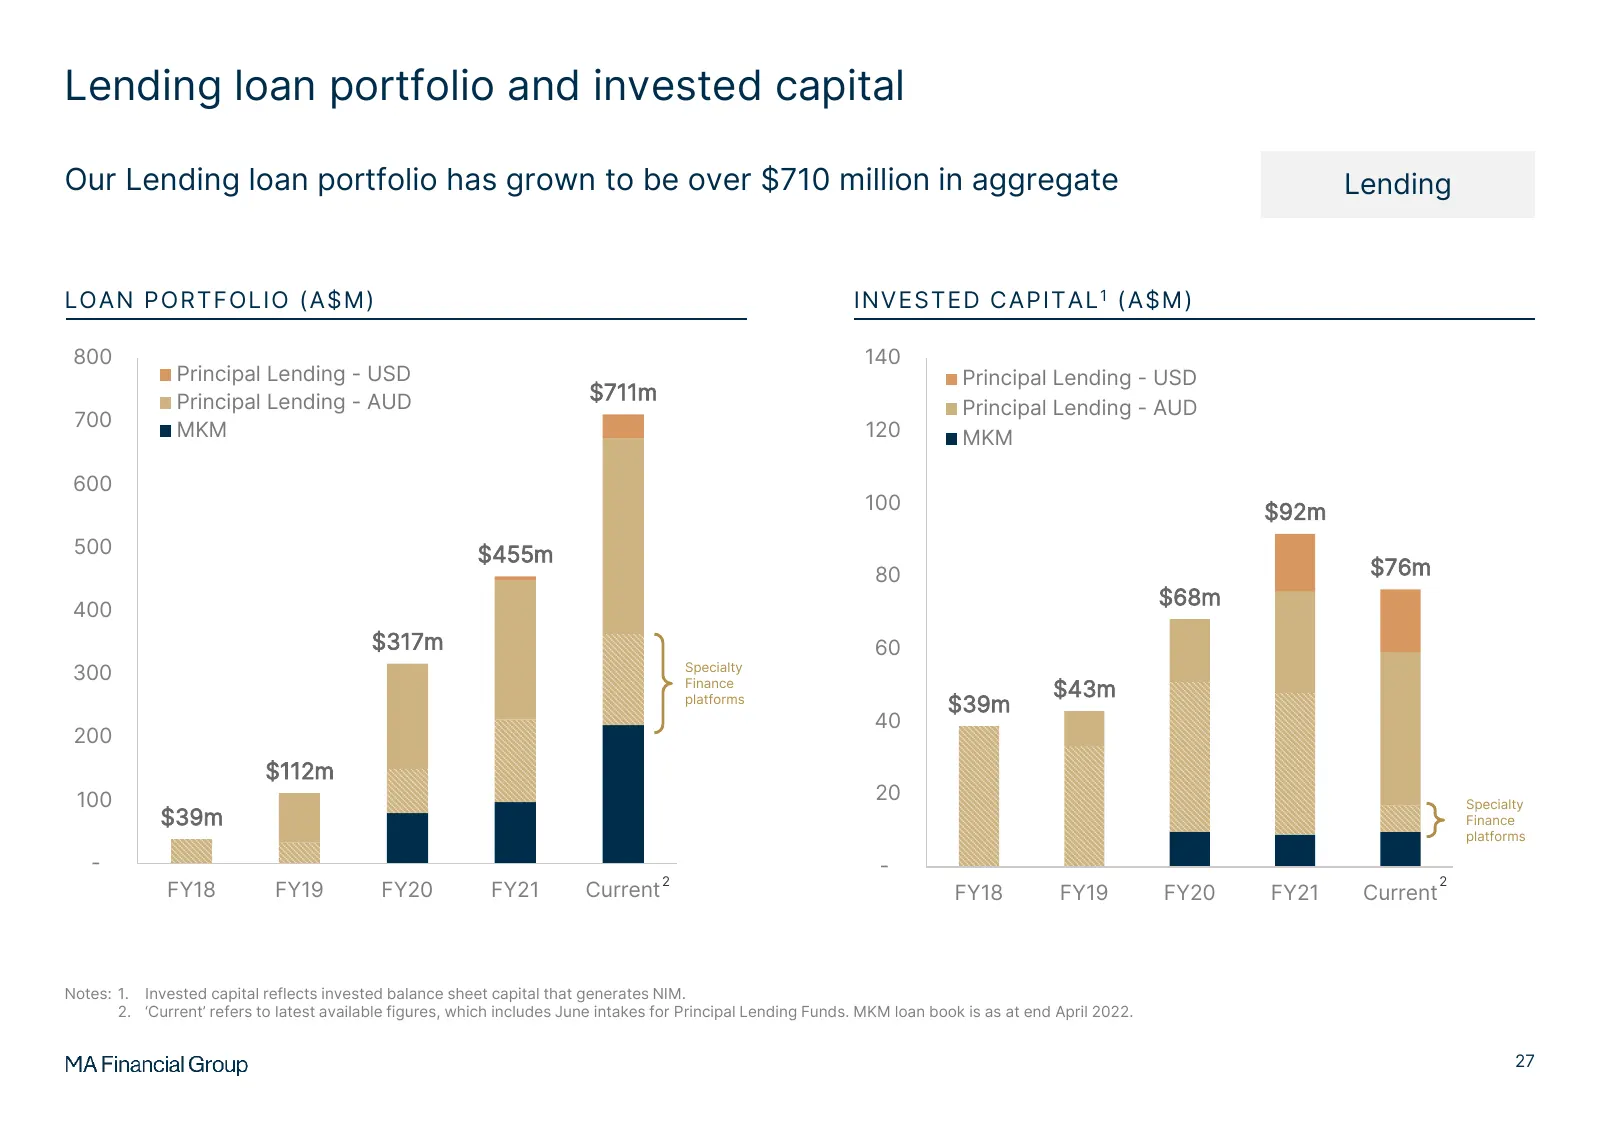
Lending loan portfolio and invested capital Our Lending loan portfolio has grown to be over $710 million in aggregate Lending LOAN PORTFOLIO (A$M) INVESTED CAPITAL 1 (A$M) 800 140 Principal Lending - USD Principal Lending - USD Principal Lending - AUD $711m Principal Lending - AUD 700 MKM 120 MKM 60
Slide 30: Credit Investing AUM
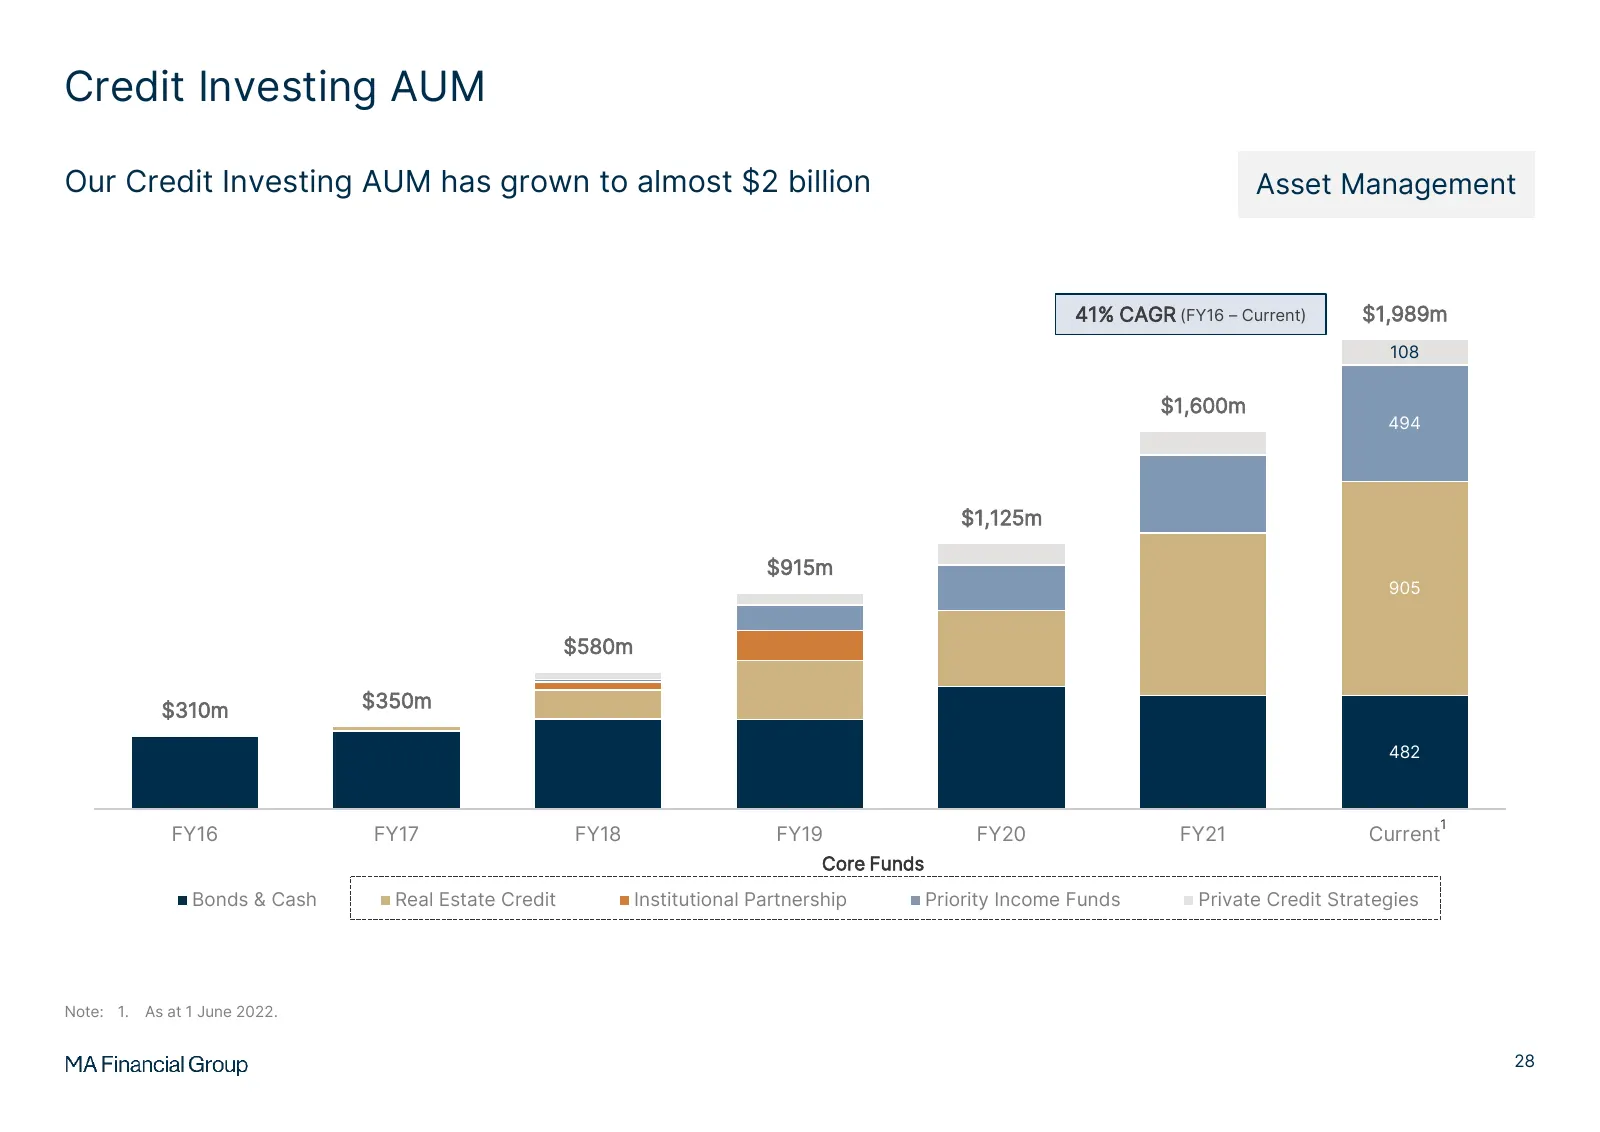
Credit Investing AUM Our Credit Investing AUM has grown to almost $2 billion Asset Management 41% CAGR (FY16 – Current) $1,989m 108 $1,600m 494 100 330 $1,125m 90 $915m 195 905 110 690 $580m 125 320 250 $310m $350m 122 520 480 482 330 383 380 310 1 FY16 FY17 FY18 FY19 FY20 FY21 Current Core Funds Bo
Slide 31: Principal Lending update
O ? Principal Lending update MA Financial Group
Slide 32: Strong growth trajectory in Principal Lending funds
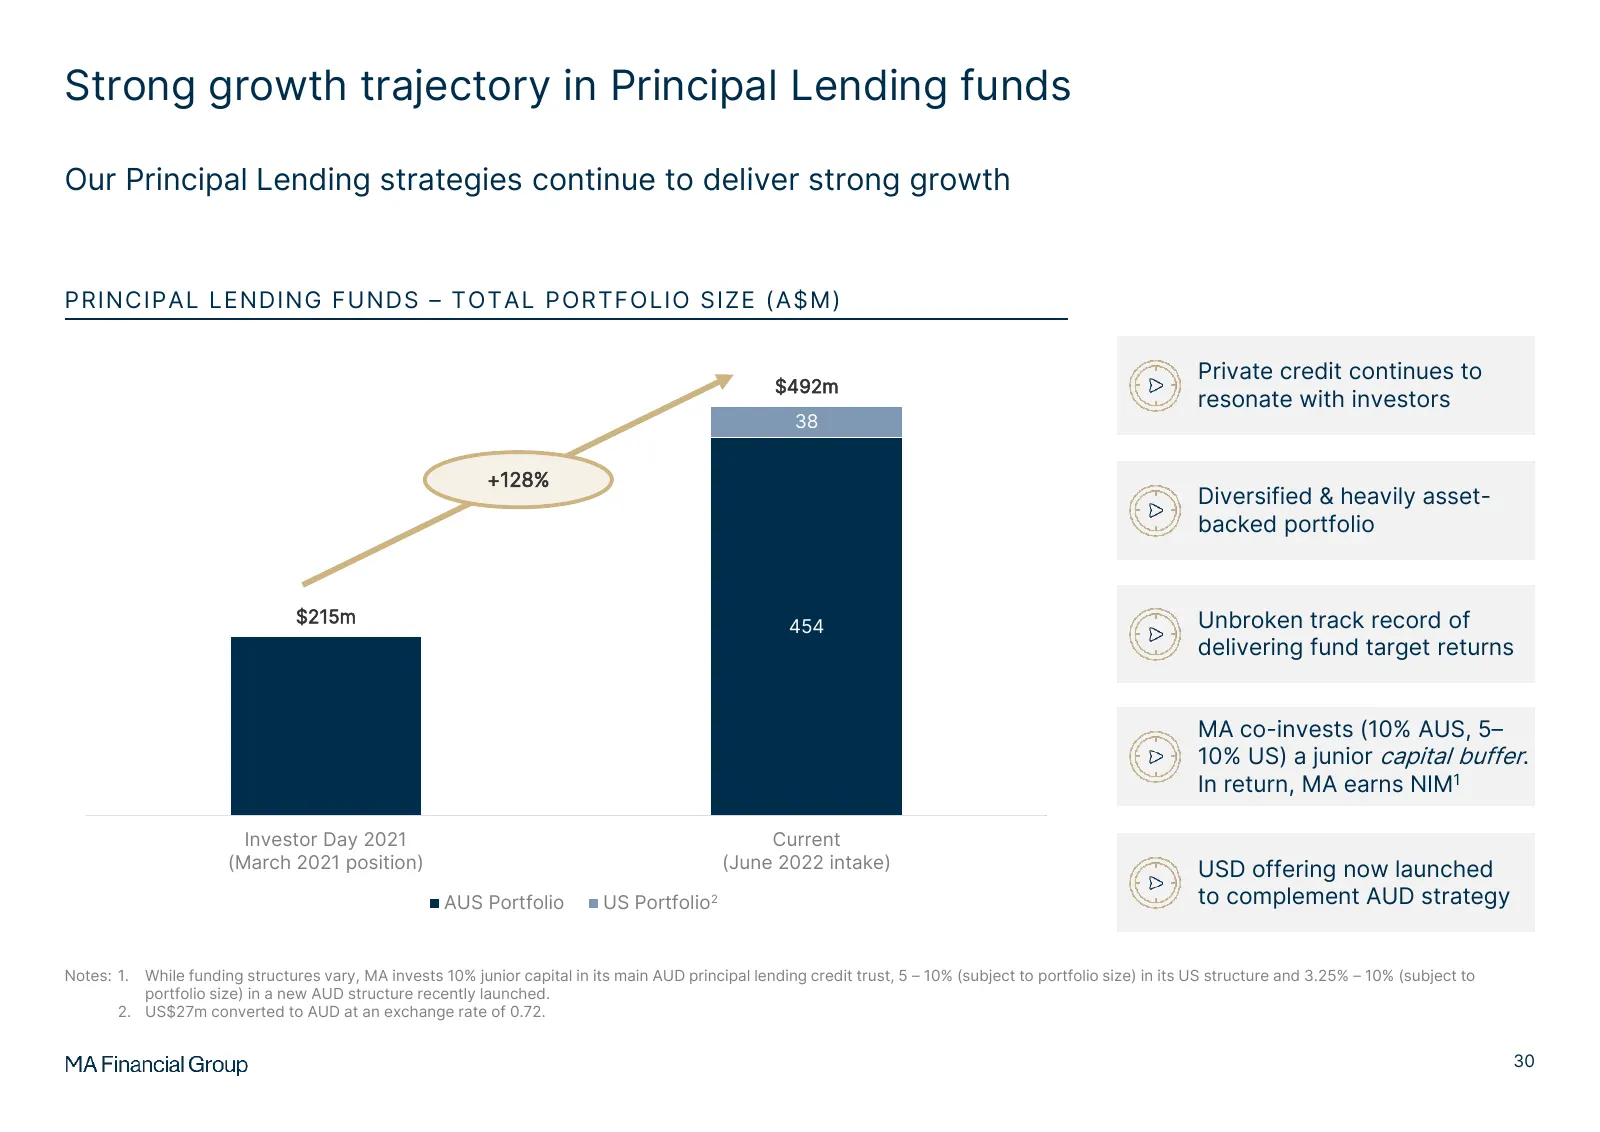
Strong growth trajectory in Principal Lending funds Our Principal Lending strategies continue to deliver strong growth PRINCIPAL LENDING FUNDS – TOTAL PORTFOLIO SIZE (A$M) Private credit continues to $492m resonate with investors 38 +128% Diversified & heavily asset- backed portfolio $215m Unbroken
Slide 33: High quality loan portfolios
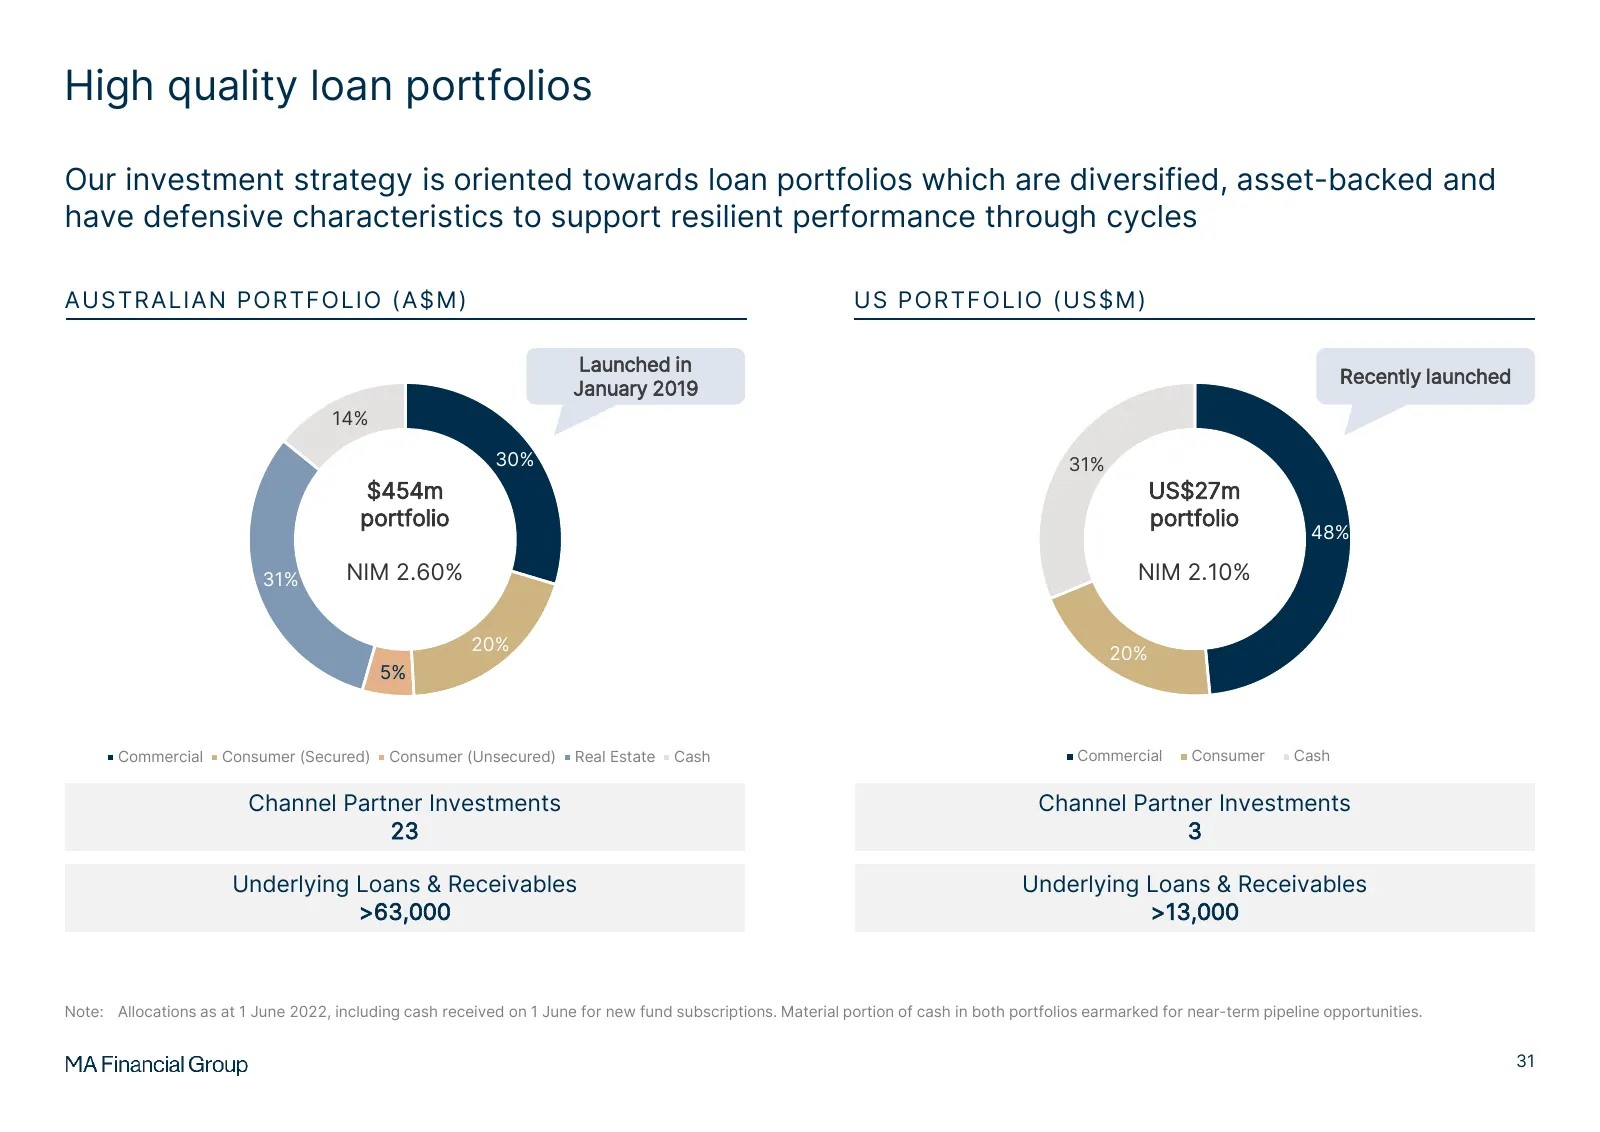
High quality loan portfolios Our investment strategy is oriented towards loan portfolios which are diversified, asset-backed and have defensive characteristics to support resilient performance through cycles AUSTRALIAN PORTFOLIO (A$M) US PORTFOLIO (US$M) Launched in Recently launched January 2019 14
Slide 34: Disciplined approach to lending
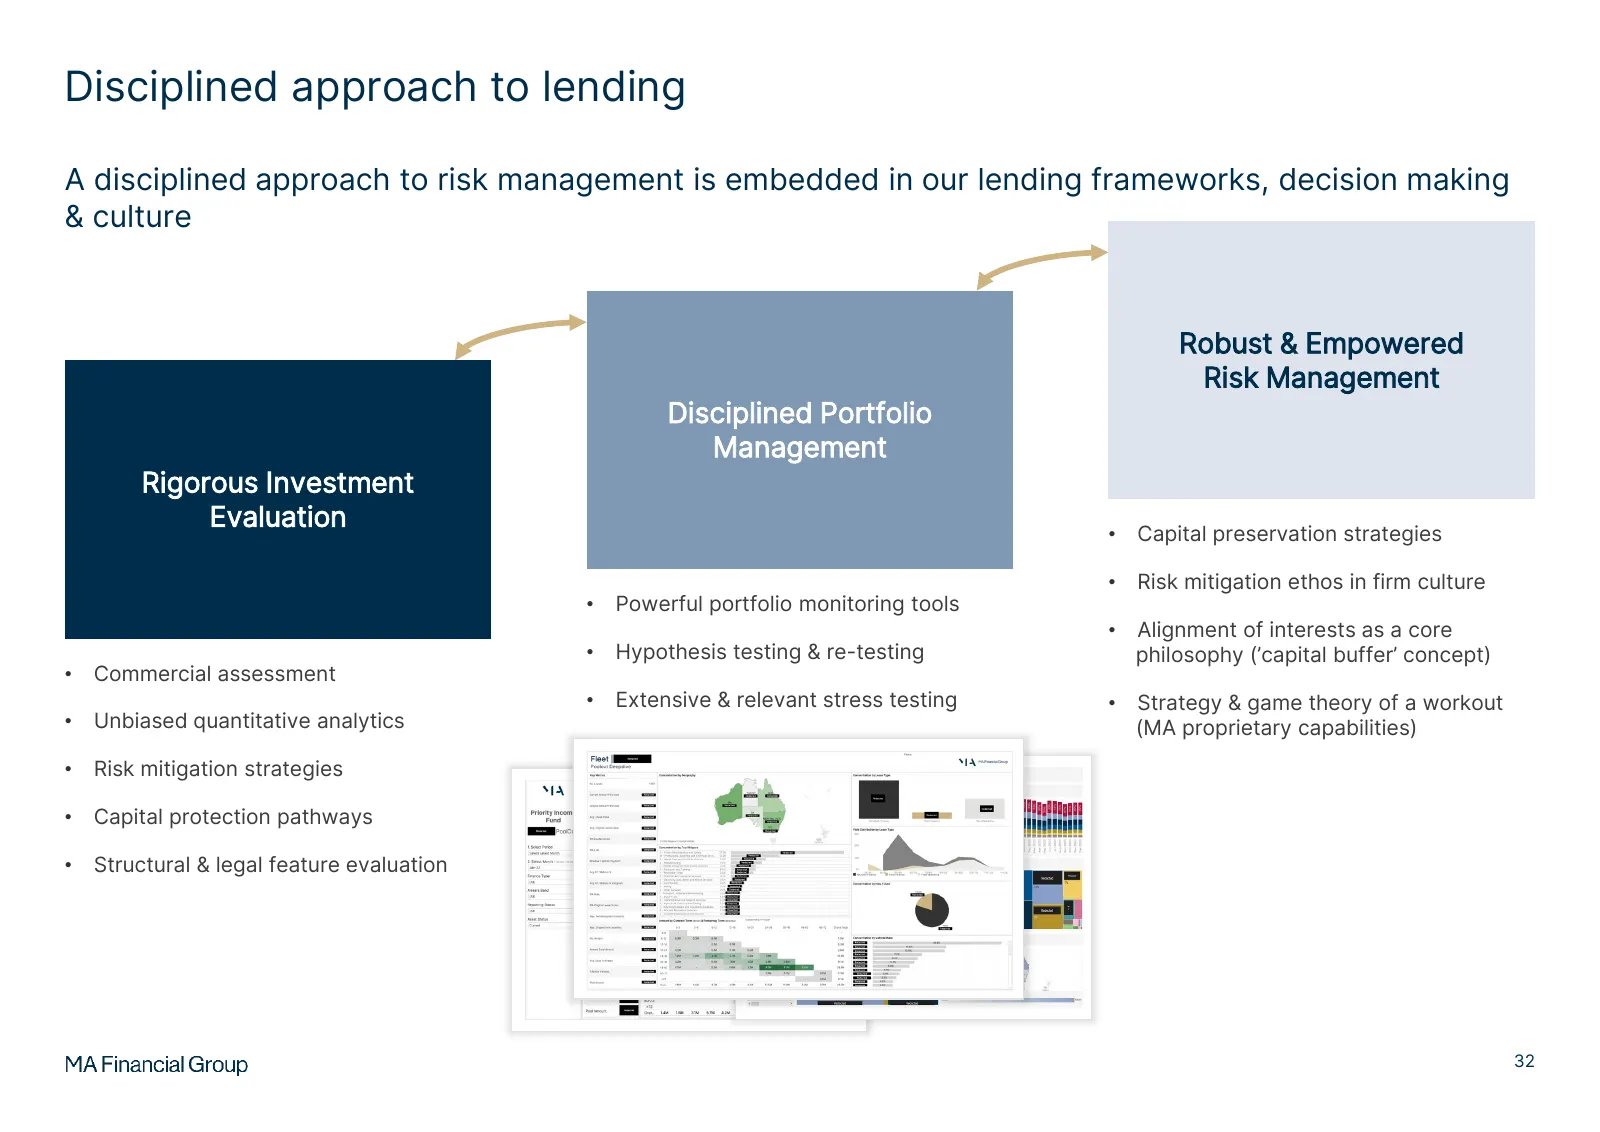
Disciplined approach to lending A disciplined approach to risk management is embedded in our lending frameworks, decision making & culture Robust & Empowered Risk Management Disciplined Portfolio Management Rigorous Investment Evaluation • Capital preservation strategies • Risk mitigation ethos in f

Slide 35: Finsure opportunity
O 3 Finsure opportunity MA Financial Group
Slide 36: Strategically valuable infrastructure
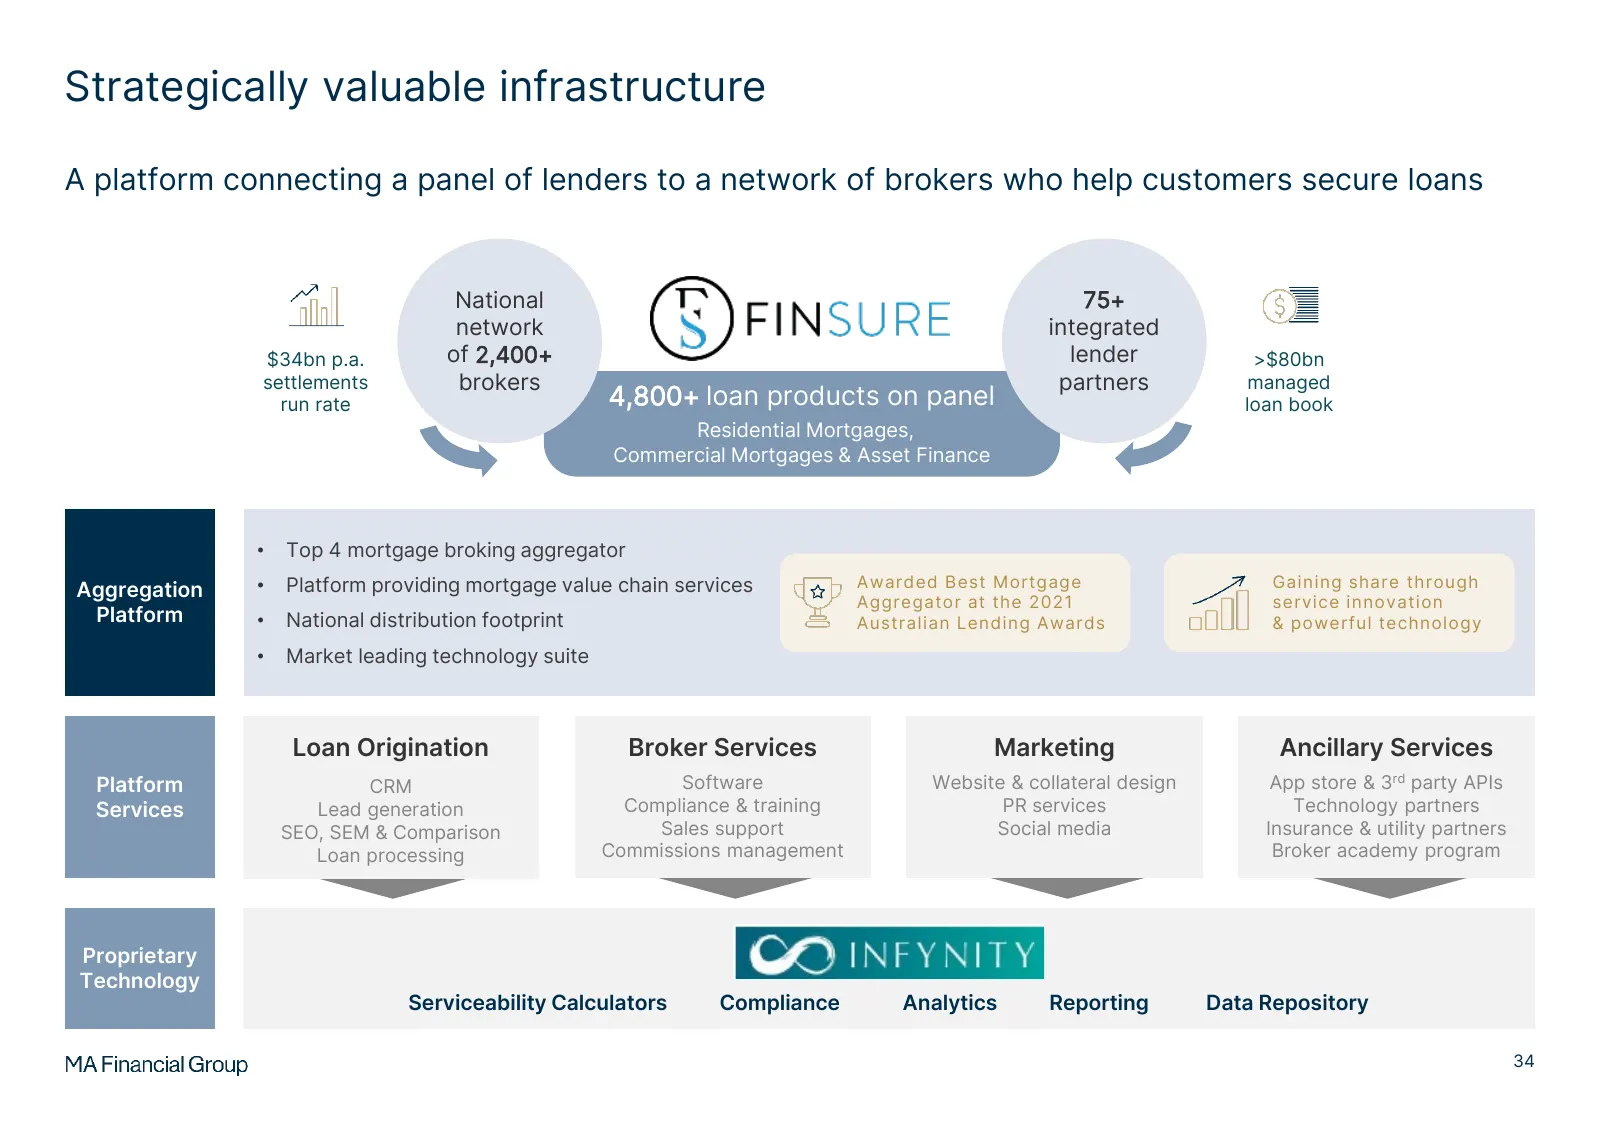
Strategically valuable infrastructure A platform connecting a panel of lenders to a network of brokers who help customers secure loans National 75+ network integrated $34bn p.a. of 2,400+ lender >$80bn settlements brokers partners managed run rate 4,800+ loan products on panel loan book Residential
Slide 37: Strong market position
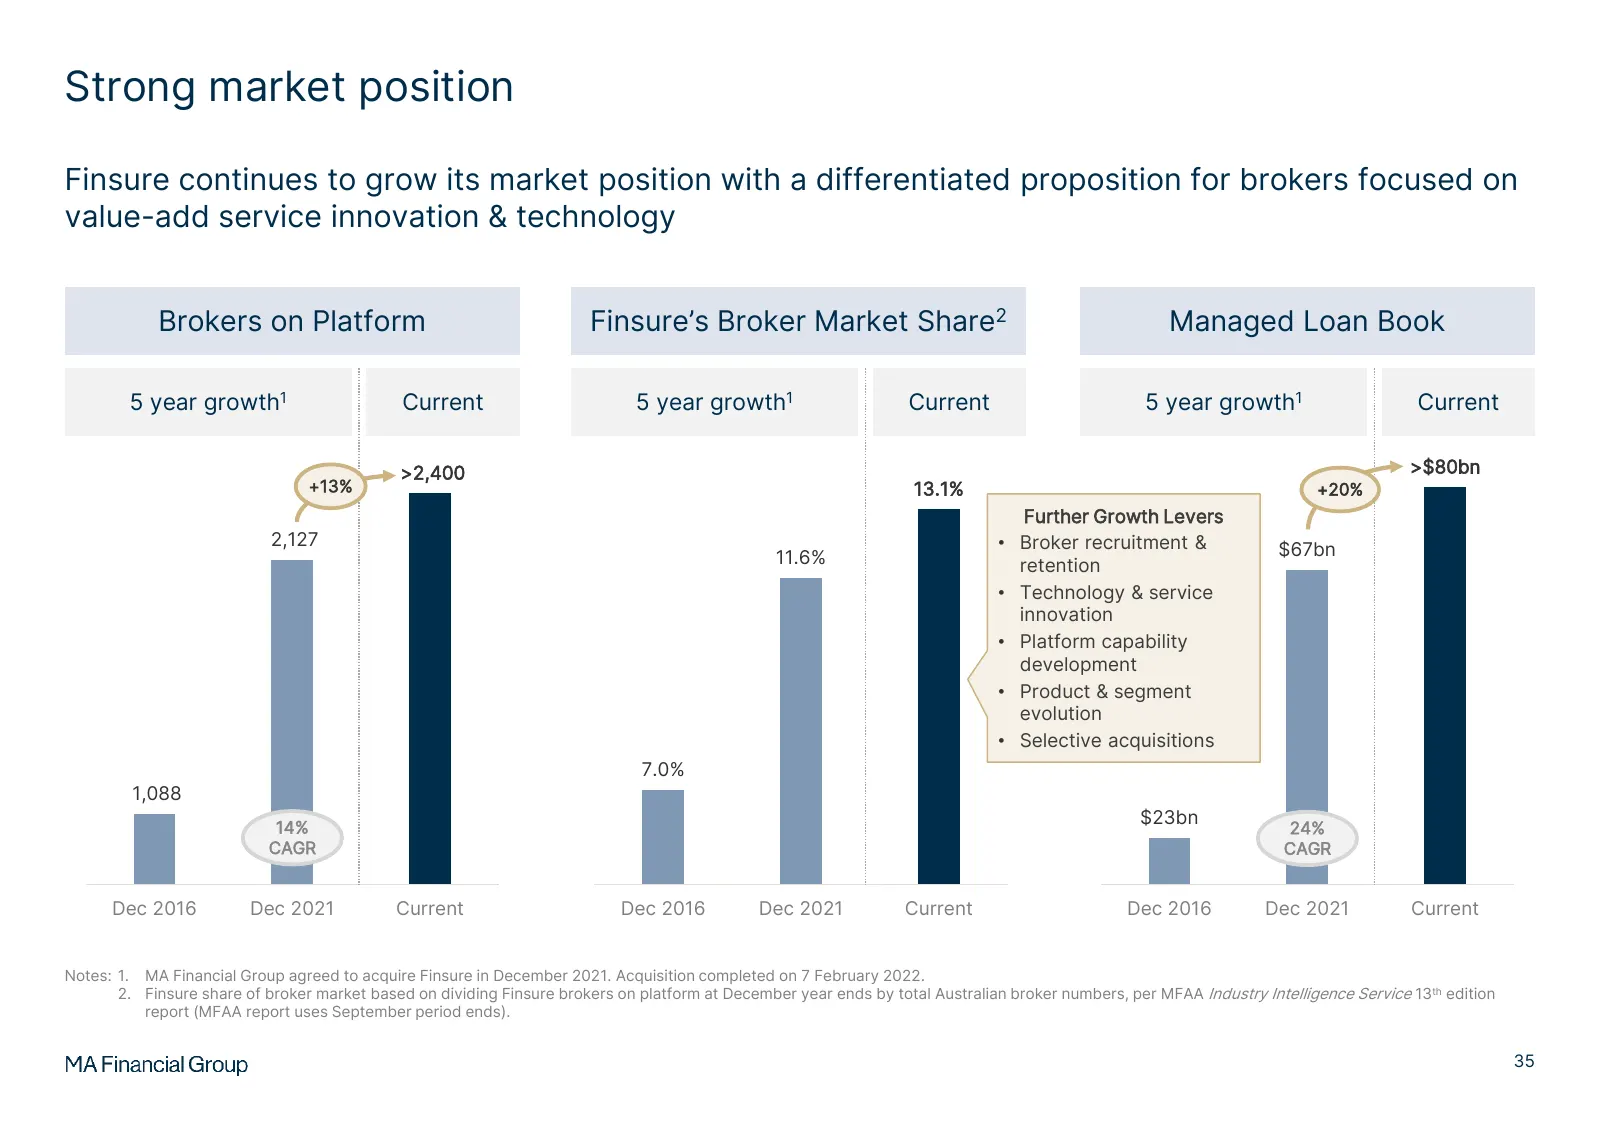
Strong market position Finsure continues to grow its market position with a differentiated proposition for brokers focused on value-add service innovation & technology Brokers on Platform Finsure’s Broker Market Share2 Managed Loan Book 5 year growth1 Current 5 year growth1 Current 5 year growth1 Cu
Slide 38: Lending ecosystem opportunities
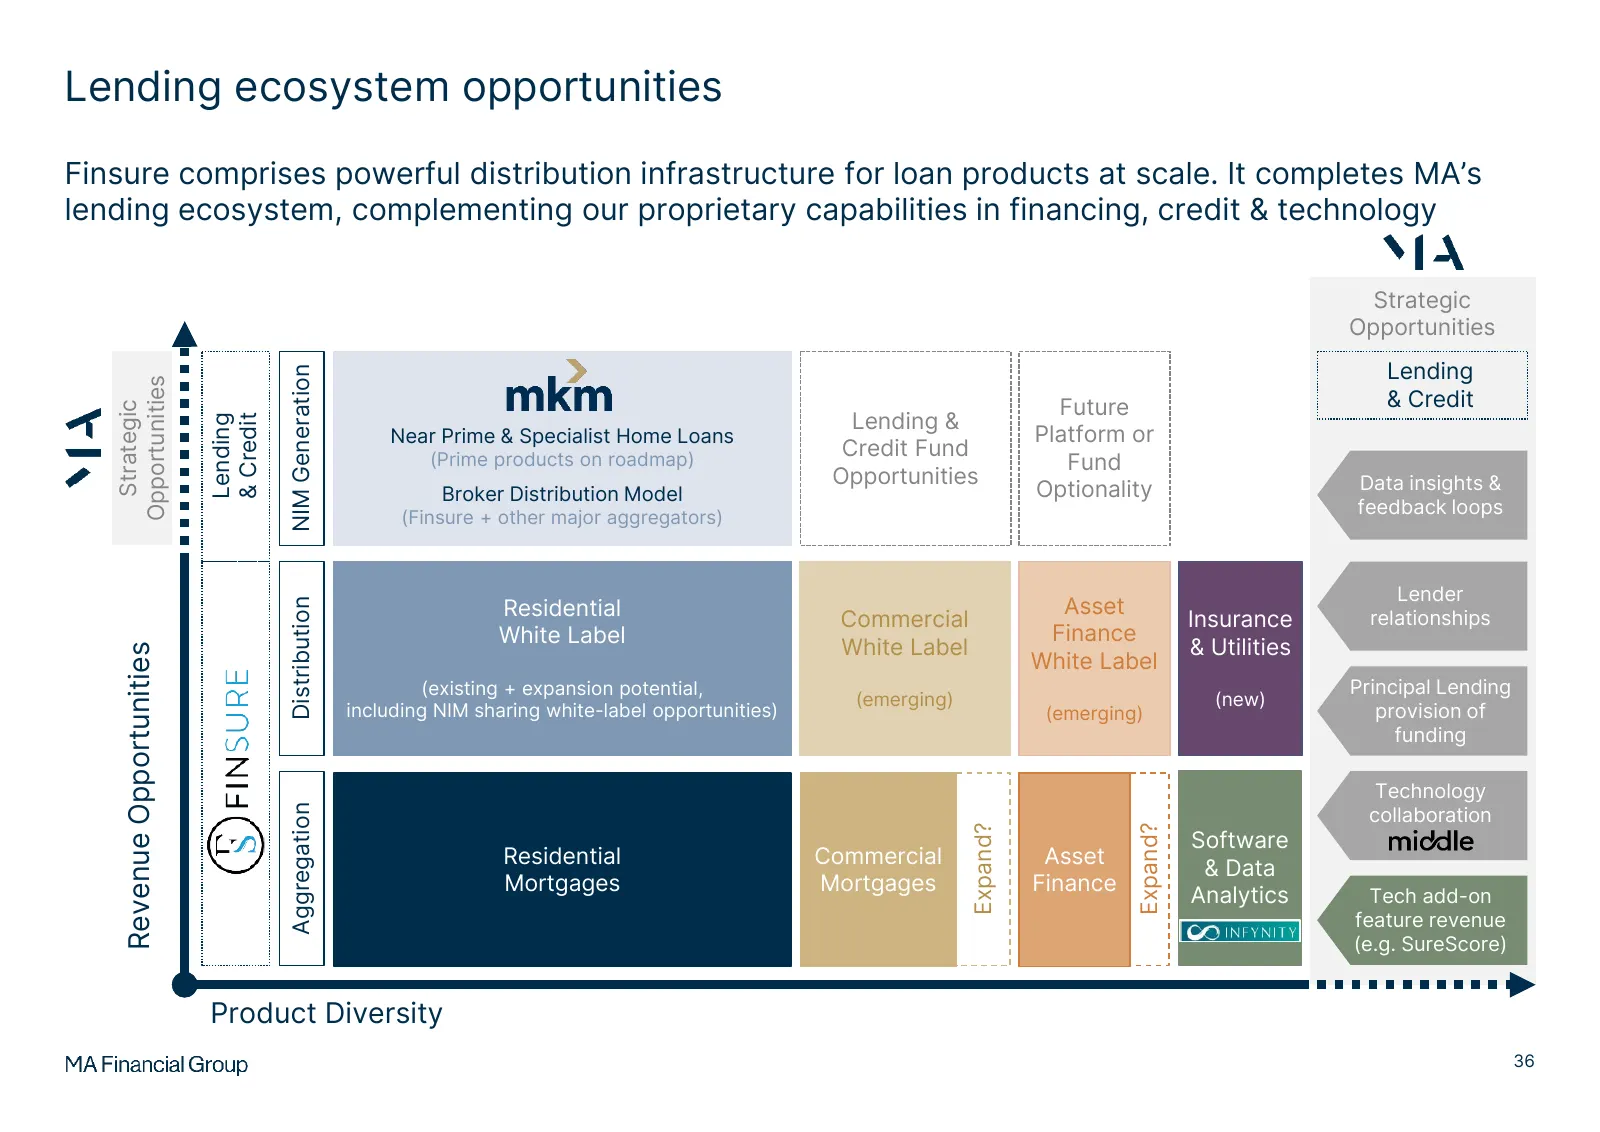
Lending ecosystem opportunities Finsure comprises powerful distribution infrastructure for loan products at scale. It completes MA’s lending ecosystem, complementing our proprietary capabilities in financing, credit & technology Strategic Opportunities Lending NIM Generation Opportunities Future & C
Slide 39: Select strategic initiatives
04 Select strategic initiatives
Slide 40: Select strategic initiatives
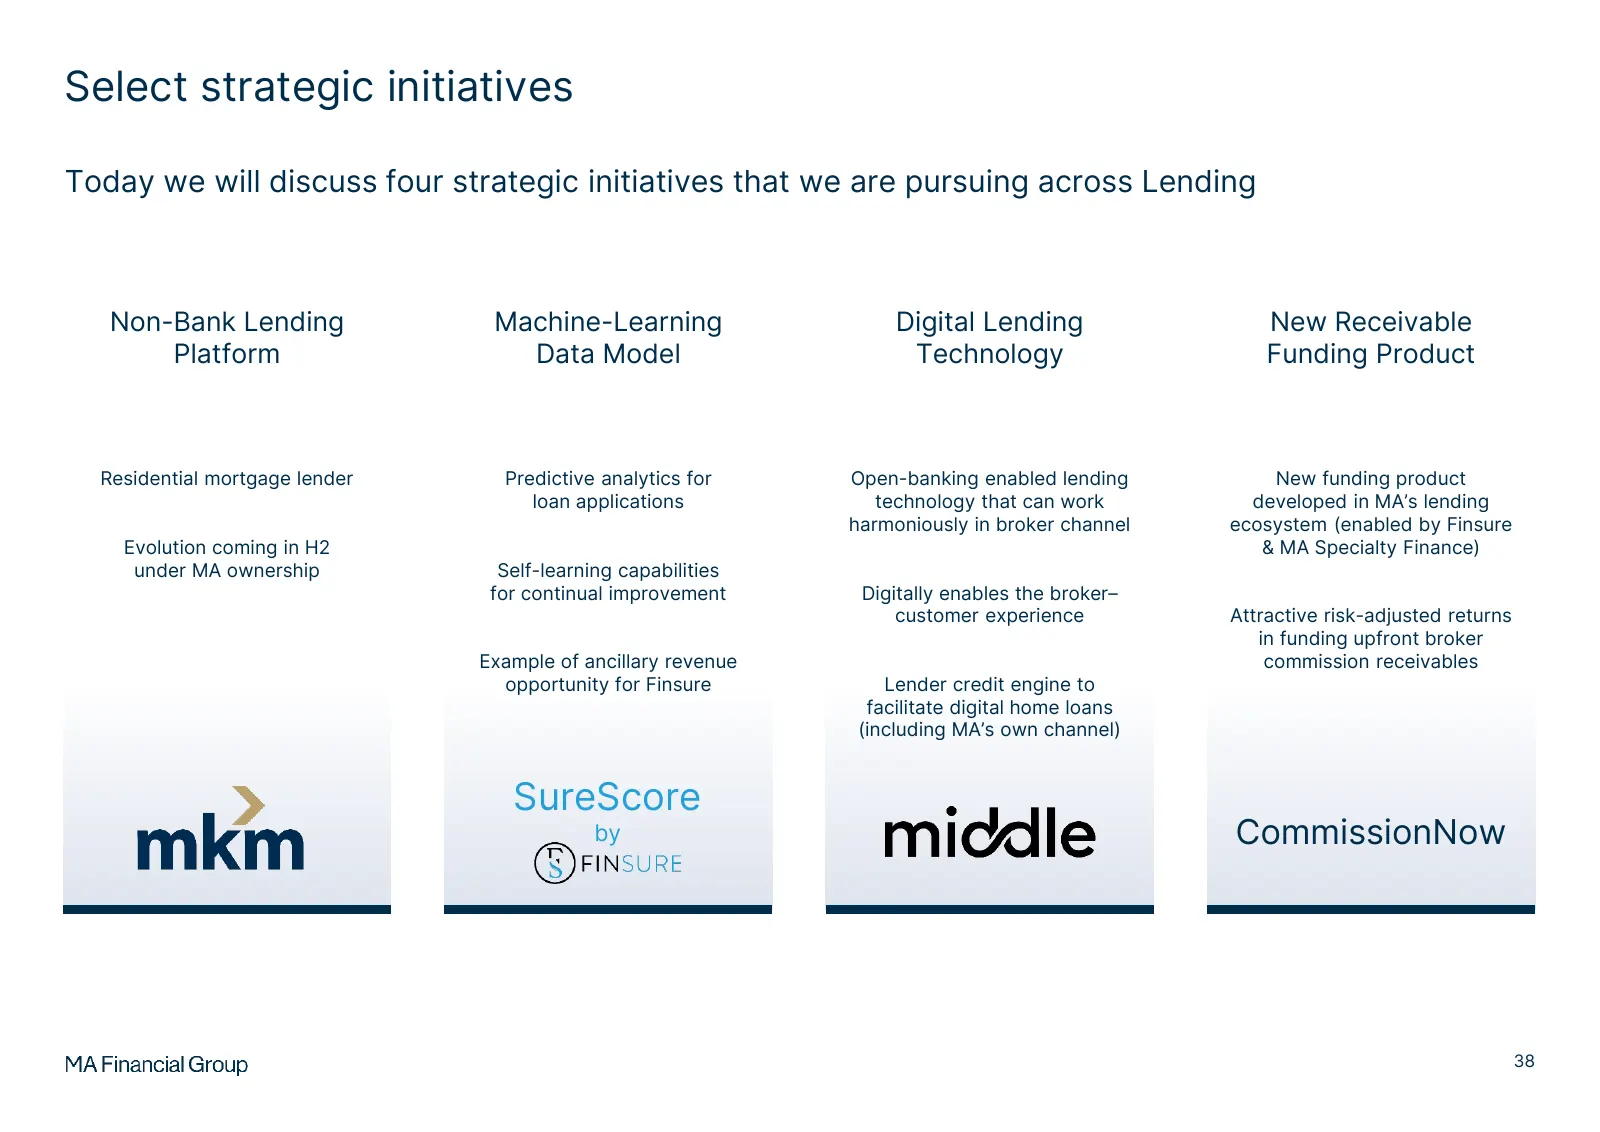
Select strategic initiatives Today we will discuss four strategic initiatives that we are pursuing across Lending Non-Bank Lending Machine-Learning Digital Lending New Receivable Platform Data Model Technology Funding Product Residential mortgage lender Predictive analytics for Open-banking enabled
Slide 41: MKM accelerated acquisition
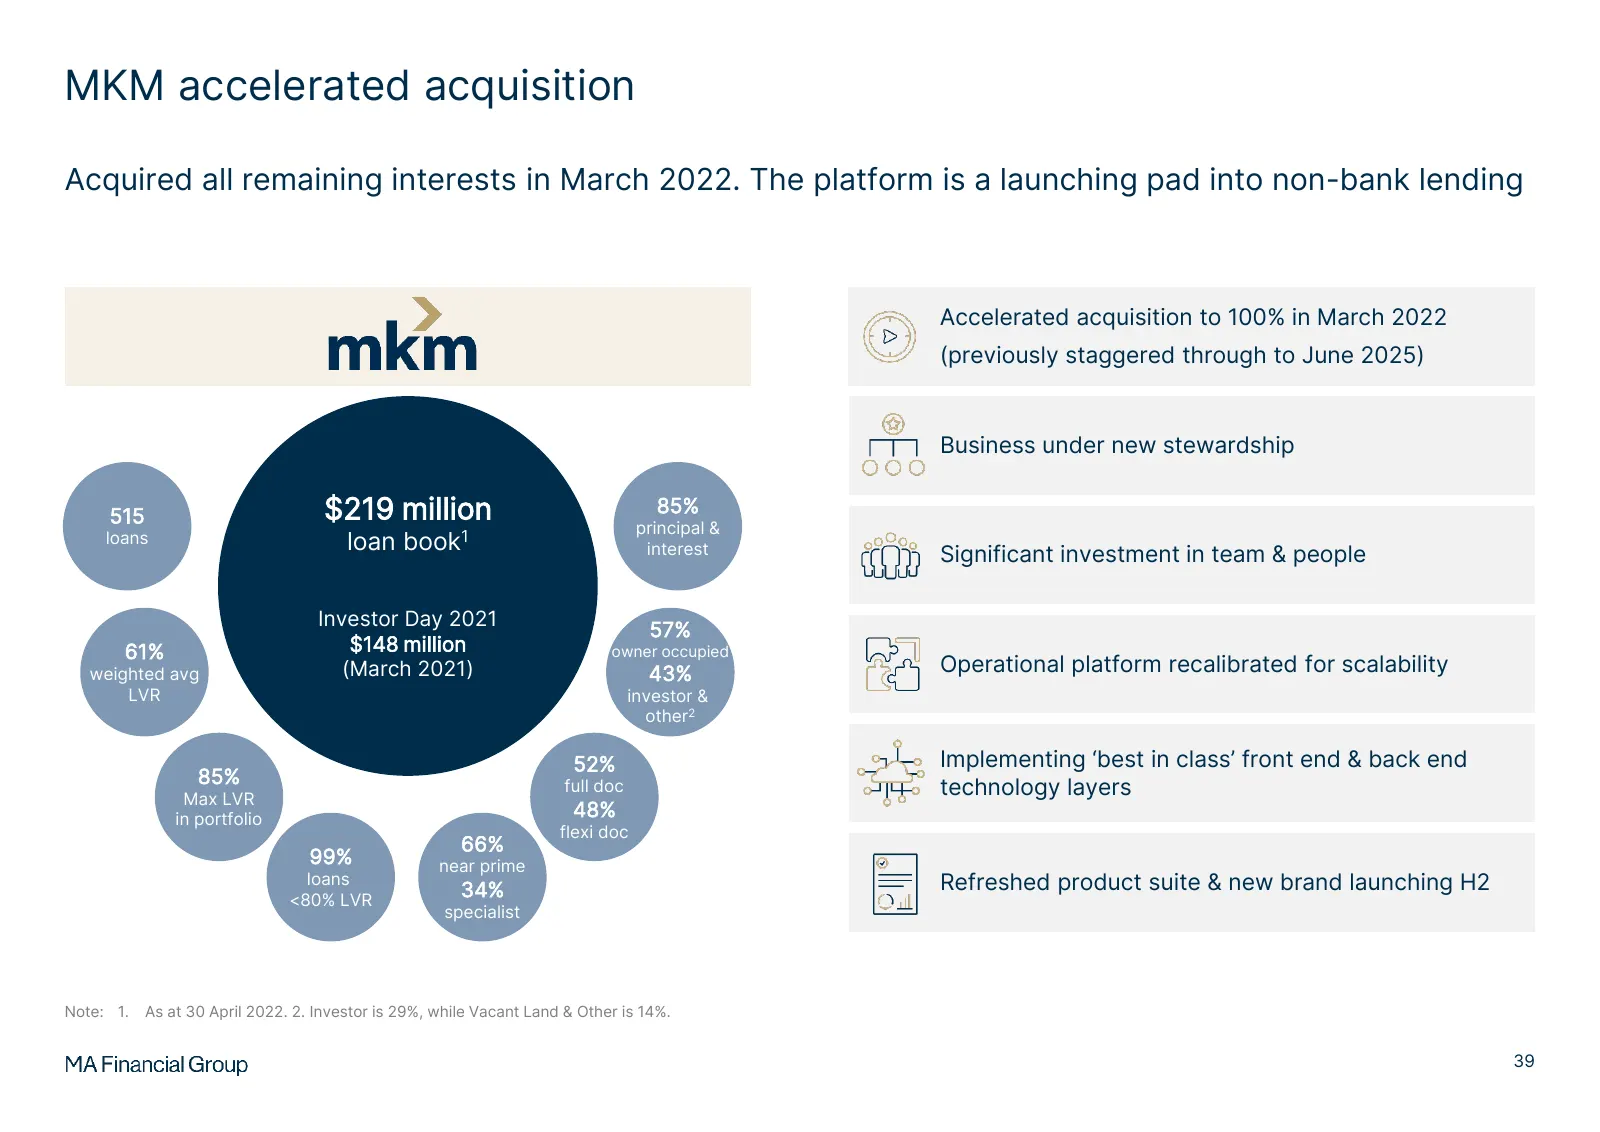
MKM accelerated acquisition Acquired all remaining interests in March 2022. The platform is a launching pad into non-bank lending Accelerated acquisition to 100% in March 2022 (previously staggered through to June 2025) Business under new stewardship 515 $219 million 85% principal & loans loan book1
Slide 42: The future of residential lending at MA
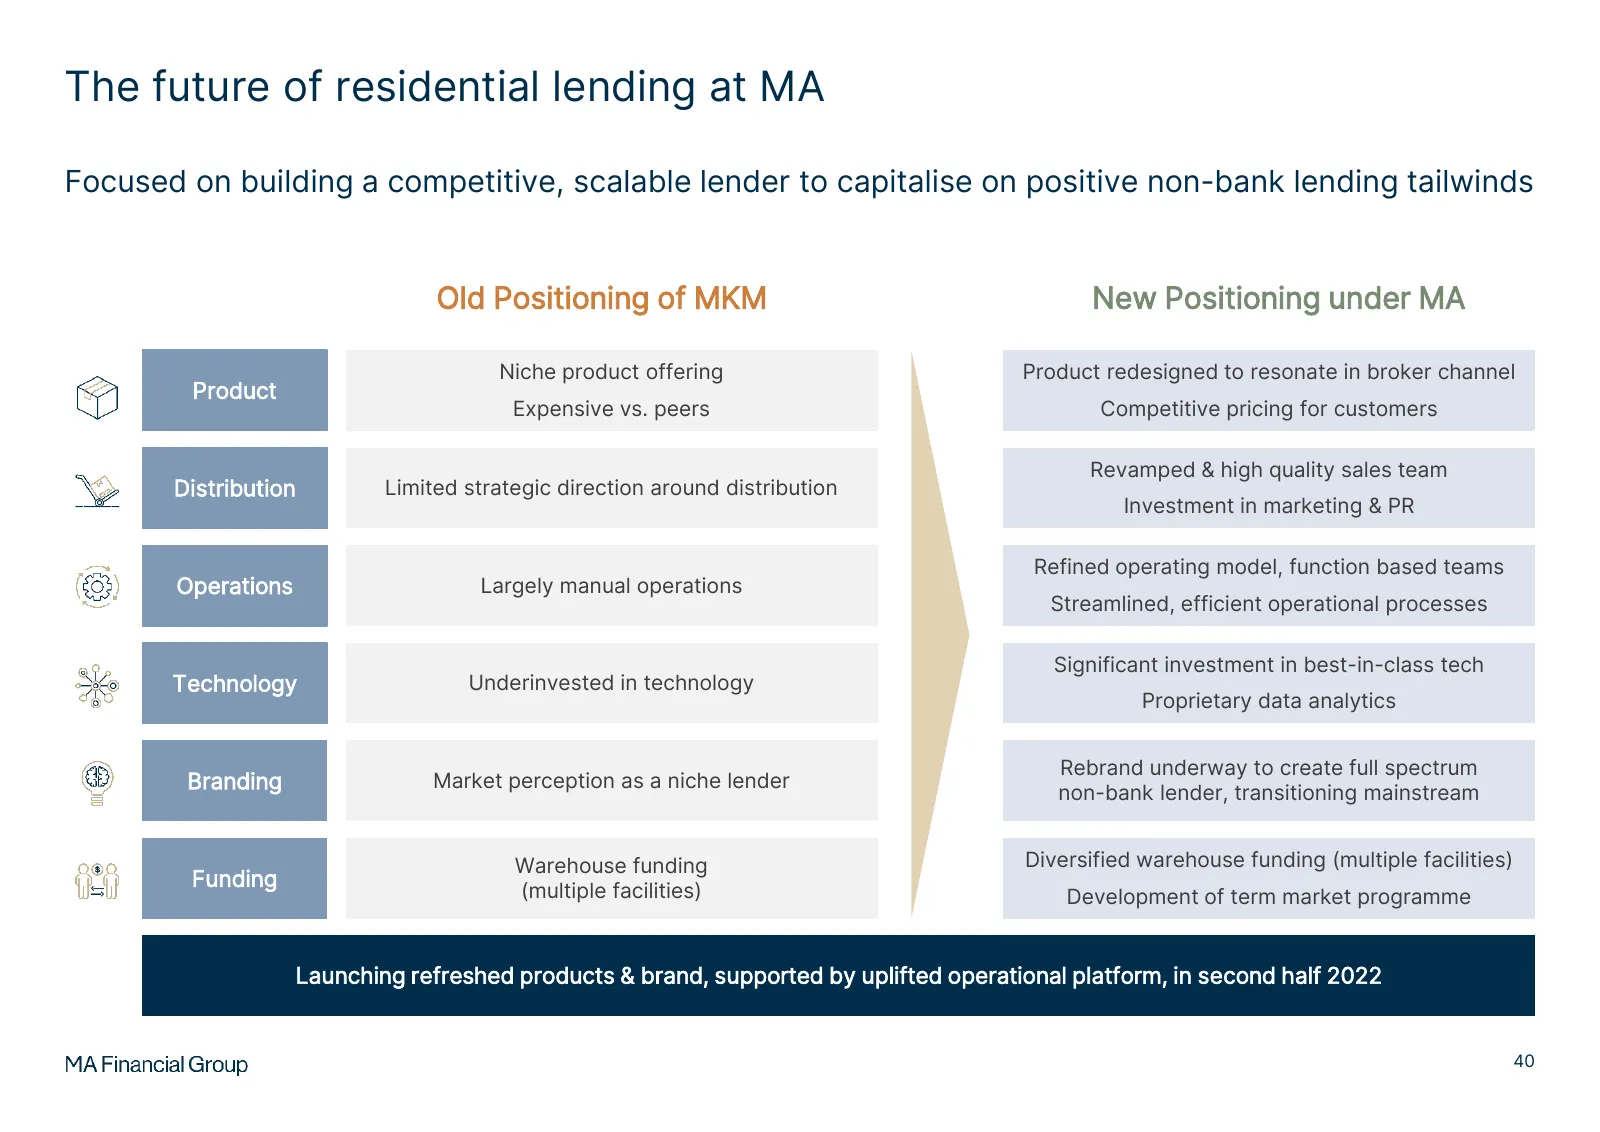
The future of residential lending at MA Focused on building a competitive, scalable lender to capitalise on positive non-bank lending tailwinds Old Positioning of MKM New Positioning under MA Niche product offering Product redesigned to resonate in broker channel Product Expensive vs. peers Competit
Slide 43: SureScore
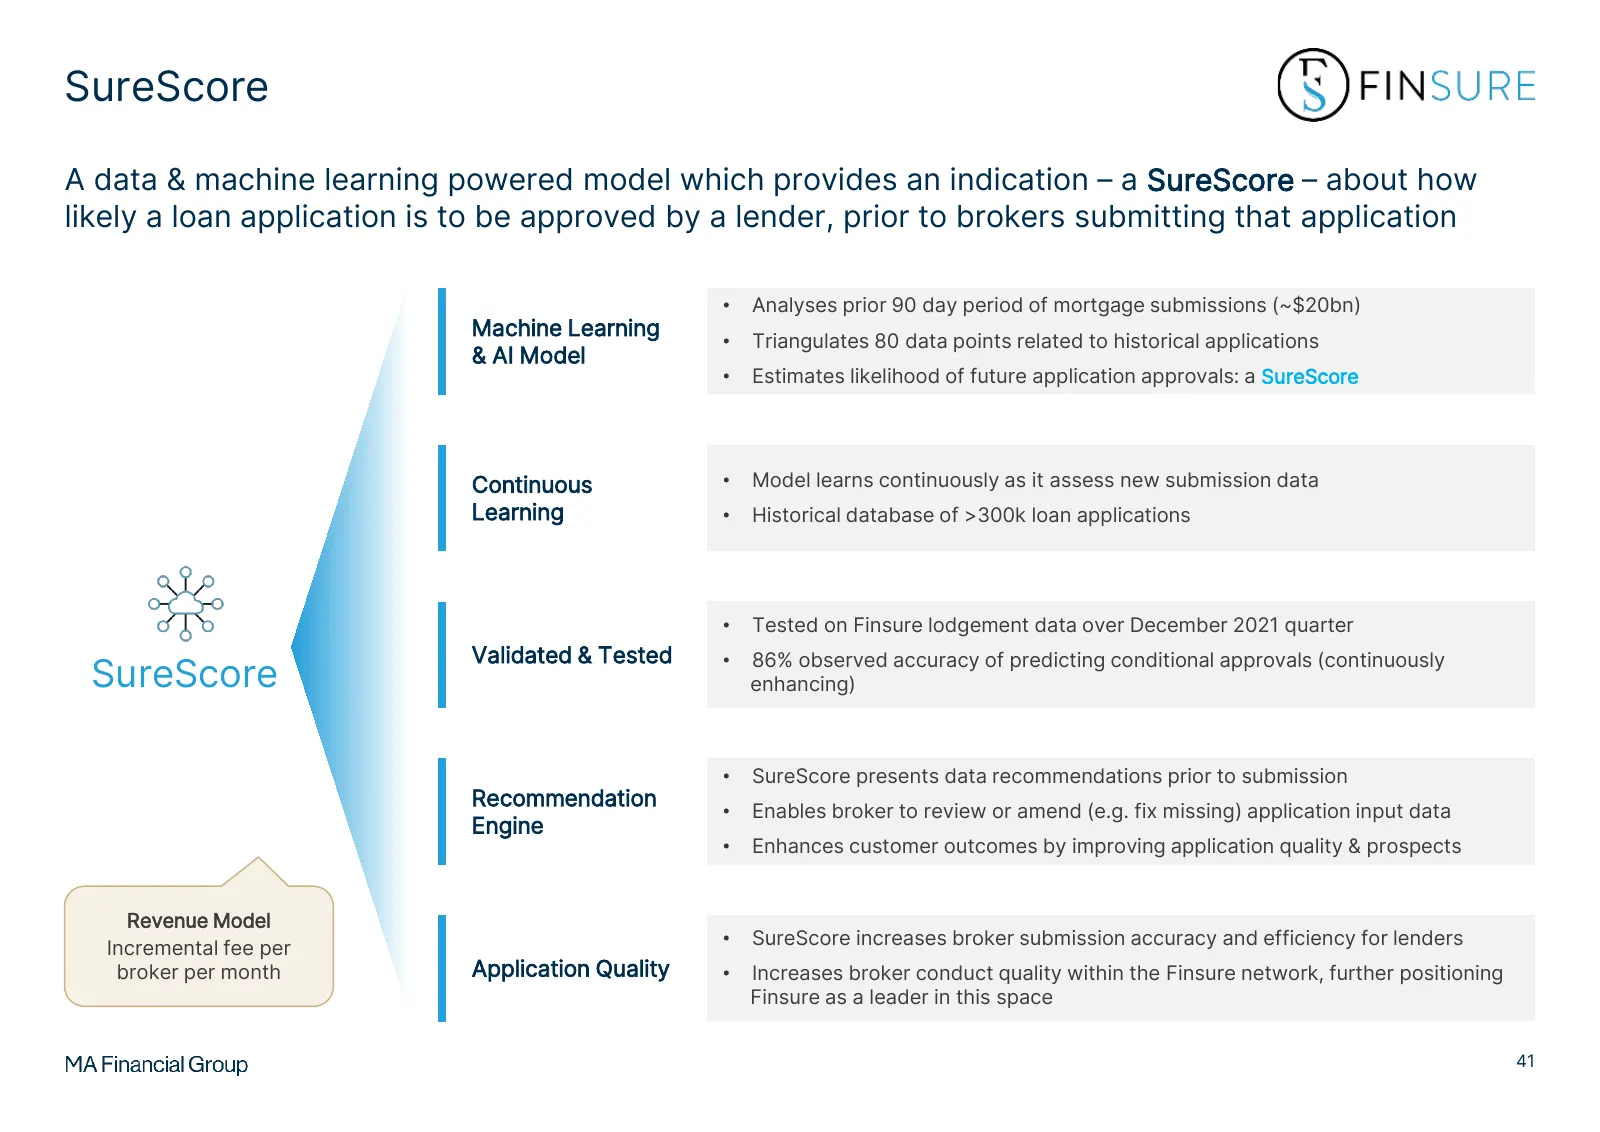
SureScore A data & machine learning powered model which provides an indication – a SureScore – about how likely a loan application is to be approved by a lender, prior to brokers submitting that application • Analyses prior 90 day period of mortgage submissions (~$20bn) Machine Learning • Triangulat
Slide 44: SureScore (continued)
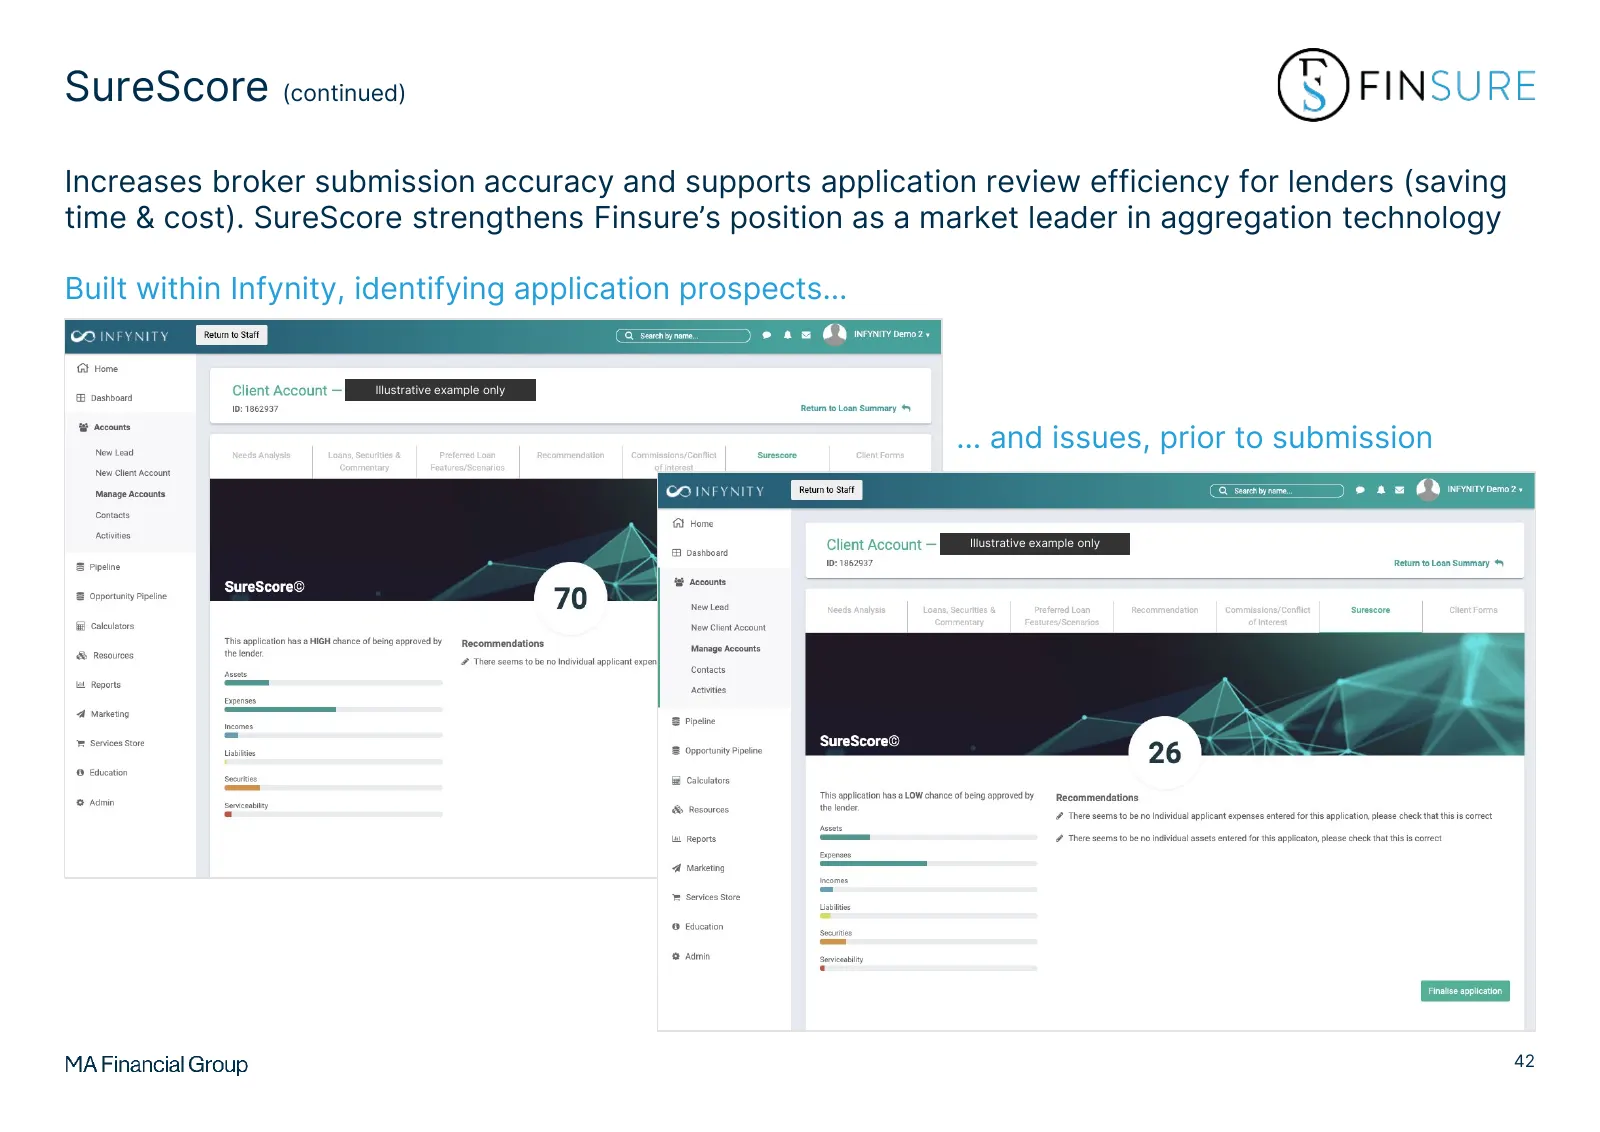
SureScore (continued) Increases broker submission accuracy and supports application review efficiency for lenders (saving time & cost). SureScore strengthens Finsure’s position as a market leader in aggregation technology Built within Infynity, identifying application prospects… Illustrative example
Slide 45: Lending technology
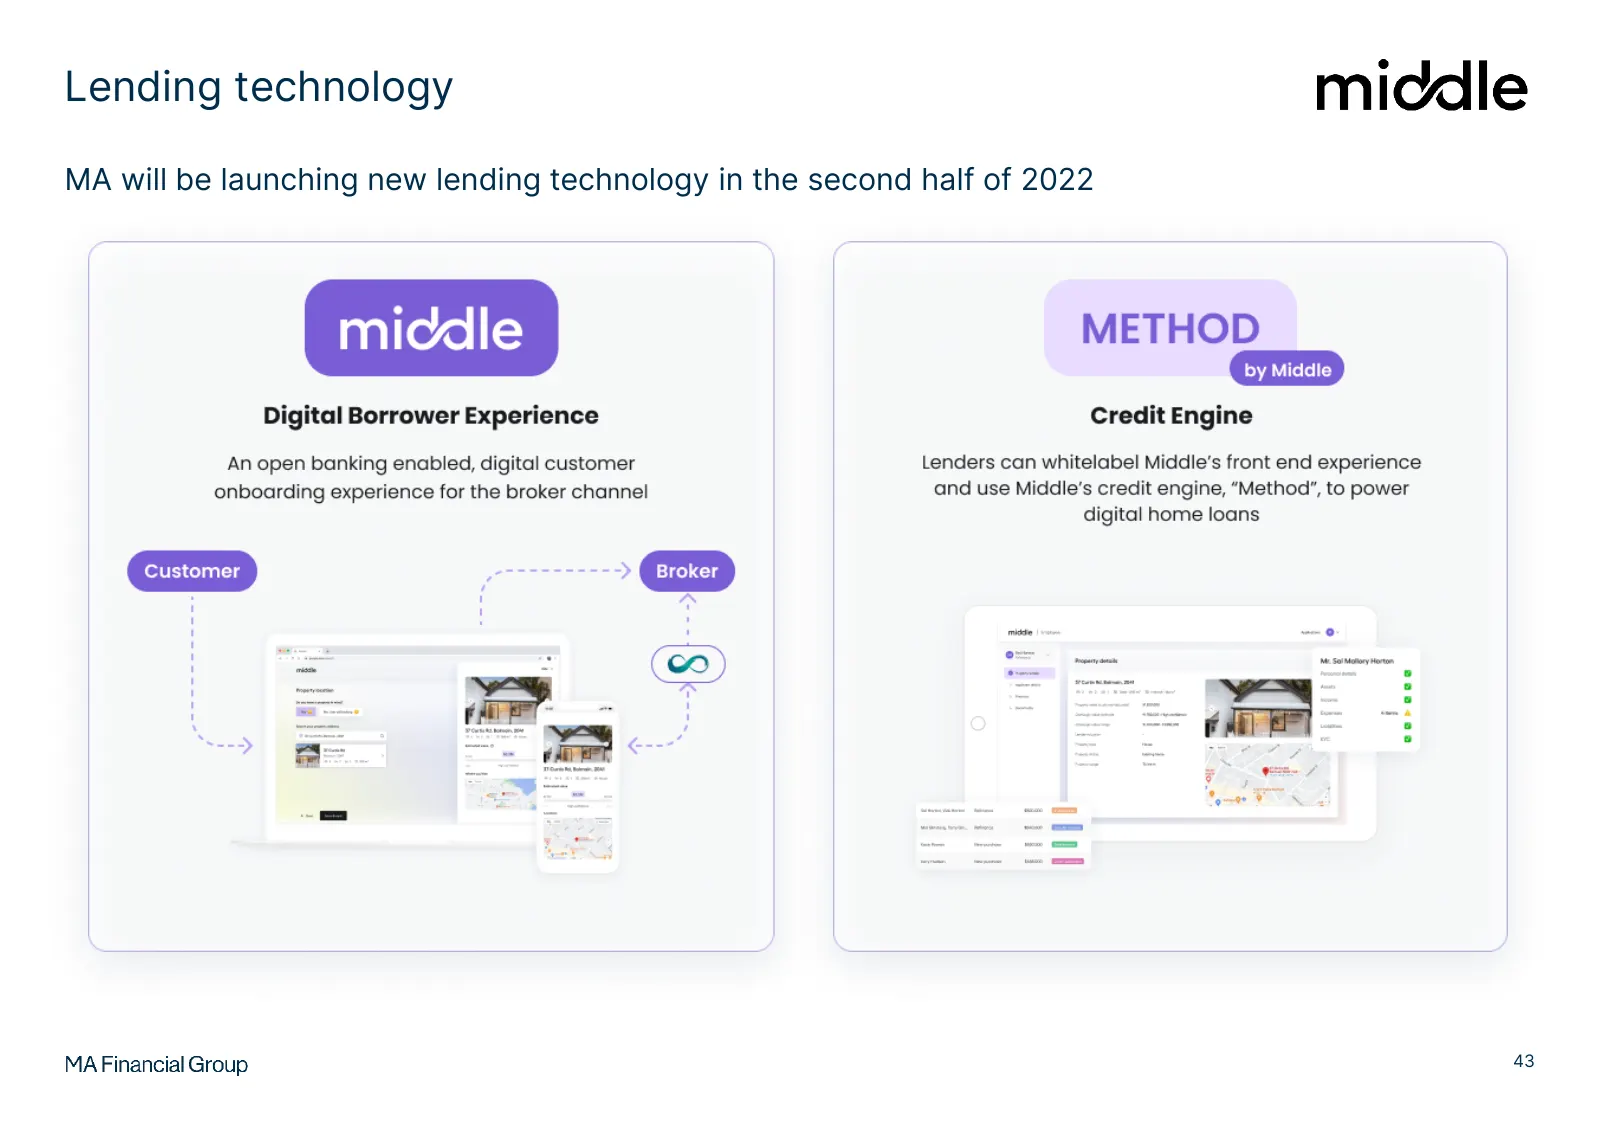
Lending technology MA will be launching new lending technology in the second half of 2022 43
Slide 46: Digital borrower experience
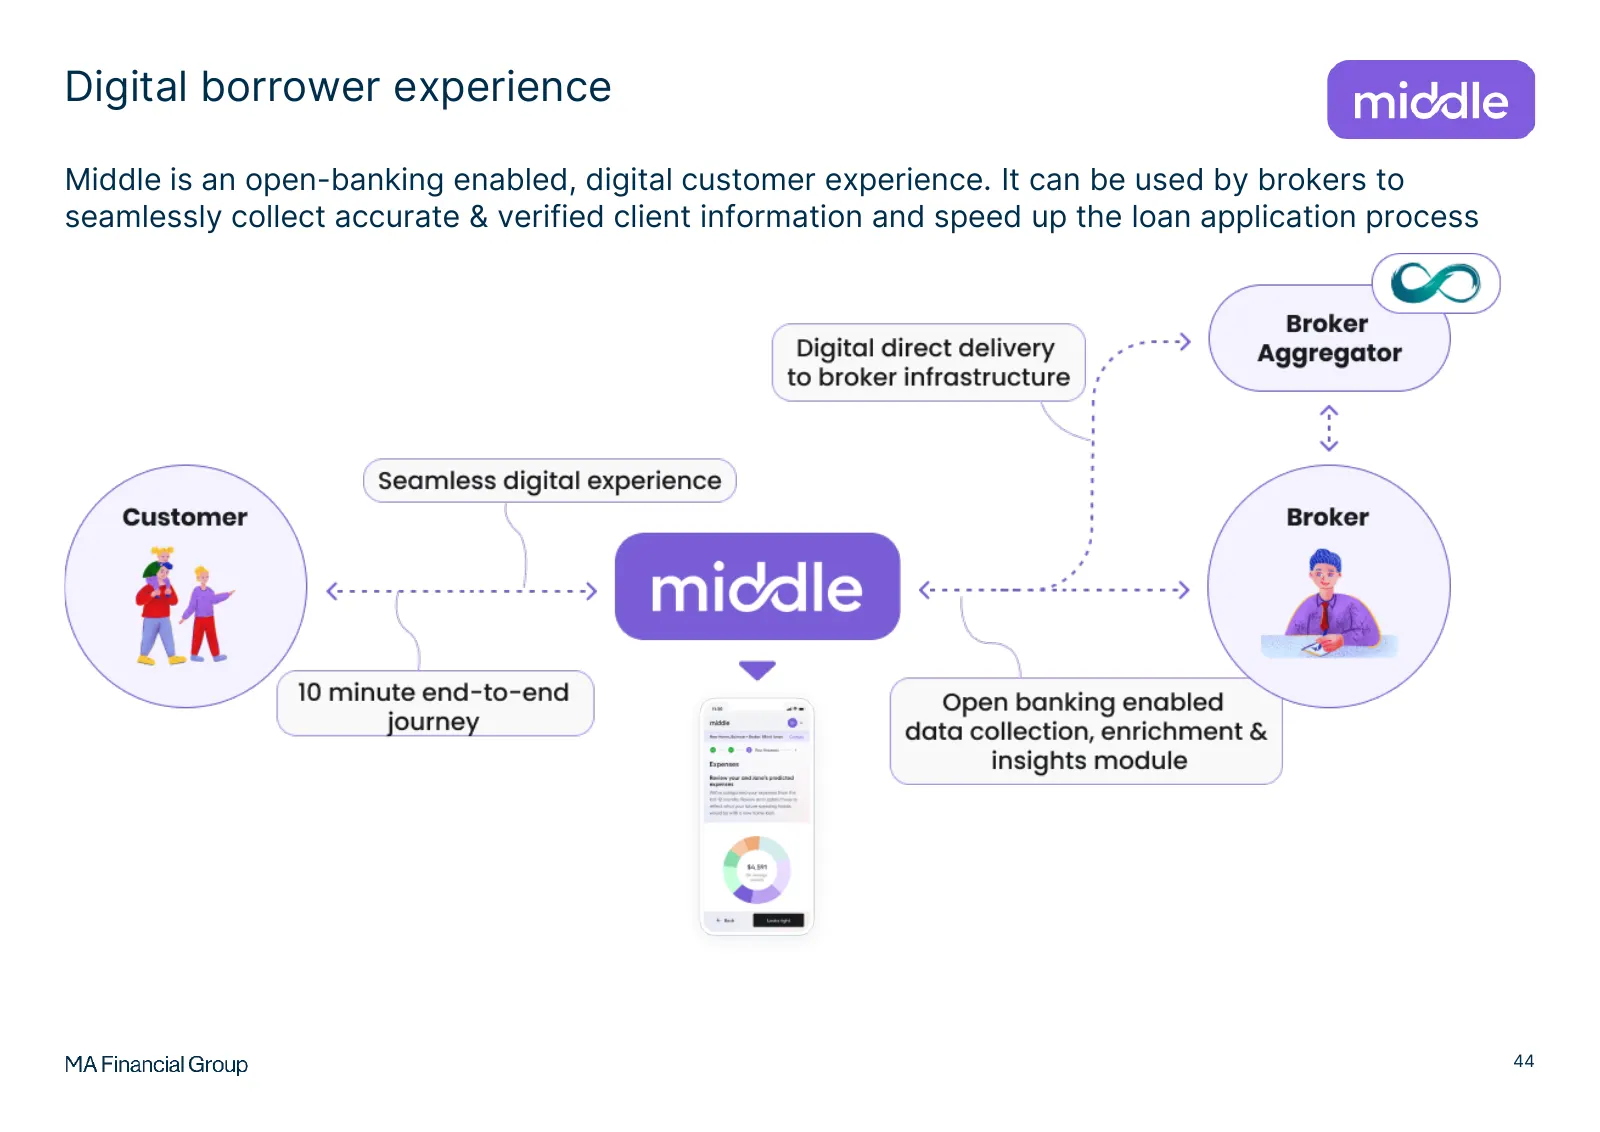
Digital borrower experience Middle is an open-banking enabled, digital customer experience. It can be used by brokers to seamlessly collect accurate & verified client information and speed up the loan application process 44
Slide 47: Digital borrower experience (continued)
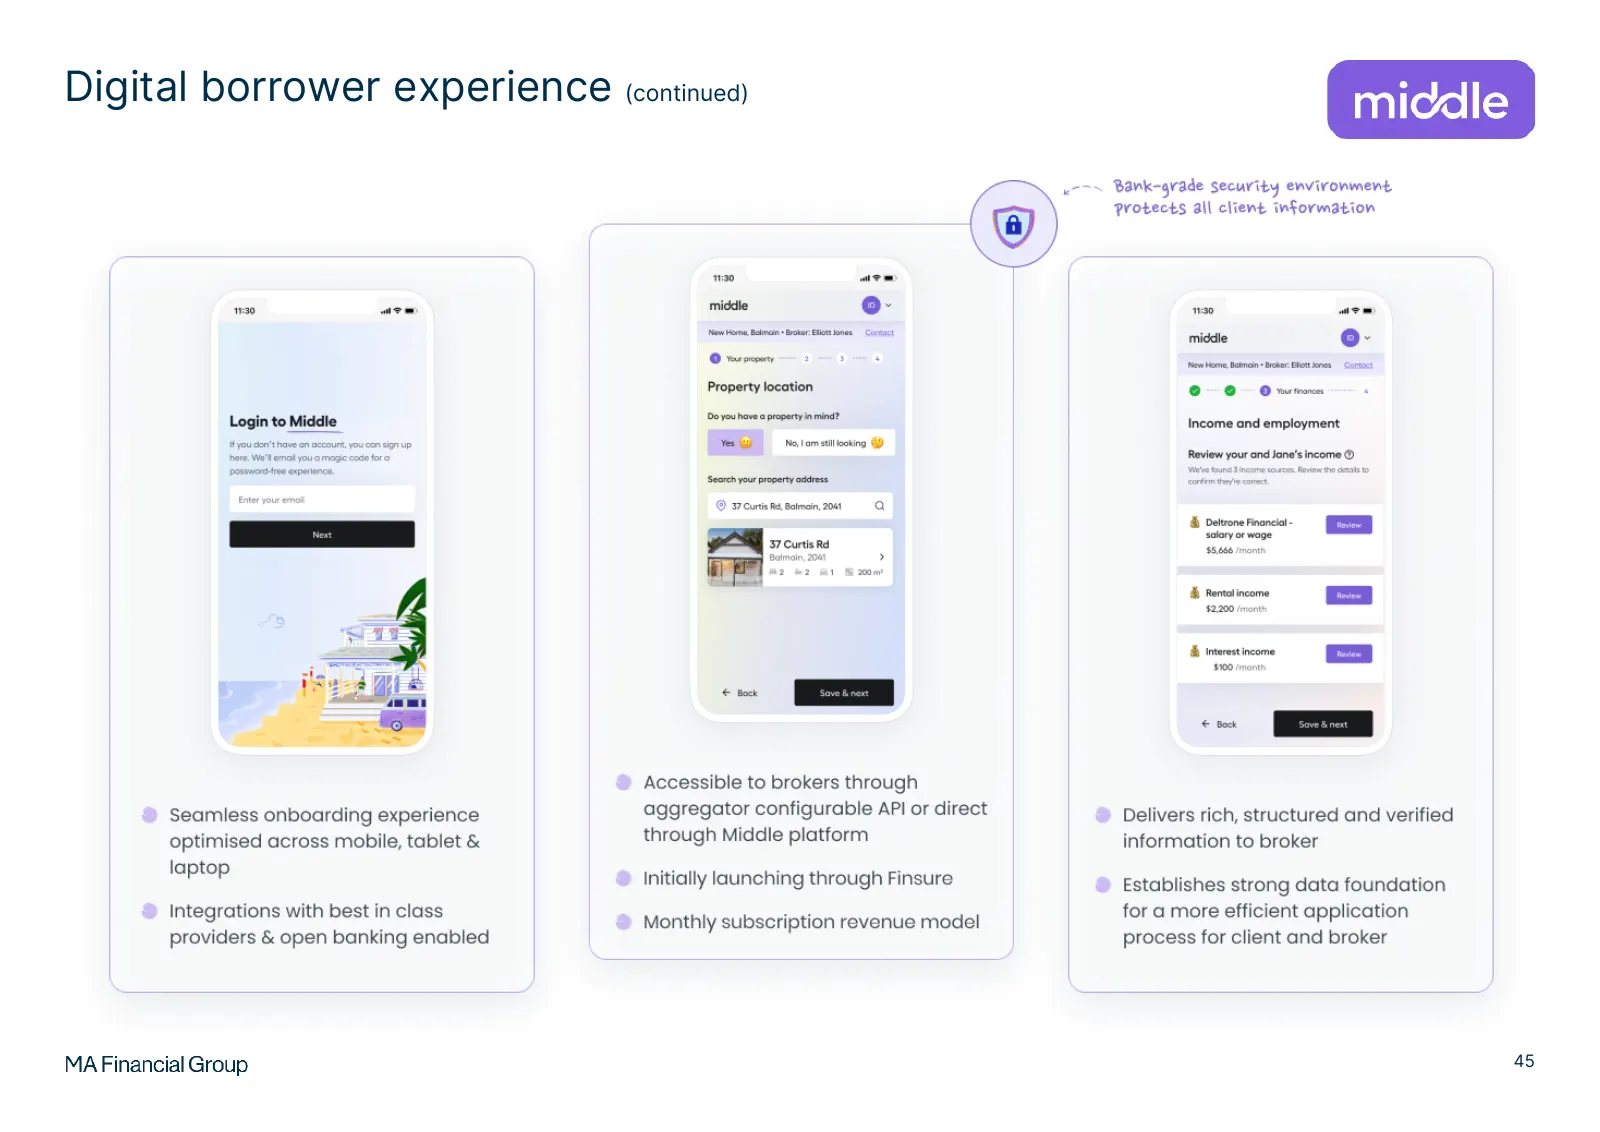
Digital borrower experience (continued) 45
Slide 48: Credit engine
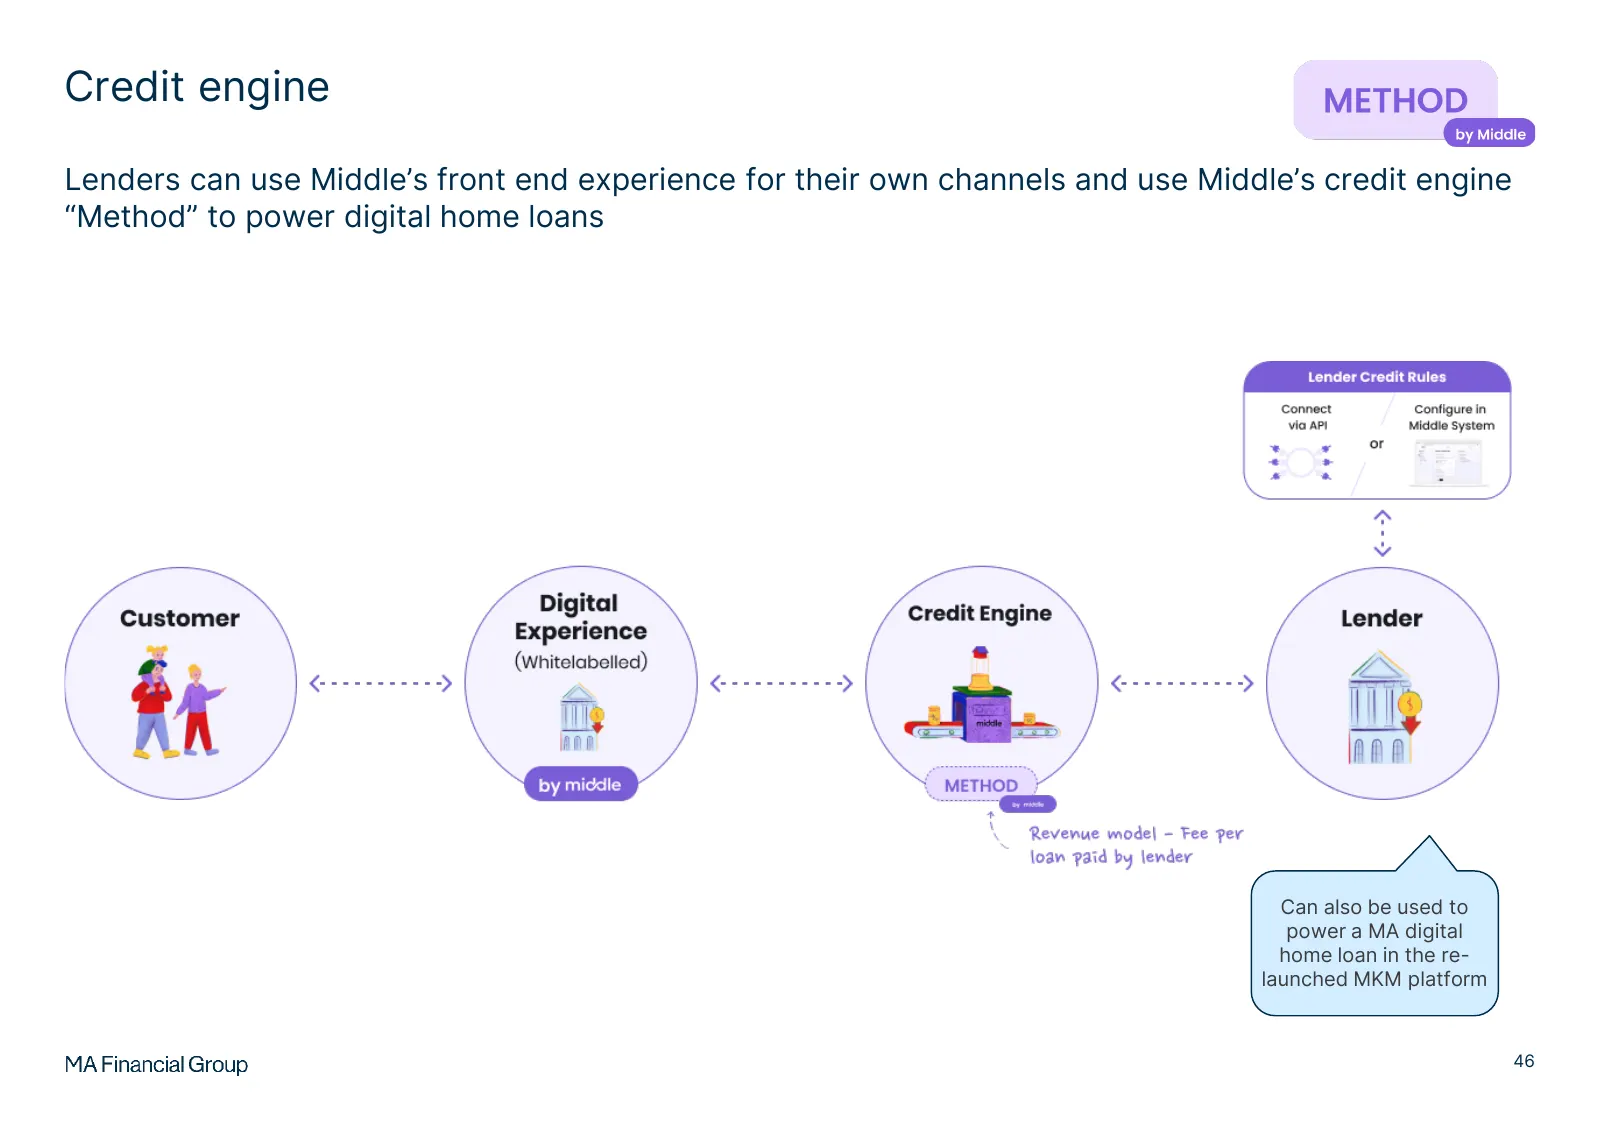
Credit engine Lenders can use Middle’s front end experience for their own channels and use Middle’s credit engine “Method” to power digital home loans Can also be used to power a MA digital home loan in the re- launched MKM platform 46
Slide 49: Middle and Method in the broker channel
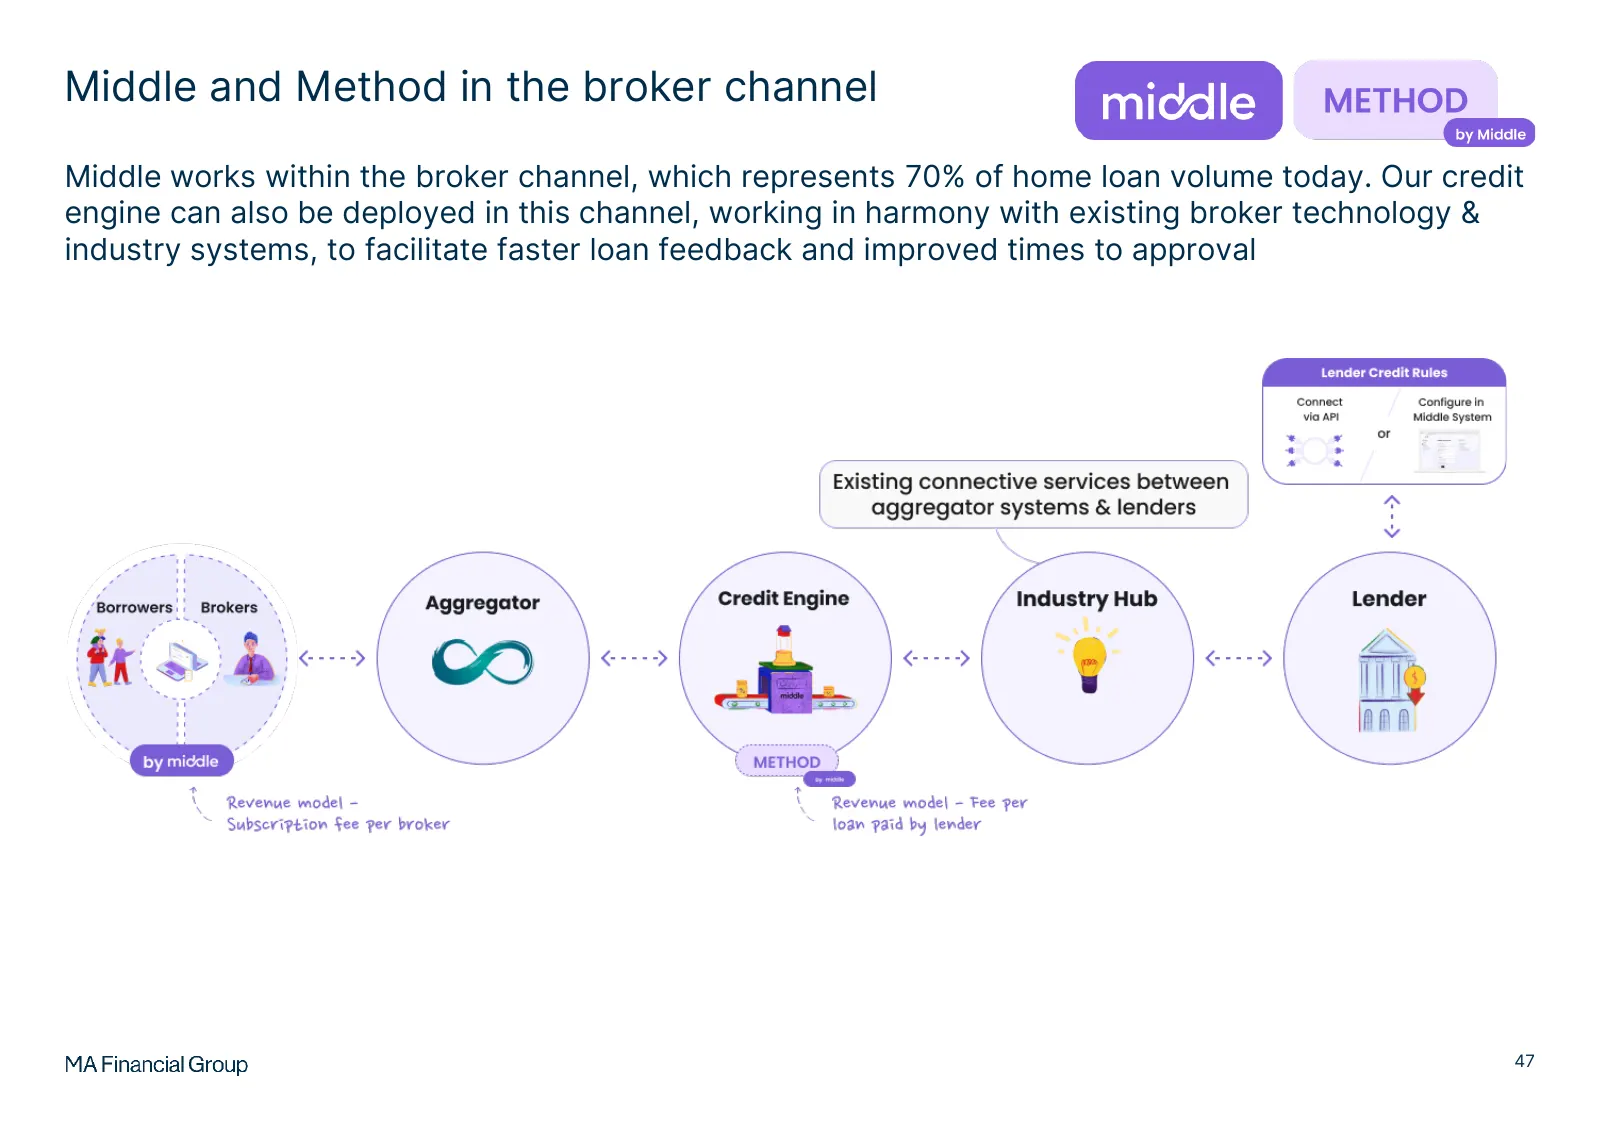
Middle and Method in the broker channel Middle works within the broker channel, which represents 70% of home loan volume today. Our credit engine can also be deployed in this channel, working in harmony with existing broker technology & industry systems, to facilitate faster loan feedback and improv
Slide 50: CommissionNow
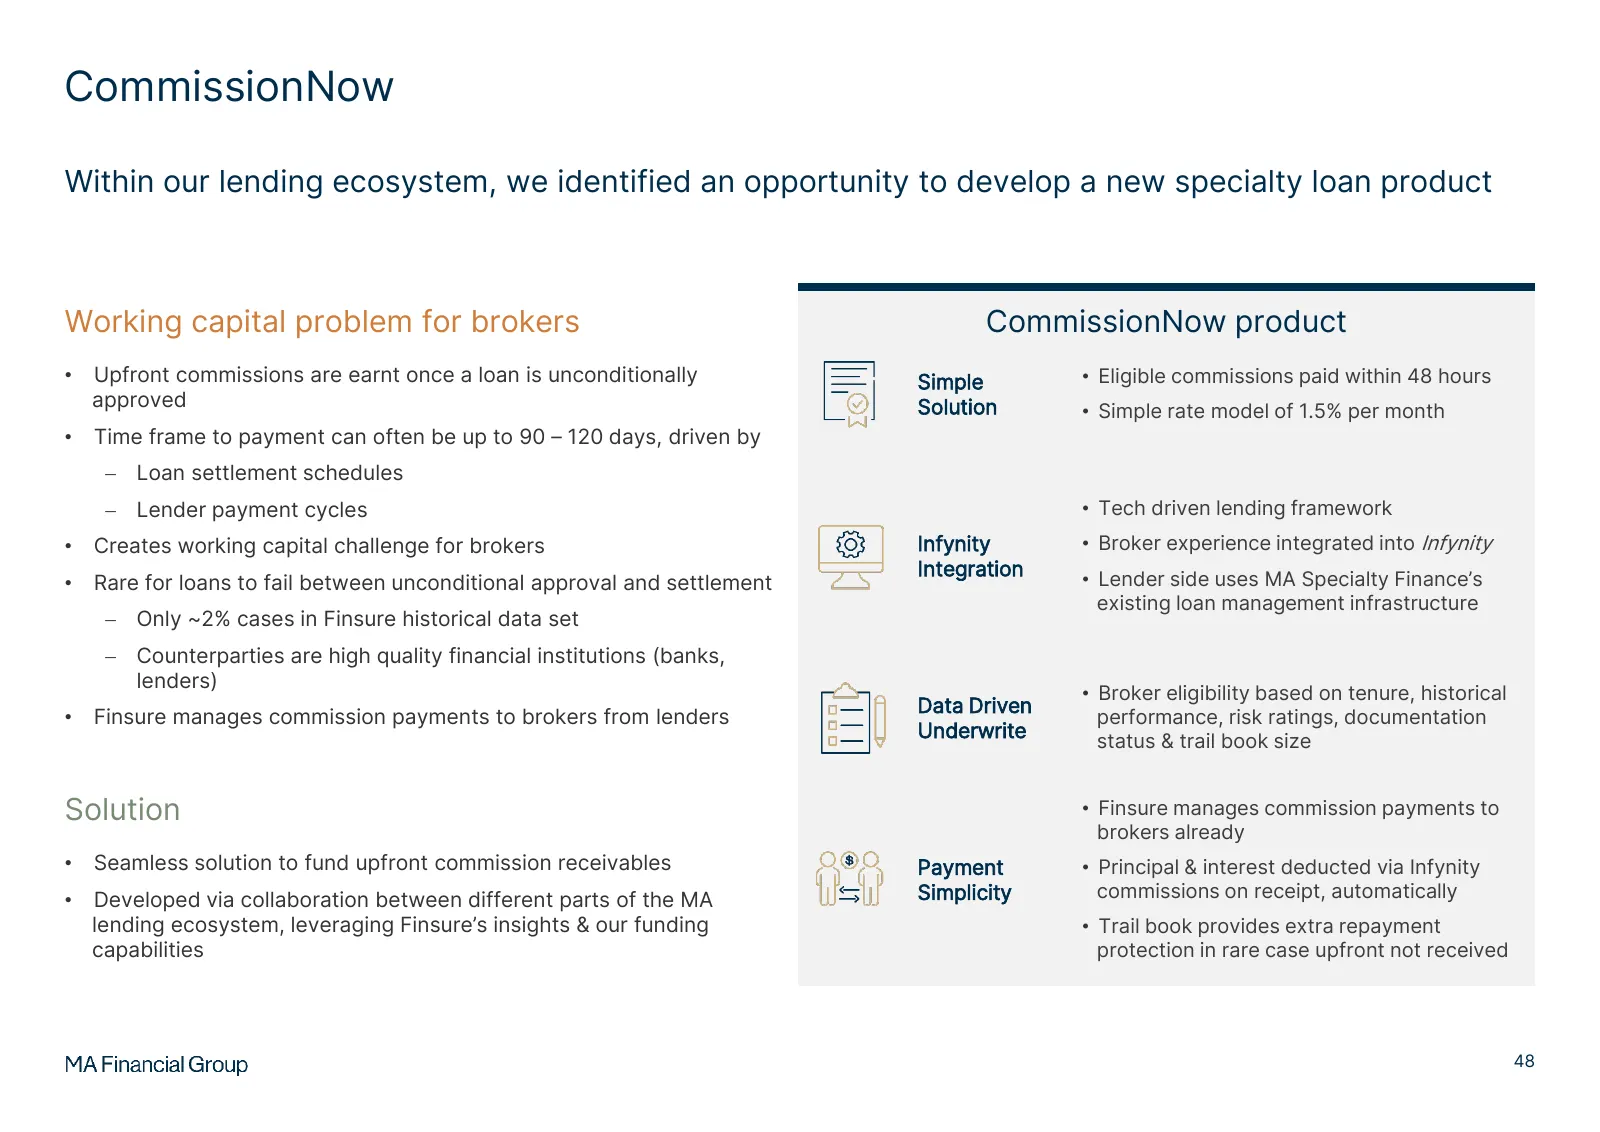
CommissionNow Within our lending ecosystem, we identified an opportunity to develop a new specialty loan product Working capital problem for brokers CommissionNow product • Upfront commissions are earnt once a loan is unconditionally Simple • Eligible commissions paid within 48 hours approved Soluti
Slide 51: CommissionNow (continued)
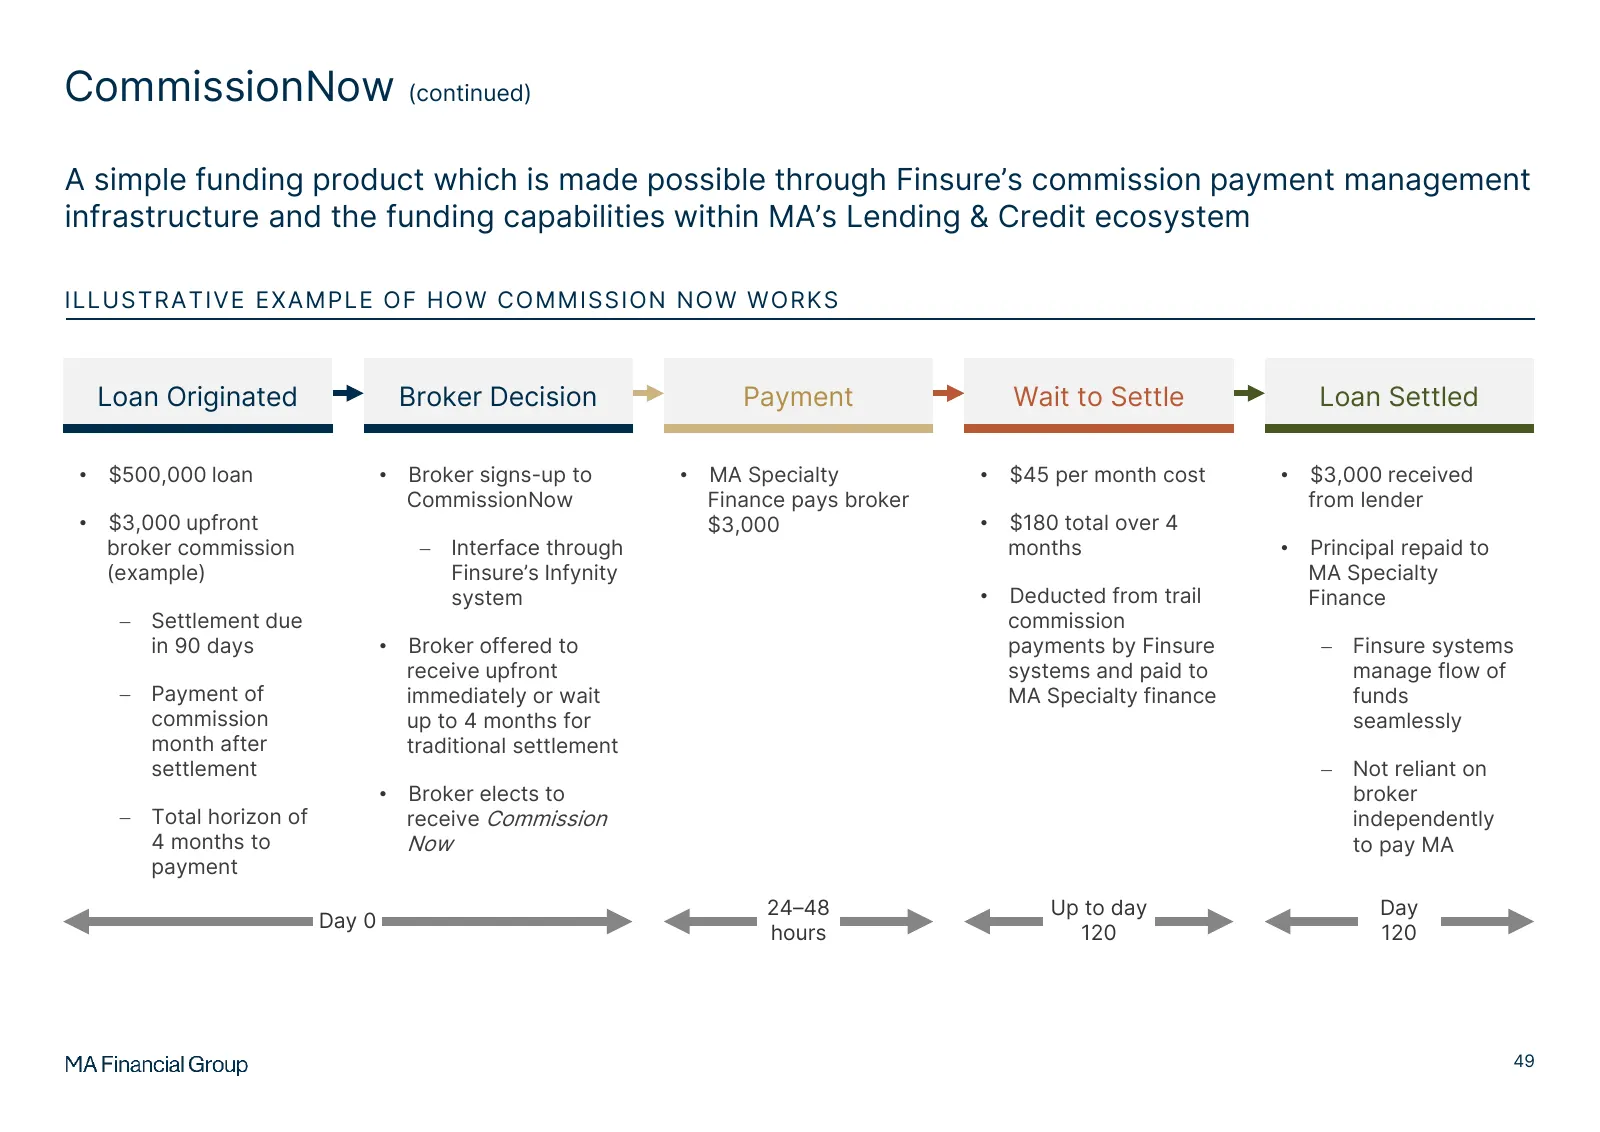
CommissionNow (continued) A simple funding product which is made possible through Finsure’s commission payment management infrastructure and the funding capabilities within MA’s Lending & Credit ecosystem ILLUSTRATIVE EXAMPLE OF HOW COMMISSION NOW WORKS Loan Originated Broker Decision Payment Wait t

Slide 52: Reflections
O 5 Reflections MA Financial Group
Slide 53: Ecosystem for growth
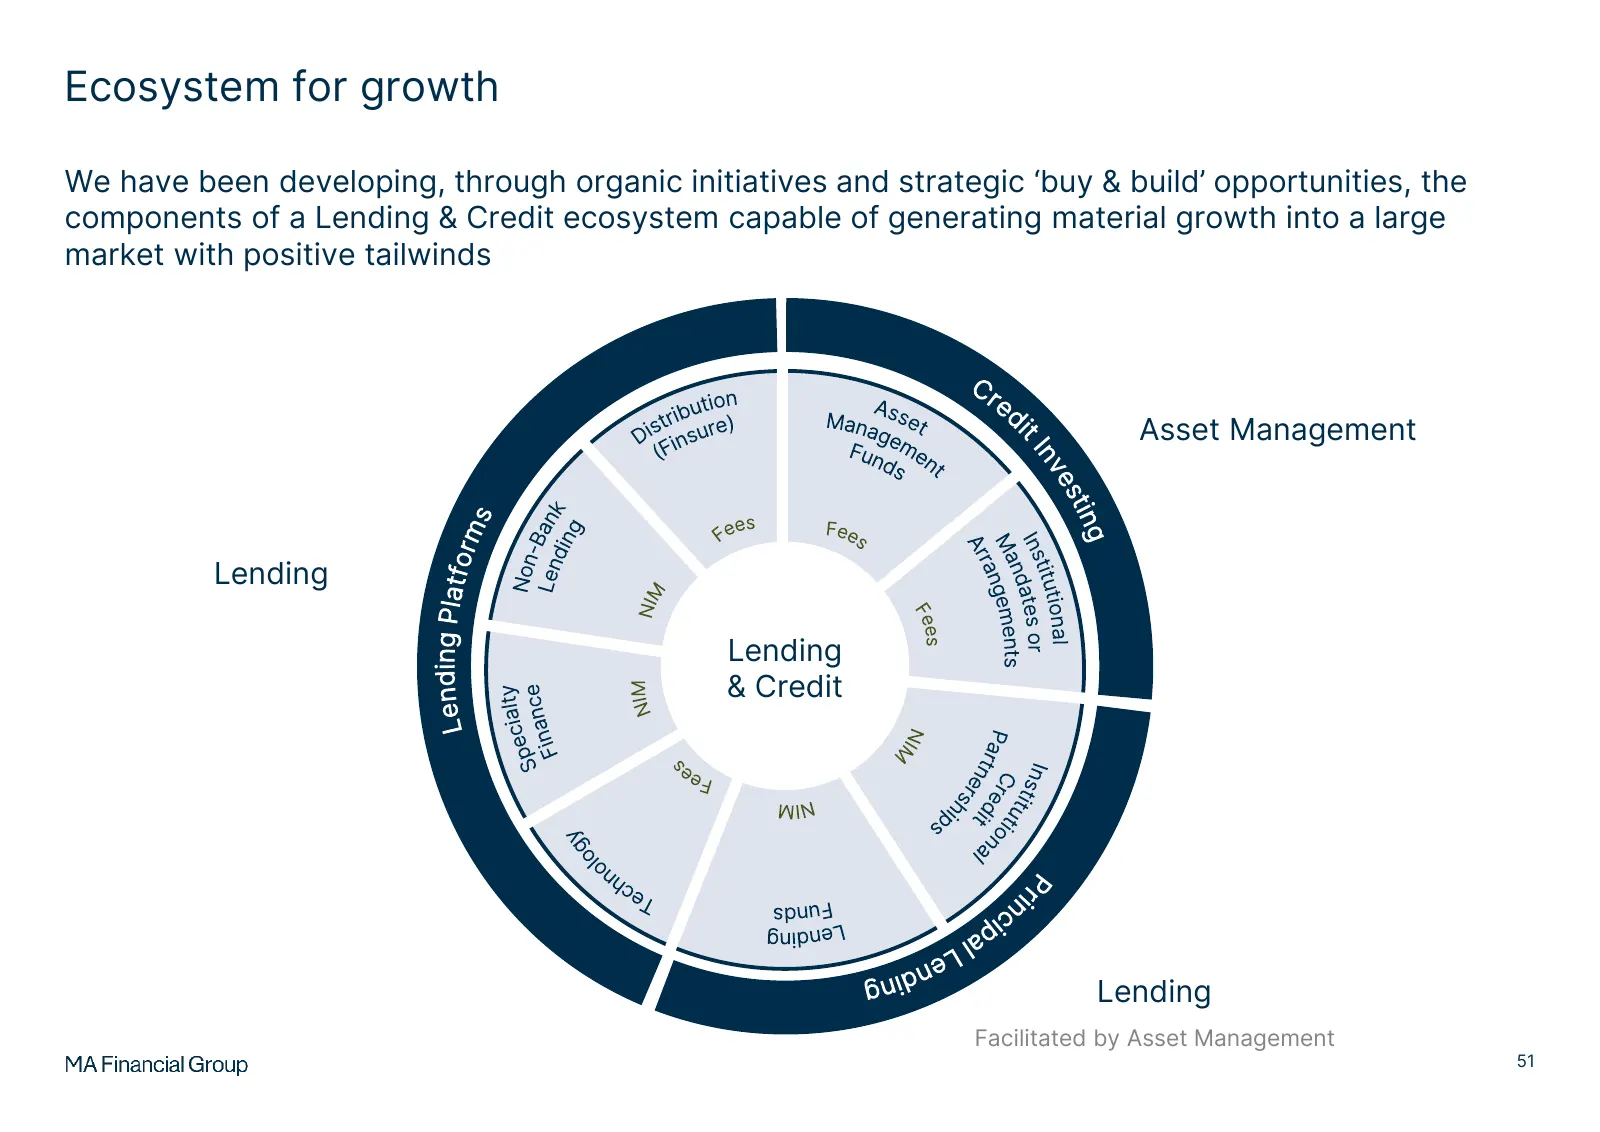
Ecosystem for growth We have been developing, through organic initiatives and strategic ‘buy & build’ opportunities, the components of a Lending & Credit ecosystem capable of generating material growth into a large market with positive tailwinds Asset Management Lending Lending & Credit Lending Faci
Slide 54: Questions
Questions Chris Wyke – Joint CEO Frank Danieli – Managing Director, Lending & Credit 52
Slide 55: Asset Management: Distribution platform
Asset Management Distribution platform Andrew Martin Head of Asset Management Lee Hayes Managing Director, Distribution
Slide 56: Introduction
01 Introduction Increasingly diversified distribution 54
Slide 57: Asset Management growth strategy
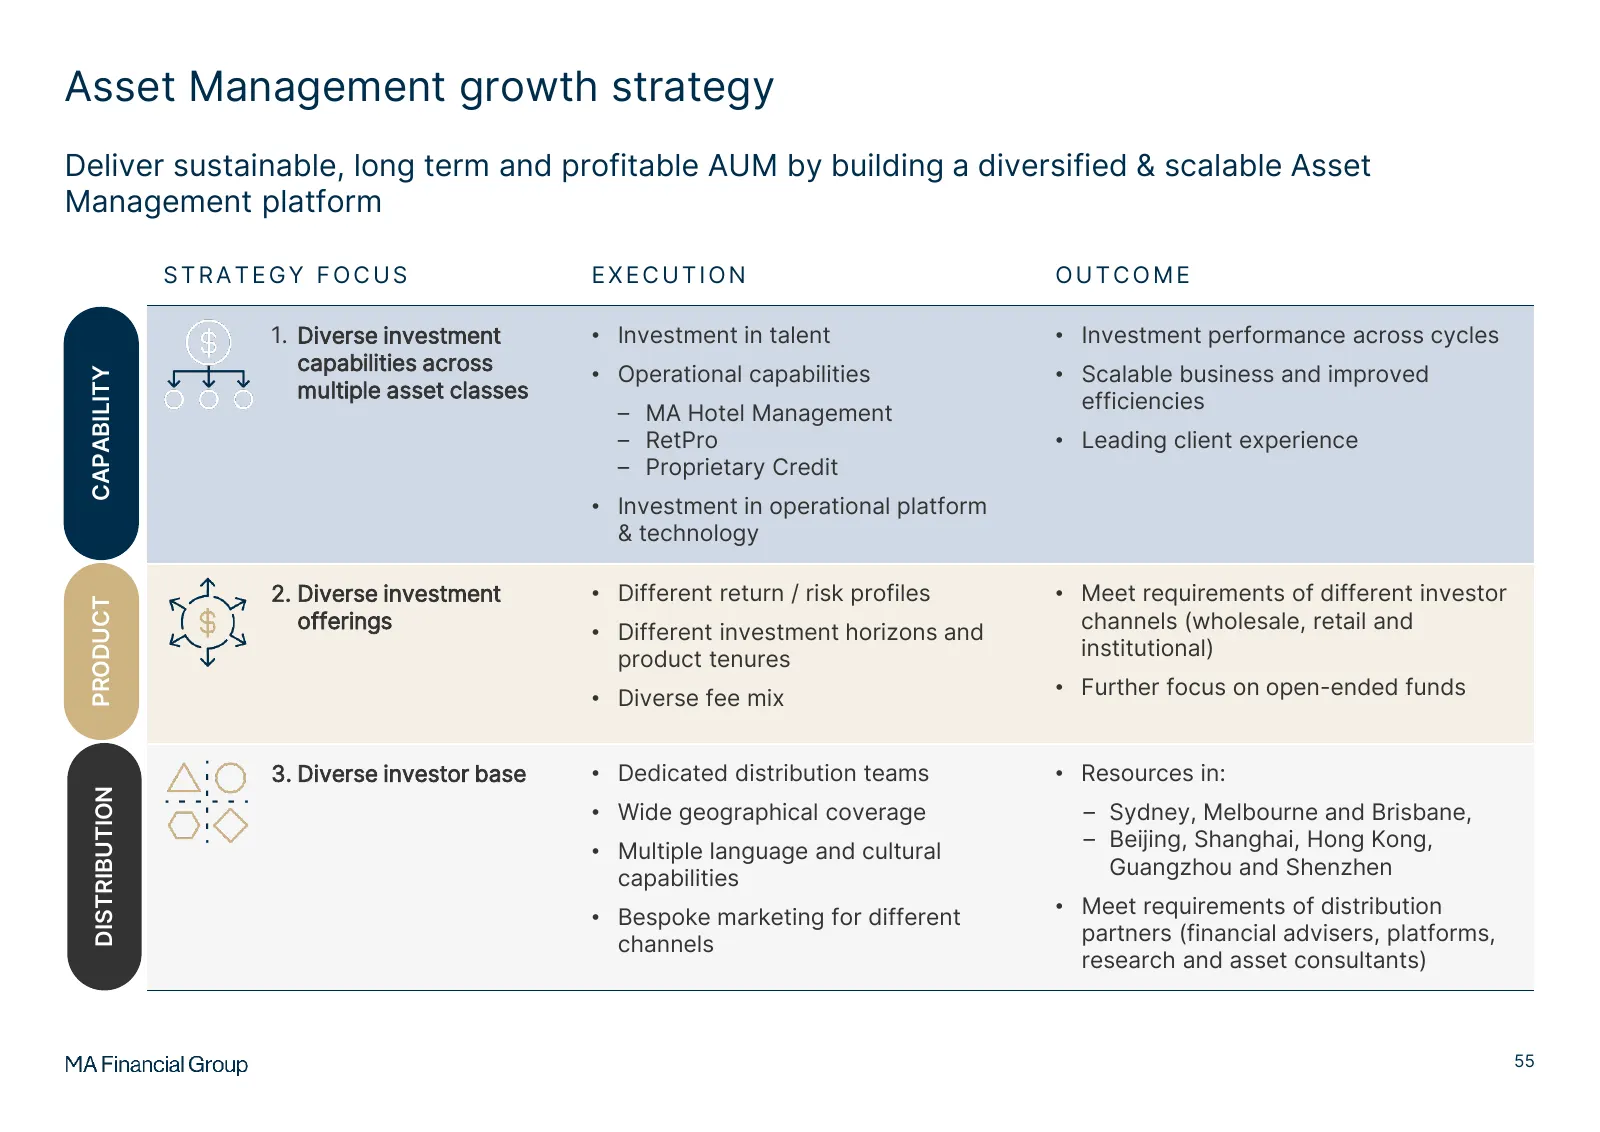
Asset Management growth strategy Deliver sustainable, long term and profitable AUM by building a diversified & scalable Asset Management platform STRATEGY FOCUS EXECUTION OUTCOME 1. Diverse investment • Investment in talent • Investment performance across cycles capabilities across • Operational cap
Slide 58: Executing on strategy – Strong AUM growth and diversified distribution
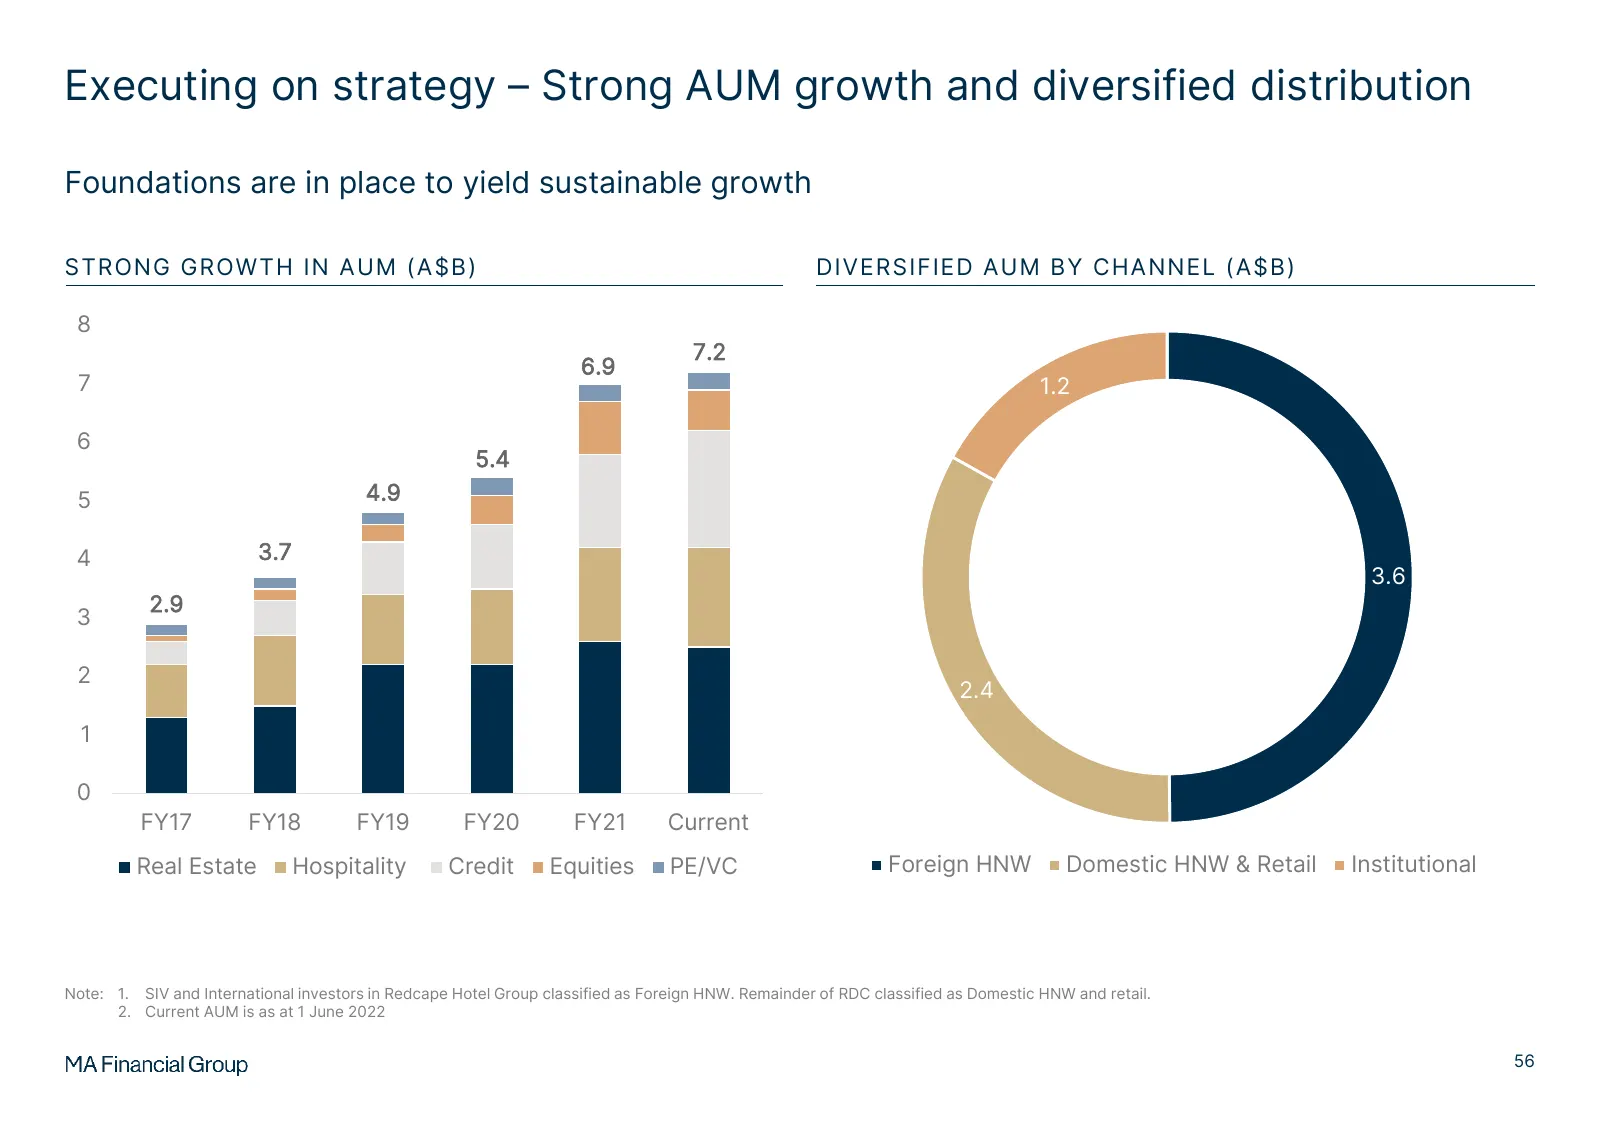
Executing on strategy – Strong AUM growth and diversified distribution Foundations are in place to yield sustainable growth STRONG GROWTH IN AUM (A$B) DIVERSIFIED AUM BY CHANNEL (A$B) 8 7.2 6.9 7 1.2 6 5.4 5 4.9 4 3.7 3.6 2.9 3 2 2.4 1 0 FY17 FY18 FY19 FY20 FY21 Current Real Estate Hospitality Credi
Slide 59: Increasing diversification of Foreign High Net Wealth (HNW) flows
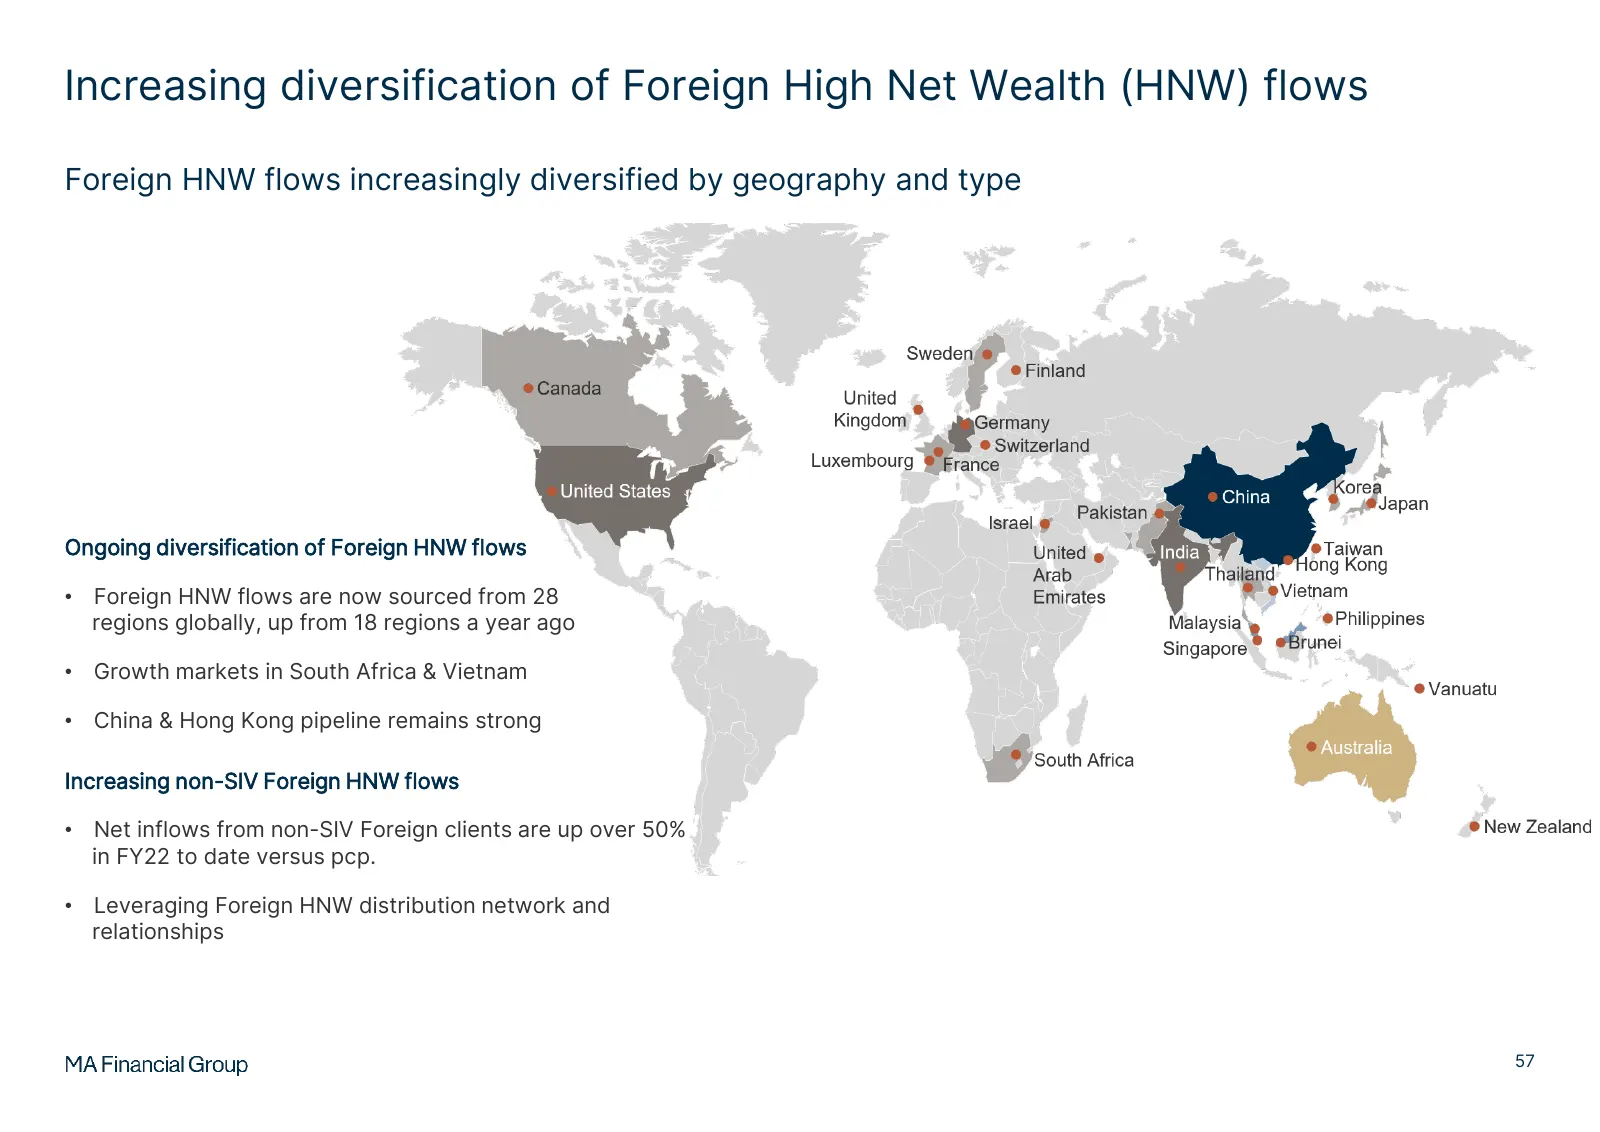
Increasing diversification of Foreign High Net Wealth (HNW) flows Foreign HNW flows increasingly diversified by geography and type Ongoing diversification of Foreign HNW flows • Foreign HNW flows are now sourced from 28 regions globally, up from 18 regions a year ago • Growth markets in South Africa
Slide 60: Domestic Distribution
02 Domestic Distribution Continuing to grow our platform and presence 58
Slide 61: Investment Platform
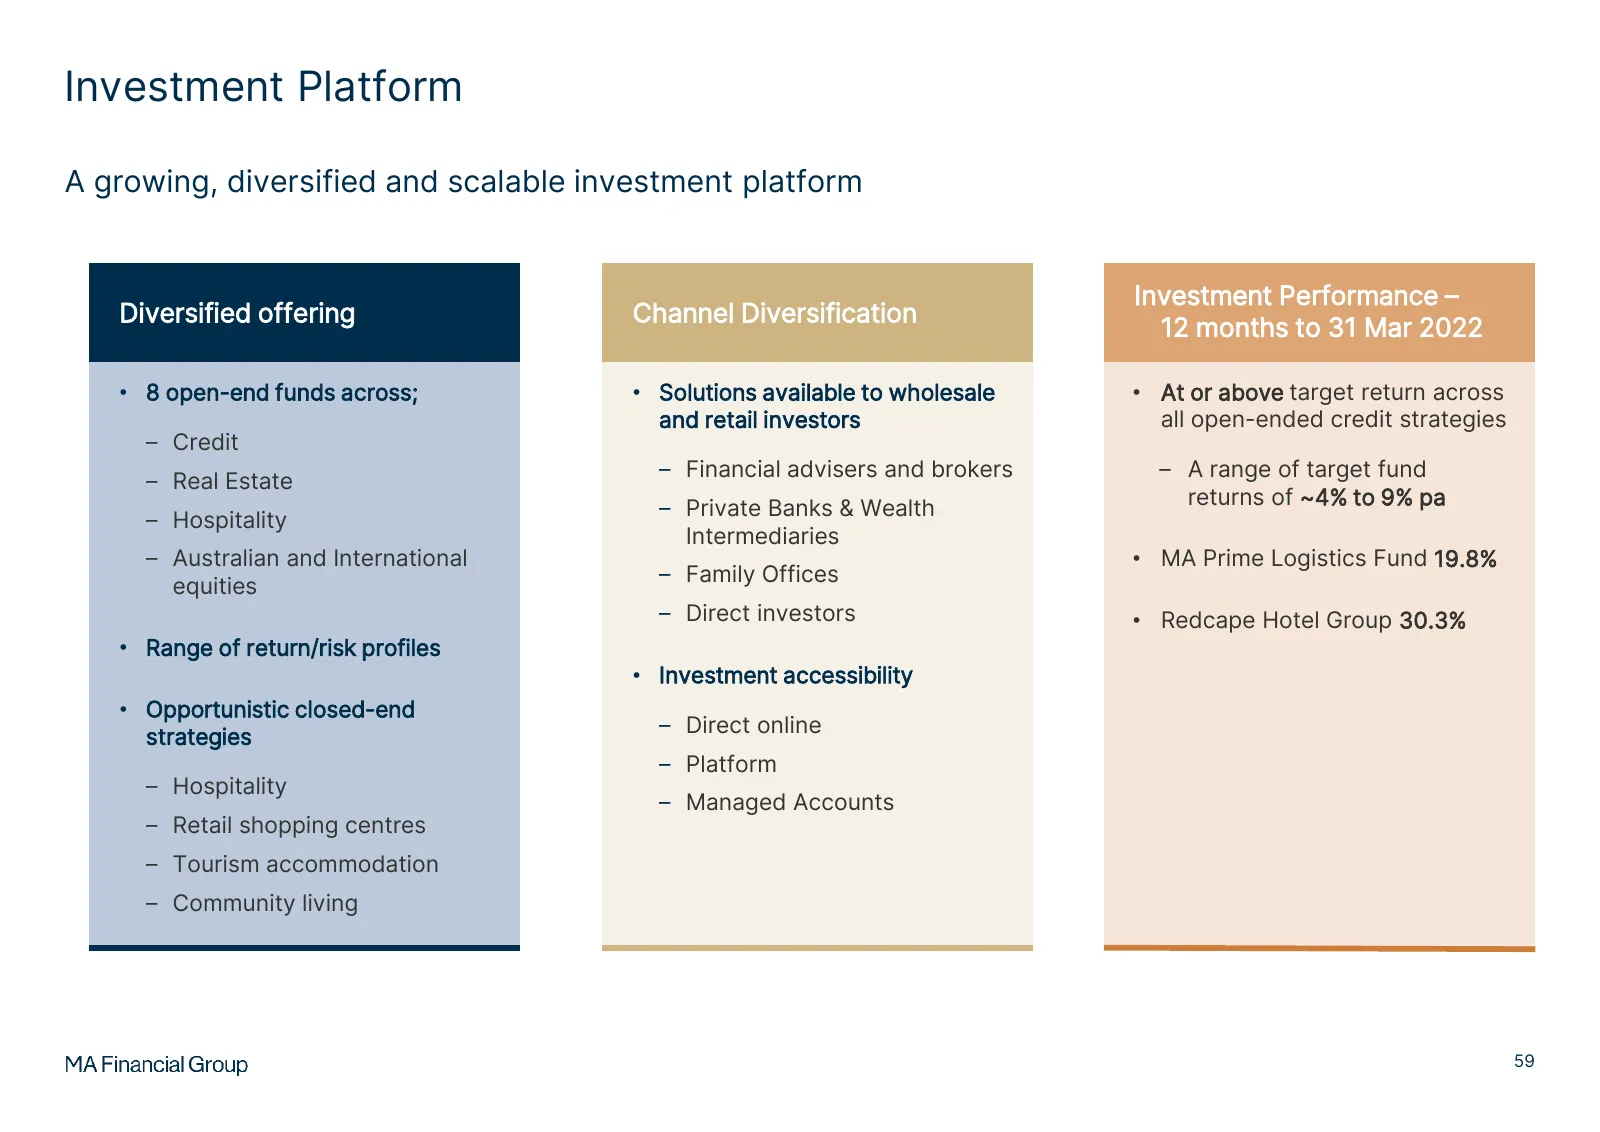
Investment Platform A growing, diversified and scalable investment platform Investment Performance – Diversified offering Channel Diversification 12 months to 31 Mar 2022 • 8 open-end funds across; • Solutions available to wholesale • At or above target return across and retail investors all open-en
Slide 62: Capitalising on current and structural advice trends
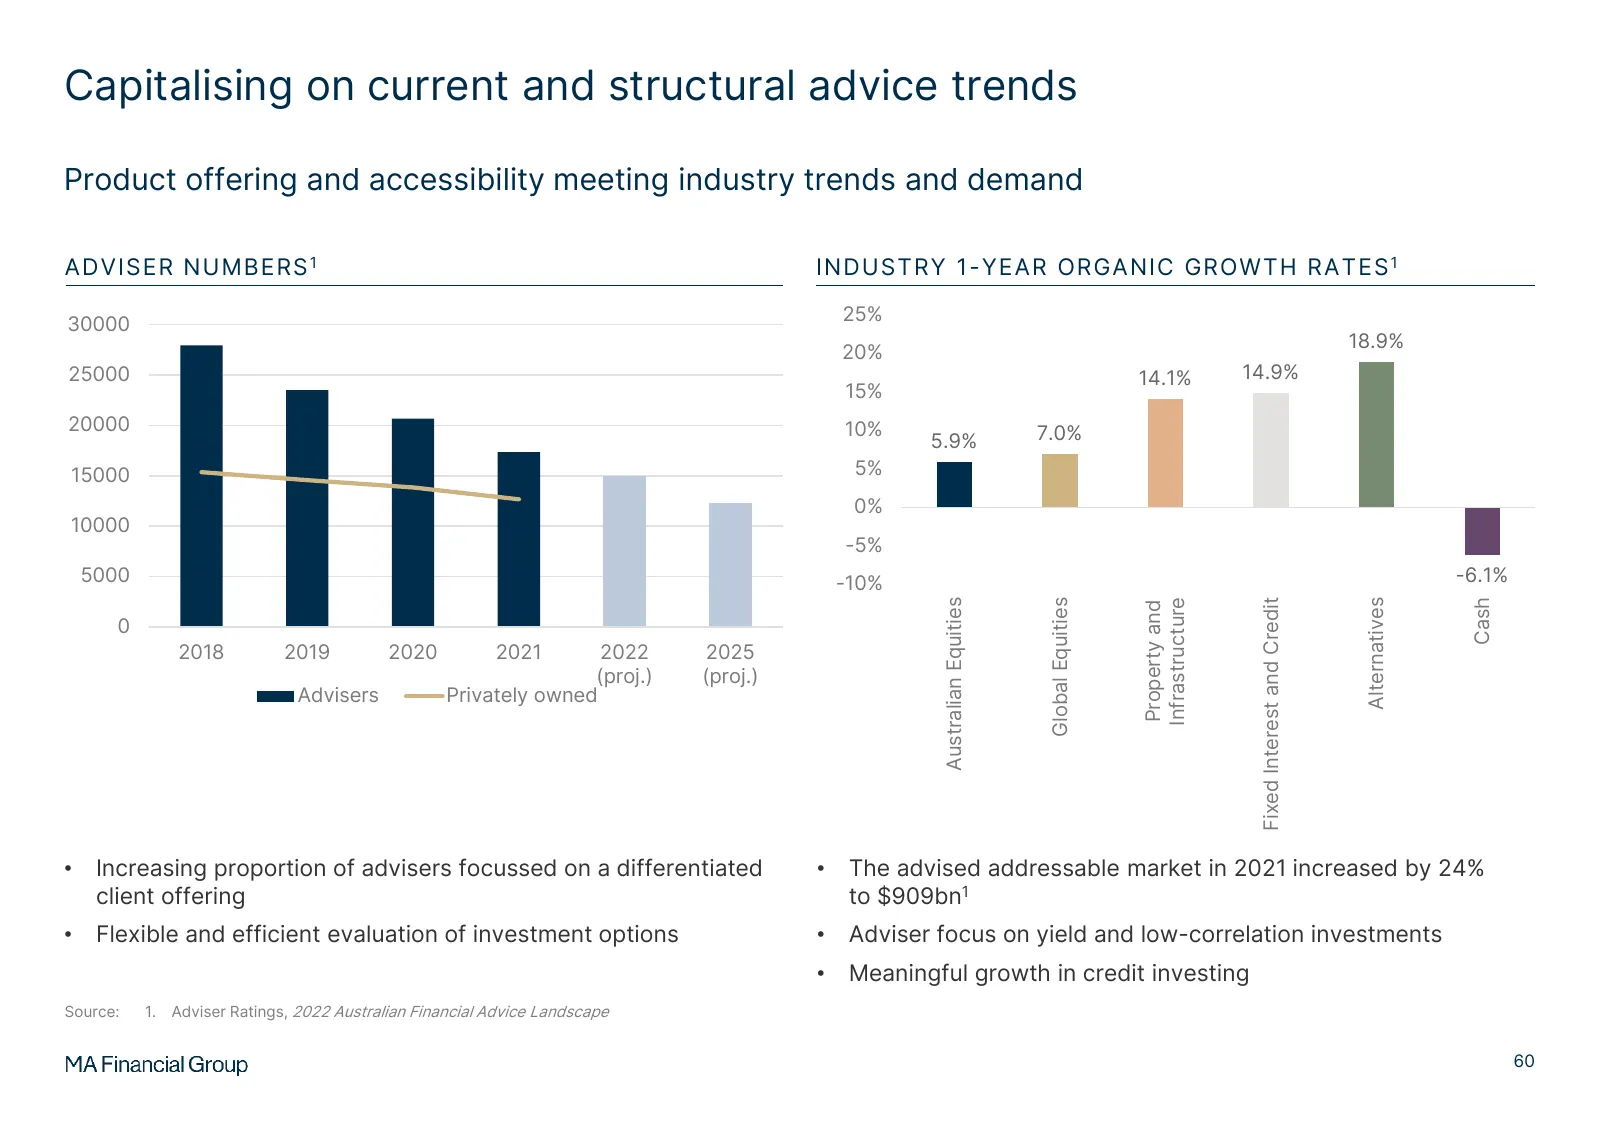
Capitalising on current and structural advice trends Product offering and accessibility meeting industry trends and demand ADVISER NUMBERS 1 INDUSTRY 1-YEAR ORGANIC GROWTH RATES 1 30000 25% 18.9% 20% 25000 14.1% 14.9% 15% 20000 10% 7.0% 5.9% 15000 5% 0% 10000 -5% 5000 -10% -6.1% Cash Australian Equi
Slide 63: Capitalising on current and structural advice trends
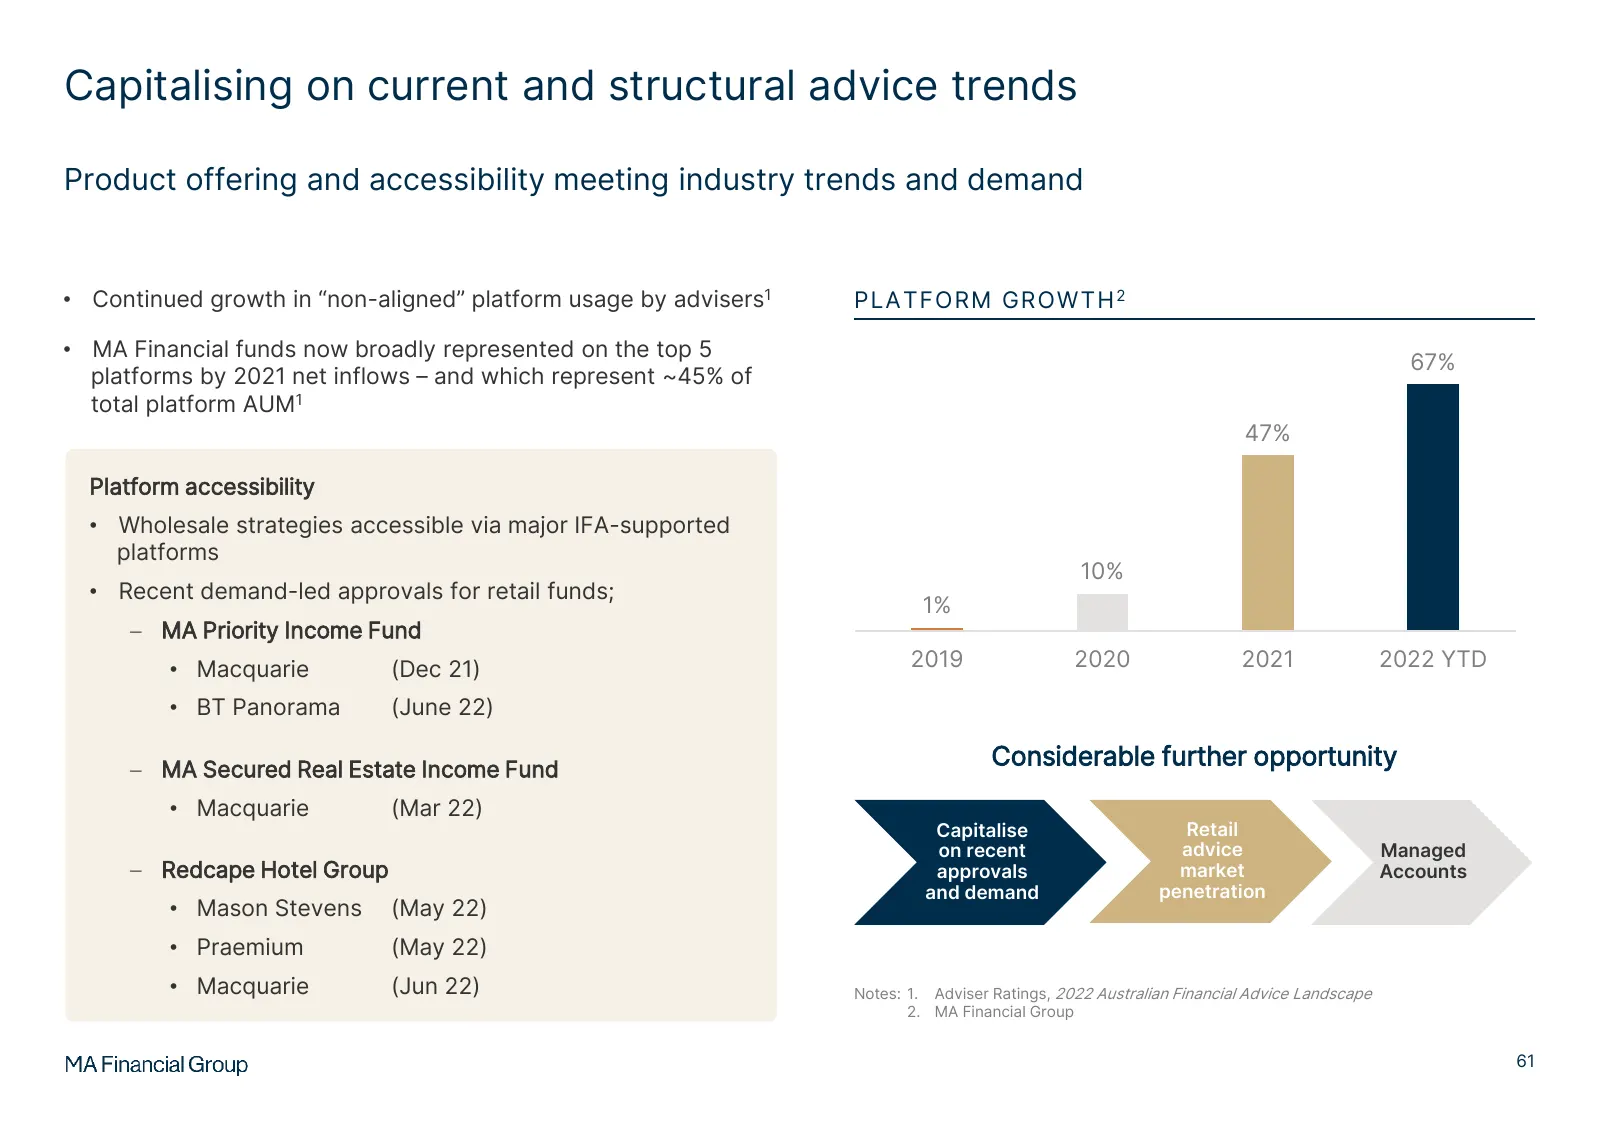
Capitalising on current and structural advice trends Product offering and accessibility meeting industry trends and demand • Continued growth in “non-aligned” platform usage by advisers1 PLATFORM GROWTH 2 • MA Financial funds now broadly represented on the top 5 MA Financial - Advised inflows via 67
Slide 64: Domestic distribution – Update
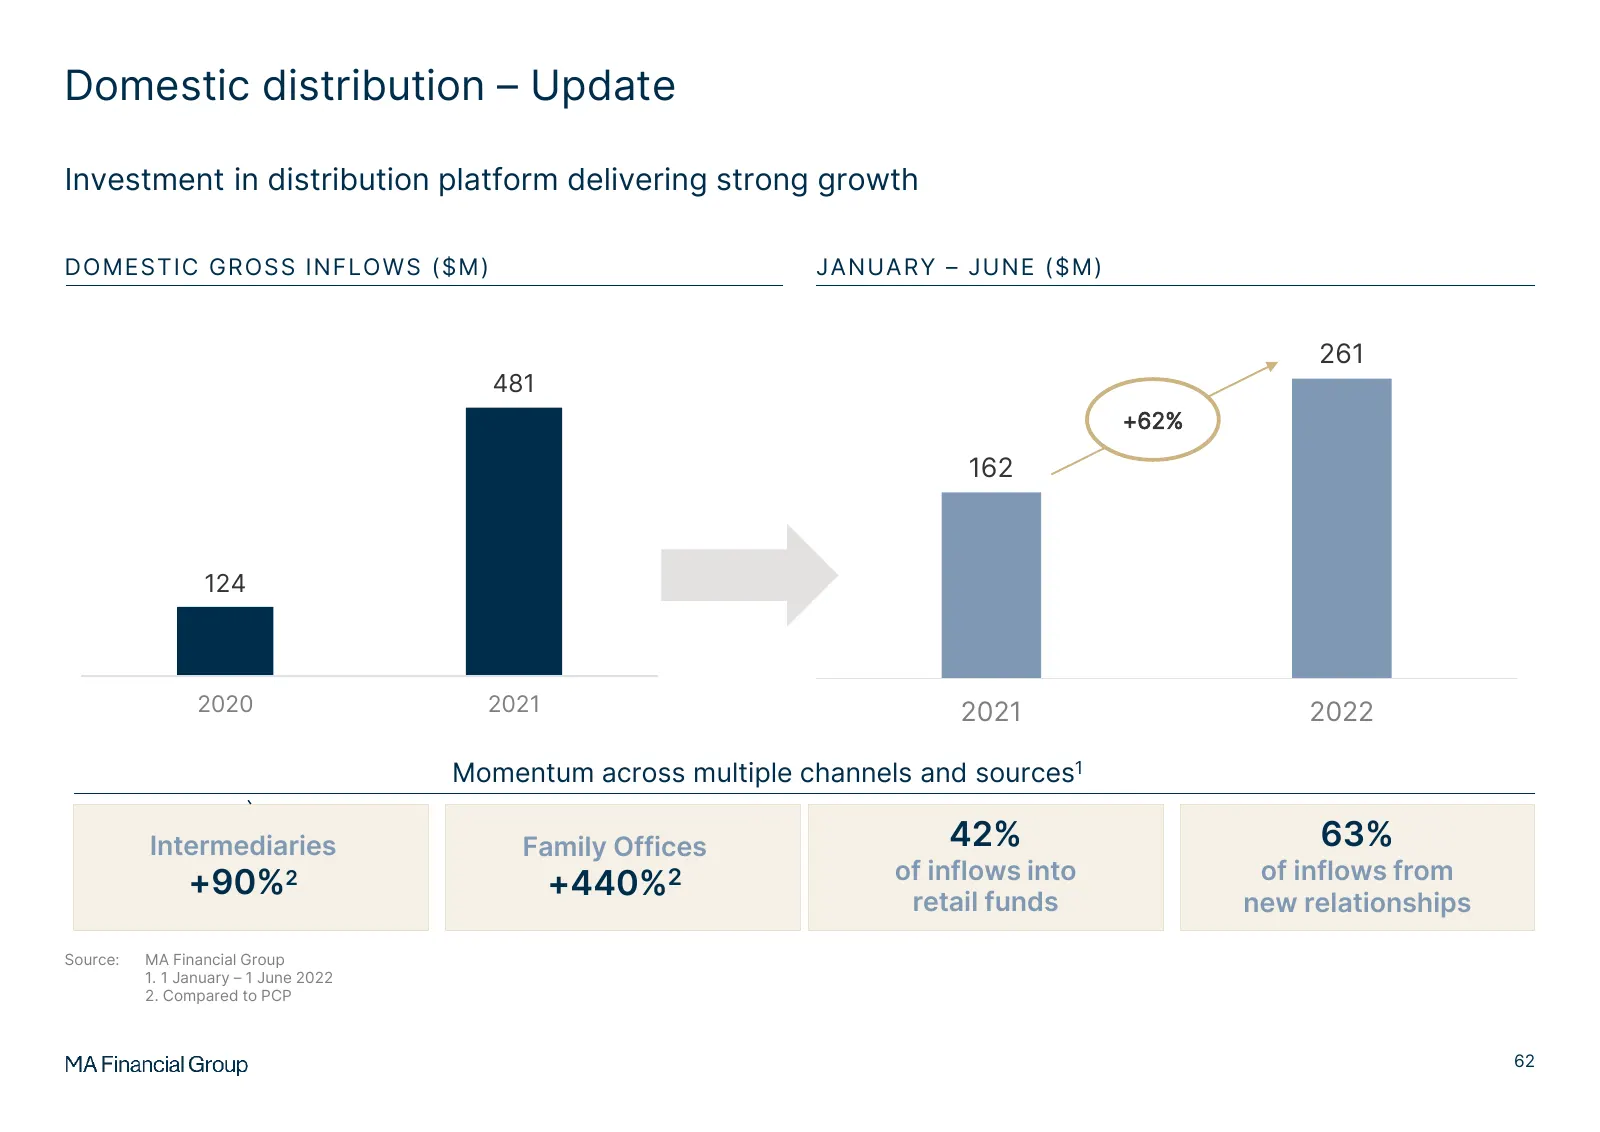
Domestic distribution – Update Investment in distribution platform delivering strong growth DOMESTIC GROSS INFLOWS ($M) JANUARY – JUNE ($M) 261 481 +62% 162 124 2020 2021 2021 2022 Momentum across multiple channels and sources1 Intermediaries Family Offices 42% 63% of inflows into of inflows from +9
Slide 65: Distribution resourcing
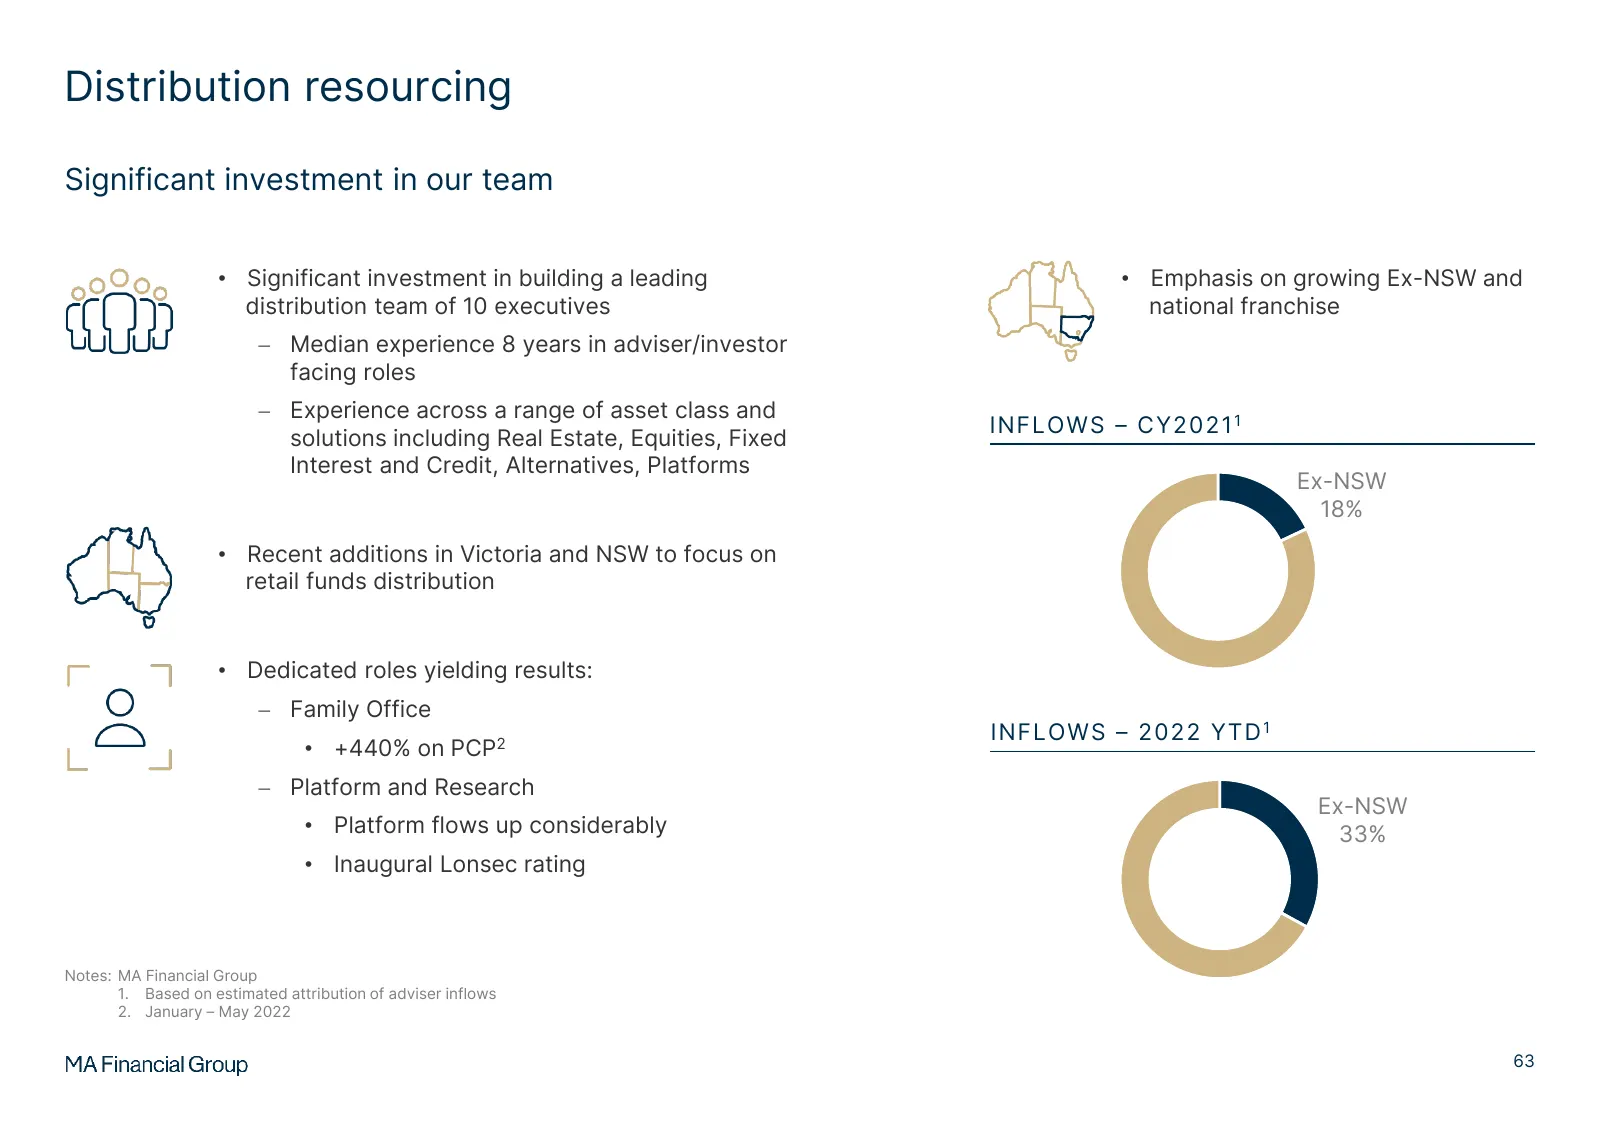
Distribution resourcing Significant investment in our team • Significant investment in building a leading • Emphasis on growing Ex-NSW and distribution team of 10 executives national franchise − Median experience 8 years in adviser/investor facing roles − Experience across a range of asset class and
Slide 66: Client engagement
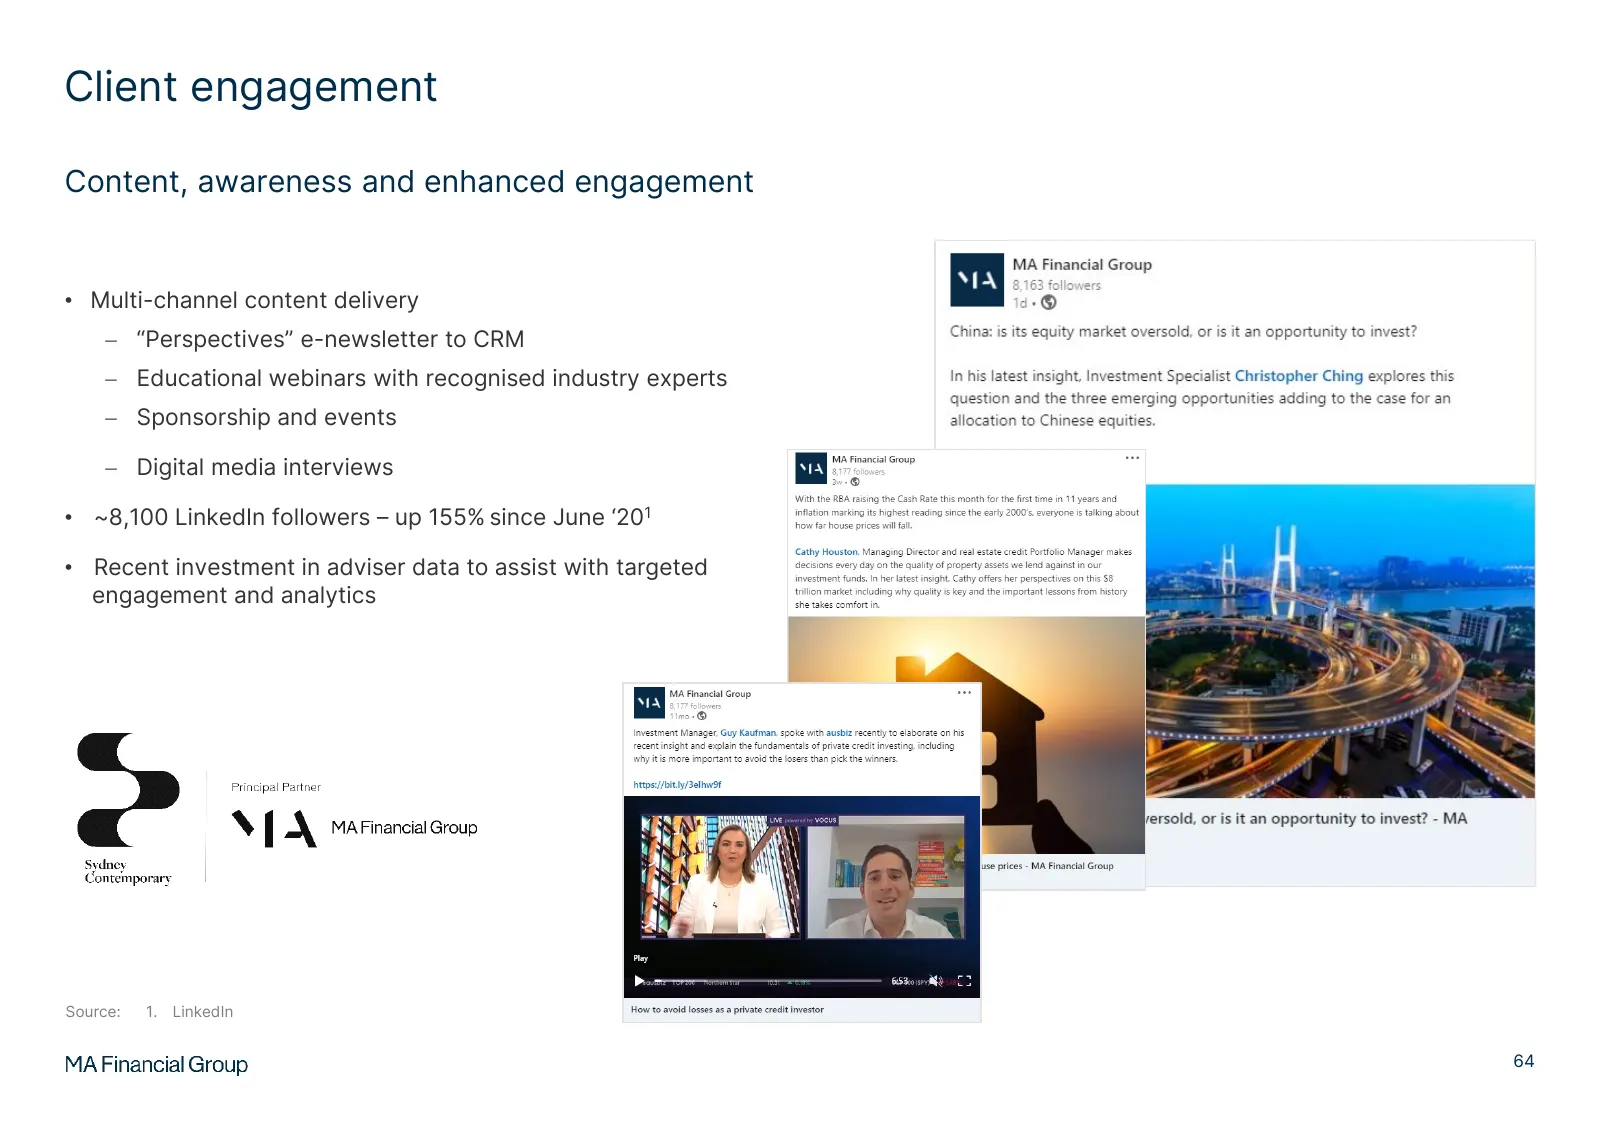
Client engagement Content, awareness and enhanced engagement • Multi-channel content delivery − “Perspectives” e-newsletter to CRM − Educational webinars with recognised industry experts − Sponsorship and events − Digital media interviews • ~8,100 LinkedIn followers – up 155% since June ‘201 • Recen
Slide 67: Upside and focus
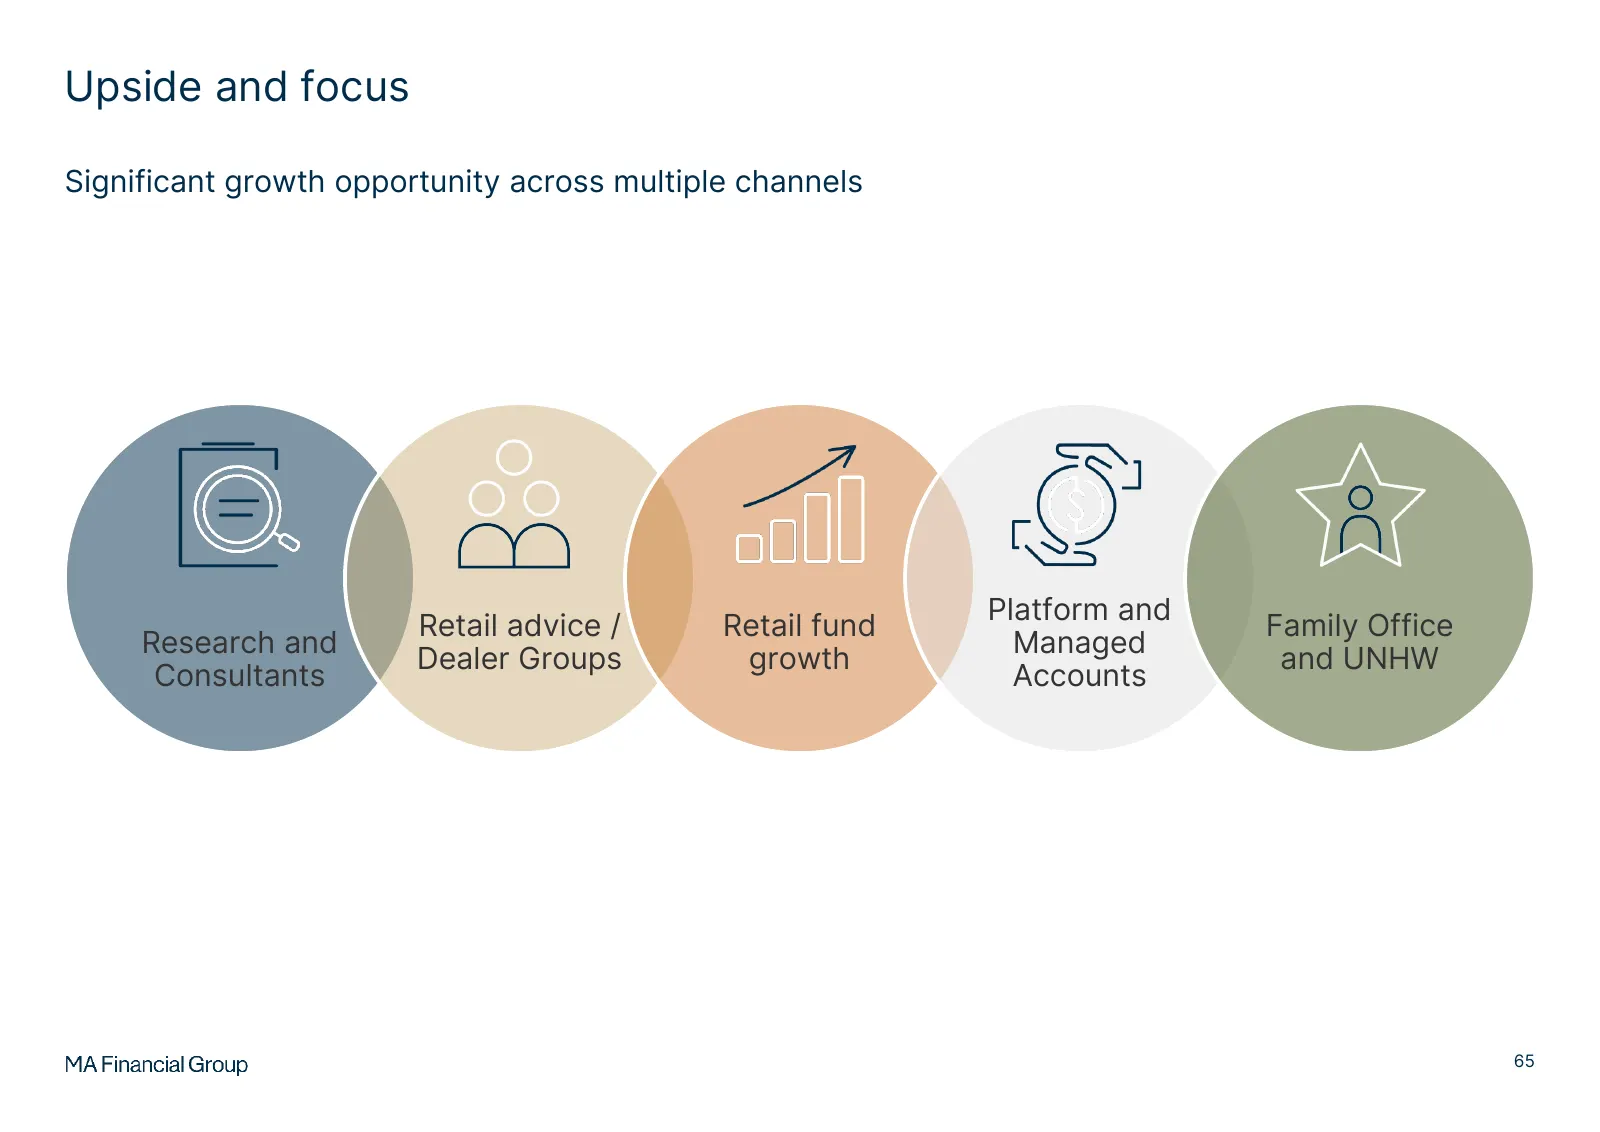
Upside and focus Significant growth opportunity across multiple channels Platform and Retail advice / Retail fund Family Office Research and Managed Dealer Groups growth and UNHW Consultants Accounts 65
Slide 68: Questions
Questions Andrew Martin – Head of Asset Management Lee Hayes – Managing Director, Distribution 66
Slide 69: Investor Day 2022: A diverse growth platform
Investor Day 2022 Julian Biggins A diverse growth platform Joint CEO
Slide 70: Disclaimer
Disclaimer The material in this presentation has been prepared by MA Financial Group Limited ACN 68 142 008 428 (MA Financial) and is general background information about MA Financial Group activities current as at the date of this presentation. This information is given in summary form and does not
Source: ASX announcement via 6ix News
More decks from MA Financial Group Limited
 H1 2026 Earnings Presentation60 slides · Aug 20, 2026
 FY2025 Earnings Presentation60 slides · Feb 19, 2026
 1H25 Earnings Presentation57 slides · Aug 21, 2025
 FY2024 Earnings Presentation63 slides · Feb 20, 2025
 1H24 Earnings Presentation60 slides · Aug 22, 2024
 FY2023 Earnings Presentation65 slides · Feb 22, 2024