TPG Inc. · NASDAQ:TPG
TPG — H1 2001 Earnings Presentation
62 slides from TPG's earnings presentation, Aug 9, 2001

Slide 1: Analyst presentation 9 August 2001
Analyst presentation 9 August 2001

Slide 2: 2001 First Half Results
2001 First Half Results Page 2 9 August, 2001

Slide 3: Agenda
Agenda ò Business Review ò Financial Review Page 3 9 August, 2001

Slide 4: Business Review
Business Review Page 4 9 August, 2001
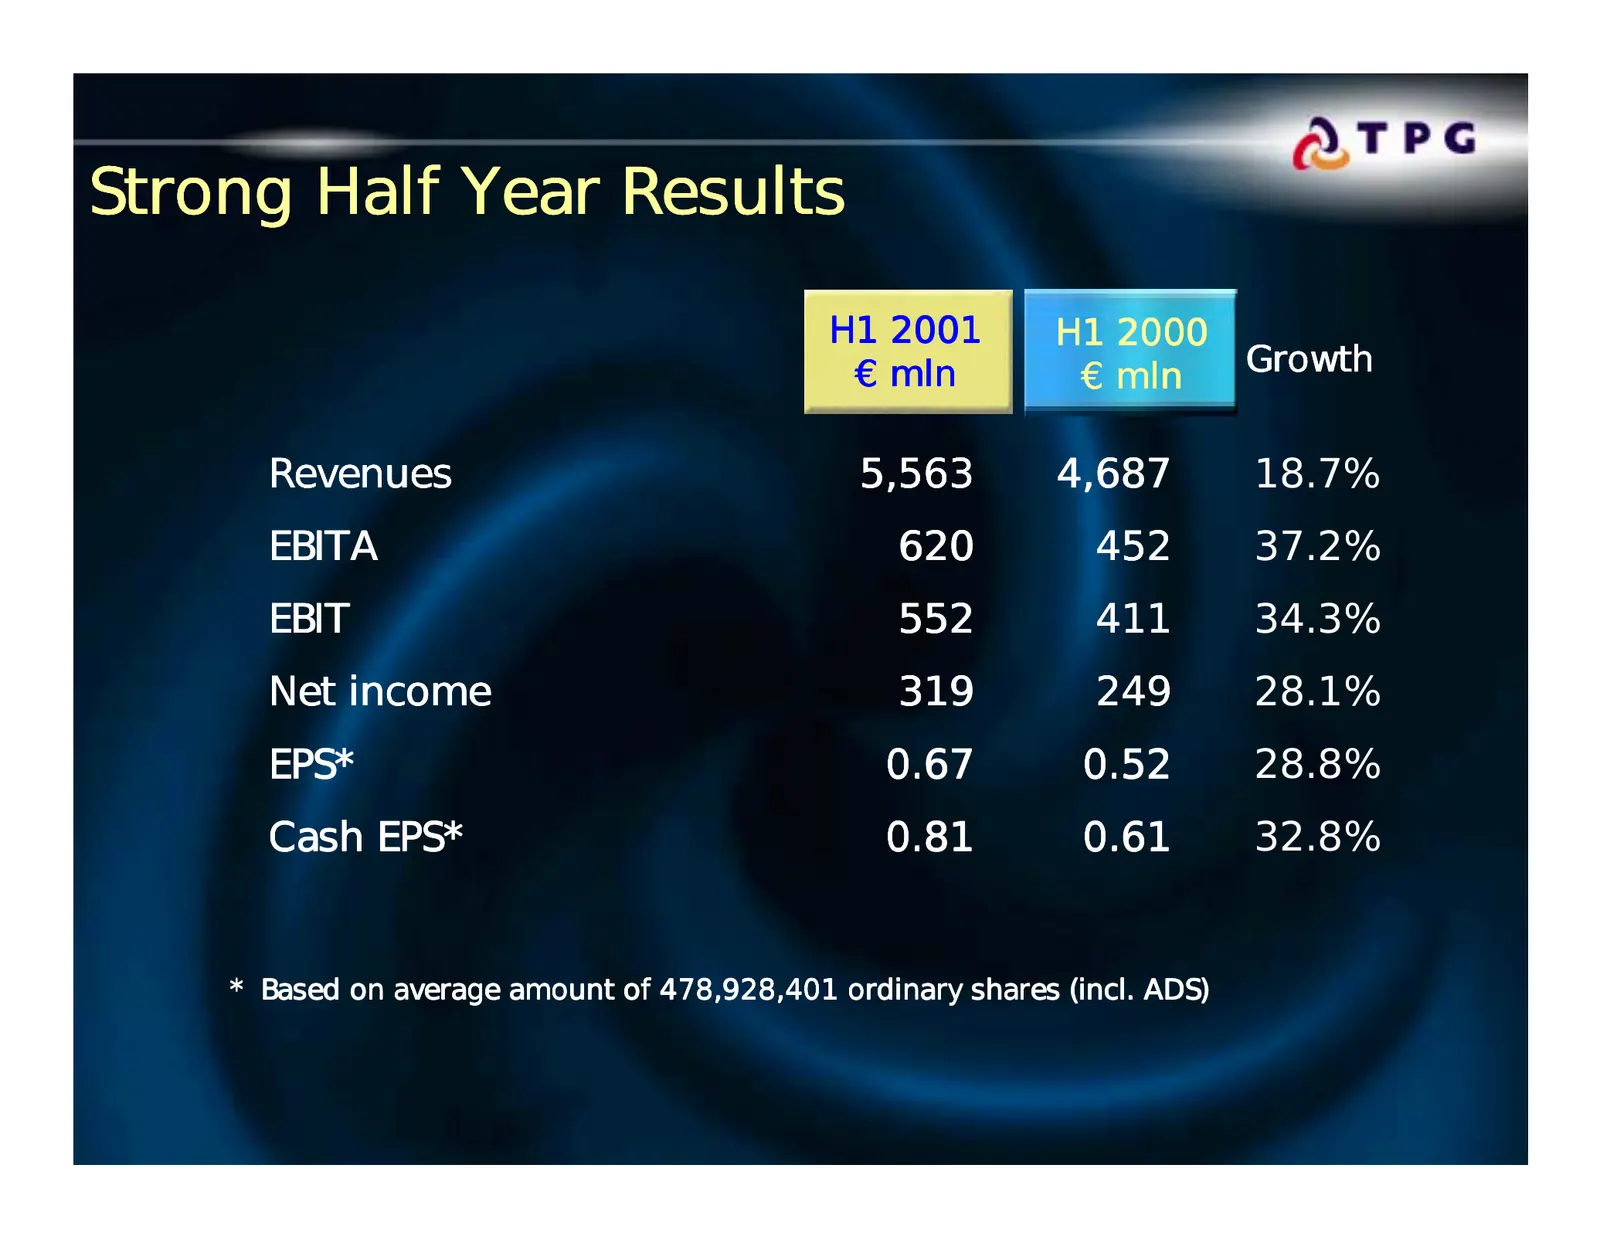
Slide 5: Strong Half Year Results
Strong Half Year Results H1 2001 H1 2000 € mln € mln Growth Revenues 5,563 4,687 18.7% EBITA 620 452 37.2% EBIT 552 411 34.3% Net income 319 249 28.1% EPS* 0.67 0.52 28.8% Cash EPS* 0.81 0.61 32.8% * Based on average amount of 478,928,401 ordinary shares (incl. ADS) Page 5 9 August, 2001
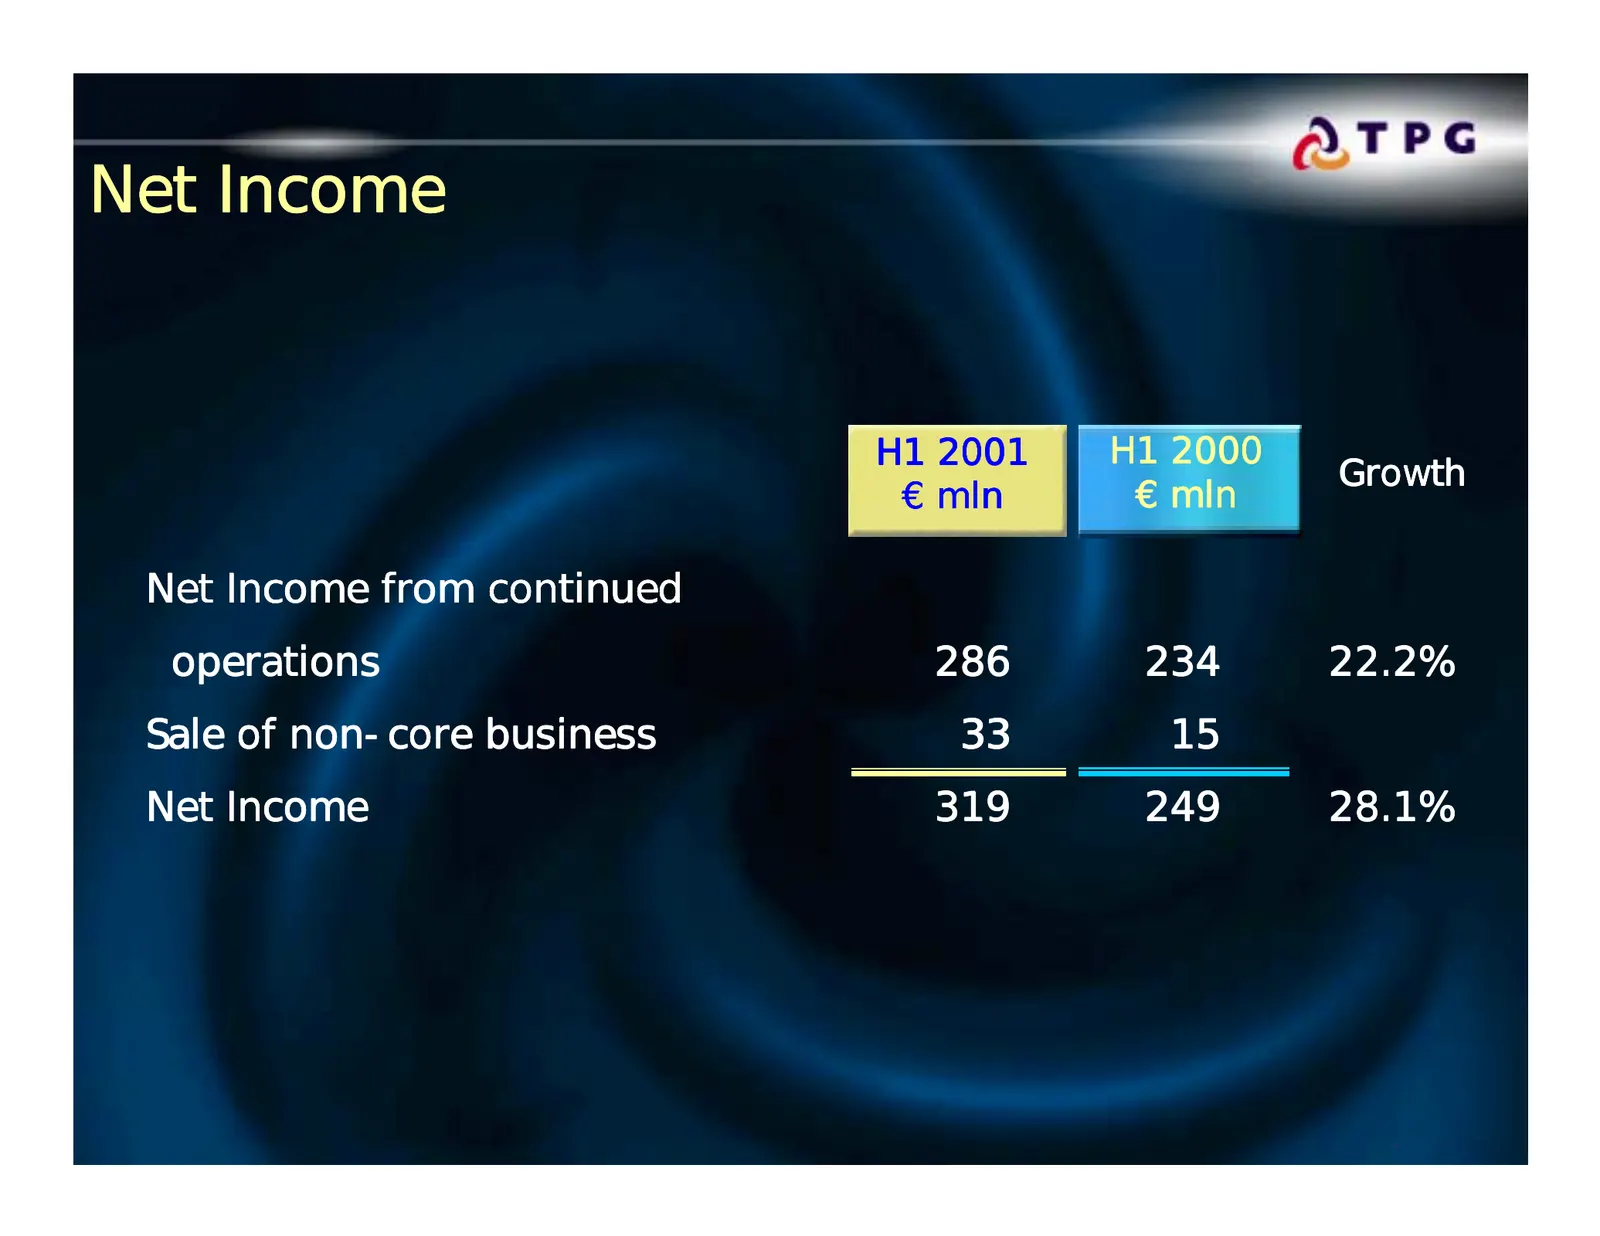
Slide 6: Net Income
Net Income H1 2001 H1 2000 Growth € mln € mln Net Income from continued operations 286 234 22.2% Sale of non-core business 33 15 Net Income 319 249 28.1% Page 6 9 August, 2001
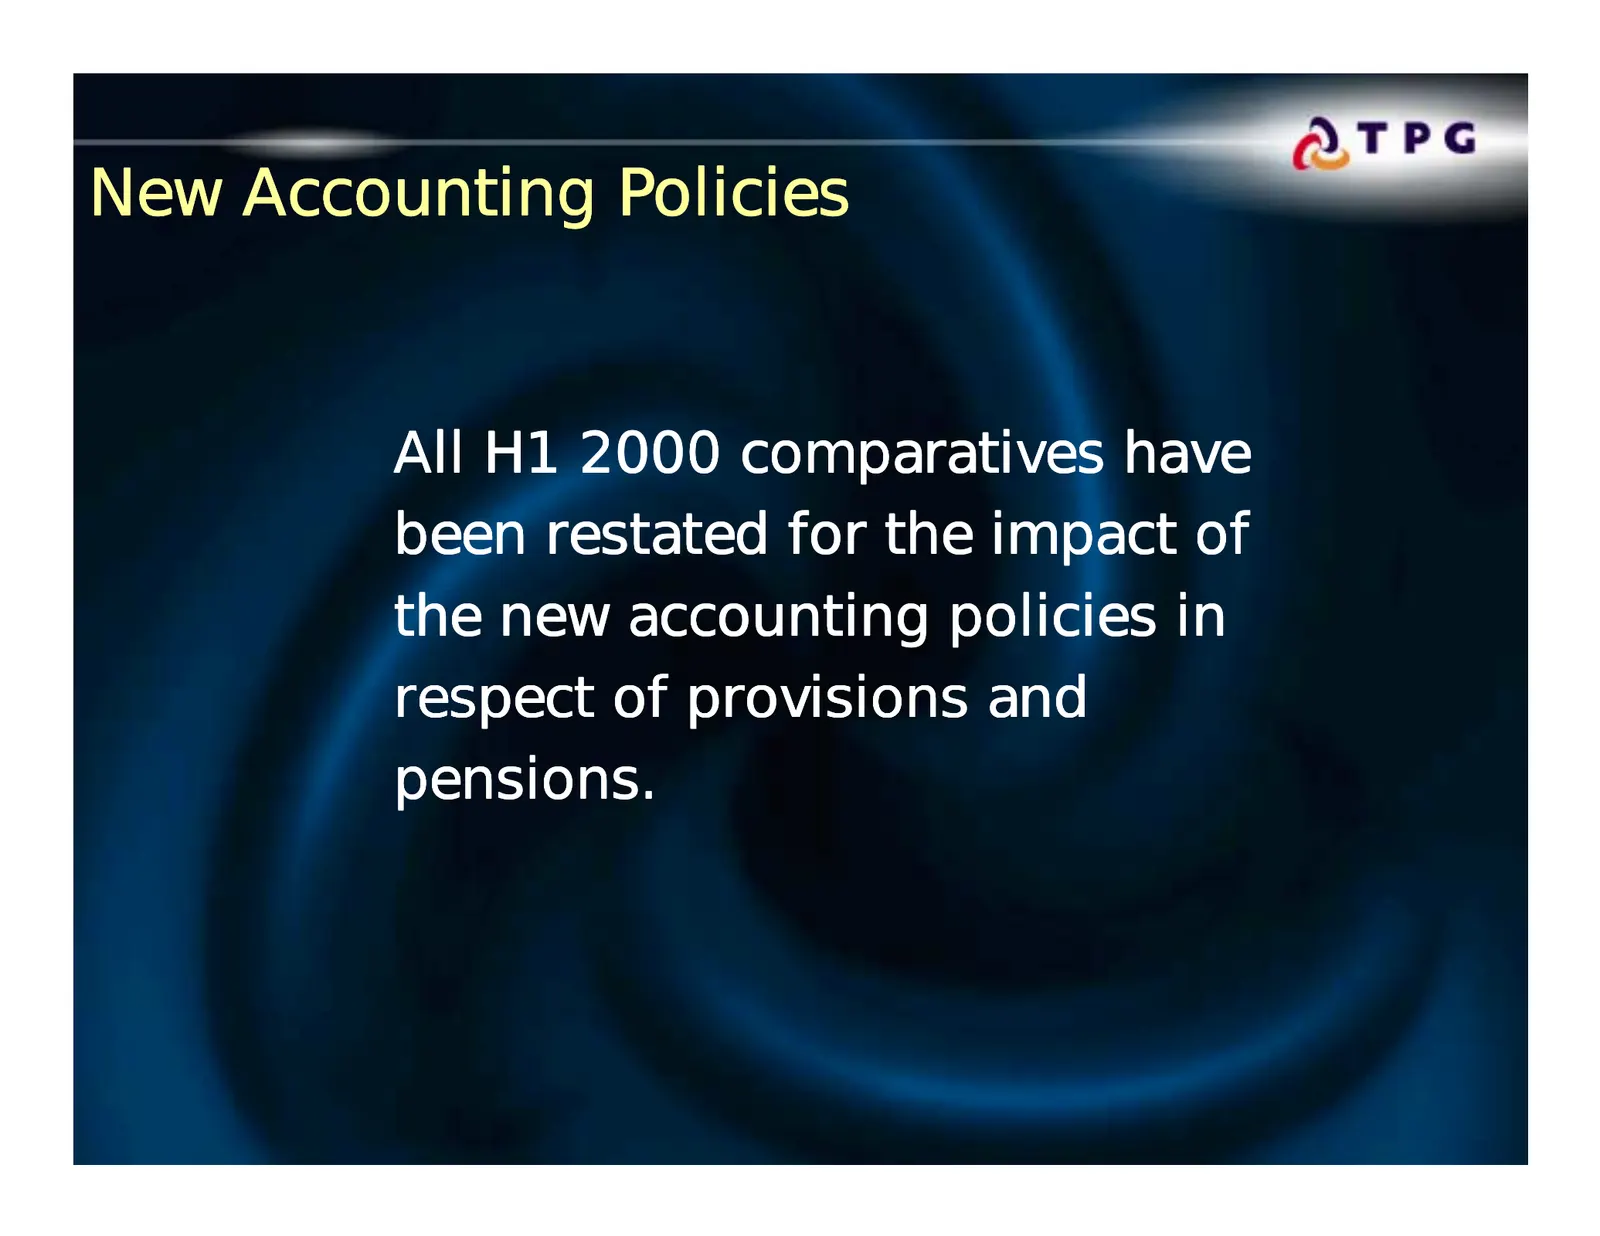
Slide 7: New Accounting Policies
New Accounting Policies All H1 2000 comparatives have been restated for the impact of the new accounting policies in respect of provisions and pensions. Page 7 9 August, 2001
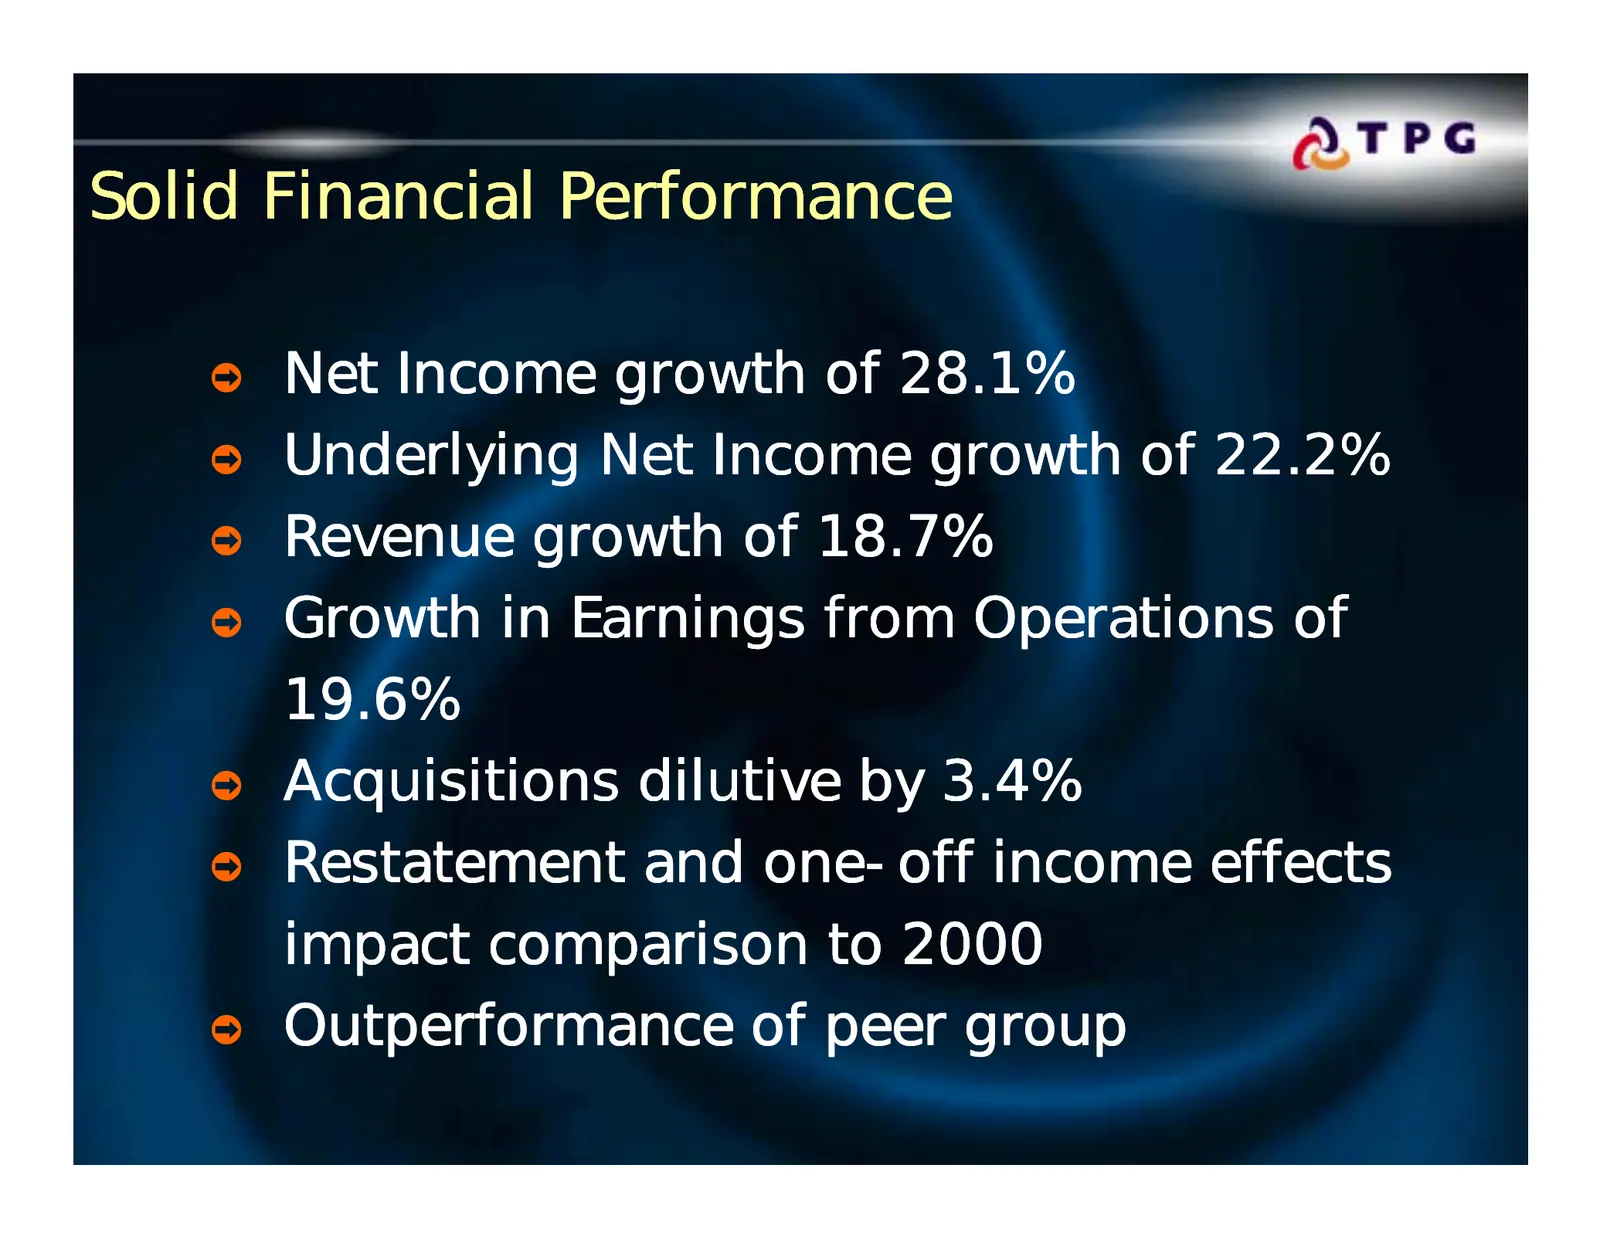
Slide 8: Solid Financial Performance
Solid Financial Performance ò Net Income growth of 28.1% ò Underlying Net Income growth of 22.2% ò Revenue growth of 18.7% ò Growth in Earnings from Operations of 19.6% ò Acquisitions dilutive by 3.4% ò Restatement and one-off income effects impact comparison to 2000 ò Outperformance of peer group P
Slide 9: Business Highlights
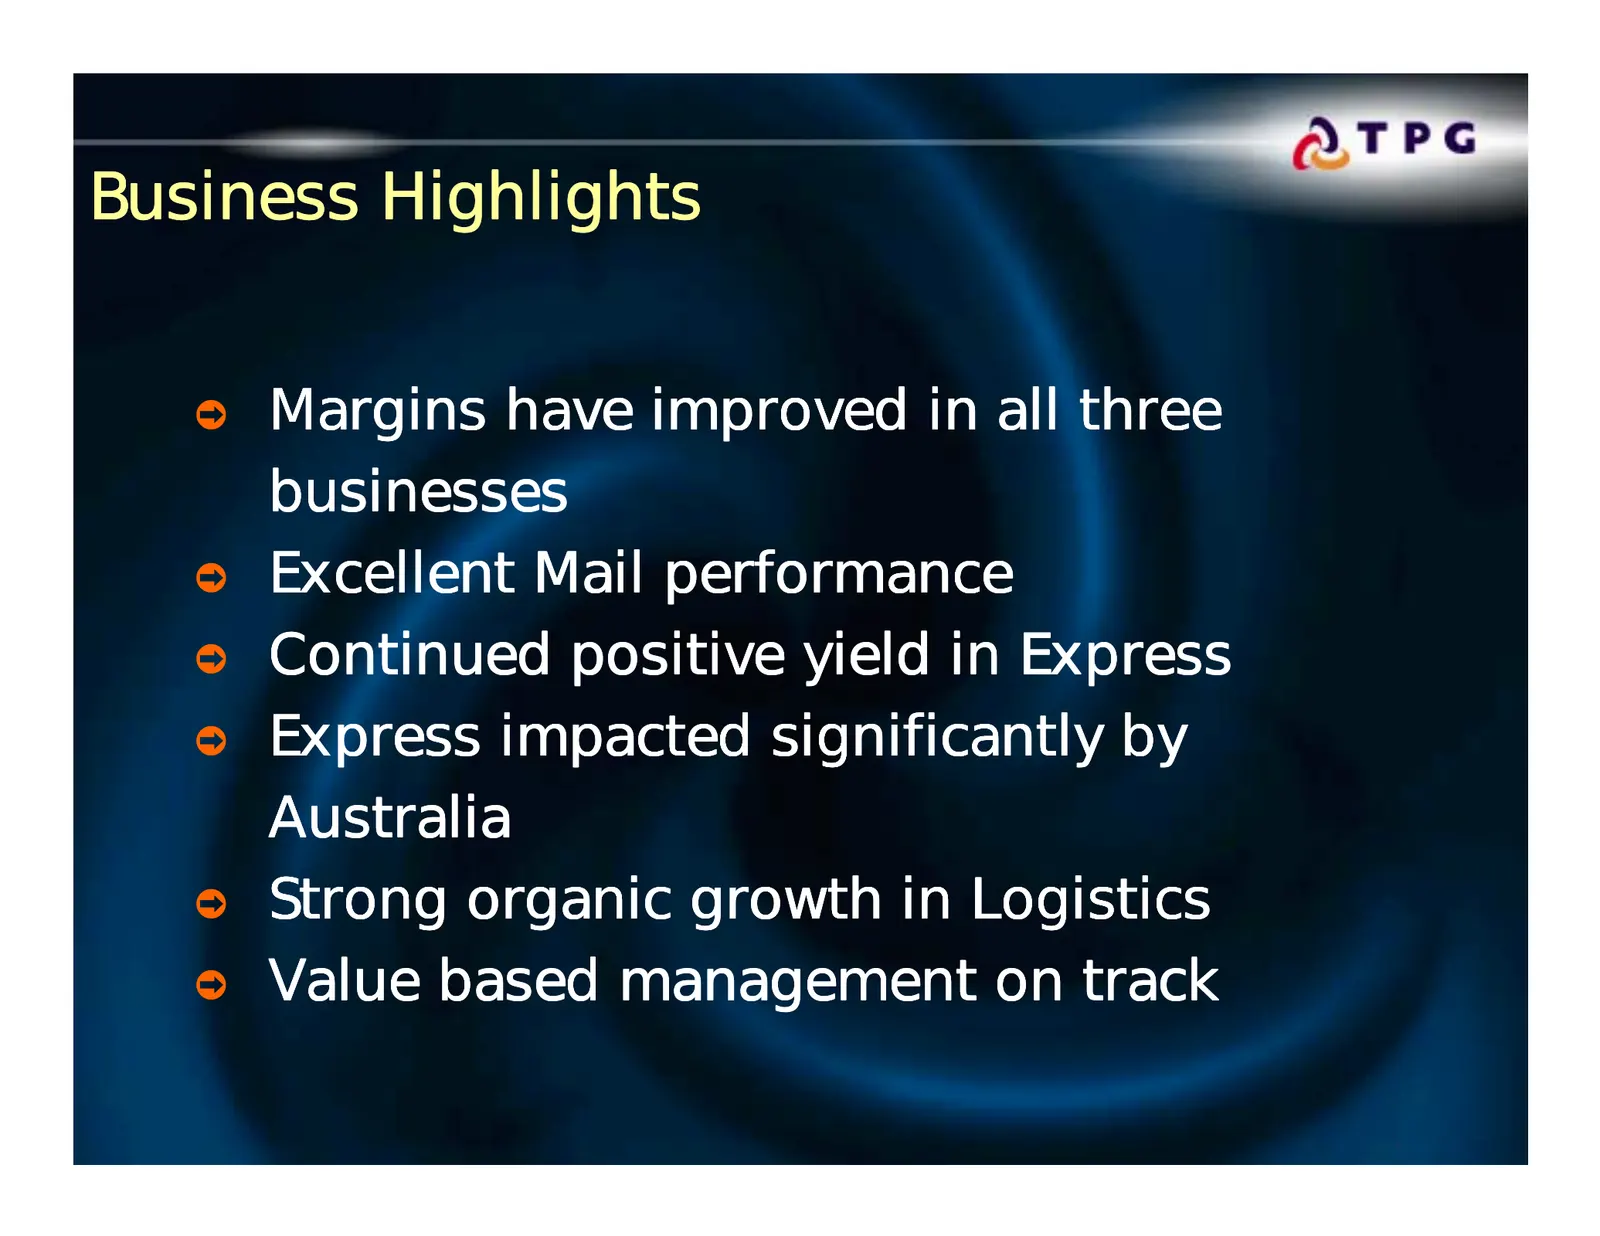
Business Highlights ò Margins have improved in all three businesses ò Excellent Mail performance ò Continued positive yield in Express ò Express impacted significantly by Australia ò Strong organic growth in Logistics ò Value based management on track Page 9 9 August, 2001
Slide 10: Systematic Strategic Progress
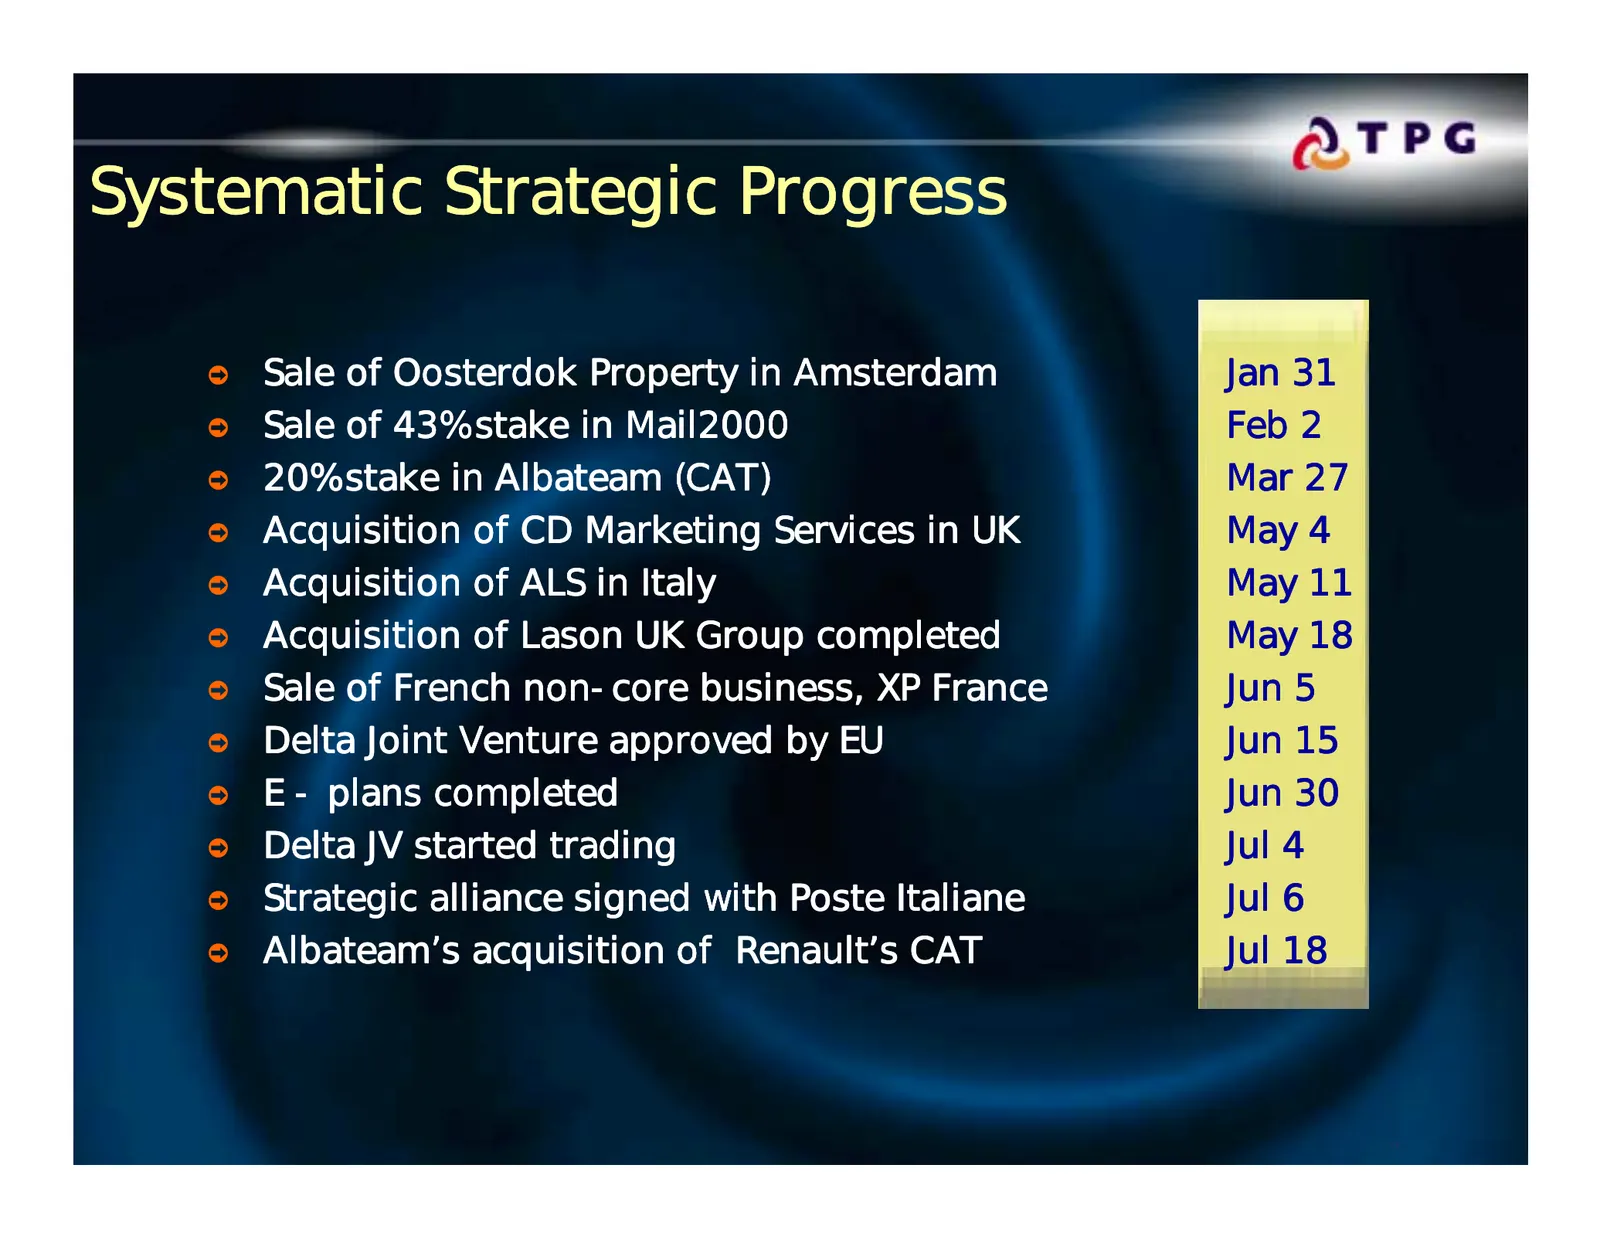
Systematic Strategic Progress ò Sale of Oosterdok Property in Amsterdam Jan 31 ò Sale of 43% stake in Mail2000 Feb 2 ò 20% stake in Albateam (CAT) Mar 27 ò Acquisition of CD Marketing Services in UK May 4 ò Acquisition of ALS in Italy May 11 ò Acquisition of Lason UK Group completed May 18 ò Sale of
Slide 11: Group Revenues
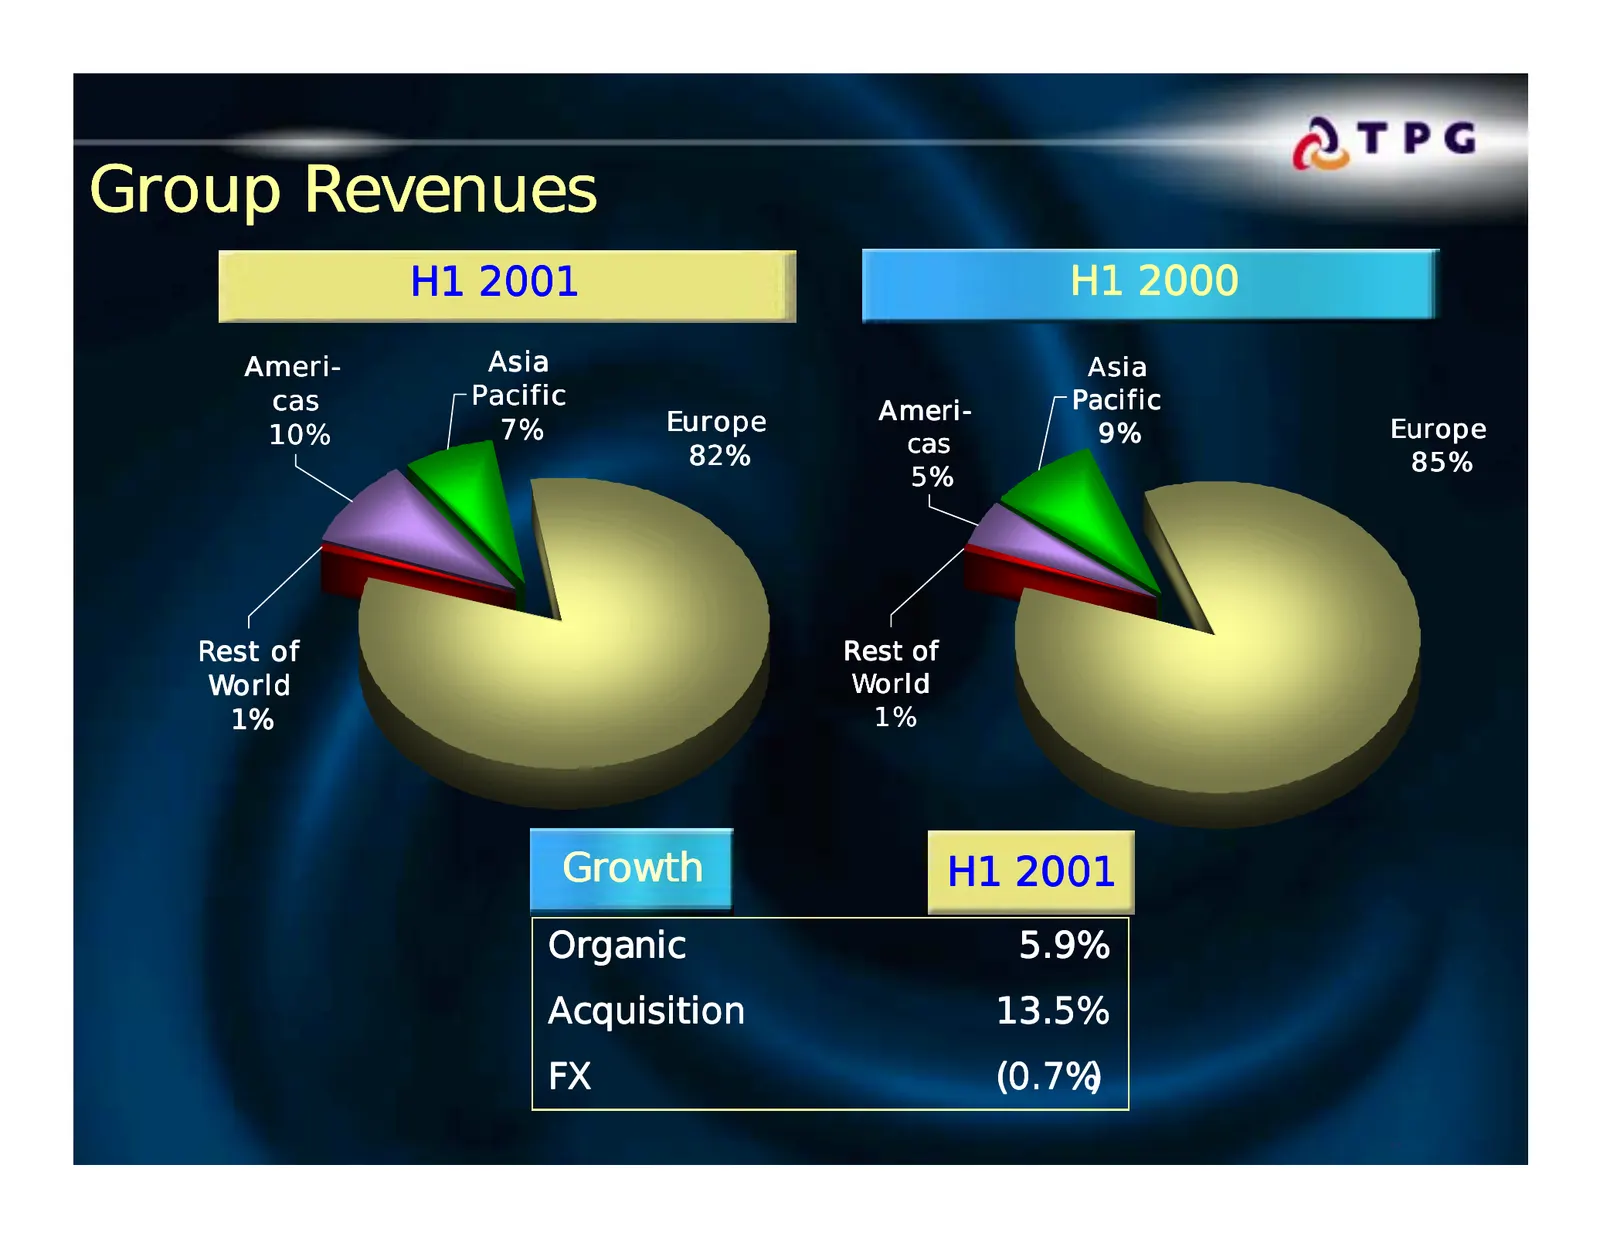
Group Revenues H1 2001 H1 2000 Ameri- Asia Asia cas Pacific Pacific Europe Ameri- 10% 7% cas 9% Europe 82% 85% 5% Rest of Rest of World World 1% 1% Growth H1 2001 Organic 5.9% Acquisition 13.5% FX (0.7%) Page 11 9 August, 2001
Slide 12: Split by Business
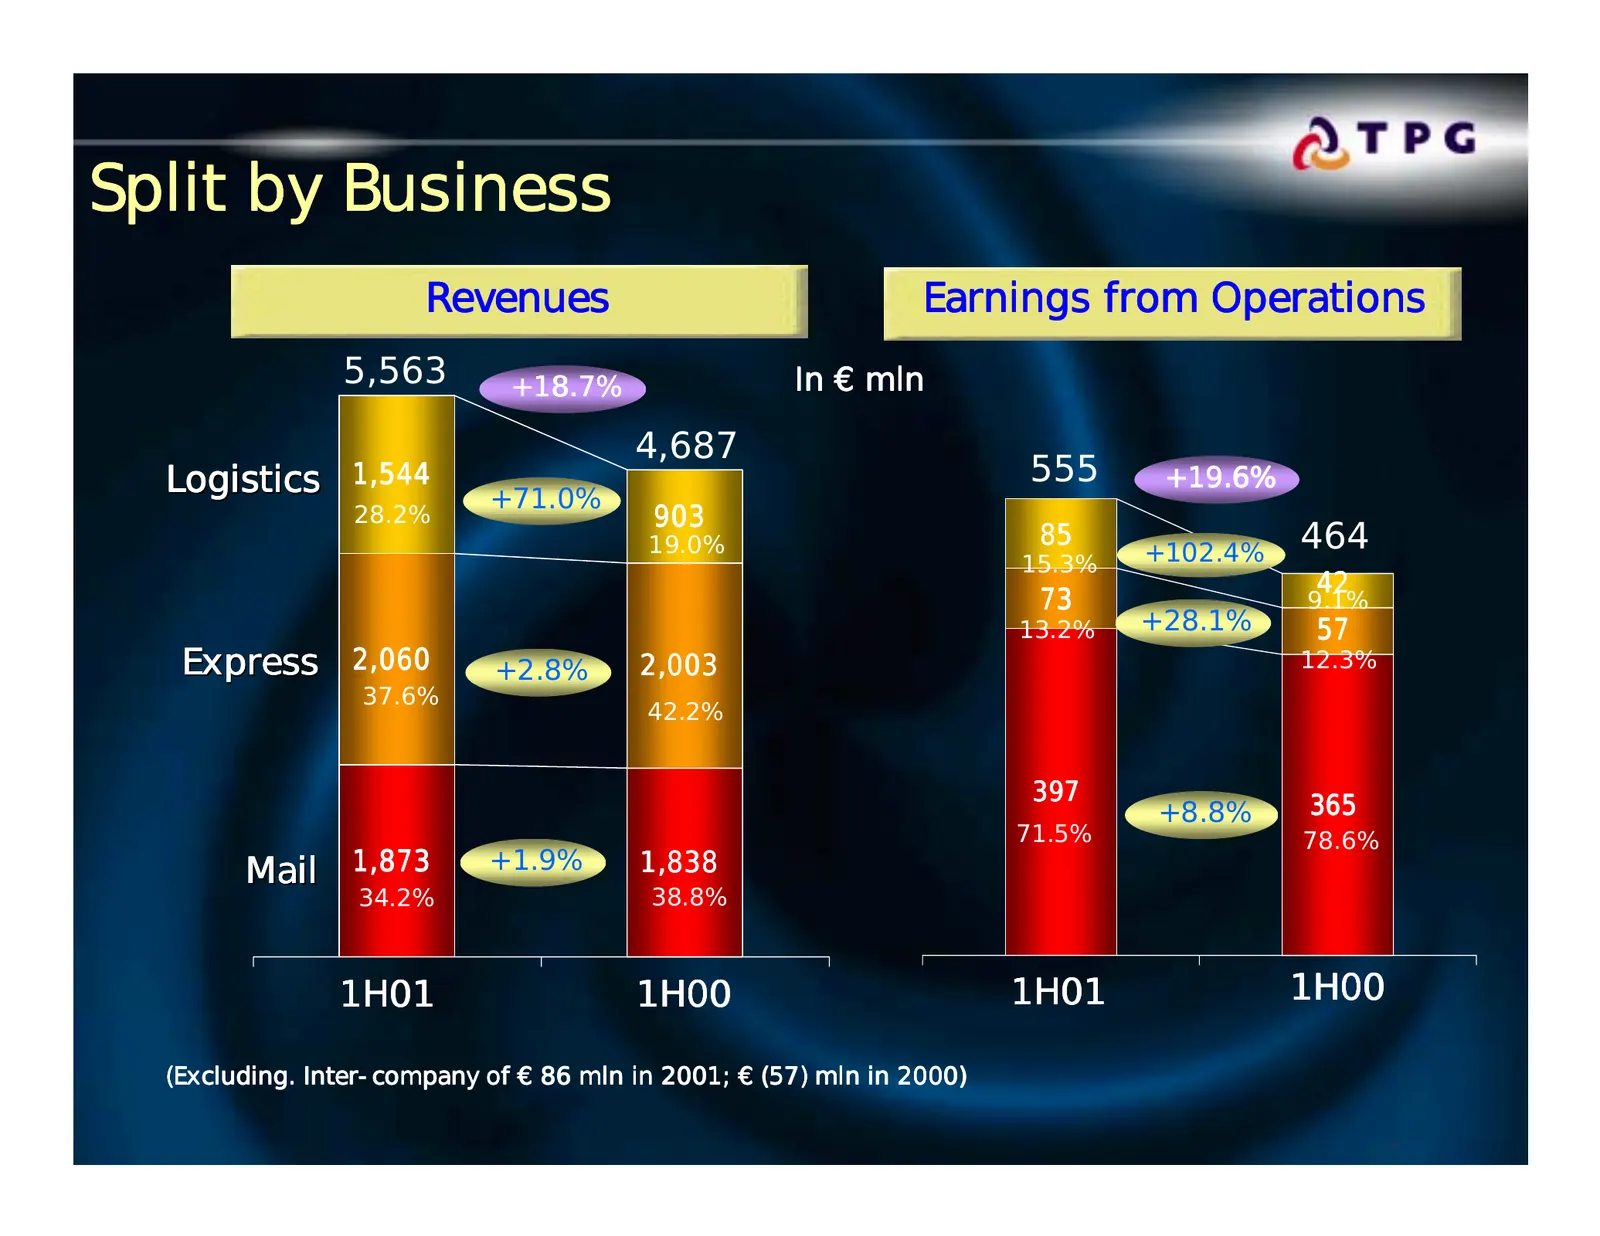
Split by Business Revenues Earnings from Operations 5,563 +18.7% In € mln 4,687 Logistics 1,544 555 +19.6% +71.0% 28.2% 903 19.0% 85 +102.4% 464 15.3% 42 73 9.1% 13.2% +28.1% 57 Express 2,060 +2.8% 2,003 12.3% 37.6% 42.2% 397 365 +8.8% 71.5% 78.6% Mail 1,873 +1.9% 1,838 34.2% 38.8% 1H01 1H00 1H01 1H

Slide 13: Mail
Page 13 9 August, 2001
Slide 14: Overview
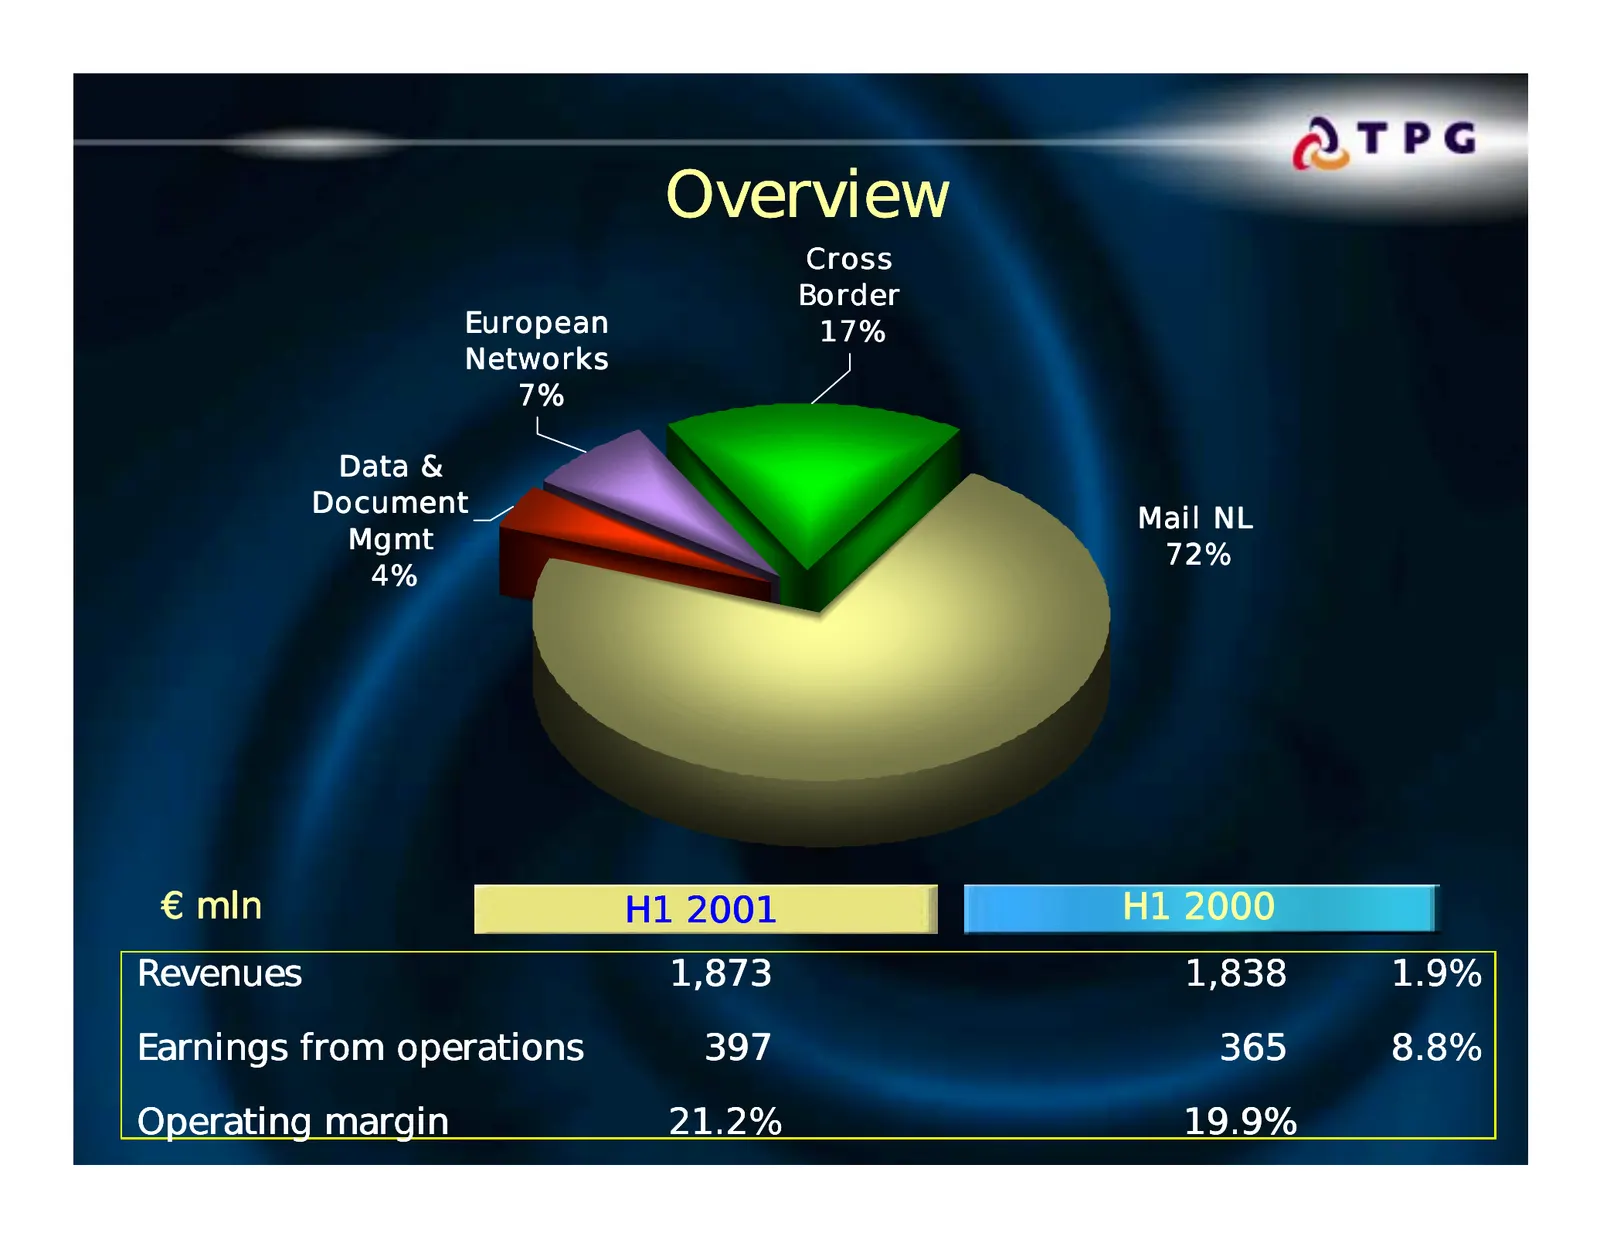
Overview Cross Border European 17% Networks 7% Data & Document Mail NL Mgmt 72% 4% € mln H1 2001 H1 2000 Revenues 1,873 1,838 1.9% Earnings from operations 397 365 8.8% Page Operating margin 21.2% 19.9% 14 9 August, 2001
Slide 15: Revenue Restatement
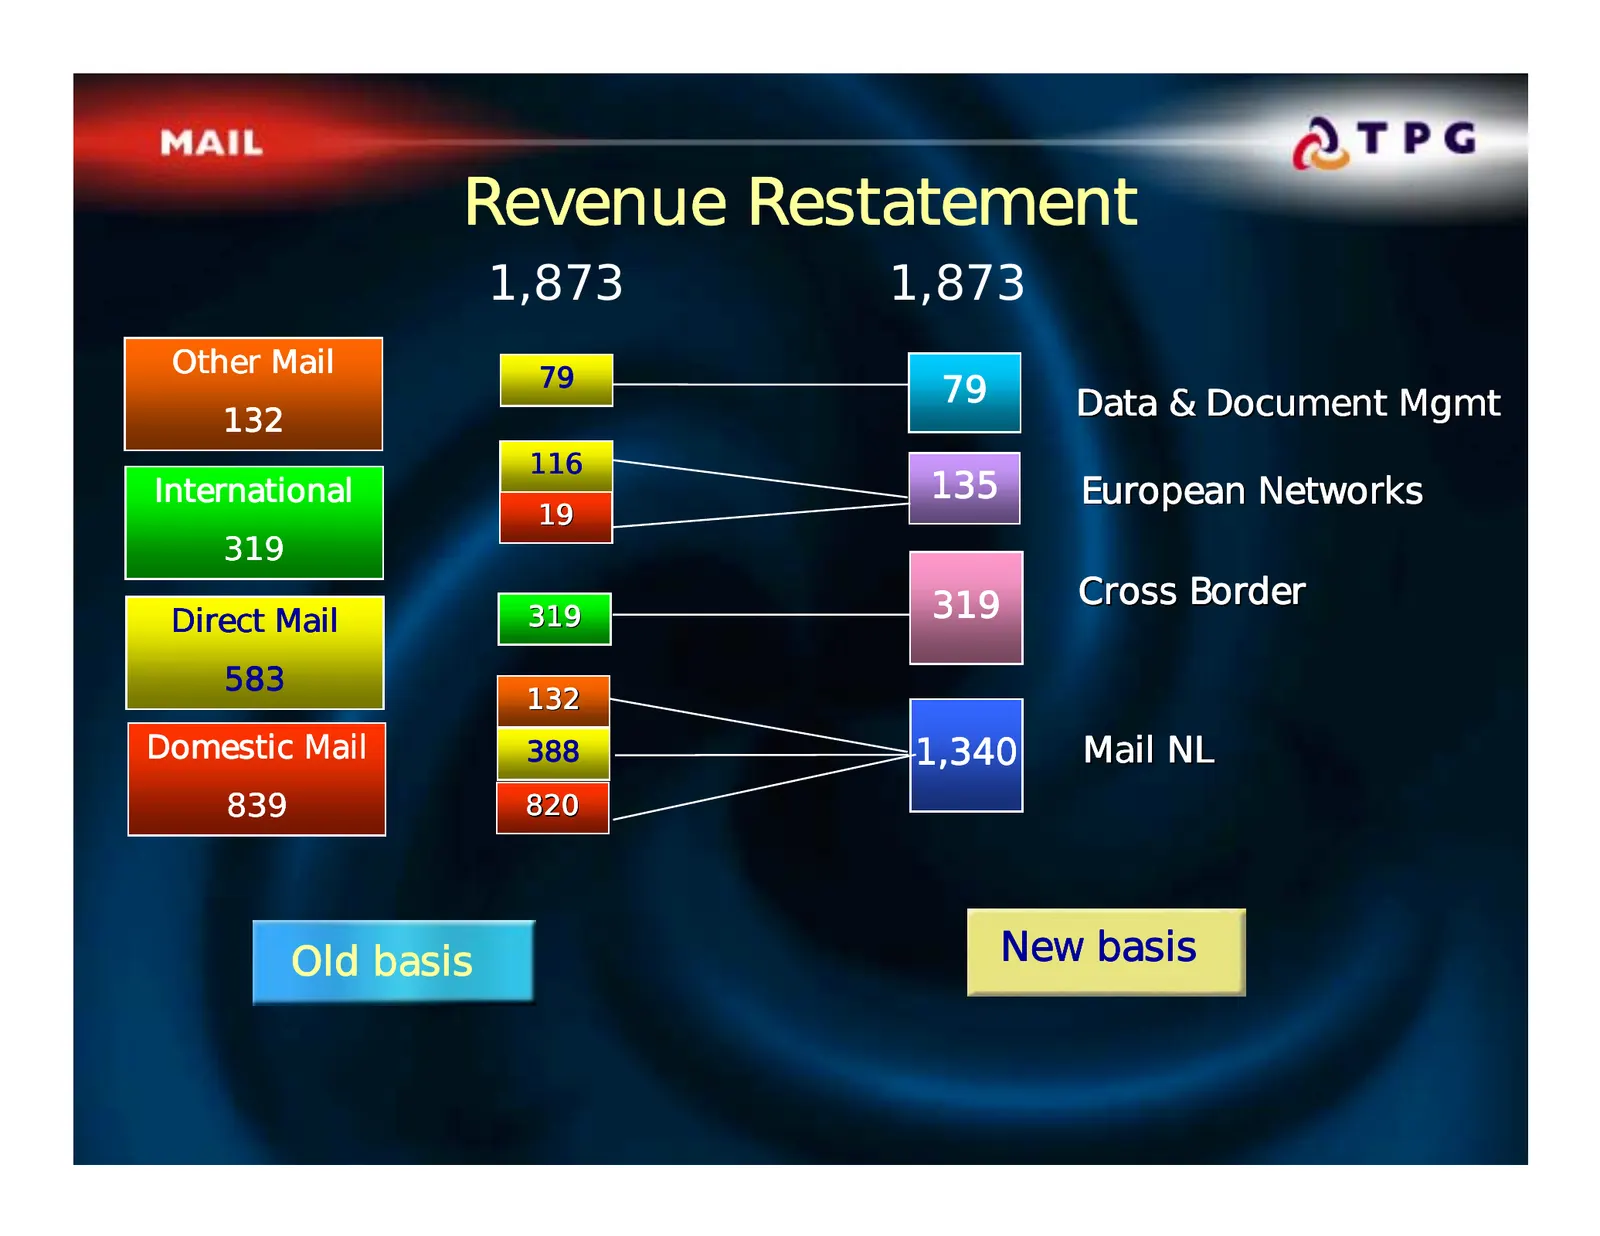
Revenue Restatement 1,873 1,873 Other Mail 79 79 Data & Document Mgmt 132 116 International 135 European Networks 19 319 319 Cross Border Direct Mail 319 583 132 Domestic Mail 388 1,340 Mail NL 839 820 Old basis New basis Page 15 9 August, 2001
Slide 16: Excellent Mail Performance
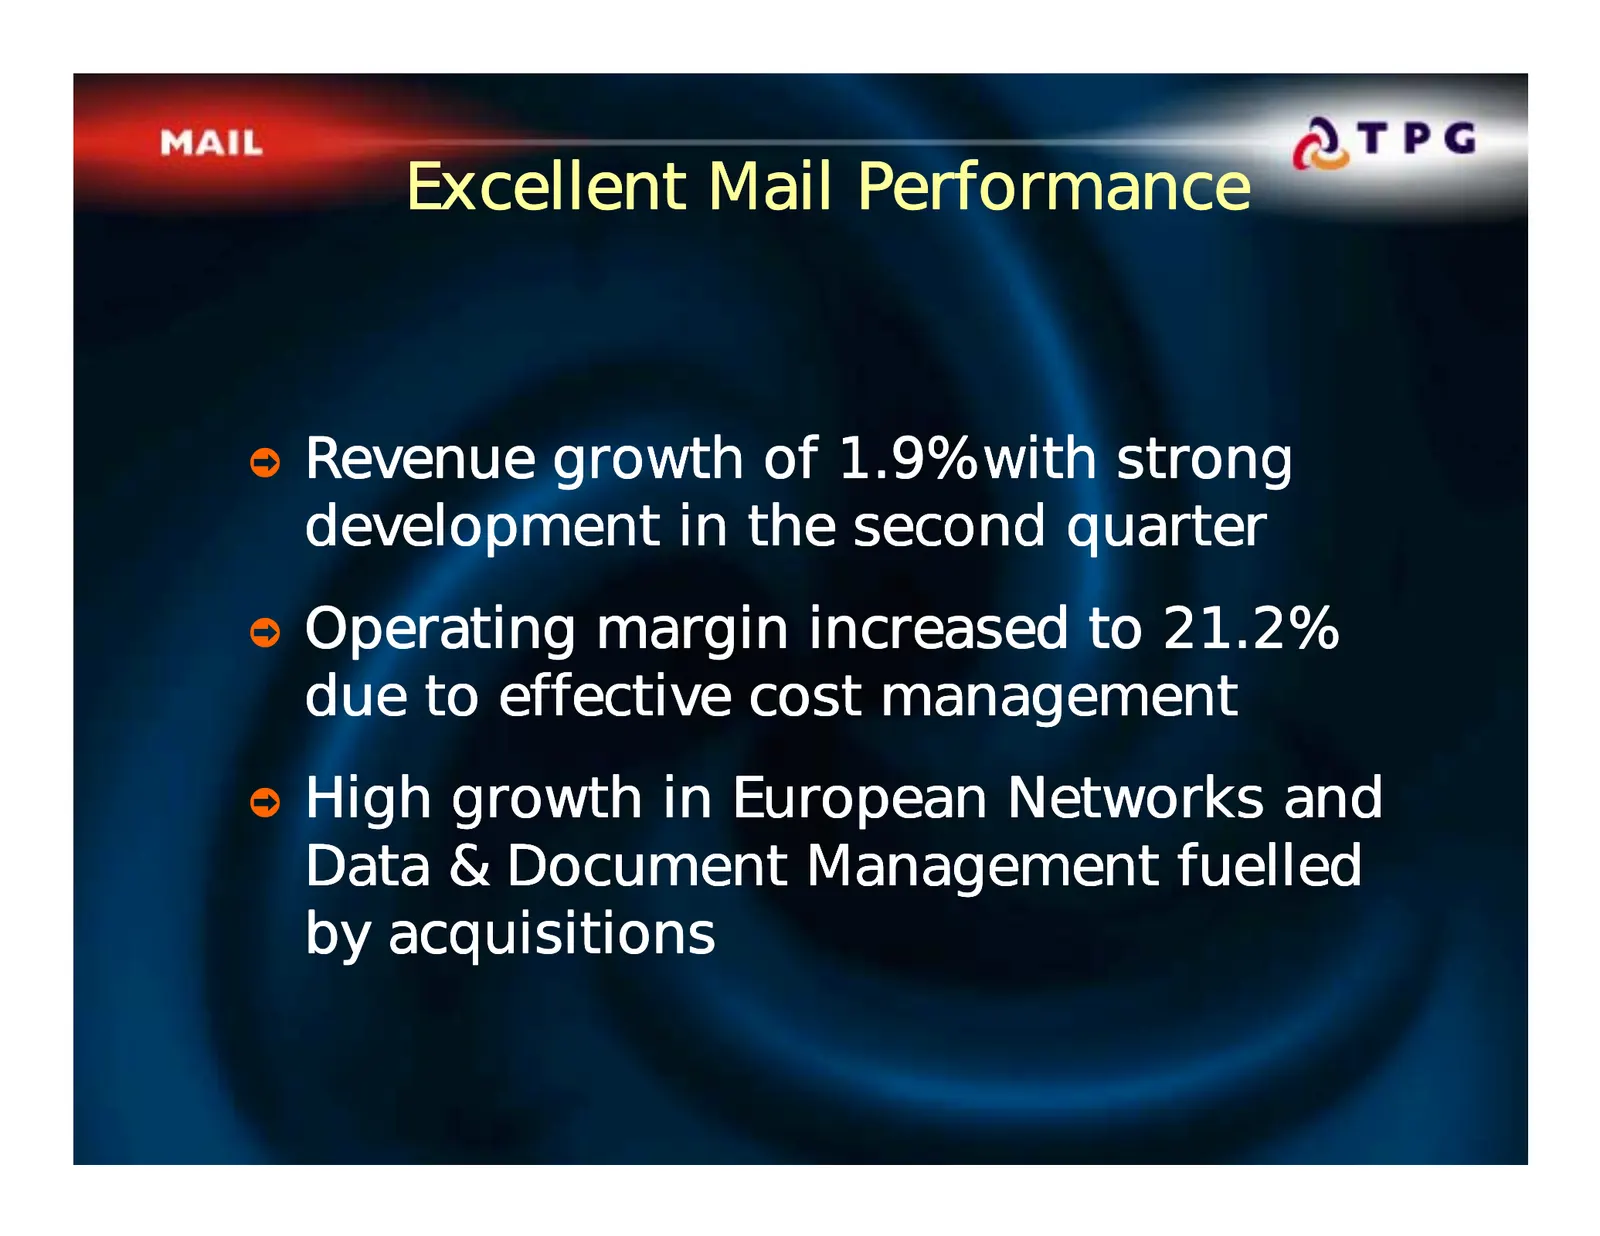
Excellent Mail Performance ò Revenue growth of 1.9% with strong development in the second quarter ò Operating margin increased to 21.2% due to effective cost management ò High growth in European Networks and Data & Document Management fuelled by acquisitions Page 16 9 August, 2001
Slide 17: Revenue Growth
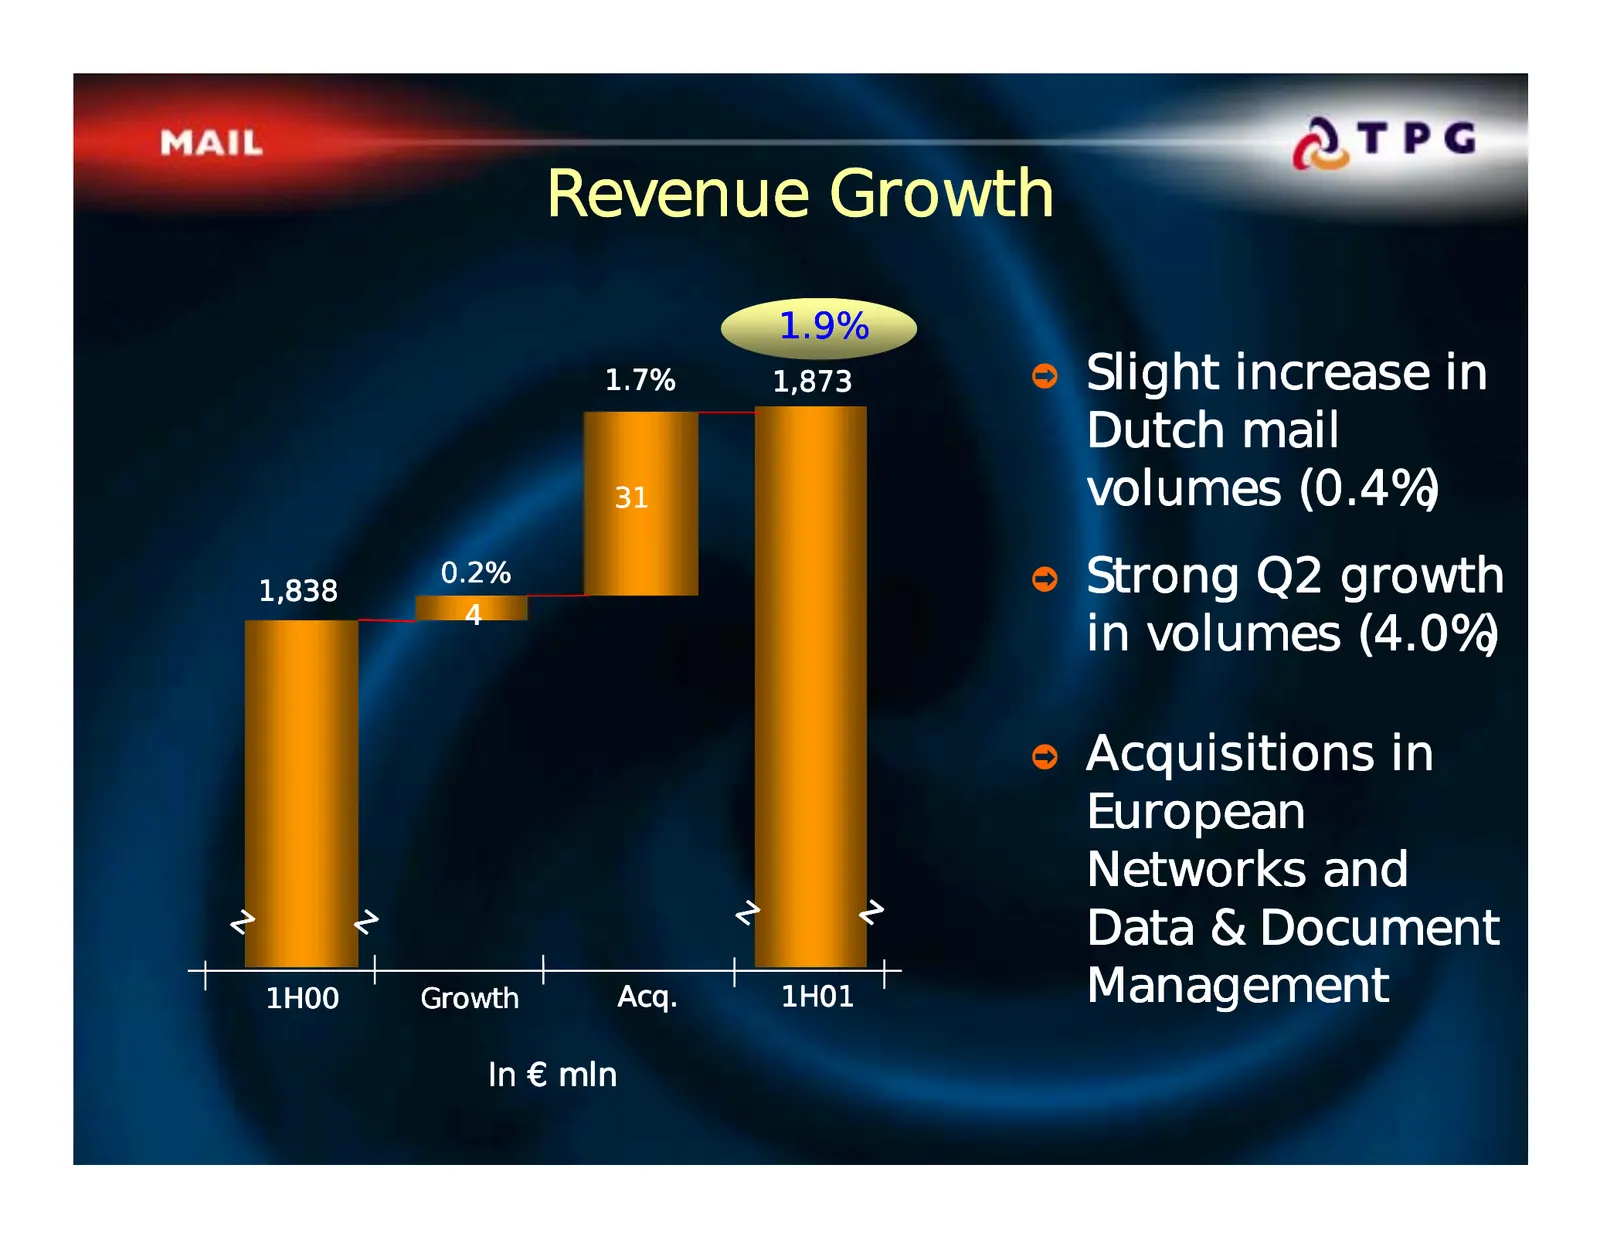
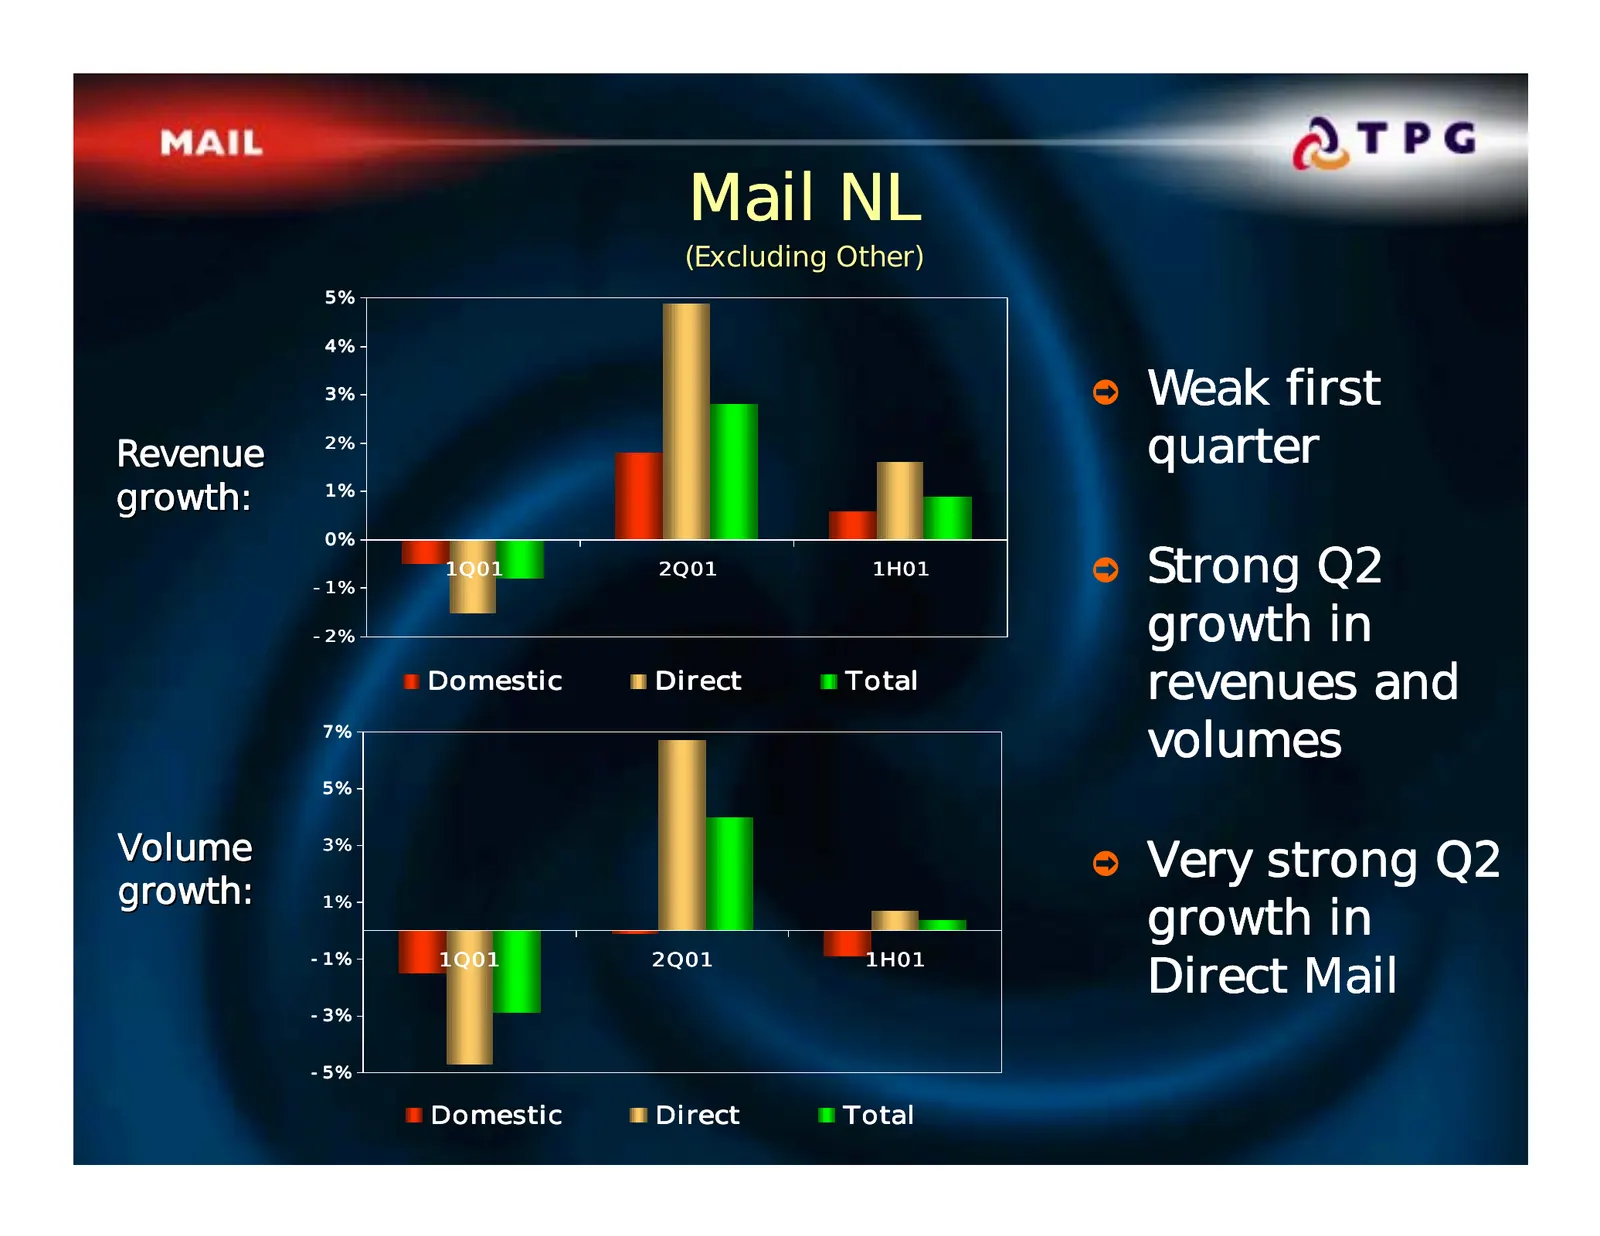
Revenue Growth 1.9% 1.7% 1,873 ò Slight increase in Dutch mail 31 volumes (0.4%) 1,838 0.2% ò Strong Q2 growth 4 in volumes (4.0%) ò Acquisitions in European Networks and z z z z Data & Document 1H00 Growth Acq. 1H01 Management In € mln Page 17 9 August, 2001
Slide 18: Mail NL
Mail NL (Excluding Other) 5% 4% 3% ò Weak first Revenue 2% quarter growth: 1% 0% -1% 1Q01 2Q01 1H01 ò Strong Q2 -2% growth in Domestic Direct Total revenues and 7% volumes 5% Volume 3% ò Very strong Q2 growth: growth in 1% Direct Mail -1% 1Q01 2Q01 1H01 -3% -5% Page Domestic Direct Total 18 9 August
Slide 19: Delta Joint Venture
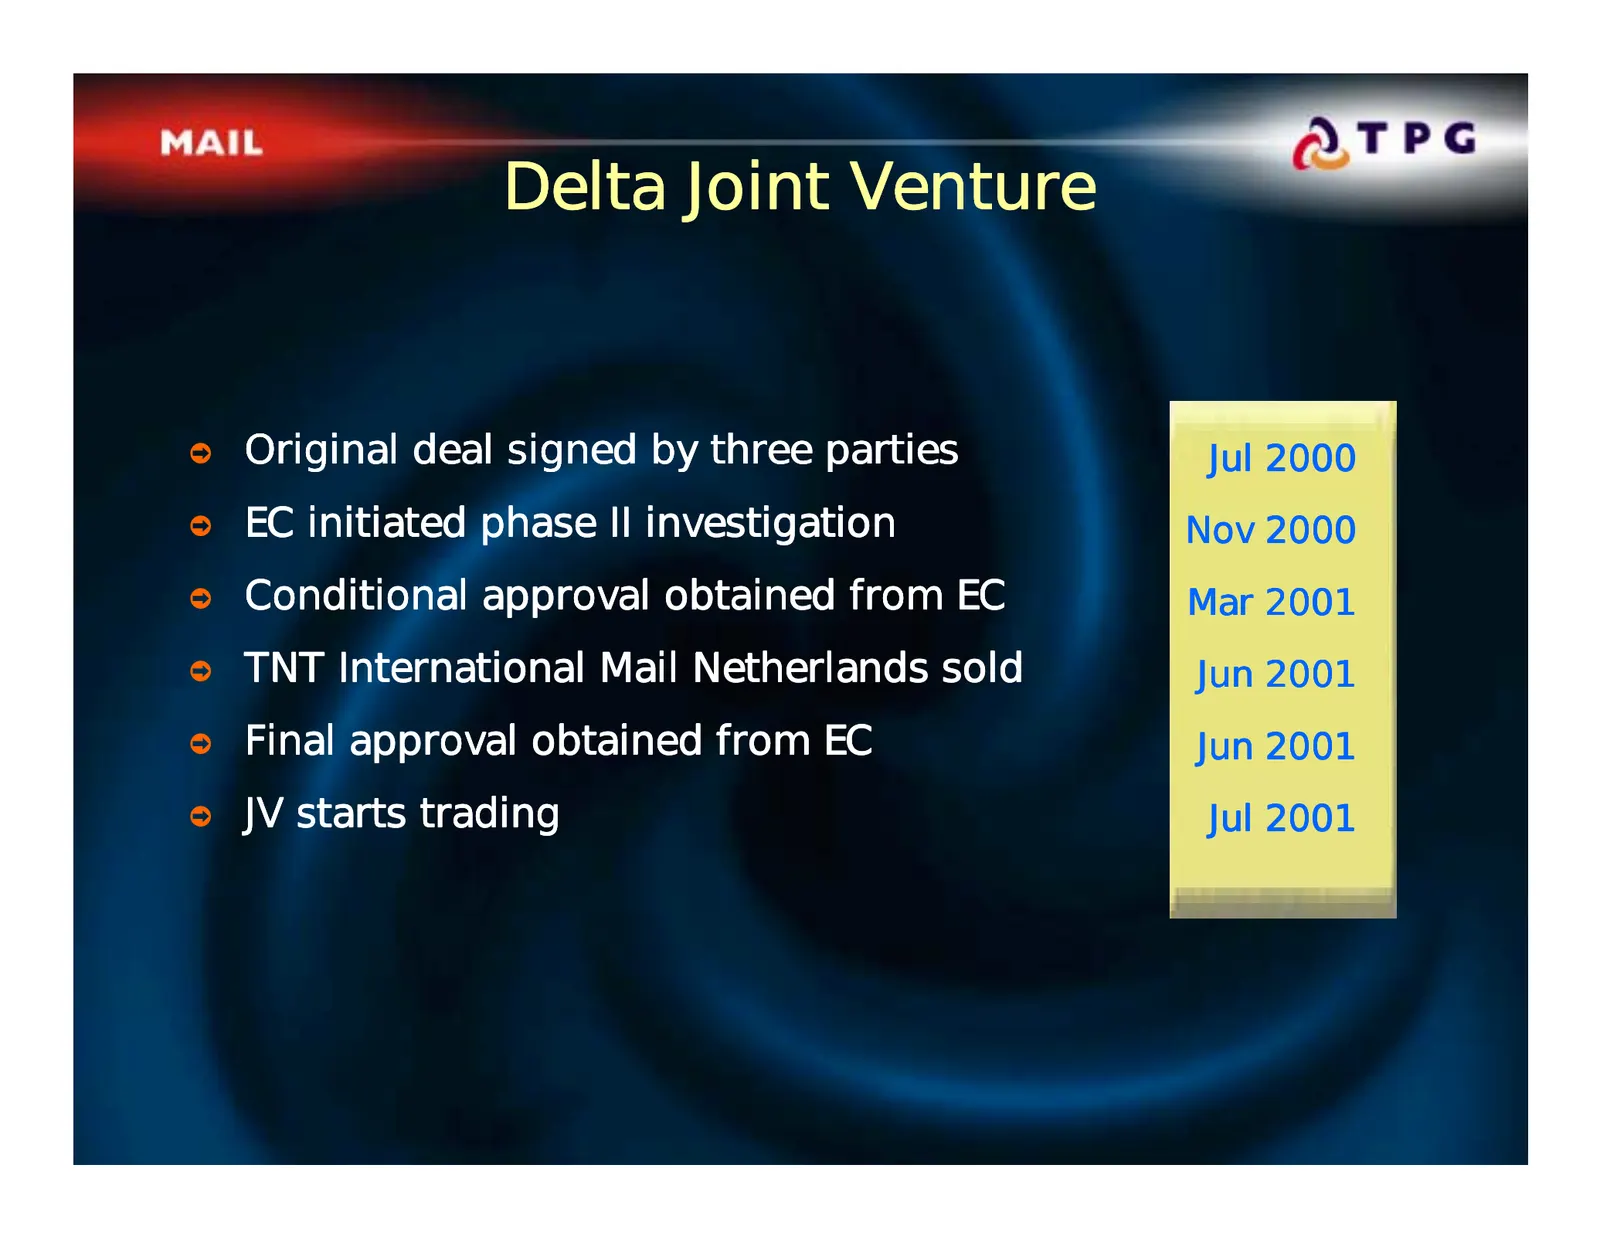
Delta Joint Venture ò Original deal signed by three parties Jul2000 Jul 2000 ò EC initiated phase II investigation Nov2000 Nov 2000 ò Conditional approval obtained from EC Mar2001 Mar 2000 ò TNT International Mail Netherlands sold Jun2001 Jun 2001 ò Final approval obtained from EC Jun2001 Jun 2001 ò
Slide 20: European Networks
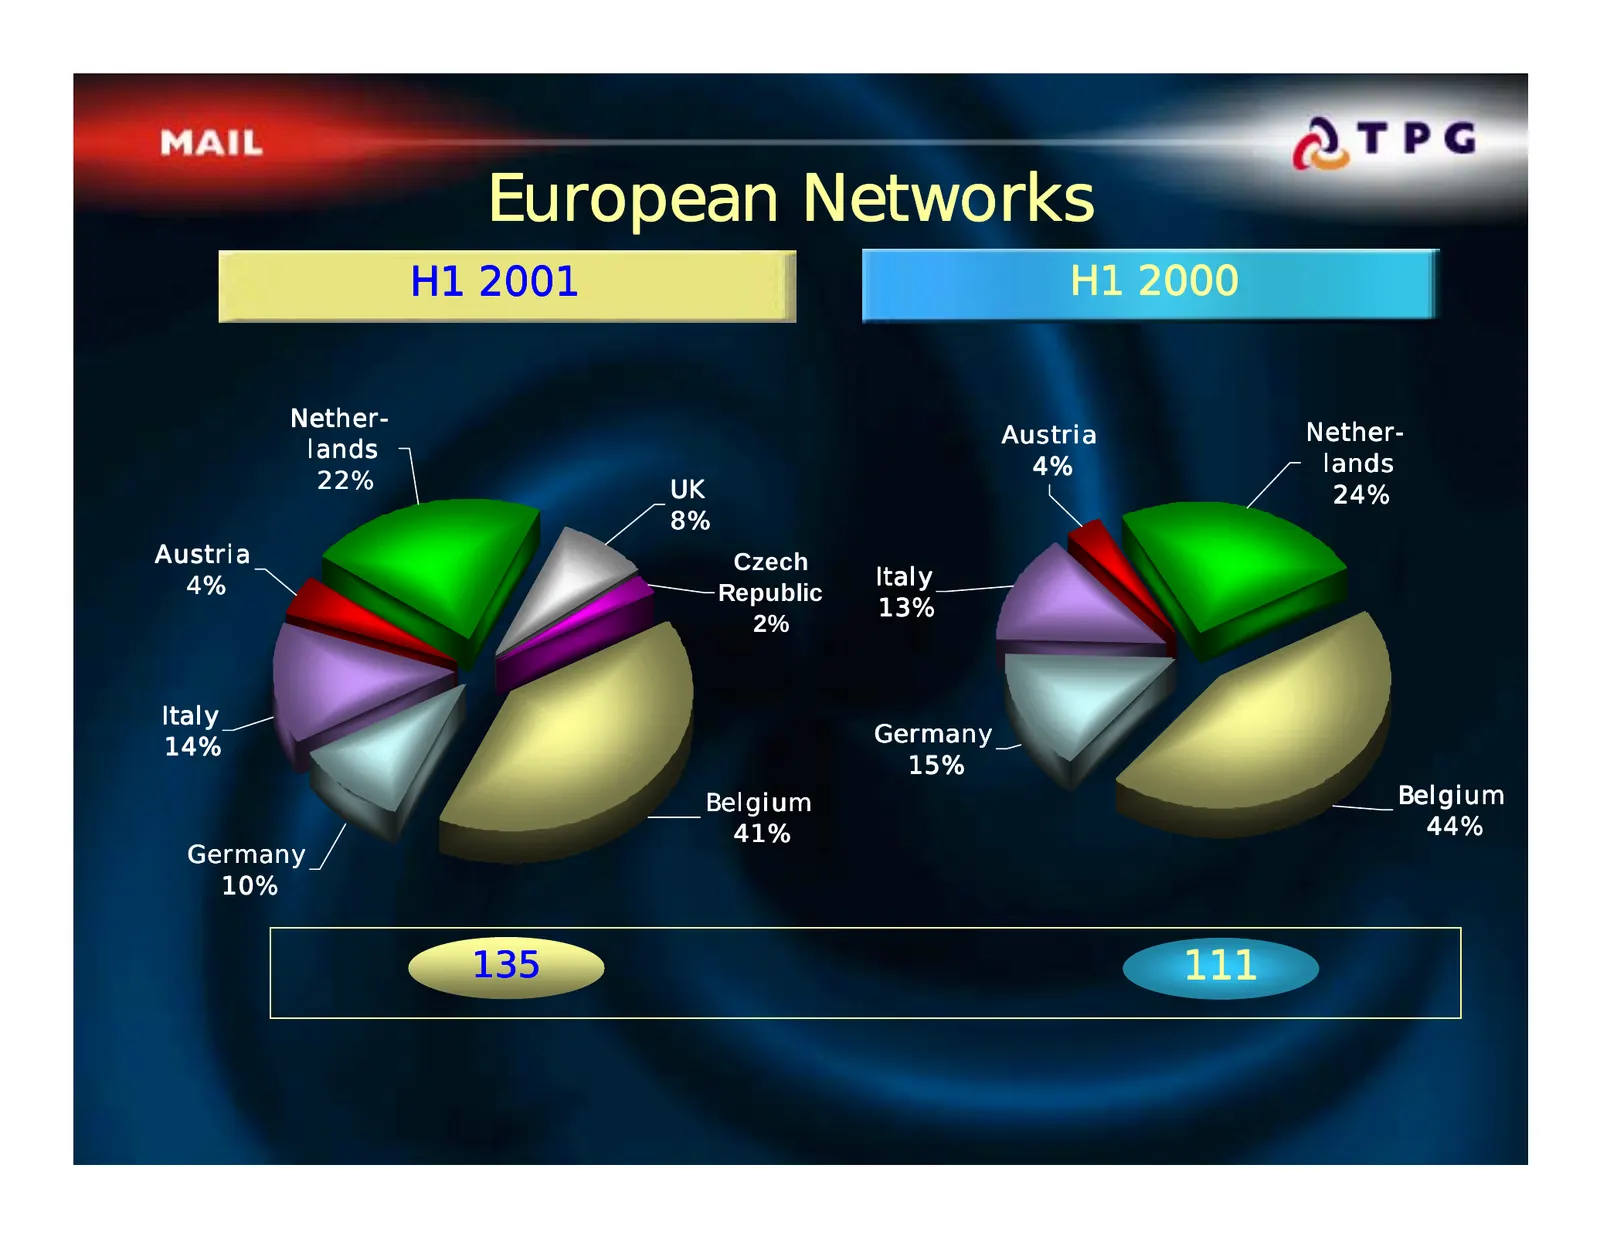
European Networks H1 2001 H1 2000 Nether- Austria Nether- lands 4% lands 22% UK 24% 8% Austria Czech 4% Italy Republic 13% 2% Italy Germany 14% 15% Belgium Belgium 41% 44% Germany 10% 135 111 Page 20 9 August, 2001
Slide 21: Data & Document Management
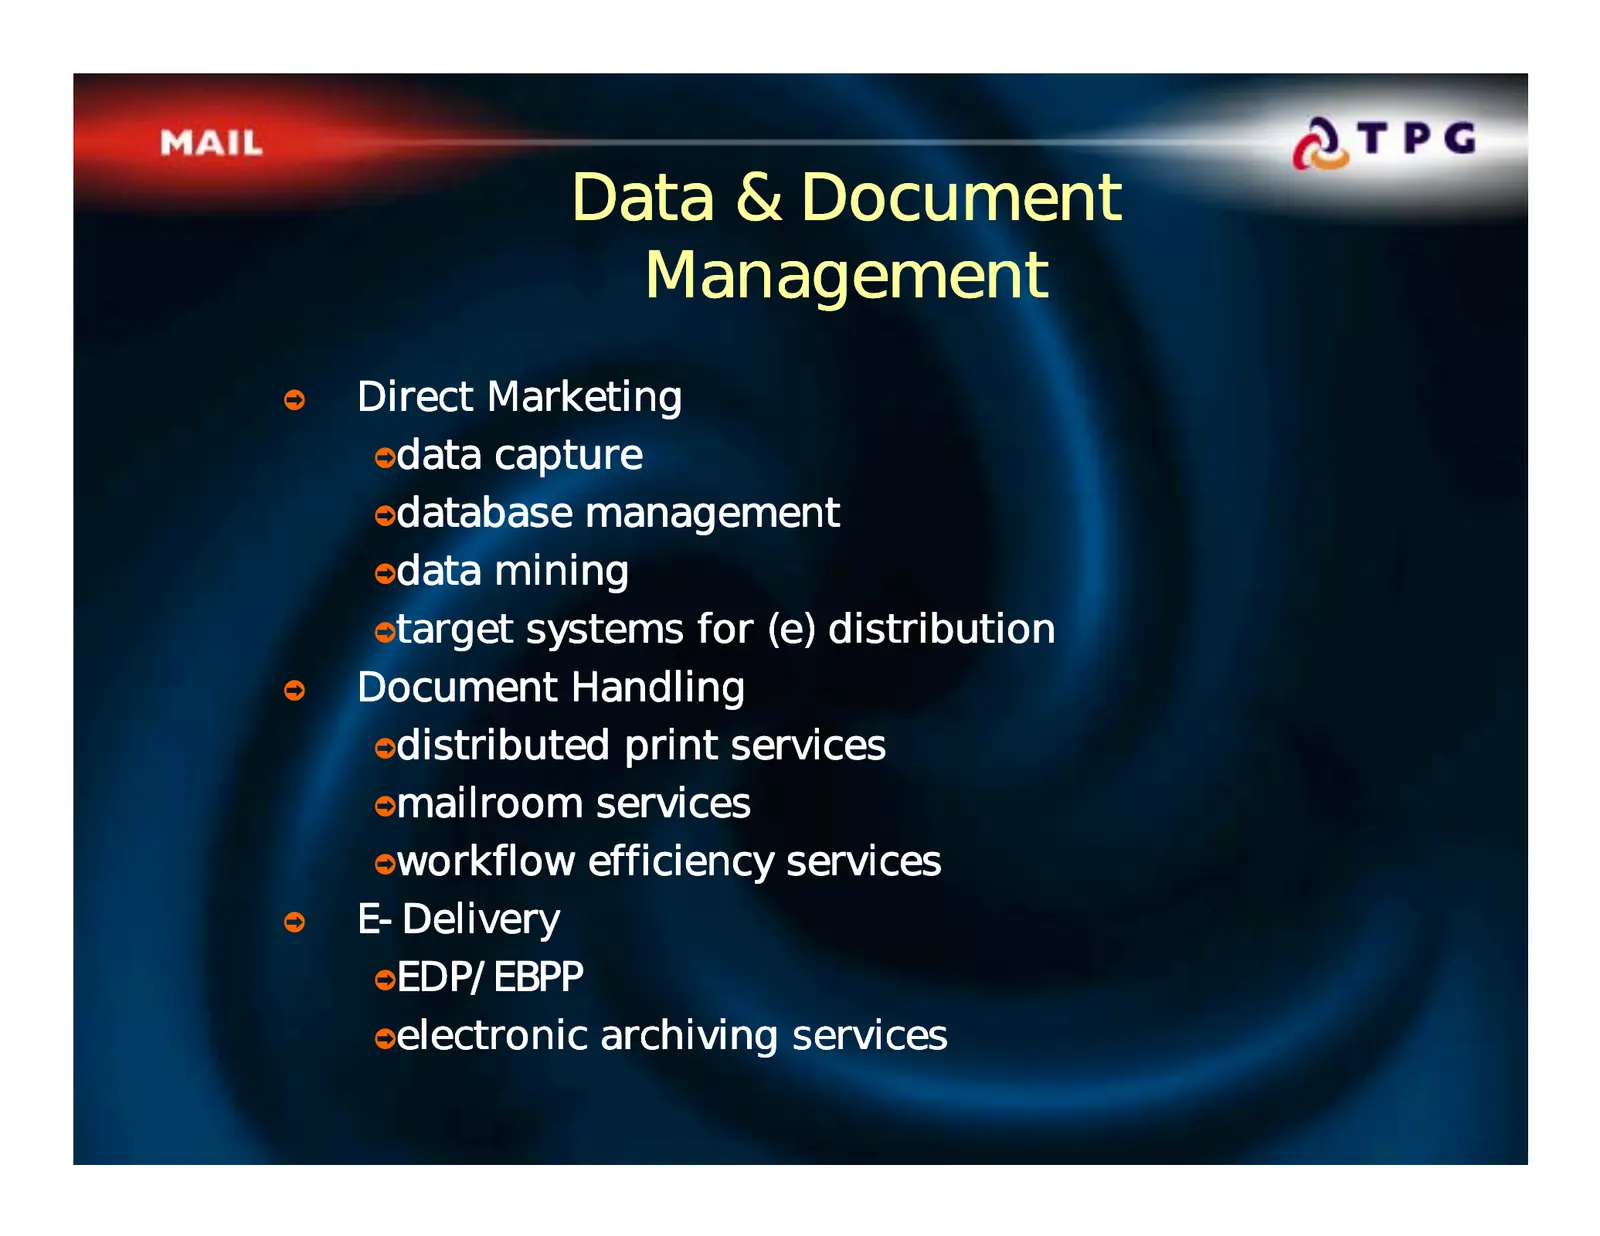
Data & Document Management ò Direct Marketing òdata capture òdatabase management òdata mining òtarget systems for (e) distribution ò Document Handling òdistributed print services òmailroom services òworkflow efficiency services ò E-Delivery òEDP/EBPP òelectronic archiving services Page 21 9 August,
Slide 22: Margin Development
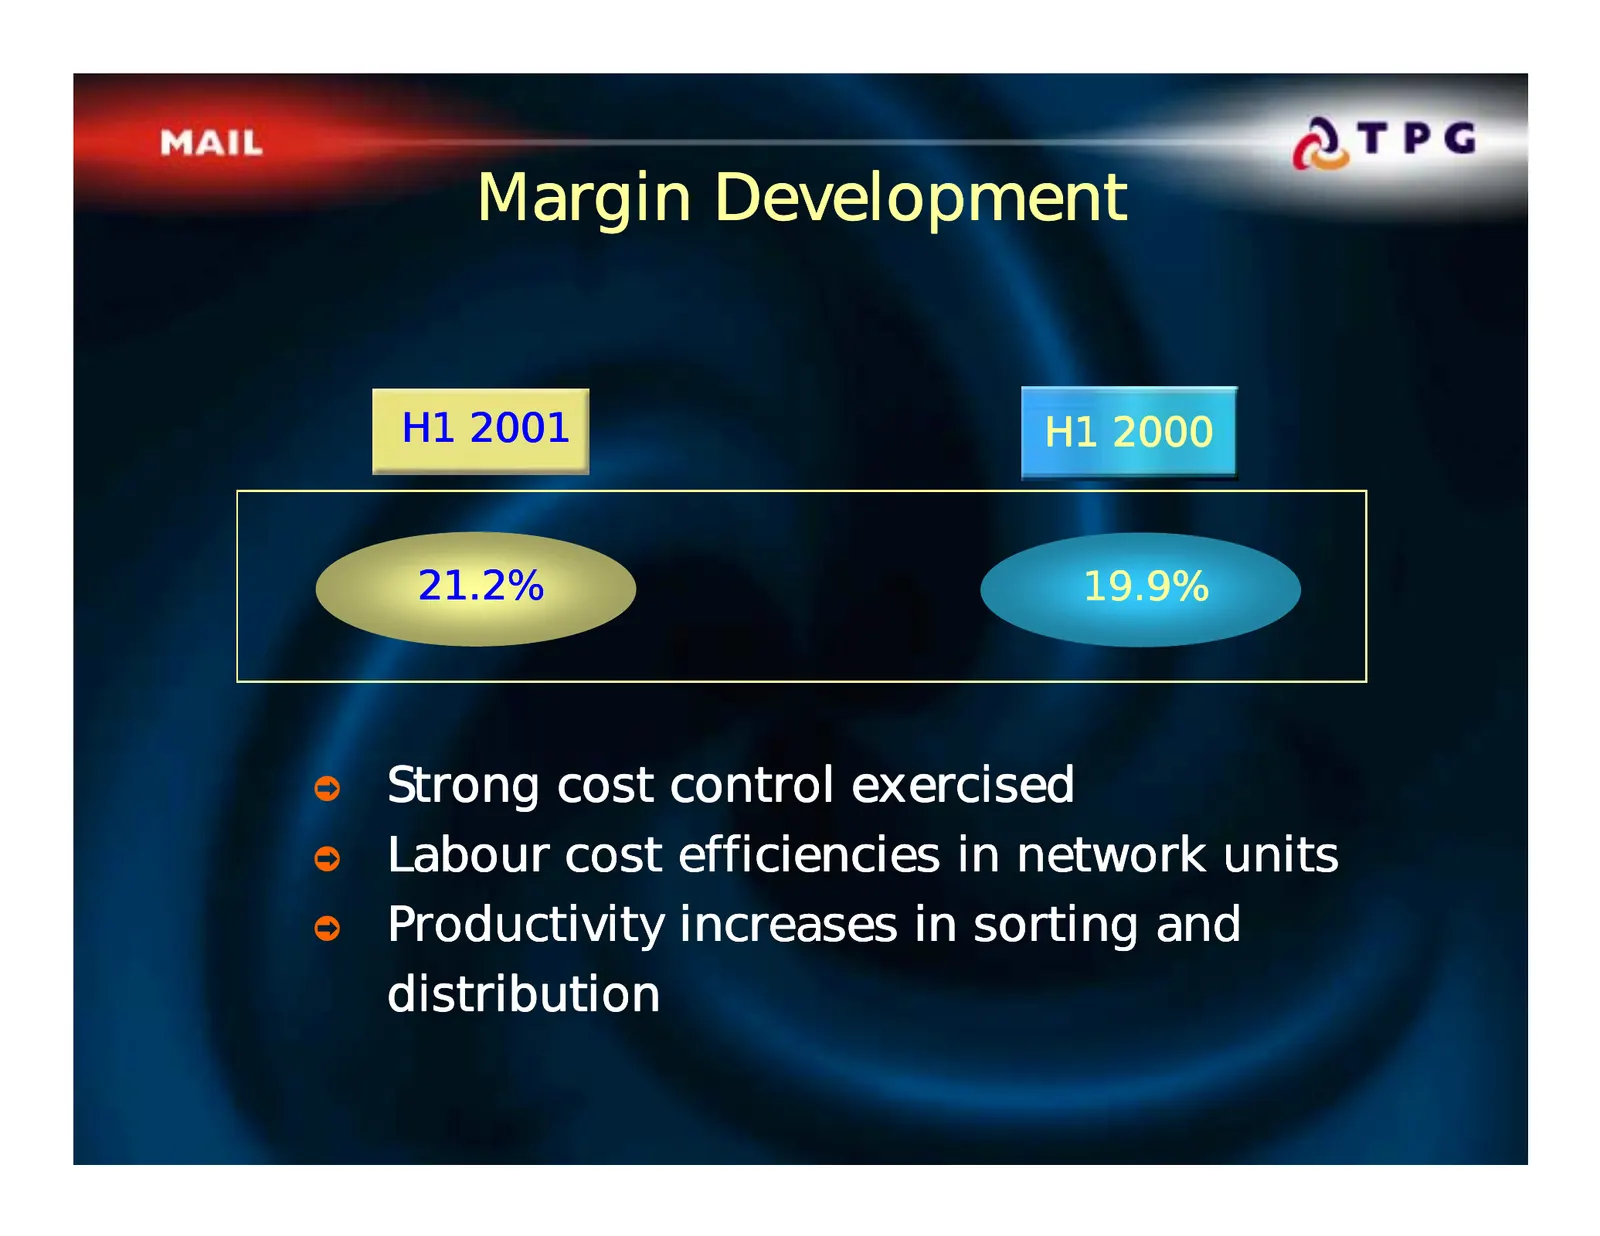
Margin Development H1 2001 H1 2000 21.2% 19.9% ò Strong cost control exercised ò Labour cost efficiencies in network units ò Productivity increases in sorting and distribution Page 22 9 August, 2001
Slide 23: Mail Outlook 2001
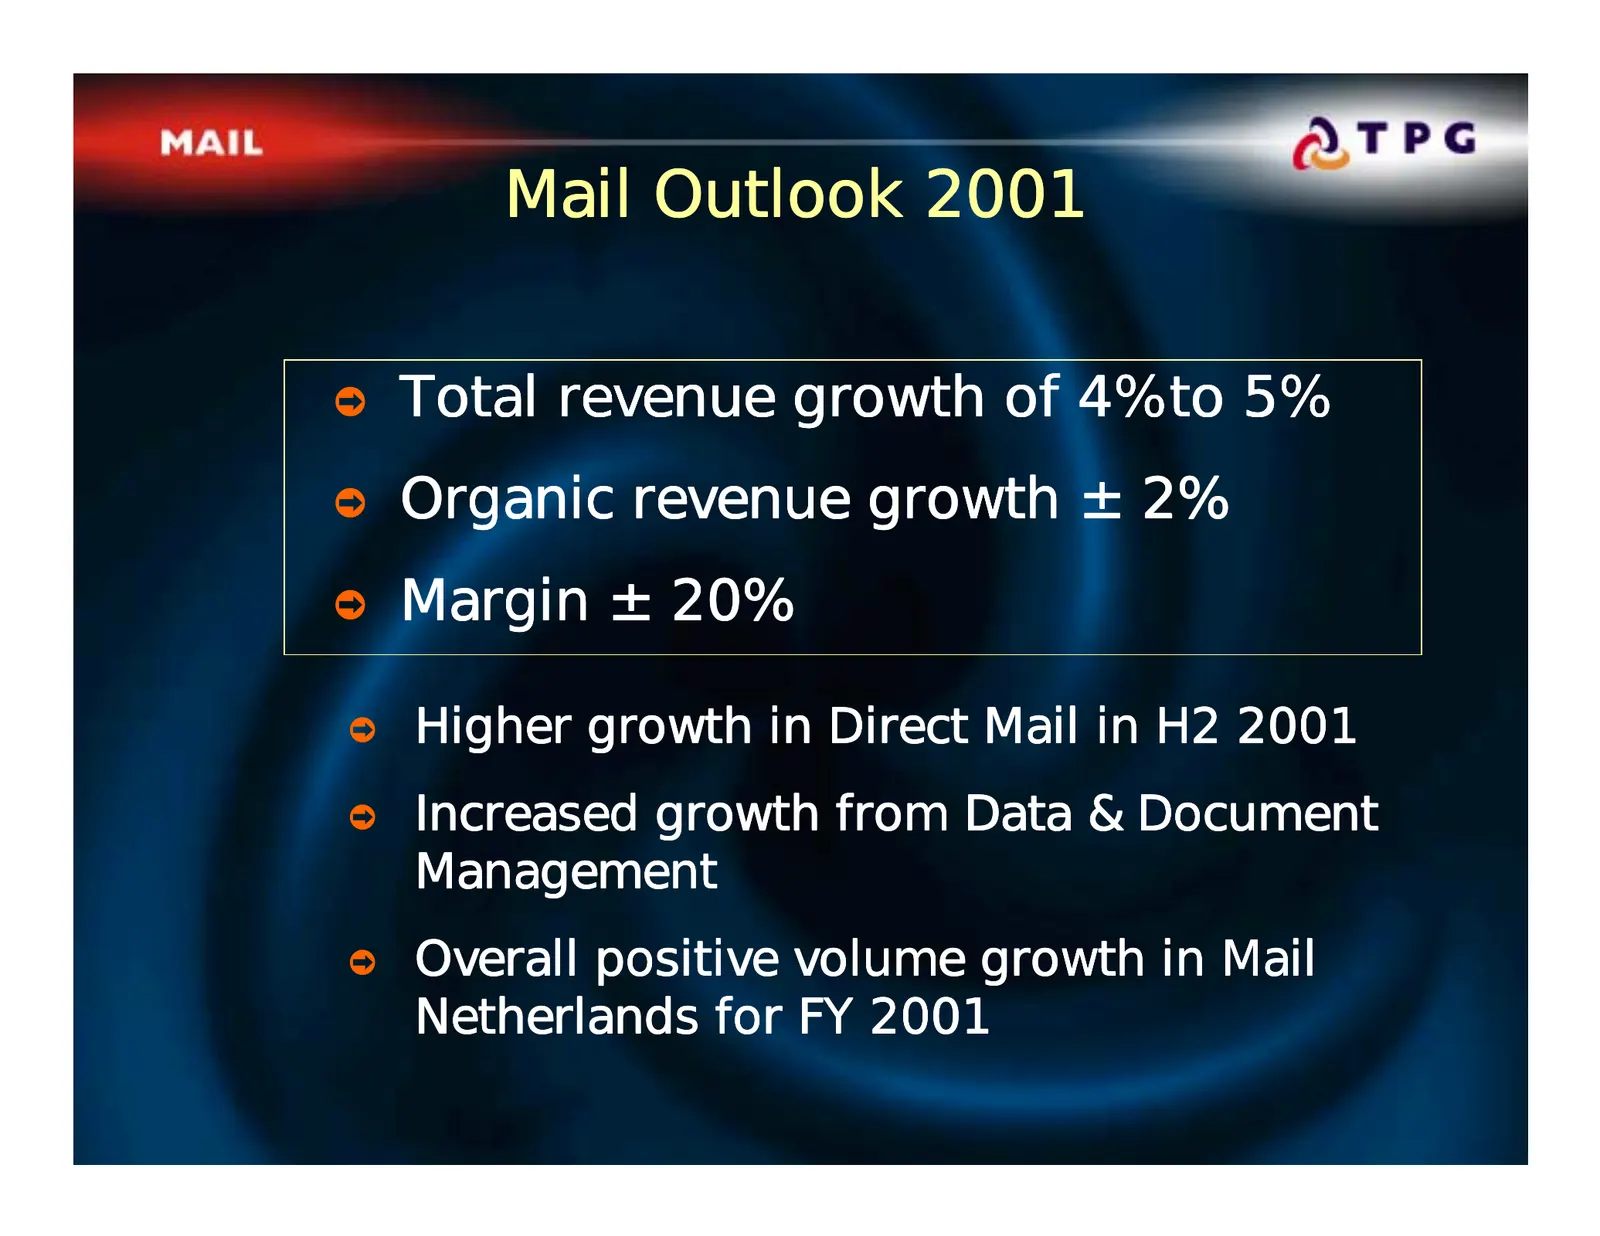
Mail Outlook 2001 ò Total revenue growth of 4% to 5% ò Organic revenue growth ± 2% ò Margin ± 20% ò Higher growth in Direct Mail in H2 2001 ò Increased growth from Data & Document Management ò Overall positive volume growth in Mail Netherlands for FY 2001 Page 23 9 August, 2001

Slide 24: Express
Page 24 9 August, 2001
Slide 25: Overview
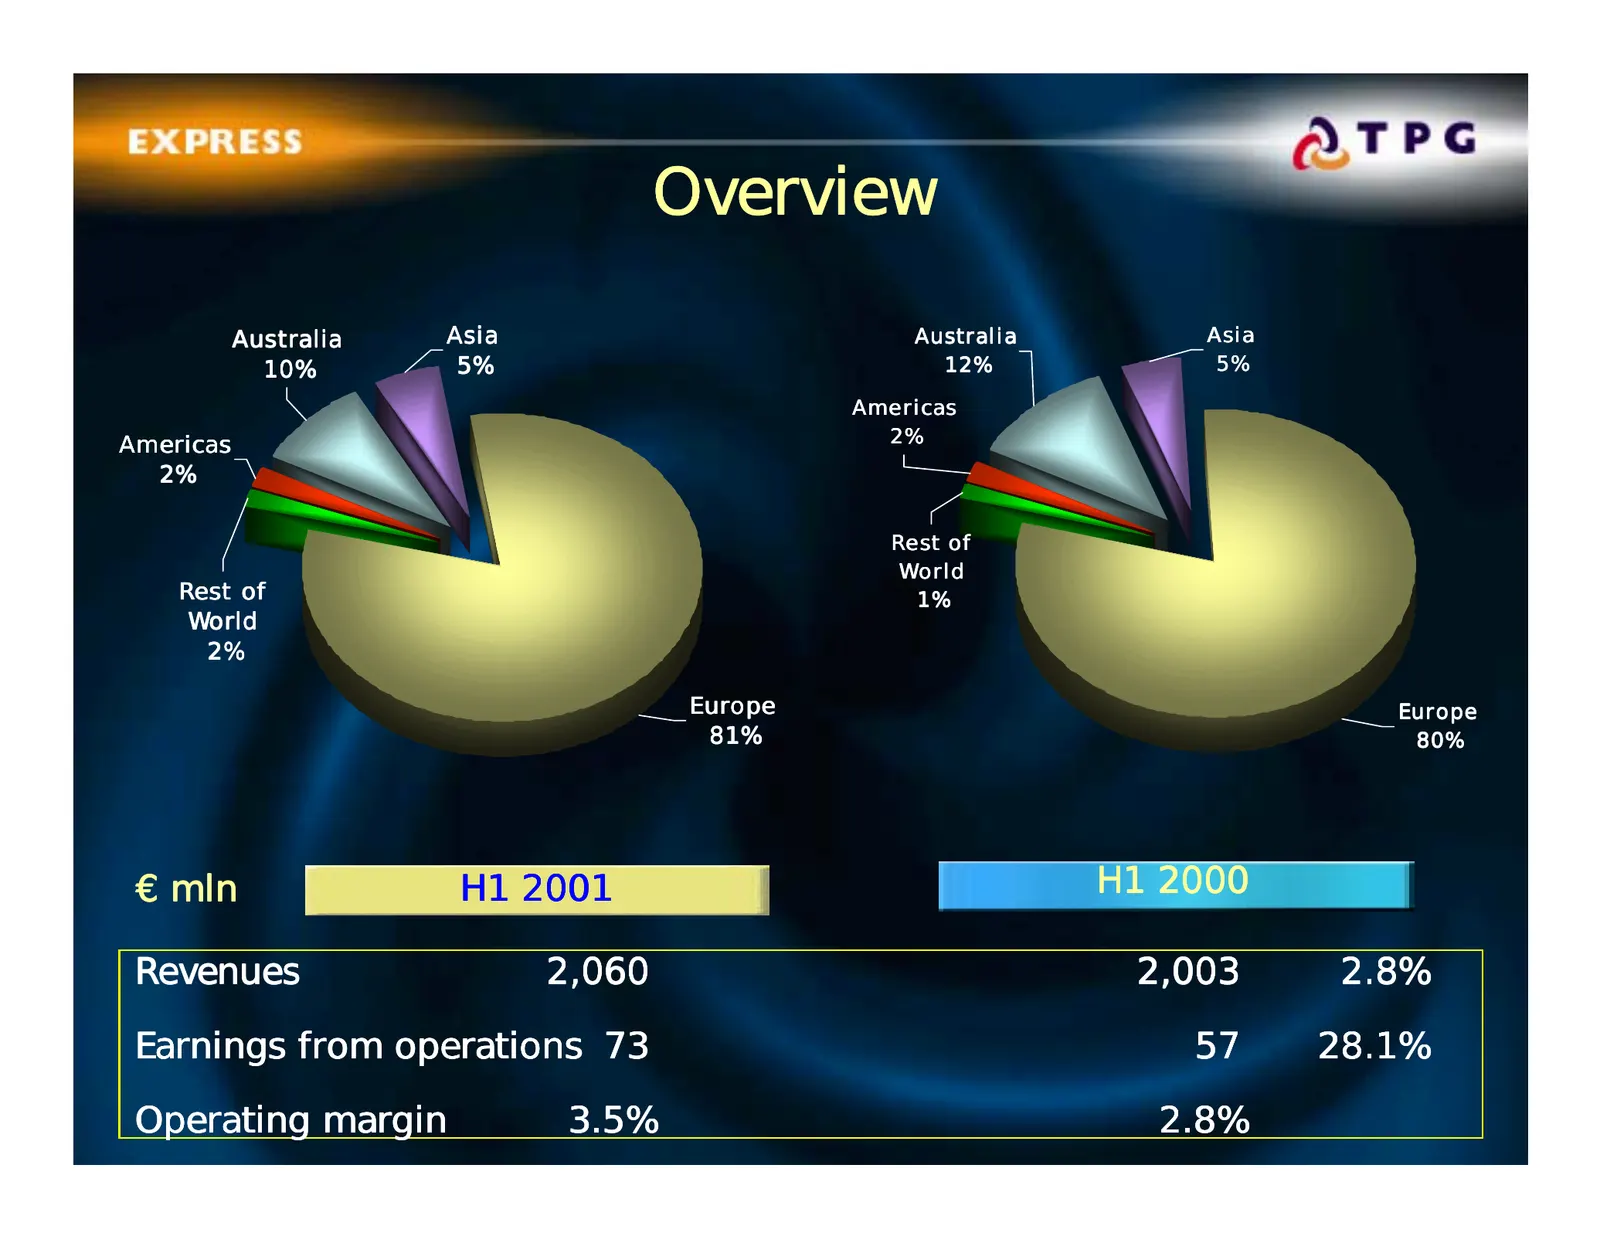
Overview Australia Asia Australia Asia 10% 5% 12% 5% Ame ricas Americas 2% 2% Re st of World Rest of 1% World 2% Europe Europe 81% 80% € mln H1 2001 H1 2000 Revenues 2,060 2,003 2.8% Earnings from operations 73 57 28.1% Page Operating margin 3.5% 2.8% 25 9 August, 2001
Slide 26: Resilient Express Performance
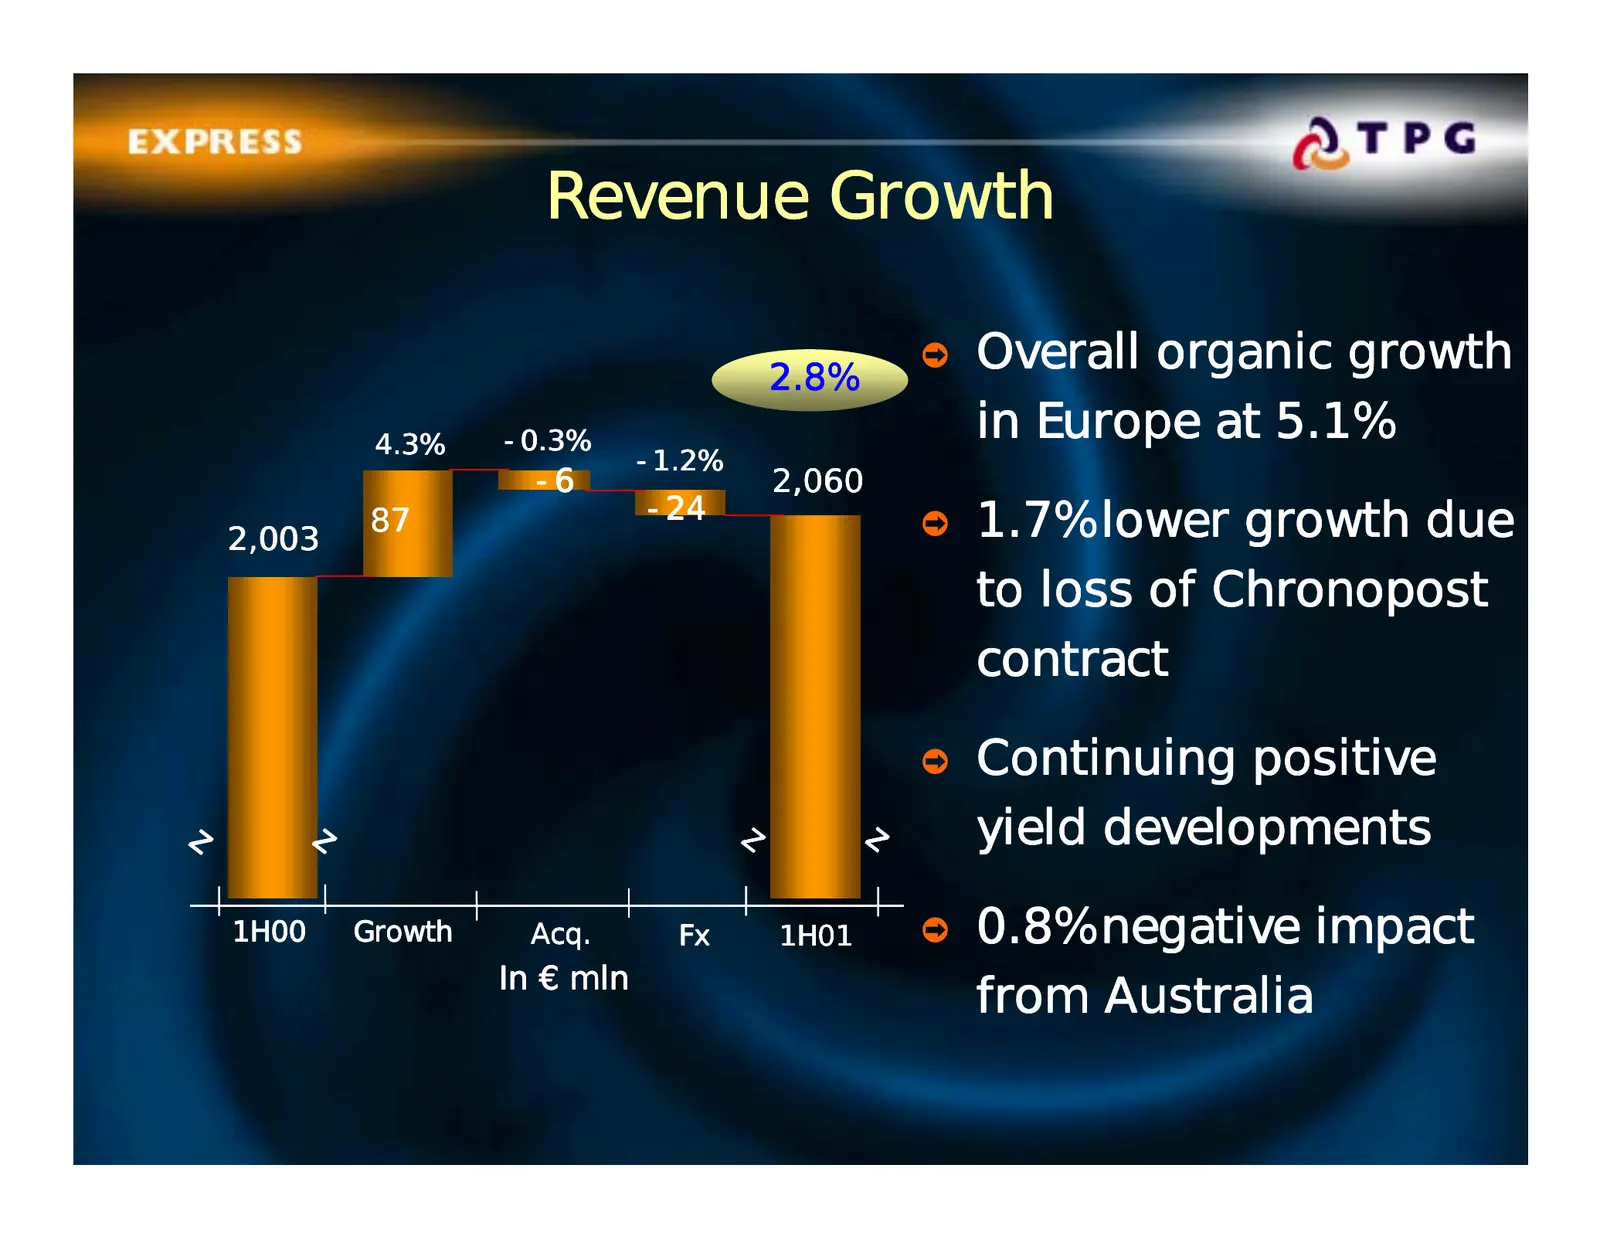
Resilient Express Performance ò Organic revenue growth of 4.3% (5.1% in Europe) ò Increased margin due to yield management programme ò Continuing performance issues in Australia have impacted overall Express revenues and margin Page 26 9 August, 2001
Slide 27: Revenue Growth
Revenue Growth 2.8% ò Overall organic growth 4.3% -0.3% in Europe at 5.1% -1.2% -6 2,060 2,003 87 -24 ò 1.7% lower growth due to loss of Chronopost contract ò Continuing positive z z z z yield developments 1H00 Growth Acq. Fx 1H01 ò 0.8% negative impact In € mln from Australia Page 27 9 August, 2001
Slide 28: Volume Growth
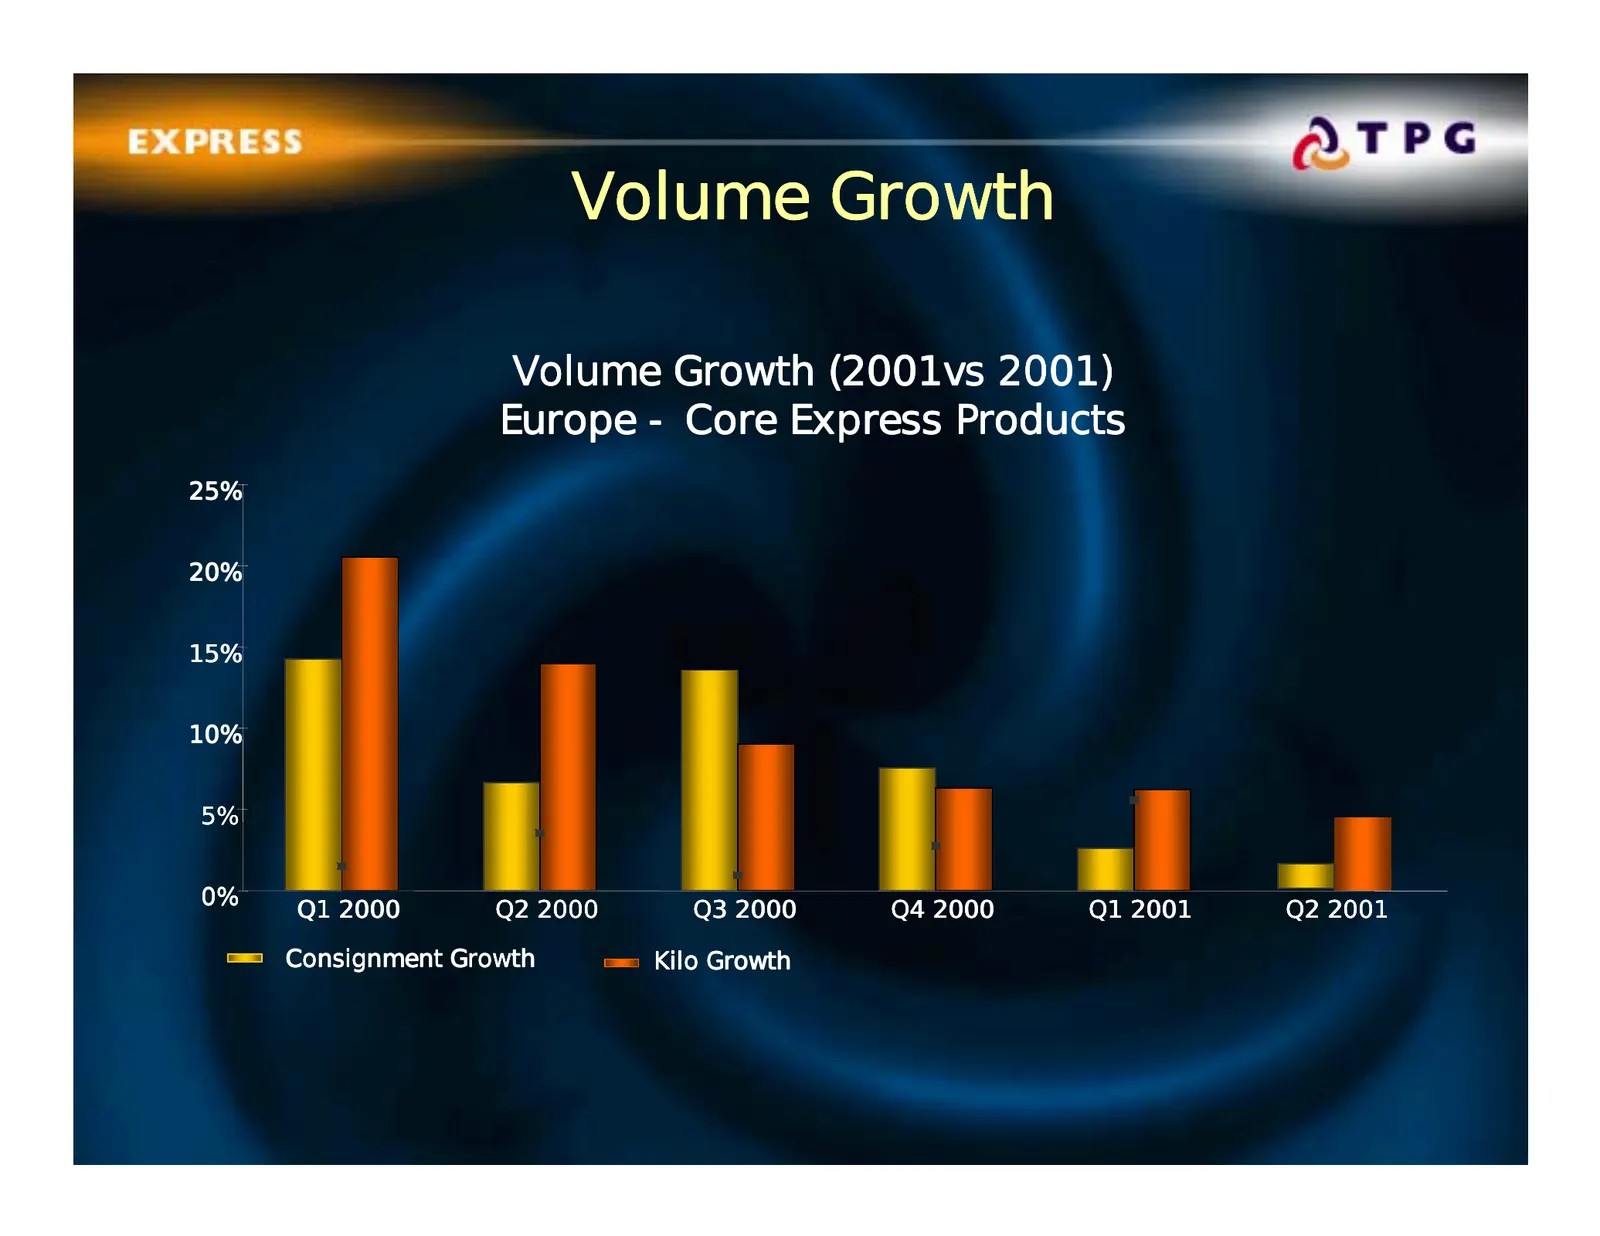
Volume Growth Volume Growth (2001vs 2001) Europe - Core Express Products 25% 20% 15% 10% 5% 0% Q1 2000 Q2 2000 Q3 2000 Q4 2000 Q1 2001 Q2 2001 Consignment Growth Kilo Growth Page 28 9 August, 2001
Slide 29: Yield Development
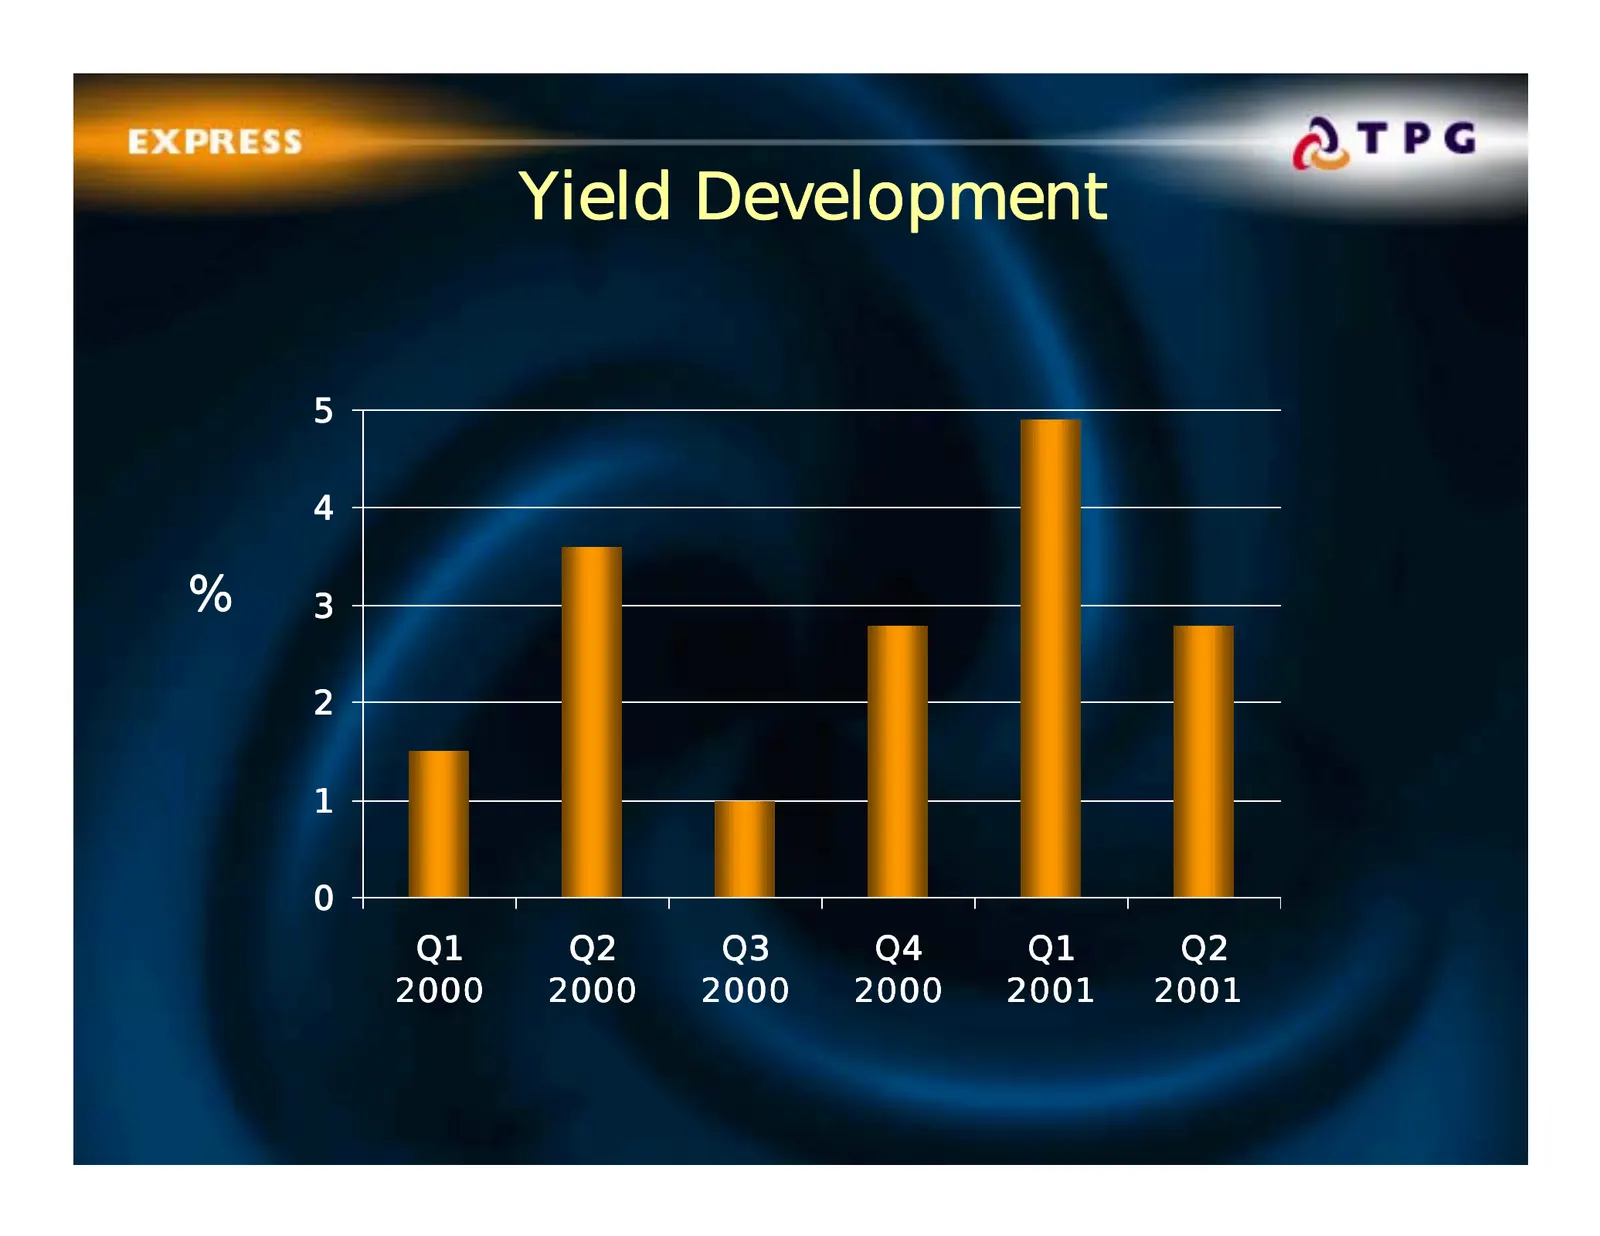
Yield Development 5 4 % 3 2 1 0 Q1 Q2 Q3 Q4 Q1 Q2 2000 2000 2000 2000 2001 2001 Page 29 9 August, 2001
Slide 30: Margin Development
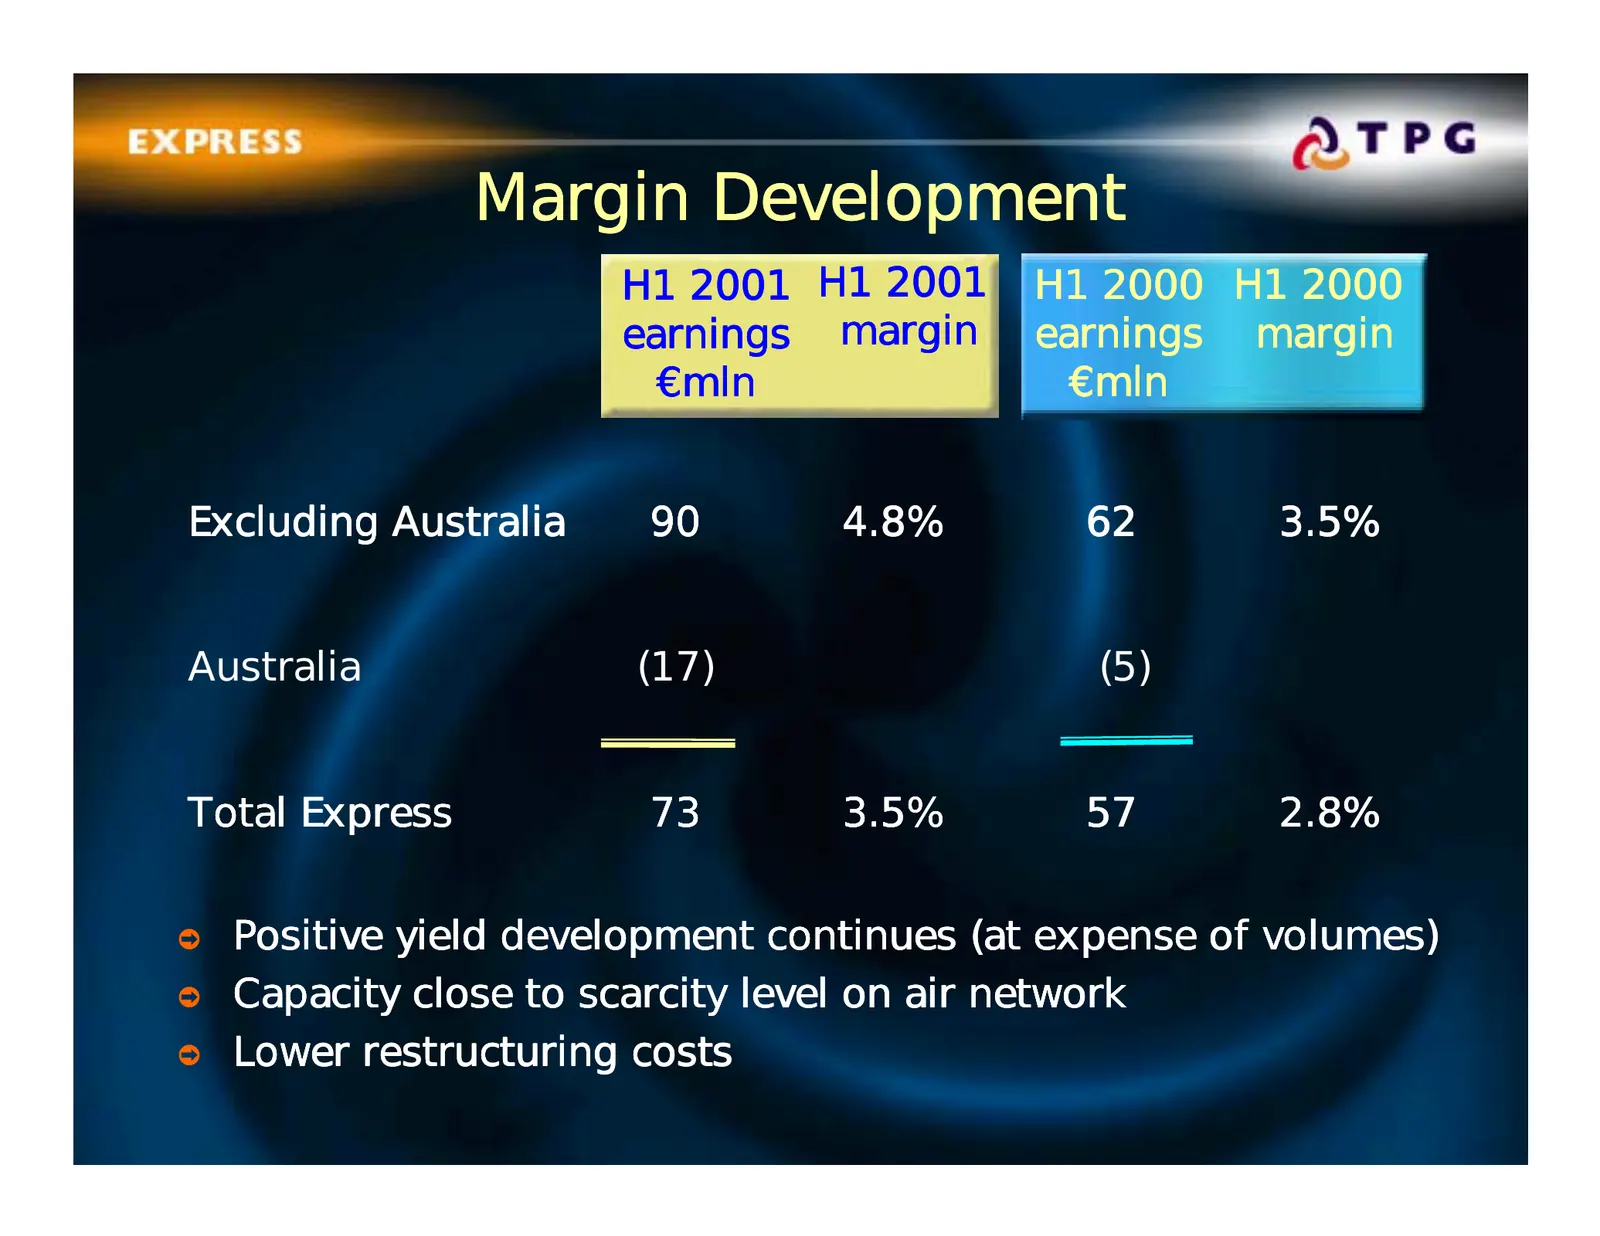
Margin Development H1 2001 H1 2001 H1 2000 H1 2000 earnings margin earnings margin €mln €mln Excluding Australia 90 4.8% 62 3.5% Australia (17) (5) Total Express 73 3.5% 57 2.8% ò Positive yield development continues (at expense of volumes) ò Capacity close to scarcity level on air network ò Lower r
Slide 31: Performance clouded by Australia
Performance clouded by Australia ò Problems caused by integration of businesses ò Loss of € 17 million in H1 2001 ò Write-downs of € 30 million in HI 2001 ò Solutions now being implemented in all problem areas ò Recovery evident by H1 2002 Page 31 9 August, 2001
Slide 32: Express Outlook 2001
Express Outlook 2001 ò Organic revenue growth of 4% to 5% ò Margin 4-5% ò Margin 6% excluding Australia ò H1 2001 levels of volume growth will continue in H2 2001 ò Further yield improvements in H2 2001 Page 32 9 August, 2001

Slide 33: Logistics
Page 33 9 August, 2001
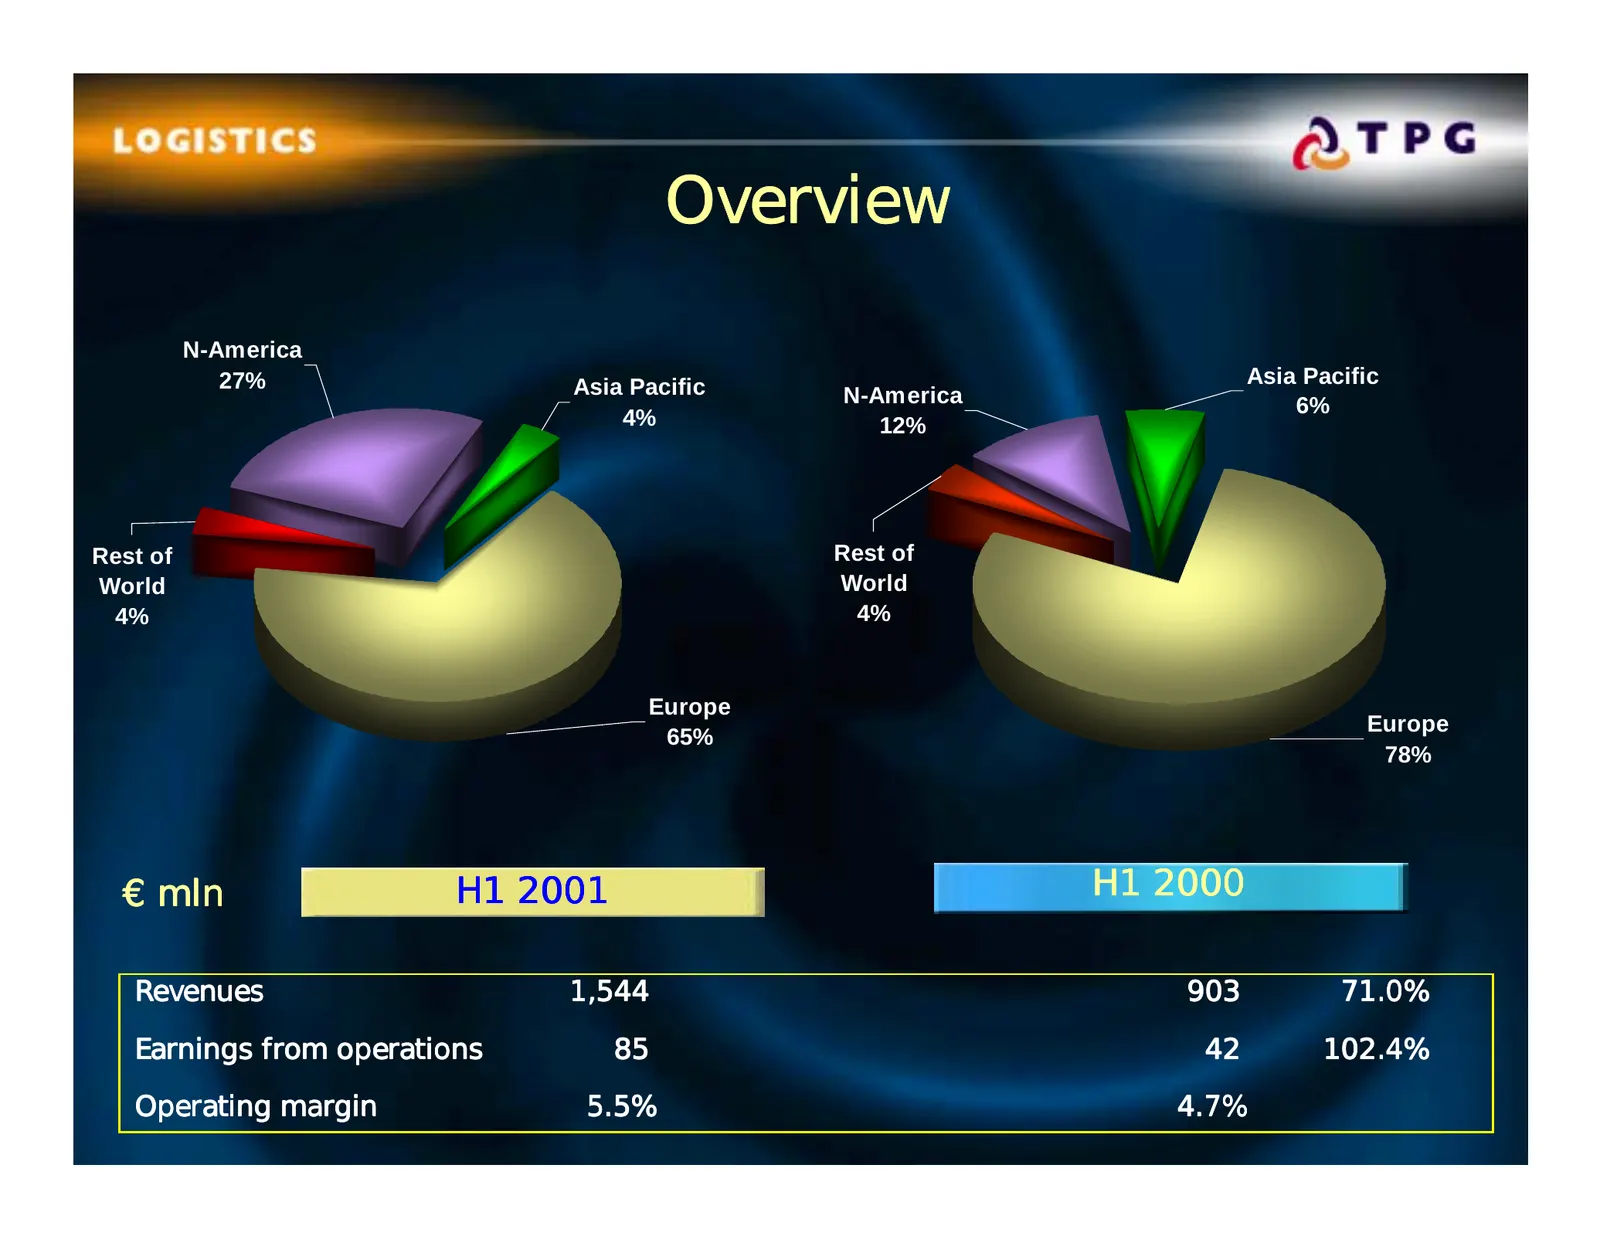
Slide 34: Overview
Overview N-America 27% Asia Pacific Asia Pacific N-America 6% 4% 12% Rest of Rest of World World 4% 4% Europe Europe 65% 78% € mln H1 2001 H1 2000 Revenues 1,544 903 71.0% Earnings from operations 85 42 102.4% Operating margin 5.5% 4.7% Page 34 9 August, 2001
Slide 35: Strong Organic Growth
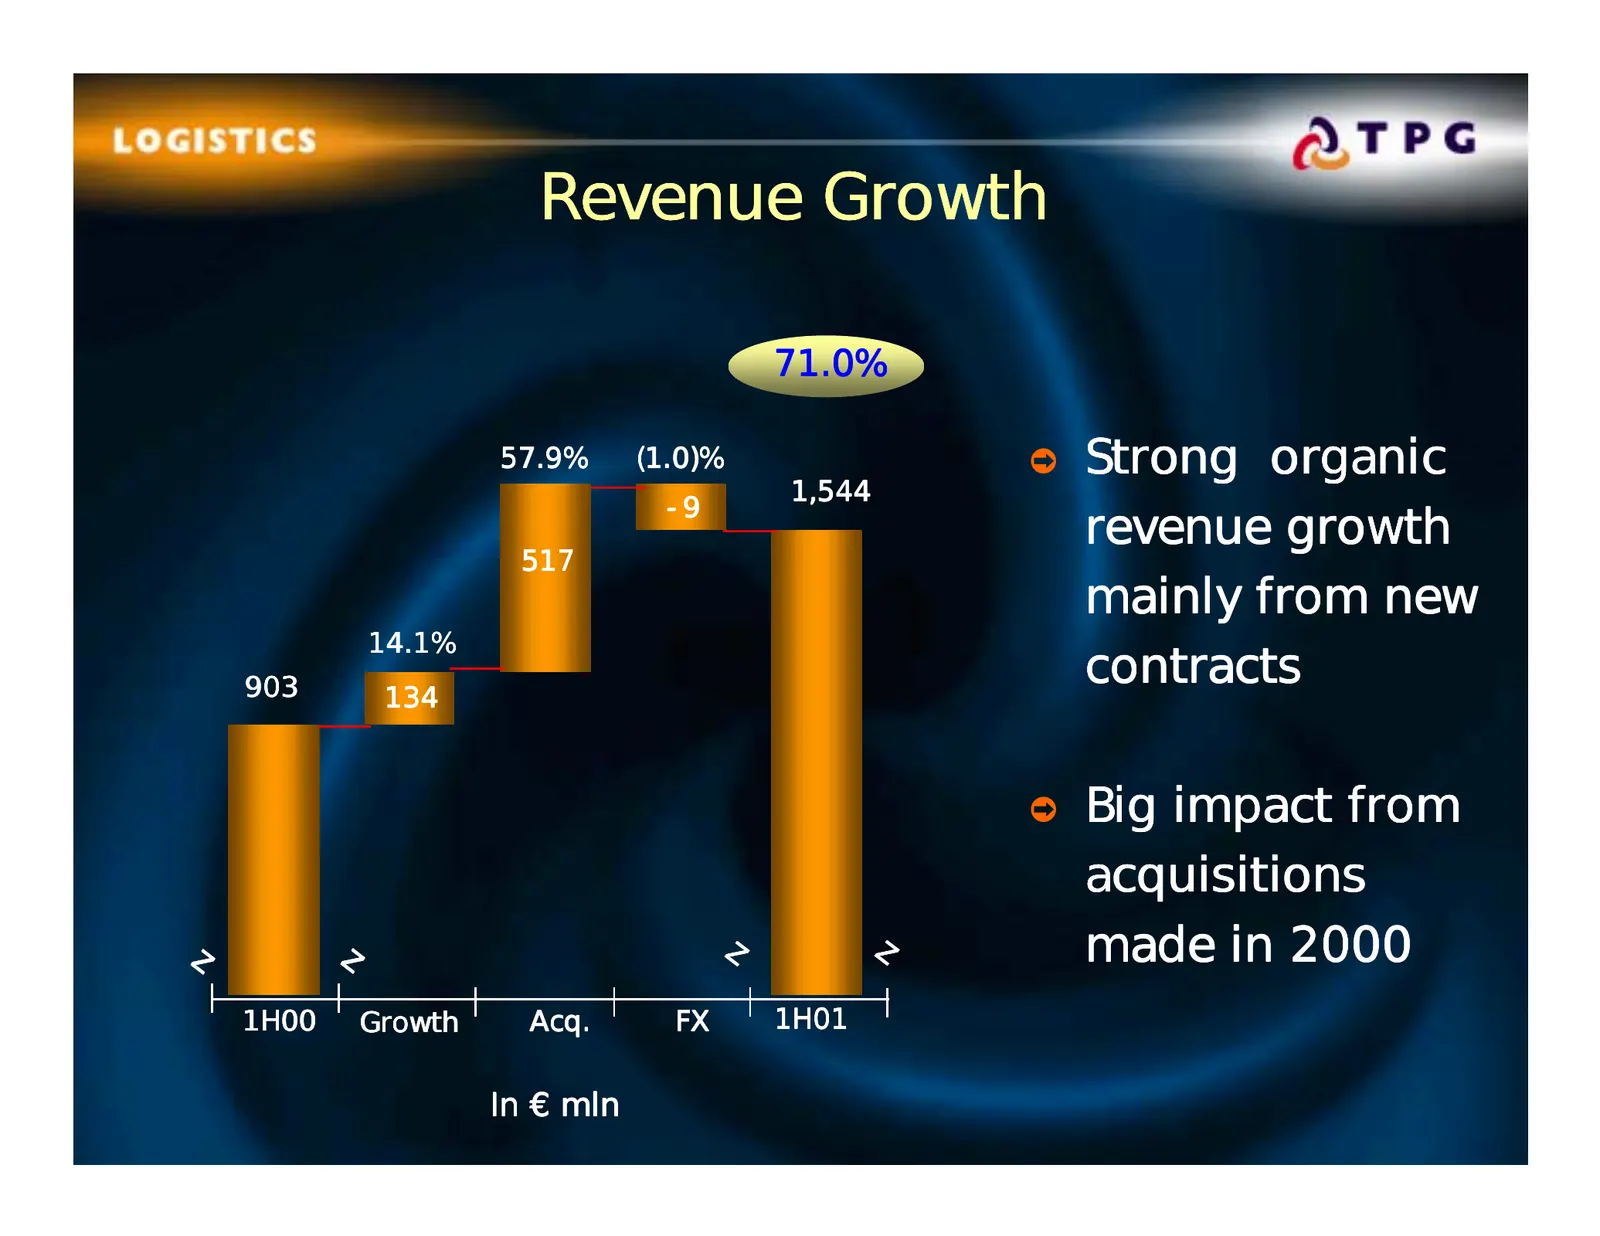
Strong Organic Growth ò Very strong 14.1% organic revenue growth ò Margin improvement to 5.5% from 4.7% last year ò Less than expected effect of US slowdown in North America in first half ò New contracts pipeline remains healthy Page 35 9 August, 2001
Slide 36: Revenue Growth
Revenue Growth 71.0% 57.9% (1.0)% ò Strong organic 1,544 -9 revenue growth 517 mainly from new 14.1% 903 contracts 134 ò Big impact from acquisitions z z z z made in 2000 1H00 Growth Acq. FX 1H01 In € mln Page 36 9 August, 2001
Slide 37: Impressive Contract Wins
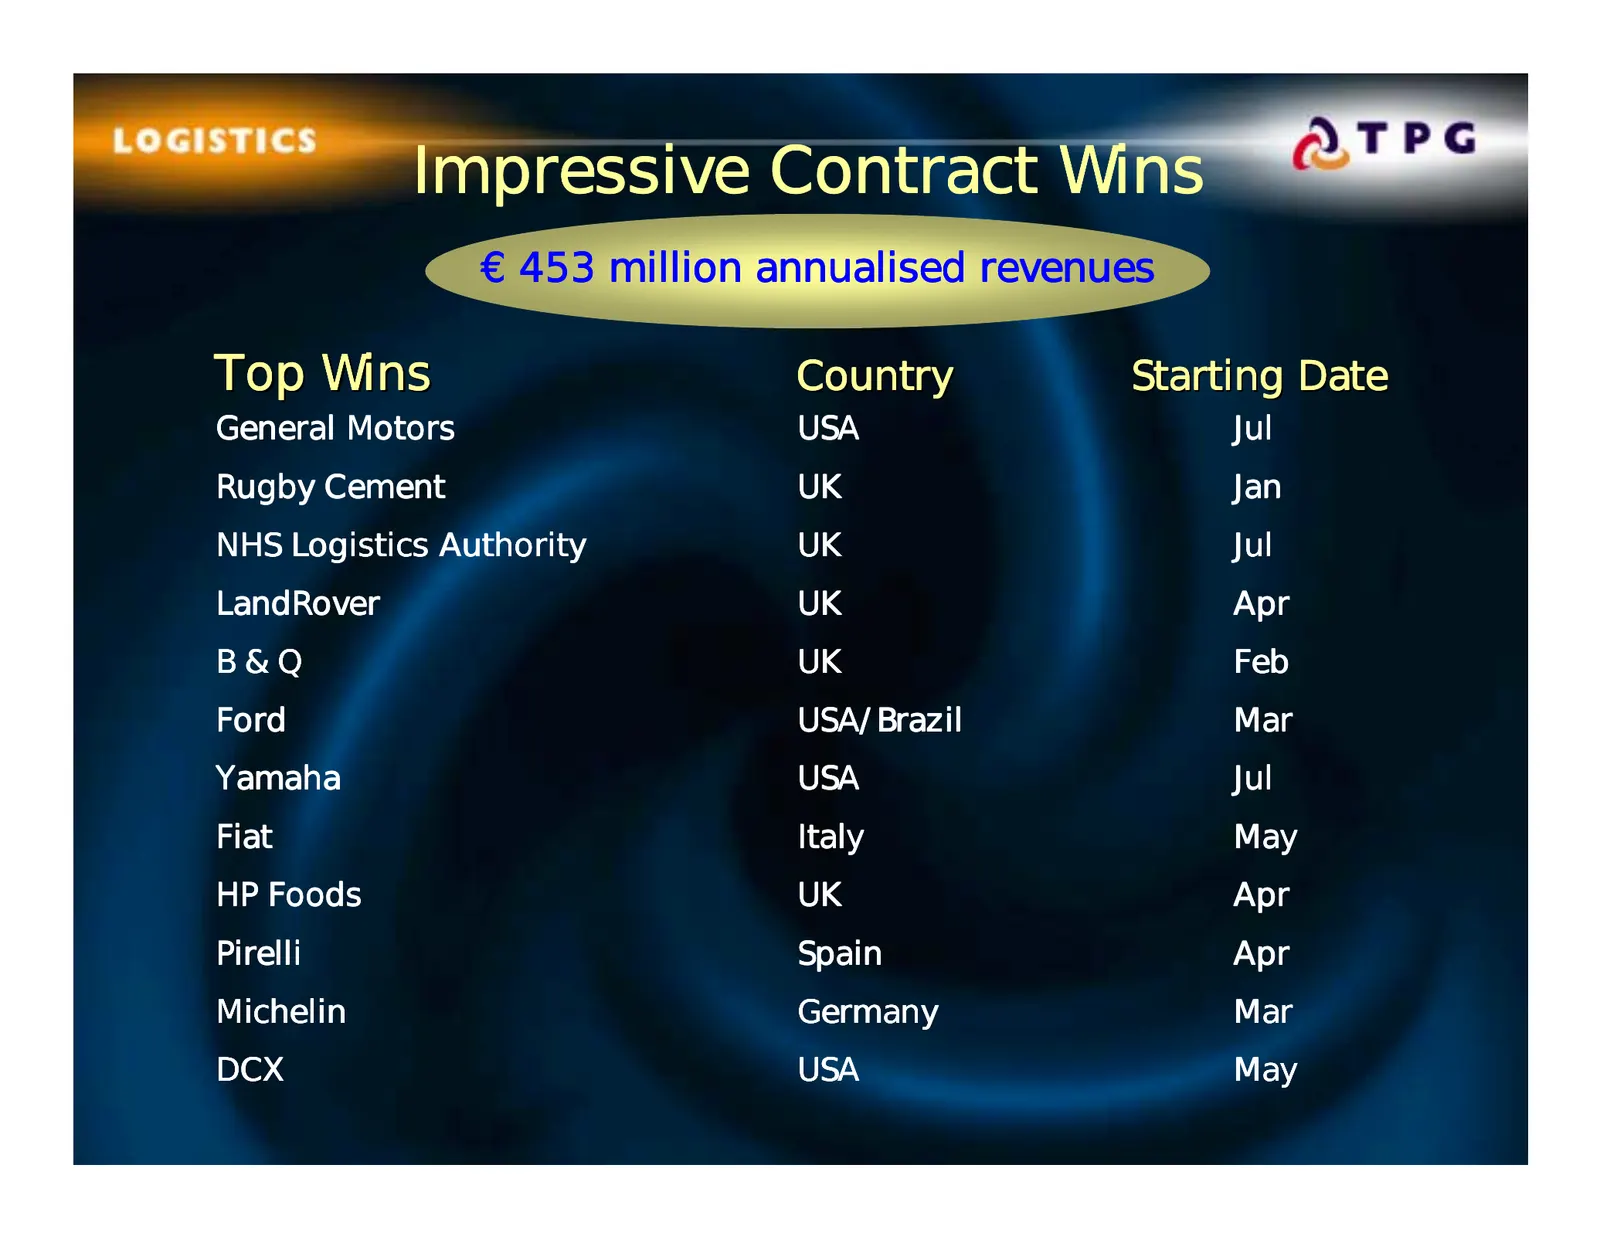
Impressive Contract Wins € 453 million annualised revenues Top Wins Country Starting Date General Motors USA Jul Rugby Cement UK Jan NHS Logistics Authority UK Jul LandRover UK Apr B&Q UK Feb Ford USA/Brazil Mar Yamaha USA Jul Fiat Italy May HP Foods UK Apr Pirelli Spain Apr Michelin Germany Mar DCX
Slide 38: New Contracts Pipeline
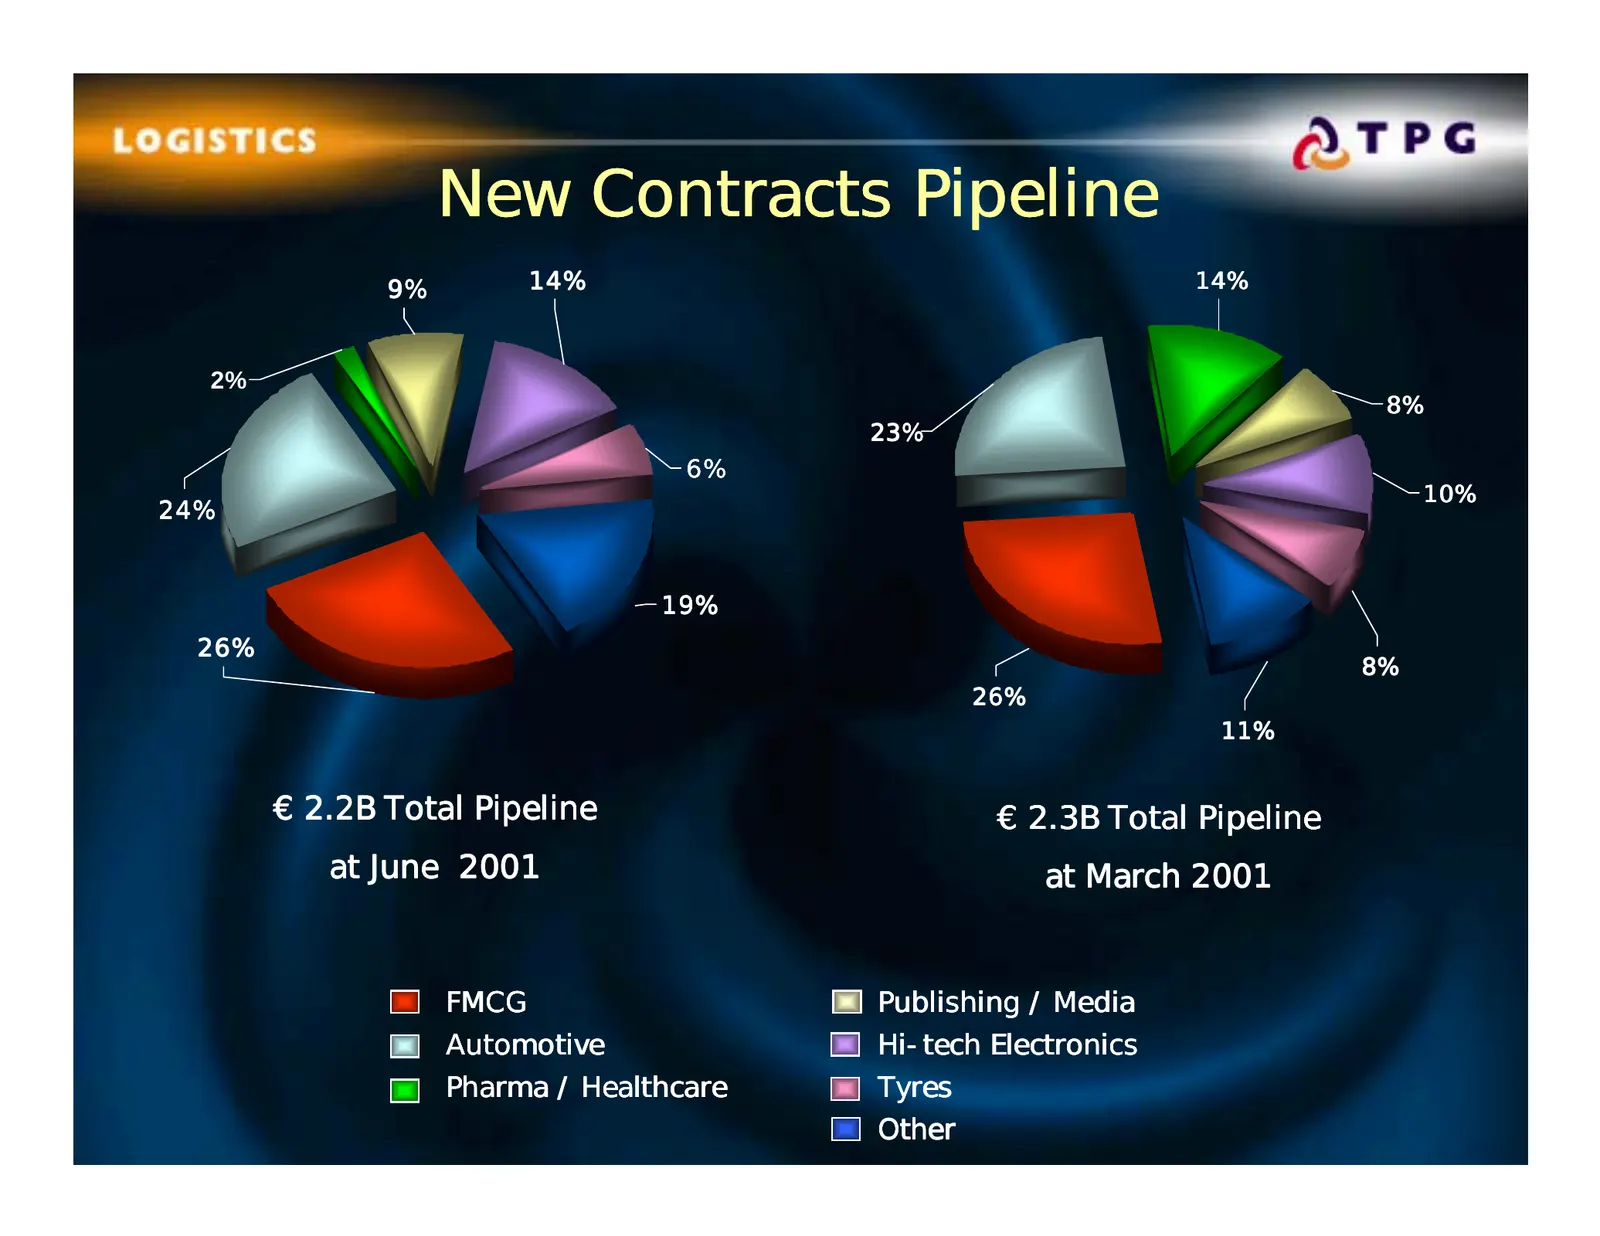
New Contracts Pipeline 9% 14% 14% 2% 8% 23% 6% 10% 24% 19% 26% 8% 26% 11% € 2.2B Total Pipeline € 2.3B Total Pipeline at June 2001 at March 2001 FMCG Publishing / Media Automotive Hi-tech Electronics Pharma / Healthcare Tyres Page Other 38 9 August, 2001
Slide 39: Pipeline with >70% certainty
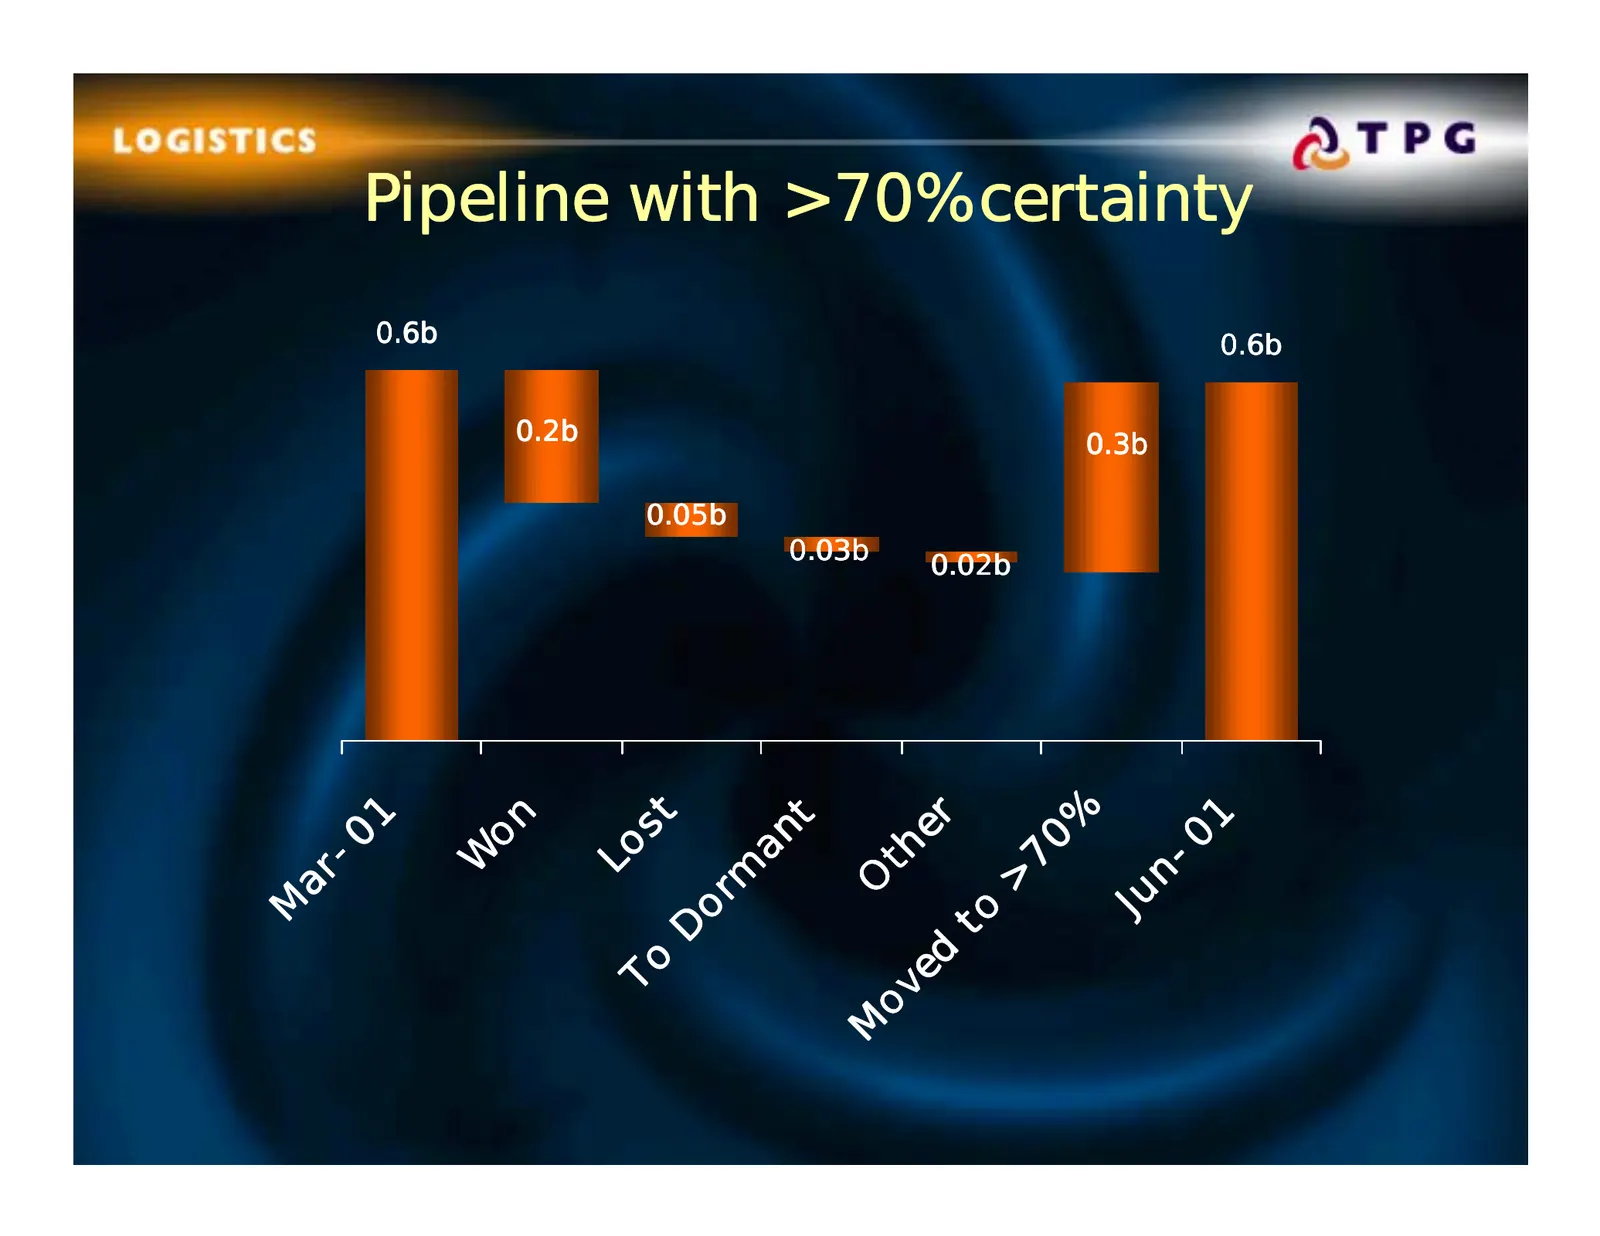
Pipeline with >70% certainty 0.6b 0.6b 0.2b 0.3b 0.05b 0.03b 0.02b 1 st on 01 er % t an -0 70 Lo th W n- m ar > O Ju or M to D ed To ov M Page 39 9 August, 2001
Slide 40: Margin Development
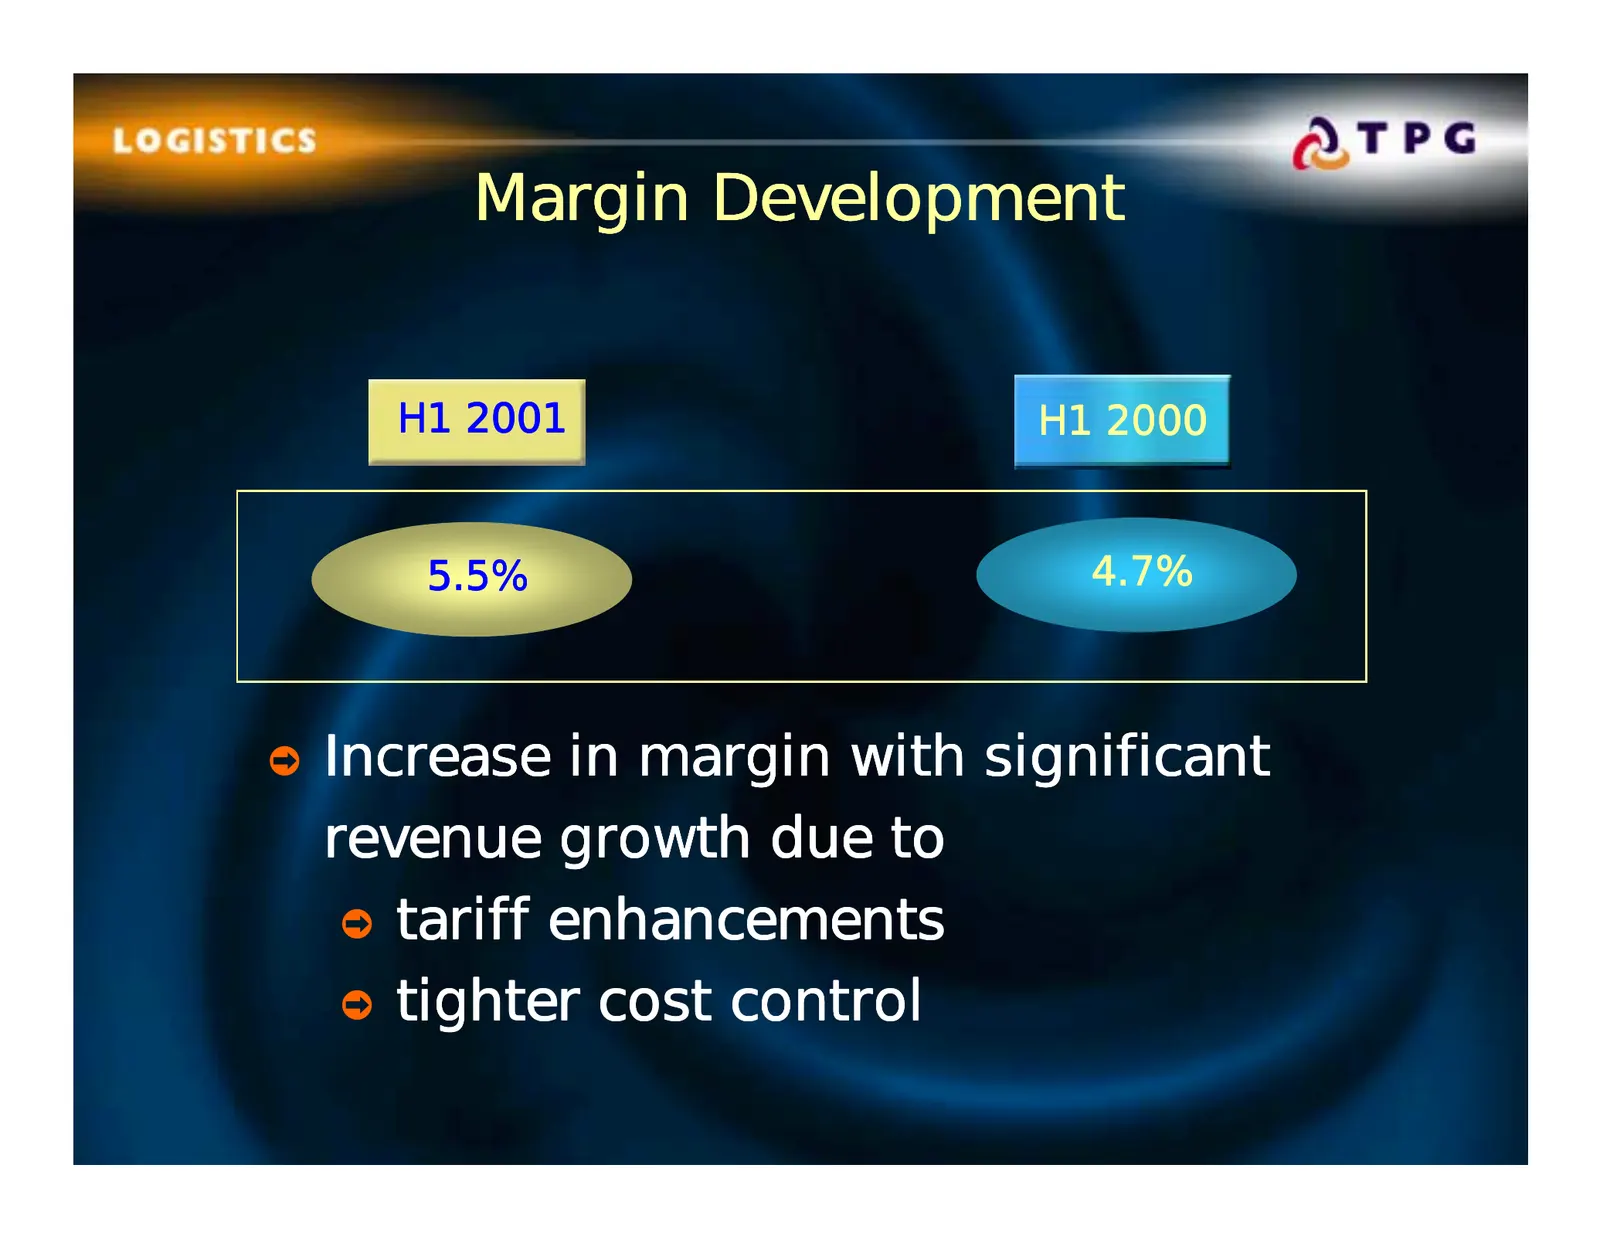
Margin Development H1 2001 H1 2000 5.5% 4.7% ò Increase in margin with significant revenue growth due to ò tariff enhancements ò tighter cost control Page 40 9 August, 2001
Slide 41: Logistics Outlook 2001
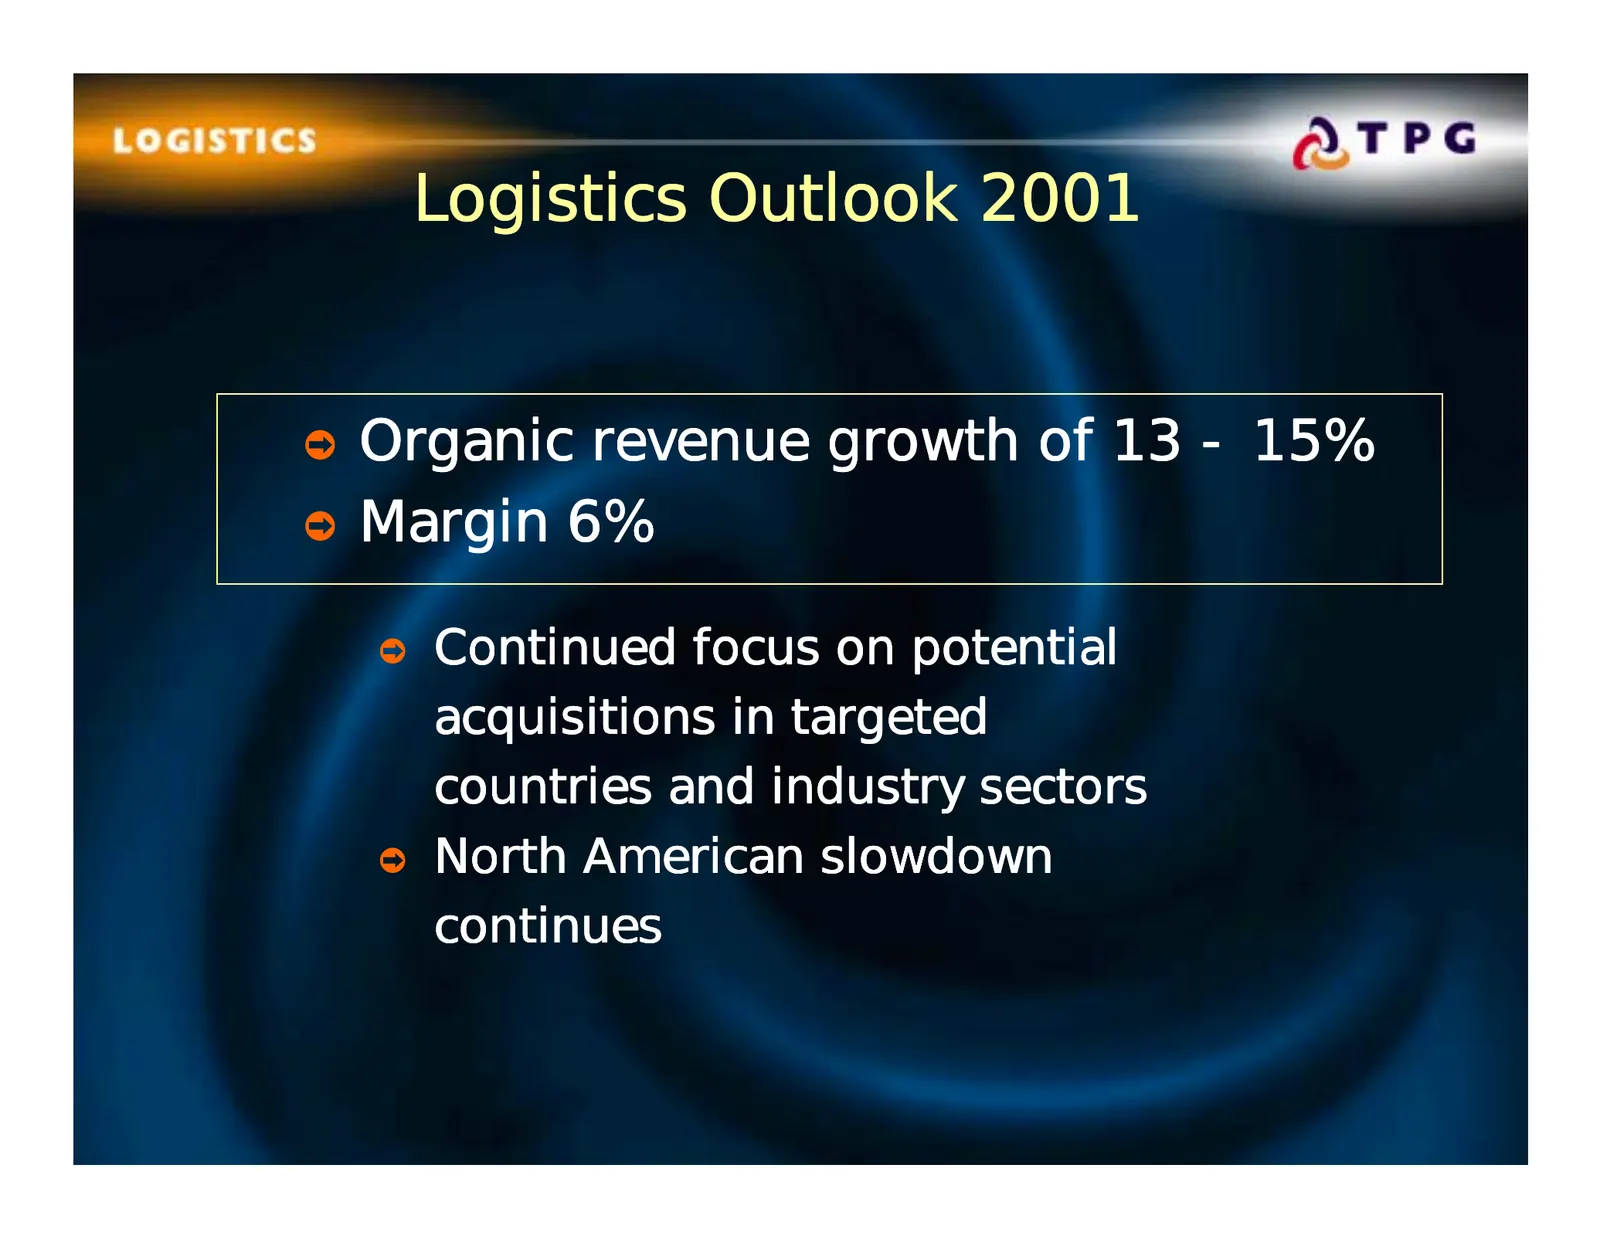
Logistics Outlook 2001 ò Organic revenue growth of 13 - 15% ò Margin 6% ò Continued focus on potential acquisitions in targeted countries and industry sectors ò North American slowdown continues Page 41 9 August, 2001

Slide 42: Financial Review
Financial Review Page 42 9 August, 2001
Slide 43: Strong Half Year Results
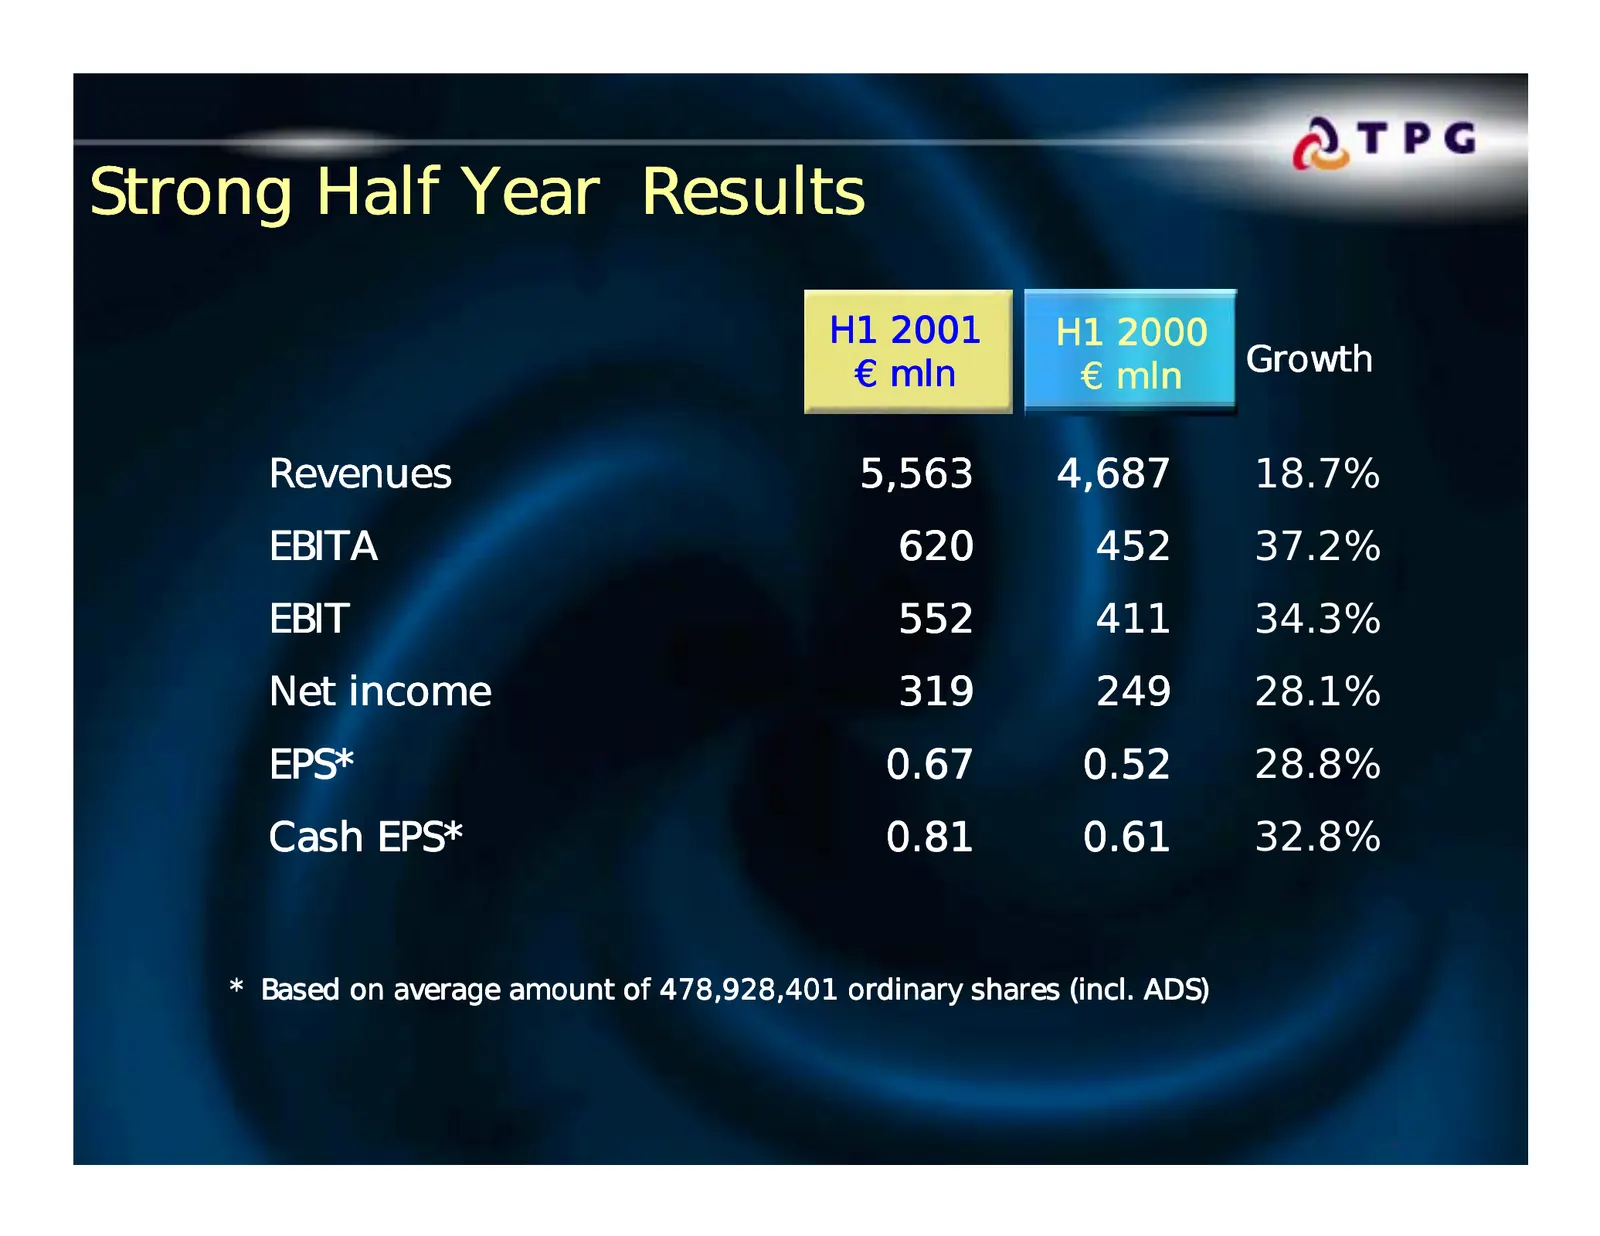
Strong Half Year Results H1 2001 H1 2000 € mln € mln Growth Revenues 5,563 4,687 18.7% EBITA 620 452 37.2% EBIT 552 411 34.3% Net income 319 249 28.1% EPS* 0.67 0.52 28.8% Cash EPS* 0.81 0.61 32.8% * Based on average amount of 478,928,401 ordinary shares (incl. ADS) Page 43 9 August, 2001
Slide 44: Net Income
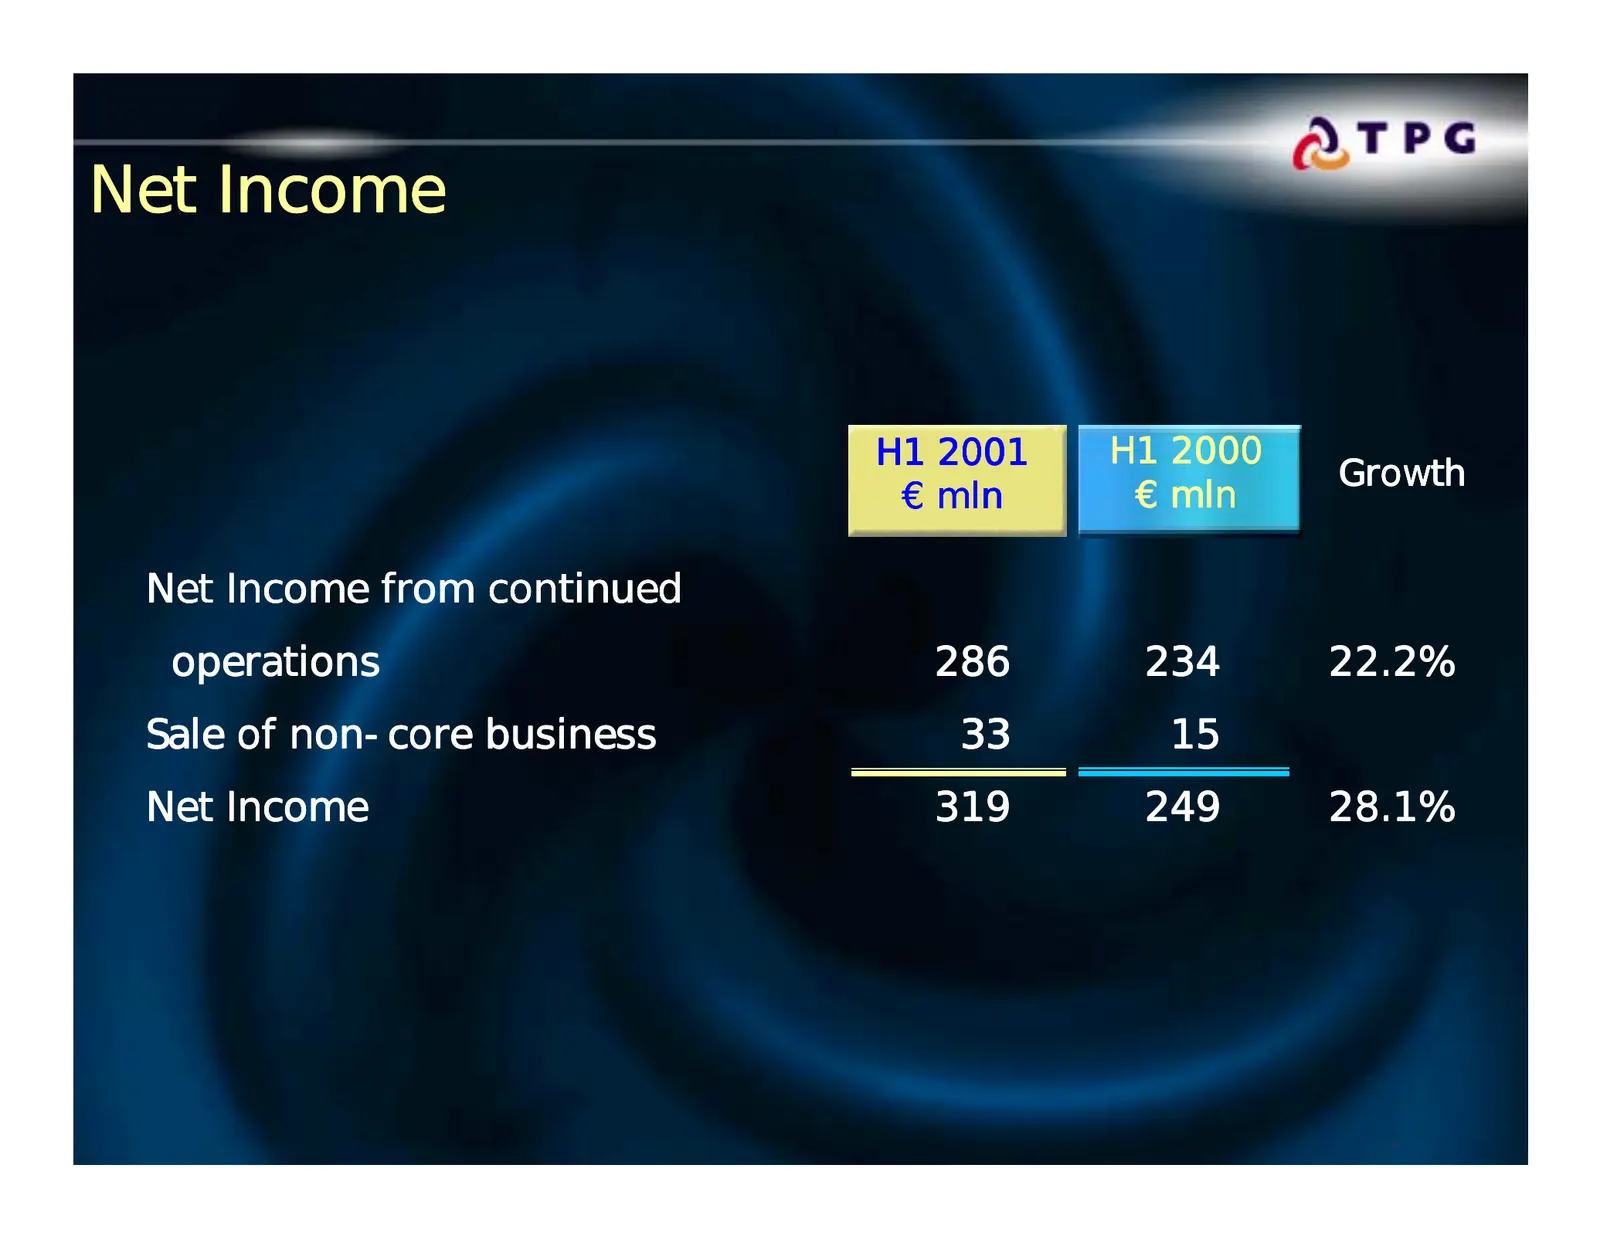
Net Income H1 2001 H1 2000 Growth € mln € mln Net Income from continued operations 286 234 22.2% Sale of non-core business 33 15 Net Income 319 249 28.1% Page 44 9 August, 2001
Slide 45: Statement of Income
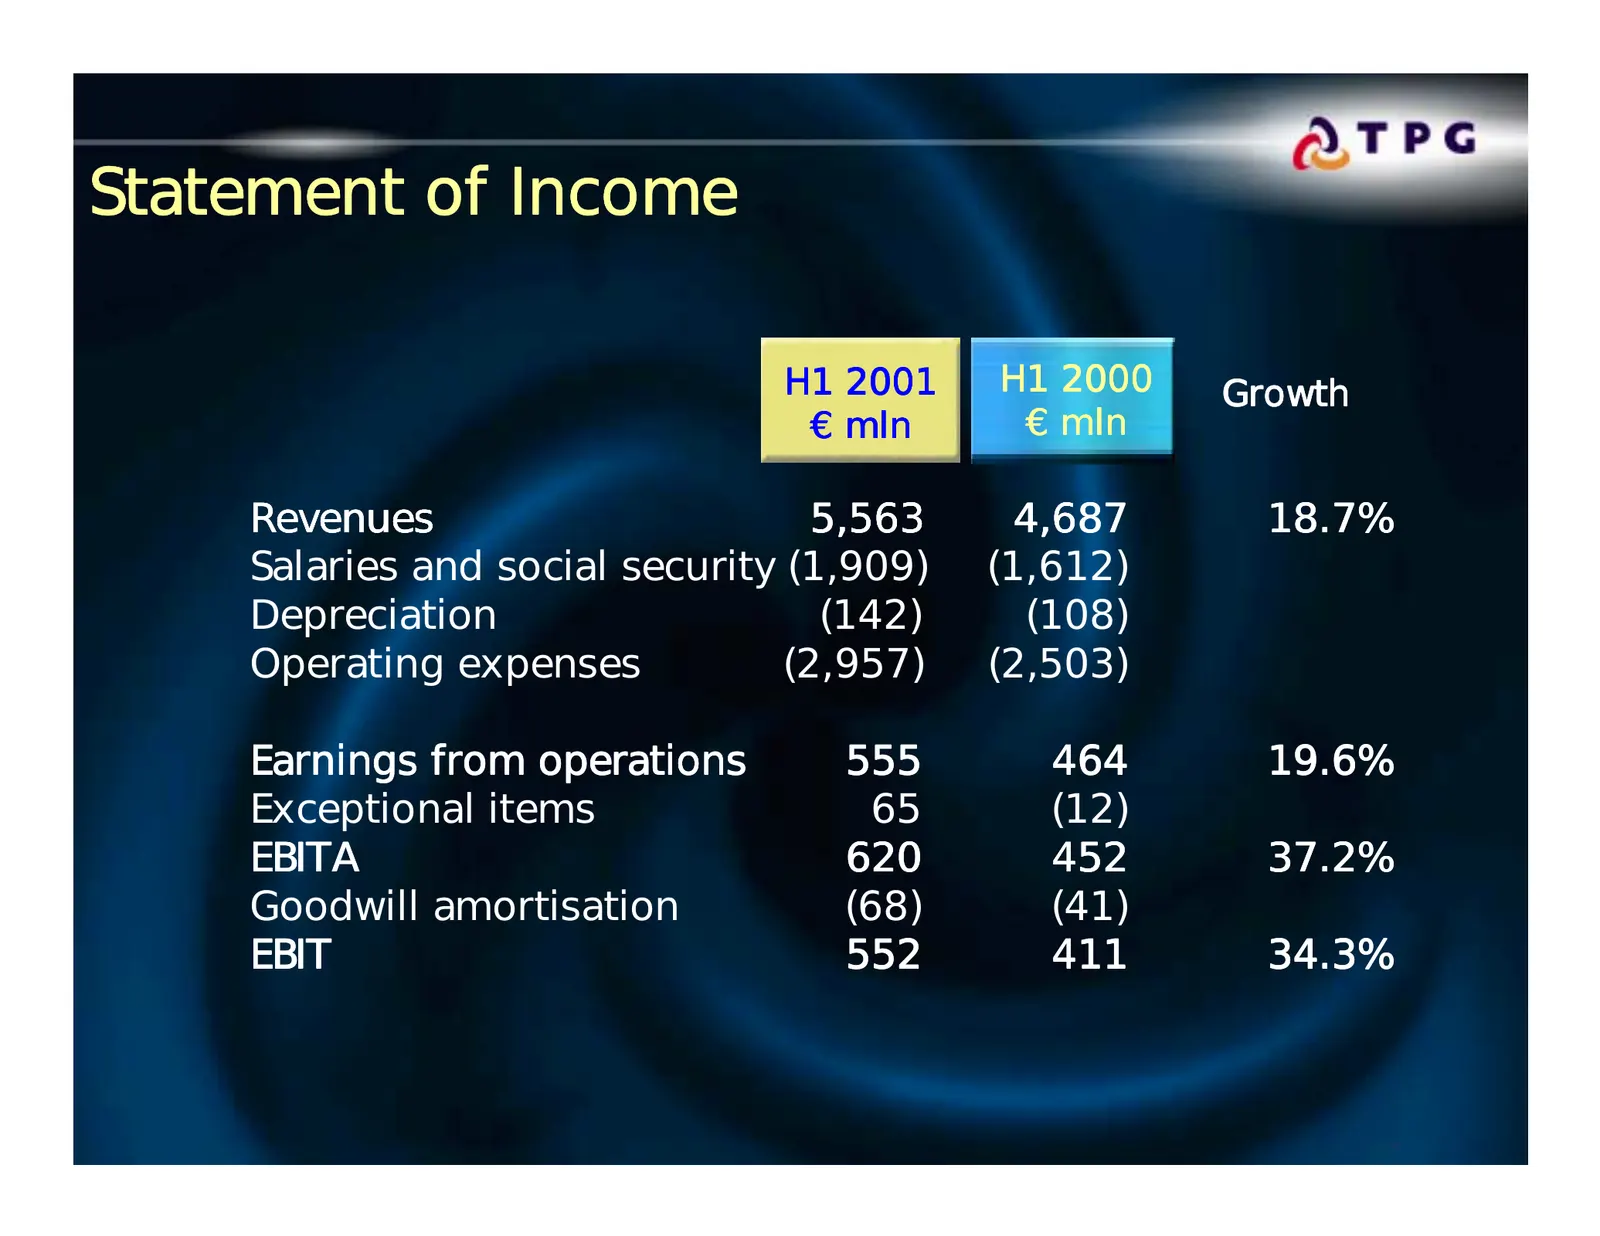
Statement of Income H1 2001 H1 2000 Growth € mln € mln Revenues 5,563 4,687 18.7% Salaries and social security (1,909) (1,612) Depreciation (142) (108) Operating expenses (2,957) (2,503) Earnings from operations 555 464 19.6% Exceptional items 65 (12) EBITA 620 452 37.2% Goodwill amortisation (68) (
Slide 46: Exceptional Items
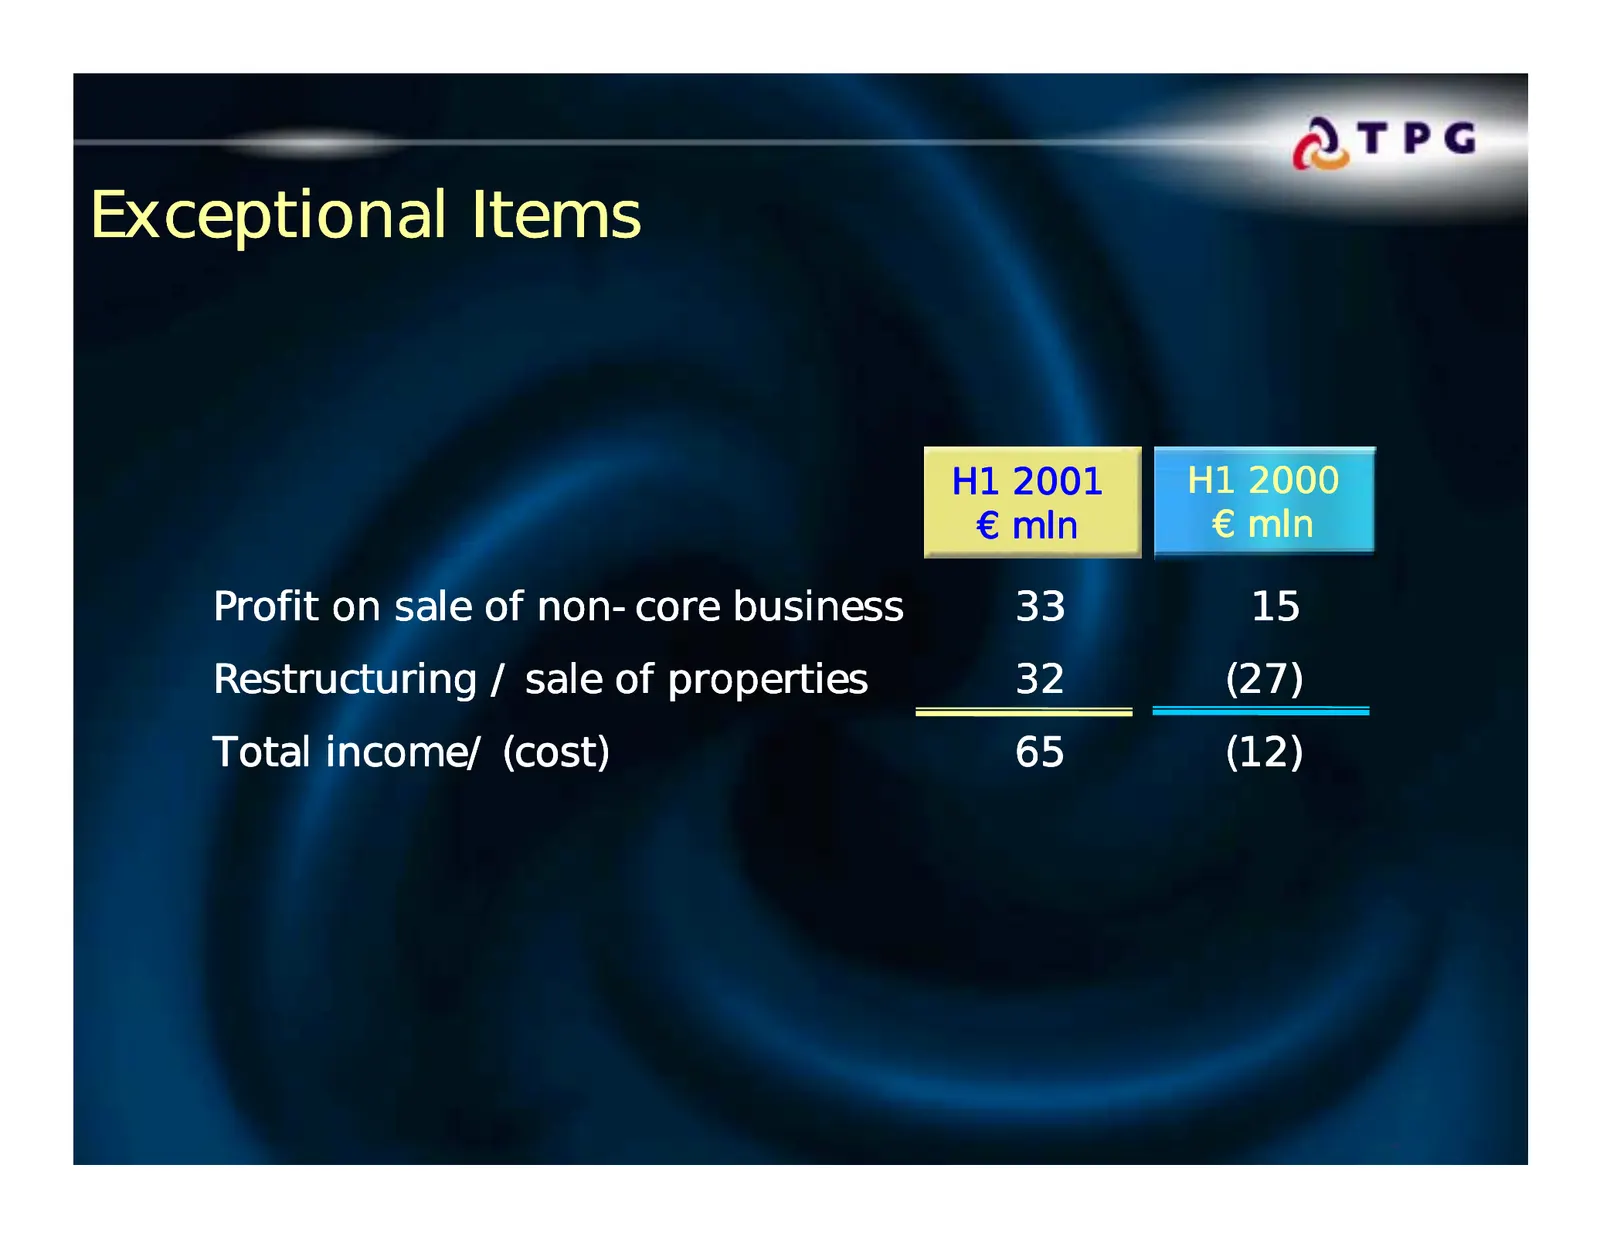
Exceptional Items H1 2001 H1 2000 € mln € mln Profit on sale of non-core business 33 15 Restructuring / sale of properties 32 (27) Total income/ (cost) 65 (12) Page 46 9 August, 2001
Slide 47: Statement of Income
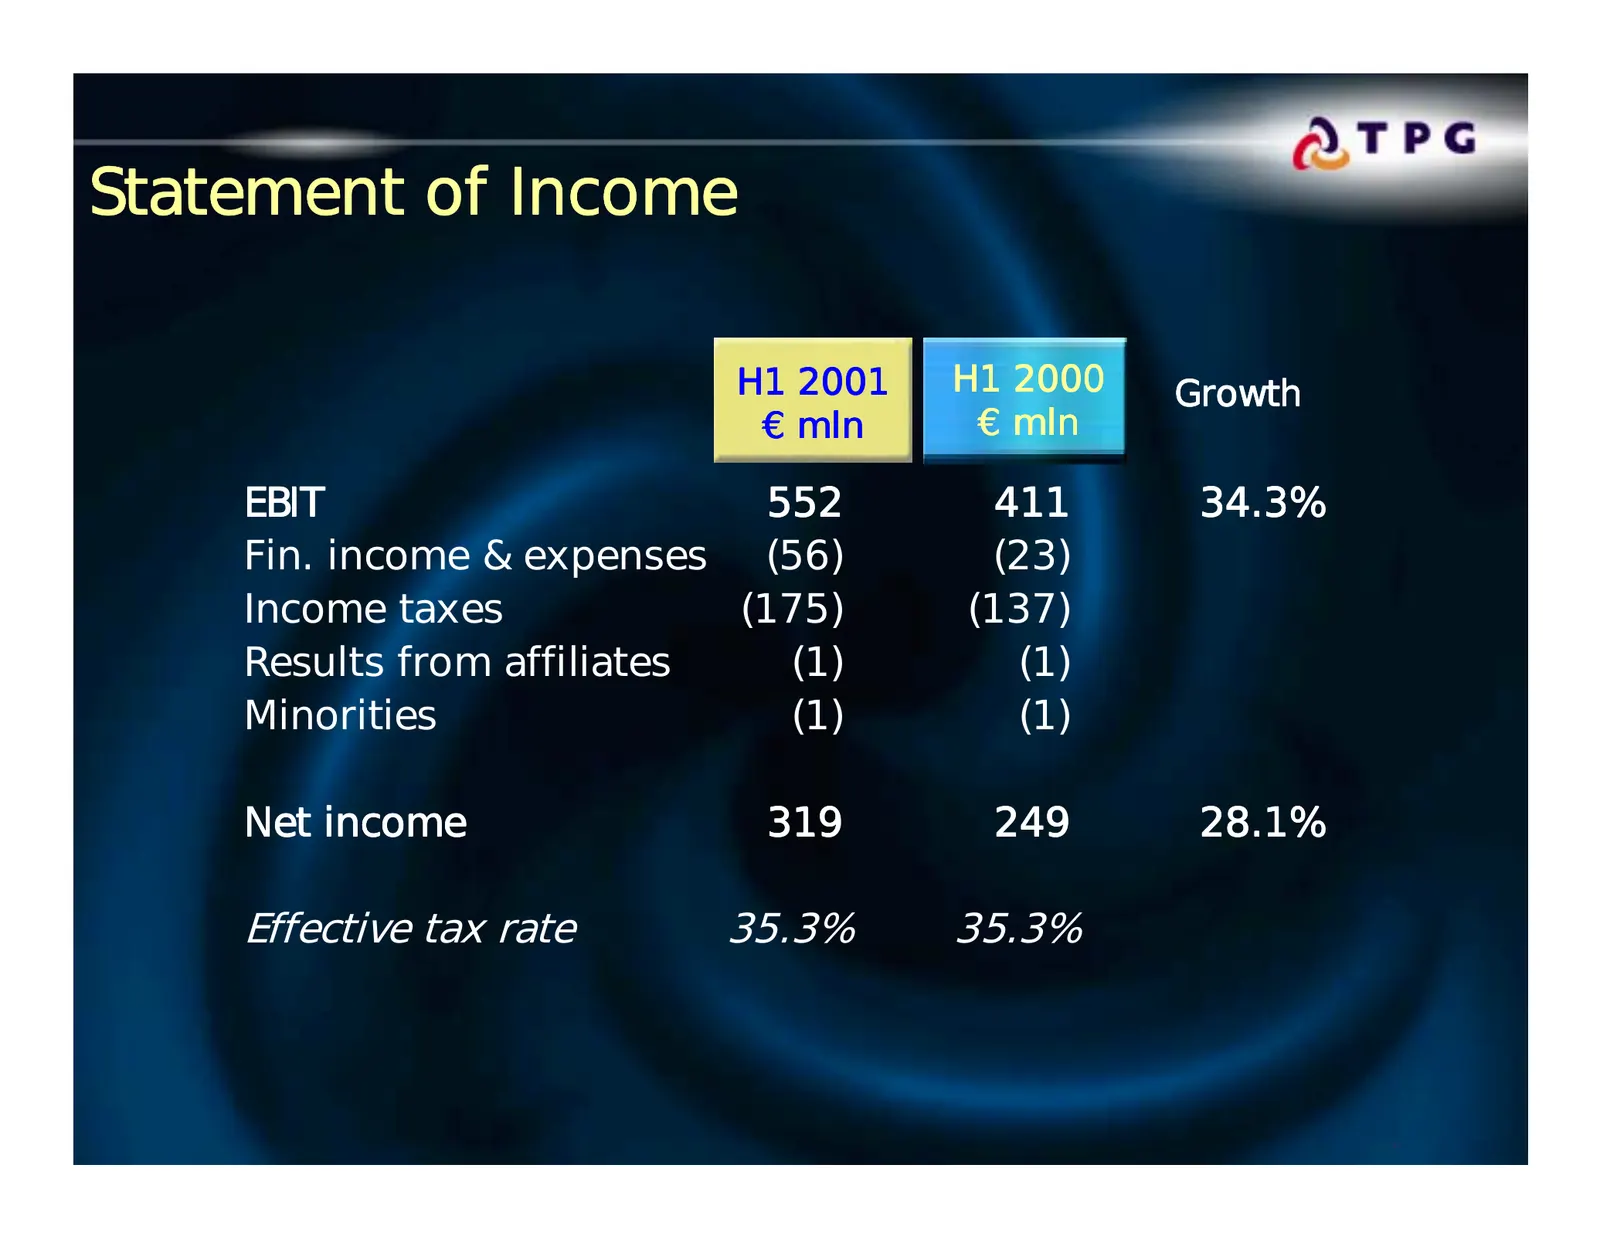
Statement of Income H1 2001 H1 2000 Growth € mln € mln EBIT 552 411 34.3% Fin. income & expenses (56) (23) Income taxes (175) (137) Results from affiliates (1) (1) Minorities (1) (1) Net income 319 249 28.1% Effective tax rate 35.3% 35.3% Page 47 9 August, 2001
Slide 48: Net Income growth
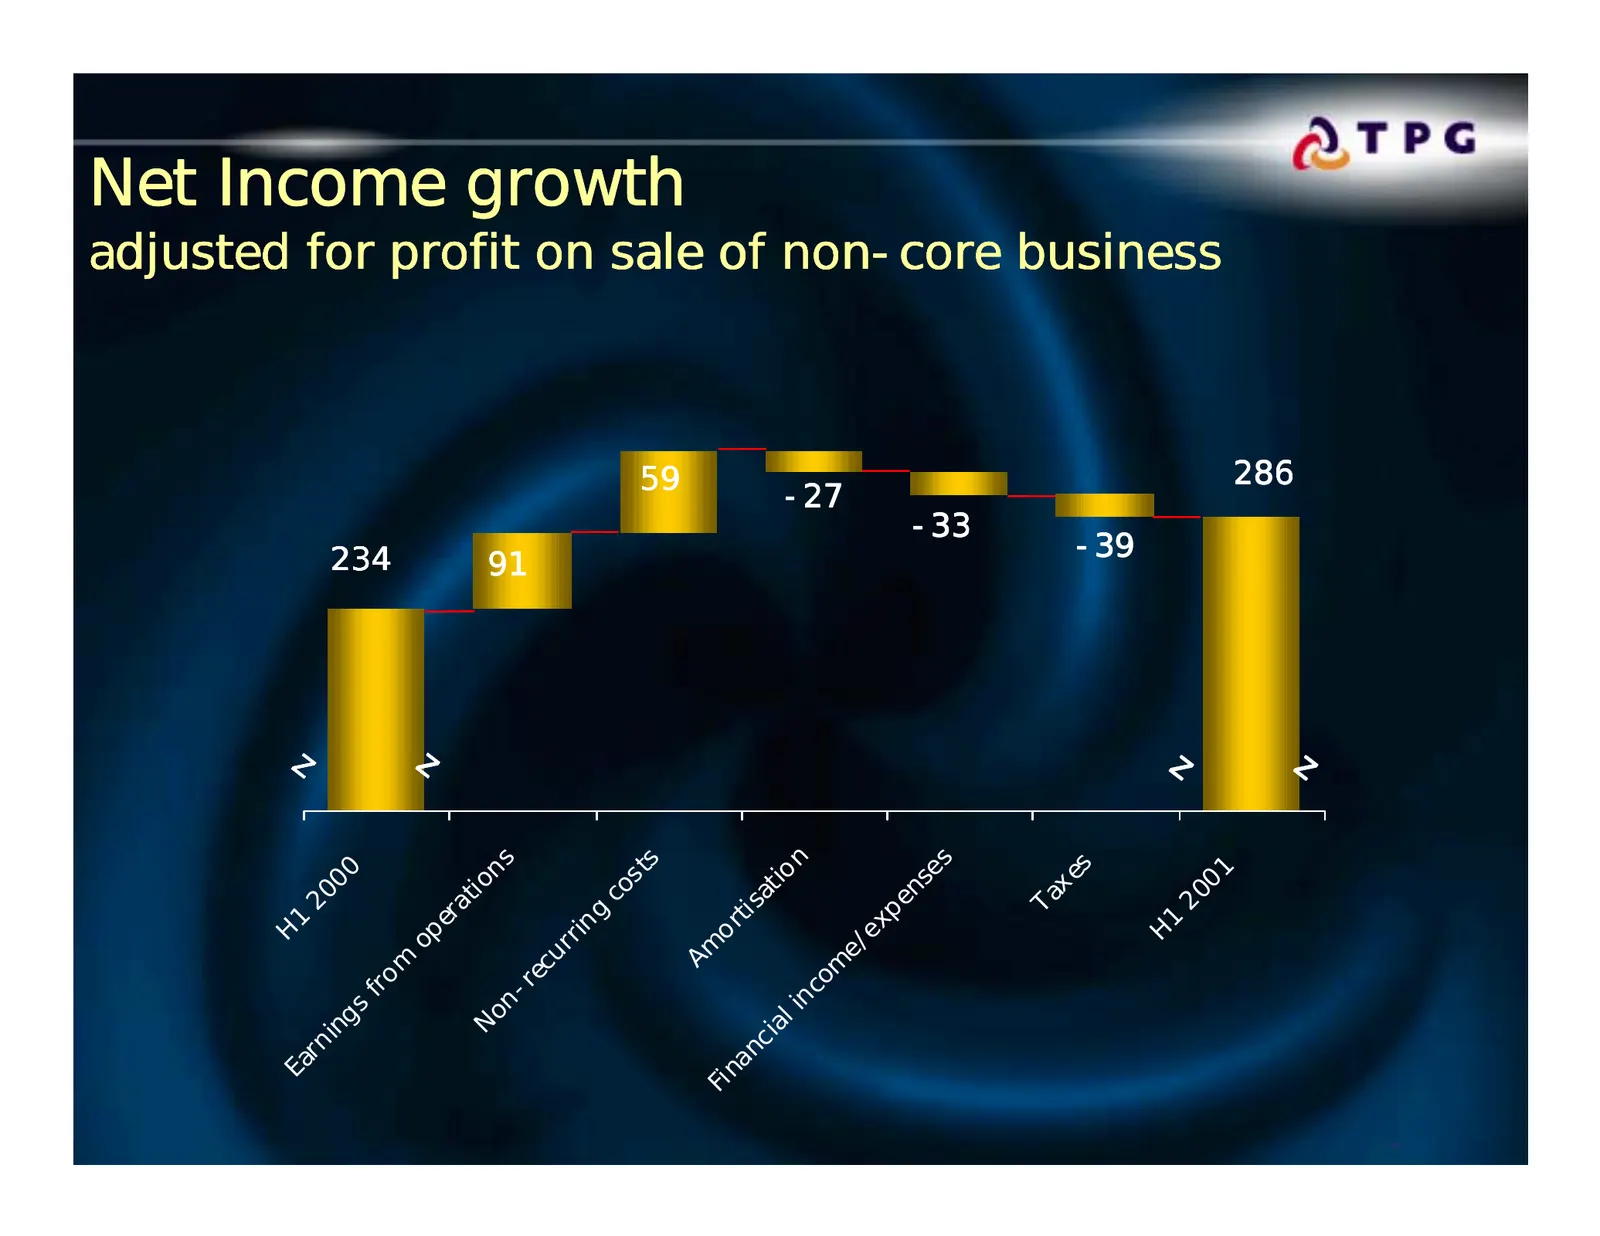
Net Income growth adjusted for profit on sale of non-core business 59 286 -27 -33 234 -39 91 z z z z n es ns s s 01 00 st io xe ns ti o co at 20 20 Ta pe tis a g er 1 1 ex rin or H H op e/ Am r cu m m re o co fr - in on gs l N ia in nc rn Ea na Fi Page 48 9 August, 2001
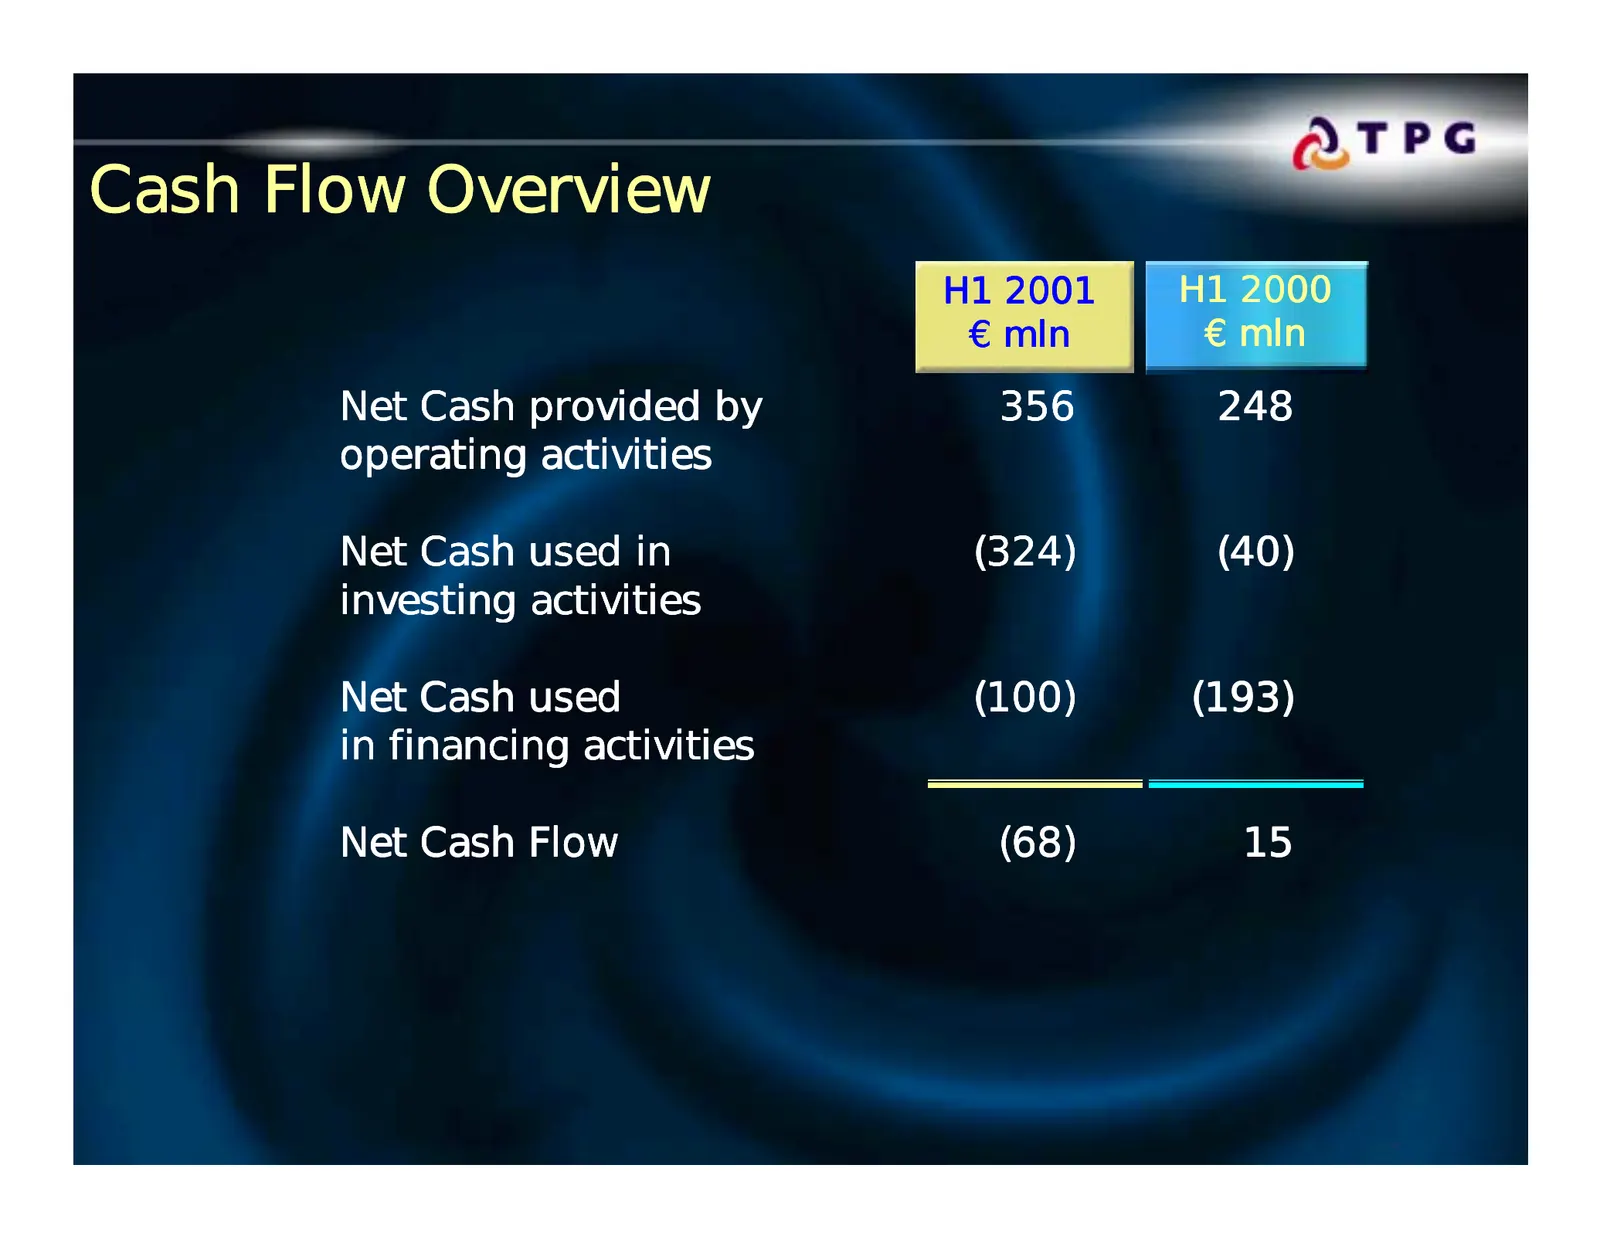
Slide 49: Cash Flow Overview
Cash Flow Overview H1 2001 H1 2000 € mln € mln Net Cash provided by 356 248 operating activities Net Cash used in (324) (40) investing activities Net Cash used (100) (193) in financing activities Net Cash Flow (68) 15 Page 49 9 August, 2001
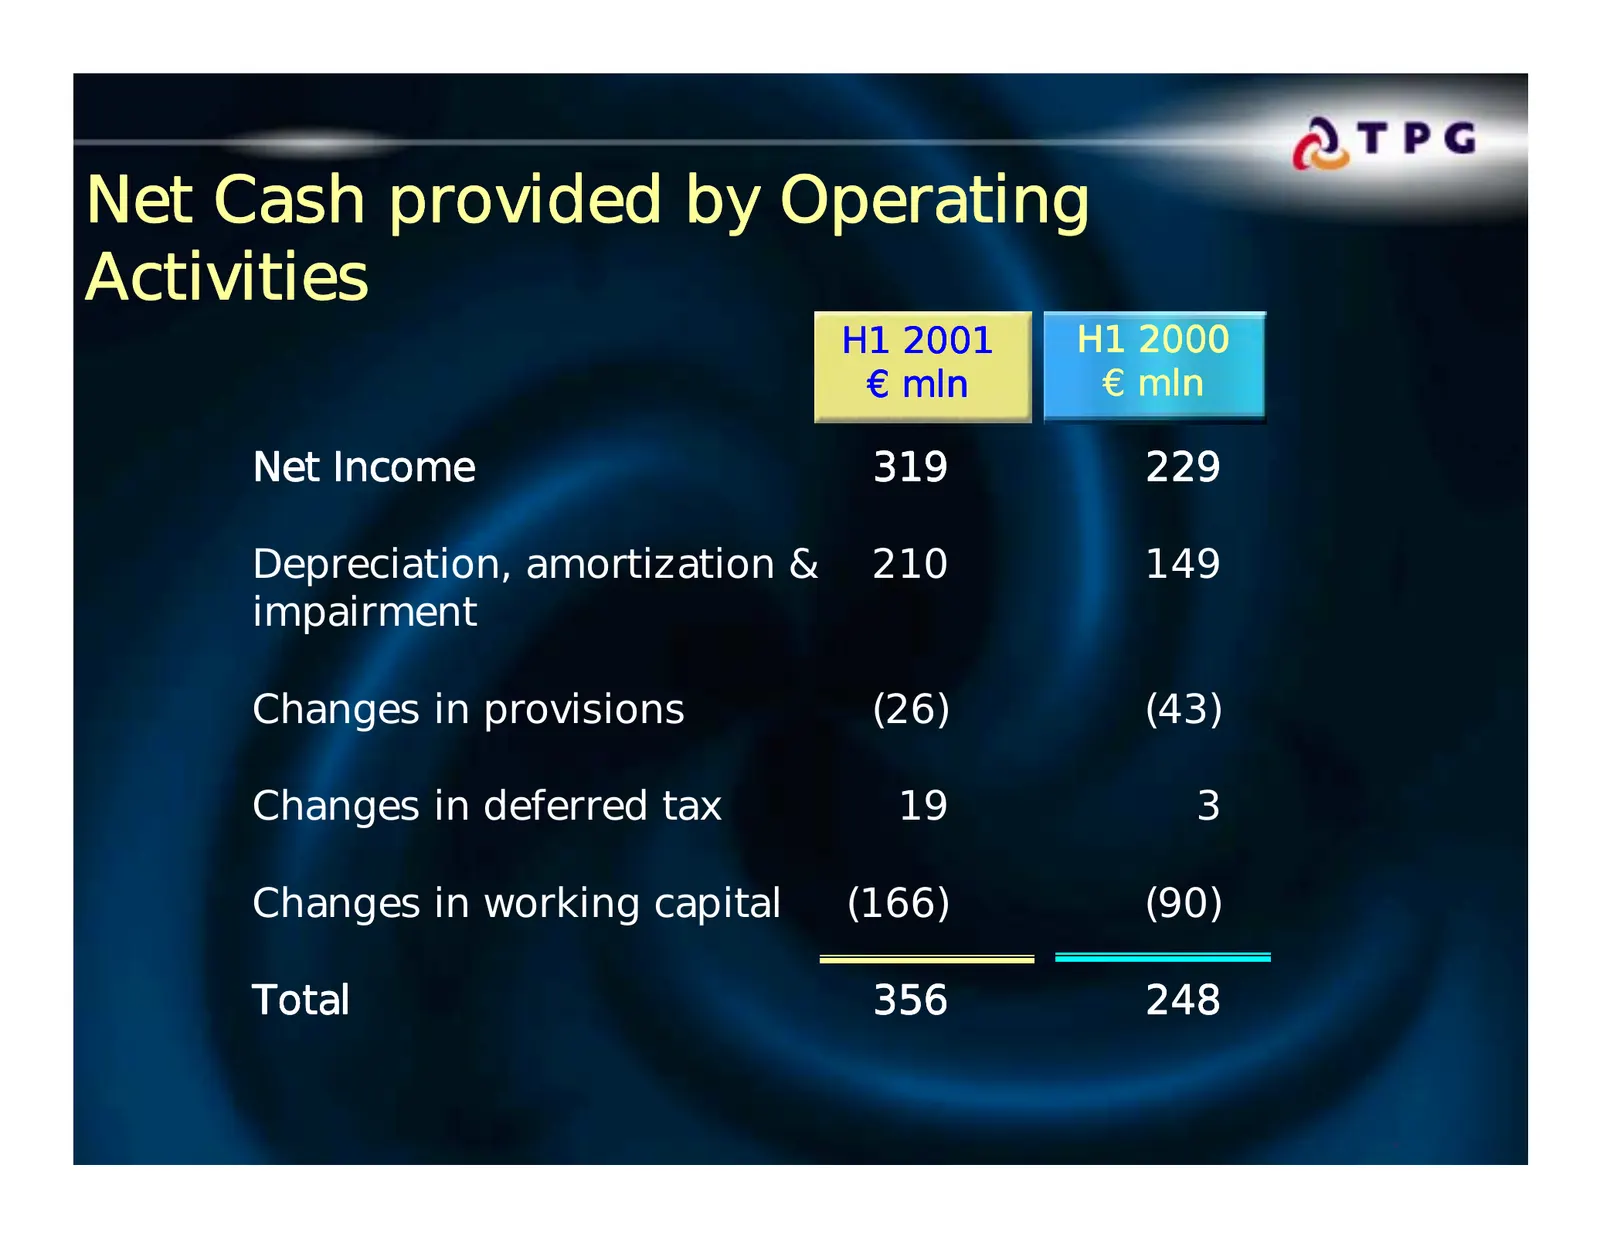
Slide 50: Net Cash provided by Operating Activities
Net Cash provided by Operating Activities H1 2001 H1 2000 € mln € mln Net Income 319 229 Depreciation, amortization & 210 149 impairment Changes in provisions (26) (43) Changes in deferred tax 19 3 Changes in working capital (166) (90) Total 356 248 Page 50 9 August, 2001
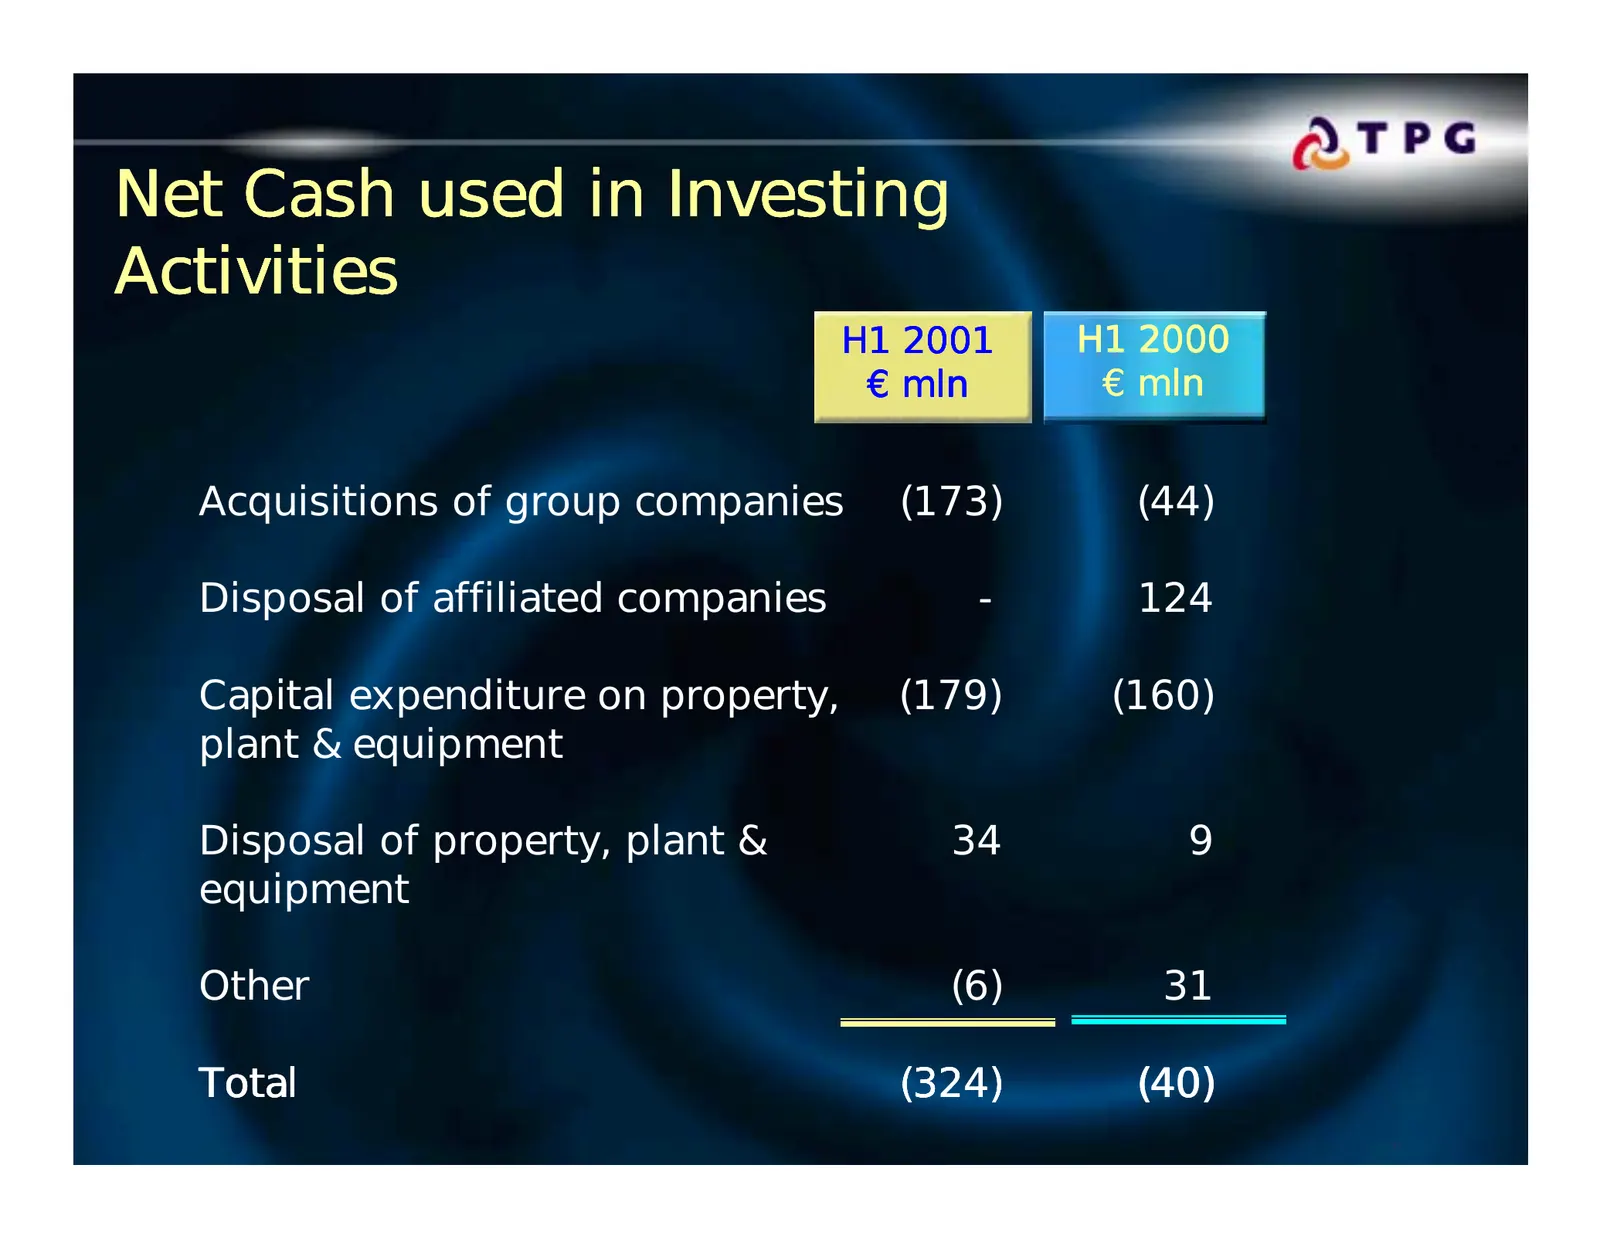
Slide 51: Net Cash used in Investing Activities
Net Cash used in Investing Activities H1 2001 H1 2000 € mln € mln Acquisitions of group companies (173) (44) Disposal of affiliated companies - 124 Capital expenditure on property, (179) (160) plant & equipment Disposal of property, plant & 34 9 equipment Other (6) 31 Total (324) (40) Page 51 9 Augu
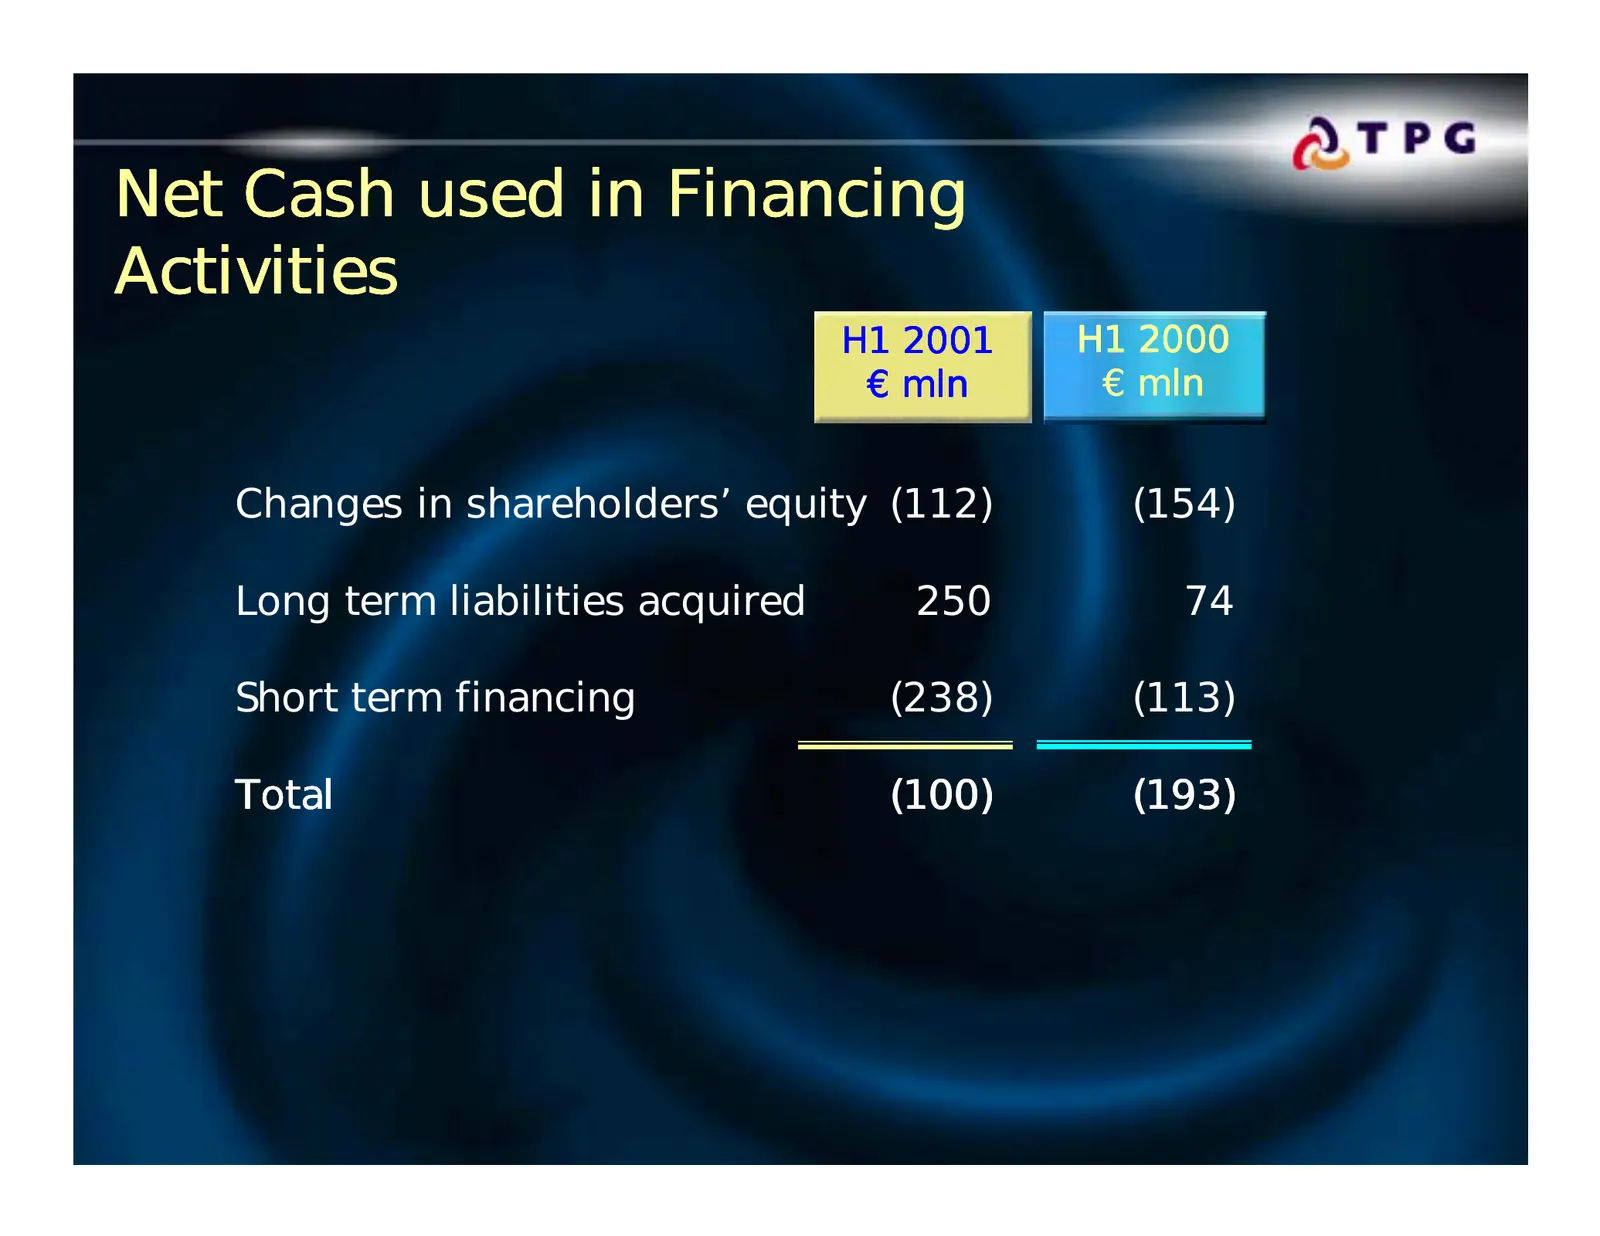
Slide 52: Net Cash used in Financing Activities
Net Cash used in Financing Activities H1 2001 H1 2000 € mln € mln Changes in shareholders’ equity (112) (154) Long term liabilities acquired 250 74 Short term financing (238) (113) Total (100) (193) Page 52 9 August, 2001
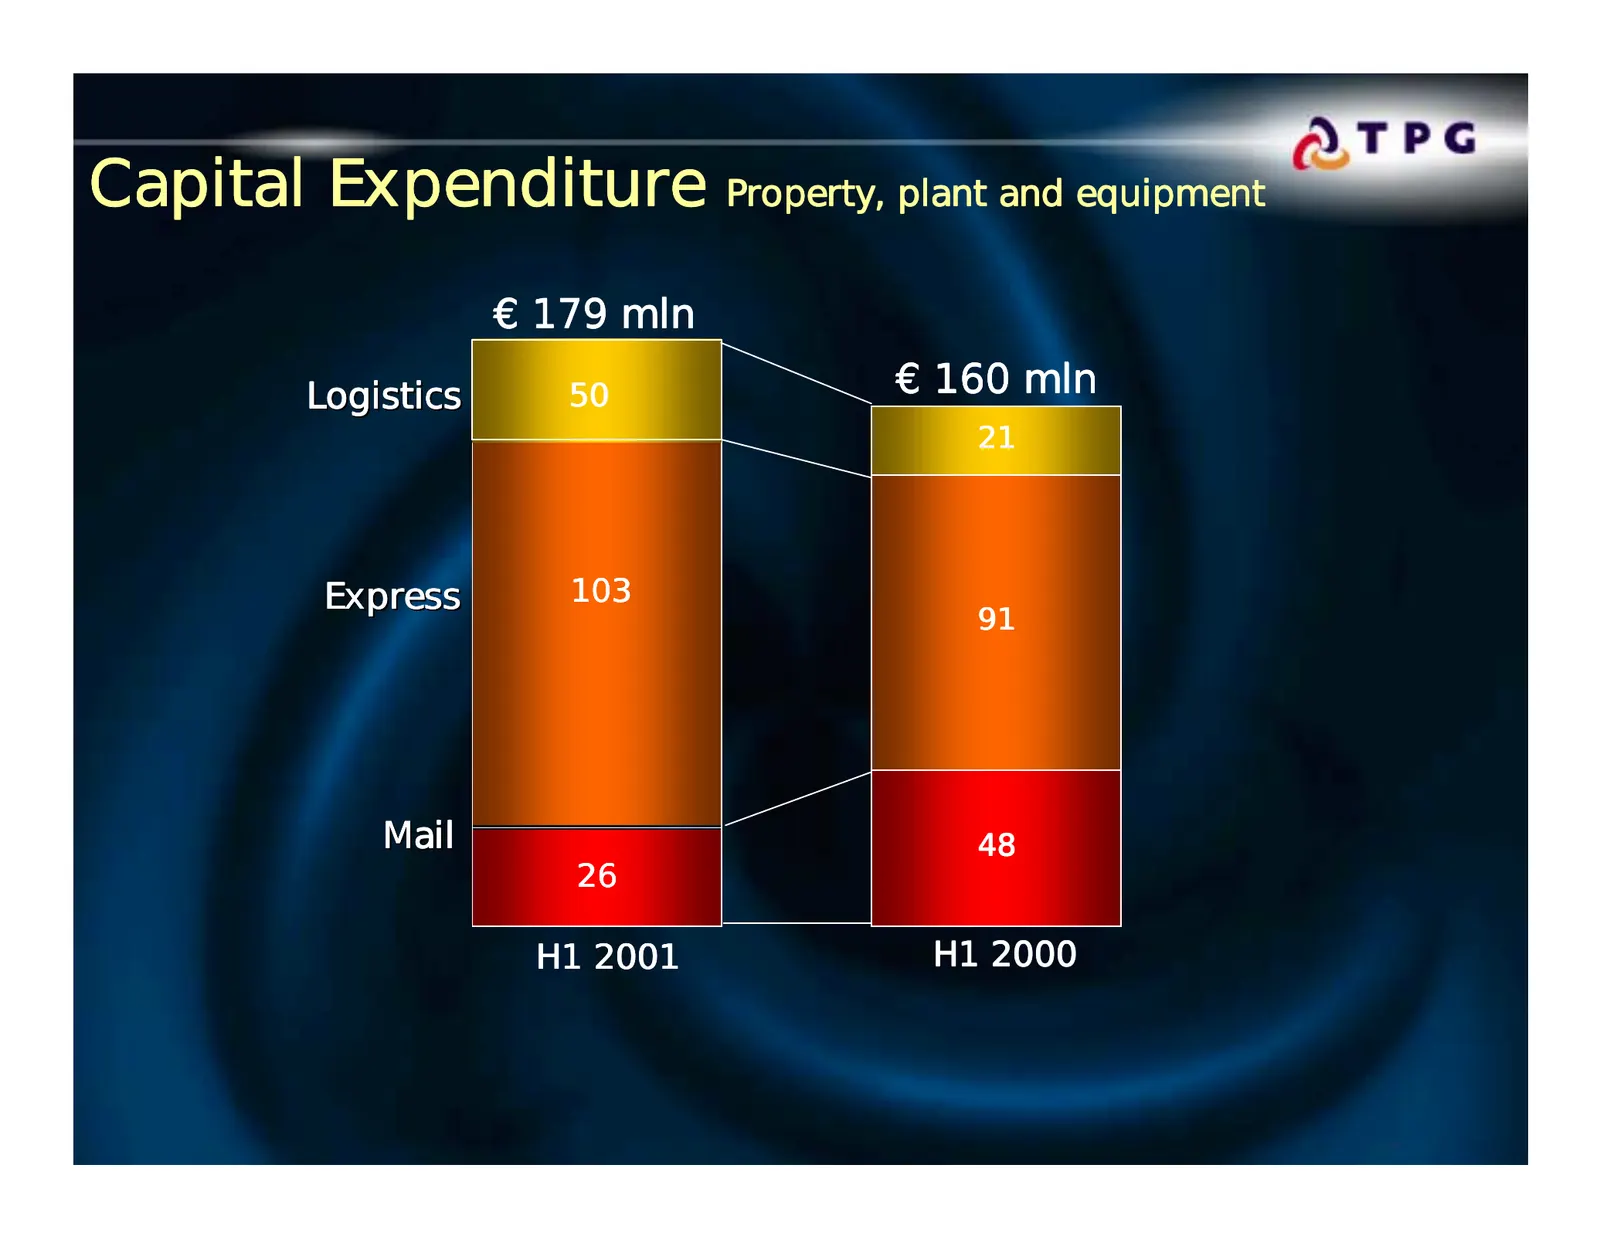
Slide 53: Capital Expenditure Property, plant and equipment
Capital Expenditure Property, plant and equipment € 179 mln Logistics 50 € 160 mln 21 Express 103 91 Mail 48 26 H1 2001 H1 2000 Page 53 9 August, 2001
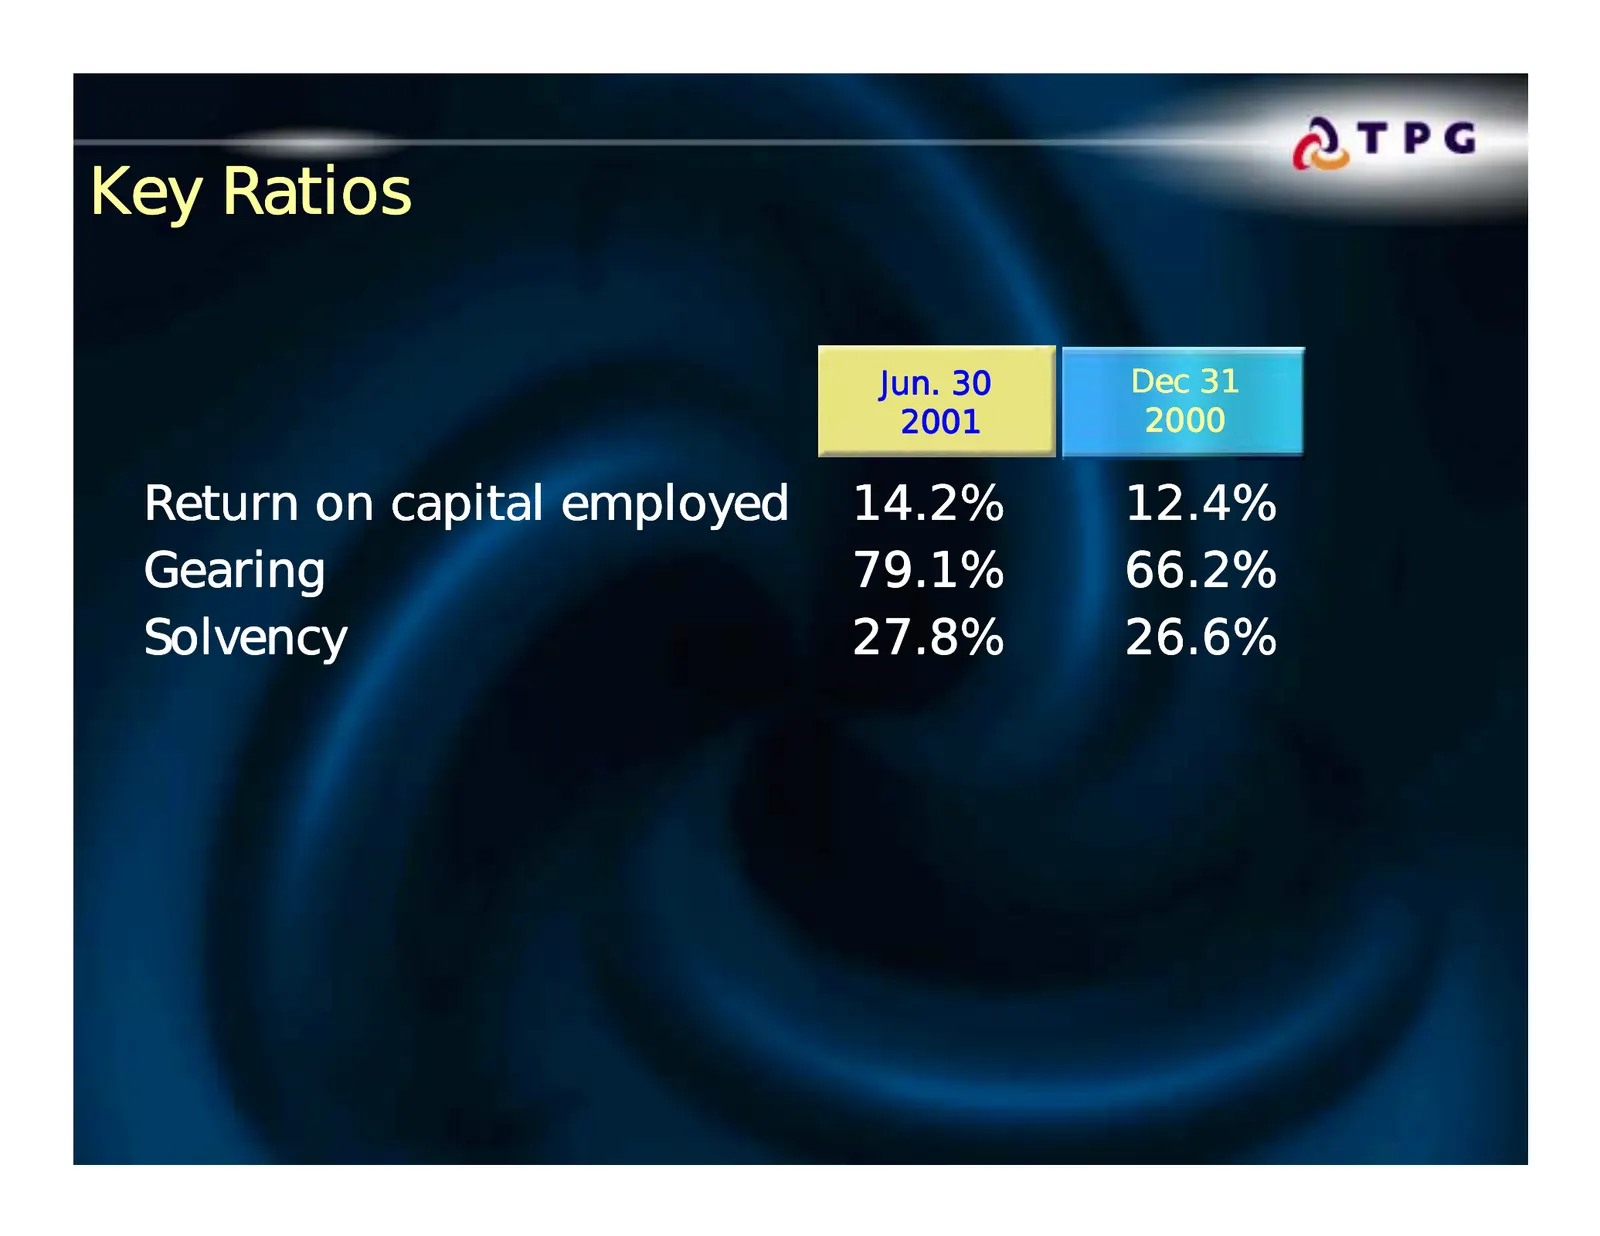
Slide 54: Key Ratios
Key Ratios Jun. 30 Dec 31 2001 2000 Return on capital employed 14.2% 12.4% Gearing 79.1% 66.2% Solvency 27.8% 26.6% Page 54 9 August, 2001
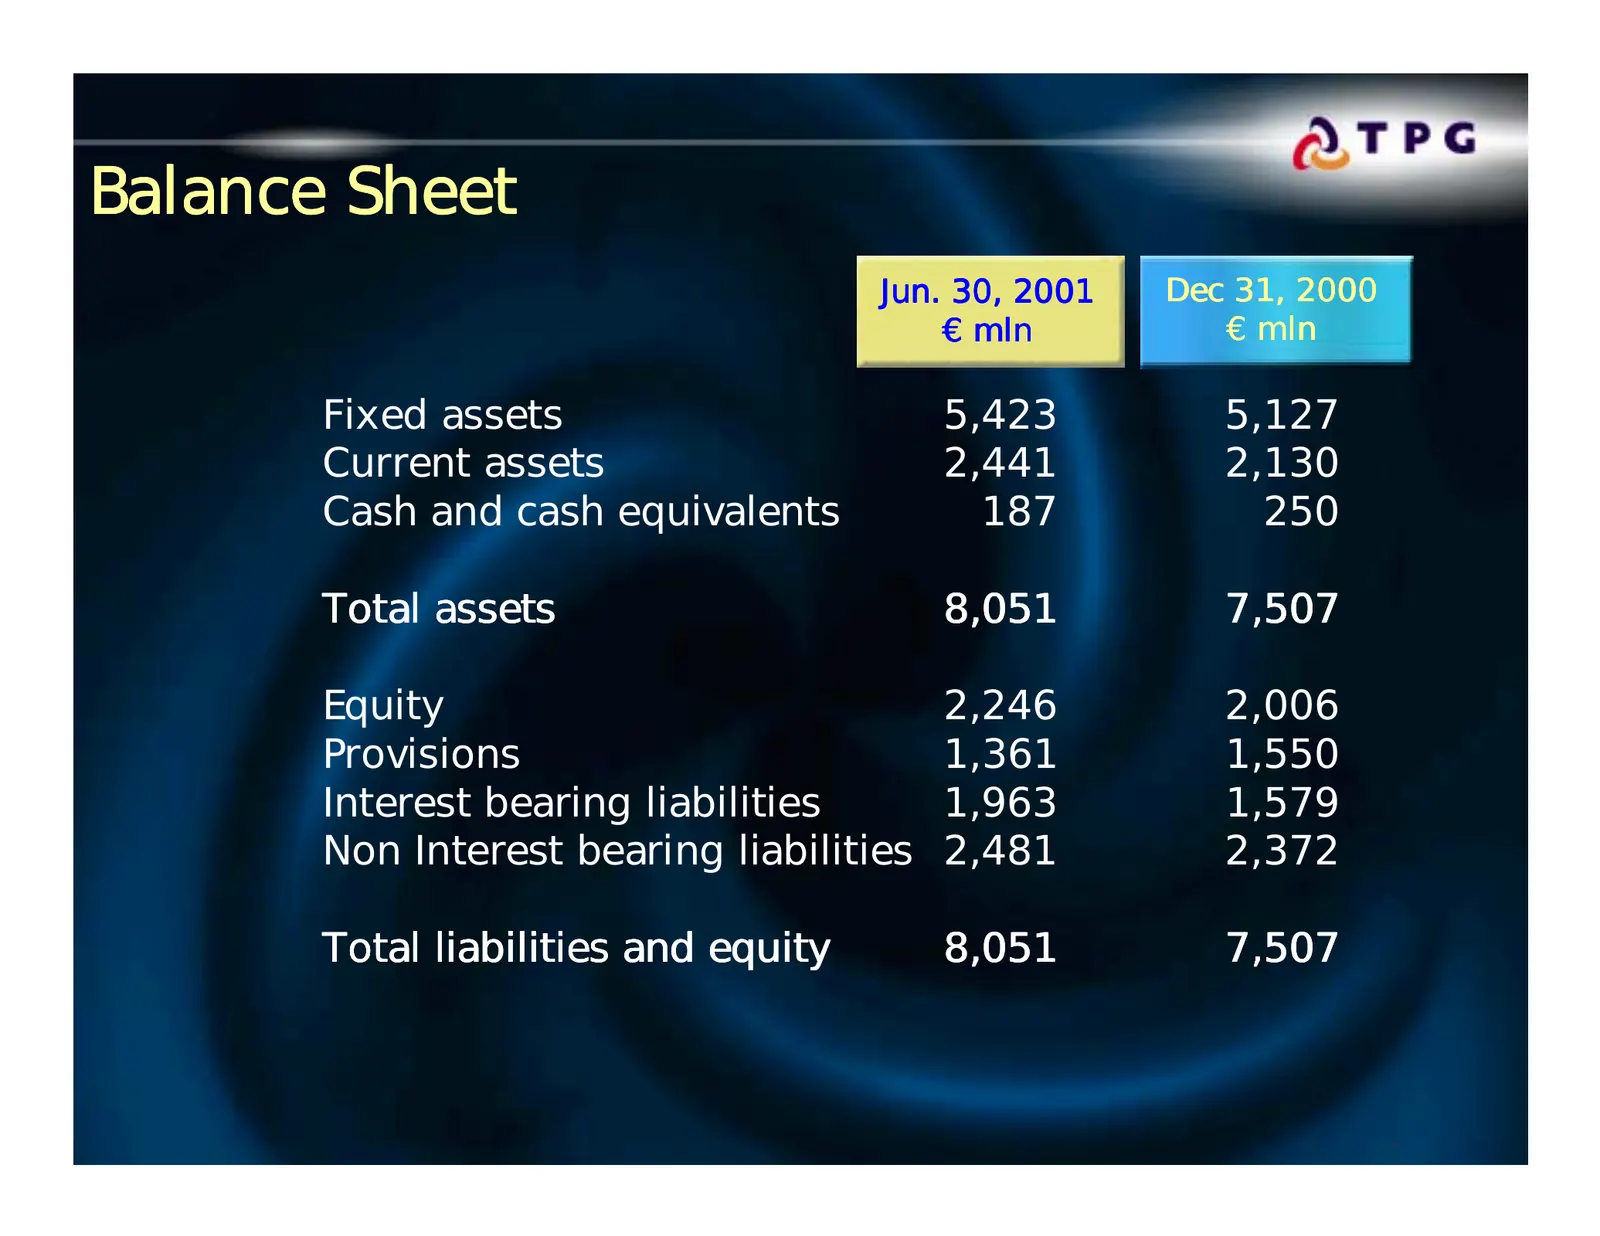
Slide 55: Balance Sheet
Balance Sheet Jun. 30, 2001 Dec 31, 2000 € mln € mln Fixed assets 5,423 5,127 Current assets 2,441 2,130 Cash and cash equivalents 187 250 Total assets 8,051 7,507 Equity 2,246 2,006 Provisions 1,361 1,550 Interest bearing liabilities 1,963 1,579 Non Interest bearing liabilities 2,481 2,372 Total li
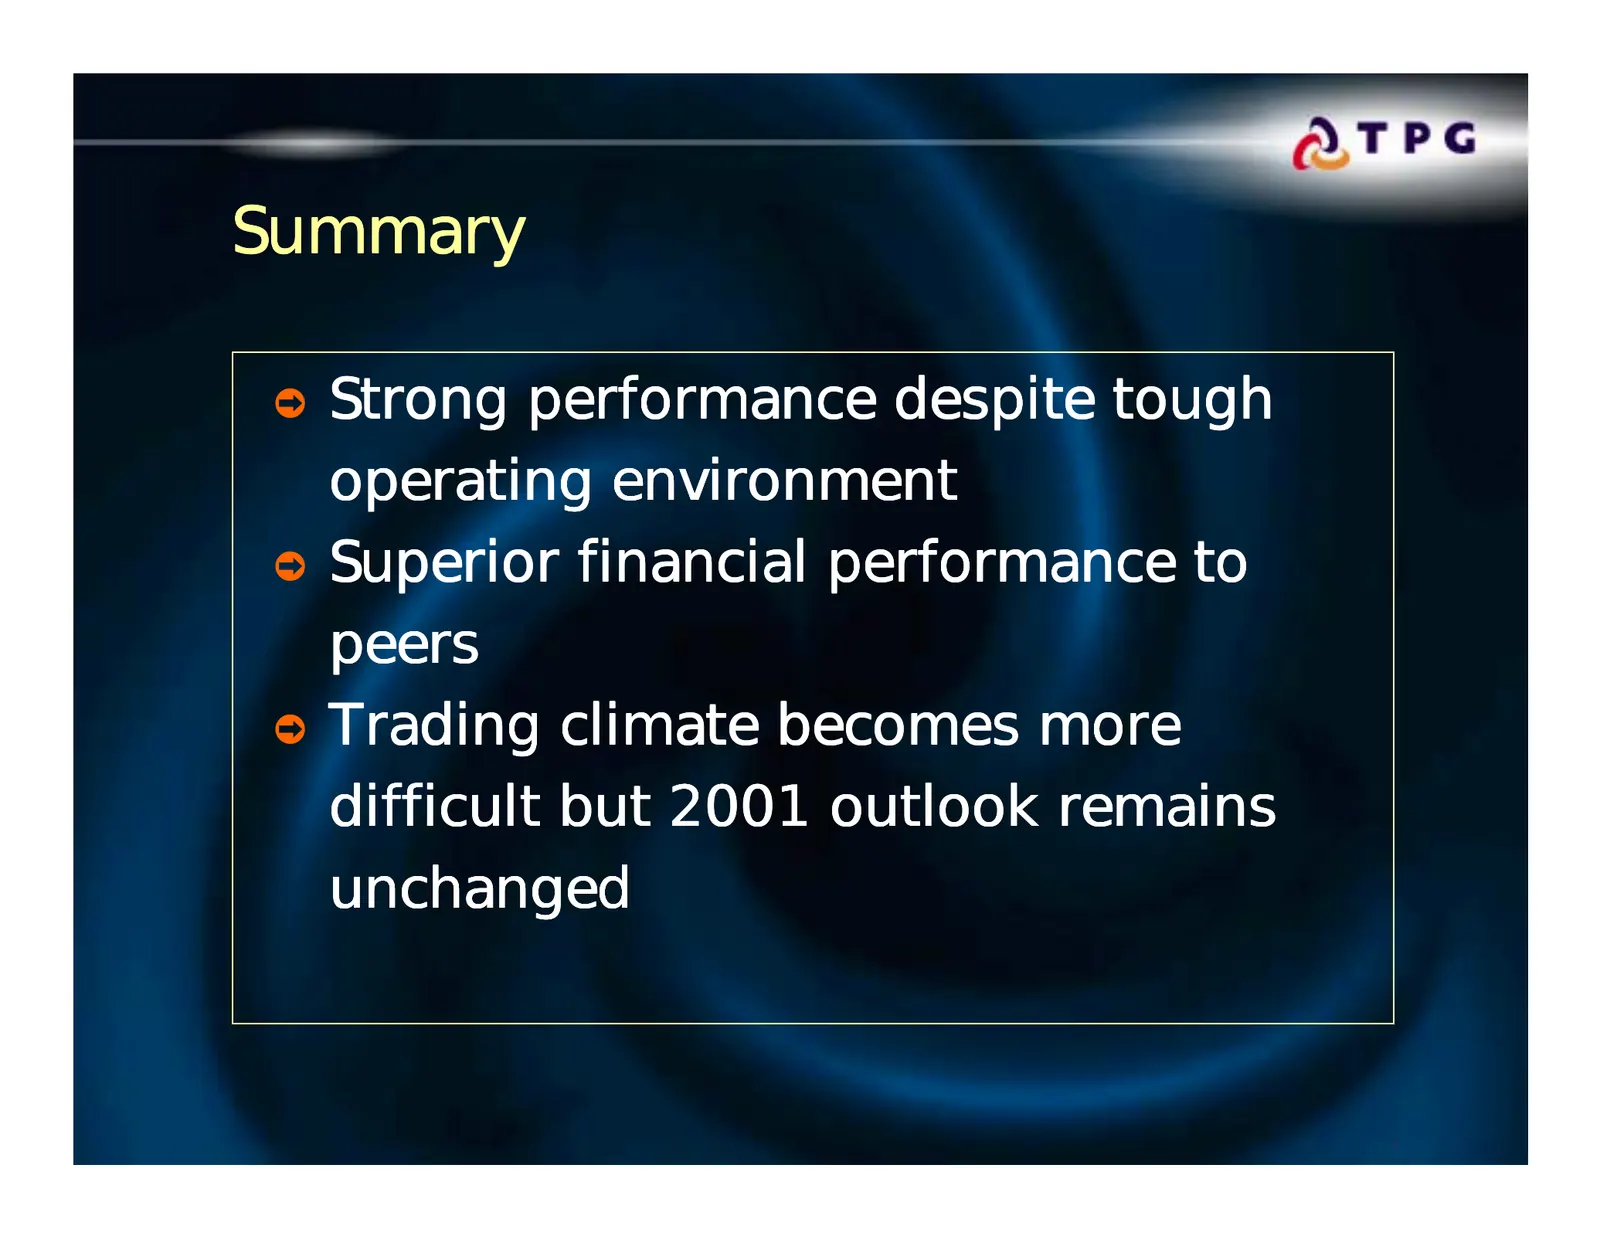
Slide 56: Summary
Summary ò Strong performance despite tough operating environment ò Superior financial performance to peers ò Trading climate becomes more difficult but 2001 outlook remains unchanged Page 56 9 August, 2001
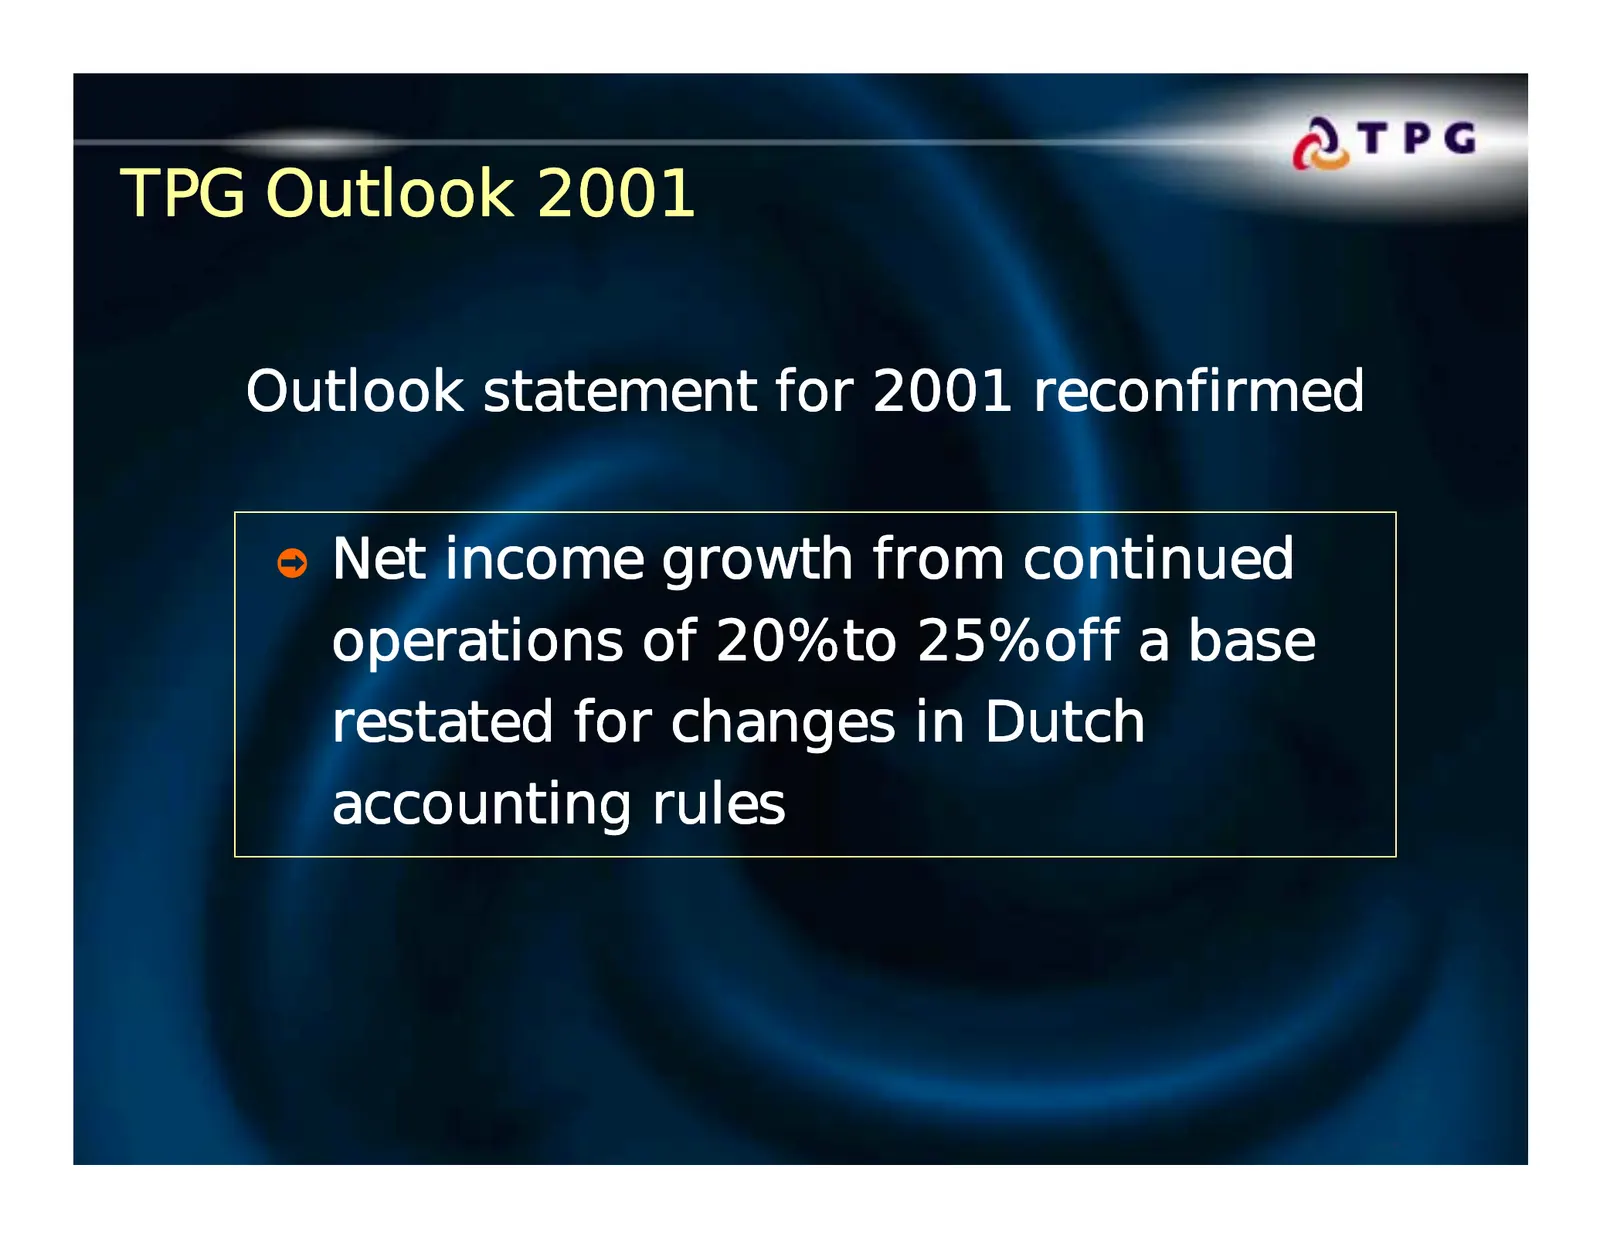
Slide 57: TPG Outlook 2001
TPG Outlook 2001 Outlook statement for 2001 reconfirmed ò Net income growth from continued operations of 20% to 25% off a base restated for changes in Dutch accounting rules Page 57 9 August, 2001
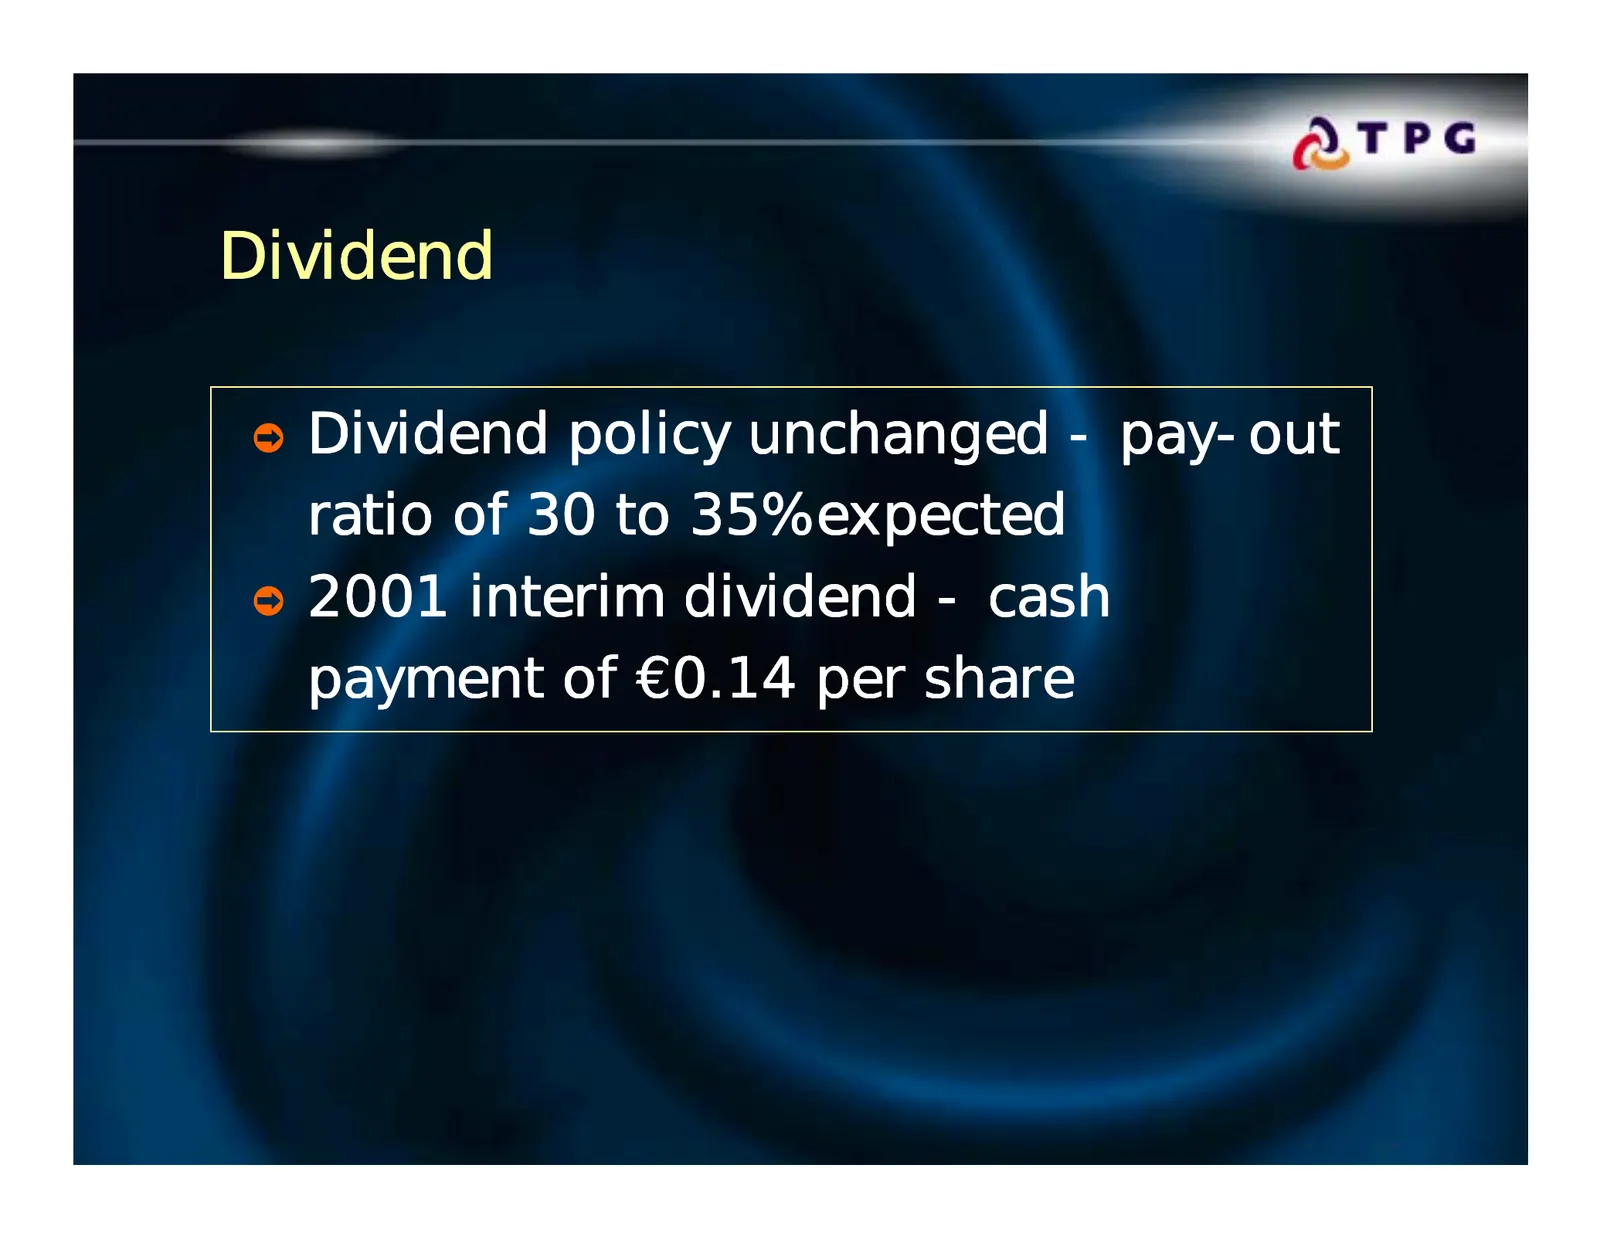
Slide 58: Dividend
Dividend ò Dividend policy unchanged - pay-out ratio of 30 to 35% expected ò 2001 interim dividend - cash payment of €0.14 per share Page 58 9 August, 2001

Slide 59: Appendix
Appendix Page 59 9 August, 2001
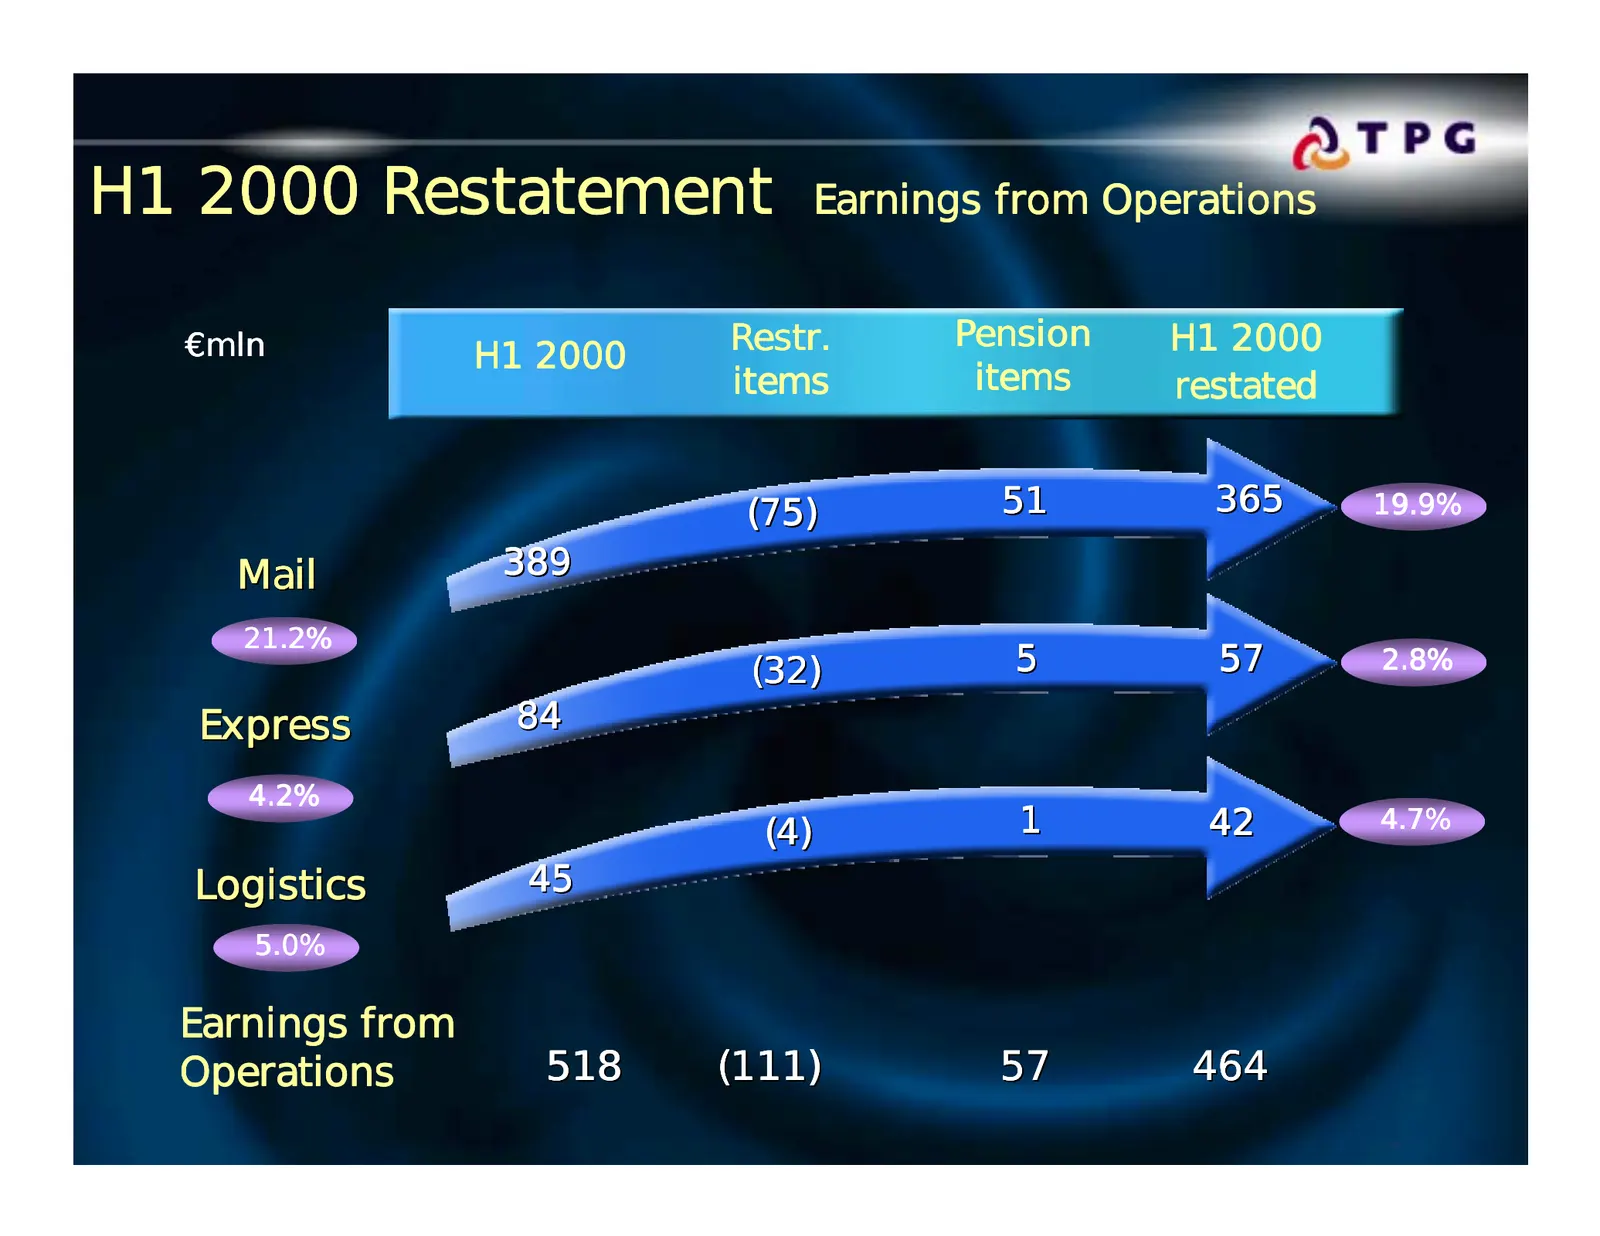
Slide 60: H1 2000 Restatement Earnings from Operations
H1 2000 Restatement Earnings from Operations €mln Restr. Pension H1 2000 H1 2000 items items restated (75) 51 365 19.9% Mail 389 21.2% (32) 5 57 2.8% Express 84 4.2% (4) 1 42 4.7% Logistics 45 5.0% Earnings from Operations 518 (111) 57 464 Page 60 9 August, 2001
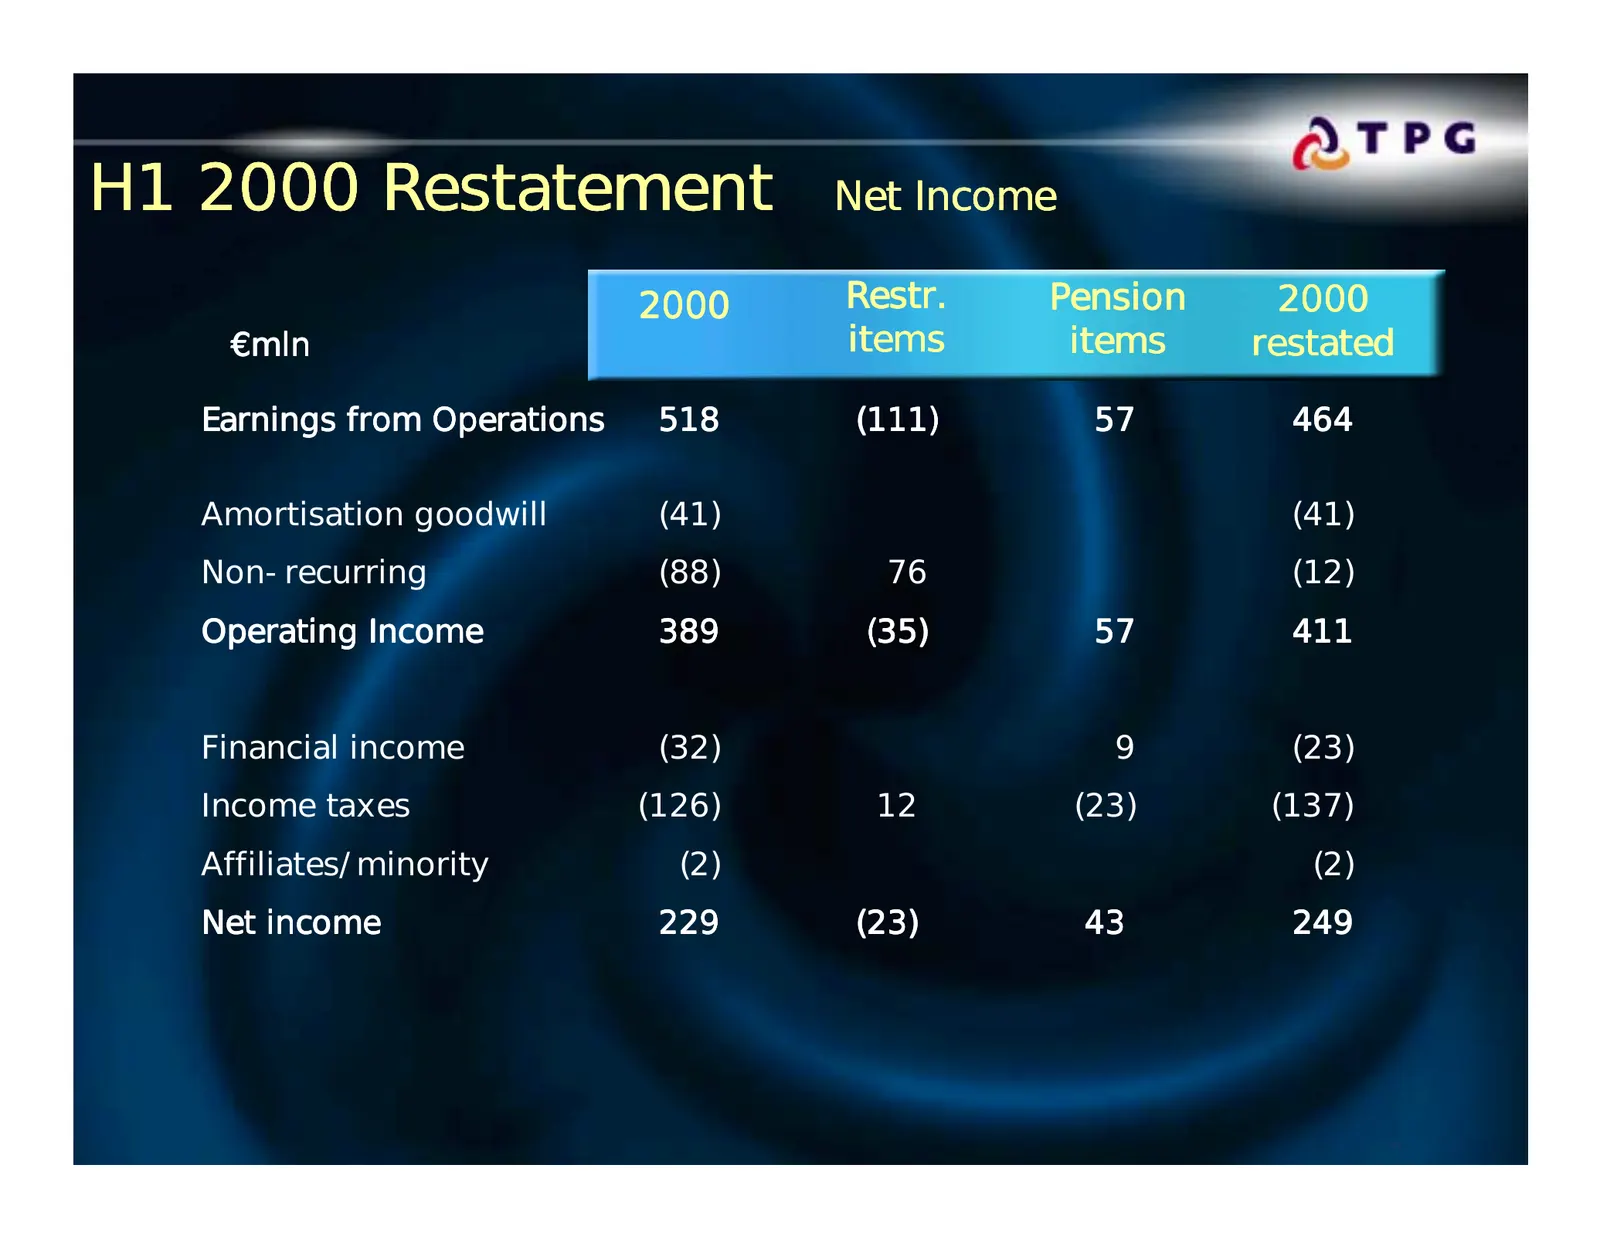
Slide 61: H1 2000 Restatement Net Income
H1 2000 Restatement Net Income 2000 Restr. Pension 2000 €mln items items restated Earnings from Operations 518 (111) 57 464 Amortisation goodwill (41) (41) Non-recurring (88) 76 (12) Operating Income 389 (35) 57 411 Financial income (32) 9 (23) Income taxes (126) 12 (23) (137) Affiliates/minority (2

Slide 62
Source: Internet Archive copy of tpg.com
More decks from TPG Inc.
 Q2 2026 Earnings Presentation44 slides · Aug 4, 2026
 Q1 2026 Earnings Presentation44 slides · May 1, 2026
 Q4 2025 Earnings Presentation45 slides · Feb 5, 2026
 Merger or Acquisition (January 2026)14 slides · Jan 6, 2026
 Q2 2025 Earnings Presentation44 slides · Aug 6, 2025
 Q1 2025 Earnings Presentation44 slides · May 7, 2025