Capita plc · LSE:CPI
Capita — H1 2018 Earnings Presentation
40 slides from Capita's earnings presentation, Aug 1, 2018
Slide 1: Half year results 2018
Capita plc Half year results 2018 1 August 2018
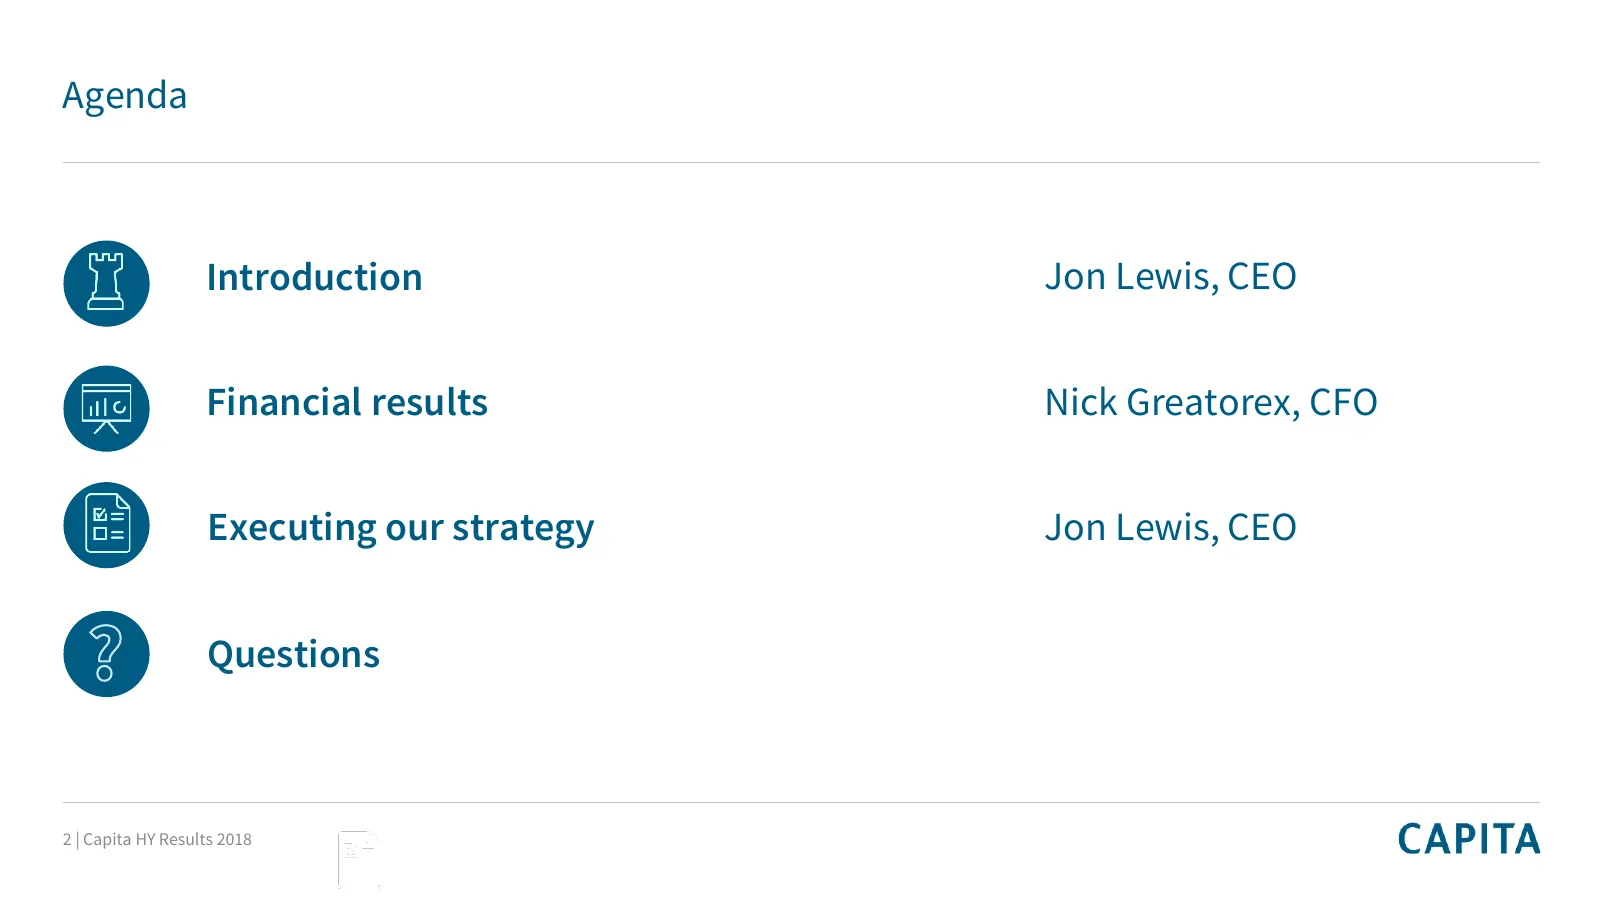
Slide 2: Agenda
Agenda Introduction Jon Lewis, CEO Financial results Nick Greatorex, CFO Executing our strategy Jon Lewis, CEO Questions 2 | Capita HY Results 2018
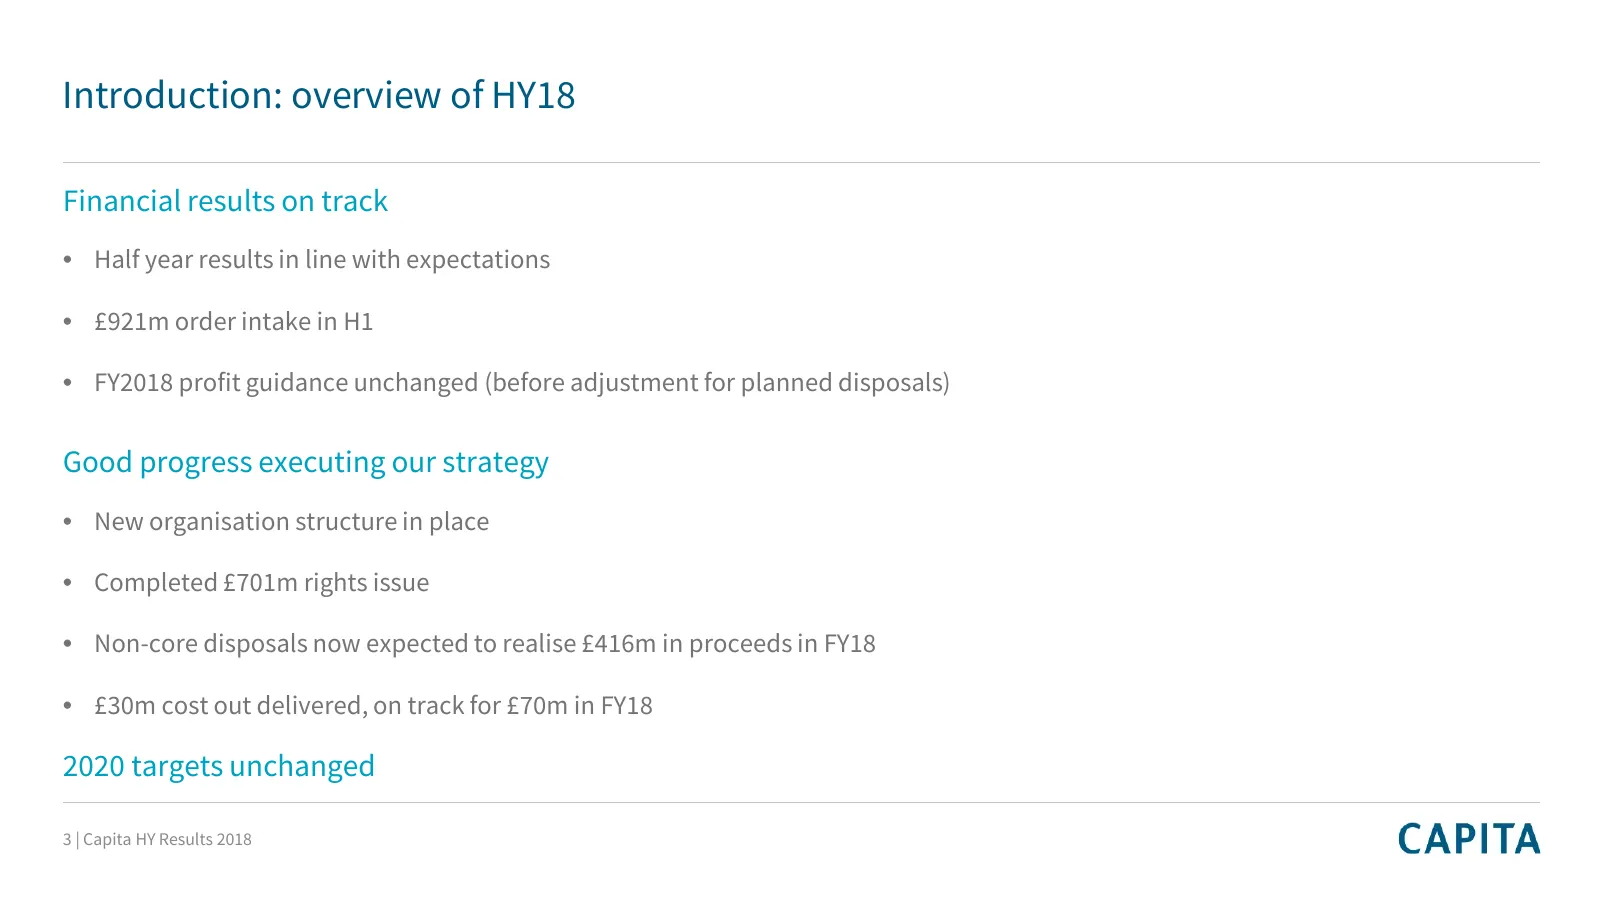
Slide 3: Introduction: overview of HY18
Introduction: overview of HY18 Financial results on track • Half year results in line with expectations • £921m order intake in H1 • FY2018 profit guidance unchanged (before adjustment for planned disposals) Good progress executing our strategy • New organisation structure in place • Completed £701m
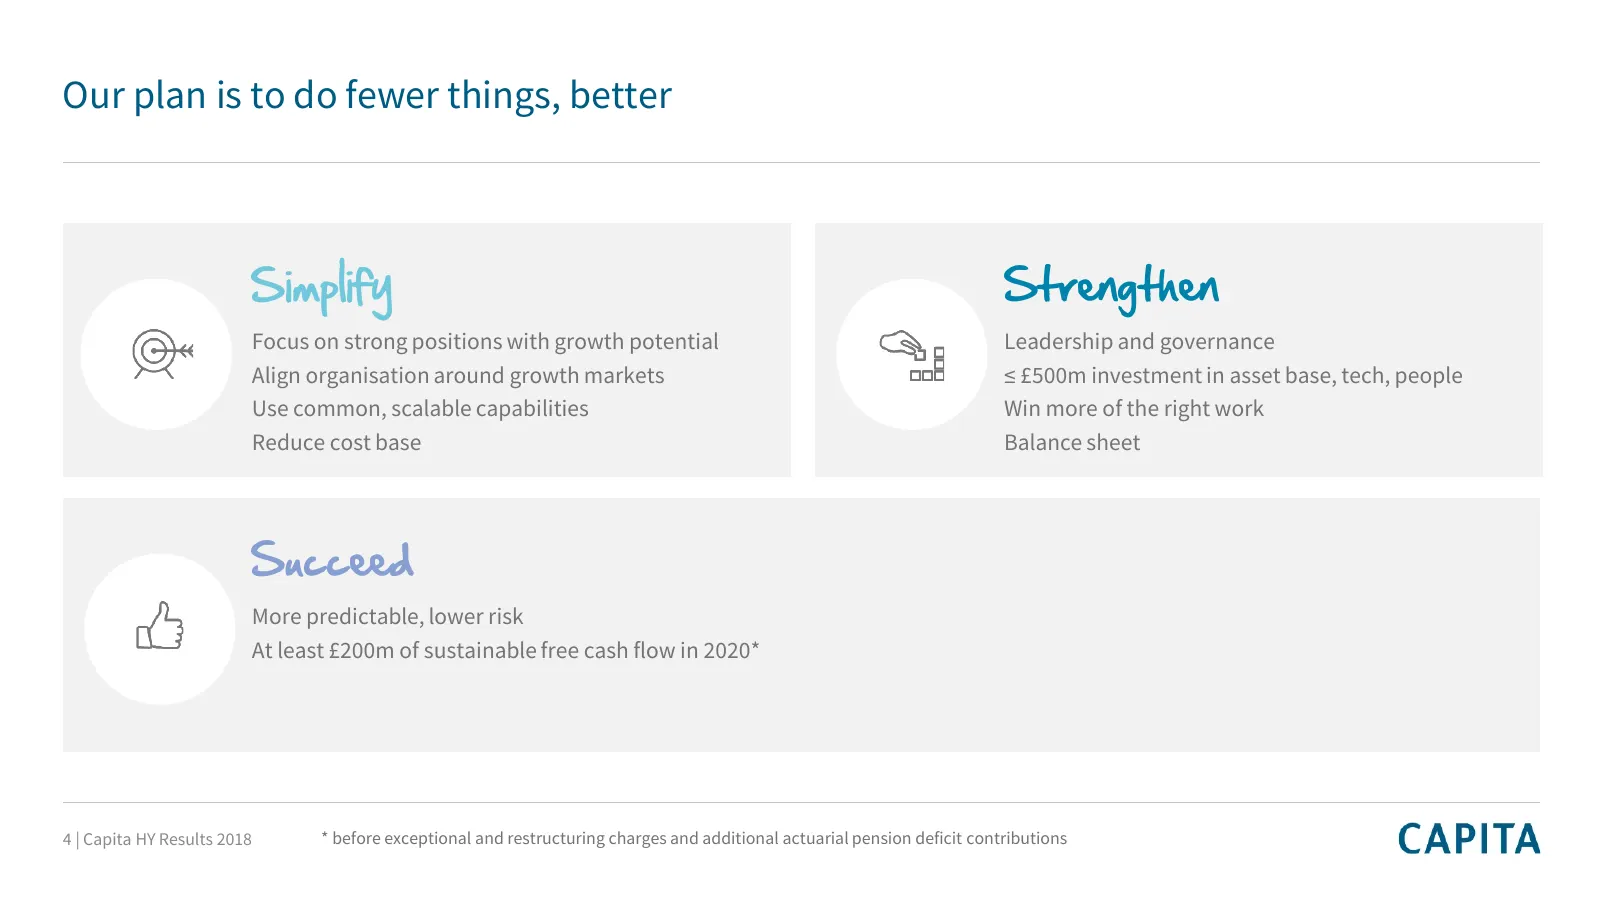
Slide 4: Our plan is to do fewer things, better
Our plan is to do fewer things, better Simplify Strengthen Focus on strong positions with growth potential Leadership and governance Align organisation around growth markets ≤ £500m investment in asset base, tech, people Use common, scalable capabilities Win more of the right work Reduce cost base B
Slide 5: Our plan is to do fewer things, better: progress
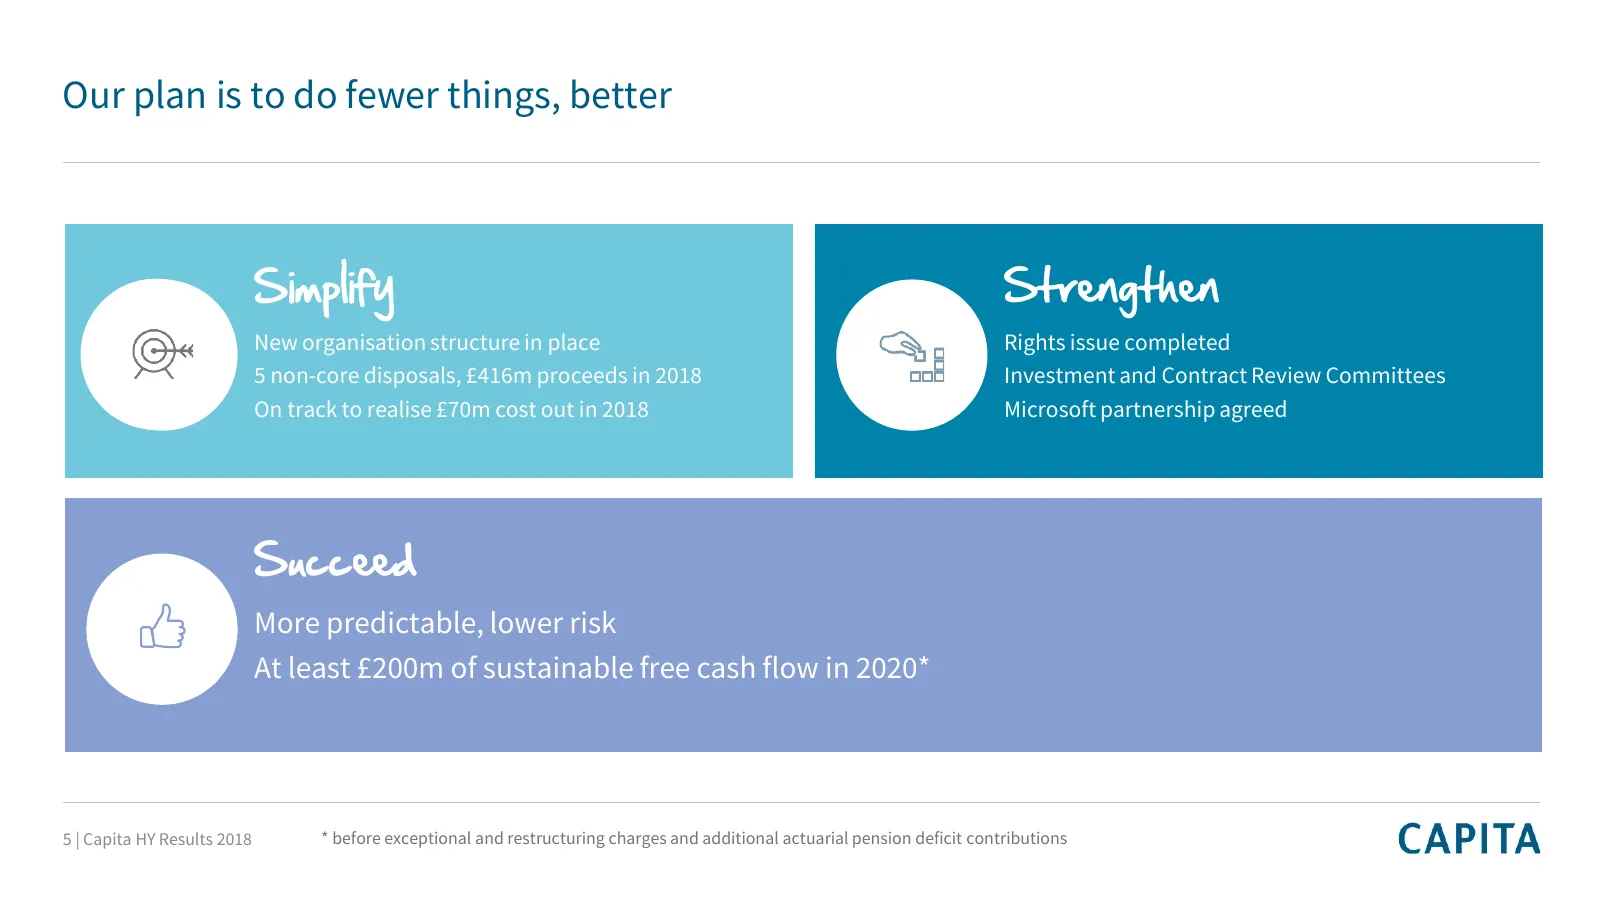
Our plan is to do fewer things, better Simplify Strengthen New organisation structure in place Rights issue completed 5 non-core disposals, £416m proceeds in 2018 Investment and Contract Review Committees On track to realise £70m cost out in 2018 Microsoft partnership agreed Succeed More predictable
Slide 6: Financial results
Financial results Nick Greatorex 6 | Capita HY Results 2018
Slide 7: Financial summary
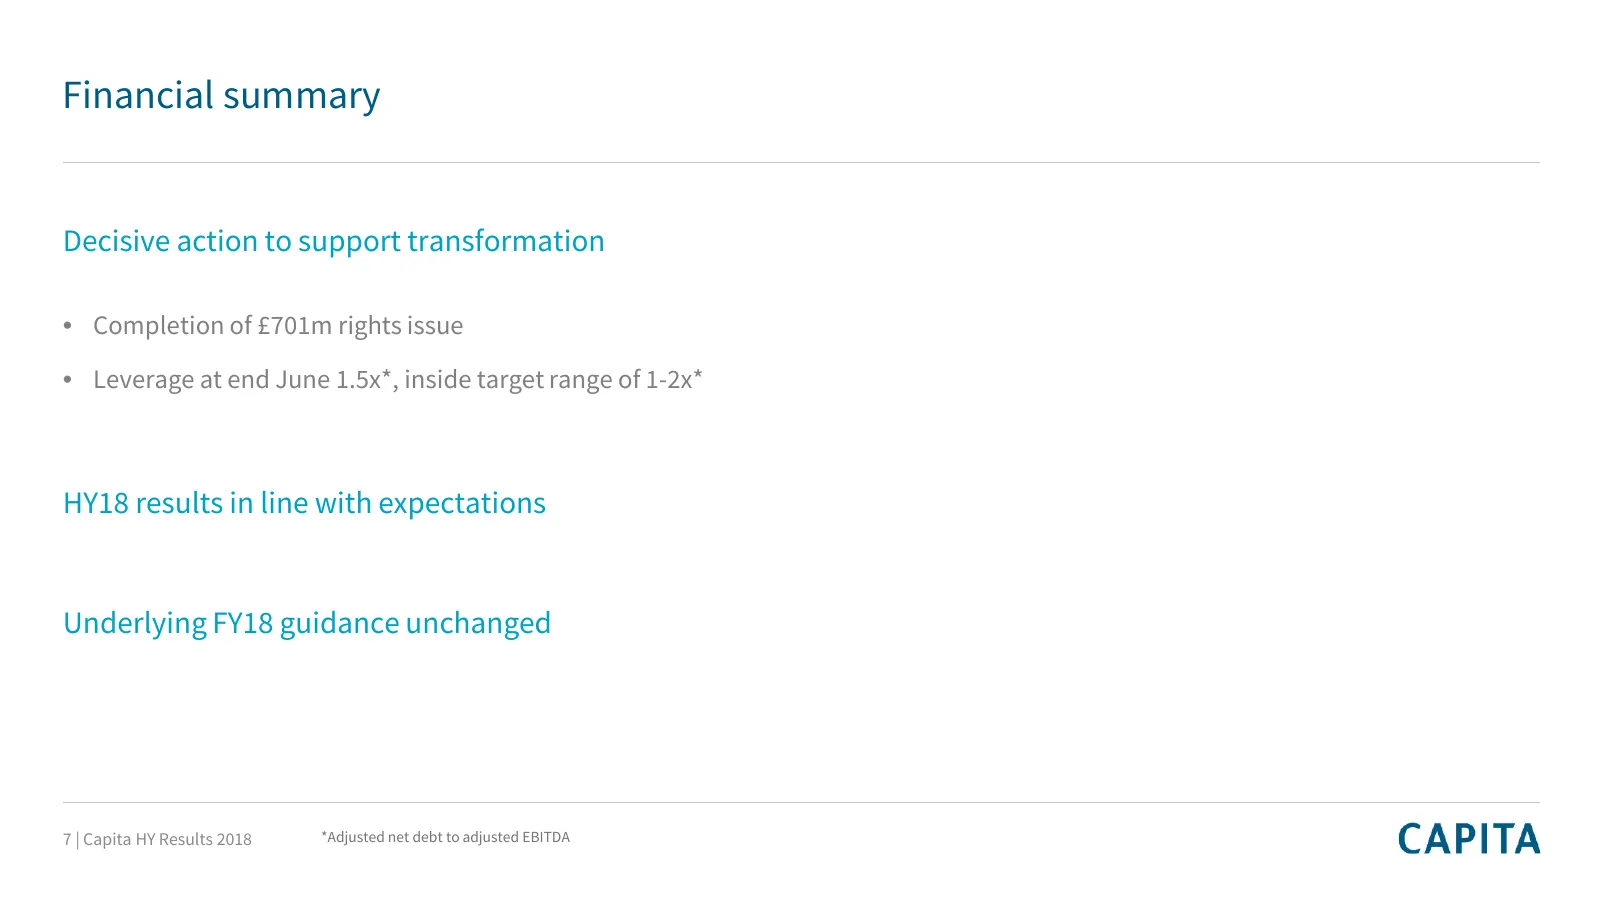
Financial summary Decisive action to support transformation • Completion of £701m rights issue • Leverage at end June 1.5x*, inside target range of 1-2x* HY18 results in line with expectations Underlying FY18 guidance unchanged 7 | Capita HY Results 2018 *Adjusted net debt to adjusted EBITDA
Slide 8: Underlying income statement
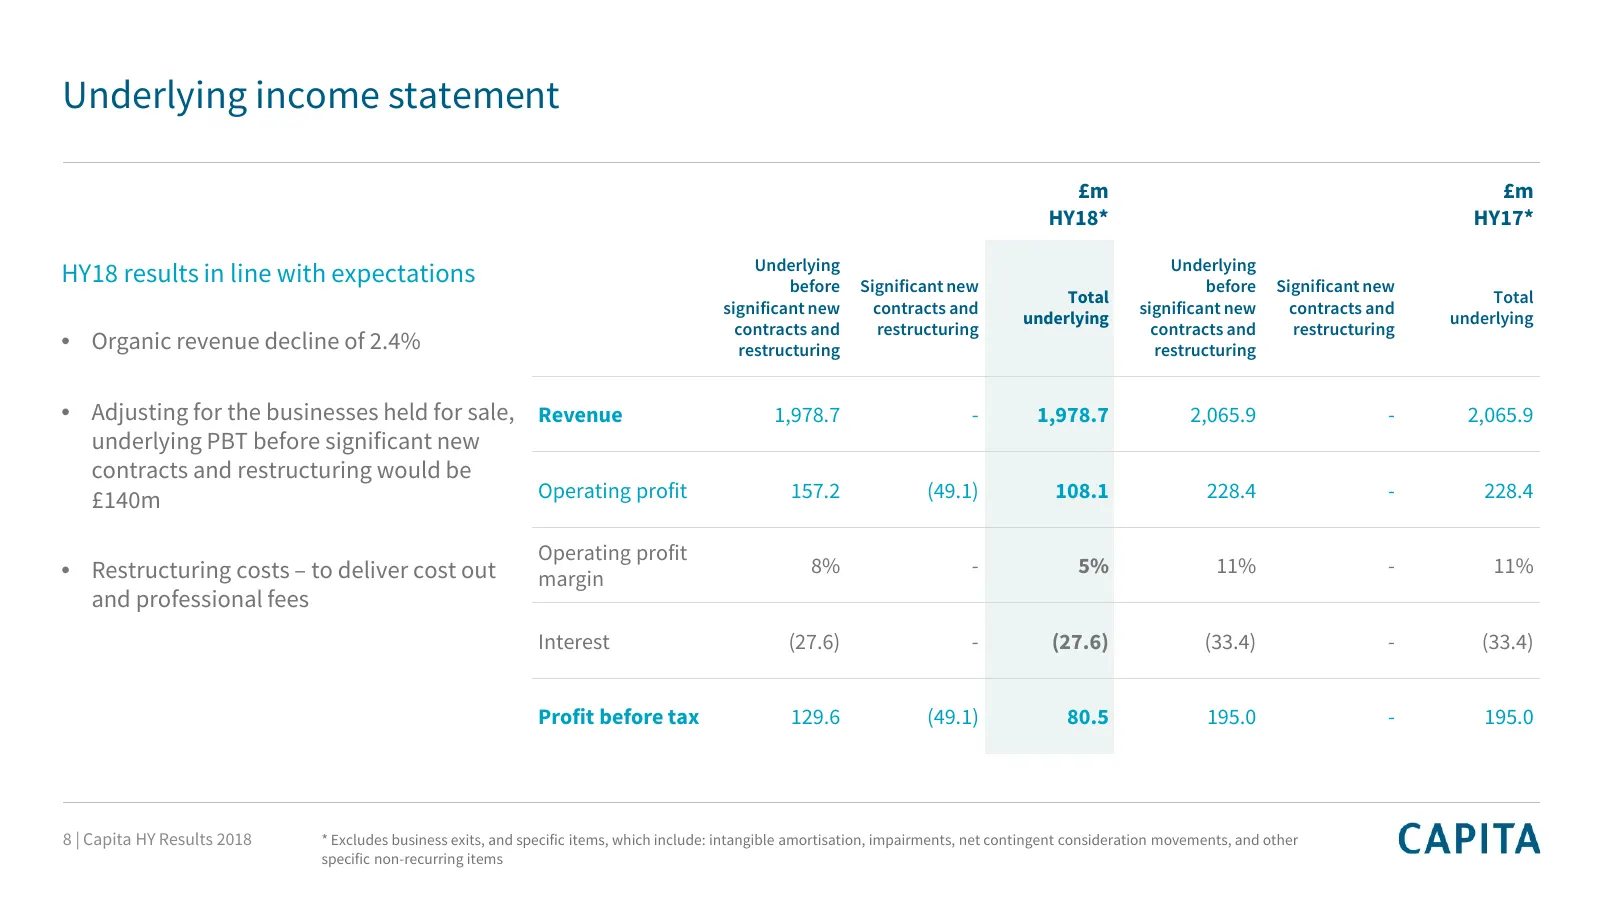
Underlying income statement £m £m HY18* HY17* £m Underlying Underlying HY18 results in line with expectations before Significant new before Significant new Total Total significant new contracts and significant new contracts and underlying underlying contracts and restructuring contracts and restruct
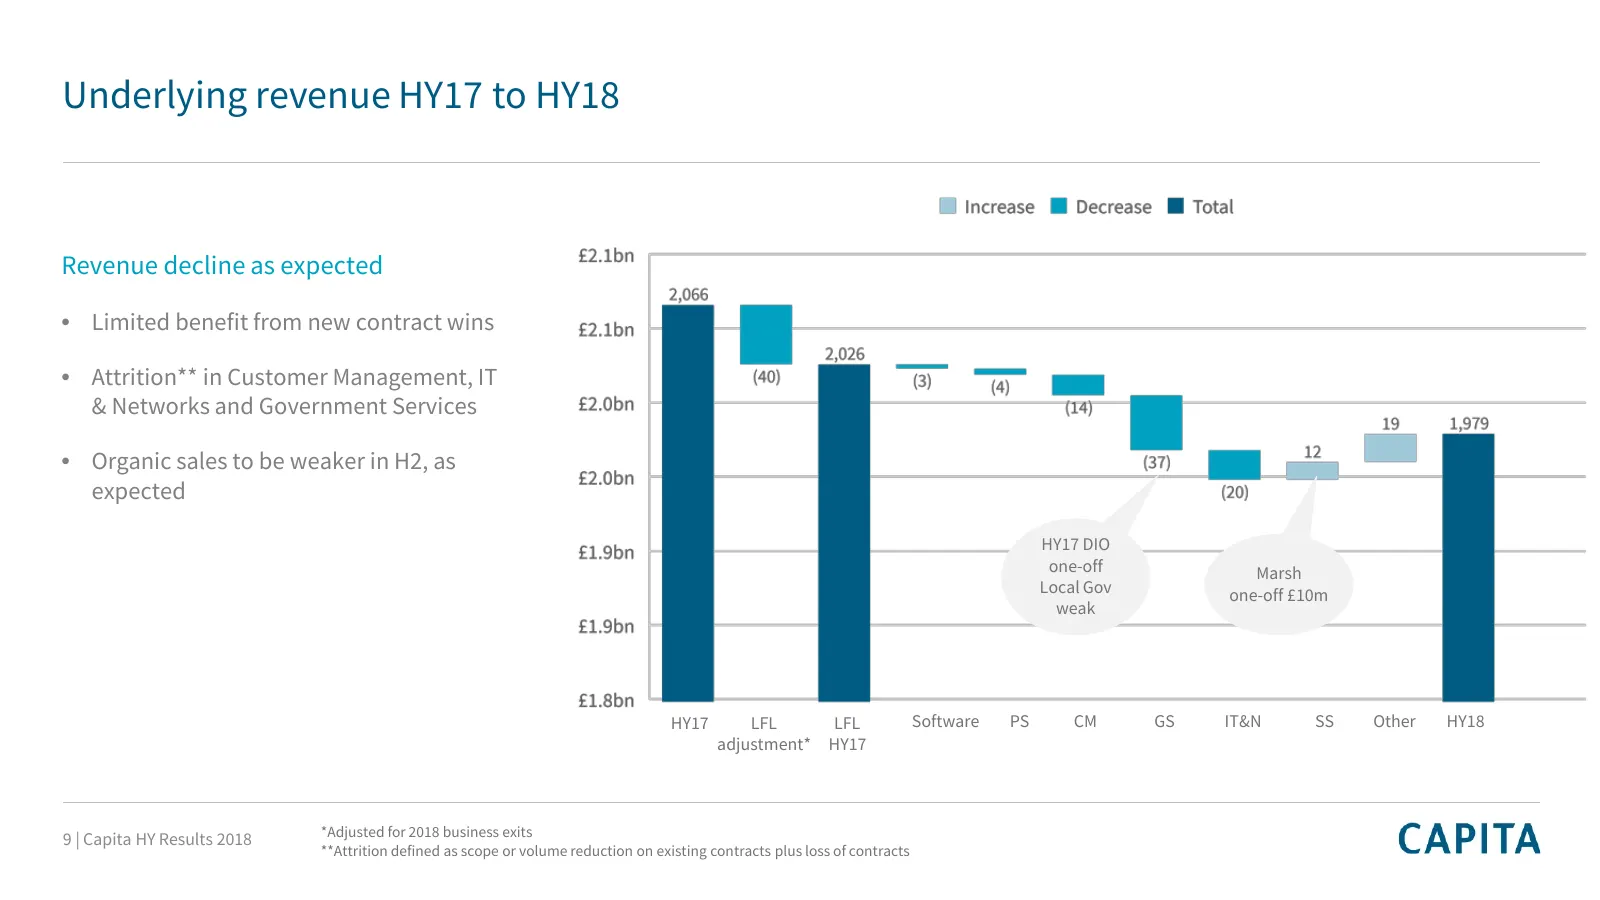
Slide 9: Underlying revenue HY17 to HY18
Underlying revenue HY17 to HY18 Revenue decline as expected • Limited benefit from new contract wins • Attrition** in Customer Management, IT & Networks and Government Services • Organic sales to be weaker in H2, as expected HY17 DIO one-off Marsh Local Gov one-off £10m weak HY17 LFL LFL Software PS
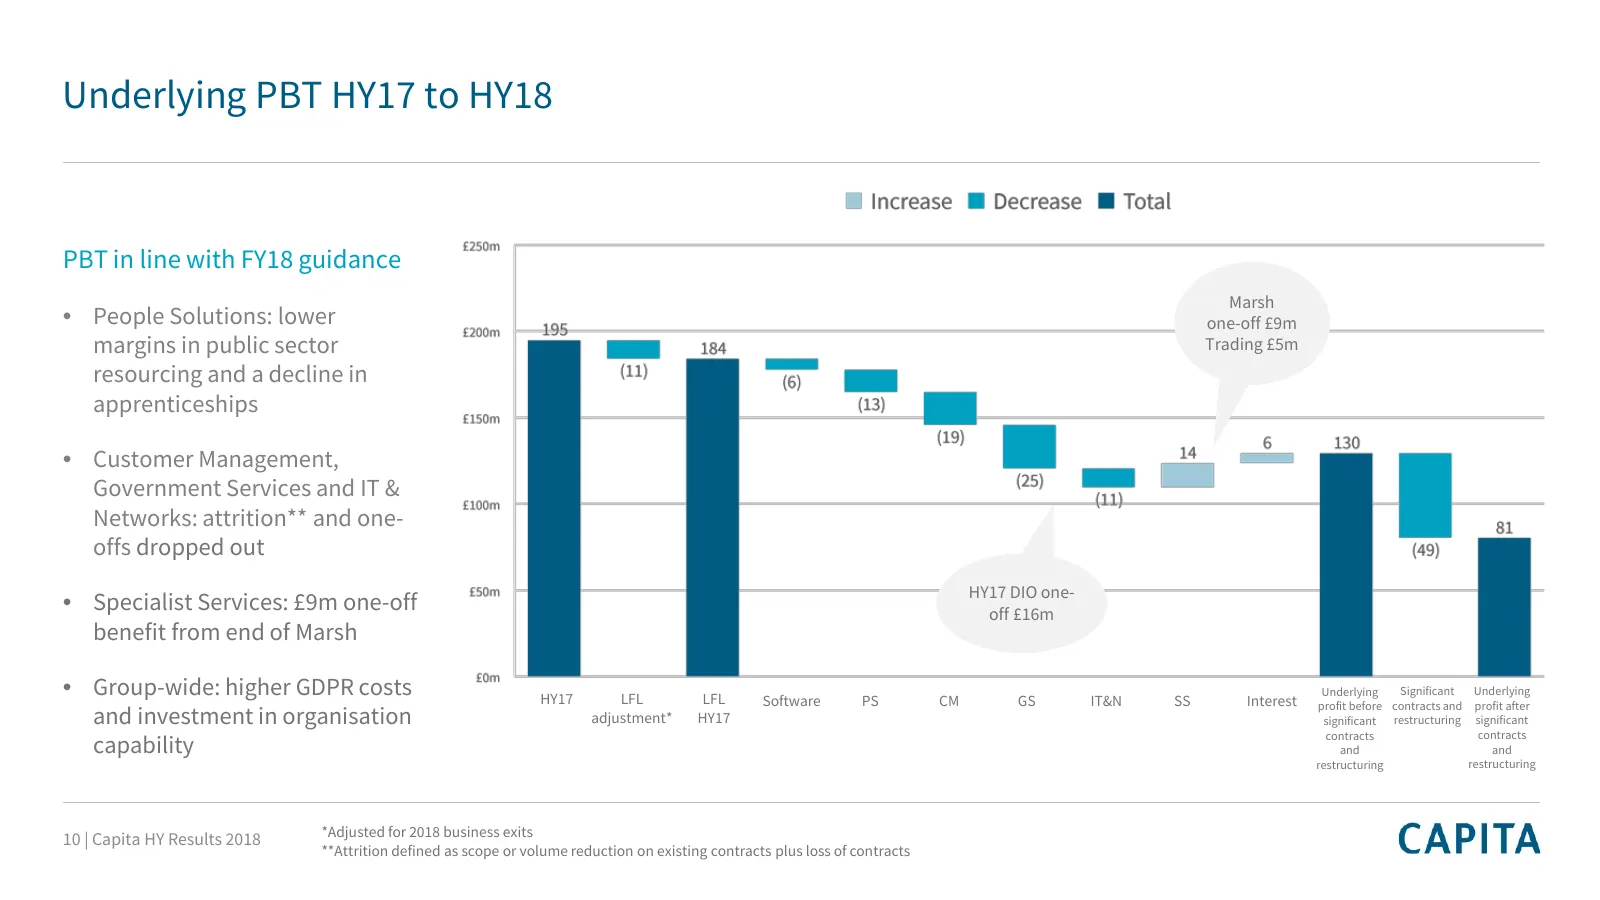
Slide 10: Underlying PBT HY17 to HY18
Underlying PBT HY17 to HY18 PBT in line with FY18 guidance Marsh • People Solutions: lower one-off £9m margins in public sector Trading £5m resourcing and a decline in apprenticeships • Customer Management, Government Services and IT & Networks: attrition** and one- offs dropped out HY17 DIO one- •
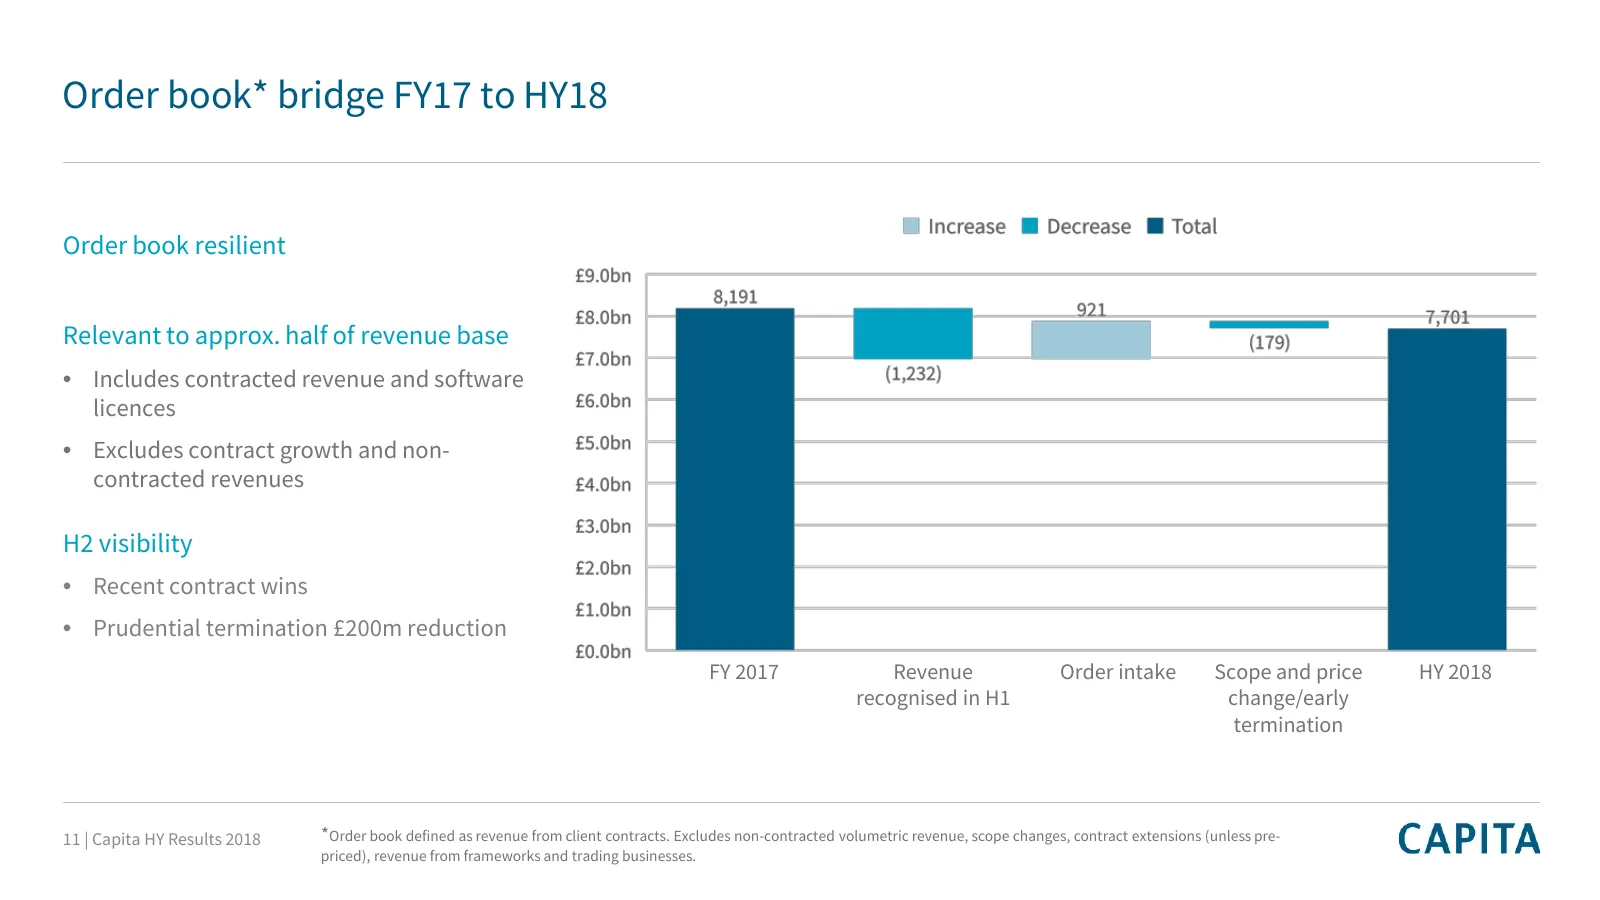
Slide 11: Order book bridge FY17 to HY18
Order book* bridge FY17 to HY18 Order book resilient Relevant to approx. half of revenue base • Includes contracted revenue and software licences • Excludes contract growth and non- contracted revenues H2 visibility • Recent contract wins • Prudential termination £200m reduction FY 2017 Revenue Orde
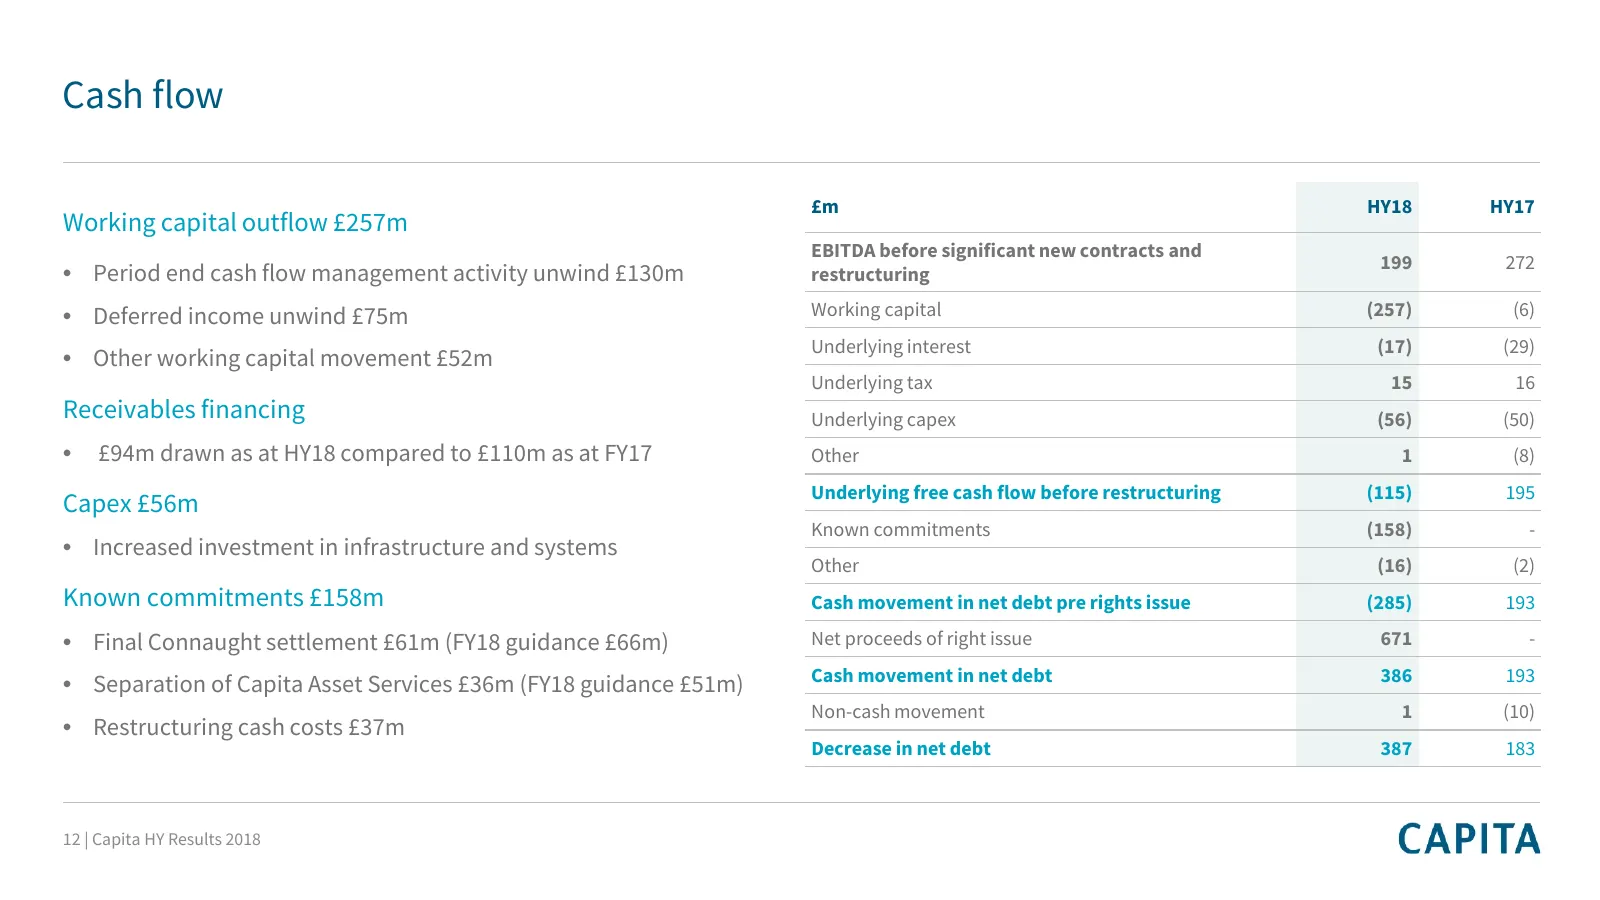
Slide 12: Cash flow
Cash flow £m HY18 HY17 Working capital outflow £257m EBITDA before significant new contracts and 199 272 • Period end cash flow management activity unwind £130m restructuring • Deferred income unwind £75m Working capital (257) (6) Underlying interest (17) (29) • Other working capital movement £52m U
Slide 13: Update on pension
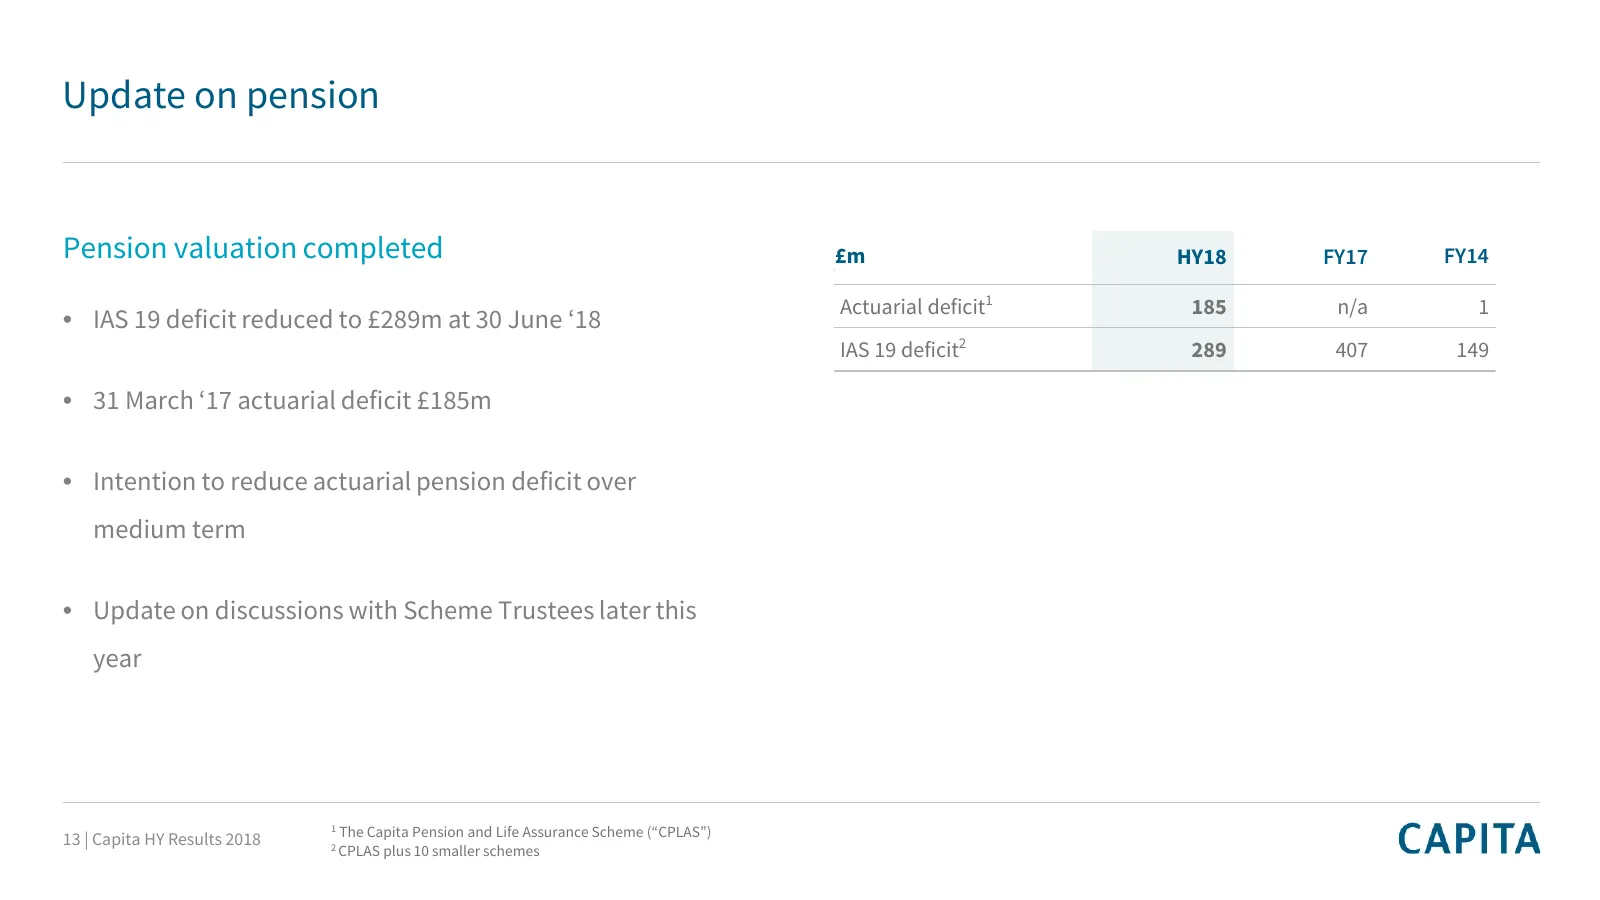
Update on pension Pension valuation completed £m $ 2 HY18 FY17 FY14 Actuarial deficit1 185 n/a 1 • IAS 19 deficit reduced to £289m at 30 June ‘18 IAS 19 deficit2 289 407 149 • 31 March ‘17 actuarial deficit £185m • Intention to reduce actuarial pension deficit over medium term • Update on discussion
Slide 14: FY18 financial guidance
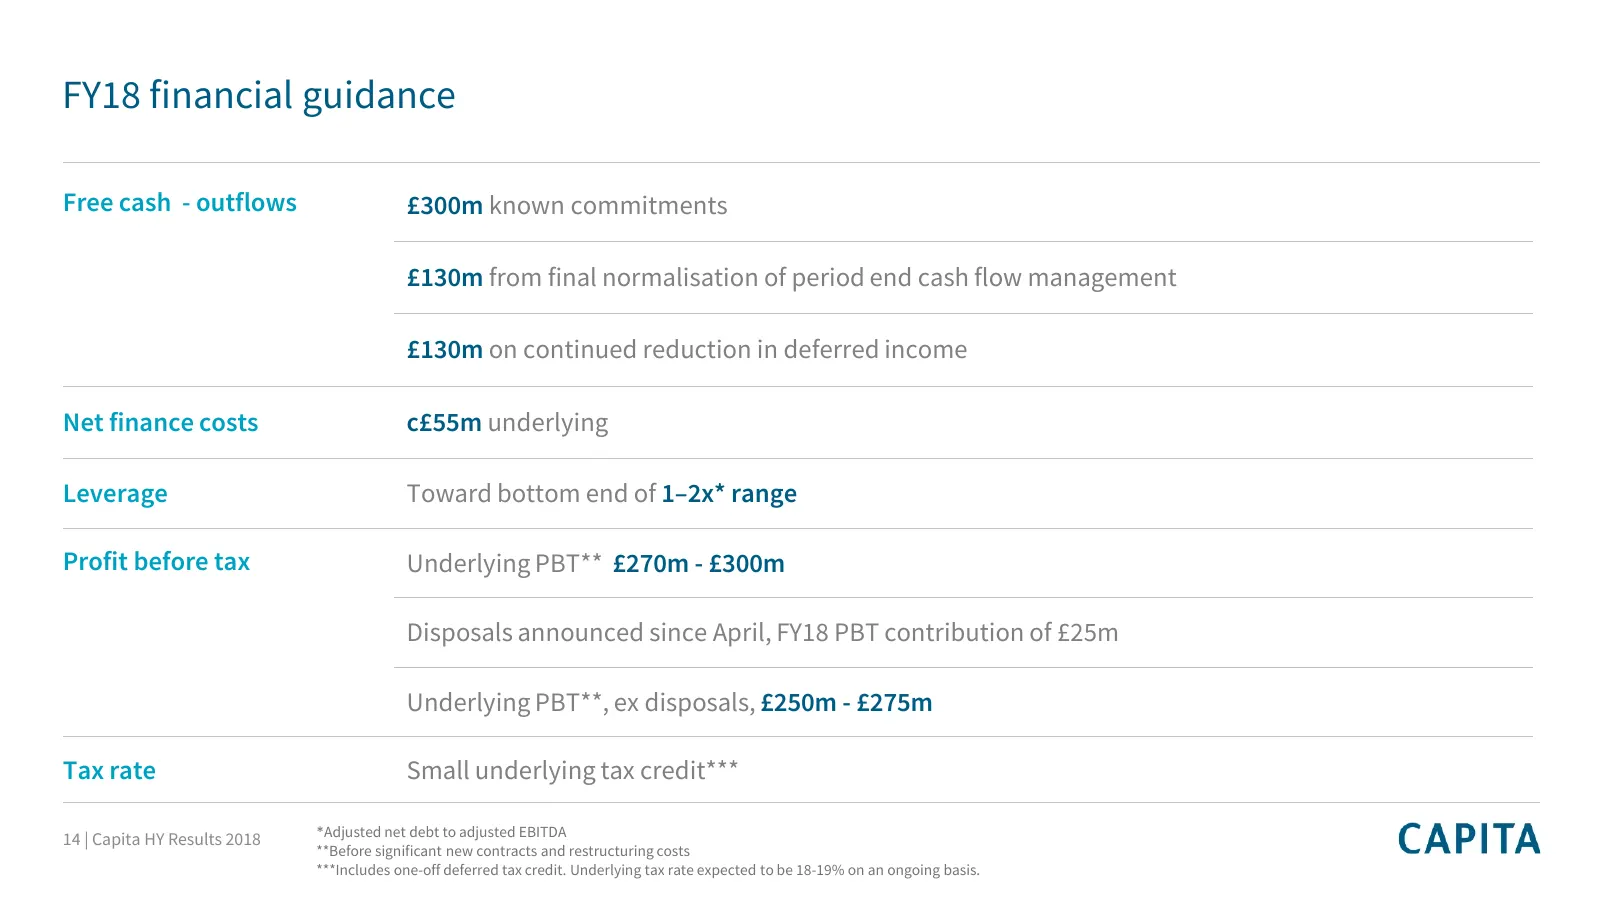
FY18 financial guidance Free cash - outflows £300m known commitments £130m from final normalisation of period end cash flow management £130m on continued reduction in deferred income Net finance costs c£55m underlying Leverage Toward bottom end of 1–2x* range Profit before tax Underlying PBT** £270m
Slide 15: Executing our strategy
Executing our strategy Jon Lewis 15 | Capita HY Results 2018
Slide 16: Succeed: transformation led by things that we control
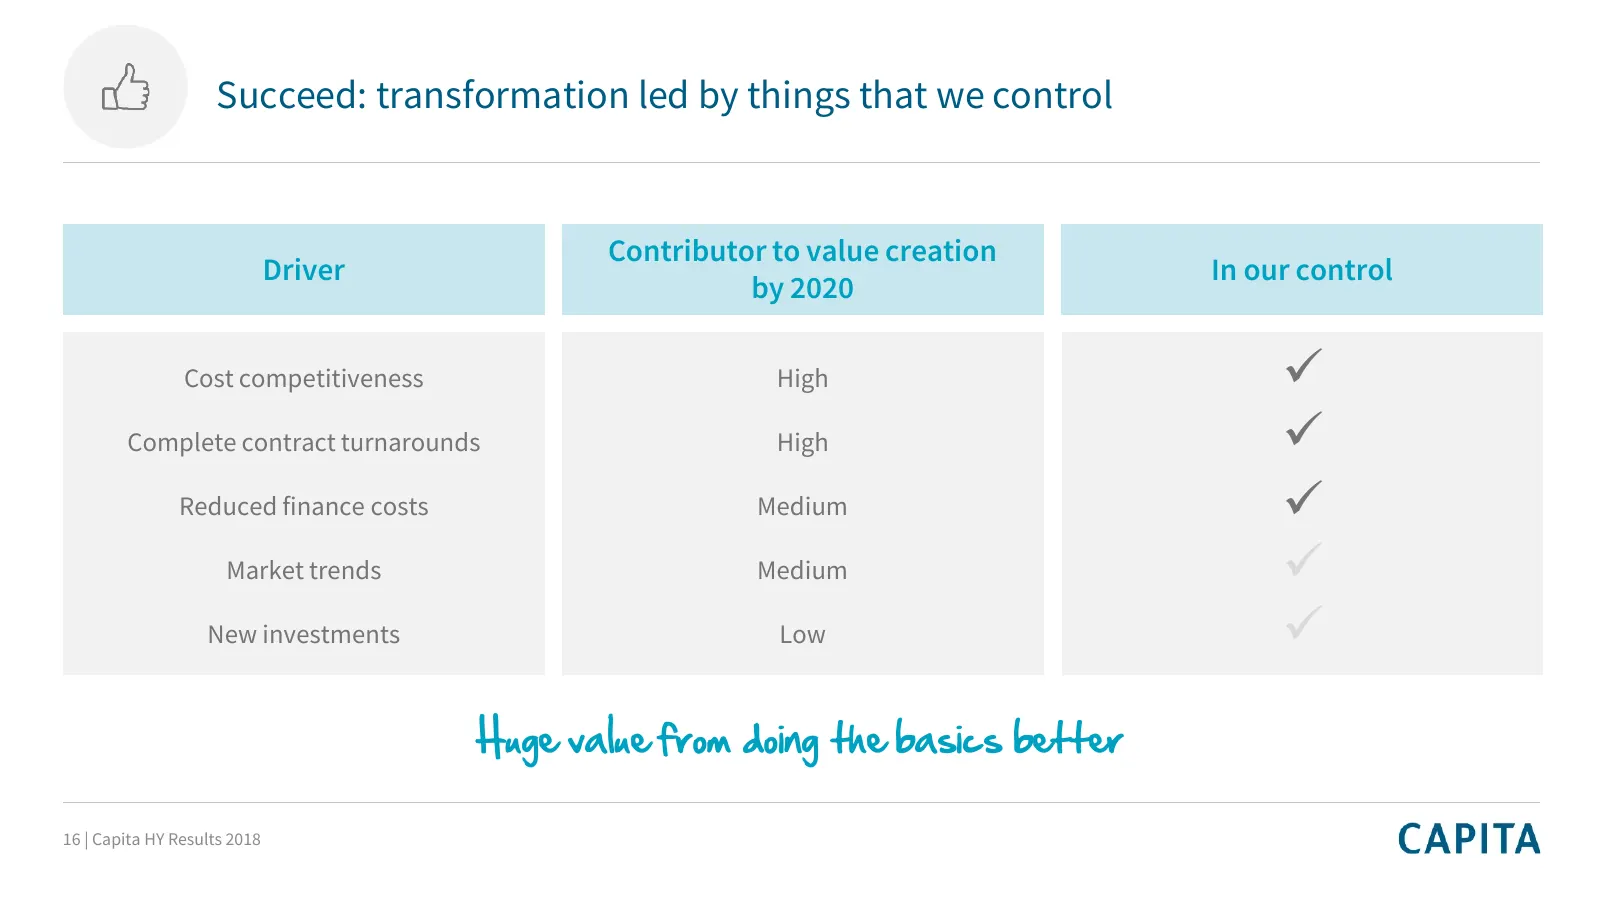
Succeed: transformation led by things that we control Contributor to value creation Driver In our control by 2020 Cost competitiveness High Complete contract turnarounds High Reduced finance costs Medium Market trends Medium New investments Low Huge value from doing the basics better 16 |
Slide 17: Simplify: delivering our cost competitiveness programme
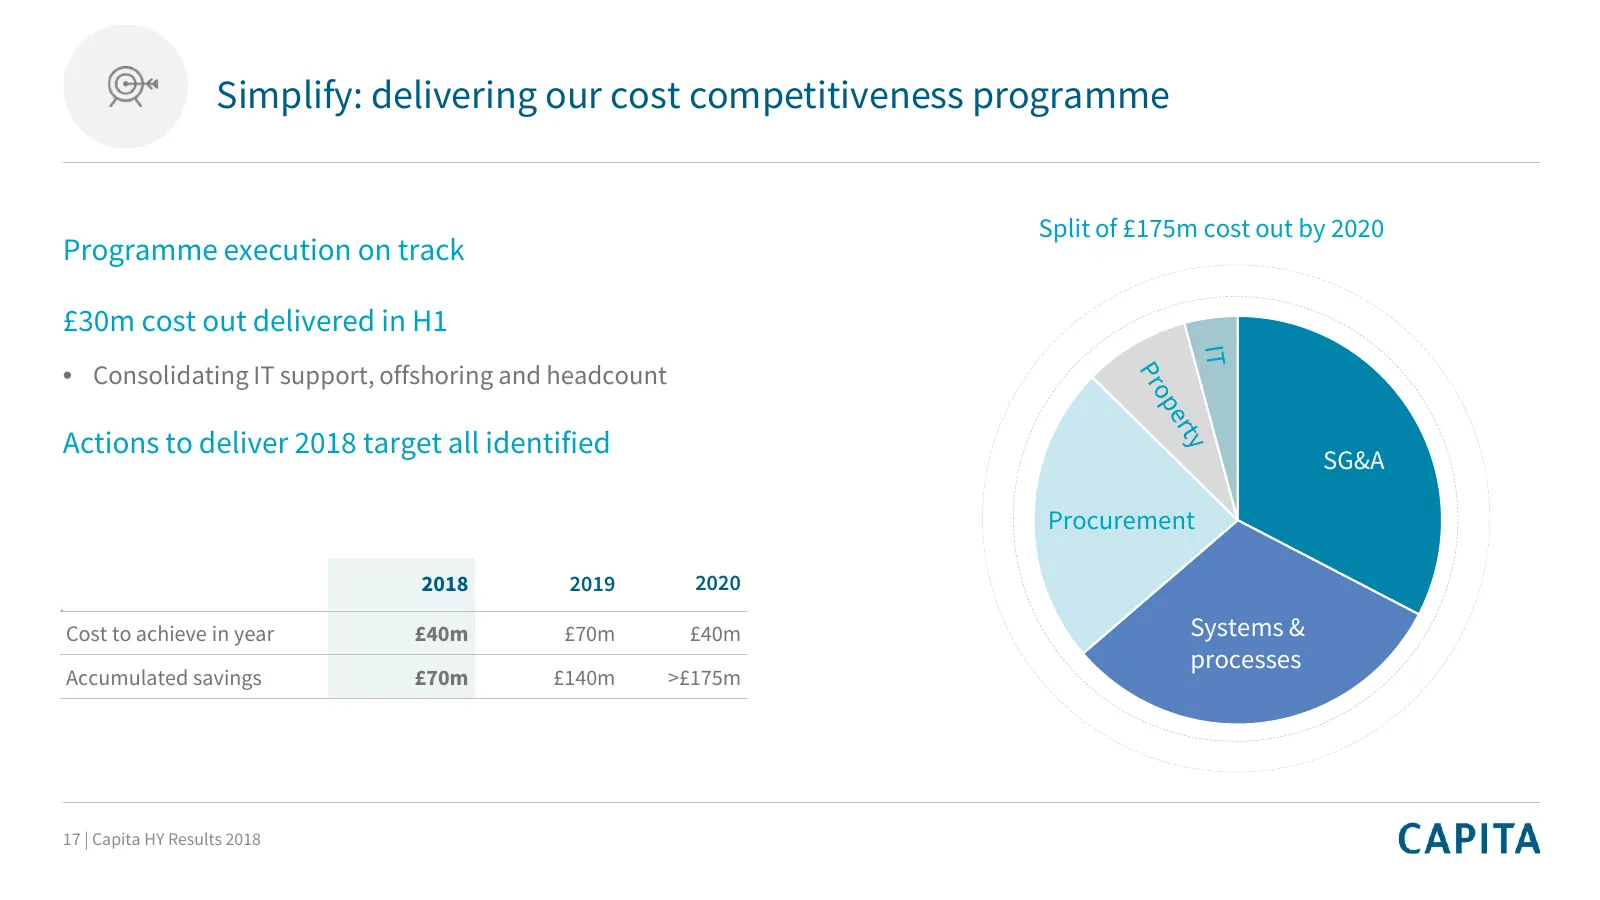
Simplify: delivering our cost competitiveness programme Split of £175m cost out by 2020 Programme execution on track £30m cost out delivered in H1 • Consolidating IT support, offshoring and headcount Actions to deliver 2018 target all identified SG&A Procurement 2018 2019 2020 $32 Cost to achieve in
Slide 18: Strengthen: improving poorly performing contracts
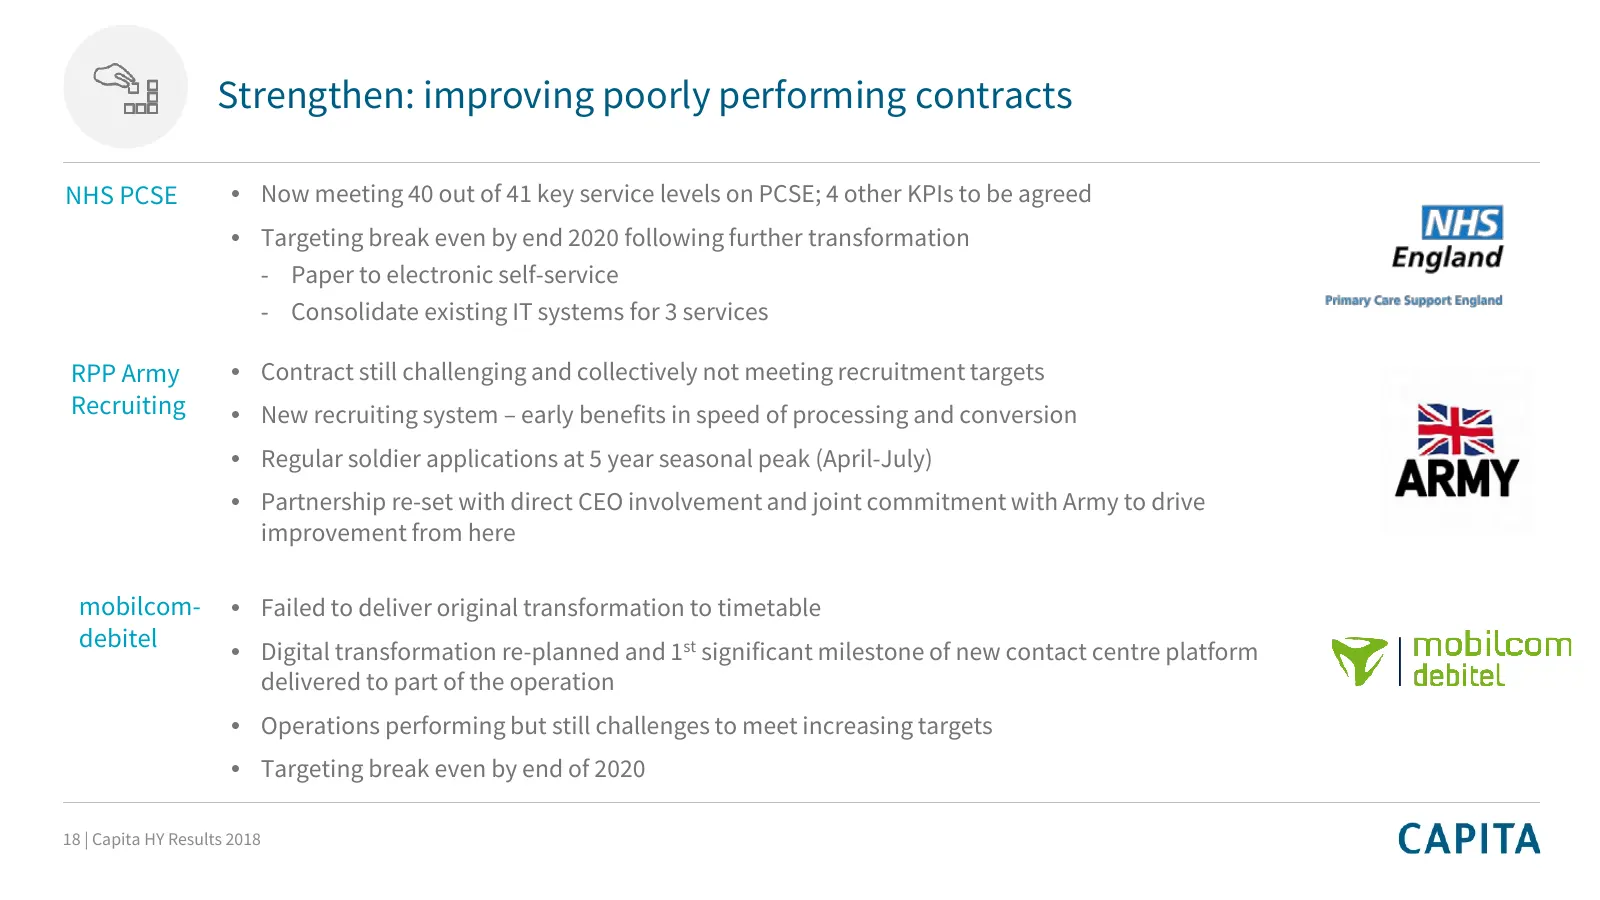
Strengthen: improving poorly performing contracts NHS PCSE • Now meeting 40 out of 41 key service levels on PCSE; 4 other KPIs to be agreed • Targeting break even by end 2020 following further transformation - Paper to electronic self-service - Consolidate existing IT systems for 3 services RPP Army
Slide 19: Strengthen: significant progress de-leveraging the balance sheet
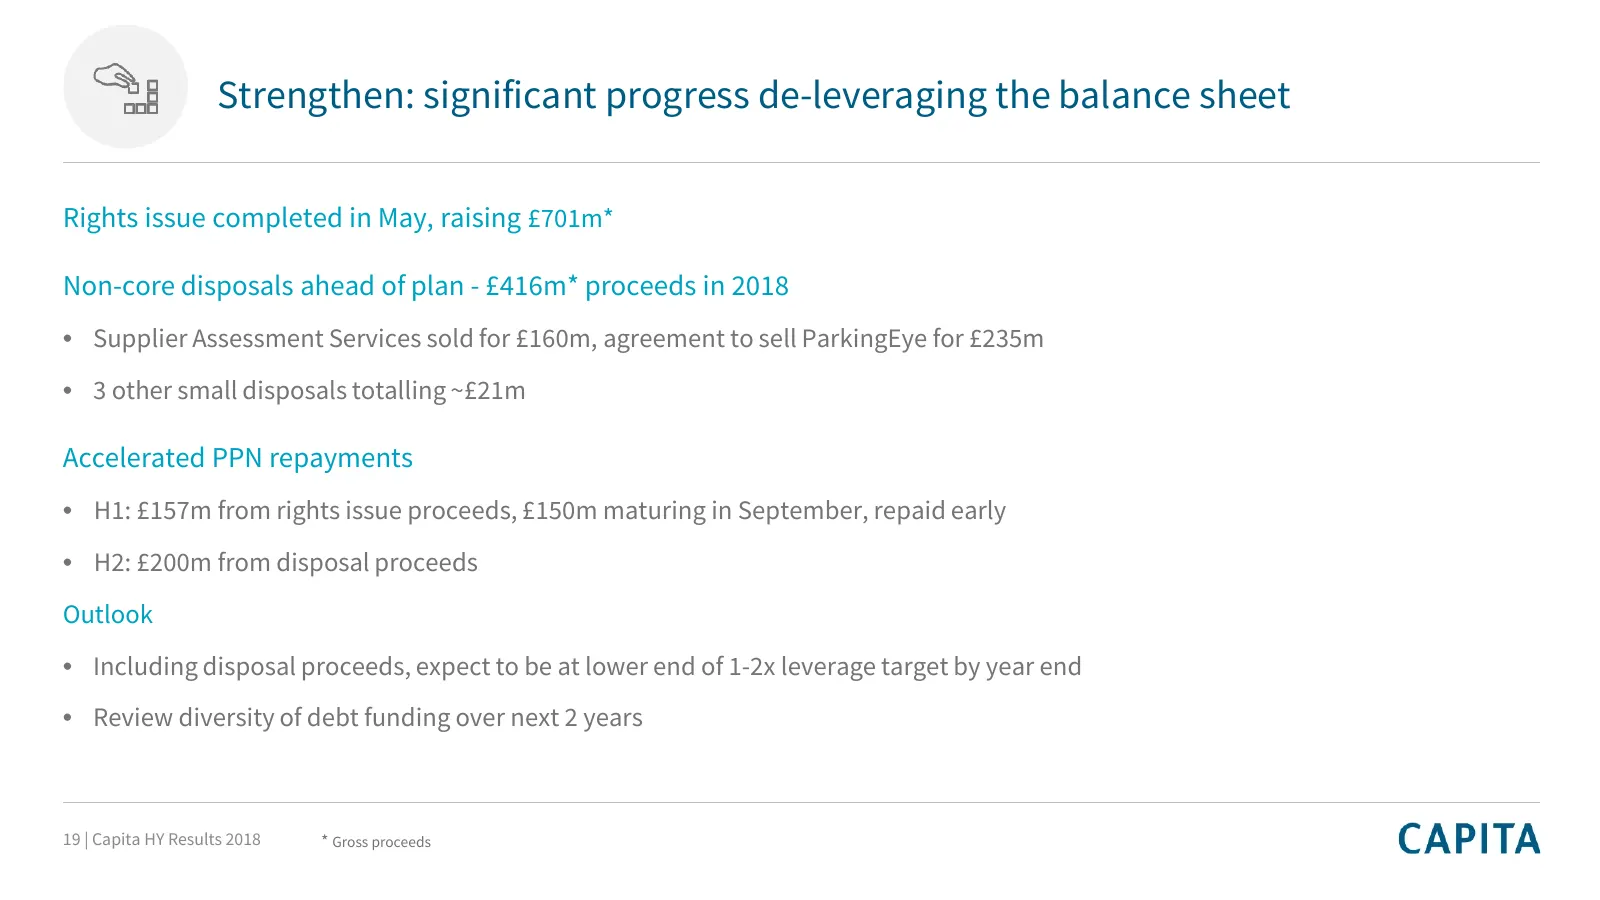
Strengthen: significant progress de-leveraging the balance sheet Rights issue completed in May, raising £701m* Non-core disposals ahead of plan - £416m* proceeds in 2018 • Supplier Assessment Services sold for £160m, agreement to sell ParkingEye for £235m • 3 other small disposals totalling ~£21m Ac
Slide 20: Strengthen: investing up to £500m over the next 3 years
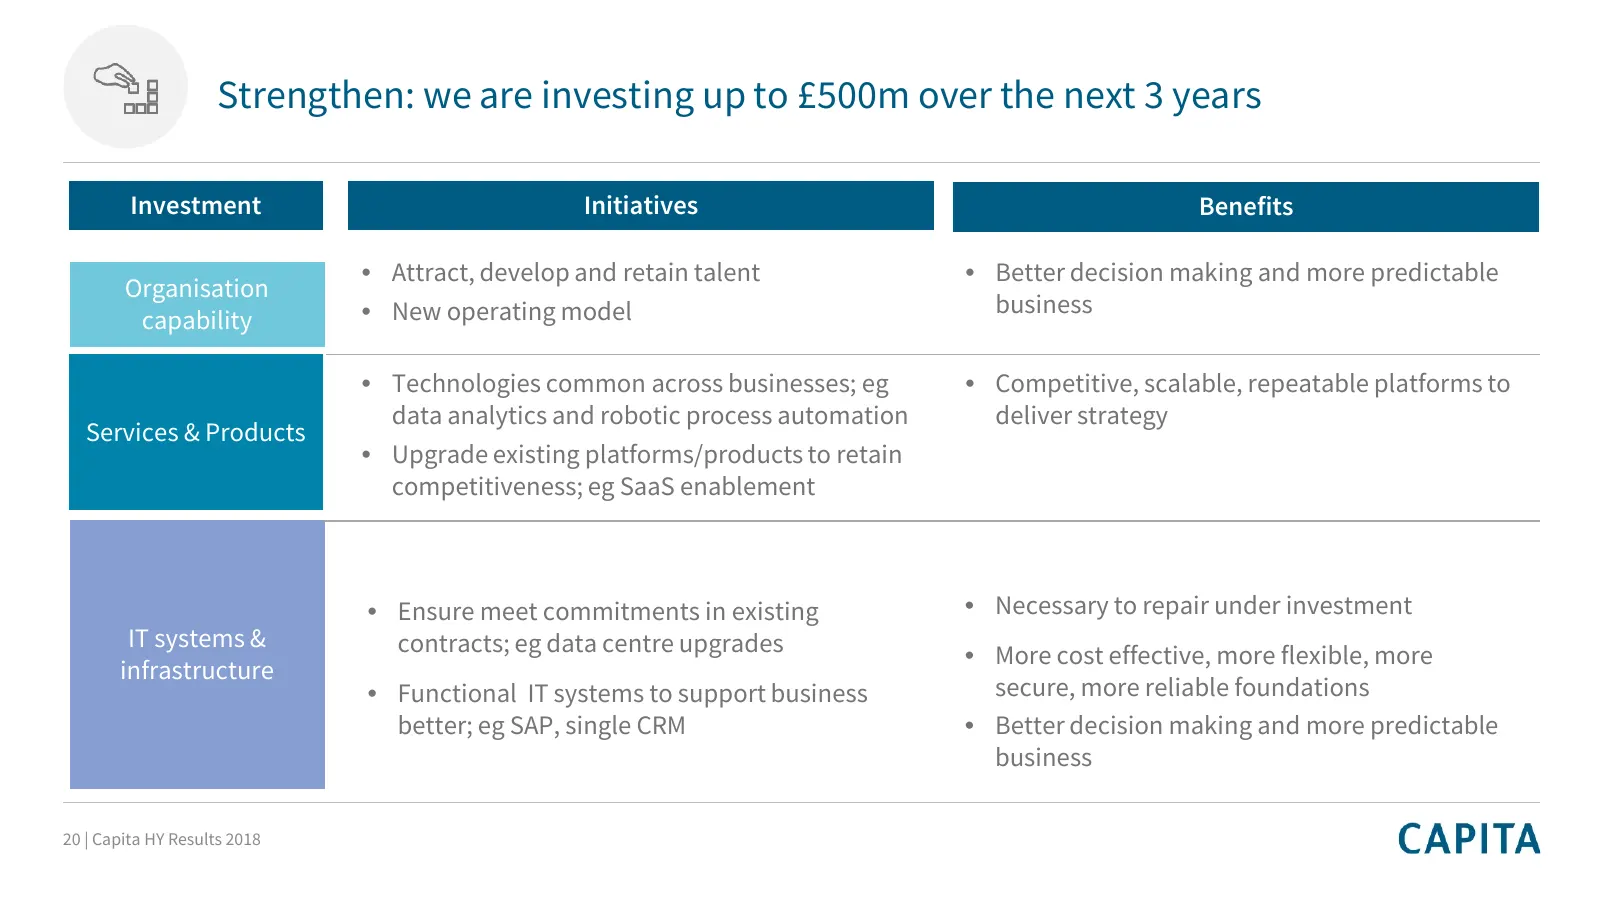
Strengthen: we are investing up to £500m over the next 3 years Investment Initiatives Benefits • Attract, develop and retain talent • Better decision making and more predictable Organisation • New operating model business capability • Technologies common across businesses; eg • Competitive, scalable
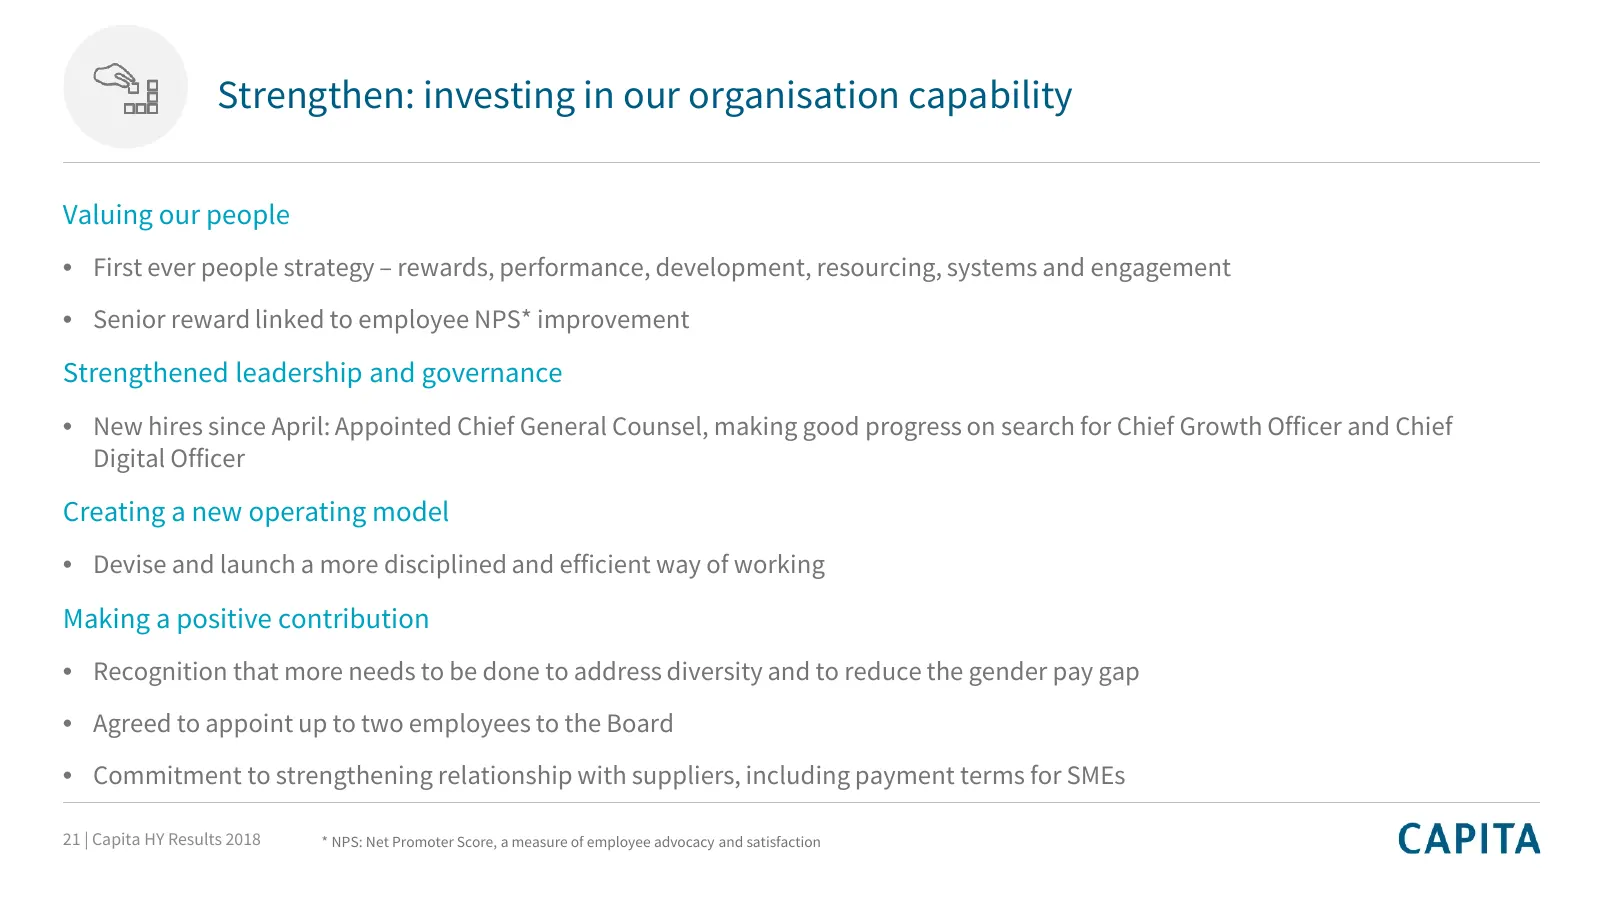
Slide 21: Strengthen: investing in our organisation capability
Strengthen: investing in our organisation capability Valuing our people • First ever people strategy – rewards, performance, development, resourcing, systems and engagement • Senior reward linked to employee NPS* improvement Strengthened leadership and governance • New hires since April: Appointed C
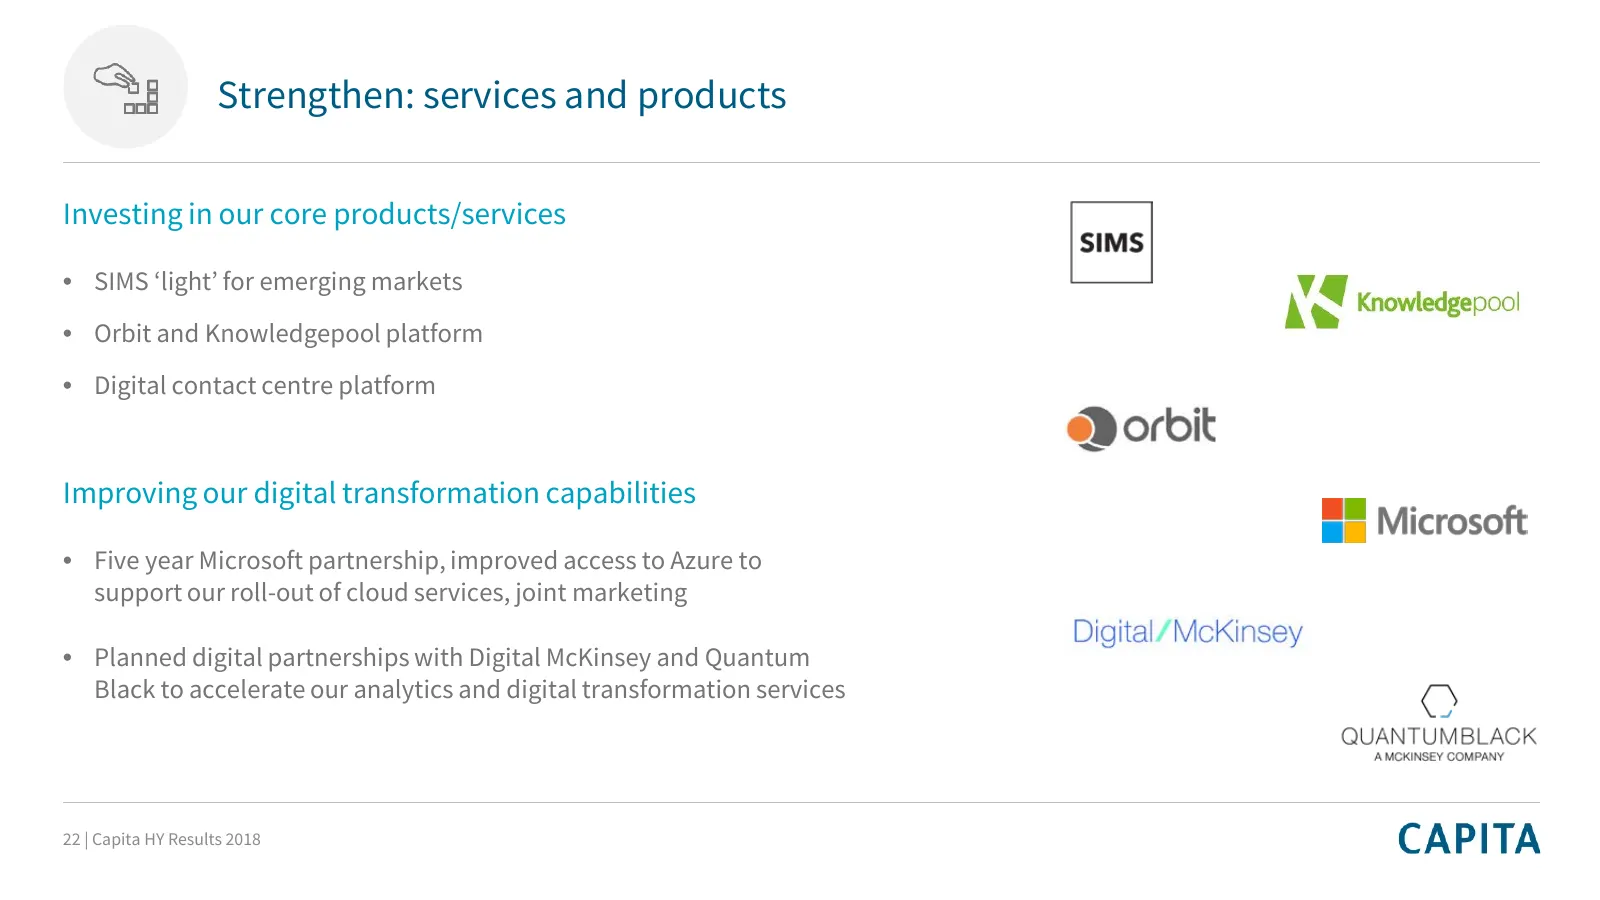
Slide 22: Strengthen: services and products
Strengthen: services and products Investing in our core products/services • SIMS ‘light’ for emerging markets • Orbit and Knowledgepool platform • Digital contact centre platform Improving our digital transformation capabilities • Five year Microsoft partnership, improved access to Azure to support
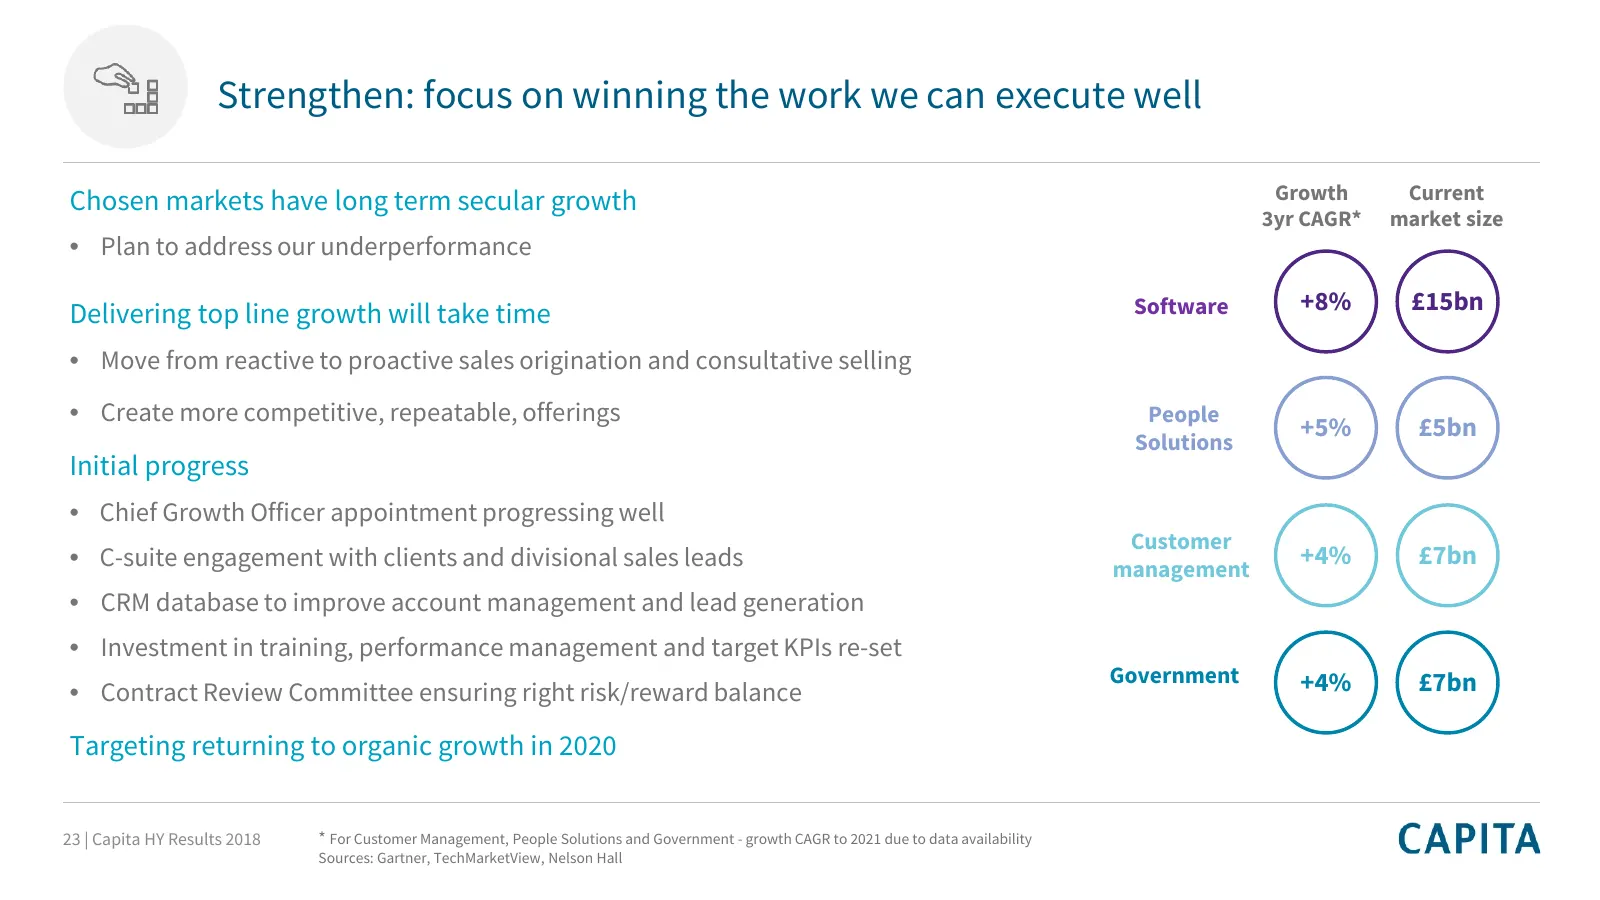
Slide 23: Strengthen: focus on winning the work we can execute well
Strengthen: focus on winning the work we can execute well Chosen markets have long term secular growth Growth Current 3yr CAGR* market size • Plan to address our underperformance Delivering top line growth will take time Software +8% £15bn • Move from reactive to proactive sales origination and cons
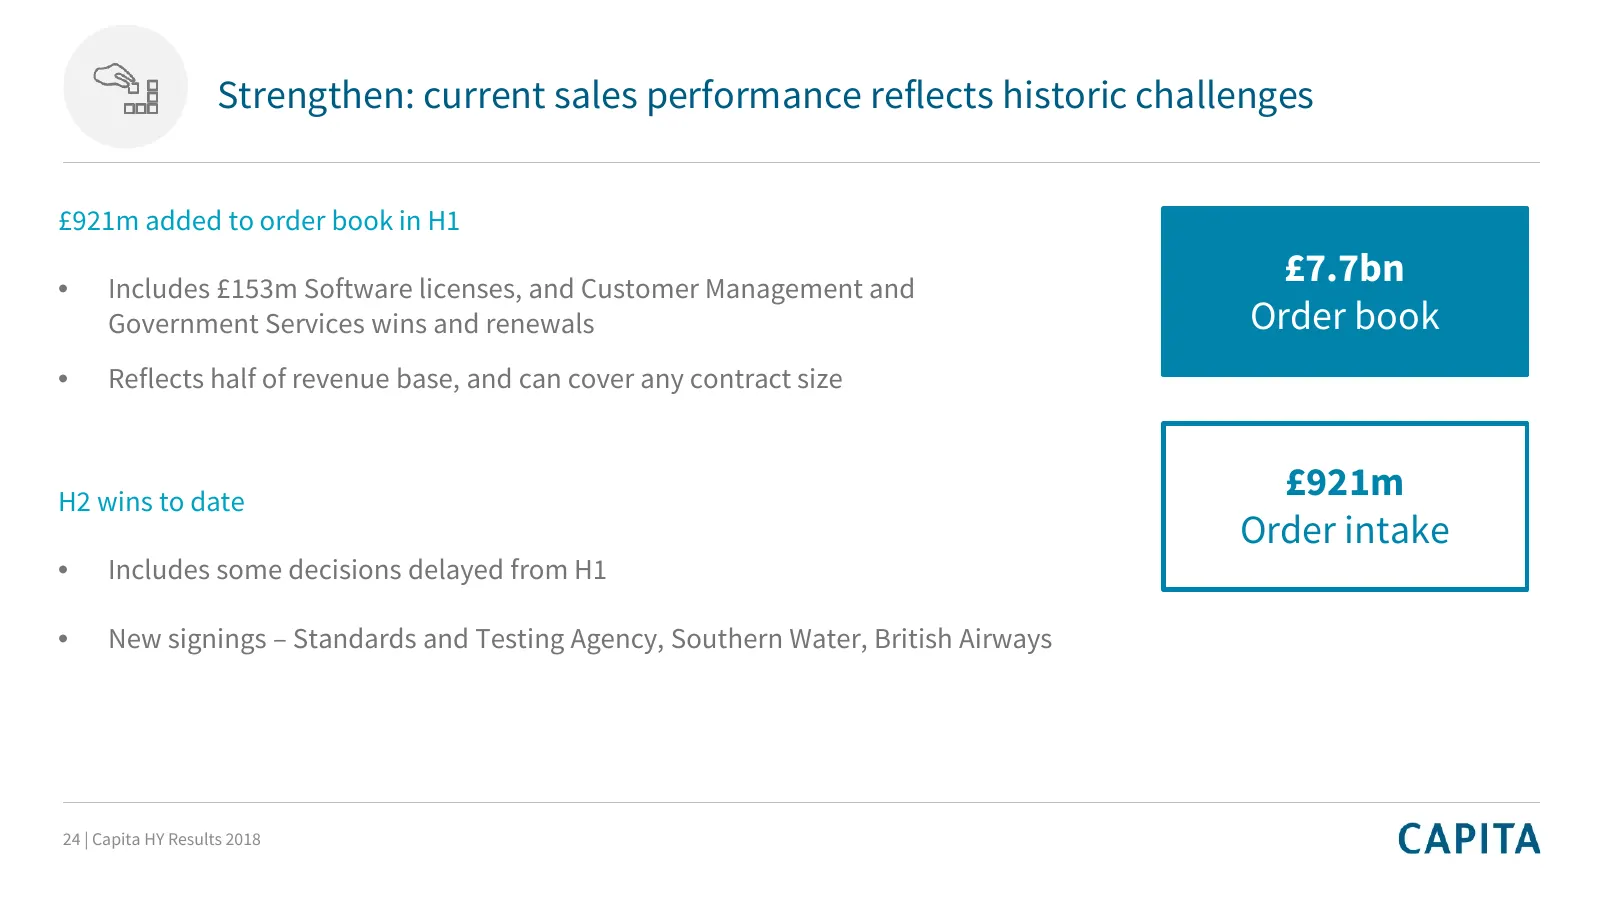
Slide 24: Strengthen: current sales performance reflects historic challenges
Strengthen: current sales performance reflects historic challenges £921m added to order book in H1 • Includes £153m Software licenses, and Customer Management and £7.7bn Government Services wins and renewals Order book • Reflects half of revenue base, and can cover any contract size H2 wins to date
Slide 25: Succeed: our plans for each division
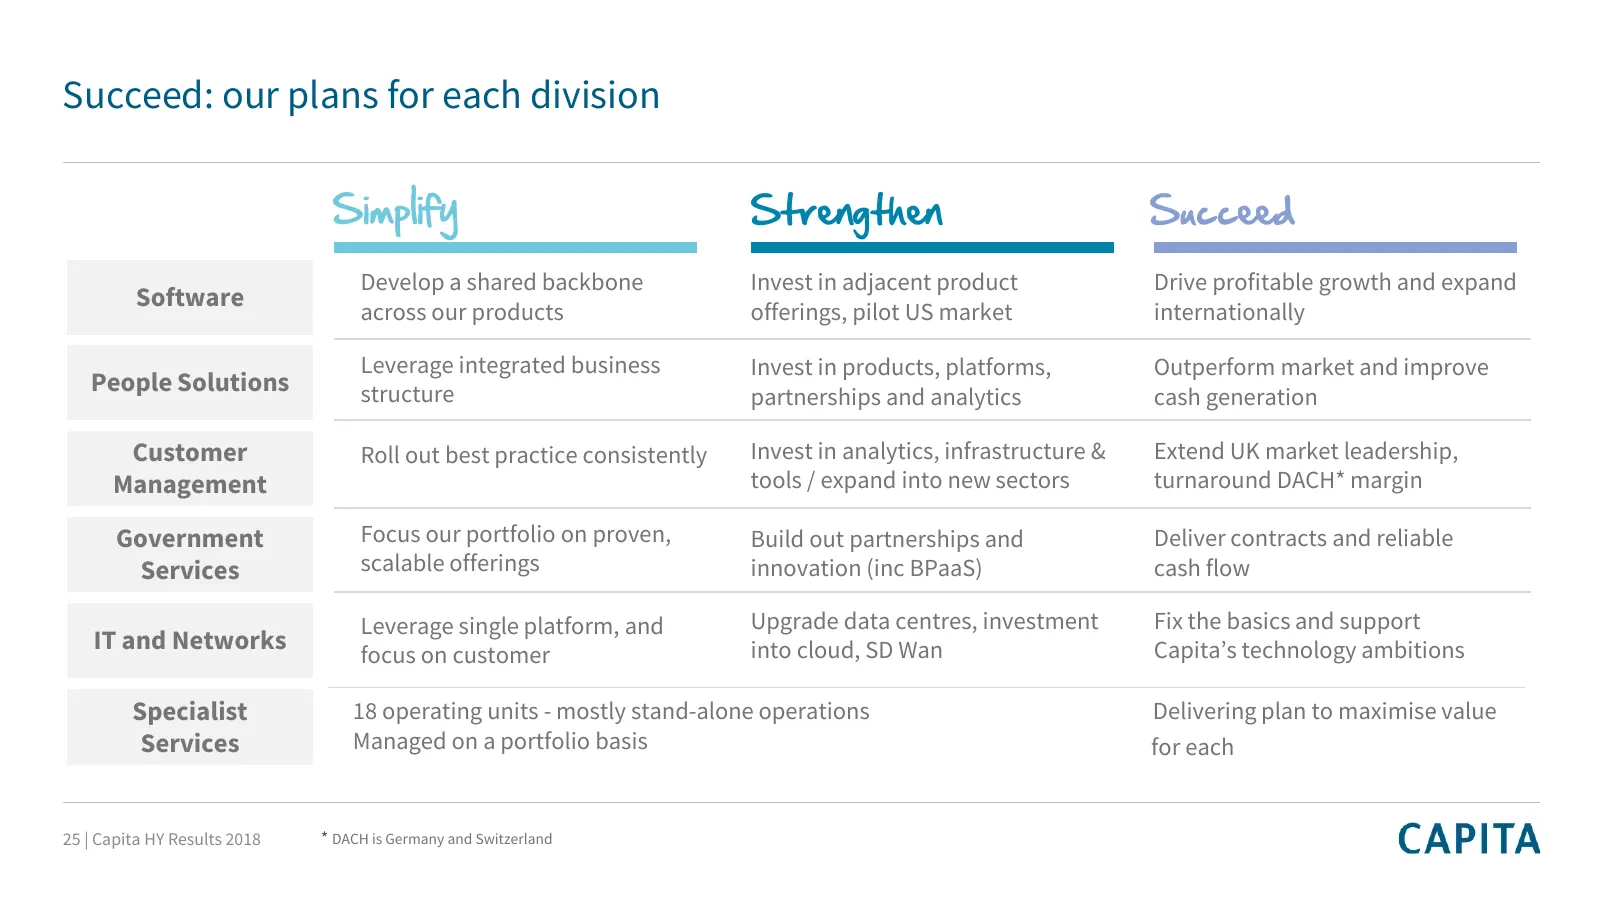
Succeed: our plans for each division Simplify Strengthen Succeed Develop a shared backbone Invest in adjacent product Drive profitable growth and expand Software across our products offerings, pilot US market internationally Leverage integrated business Invest in products, platforms, Outperform mark
Slide 26: Software
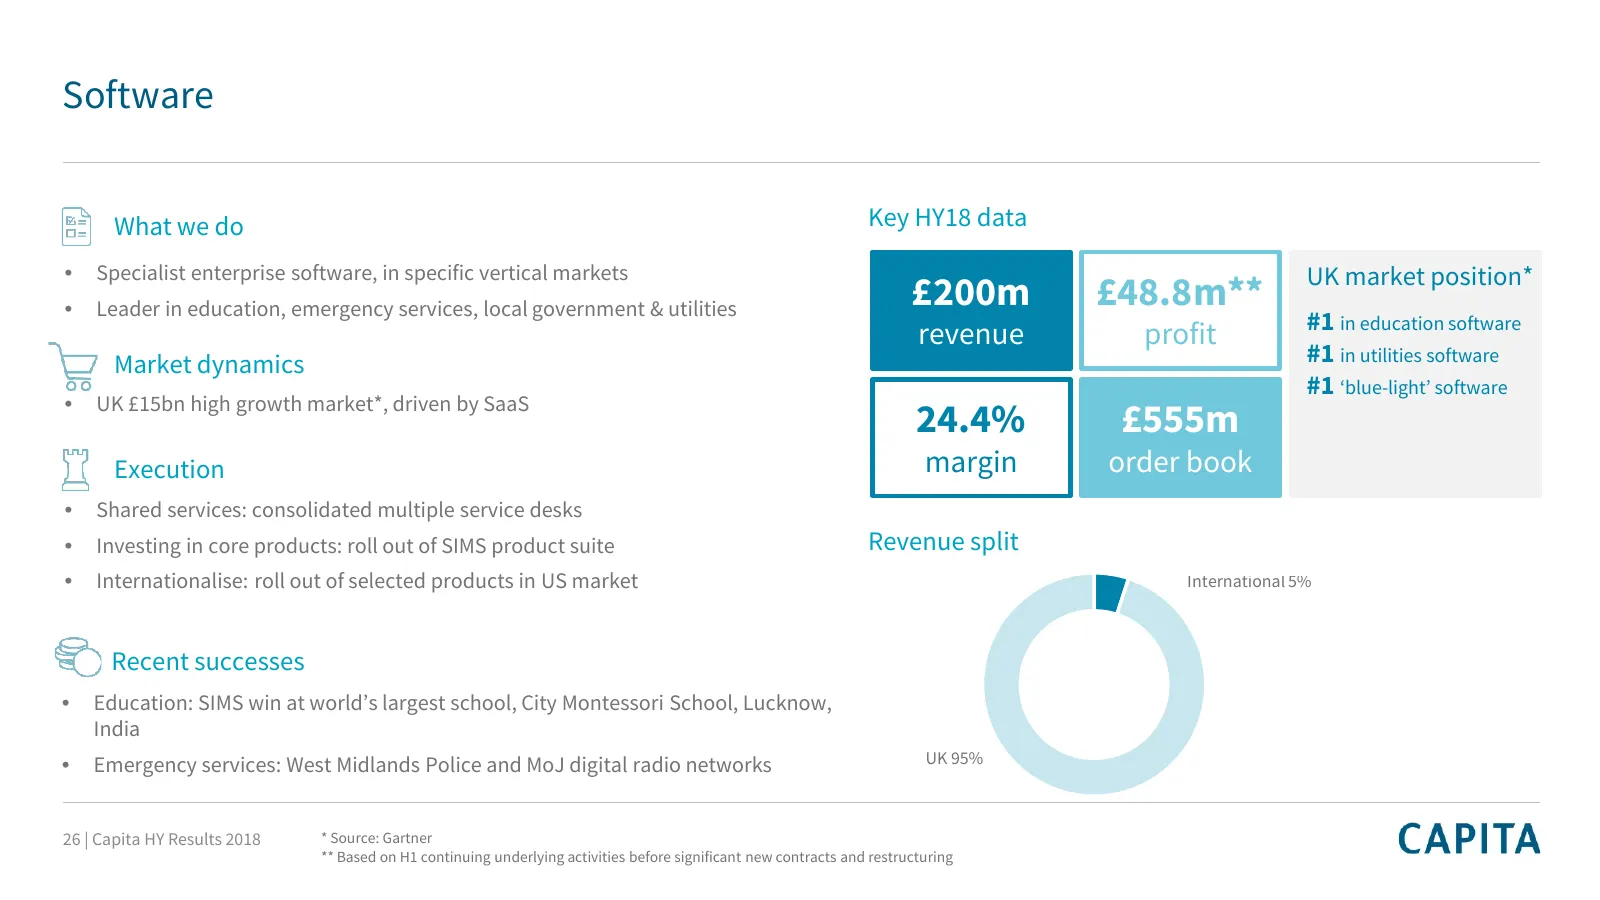
Software What we do Key HY18 data Specialist enterprise software, in specific vertical markets UK market position* £200m £48.8m** • • Leader in education, emergency services, local government & utilities #1 in education software revenue profit Market dynamics #1 in utilities software #1 ‘blue-light’
Slide 27: People Solutions
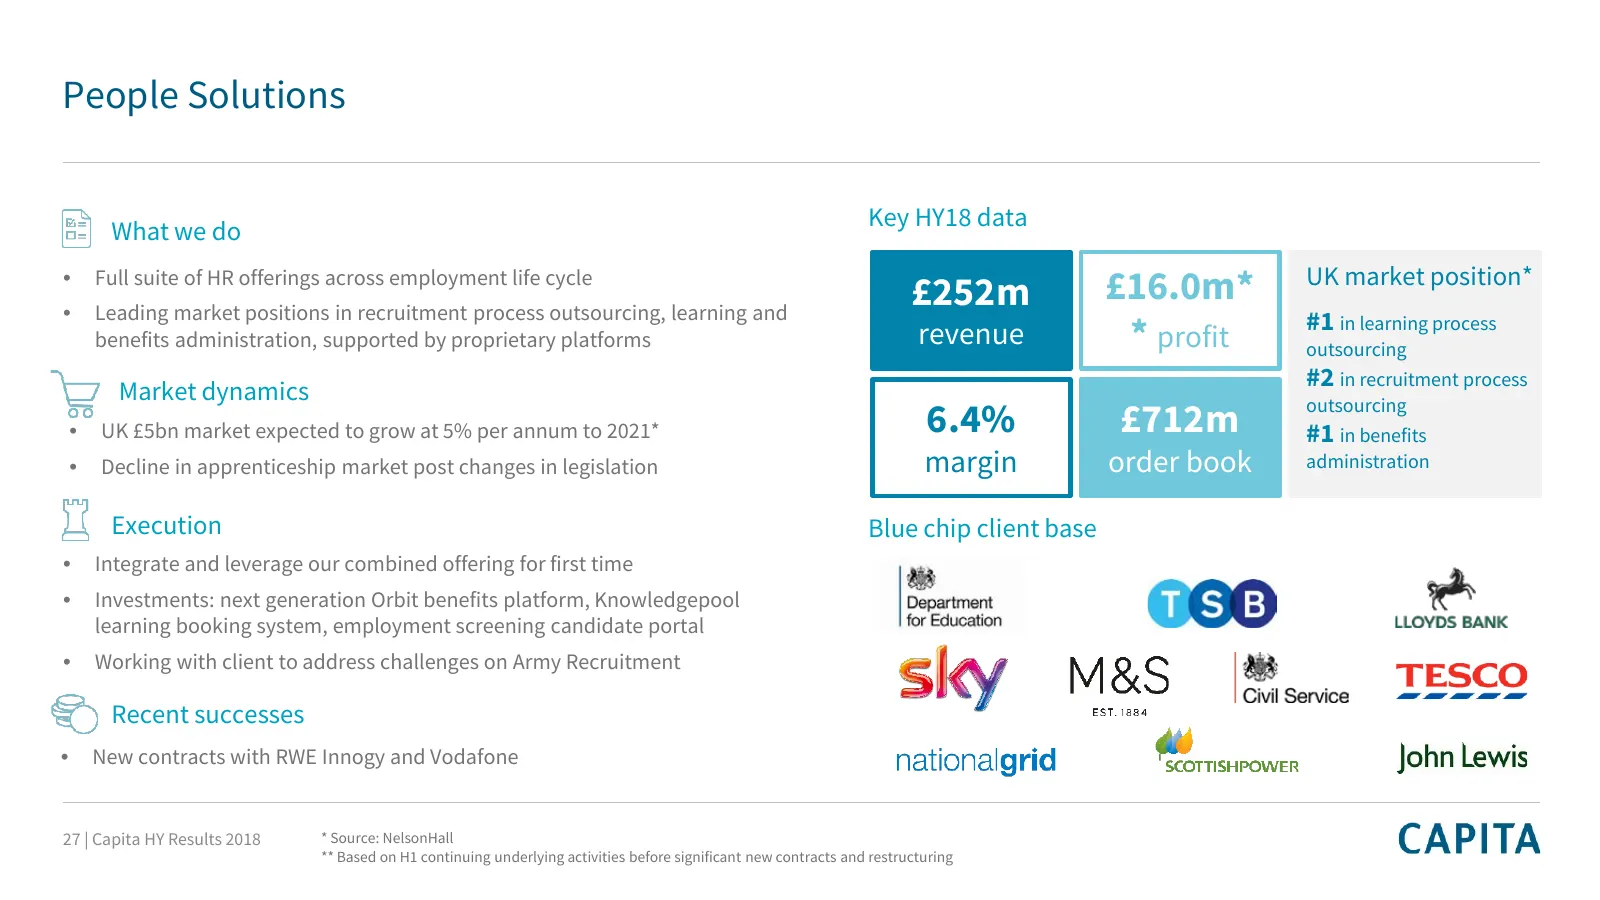
People Solutions Key HY18 data What we do UK market position* • Full suite of HR offerings across employment life cycle £252m £16.0m* • Leading market positions in recruitment process outsourcing, learning and #1 in learning process benefits administration, supported by proprietary platforms revenue
Slide 28: Customer Management
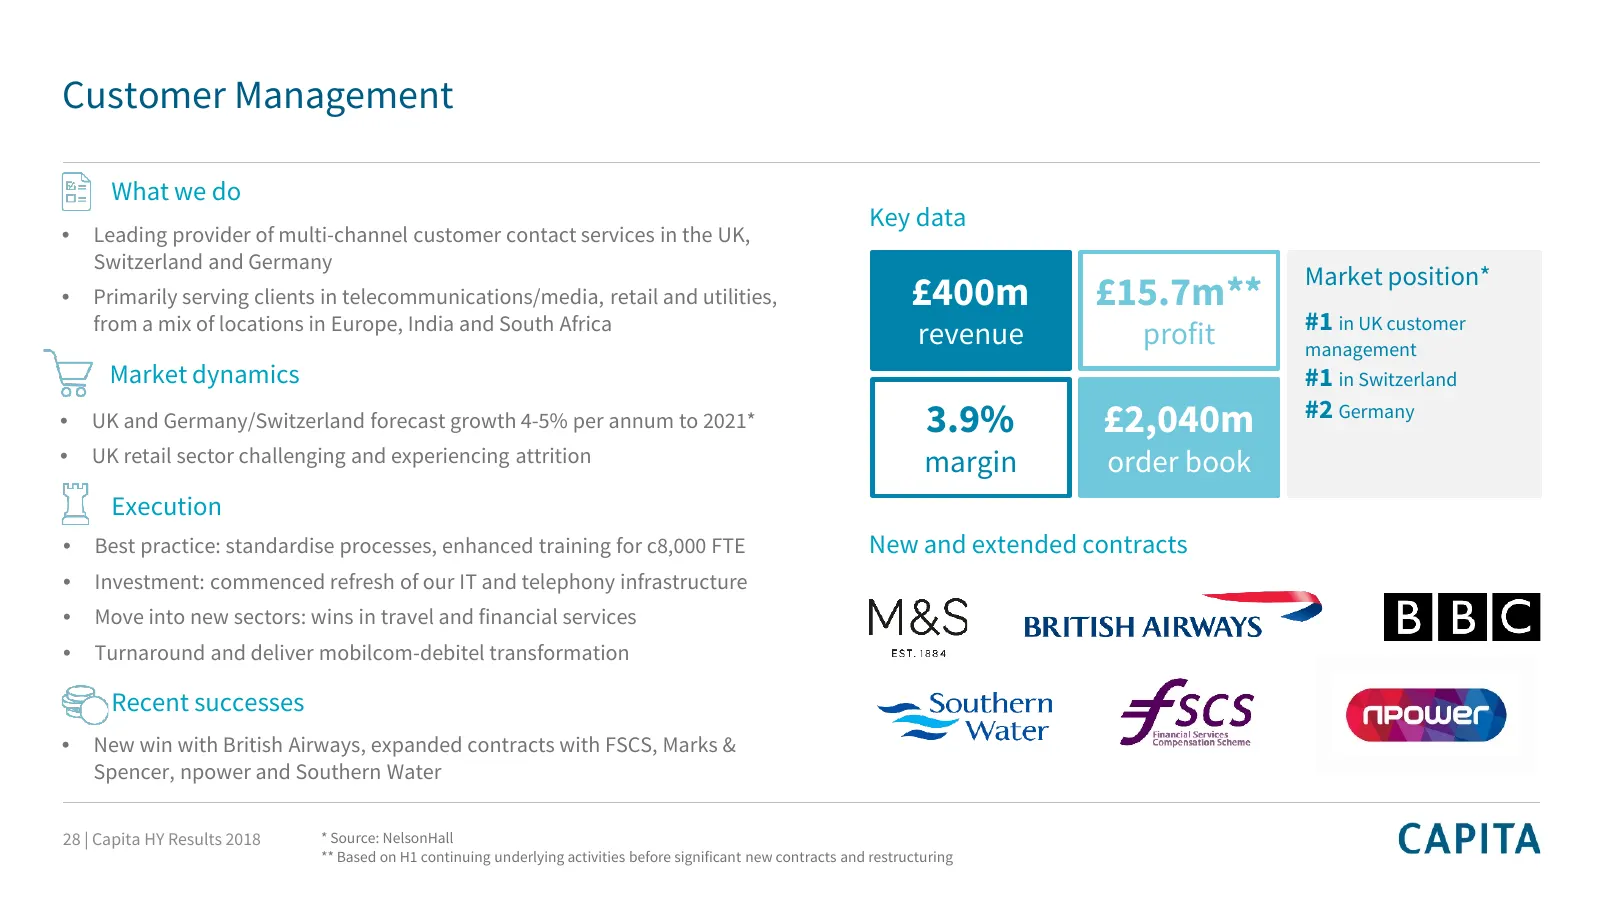
Customer Management What we do Key data • Leading provider of multi-channel customer contact services in the UK, Switzerland and Germany Market position* • Primarily serving clients in telecommunications/media, retail and utilities, £400m £15.7m** from a mix of locations in Europe, India and South A
Slide 29: Government Services
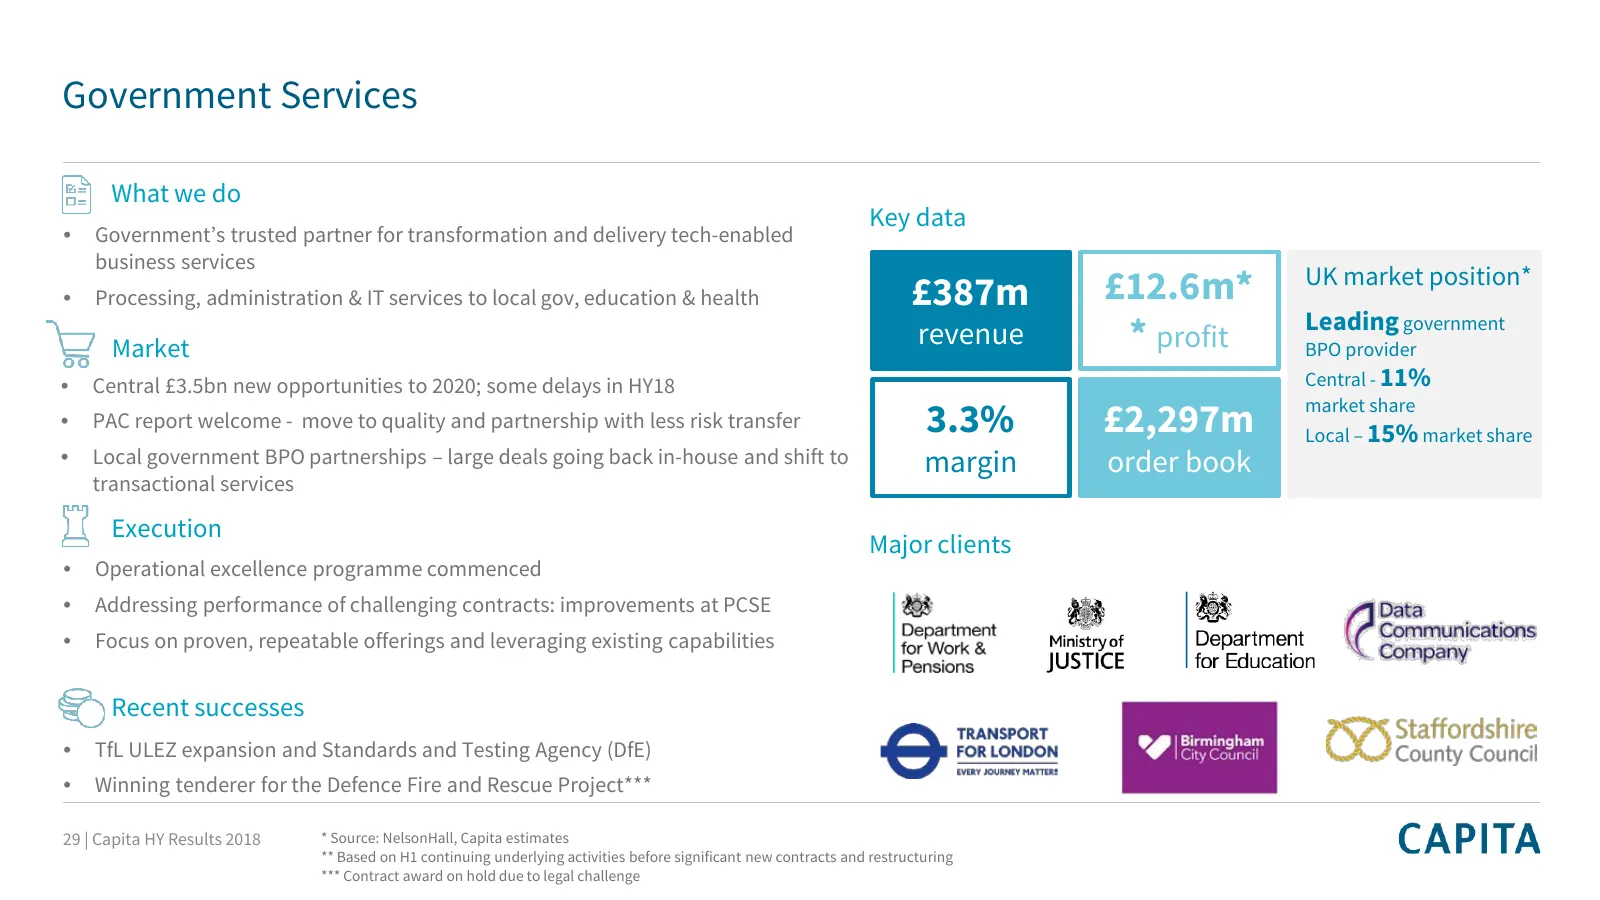
Government Services What we do Key data • Government’s trusted partner for transformation and delivery tech-enabled business services UK market position* • Processing, administration & IT services to local gov, education & health £387m £12.6m* Leading government Market revenue * profit BPO provider
Slide 30: IT and Networks
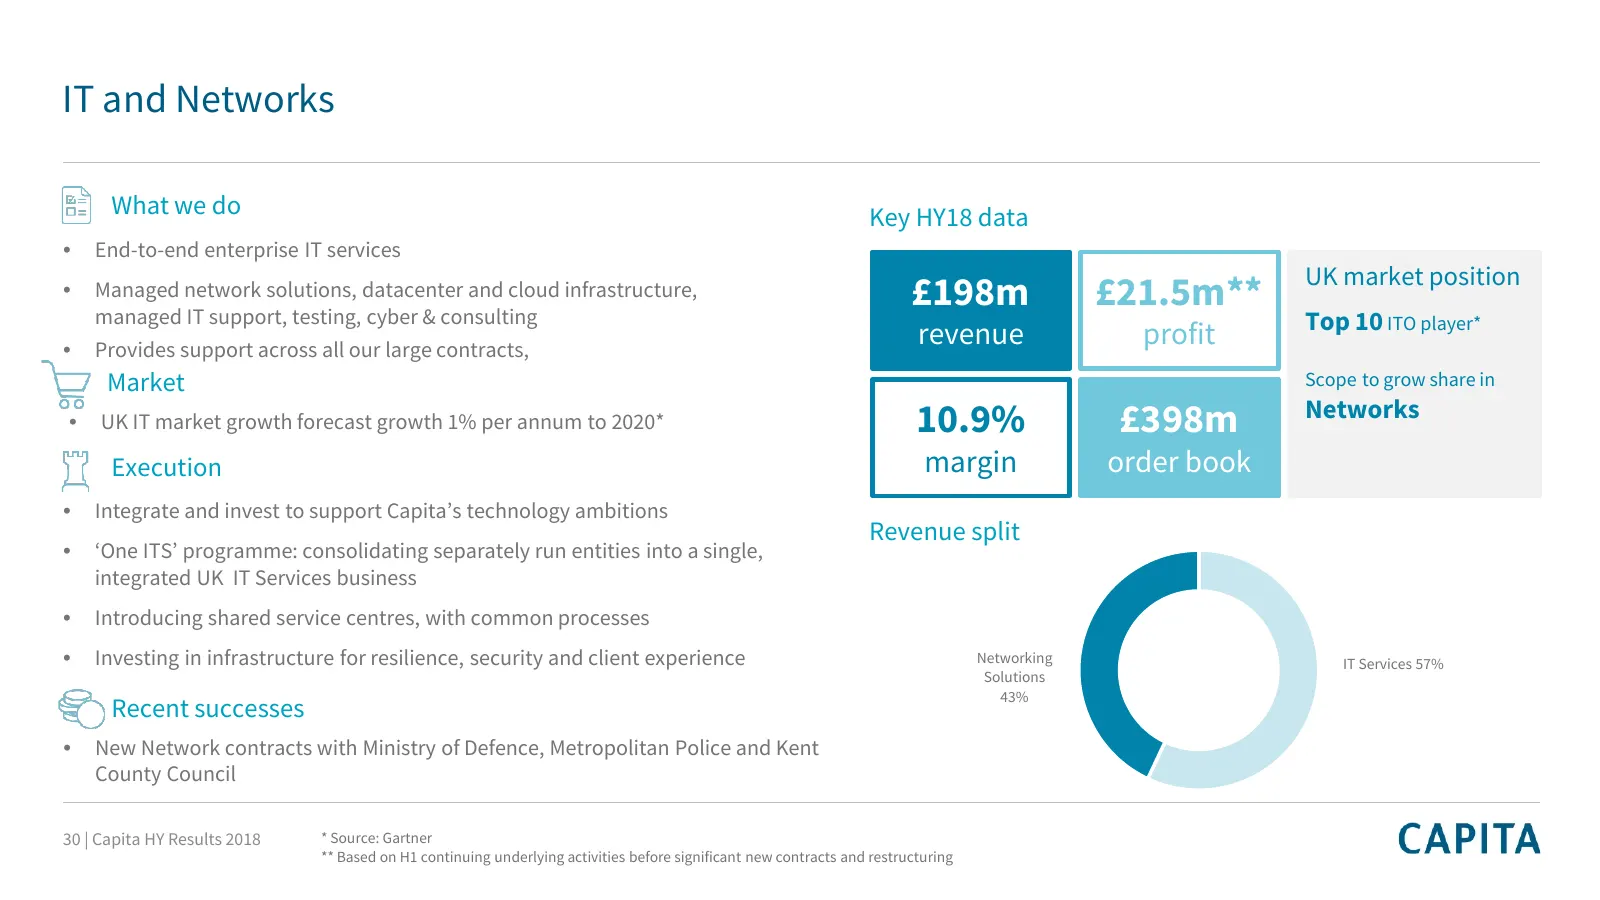
IT and Networks What we do Key HY18 data • End-to-end enterprise IT services UK market position • Managed network solutions, datacenter and cloud infrastructure, managed IT support, testing, cyber & consulting £198m £21.5m** Top 10 ITO player* • Provides support across all our large contracts, reven
Slide 31: Specialist Services
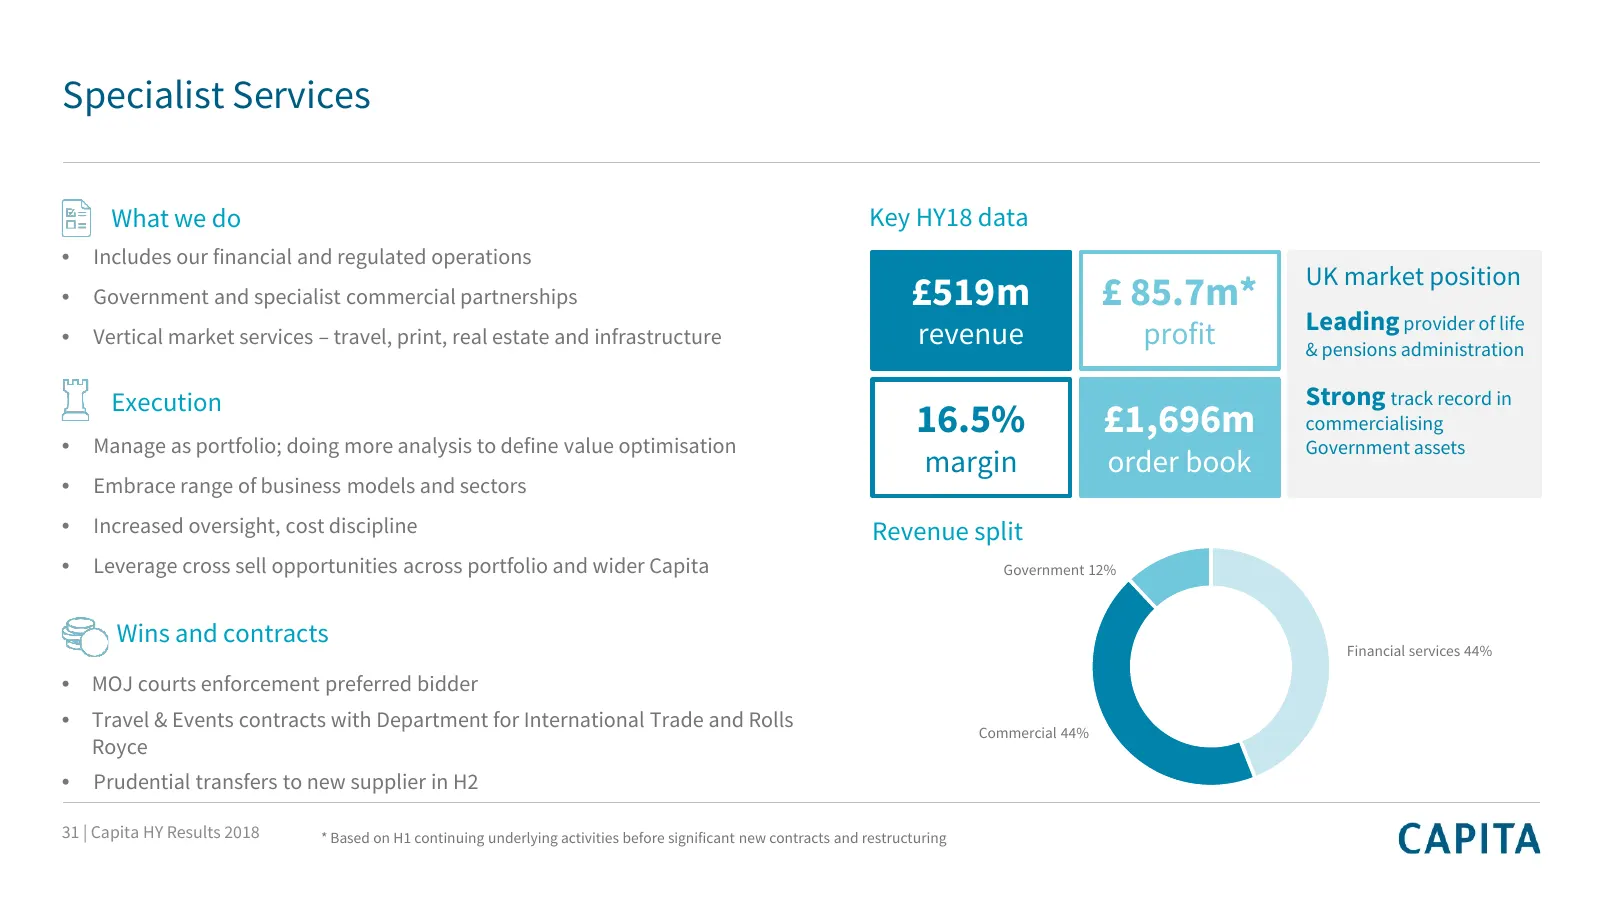
Specialist Services What we do Key HY18 data • Includes our financial and regulated operations UK market position • Government and specialist commercial partnerships £519m £ 85.7m* Leading provider of life • Vertical market services – travel, print, real estate and infrastructure revenue profit & pe
Slide 32: Summary
Summary 32 | Capita HY Results 2018
Slide 33: Summary: on track to deliver significant financial transformation
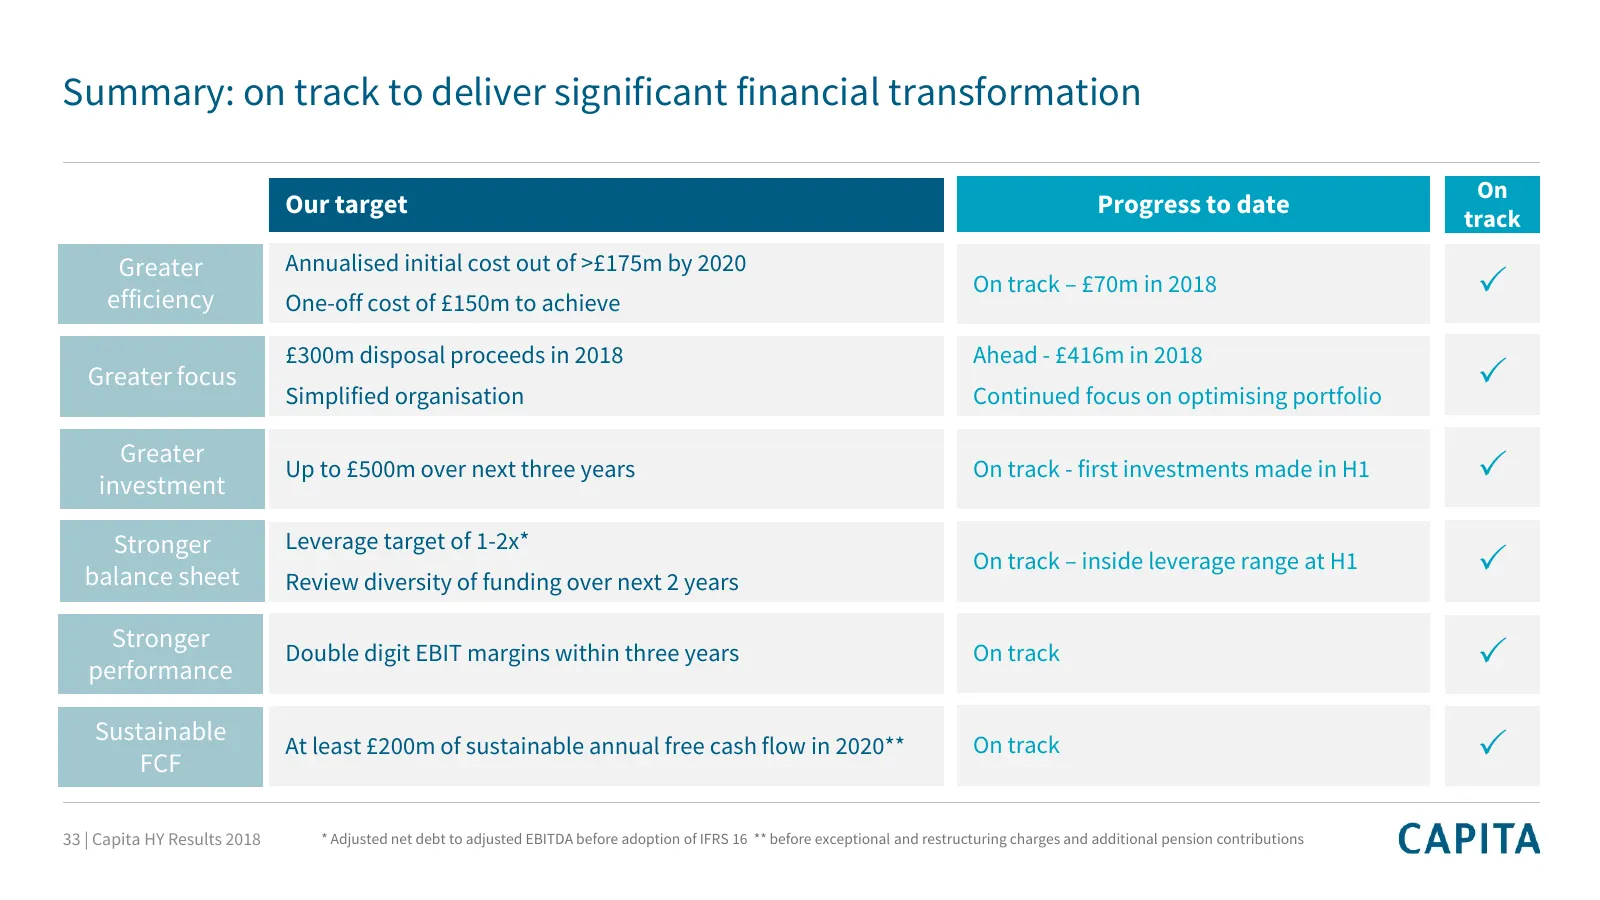
Summary: on track to deliver significant financial transformation On Our target Progress to date track Greater Annualised initial cost out of >£175m by 2020 efficiency One-off cost of £150m to achieve On track – £70m in 2018 £300m disposal proceeds in 2018 Ahead - £416m in 2018 Greater focus Simpl
Slide 34: Appendix
Appendix 34 | Capita HY Results 2018
Slide 35: Revenue
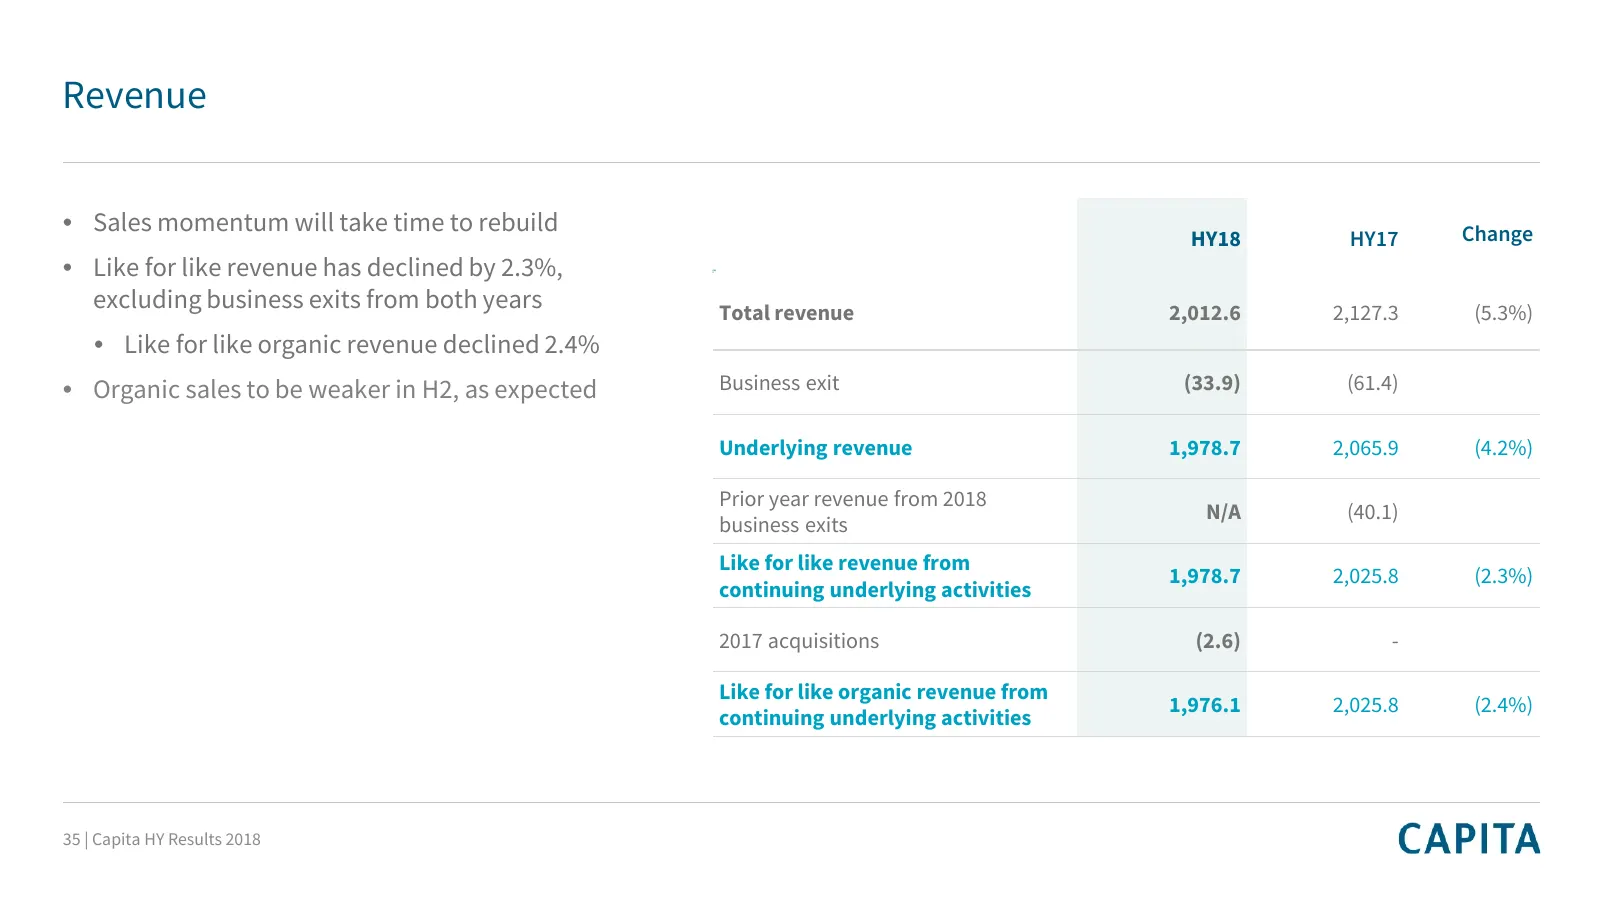
Revenue • Sales momentum will take time to rebuild Change HY18 HY17 • Like for like revenue has declined by 2.3%, $3£ 2 excluding business exits from both years Total revenue 2,012.6 2,127.3 (5.3%) • Like for like organic revenue declined 2.4% • Organic sales to be weaker in H2, as expected Business
Slide 36: Underlying PBT bridge to reported PBT
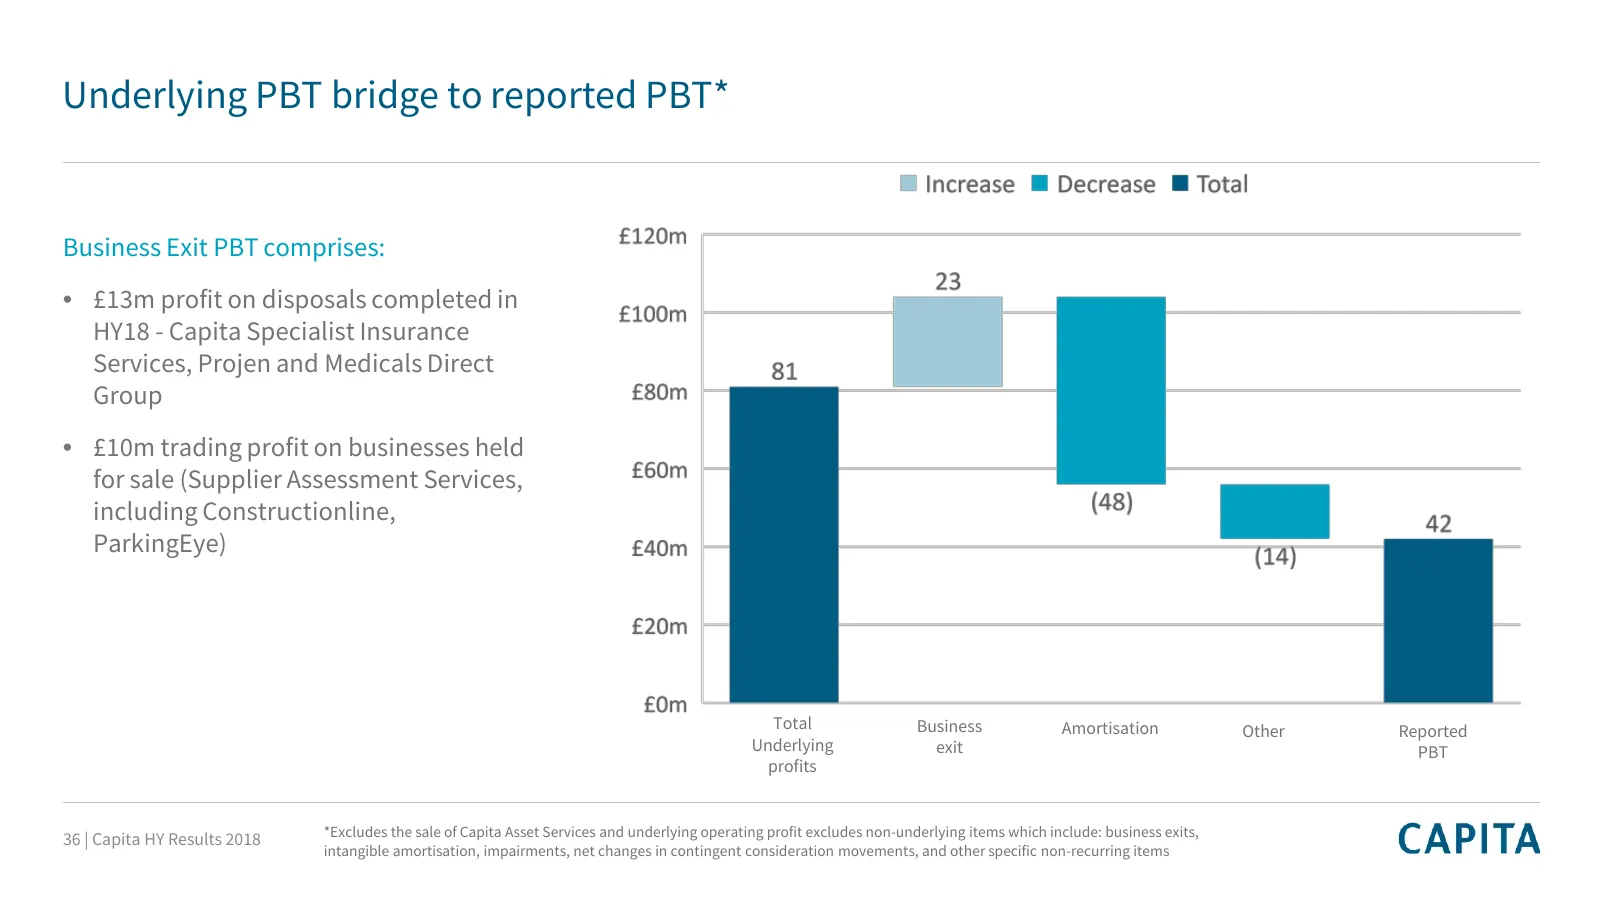
Underlying PBT bridge to reported PBT* Business Exit PBT comprises: • £13m profit on disposals completed in HY18 - Capita Specialist Insurance Services, Projen and Medicals Direct Group • £10m trading profit on businesses held for sale (Supplier Assessment Services, including Constructionline, Parki
Slide 37: Overall underlying revenue split
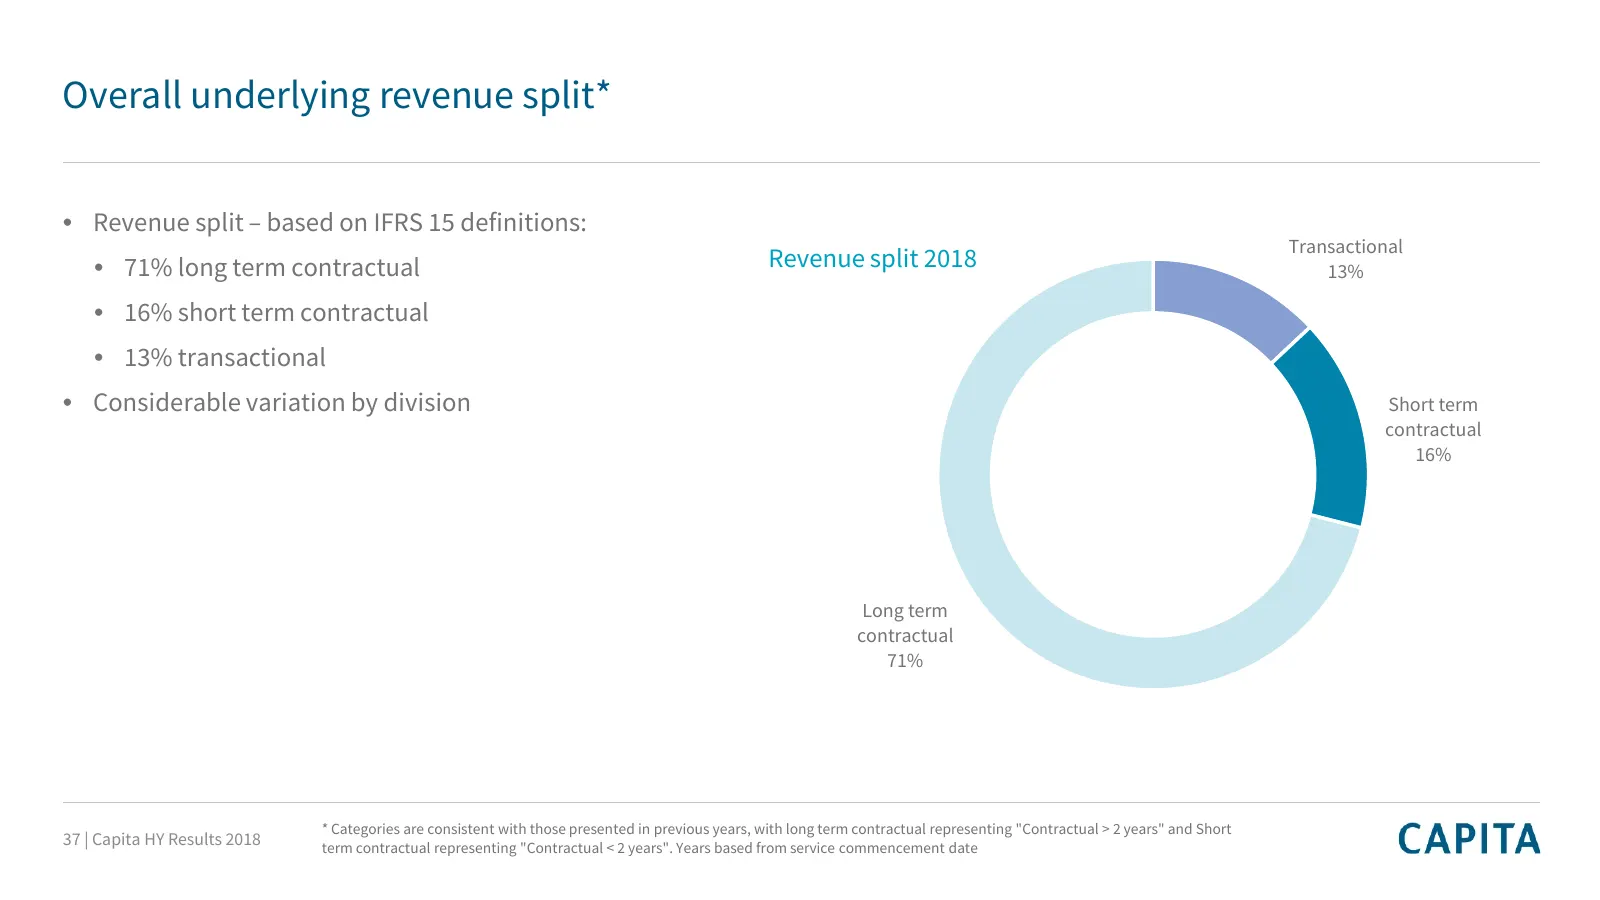
Overall underlying revenue split* • Revenue split – based on IFRS 15 definitions: Transactional • 71% long term contractual Revenue split 2018 13% • 16% short term contractual • 13% transactional • Considerable variation by division Short term contractual 16% Long term contractual 71% * Categories a
Slide 38: Divisional performance – underlying excluding significant contracts and restructuring
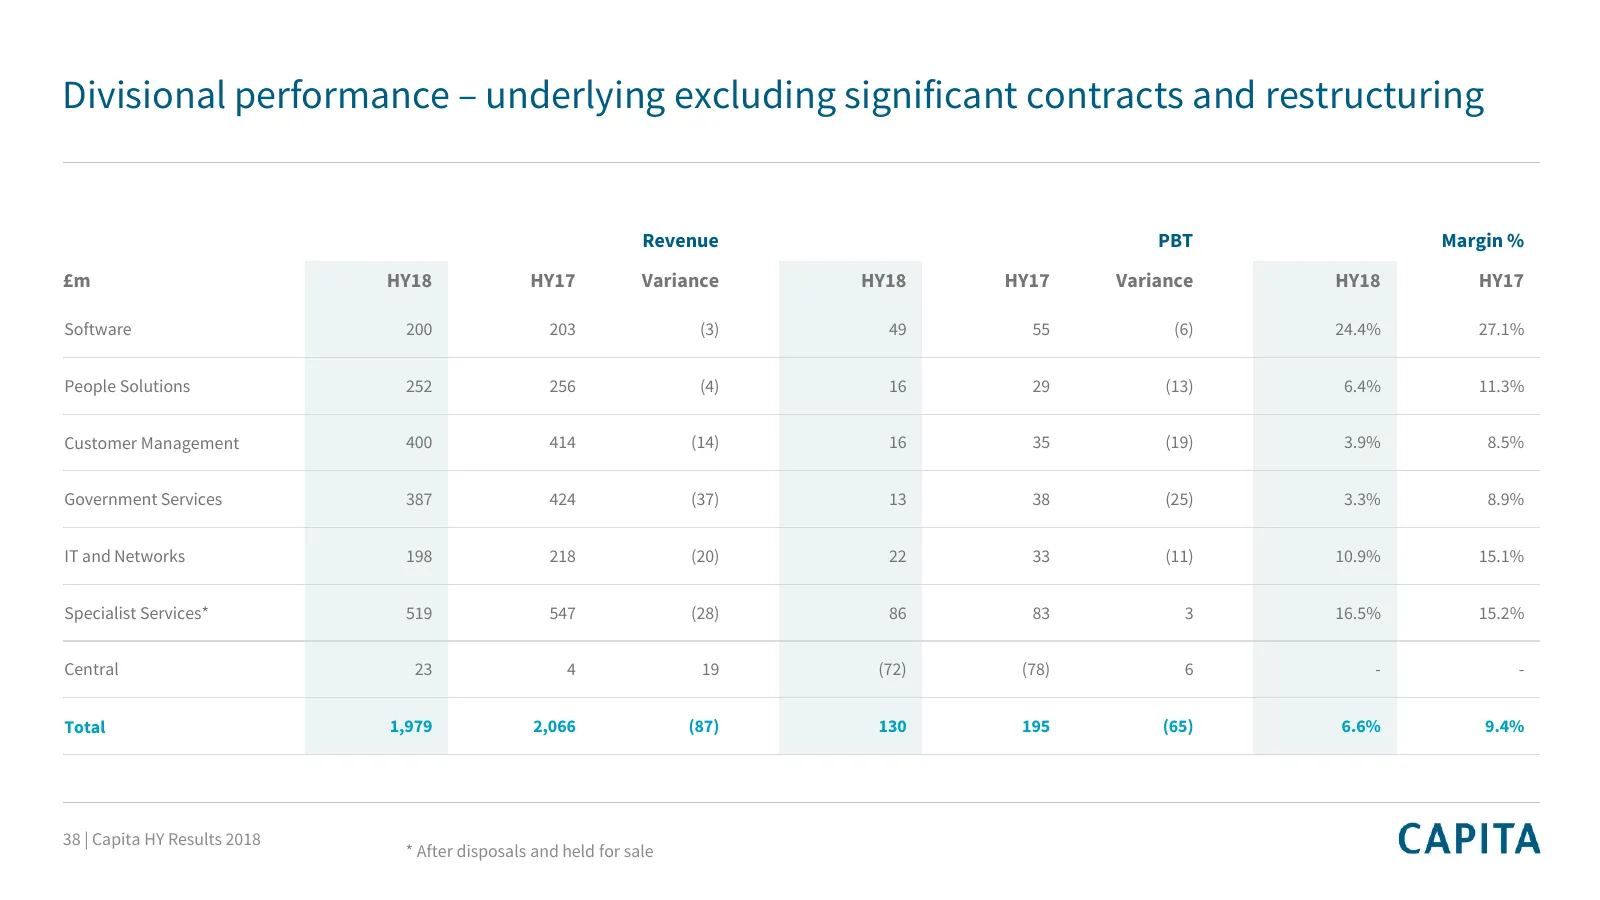
Divisional performance – underlying excluding significant contracts and restructuring Revenue PBT Margin % £m HY18 HY17 Variance HY18 HY17 Variance HY18 HY17 Software 200 203 (3) 49 55 (6) 24.4% 27.1% People Solutions 252 256 (4) 16 29 (13) 6.4% 11.3% Customer Management 400 414 (14) 16 35 (19) 3.9%
Slide 39: Balance sheet gearing
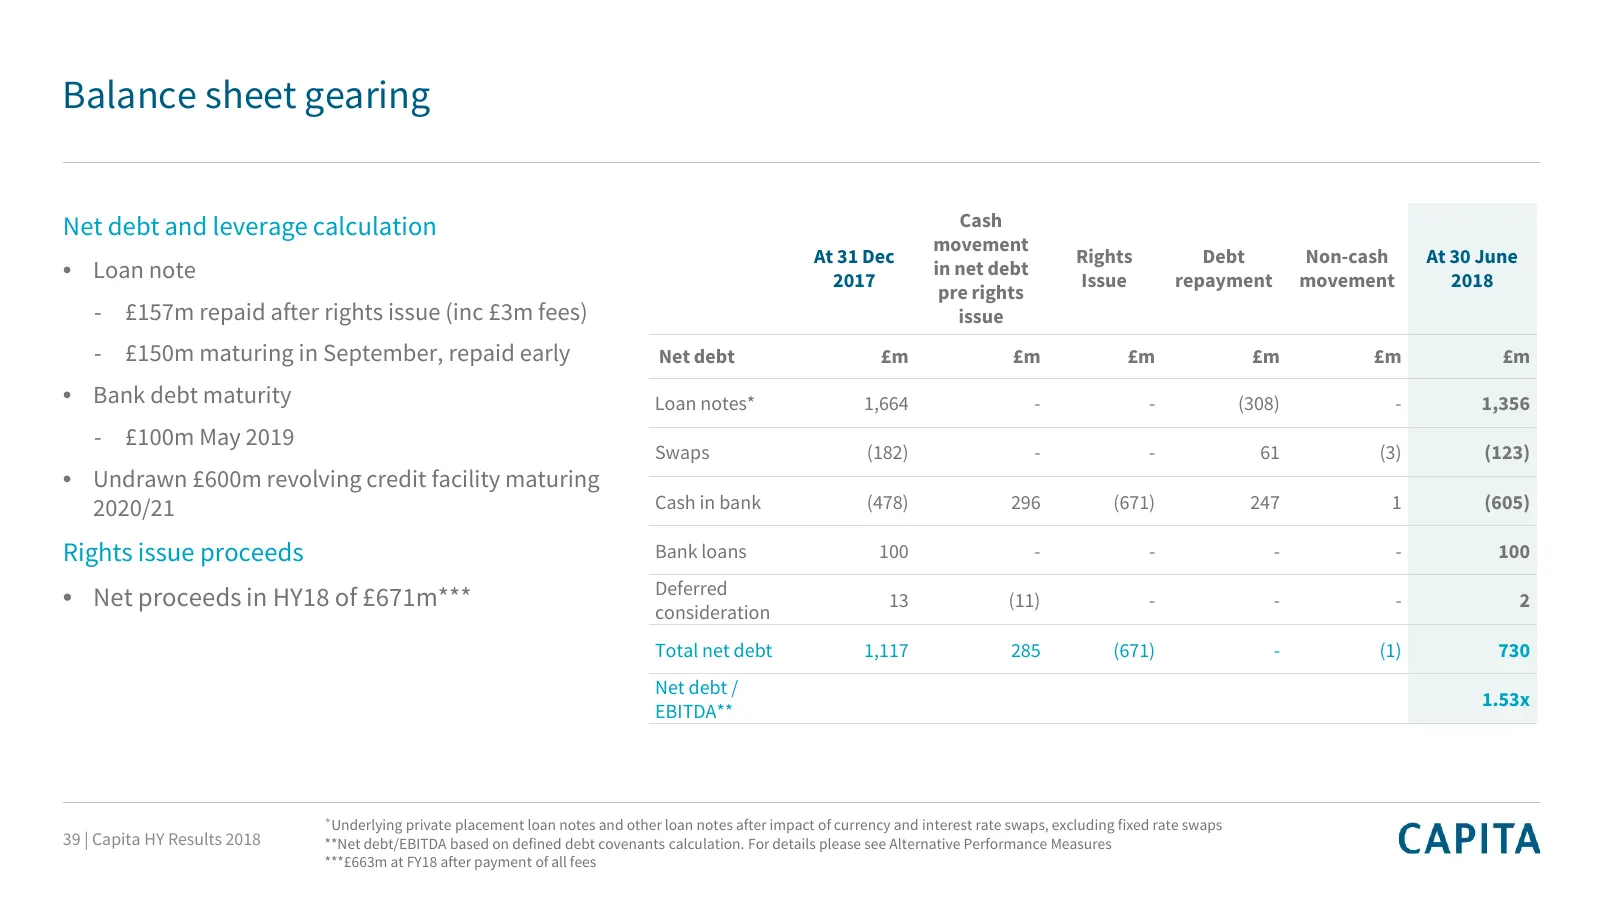
Balance sheet gearing Net debt and leverage calculation Cash movement At 31 Dec Rights Debt Non-cash At 30 June • Loan note 2017 in net debt Issue repayment movement 2018 pre rights - £157m repaid after rights issue (inc £3m fees) issue - £150m maturing in September, repaid early Net debt £m £m £m £
Slide 40: Disclaimer
Disclaimer This announcement is prepared for and addressed only to the Company's shareholders as a whole and to no other person. The Company, its Directors, employees, agents and advisers accept and assume no liability to any person in respect of this trading update save as would arise under English
Source: Internet Archive copy of capita.com
More decks from Capita plc
 H1 2026 Earnings Presentation44 slides · Aug 4, 2026
 FY2025 Earnings Presentation46 slides · March 2026
 Merger or Acquisition (March 2026)10 slides · March 2026
 H1 2025 Earnings Presentation51 slides · August 2025
 FY2024 Earnings Presentation44 slides · March 2025
 H1 2024 Earnings Presentation33 slides · Aug 1, 2024