Sembcorp Industries Ltd. · SGX:U96
Sembcorp Industries — Q1 2014 Earnings Presentation
14 slides from Sembcorp Industries's earnings presentation, May 6, 2014
Slide 1: 1Q2014 Results Announcement
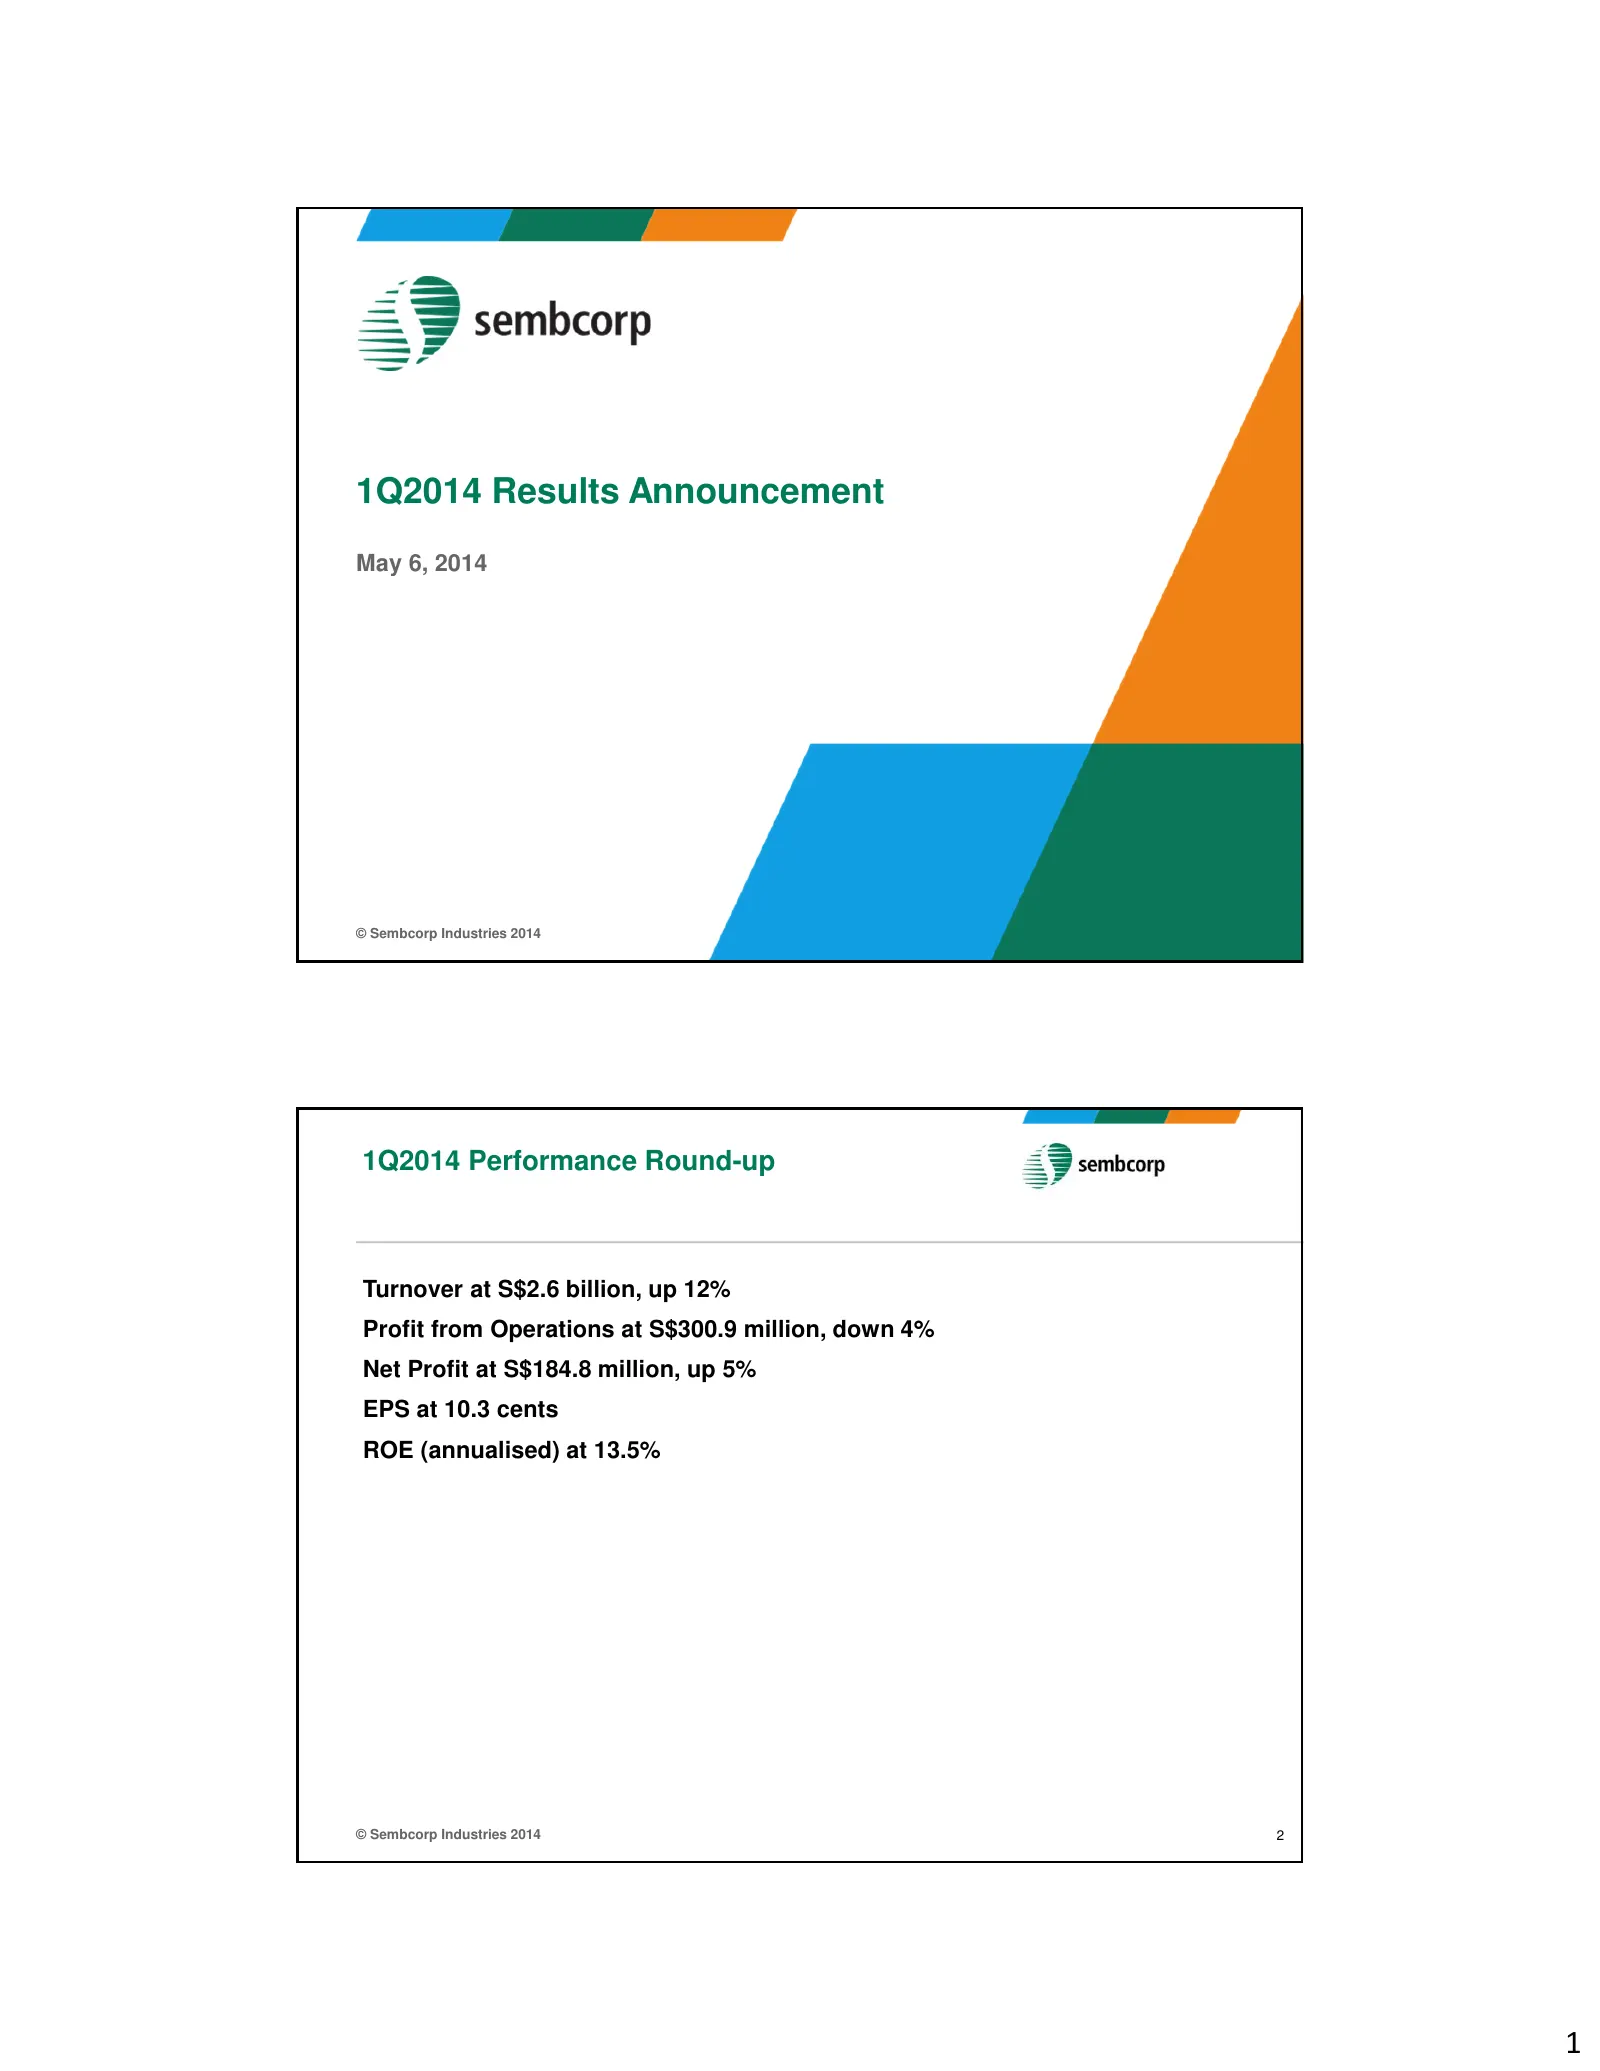
1Q2014 Results Announcement May 6, 2014 © Sembcorp Industries 2014 1Q2014 Performance Round-up Turnover at S$2.6 billion, up 12% Profit from Operations at S$300.9 million, down 4% Net Profit at S$184.8 million, up 5% EPS at 10.3 cents ROE (annualised) at 13.5% © Sembcorp Industries 2014 2 1
Slide 2: Group Net Profit Mix and Utilities Highlights
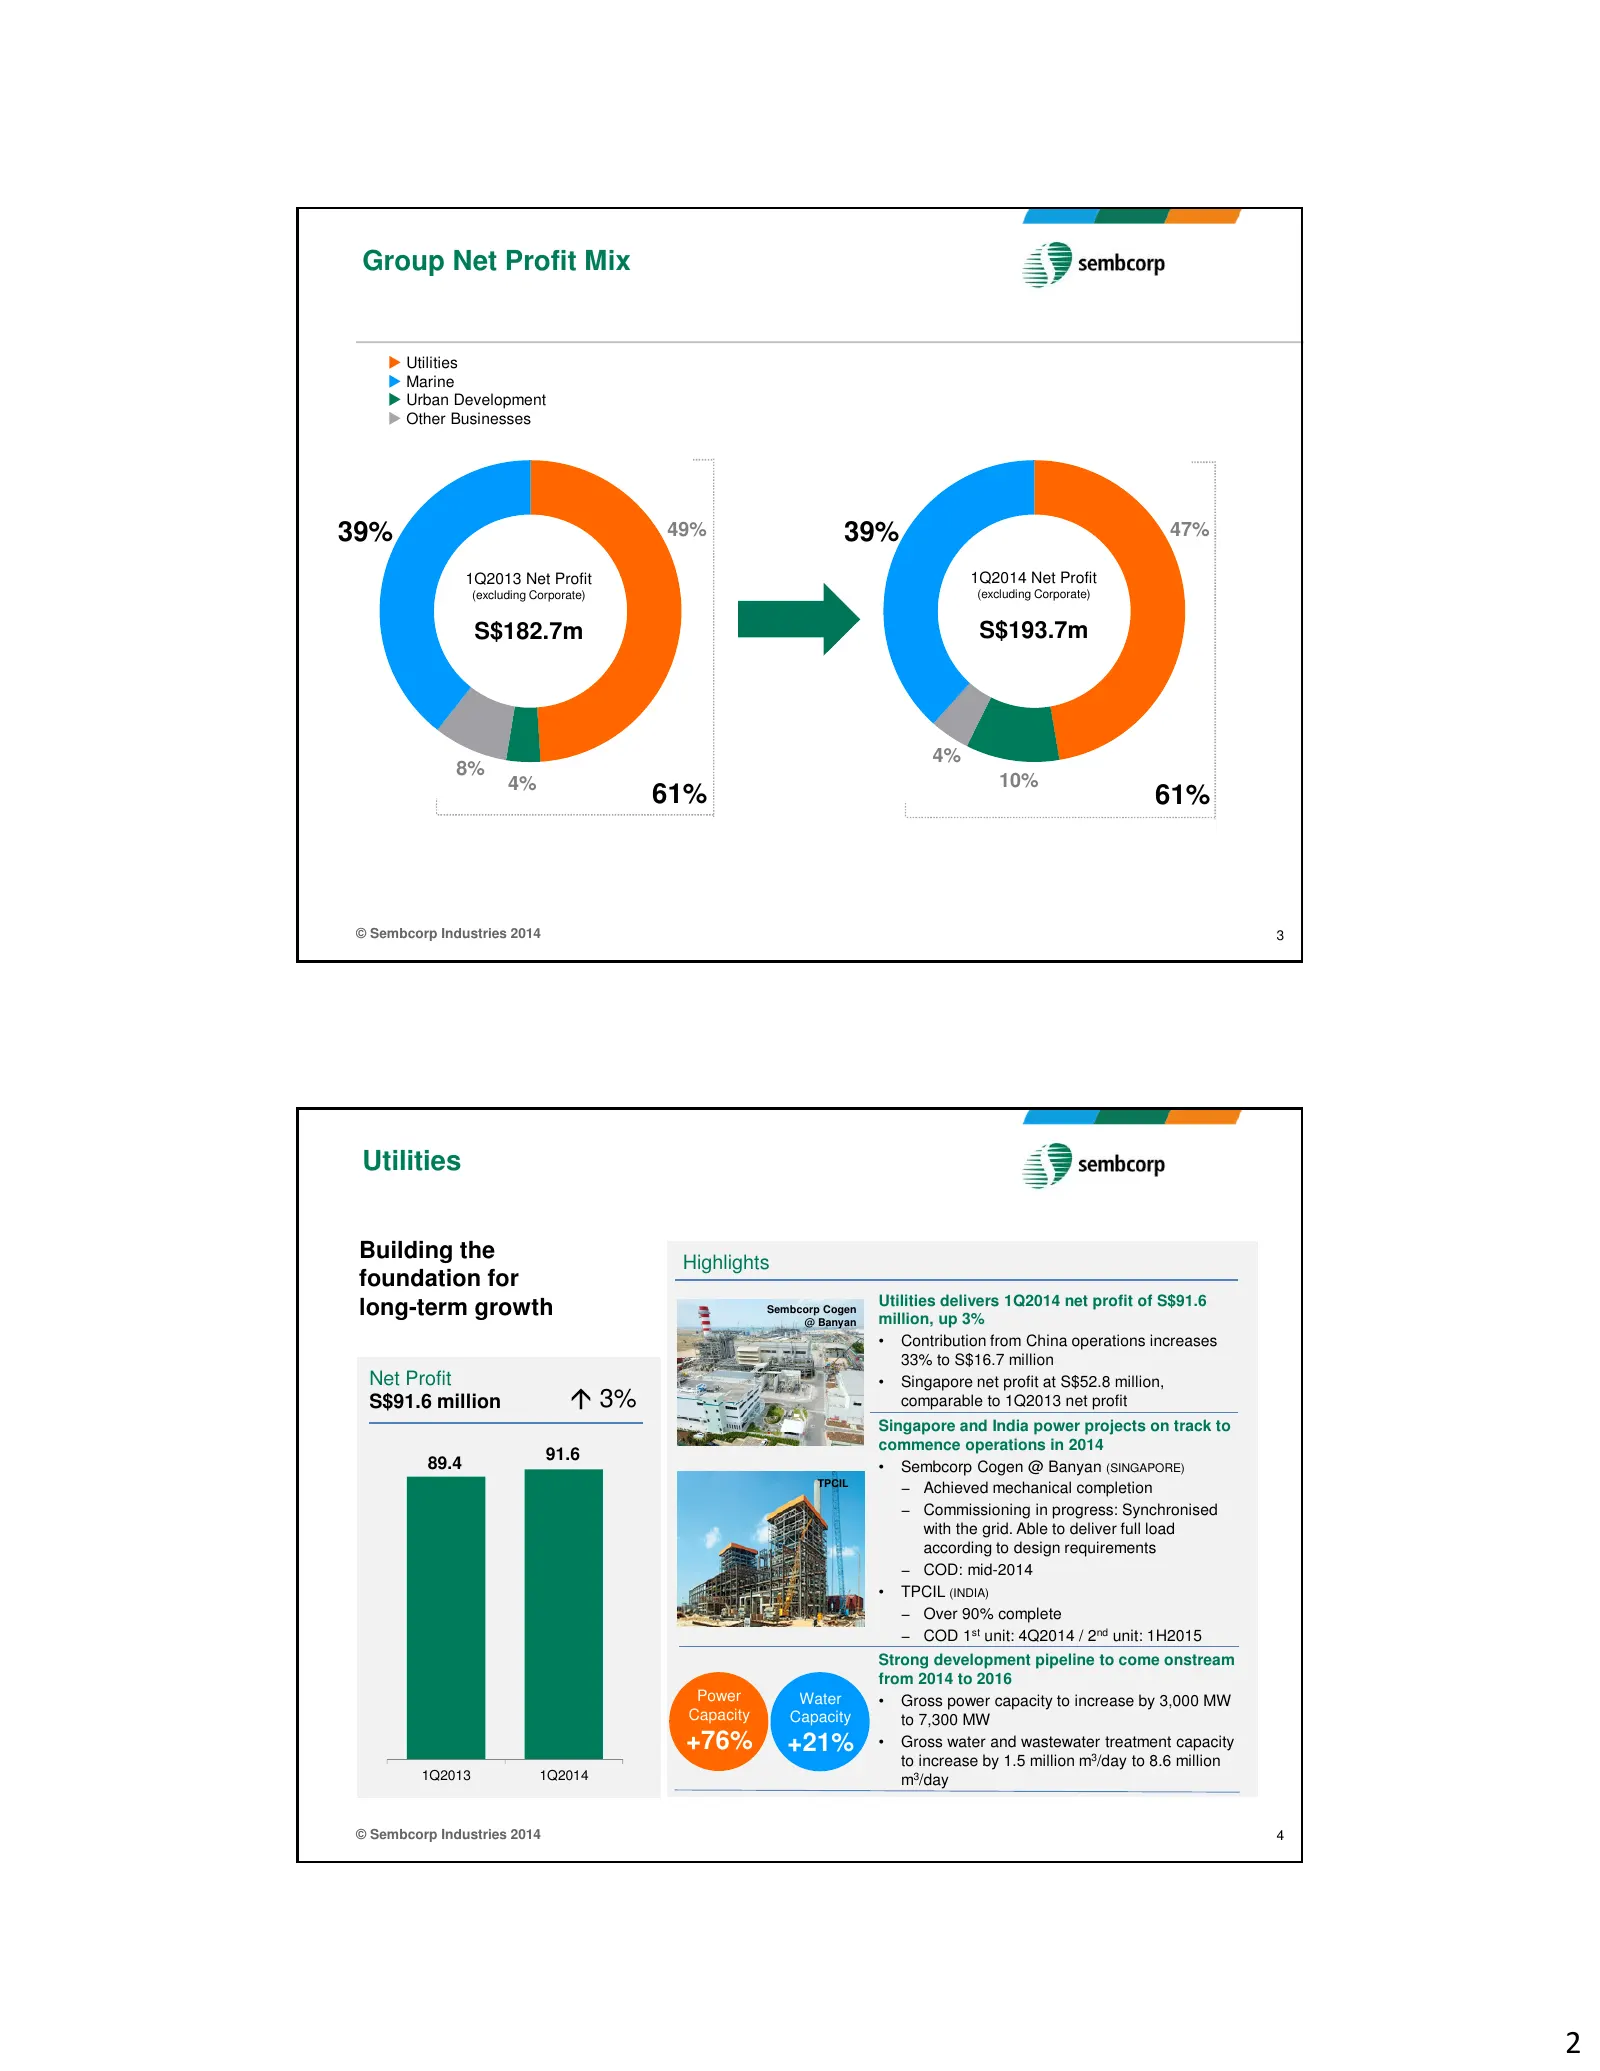
Group Net Profit Mix Utilities Marine Urban Development Other Businesses 39% 49% 39% 47% 1Q2013 Net Profit 1Q2014 Net Profit (excluding Corporate) (excluding Corporate) S$182.7m S$193.7m 4% 8% 4% 10% 61% 61% © Sembcorp Industries 2014 3 Utilities Building the Highlights foundation for Utilities deli
Slide 3: Utilities: Total Water Solutions; Marine Orderbook
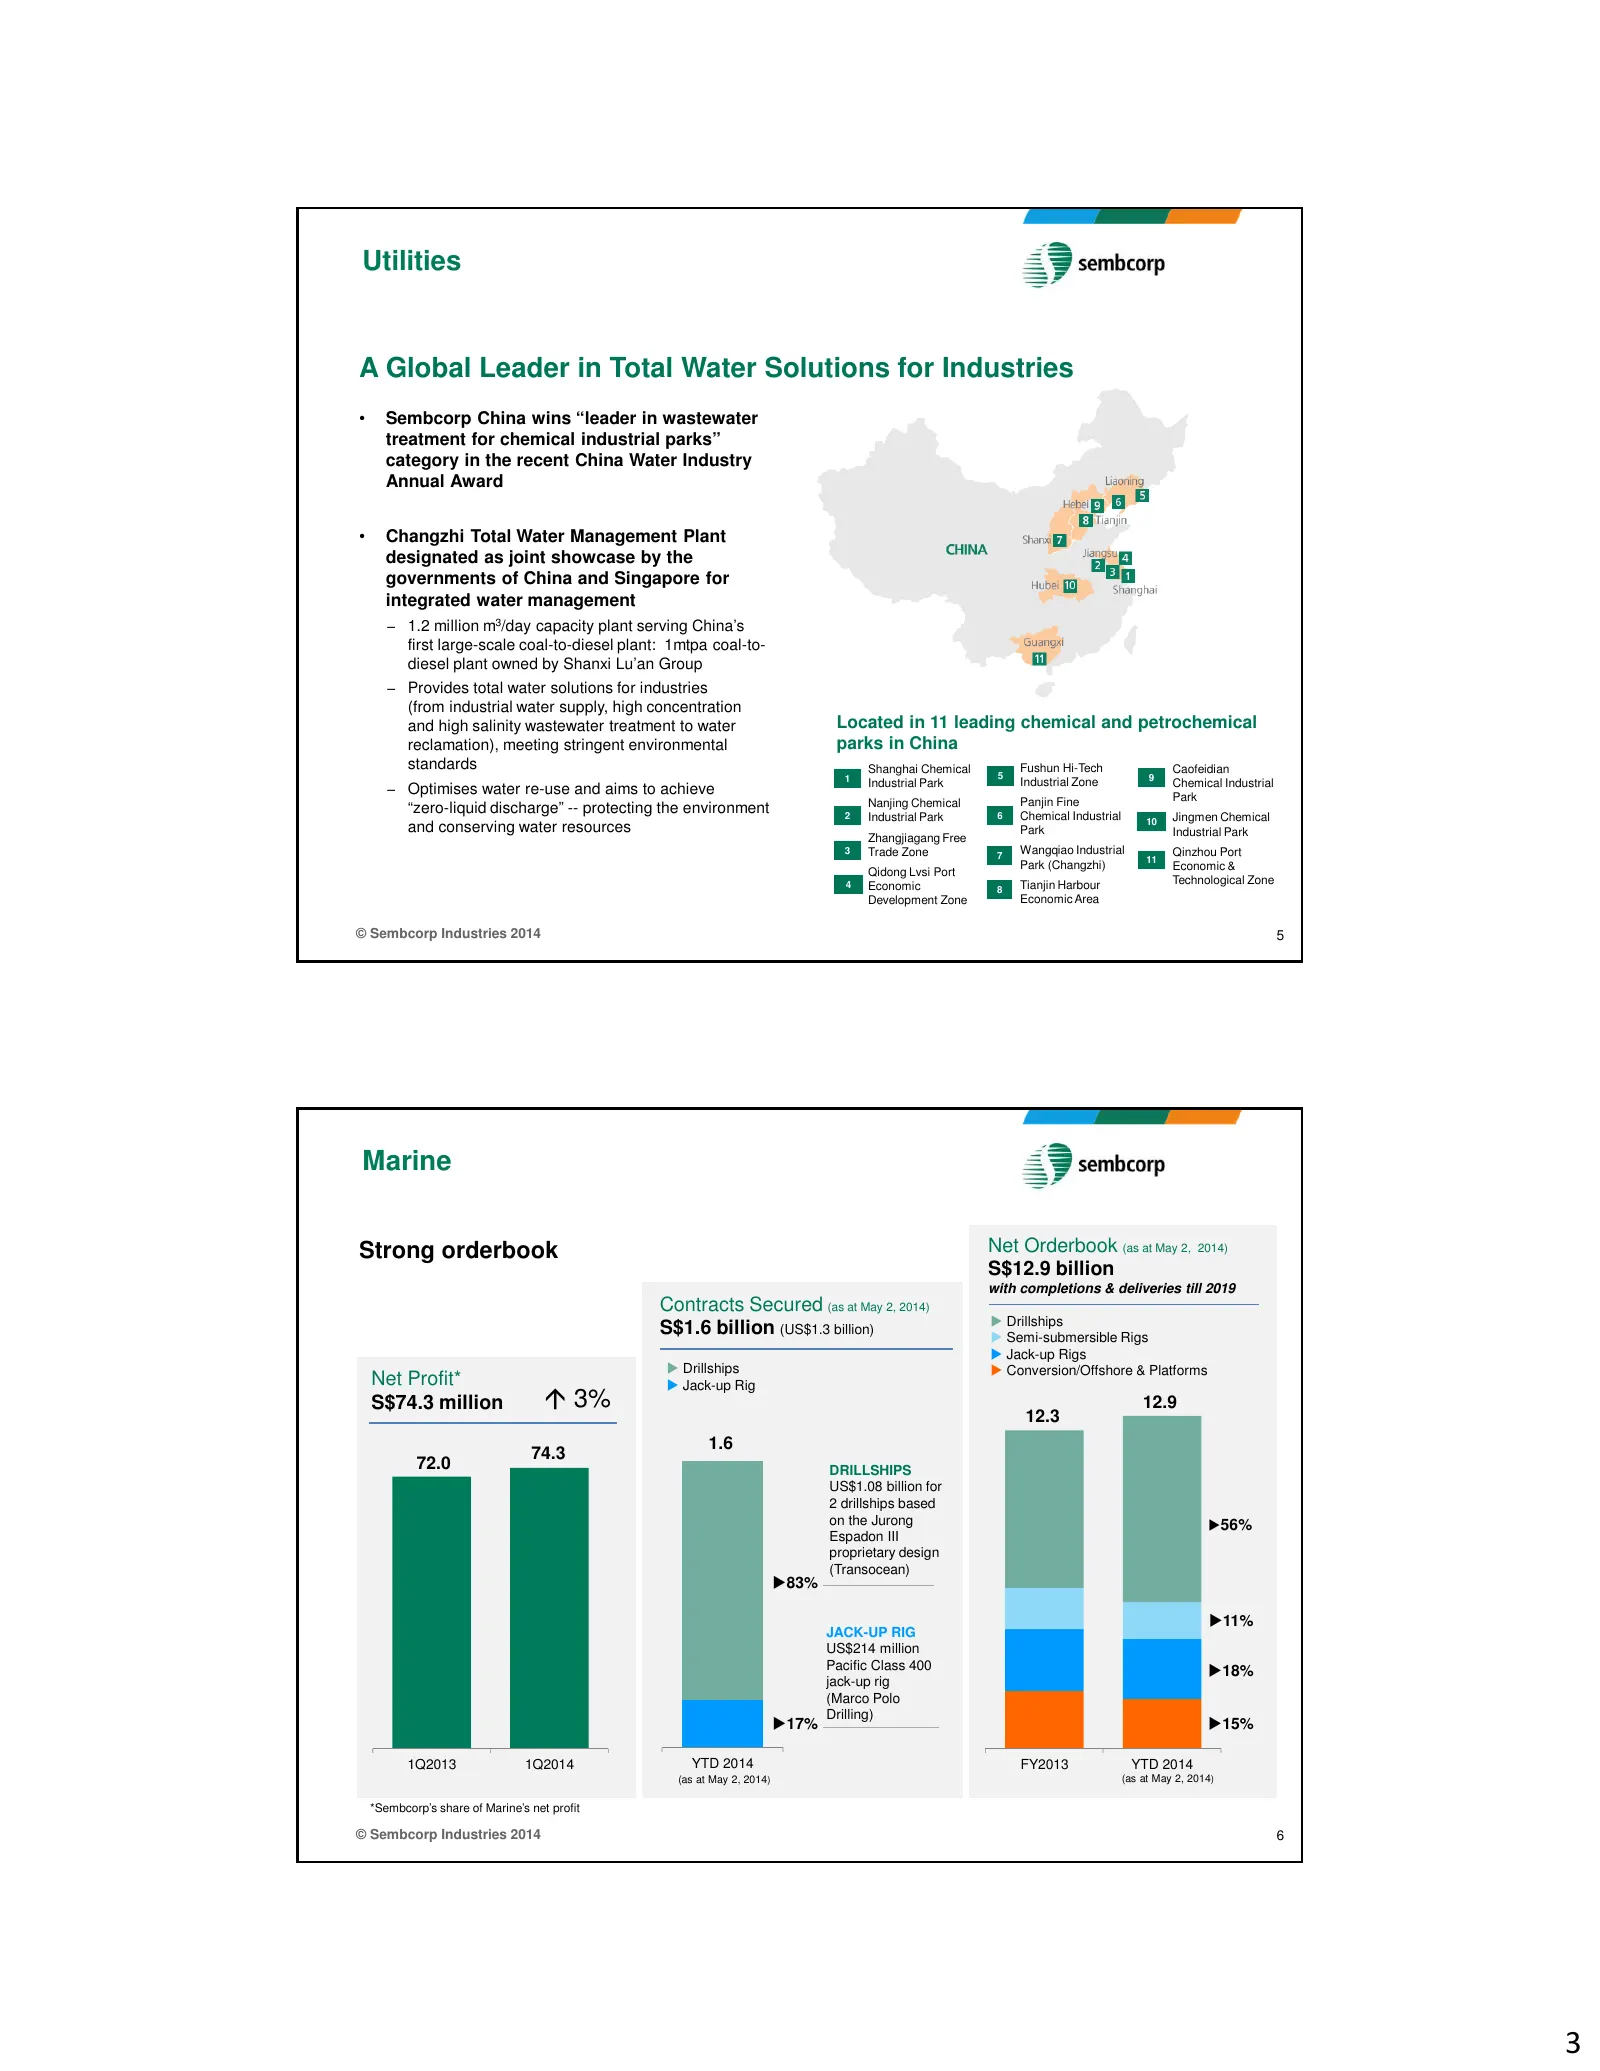
Utilities A Global Leader in Total Water Solutions for Industries • Sembcorp China wins “leader in wastewater treatment for chemical industrial parks” category in the recent China Water Industry Annual Award • Changzhi Total Water Management Plant designated as joint showcase by the governments of C
Slide 4: Urban Development: Strong Land Sales
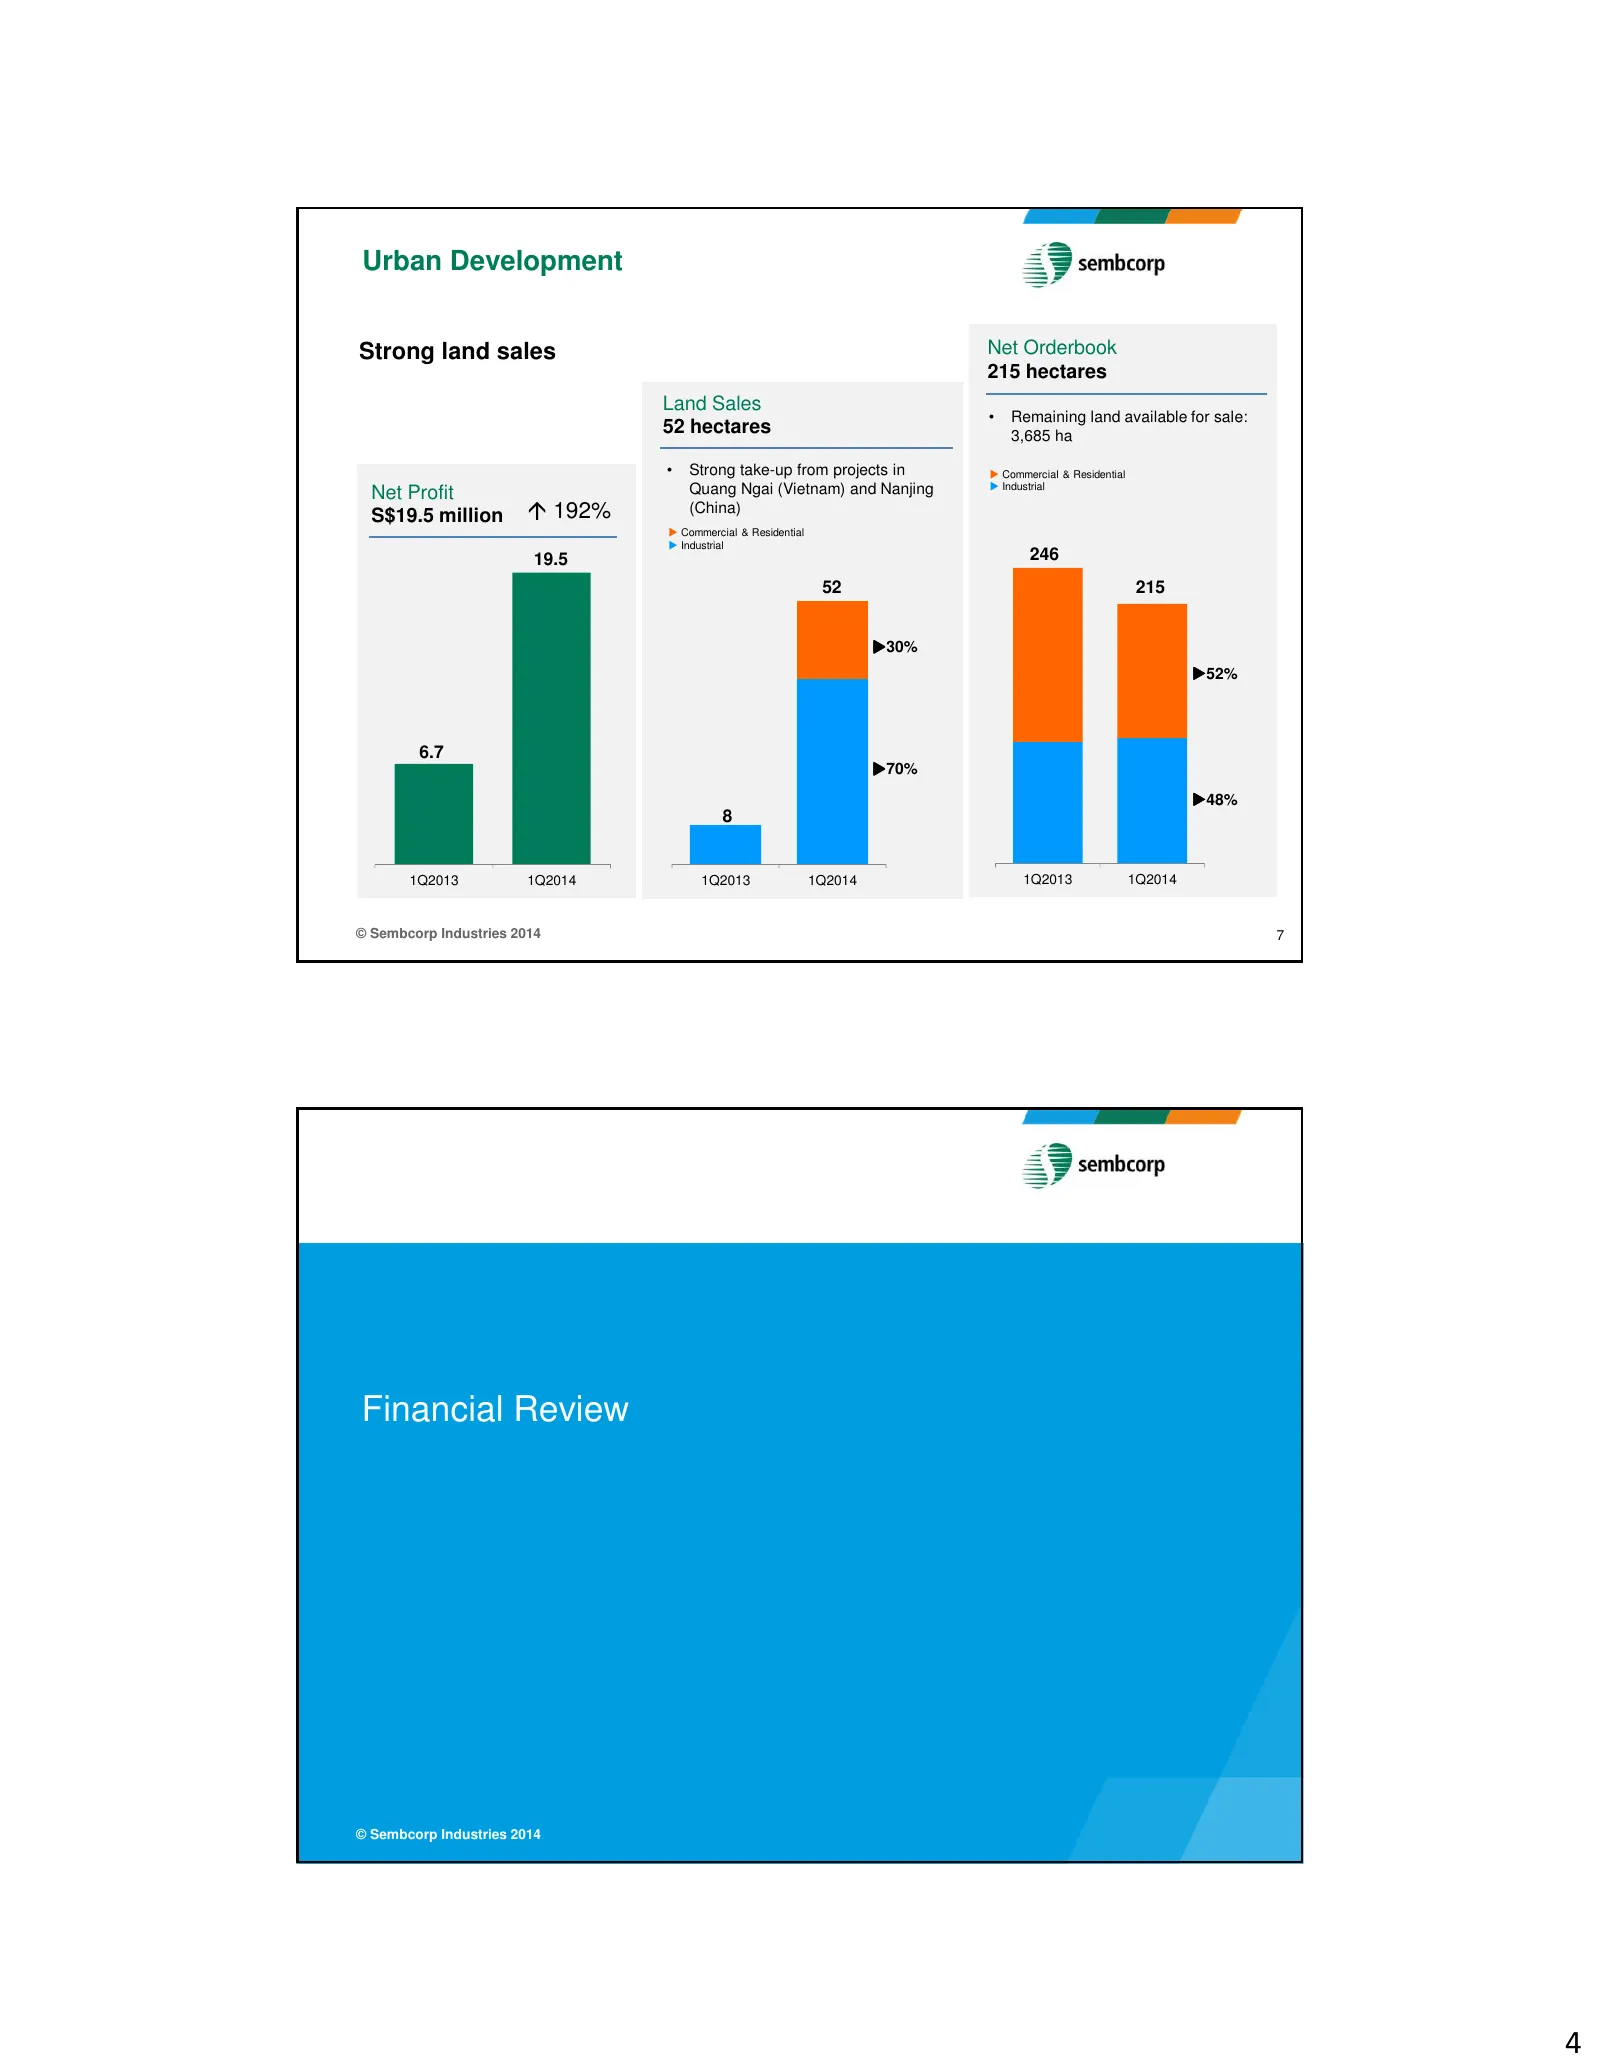
Urban Development Strong land sales Net Orderbook 215 hectares Land Sales • Remaining land available for sale: 52 hectares 3,685 ha • Strong take-up from projects in Commercial & Residential Net Profit Quang Ngai (Vietnam) and Nanjing Industrial S$19.5 million 192% (China) Commercial & Residential I
Slide 5: Group Profit & Loss and Turnover
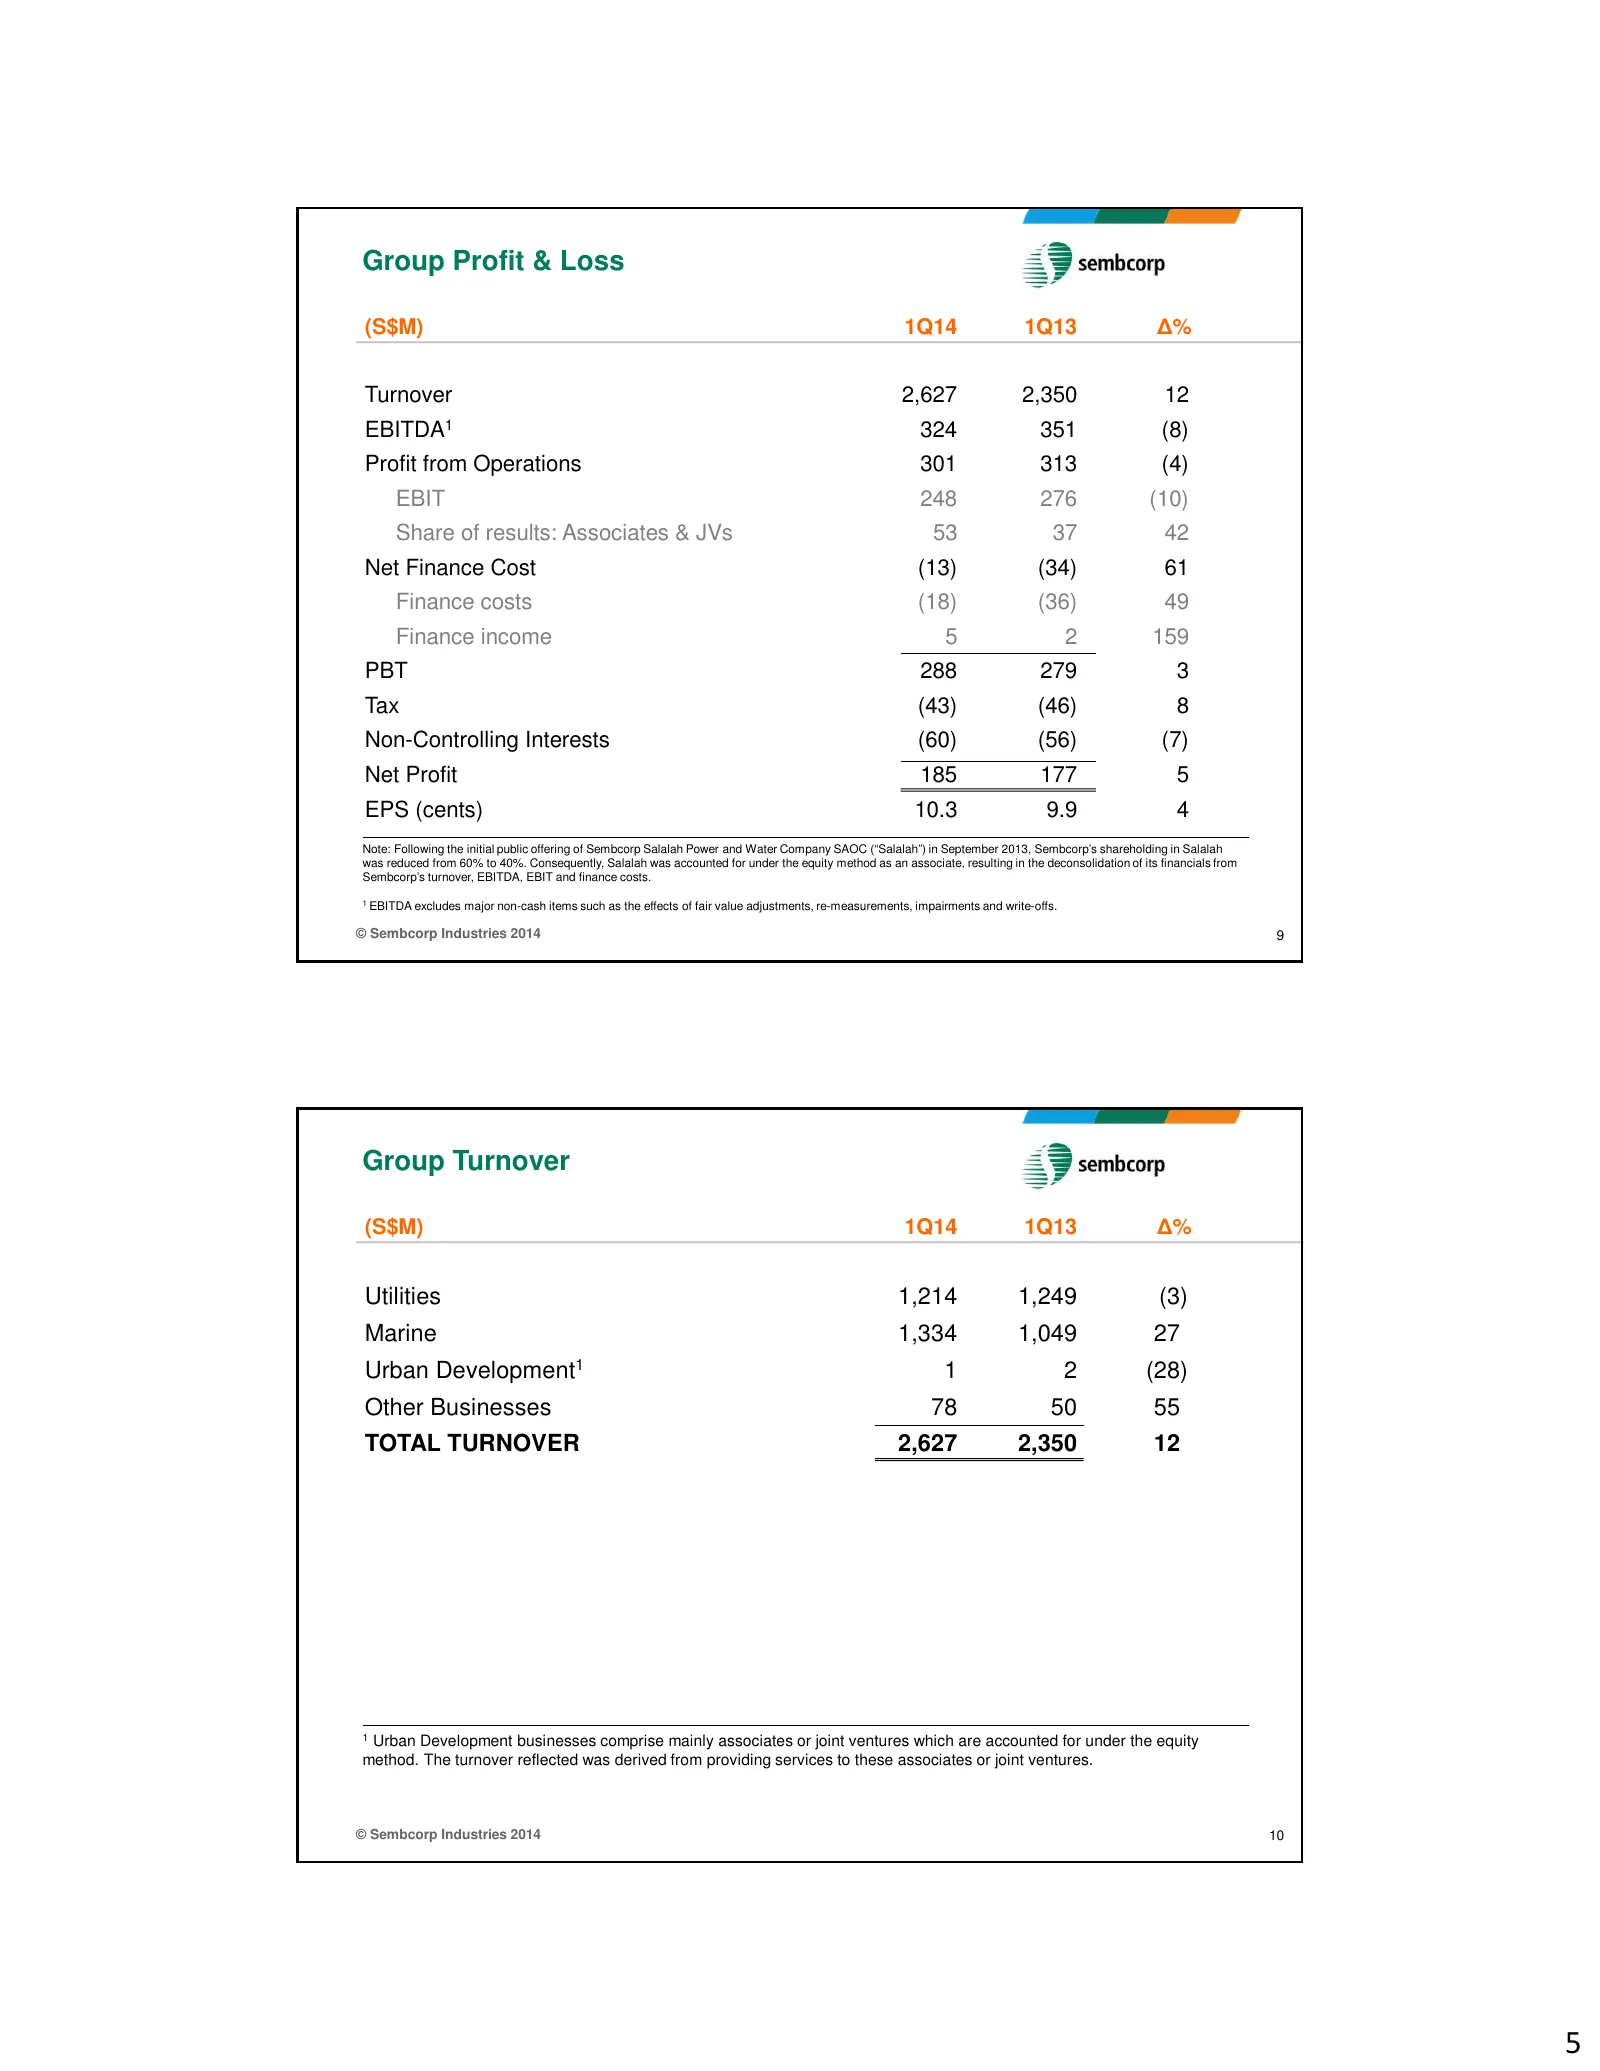
Group Profit & Loss (S$M) 1Q14 1Q13 ∆% Turnover 2,627 2,350 12 EBITDA1 324 351 (8) Profit from Operations 301 313 (4) EBIT 248 276 (10) Share of results: Associates & JVs 53 37 42 Net Finance Cost (13) (34) 61 Finance costs (18) (36) 49 Finance income 5 2 159 PBT 288 279 3 Tax (43) (46) 8 Non-Contro
Slide 6: Group Profit from Operations and Net Profit
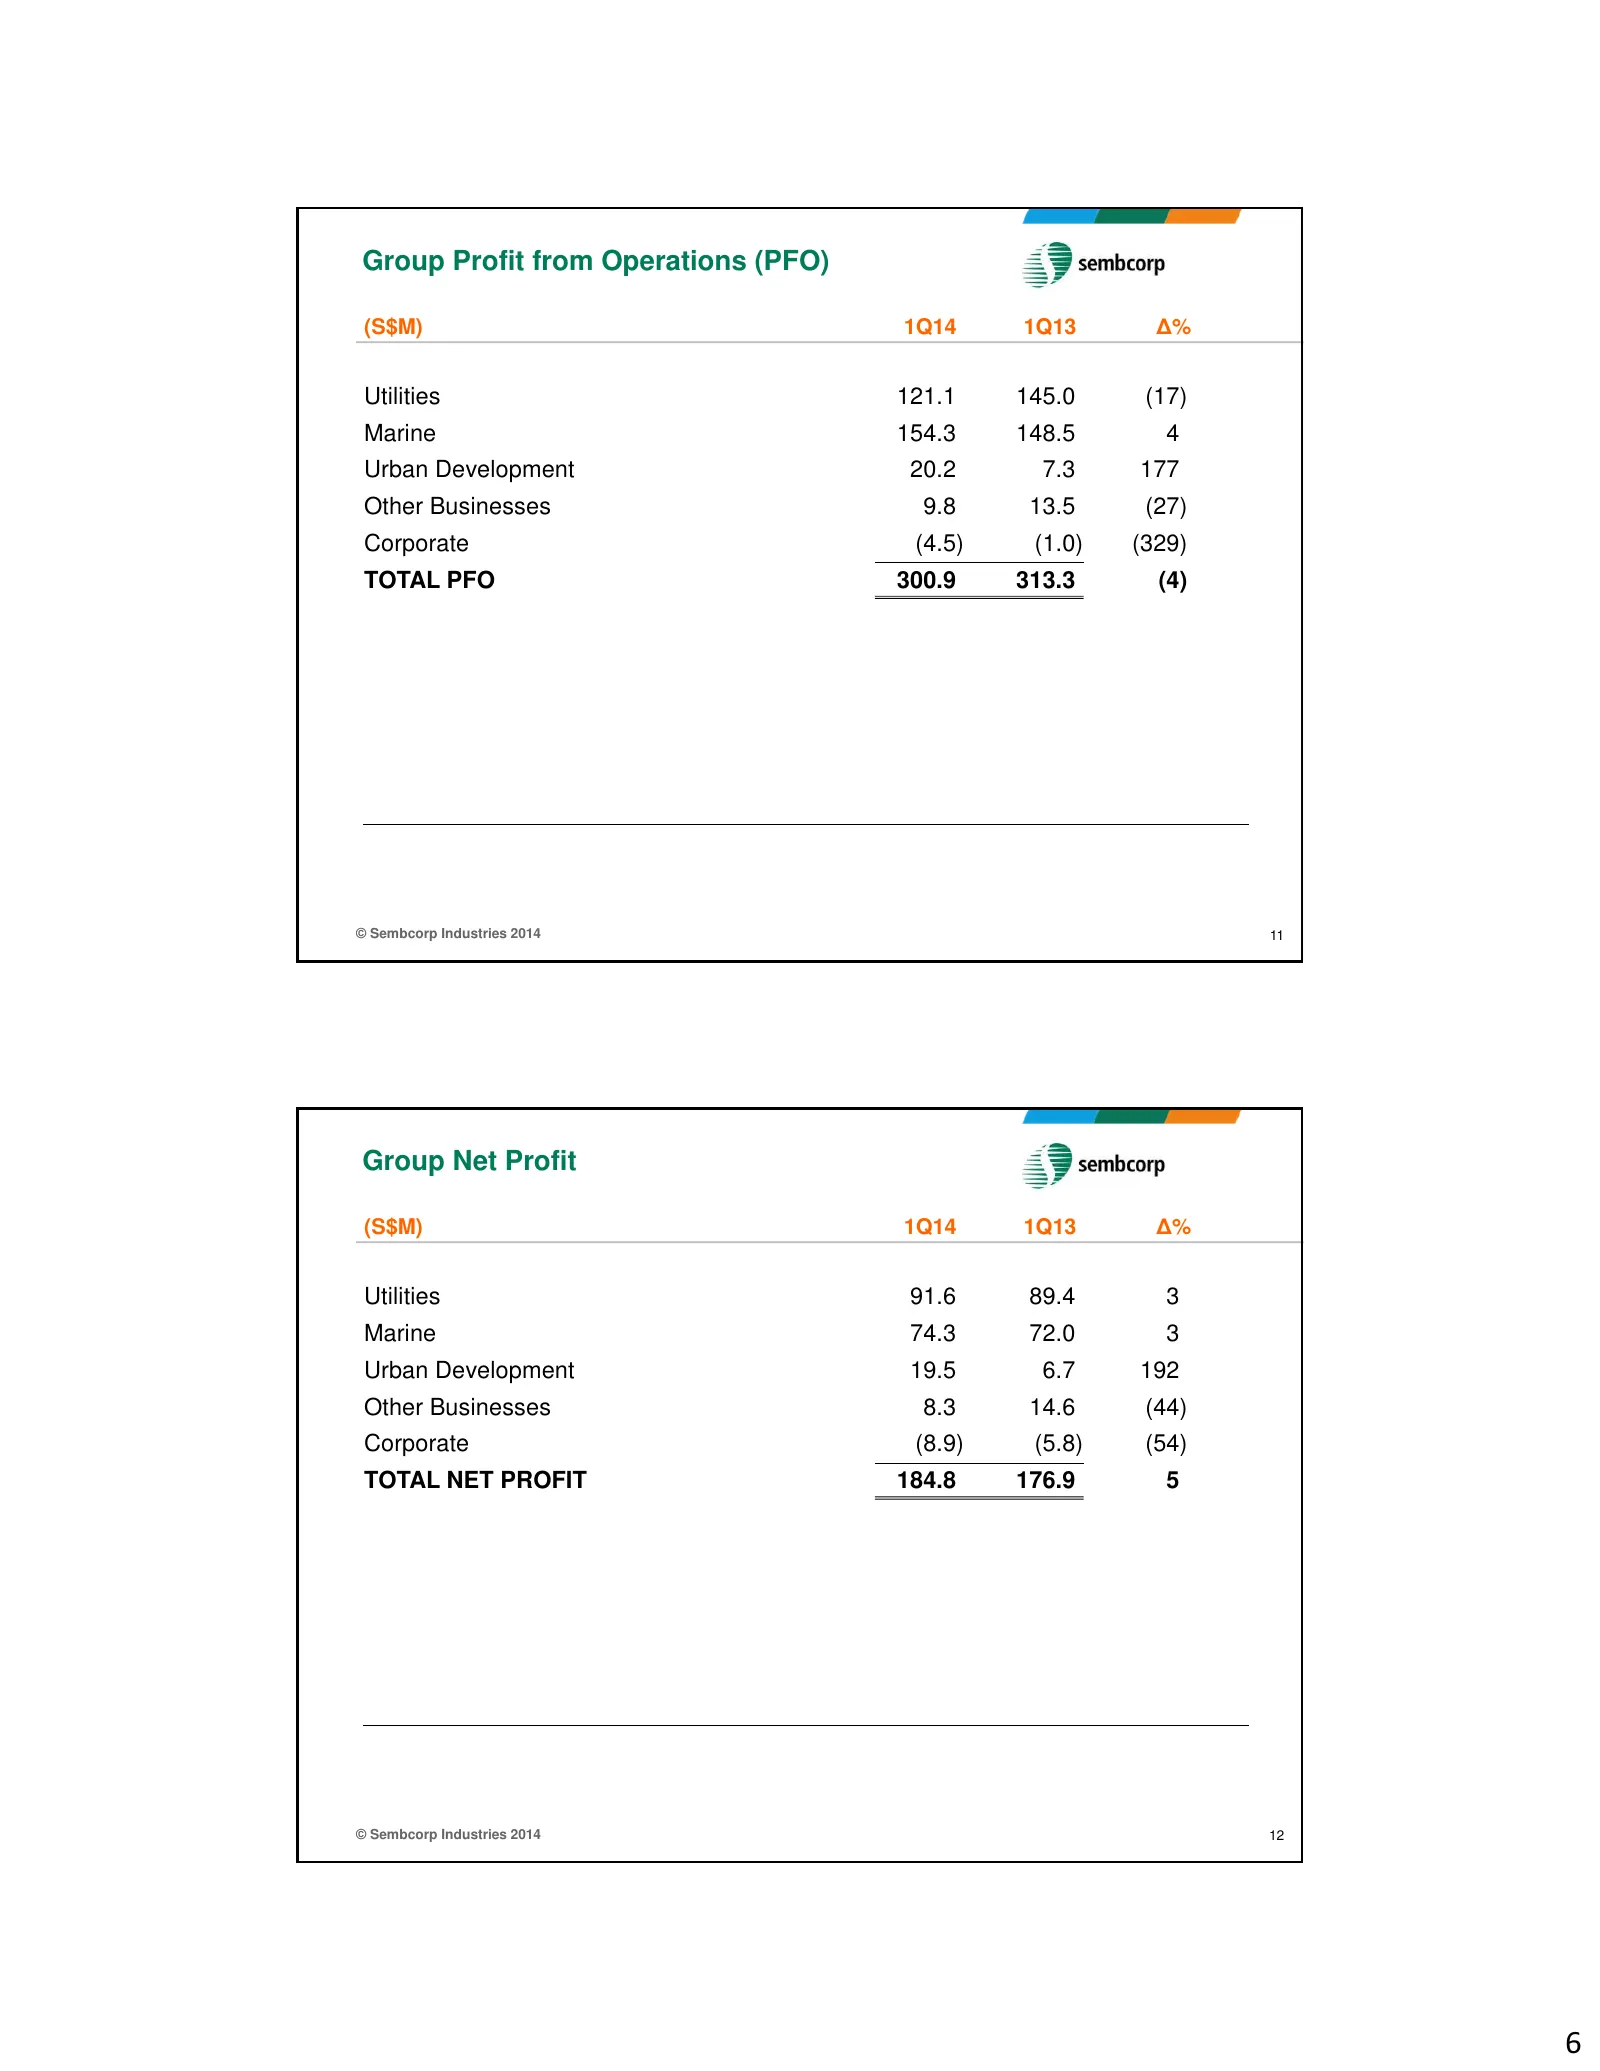
Group Profit from Operations (PFO) (S$M) 1Q14 1Q13 ∆% Utilities 121.1 145.0 (17) Marine 154.3 148.5 4 Urban Development 20.2 7.3 177 Other Businesses 9.8 13.5 (27) Corporate (4.5) (1.0) (329) TOTAL PFO 300.9 313.3 (4) © Sembcorp Industries 2014 11 Group Net Profit (S$M) 1Q14 1Q13 ∆% Utilities 91.6 8
Slide 7: Utilities Net Profit by Geography and Segment
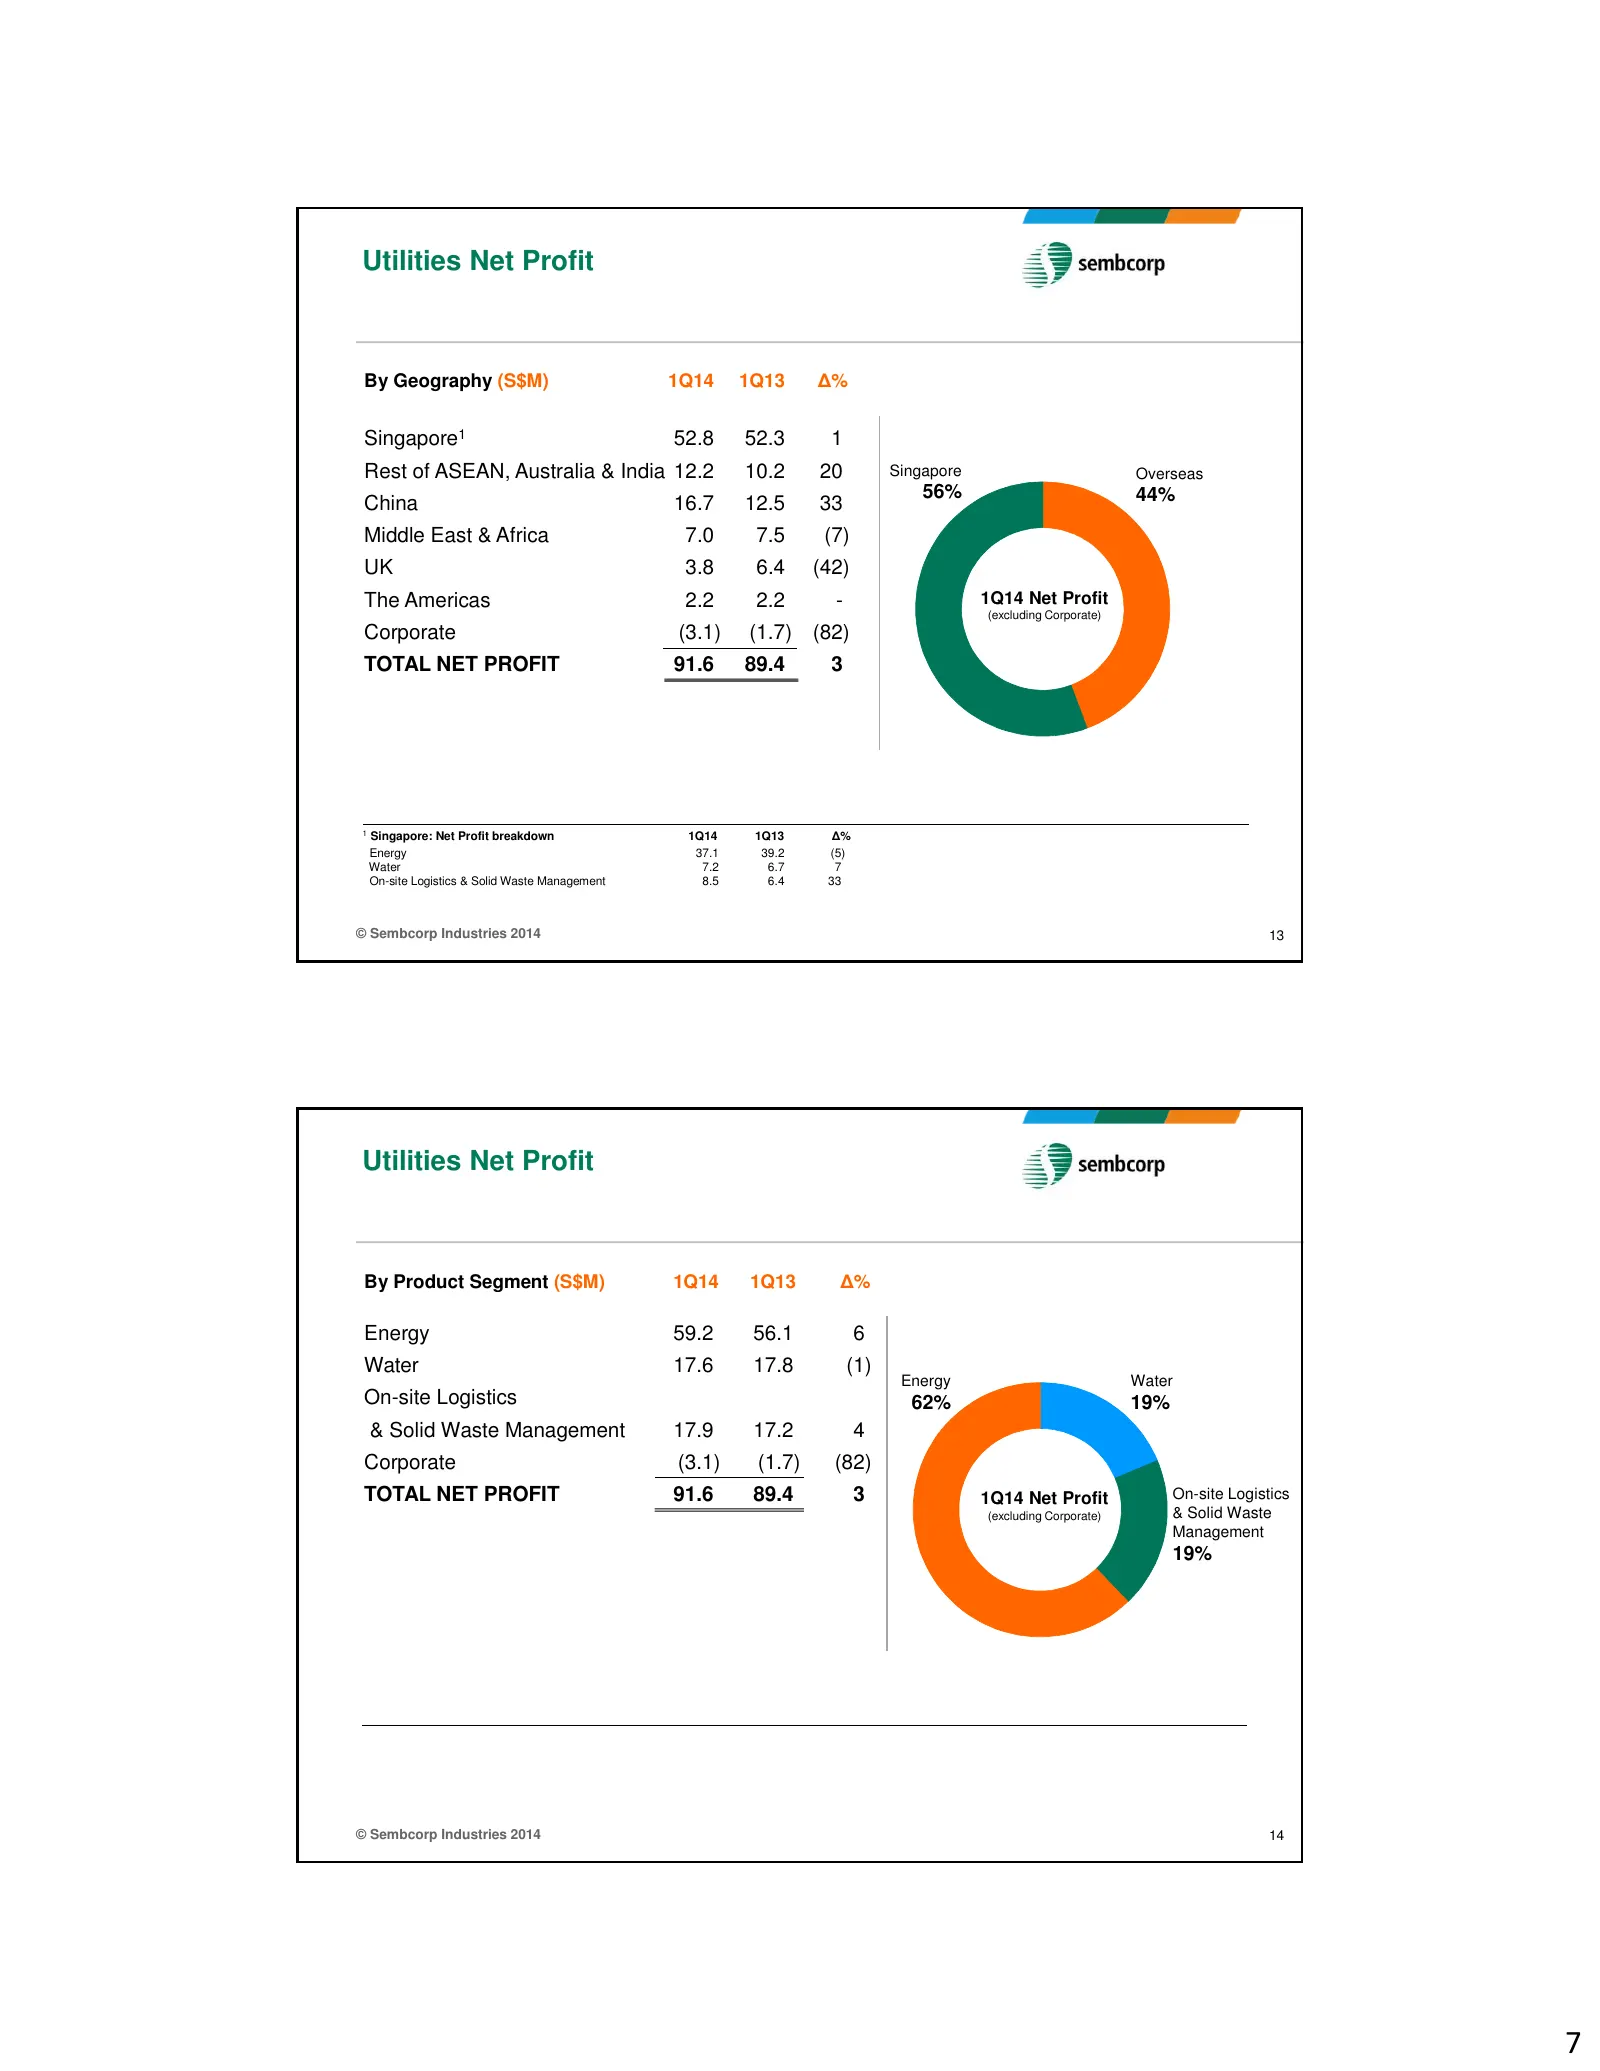
Utilities Net Profit By Geography (S$M) 1Q14 1Q13 ∆% Singapore1 52.8 52.3 1 Rest of ASEAN, Australia & India 12.2 10.2 20 Singapore Overseas 56% 44% China 16.7 12.5 33 Middle East & Africa 7.0 7.5 (7) UK 3.8 6.4 (42) The Americas 2.2 2.2 - 1Q14 Net Profit (excluding Corporate) Corporate (3.1) (1.7)
Slide 8: Group Capex, Equity Investment and Free Cash Flow
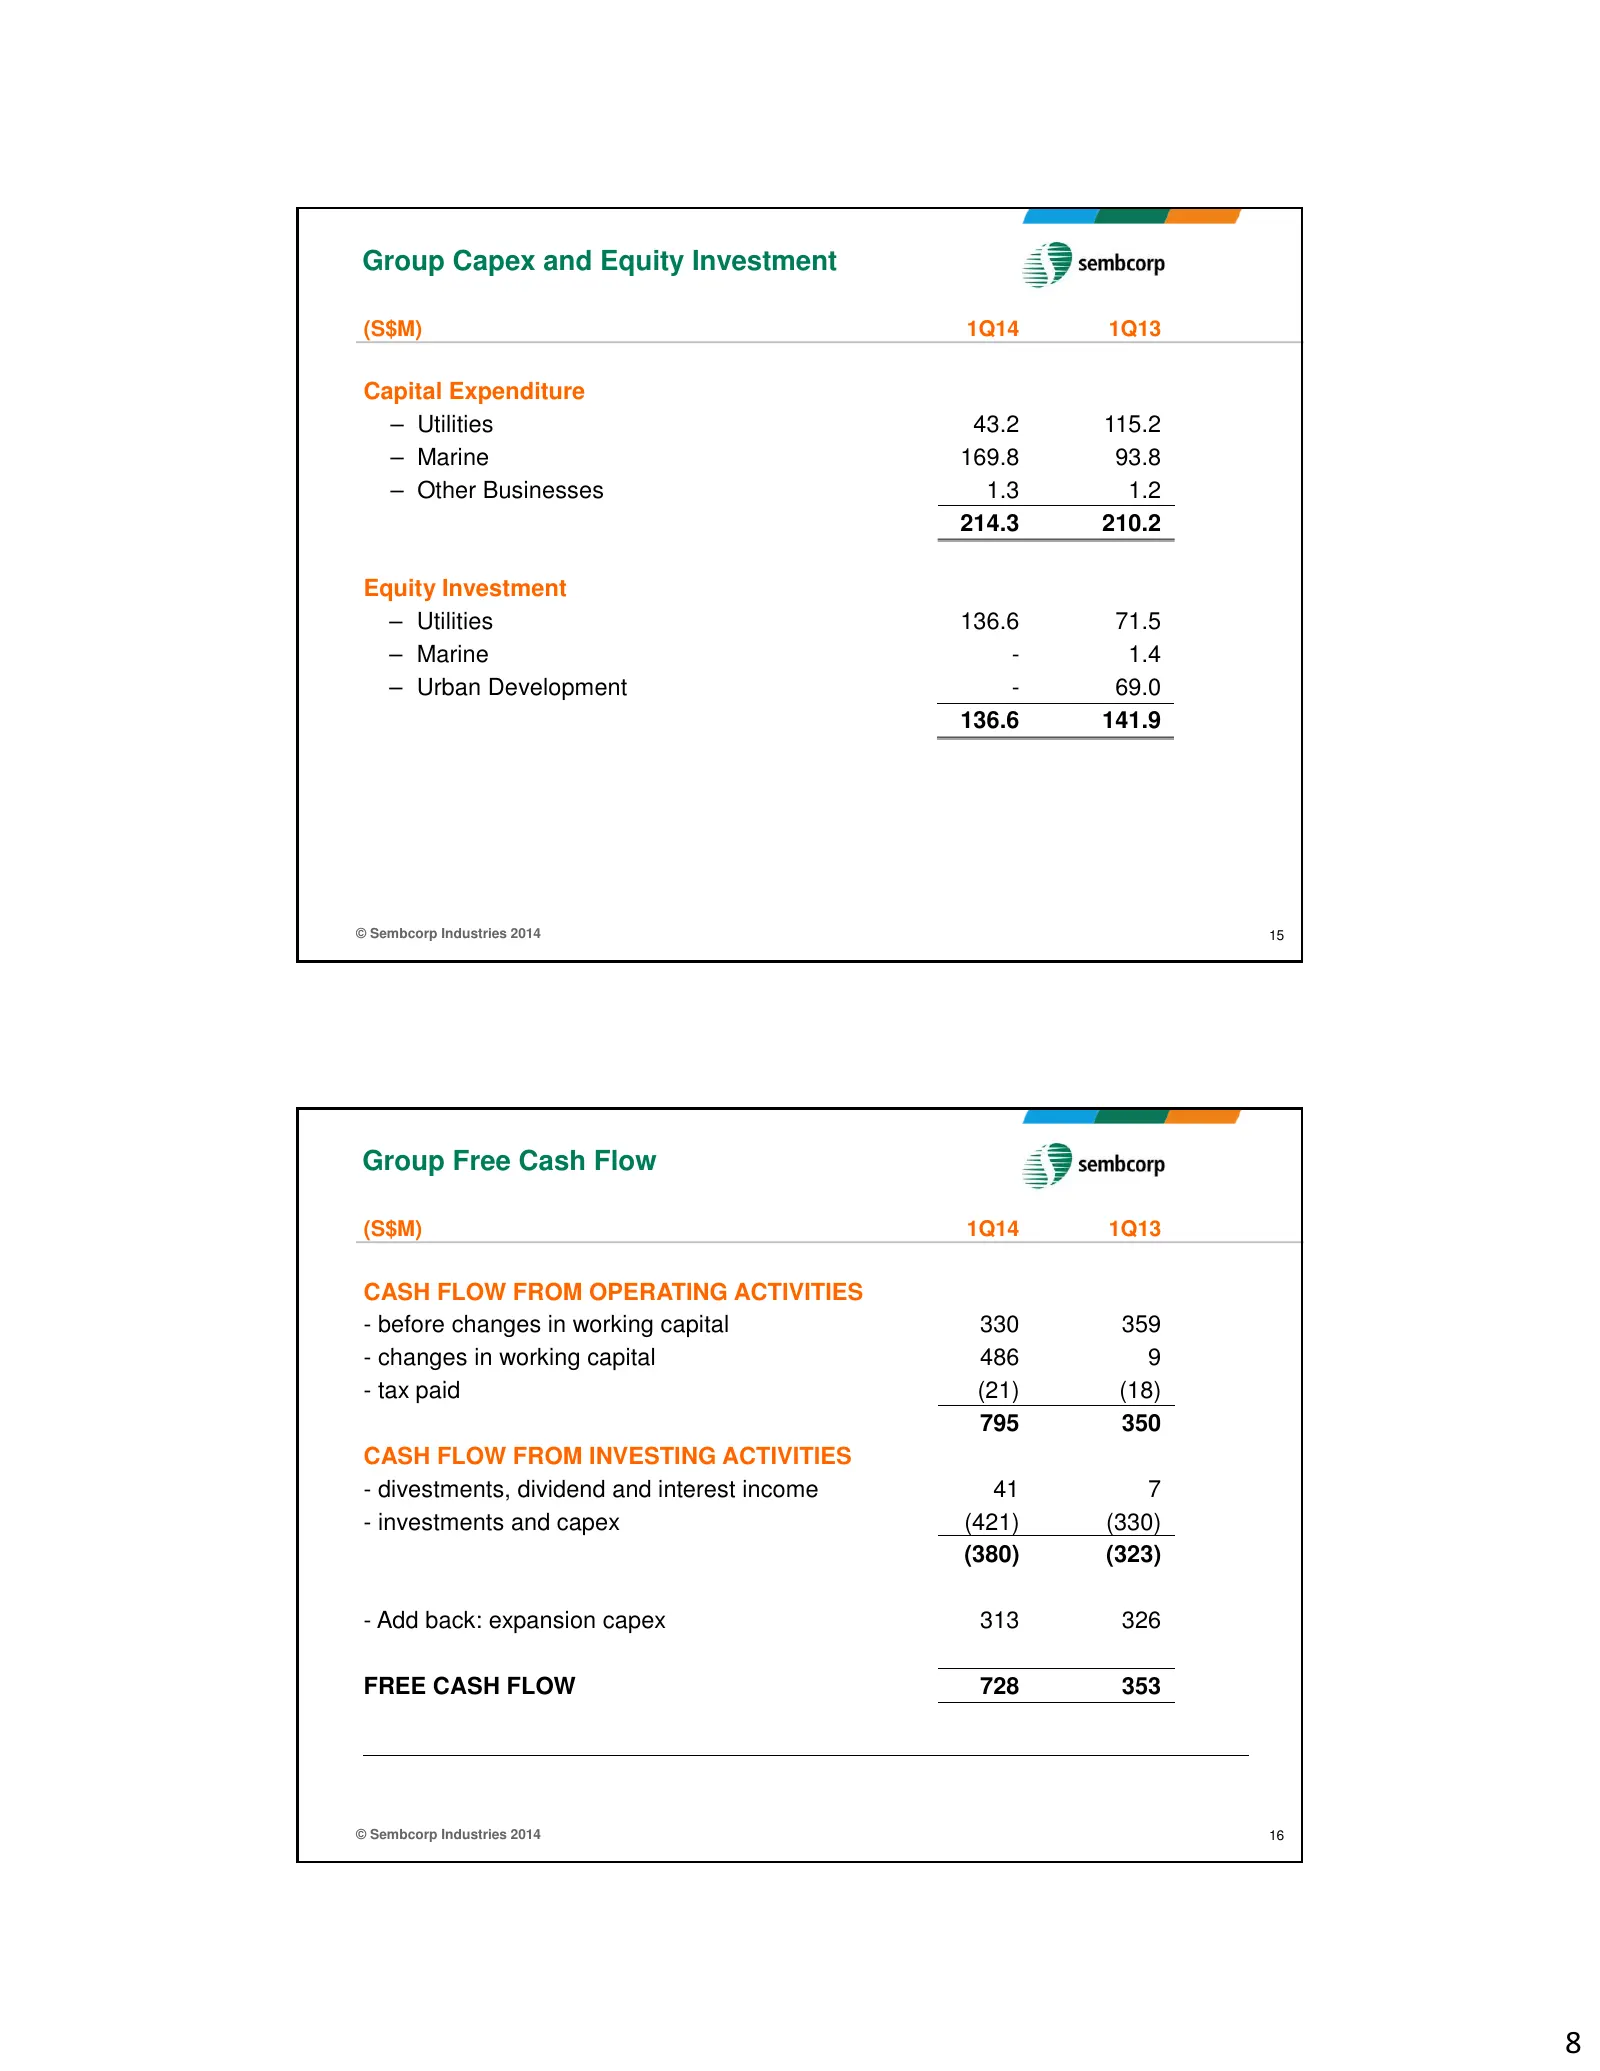
Group Capex and Equity Investment (S$M) 1Q14 1Q13 Capital Expenditure – Utilities 43.2 115.2 – Marine 169.8 93.8 – Other Businesses 1.3 1.2 214.3 210.2 Equity Investment – Utilities 136.6 71.5 – Marine - 1.4 – Urban Development - 69.0 136.6 141.9 © Sembcorp Industries 2014 15 Group Free Cash Flow (S
Slide 9: Group Borrowings
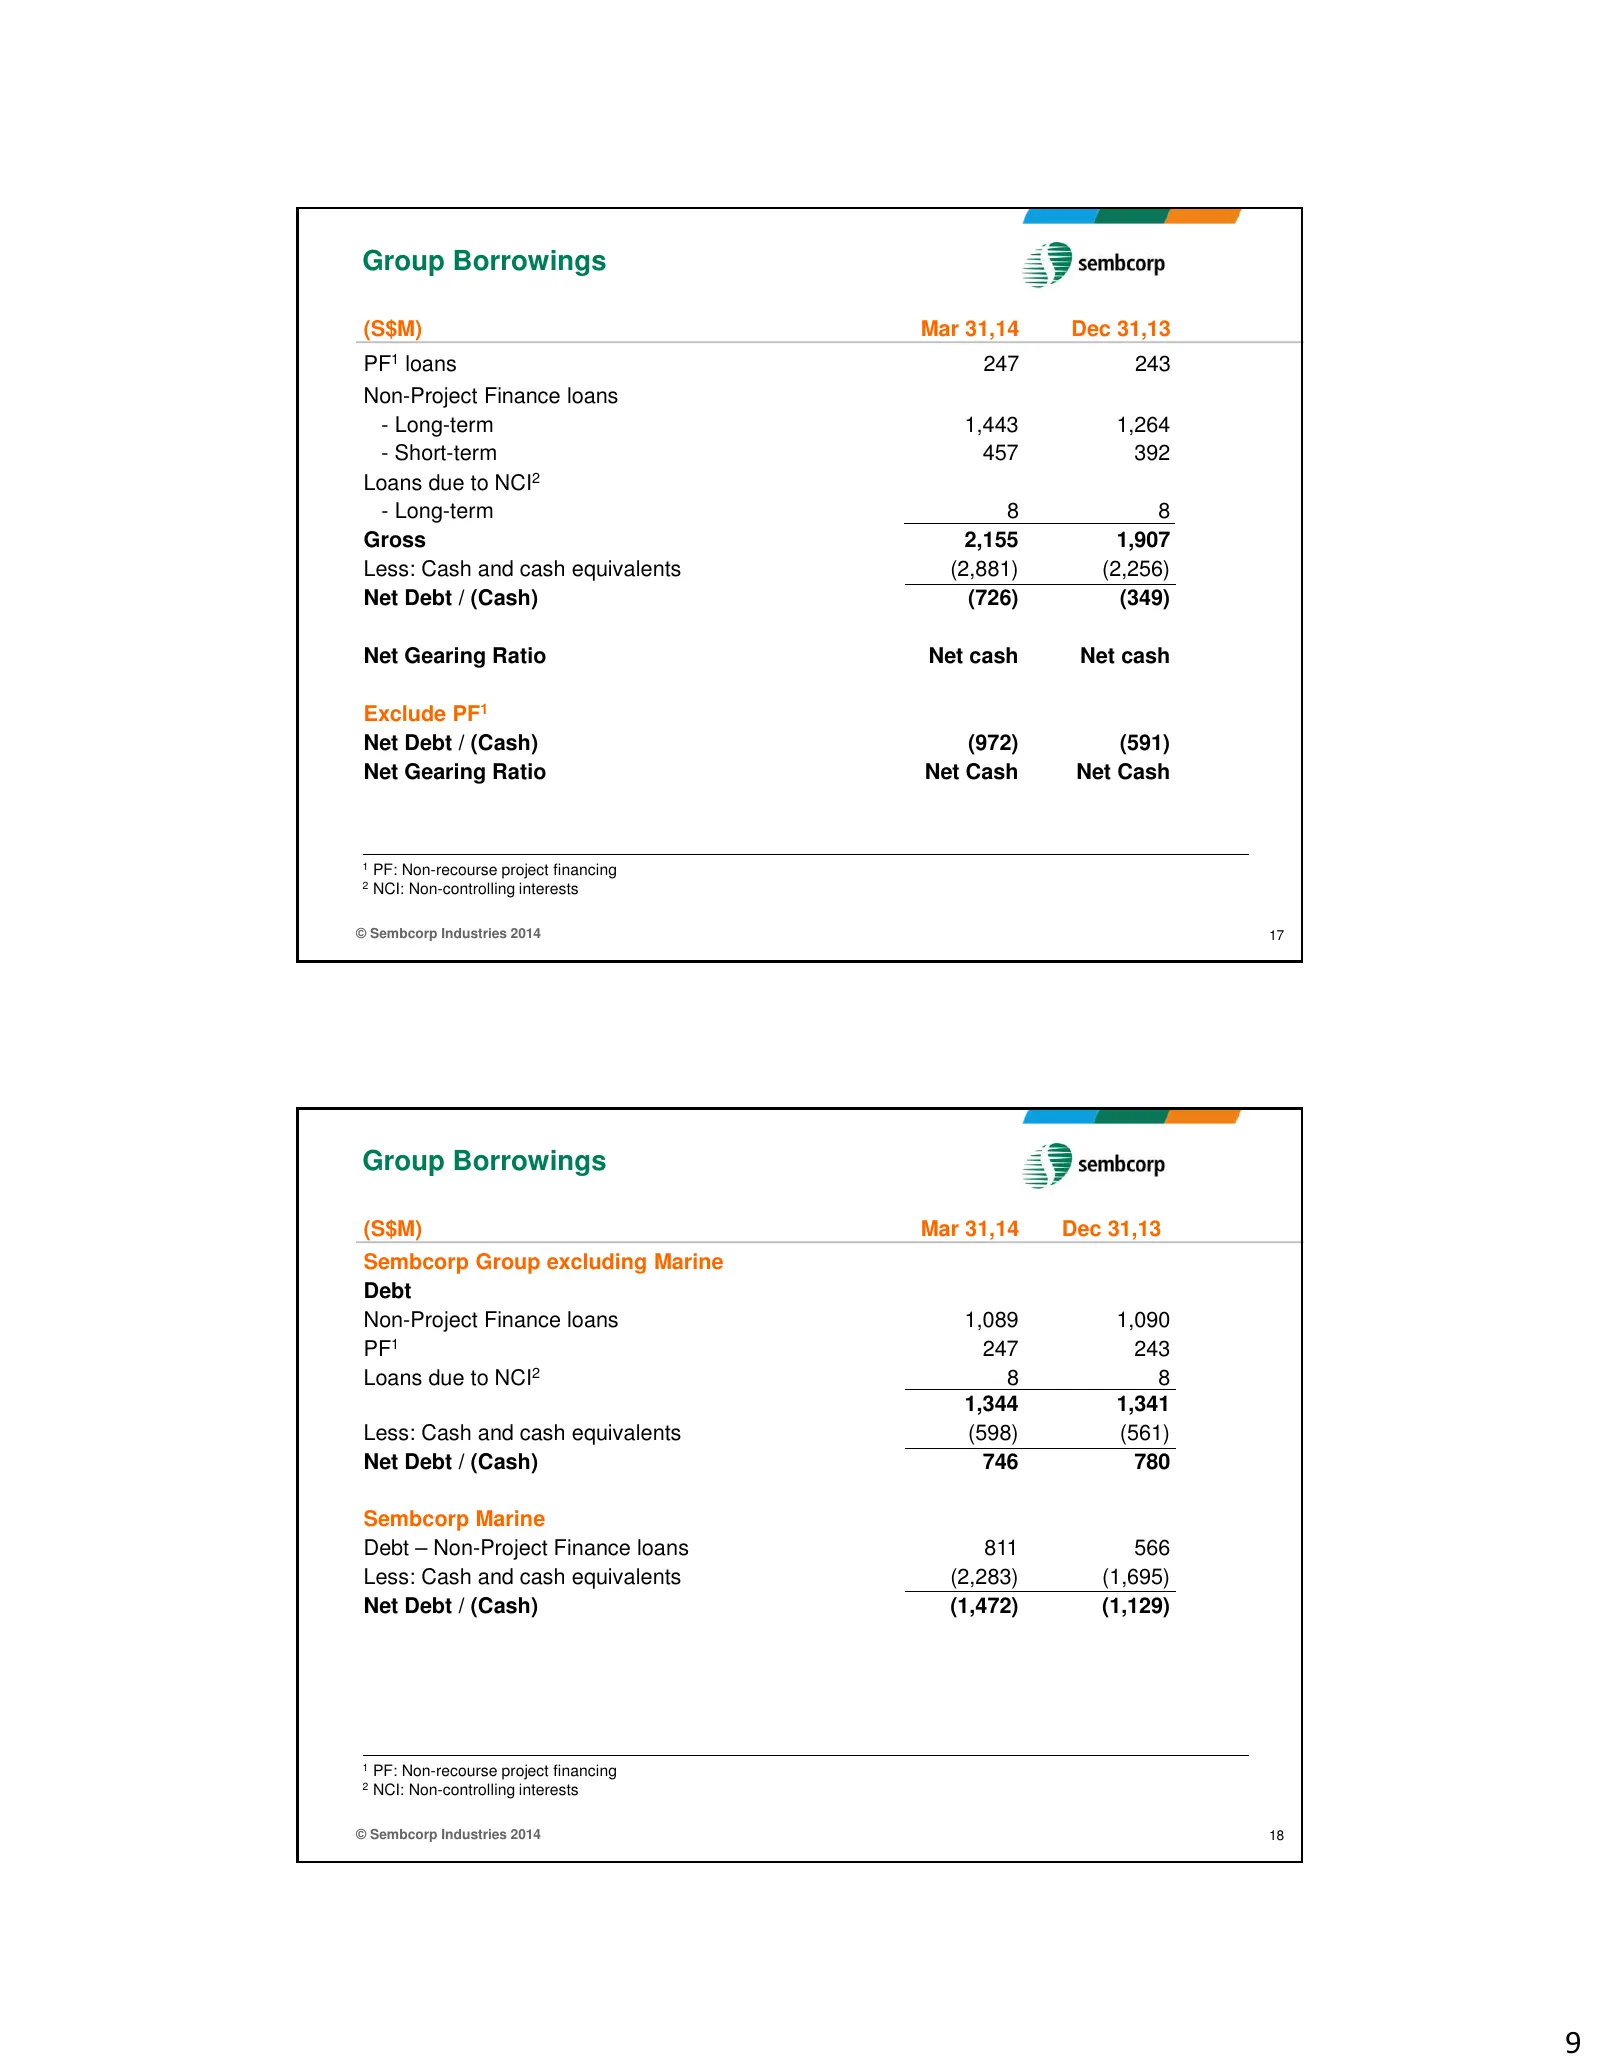
Group Borrowings (S$M) Mar 31,14 Dec 31,13 PF1 loans 247 243 Non-Project Finance loans - Long-term 1,443 1,264 - Short-term 457 392 Loans due to NCI2 - Long-term 8 8 Gross 2,155 1,907 Less: Cash and cash equivalents (2,881) (2,256) Net Debt / (Cash) (726) (349) Net Gearing Ratio Net cash Net cash Ex
Slide 10: Financial Indicators and Group Outlook
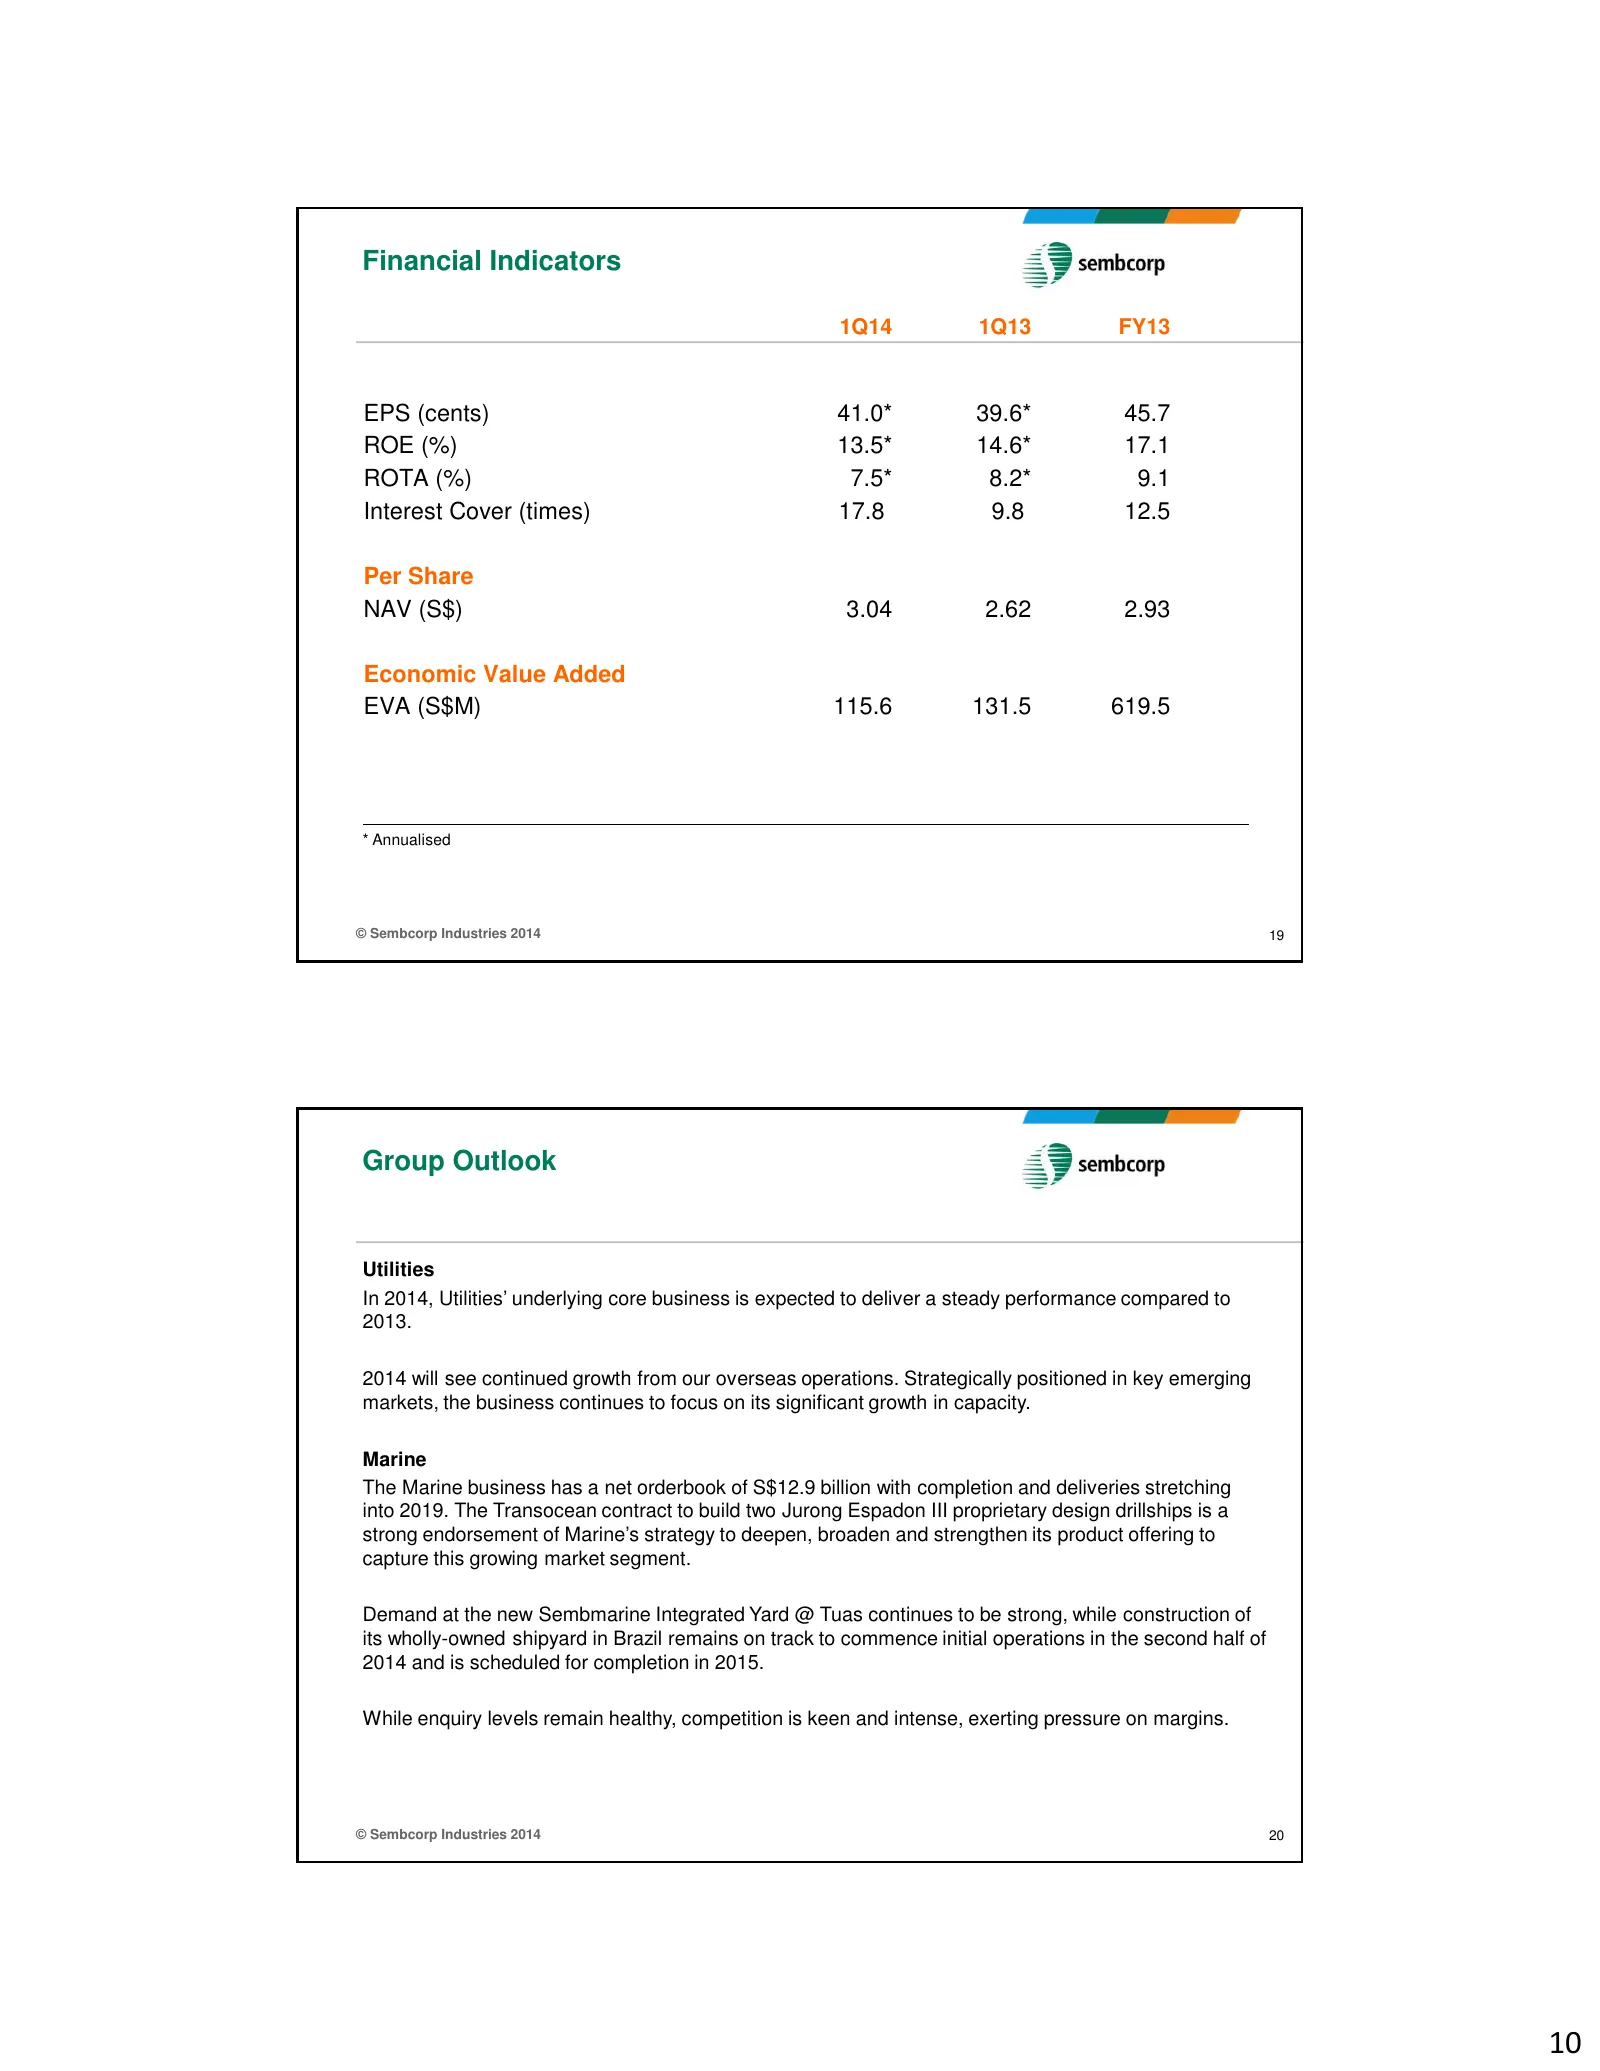
Financial Indicators 1Q14 1Q13 FY13 EPS (cents) 41.0* 39.6* 45.7 ROE (%) 13.5* 14.6* 17.1 ROTA (%) 7.5* 8.2* 9.1 Interest Cover (times) 17.8 9.8 12.5 Per Share NAV (S$) 3.04 2.62 2.93 Economic Value Added EVA (S$M) 115.6 131.5 619.5 * Annualised © Sembcorp Industries 2014 19 Group Outlook Utilities
Slide 11: Outlook: Vital Partners. Essential Solutions.
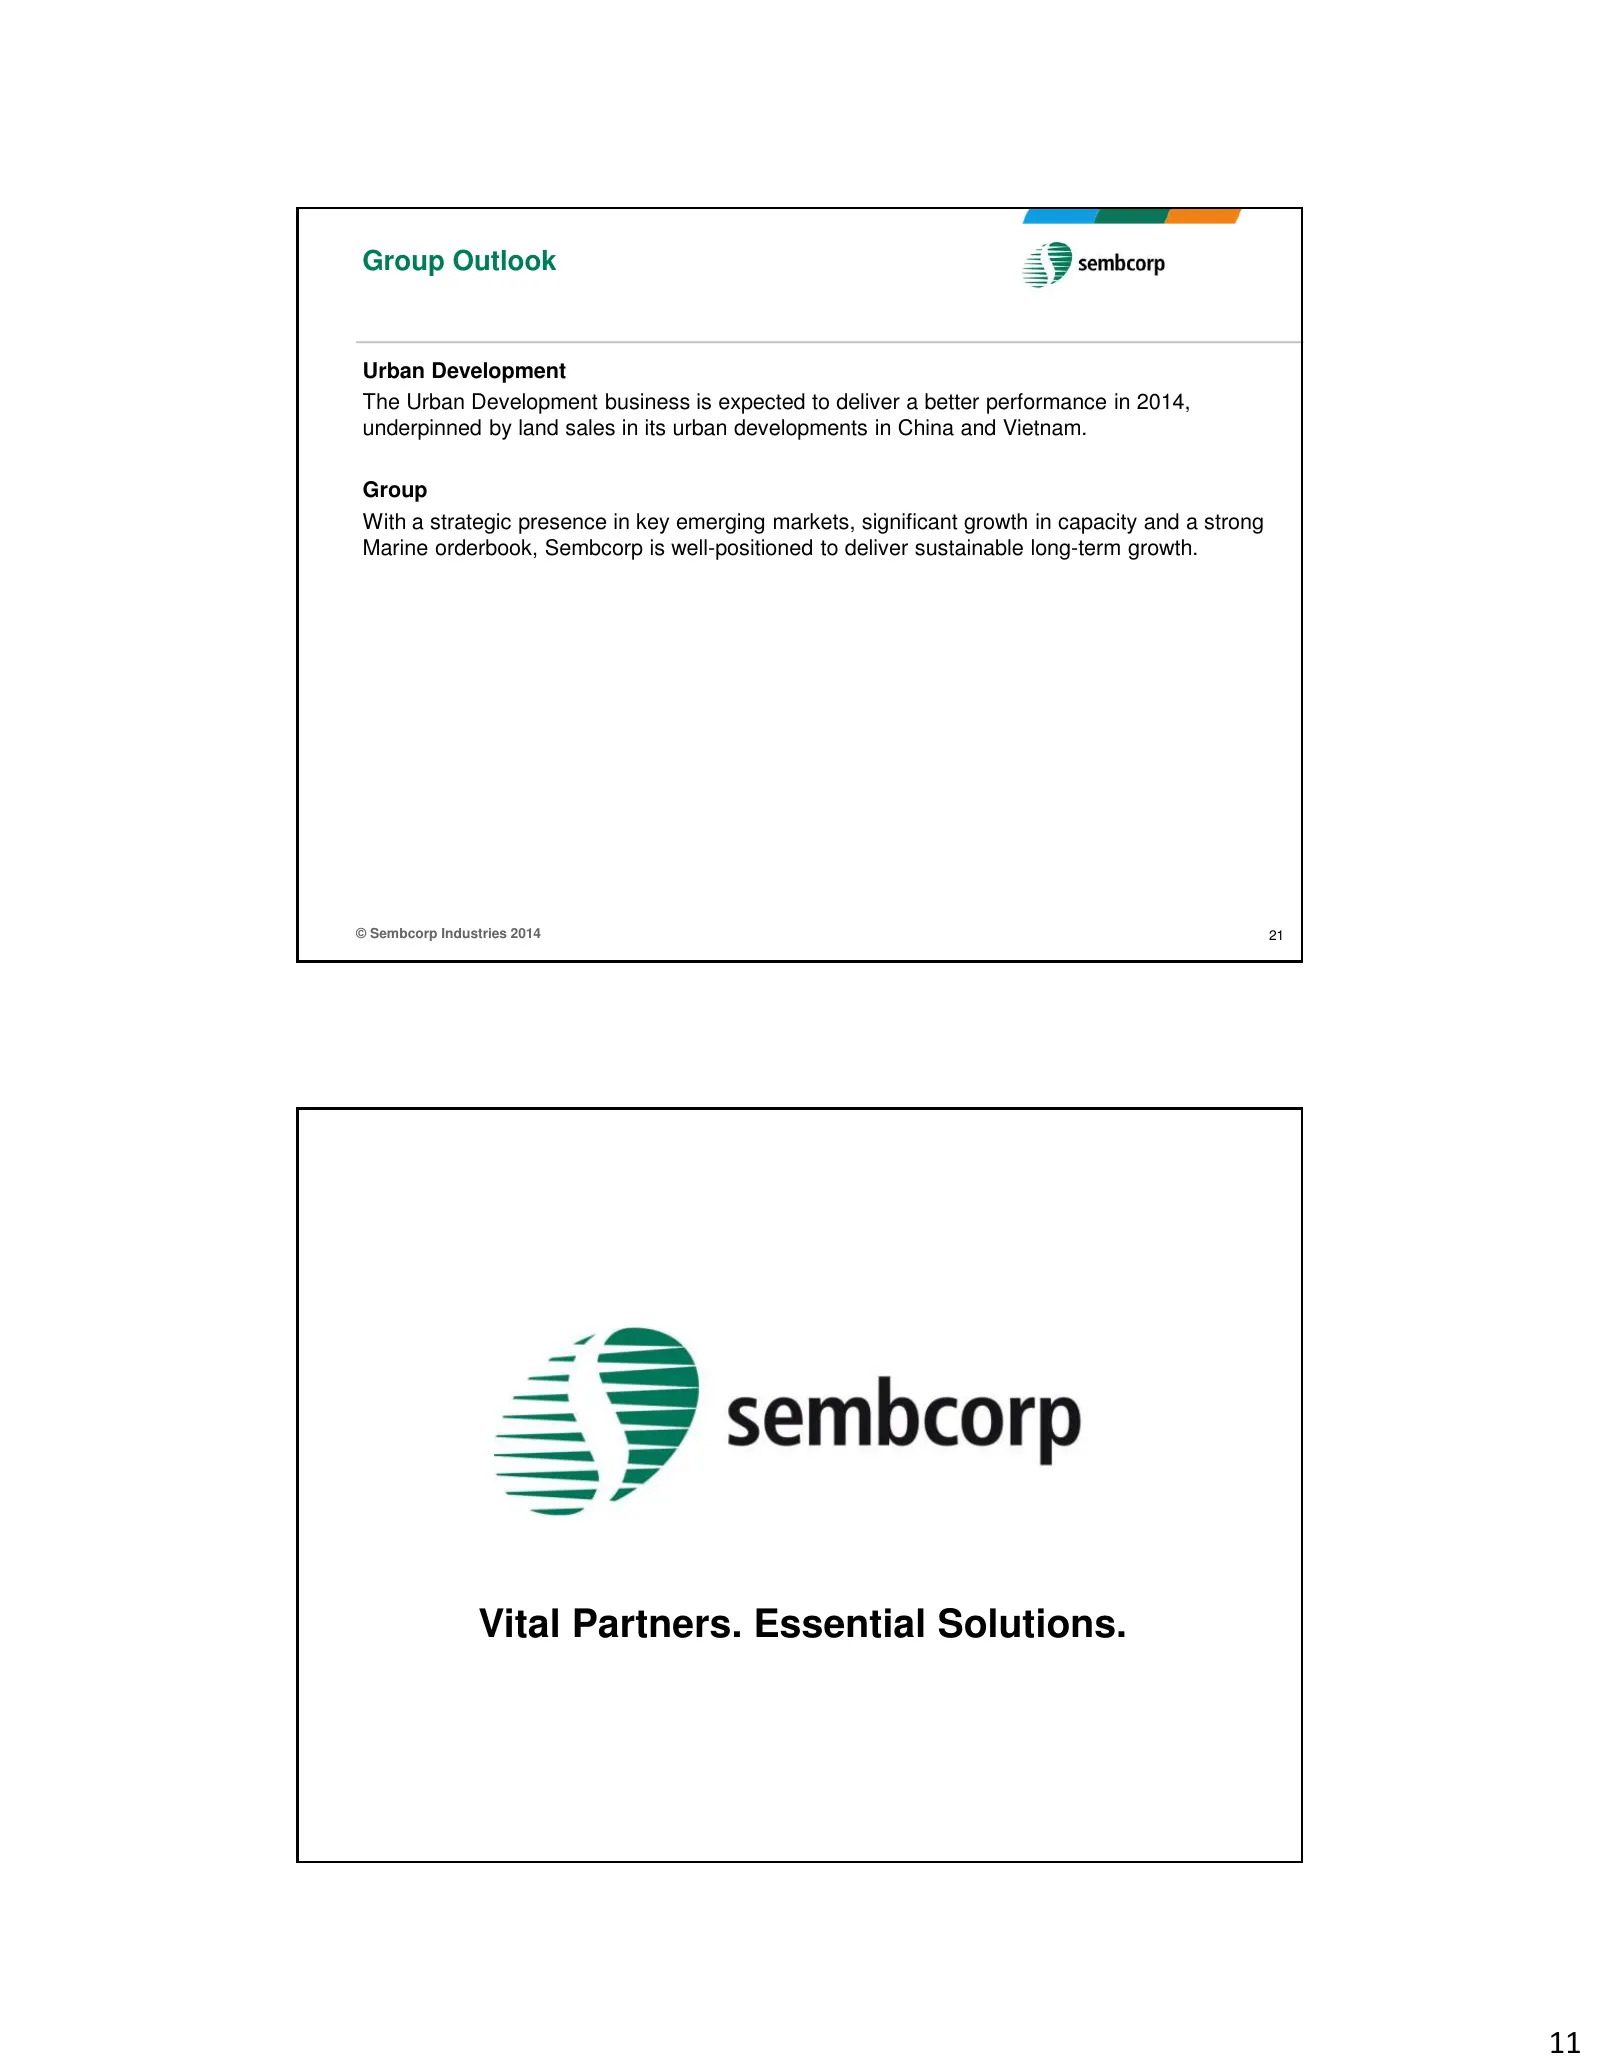
Group Outlook Urban Development The Urban Development business is expected to deliver a better performance in 2014, underpinned by land sales in its urban developments in China and Vietnam. Group With a strategic presence in key emerging markets, significant growth in capacity and a strong Marine or
Slide 12: Appendix: Disclaimer
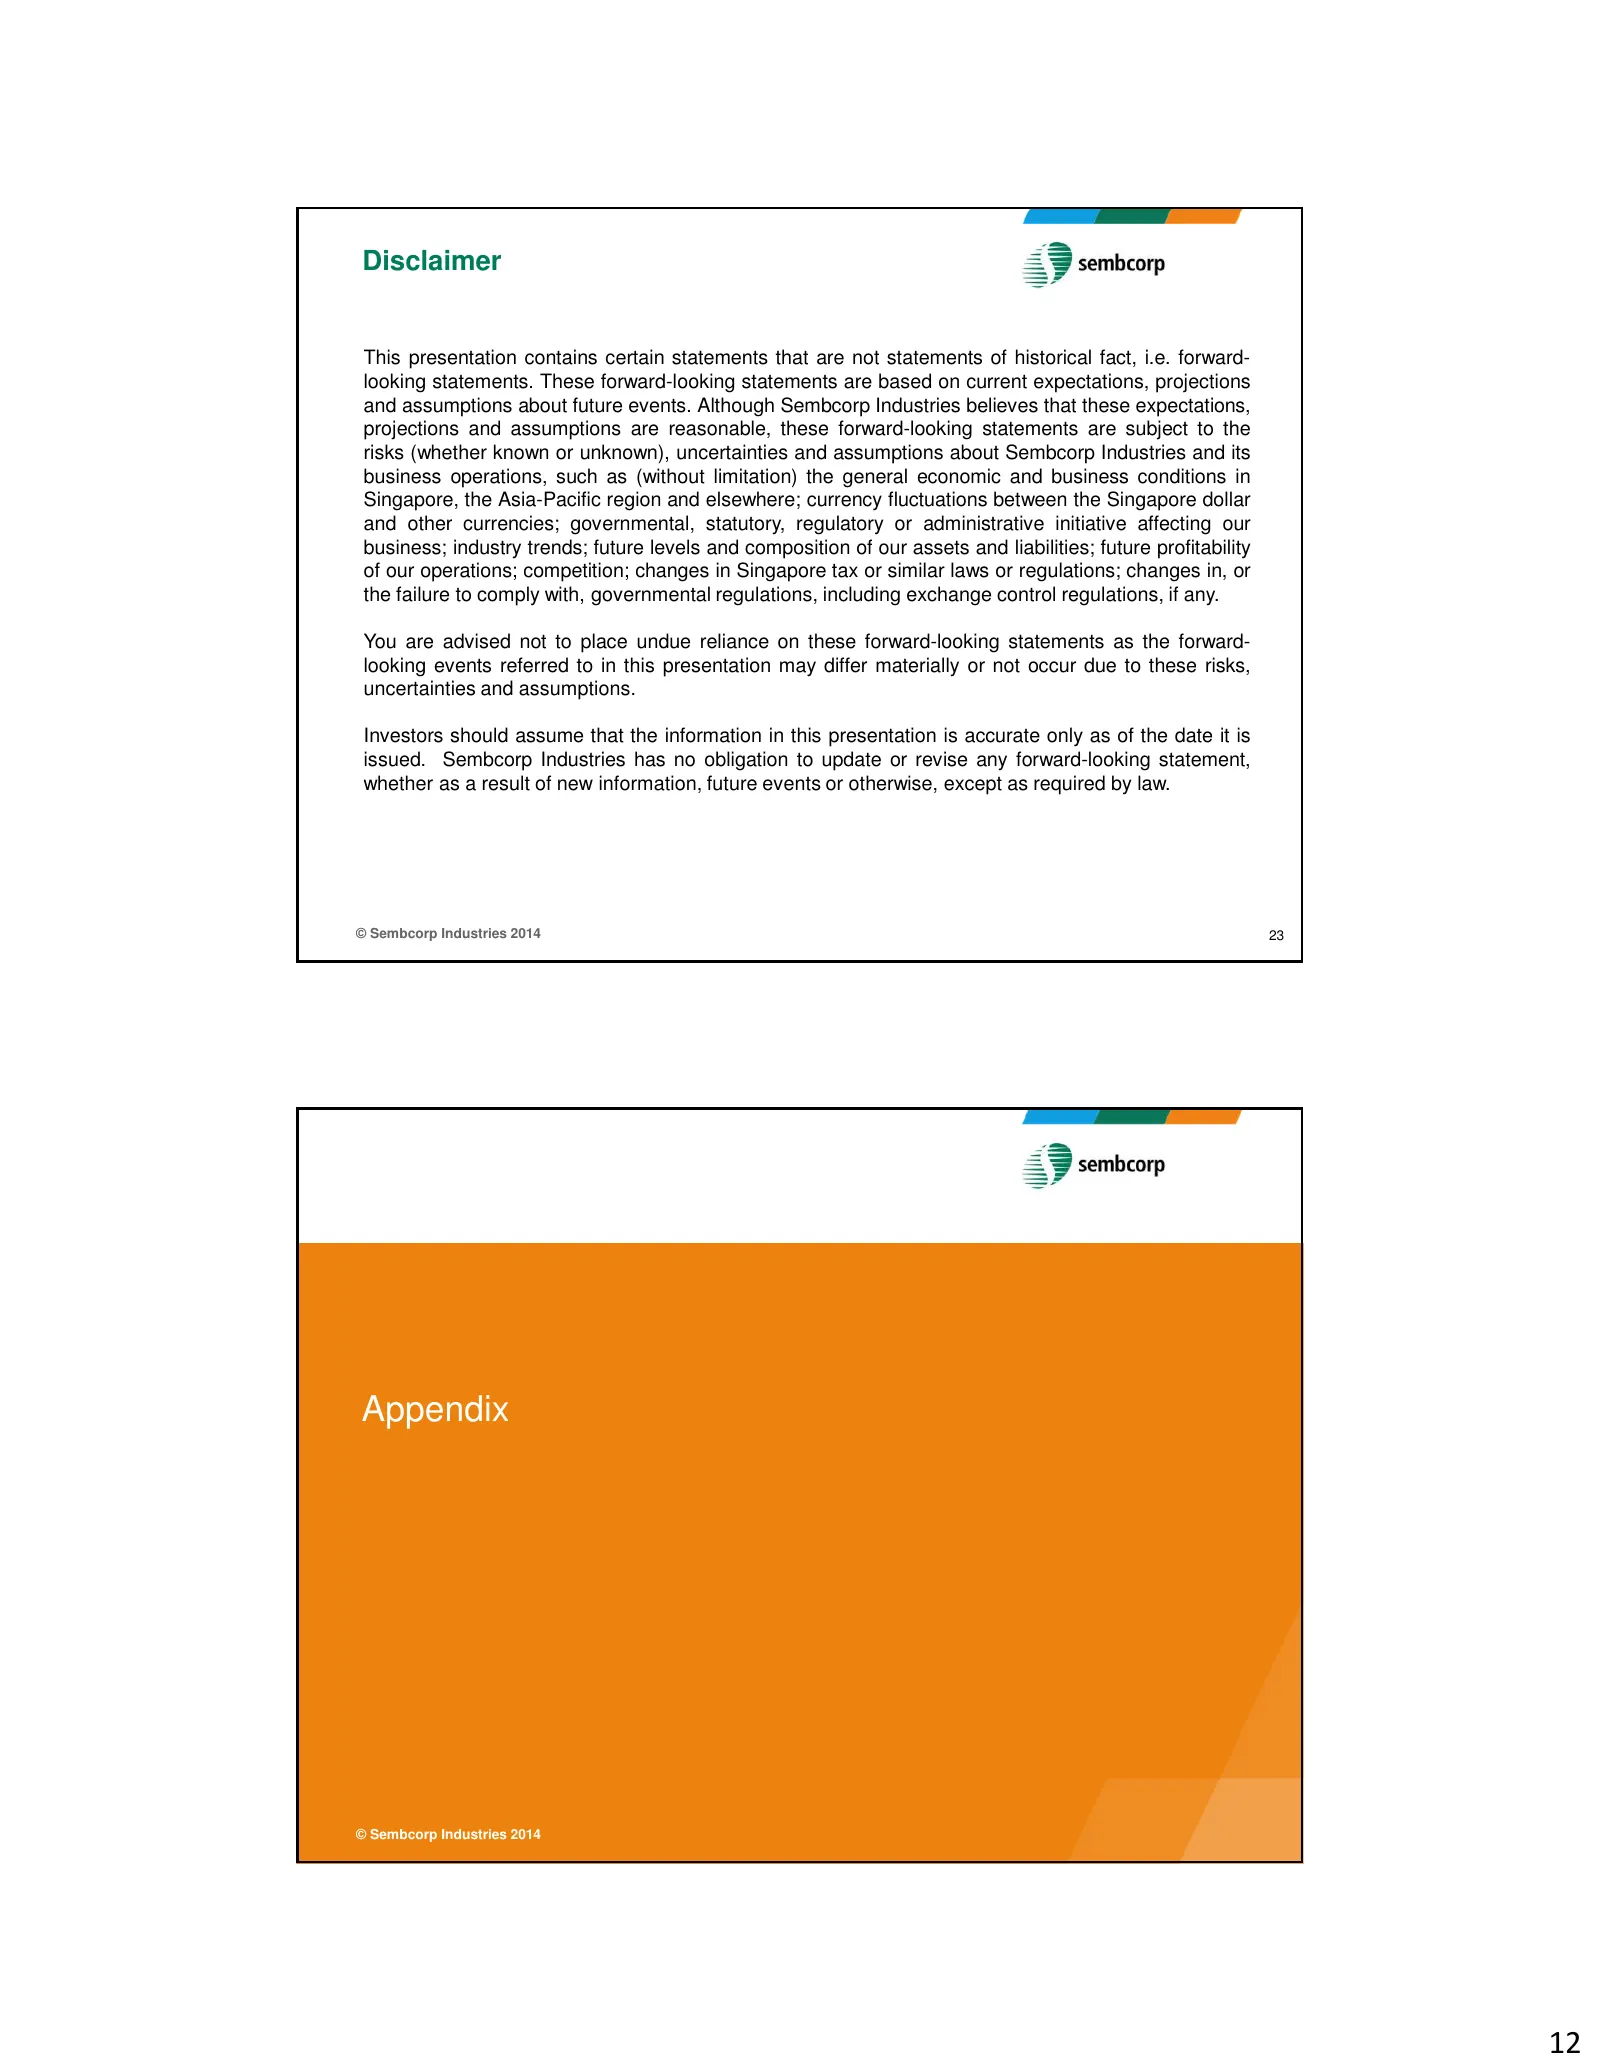
Disclaimer This presentation contains certain statements that are not statements of historical fact, i.e. forward- looking statements. These forward-looking statements are based on current expectations, projections and assumptions about future events. Although Sembcorp Industries believes that these
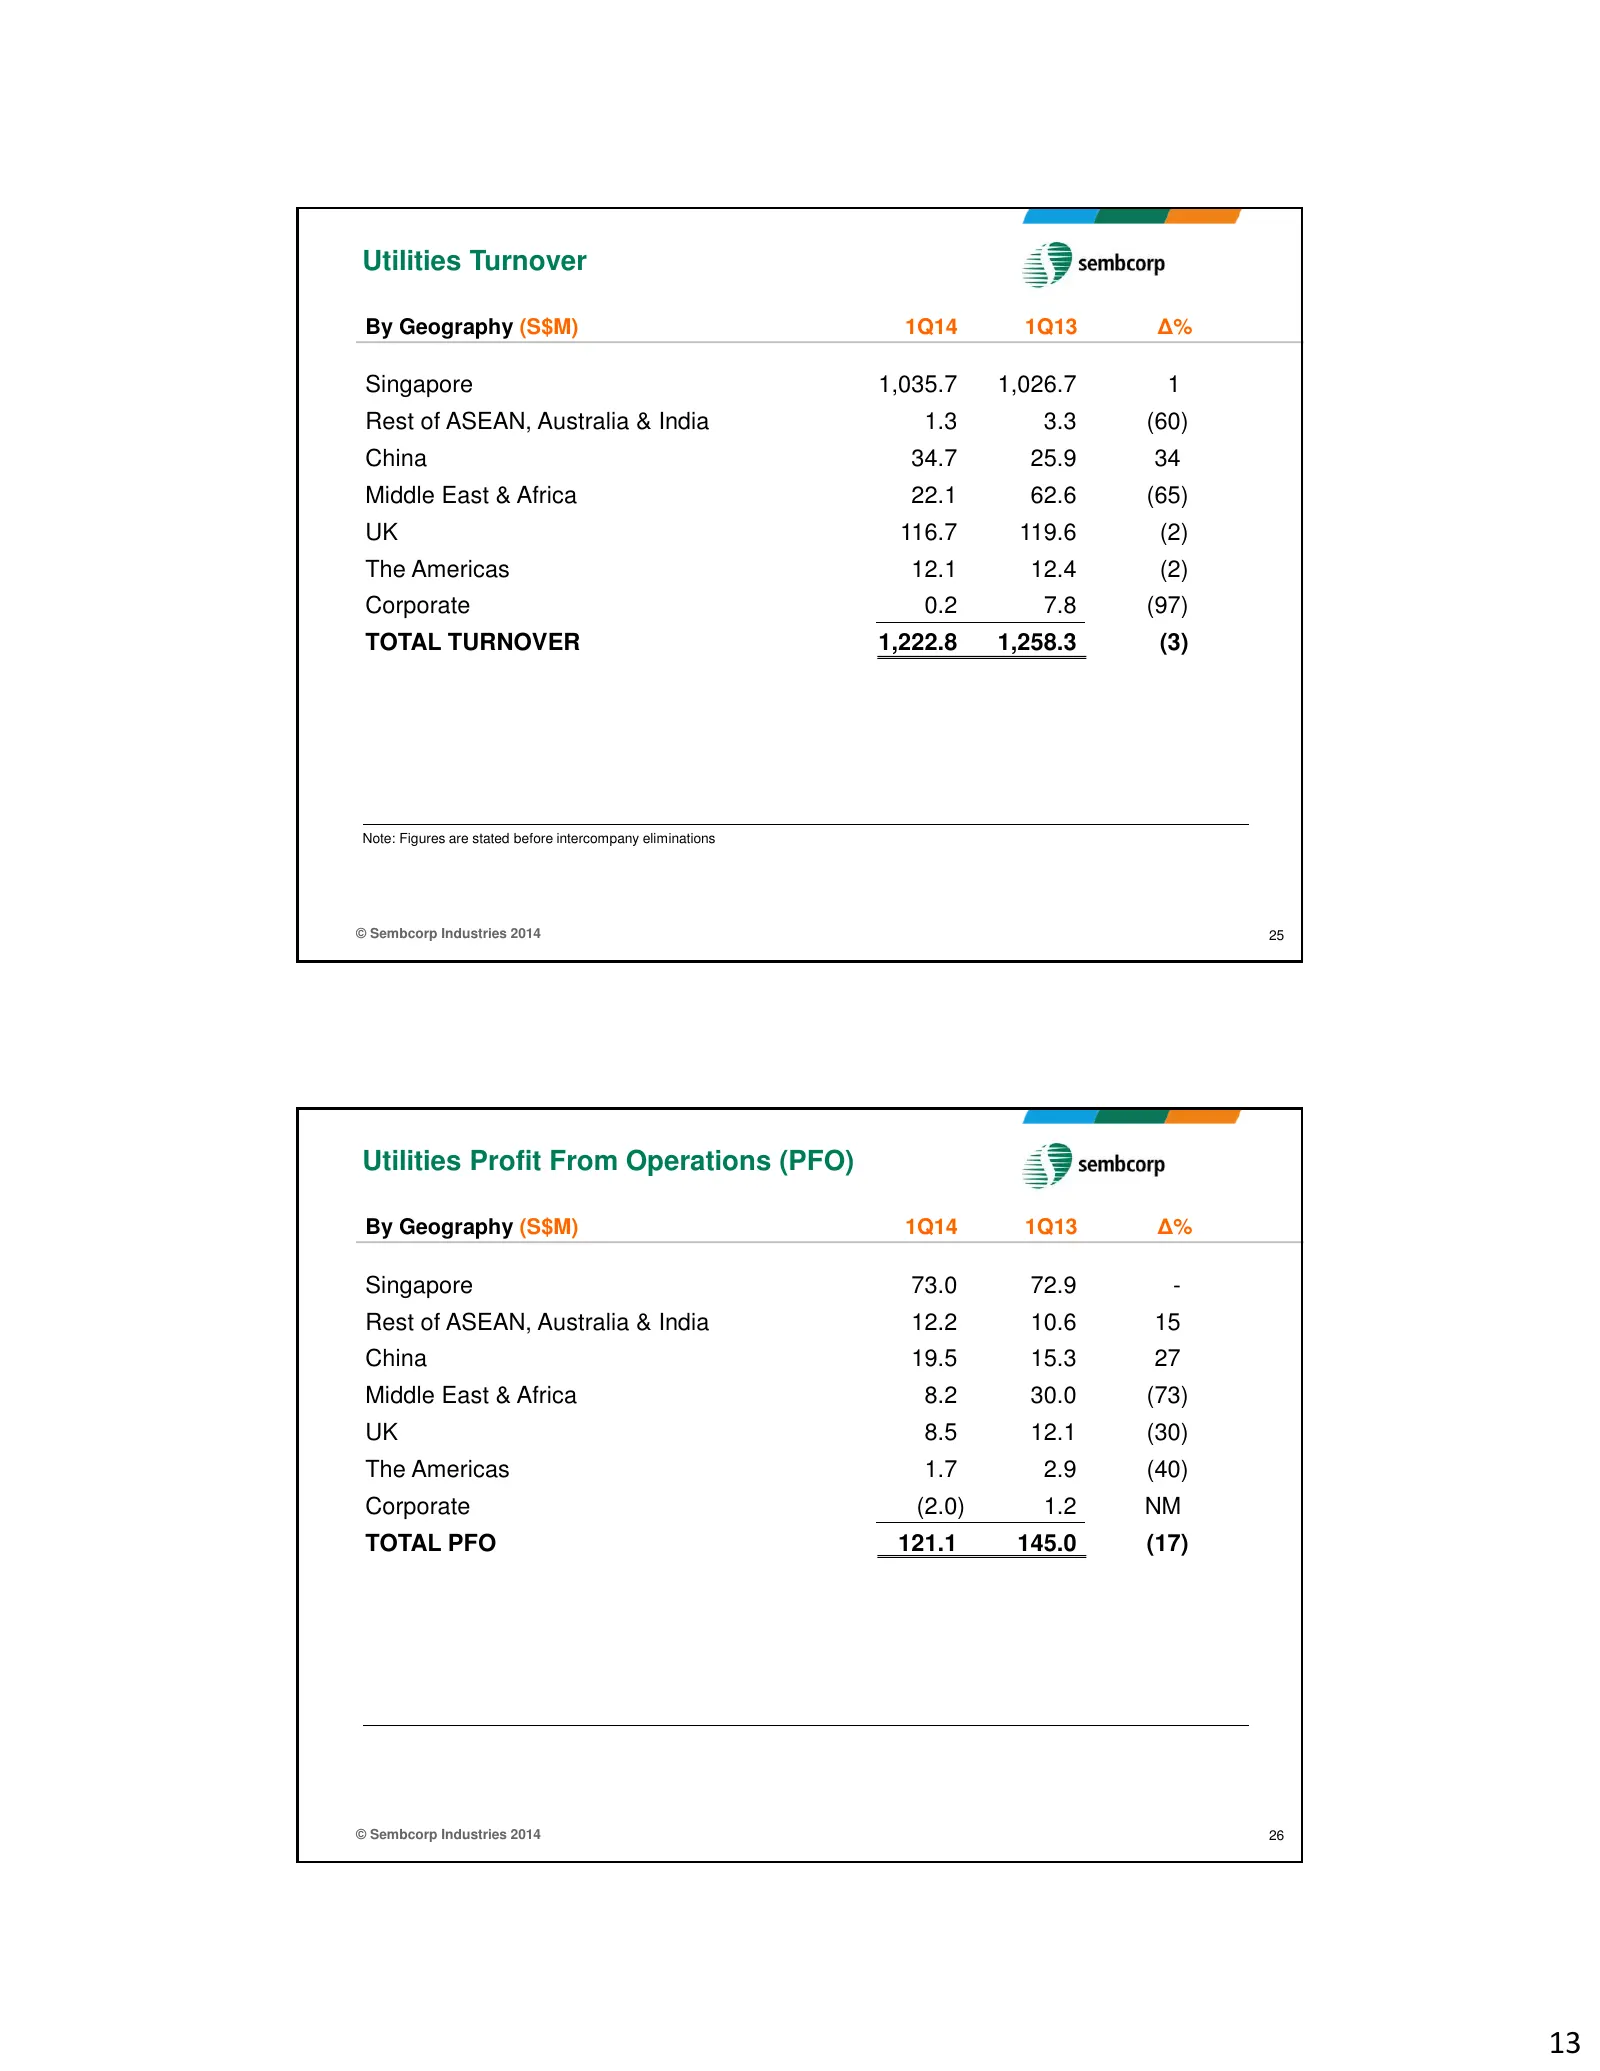
Slide 13: Utilities Turnover and PFO by Geography
Utilities Turnover By Geography (S$M) 1Q14 1Q13 ∆% Singapore 1,035.7 1,026.7 1 Rest of ASEAN, Australia & India 1.3 3.3 (60) China 34.7 25.9 34 Middle East & Africa 22.1 62.6 (65) UK 116.7 119.6 (2) The Americas 12.1 12.4 (2) Corporate 0.2 7.8 (97) TOTAL TURNOVER 1,222.8 1,258.3 (3) Note: Figures ar
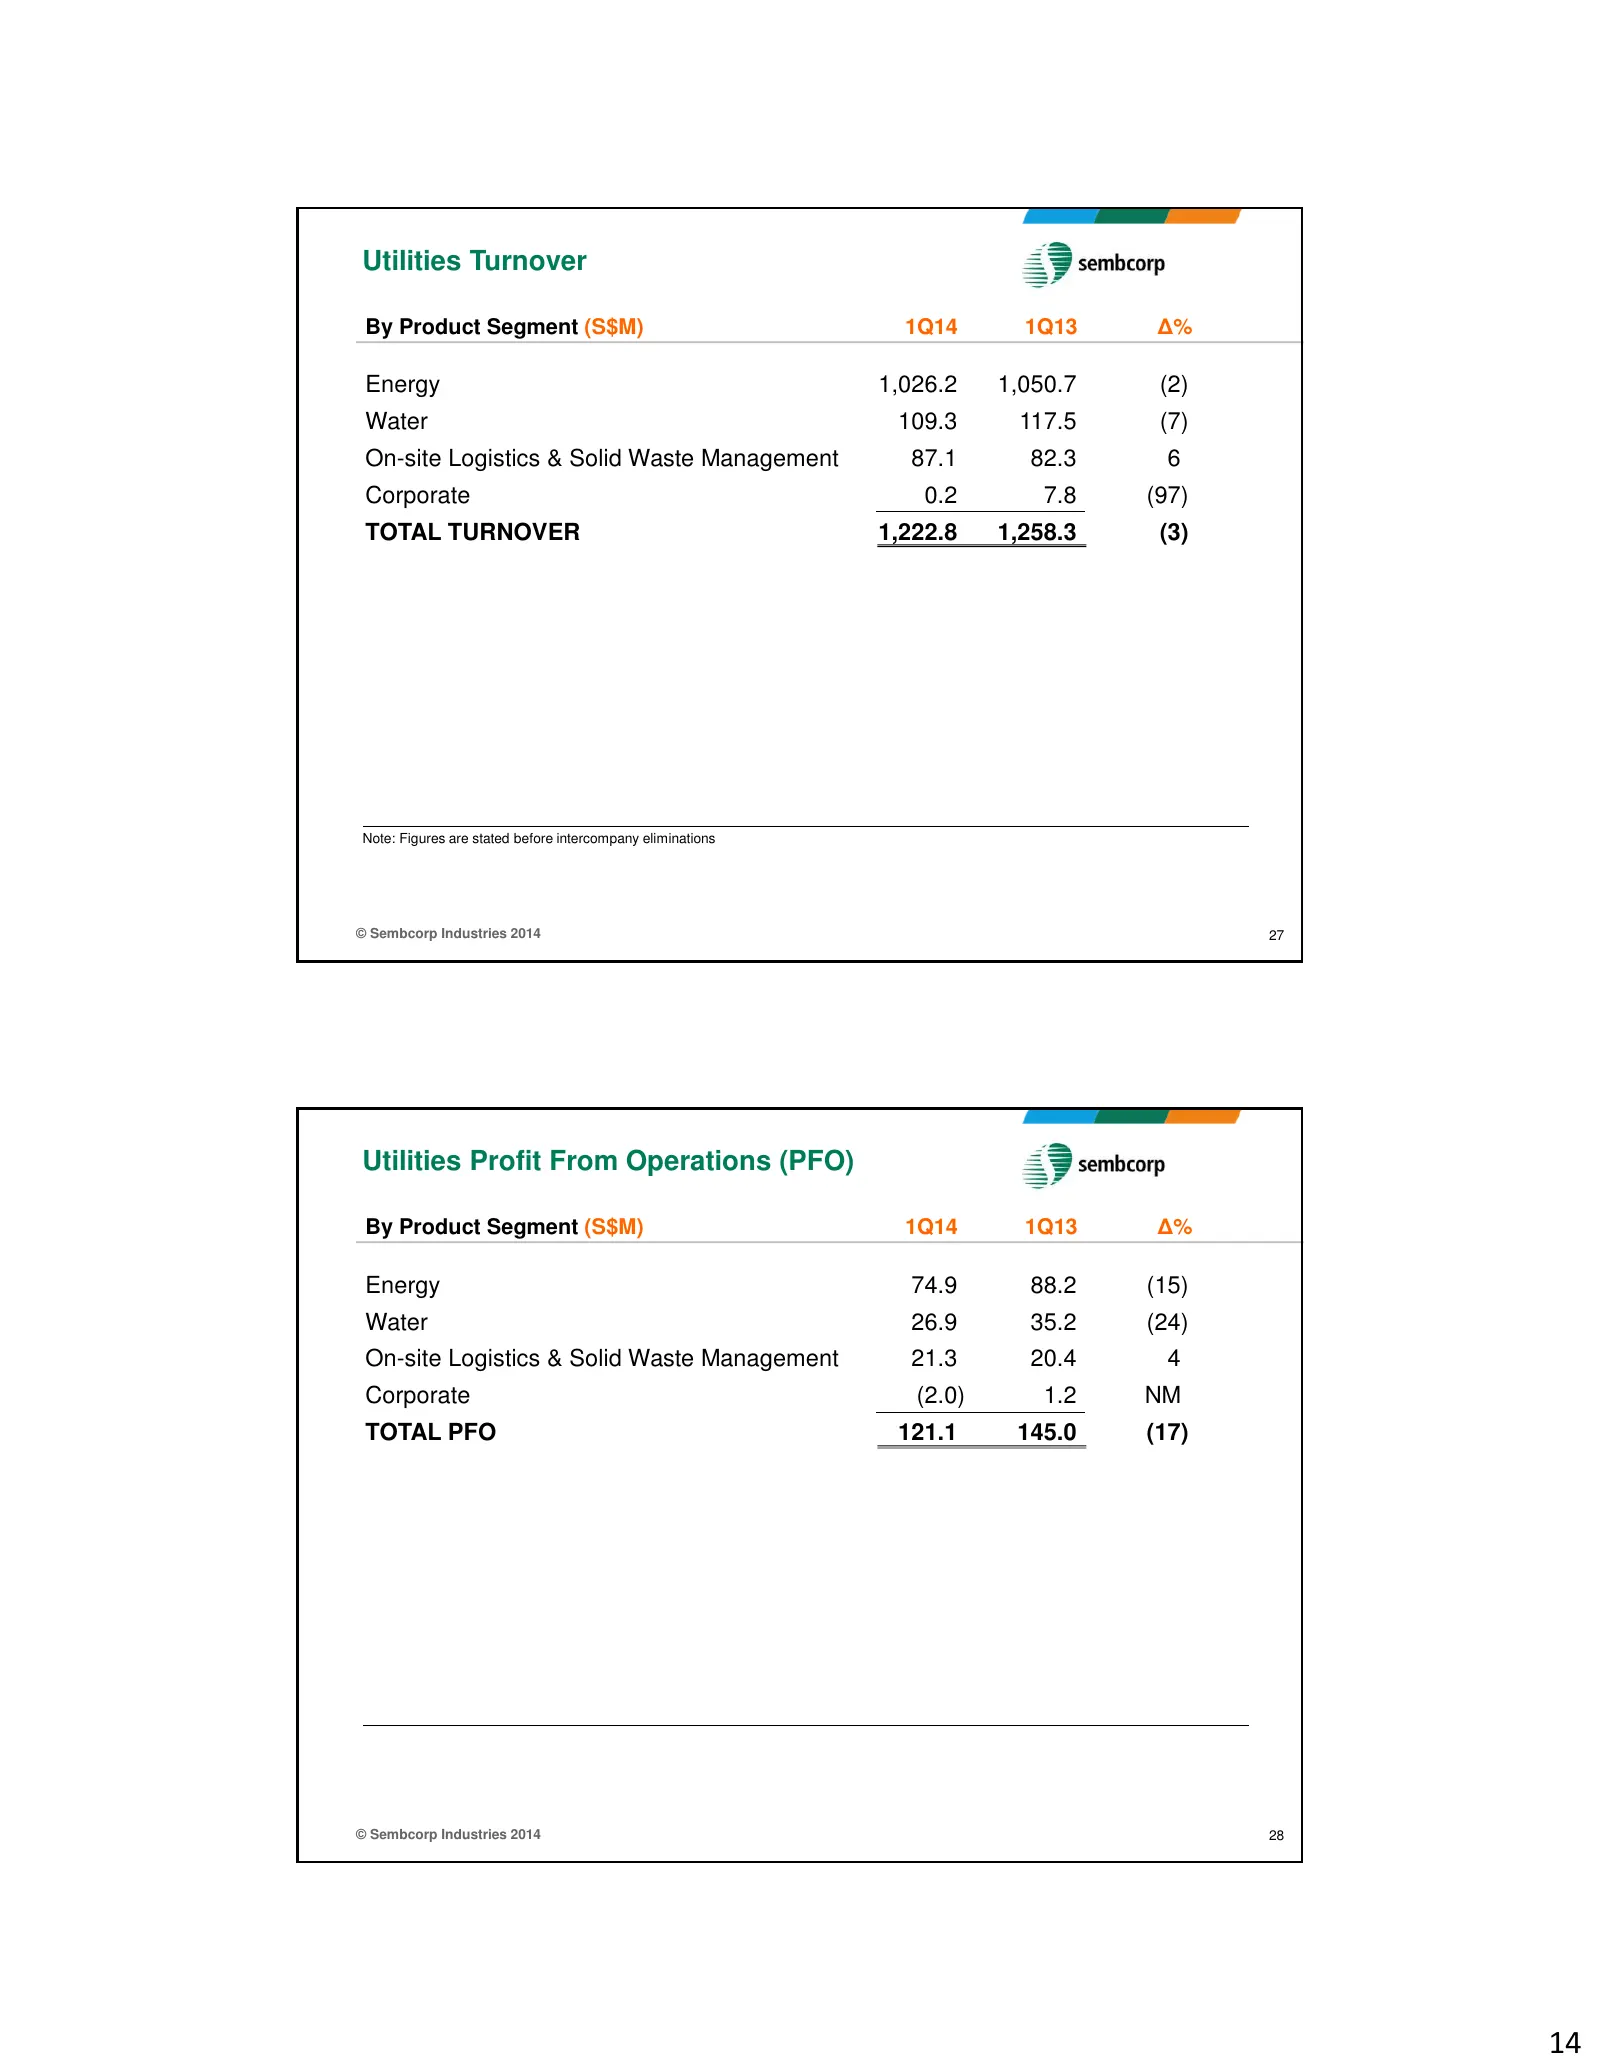
Slide 14: Utilities Turnover and PFO by Product Segment
Utilities Turnover By Product Segment (S$M) 1Q14 1Q13 ∆% Energy 1,026.2 1,050.7 (2) Water 109.3 117.5 (7) On-site Logistics & Solid Waste Management 87.1 82.3 6 Corporate 0.2 7.8 (97) TOTAL TURNOVER 1,222.8 1,258.3 (3) Note: Figures are stated before intercompany eliminations © Sembcorp Industries 2
Source: Internet Archive copy of sembcorp.com
More decks from Sembcorp Industries Ltd.
 H1 2026 Earnings Presentation26 slides · Aug 13, 2026
 Investor Presentation (June 2026)52 slides · June 2026
 Shareholder Meeting (April 2026)11 slides · Apr 29, 2026
 FY2025 Earnings Presentation35 slides · Feb 25, 2026
 Merger or Acquisition (January 2026)13 slides · Jan 30, 2026
 Merger or Acquisition (December 2025)24 slides · Dec 11, 2025