DEX ONE — R.H. Donnelley — Investor Day (November 2003)
28 slides from DEX ONE's investor day presentation, Nov 20, 2003

Slide 1: Investor Day Presentation November 20, 2003
Investor Day Presentation November 20, 2003

Slide 2: Safe Harbor Statement
Safe Harbor Statement Certain statements contained in this presentation regarding R.H. Donnelley's future operating results or performance or business plans or prospects and any other statements not constituting historical fact are "forward-looking statements" subject to the safe harbor created by t

Slide 3: Financial Overview and Investment Thesis
Financial Overview and Investment Thesis

Slide 4: Investment Highlights
Investment Highlights Recognized brand affiliation – Sprint and SBC Leading incumbent market share Attractive market demographics and diversity Highly experienced and proactive management team Compelling LBO cash flow dynamics Only publicly traded pure play directory publisher Track record of buildi
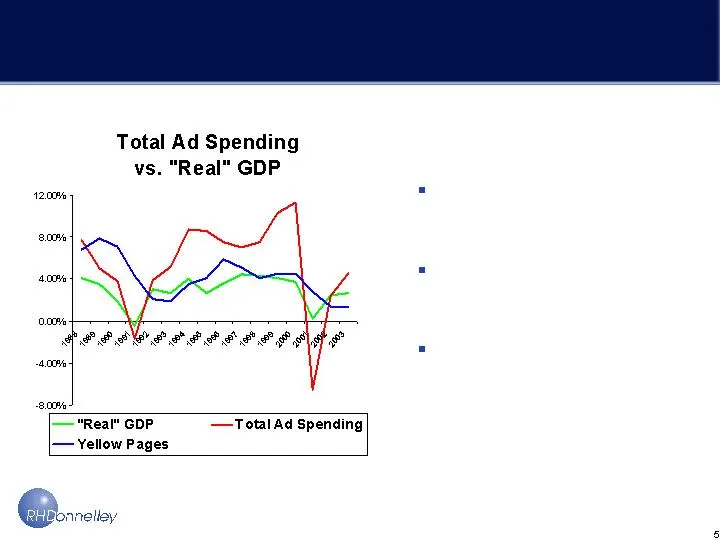
Slide 5: Real GDP and Ad Spending
Real GDP and Ad Spending Source: Beige Book, Federal Reserve Bank, Third Quarter 2003 Bob Coen, McCann Erickson Ad spending and economic activity are closely aligned Peaks and valleys tend to coincide Yellow Page performance lags economic activity due to annual sales cycle
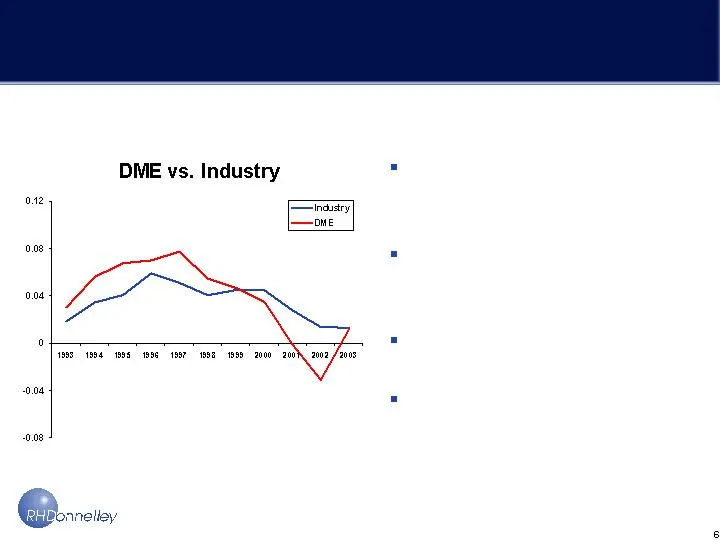
Slide 6: DME Historical Performance
DME Historical Performance DME previously out- performed the industry thru Changes in billing and collections processes in 2000- Events of 9-11 impacted the tourist driven economy 2003 performance promises return of growth Source: Bob Coen, McCann Erickson
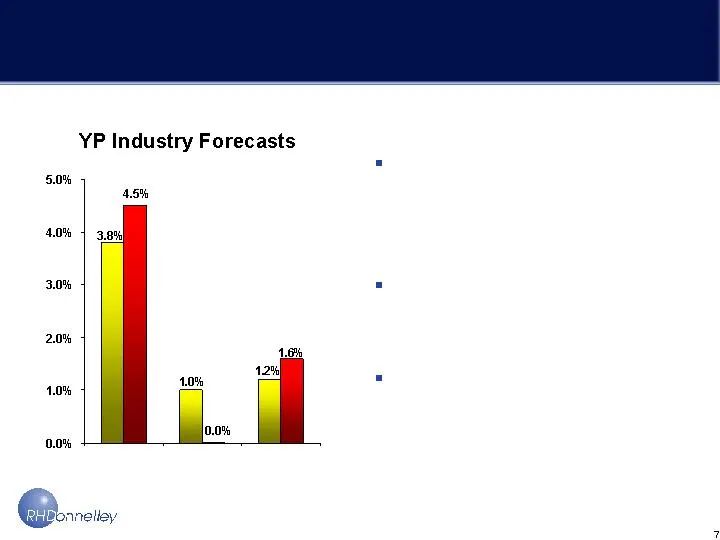
Slide 7: Industry Forecasts
Industry Forecasts Veronis Suhler robust forecasts may inflate industry performance Jack Myers’ recent flat 2004 expectations on the low side Kelsey recent forecast to 2008 ’03 ’04 Myers ’03 ’04 Veronis Suhler ’03 ’04 Kelsey

Slide 8: Factors Influencing DME Growth
Factors Influencing DME Growth Constraining Influences – 2004 Acclimating to new processes, reports, management tools Consolidation and relocation of operational headquarters Streamlined Sales Divisions (13 to 10) result in some lack of continuity Local media slower to recover

Slide 9: Factors Influencing DME Growth
Factors Influencing DME Growth Better but not as good as we will be! Enhancing Influences – 2004 Improving economic conditions Full year impact of credit policy supports new business Performance based compensation Change in management philosophies begin to take hold New Products/Pricing We expect 2%

Slide 10: Revenue Trend
Revenue Trend ($ in millions) * Net of claims & adjustments (1) For ease of computation purposes, forecasted revenues and associated measures are based on the mid-point of the range of projected publication sales growth. Normalizing Adjustments (8) (3) Normalized Total Net Revenue $563 $569 $579 1.1

Slide 11: Expense Trend
Expense Trend ($ in millions) * before D&A Base Cost Escalation - net Expense Reduction $(14) $(11) Efficiencies $(14) $(1) Synergies (9) (11) Subtotal $(23) $(12) Expenses * $281 $279 $274 (0.7 ) 1. 8 Normalizing Adjustments (5) (11) Normalized Expenses* 4.9 4.0 Adjusted Adjusted Forecast % Change

Slide 12: DonTech Ad Sales/Contribution
DonTech Ad Sales/Contribution ($ in millions) Pub Sales $418 $403 $394 (3.6 ) (2.2 ) Calendar Sales (1.7) (0.8) Partnership Income $117 $114 $112 (2.6) (1.8) Actual Actual Forecast % Change 2003 E

Slide 13: EBITDA Trend
EBITDA Trend ($ in millions) * before D&A Adjusted Adjusted Forecast % Change PF 2002 2003 E DonTech (2.6 ) (1.8 ) Normalized EBITDA - Total $392 $409 $428 4.3 4.7 Normalized Revenue $563 $569 $579 1. 1 1. 8 Normalized Expenses* 4.9 4.0 Normalized EBITDA – Donnelley 7.3 7.1 margin% 49% 52% 55%

Slide 14: Financial Overview
Financial Overview ($ in millions) * Excluding D&A, interest & taxes DME Pub Sales $542 $549 $562 1. 3 2. 4 Revenue 0.2 0.9 Expenses* 0.7 (1.8) Donnelley EBITDA 1.0 3.4 DonTech (2.6) (1.8) Total EBITDA --- 2.0 Net Normalizing Adjustments (15) Normalized EBITDA $392 $409 $428 4.3 4.7 Adjusted Adjuste

Slide 15: Net Income Trend
Net Income Trend ($ in millions, except EPS) * before preferred dividend Adjusted Adjusted Forecast % Change PF 2002 2003 E D & A Interest Tax Provision Adjusted Net Income* $98 $101 $116 3.1 14.9 Total EBITDA $407 $407 $415 -- - 2. 0 Adjusted Wtd. Avg. Shares 39.4 40.4 42.9 Adjusted EPS $2.49 $2.50

Slide 16: Summary Free Cash Flow Projections
Summary Free Cash Flow Projections ($ in millions) Total EBITDA $407 $415 Cash Interest Changes in Working Capital (10) Cash Taxes Capital Expenditures Free Cash Flow $230 $240 Adjusted Forecast 2003E

Slide 17: Debt Repayment
Debt Repayment RHD debt repayment and deleveraging well ahead of schedule ($ in millions) Bank Debt $1,389 $1,159 $919 8.875% Sr. Notes Total Senior Debt 1,714 1,484 1,244 Senior Subordinated Notes Total Debt $2,335 $2,105 $1,865 Change $ $ Leverage Ratio 5.7X 5.2X 4.5X Balance Estimated Estimated 1
Slide 18: Investment Value Proposition
Investment Value Proposition Essential resource for people ready to buy Critical medium for SME advertisers Solid fundamental value proposition Visible recurring revenue and loyal customers Stable growth and high margins Exceptional conversion of profit to FCF Powerful combination of operating and f
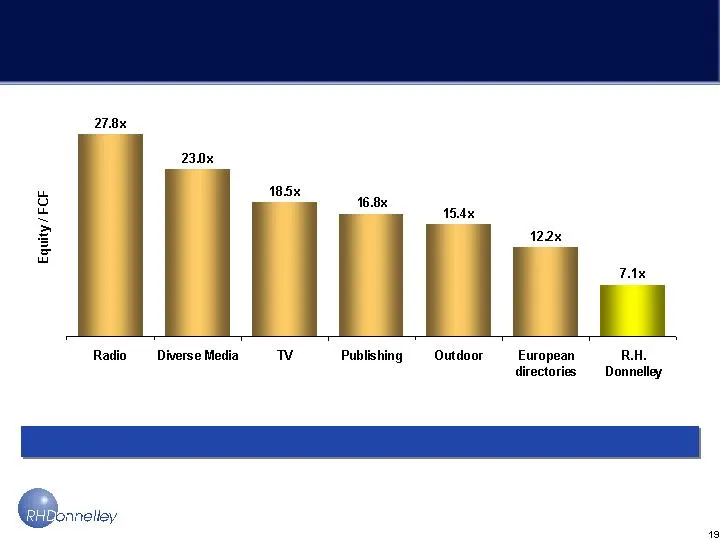
Slide 19: Favorable Free Cash Flow Multiple
Favorable Free Cash Flow Multiple Cash is a Fact Source: Deutsche Bank Securities Inc.

Slide 20: OP nnciey
e OP nnciey

Slide 21: Appendix
Appendix
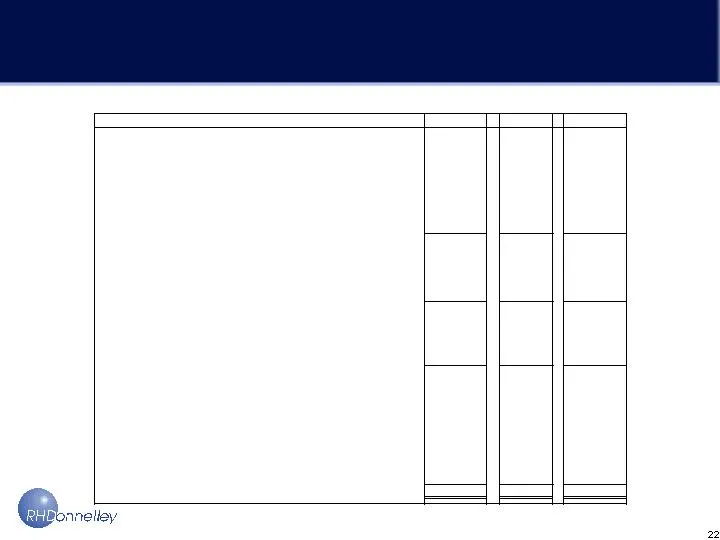
Slide 22: Reconciliation of non-GAAP measures
Reconciliation of non-GAAP measures Amounts in millions 2002PF 2003E 2004G Reconciliation of publication sales for Sprint-branded directories to total net revenue, normalized net revenue and GAAP net revenue Publication sales in the period $ $ $ Less publication sales for January 2003 directories th
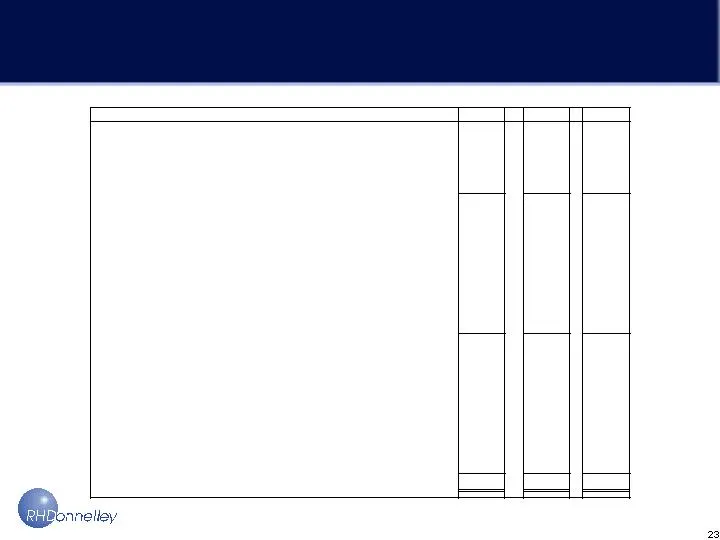
Slide 23: Reconciliation of non-GAAP measures (cont'd)
Reconciliation of non-GAAP measures (cont’d) Amounts in millions 2002PF 2003E 2004G Reconciliation of GAAP expenses to adjusted expenses, excluding depreciation and amortization ("D&A") to normalized expenses, excluding D&A GAAP expenses $ $ $ Less D&A - GAAP (6) (66) (59) GAAP expenses, excluding D
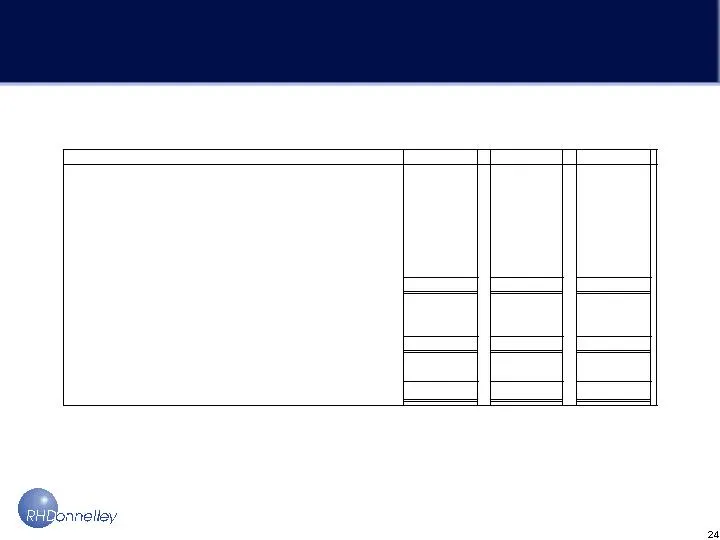
Slide 24: Reconciliation of non-GAAP measures (cont'd)
Reconciliation of non-GAAP measures (cont’d) Amounts in millions 2003E 2004G Reconciliation of publication sales for SBC directories for which DonTech sells advertising to partnership income from DonTech Publication sales in the period $ $ $ Less the value of contracts executed and reported as calen
Slide 25: Reconciliation of non-GAAP measures (cont'd)
Reconciliation of non-GAAP measures (cont’d) Amounts in millions 2002PF 2003E 2004G Reconciliation of GAAP net income (loss) to Donnelley EBITDA, normalized Donnelley EBITDA and total normalized EBITDA and calculation of normalized Donnelley EBITDA margin Net income (loss) - GAAP $ (51) $ $ Plus tax
Slide 26: Reconciliation of non-GAAP measures (cont'd)
Reconciliation of non-GAAP measures (cont’d) Amounts in millions 2002PF 2003E 2004G Reconciliation of GAAP net income (loss) to EBITDA, adjusted EBITDA and normalized EBITDA Net income (loss) - GAAP $ (51) $ $ Plus tax expense (benefit) (38) Plus interest expense, net Plus depreciation and amortizat
Slide 27: Reconciliation of non-GAAP measures (cont'd)
Reconciliation of non-GAAP measures (cont’d) Amounts in millions 2002PF 2003E 2004G Reconciliation of adjusted EBITDA to adjusted net income Adjusted EBITDA - see prior reconciliation to GAAP net income (loss) $ $ $ Less depreciation and amortization (6) (66) (59) Less additional depreciation and am
Slide 28: Reconciliation of non-GAAP measures (cont'd)
Reconciliation of non-GAAP measures (cont’d) Amounts in millions 2003E 2004G Reconciliation of GAAP cash flow from operations to free cash flow Cash flow from operations - GAAP $ $ Less capital expenditures (17) (15) Free cash flow $ $ Amounts in millions 2002PF 2003E 2004G Reconciliation of GAAP di
Source: SEC EDGAR · 8-K filed Nov 20, 2003
More decks from DEX ONE Corp
 Q4 2012 Earnings Presentation17 slides · Mar 18, 2013
 Merger or Acquisition (December 2012)42 slides · Dec 6, 2012
 Merger or Acquisition (September 2012)51 slides · Sep 18, 2012
 Merger or Acquisition (August 2012)15 slides · Aug 21, 2012
 Q2 2012 Earnings Presentation16 slides · Jul 25, 2012
 Q1 2012 Earnings Presentation17 slides · Apr 26, 2012