MMA Capital — Municipal Mortgage & Equity — Q3 2005 Earnings Presentation
26 slides from MMA Capital's earnings presentation, Nov 10, 2005
Slide 1: Supplemental Financial Information Third Quarter 2005
Exhibit 99.2 Supplemental Financial Information Third Quarter 2005
Slide 2: Table of Contents
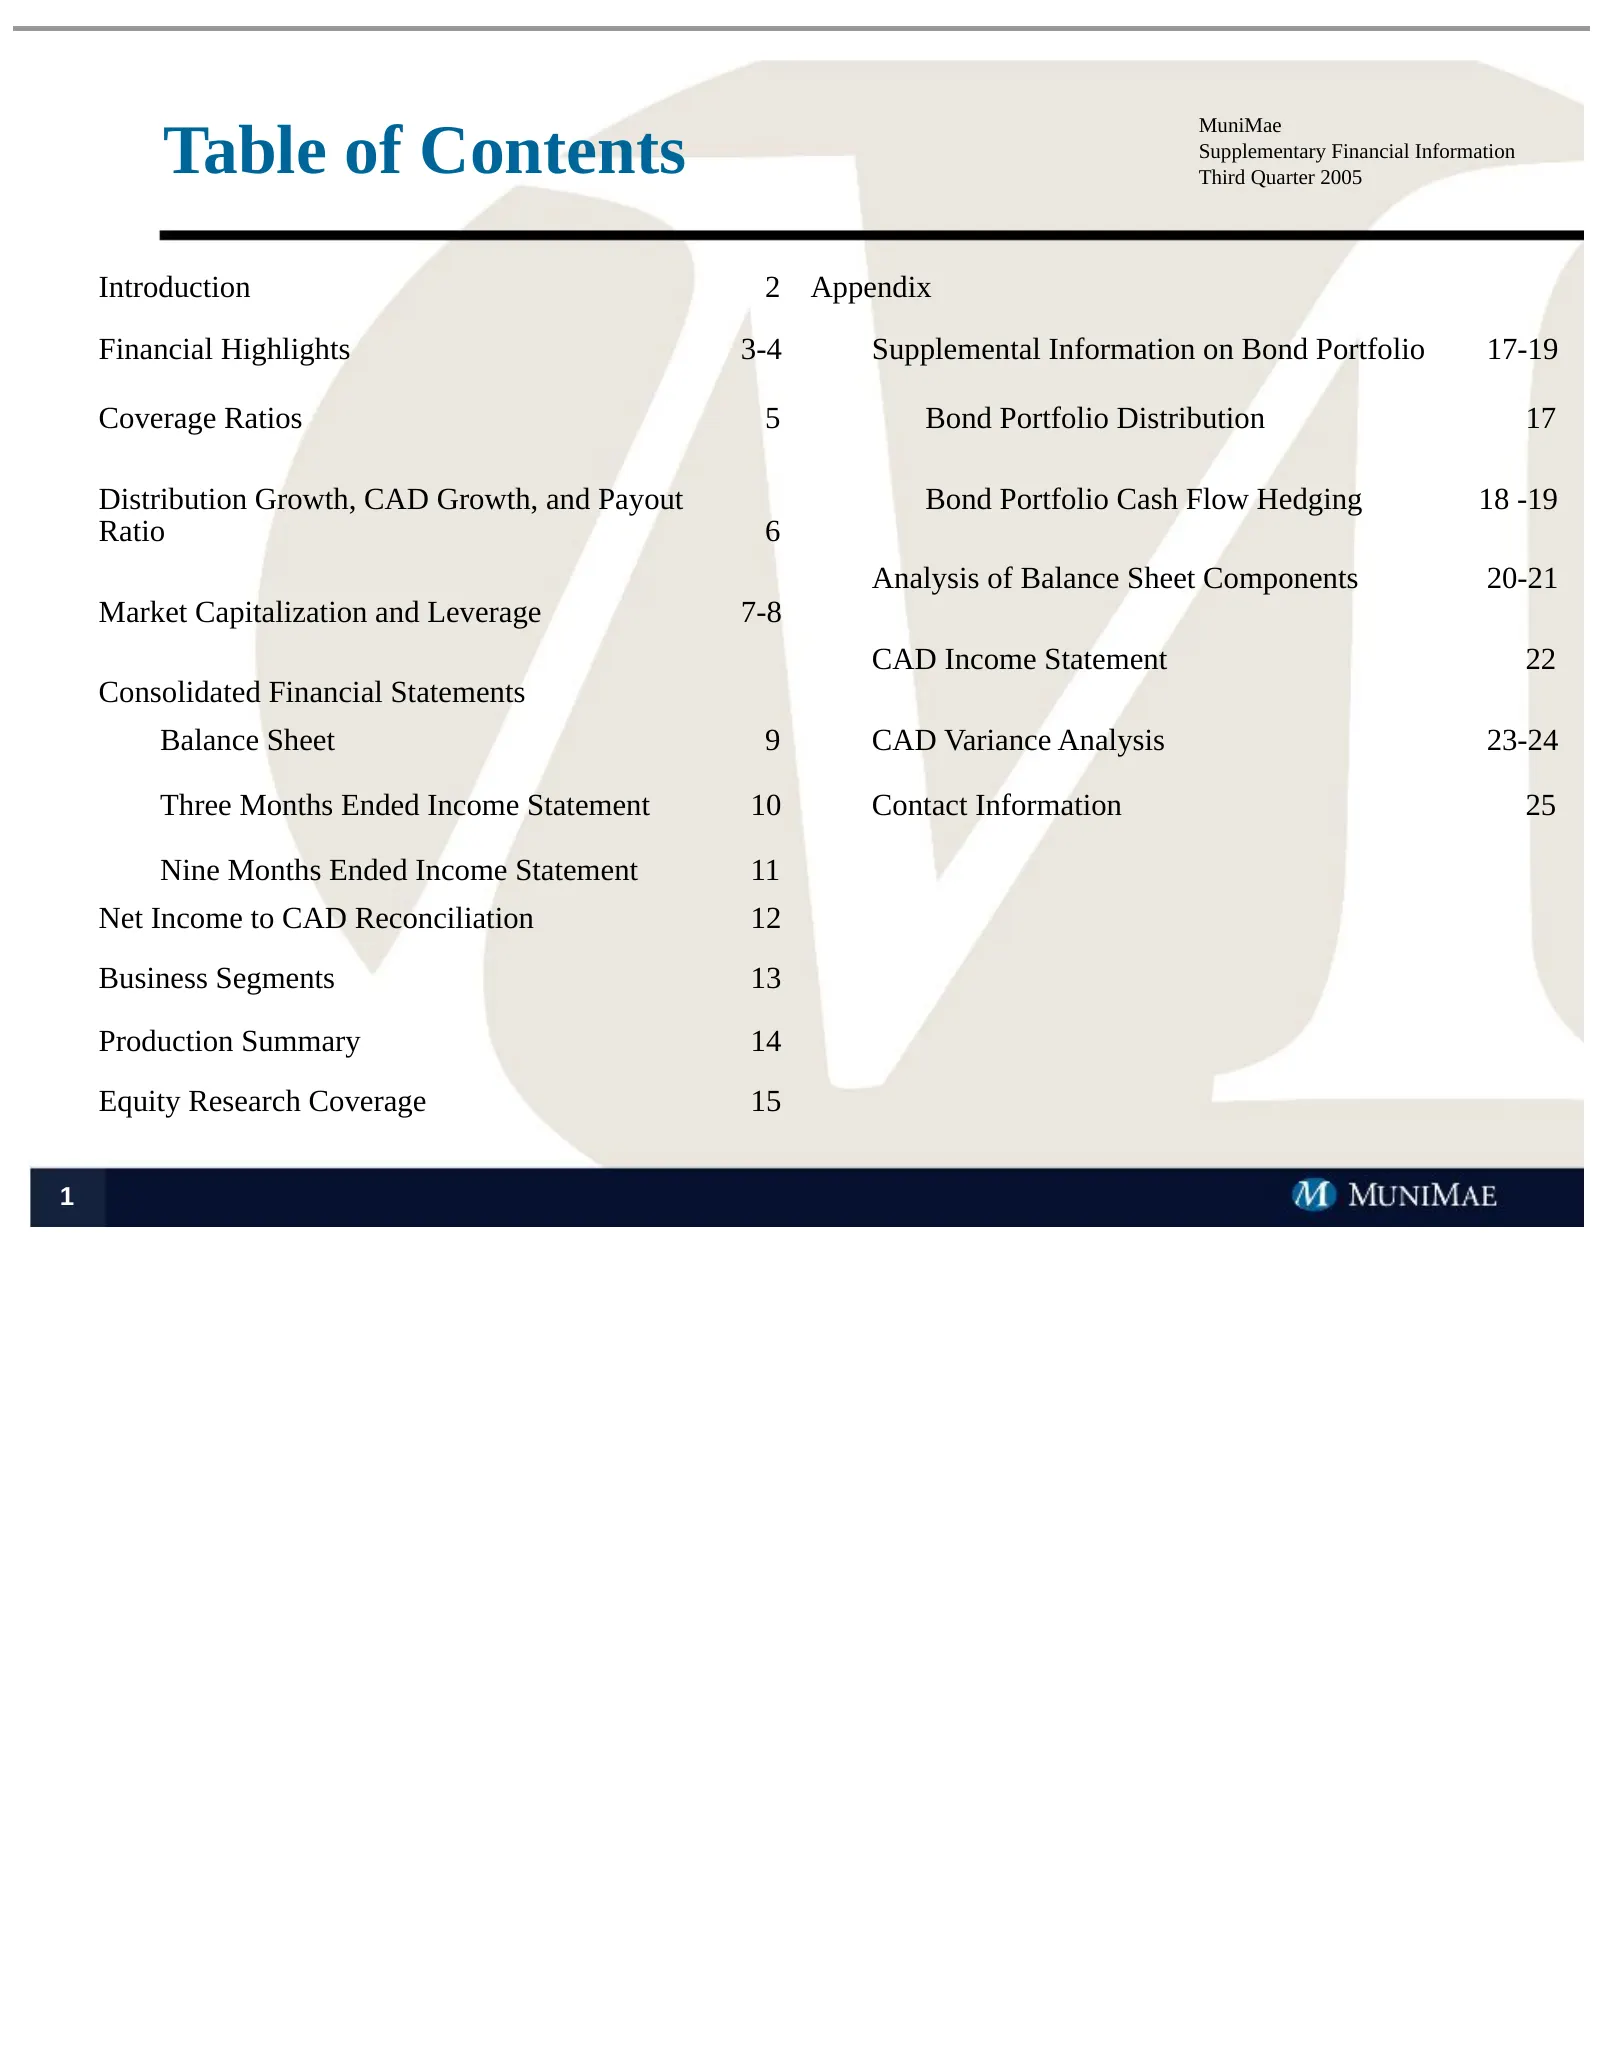
Table of Contents MuniMae Supplementary Financial Information Third Quarter 2005 Introduction 2 Appendix Financial Highlights 3-4 Supplemental Information on Bond Portfolio 17-19 Coverage Ratios 5 Bond Portfolio Distribution 17 Distribution Growth, CAD Growth, and Payout Bond Portfolio Cash Flow Hed
Slide 3: Introduction
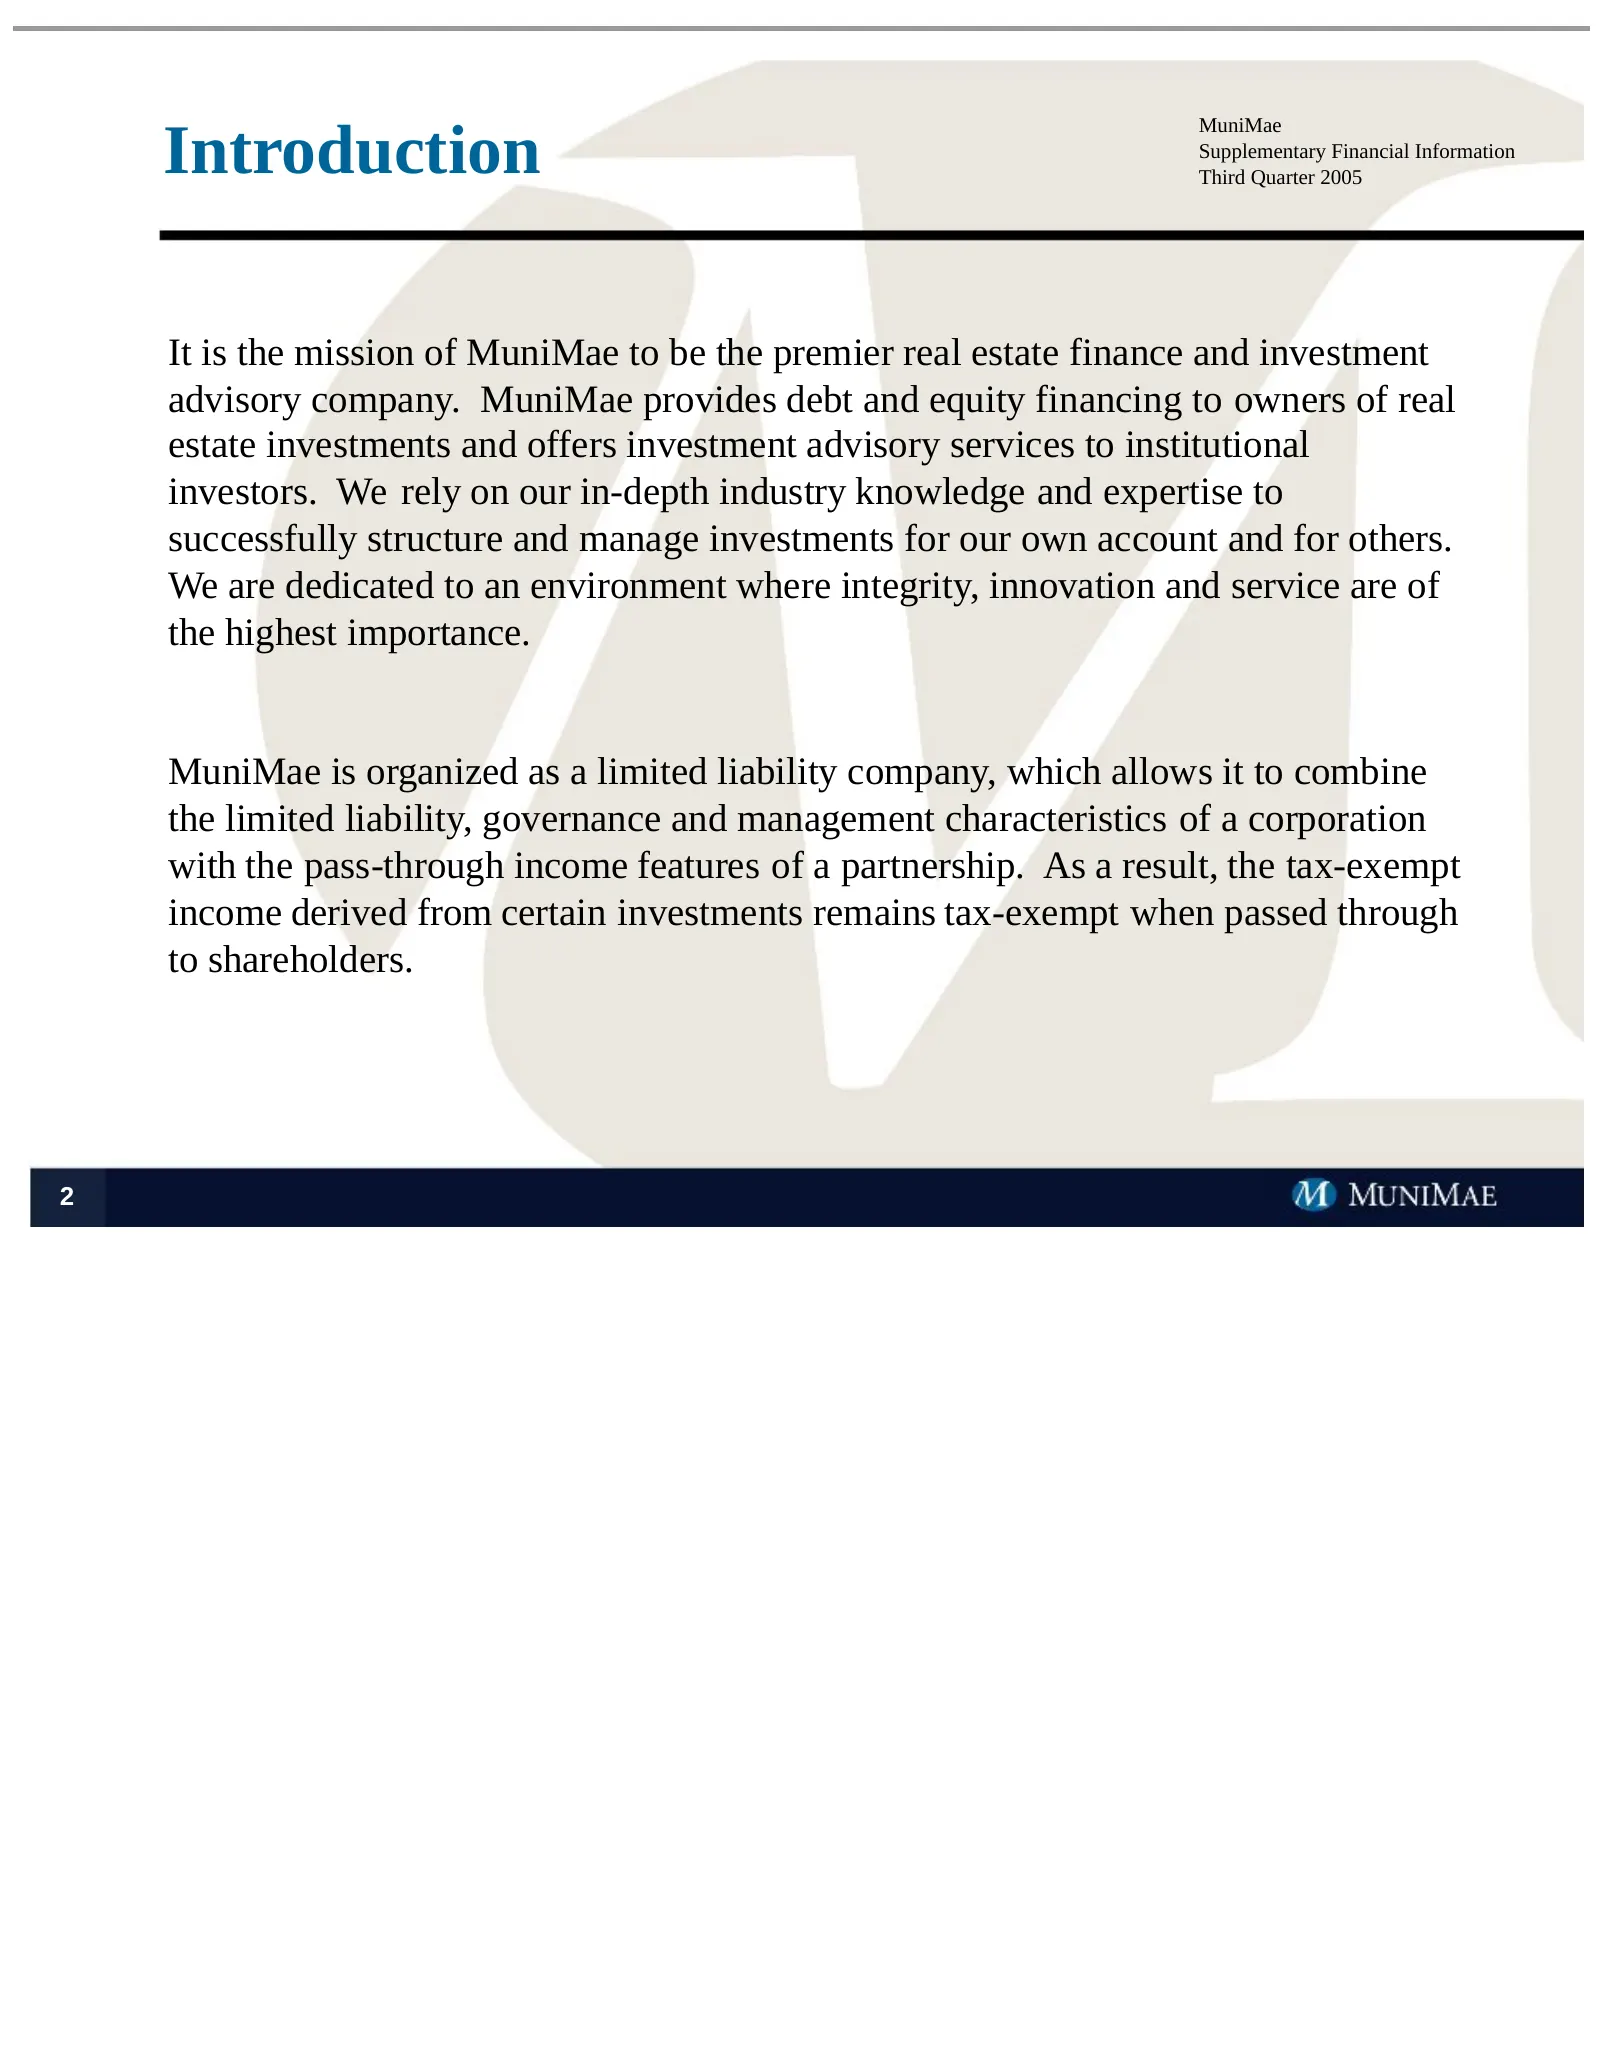
Introduction MuniMae Supplementary Financial Information Third Quarter 2005 It is the mission of MuniMae to be the premier real estate finance and investment advisory company. MuniMae provides debt and equity financing to owners of real estate investments and offers investment advisory services to i
Slide 4: Financial Highlights
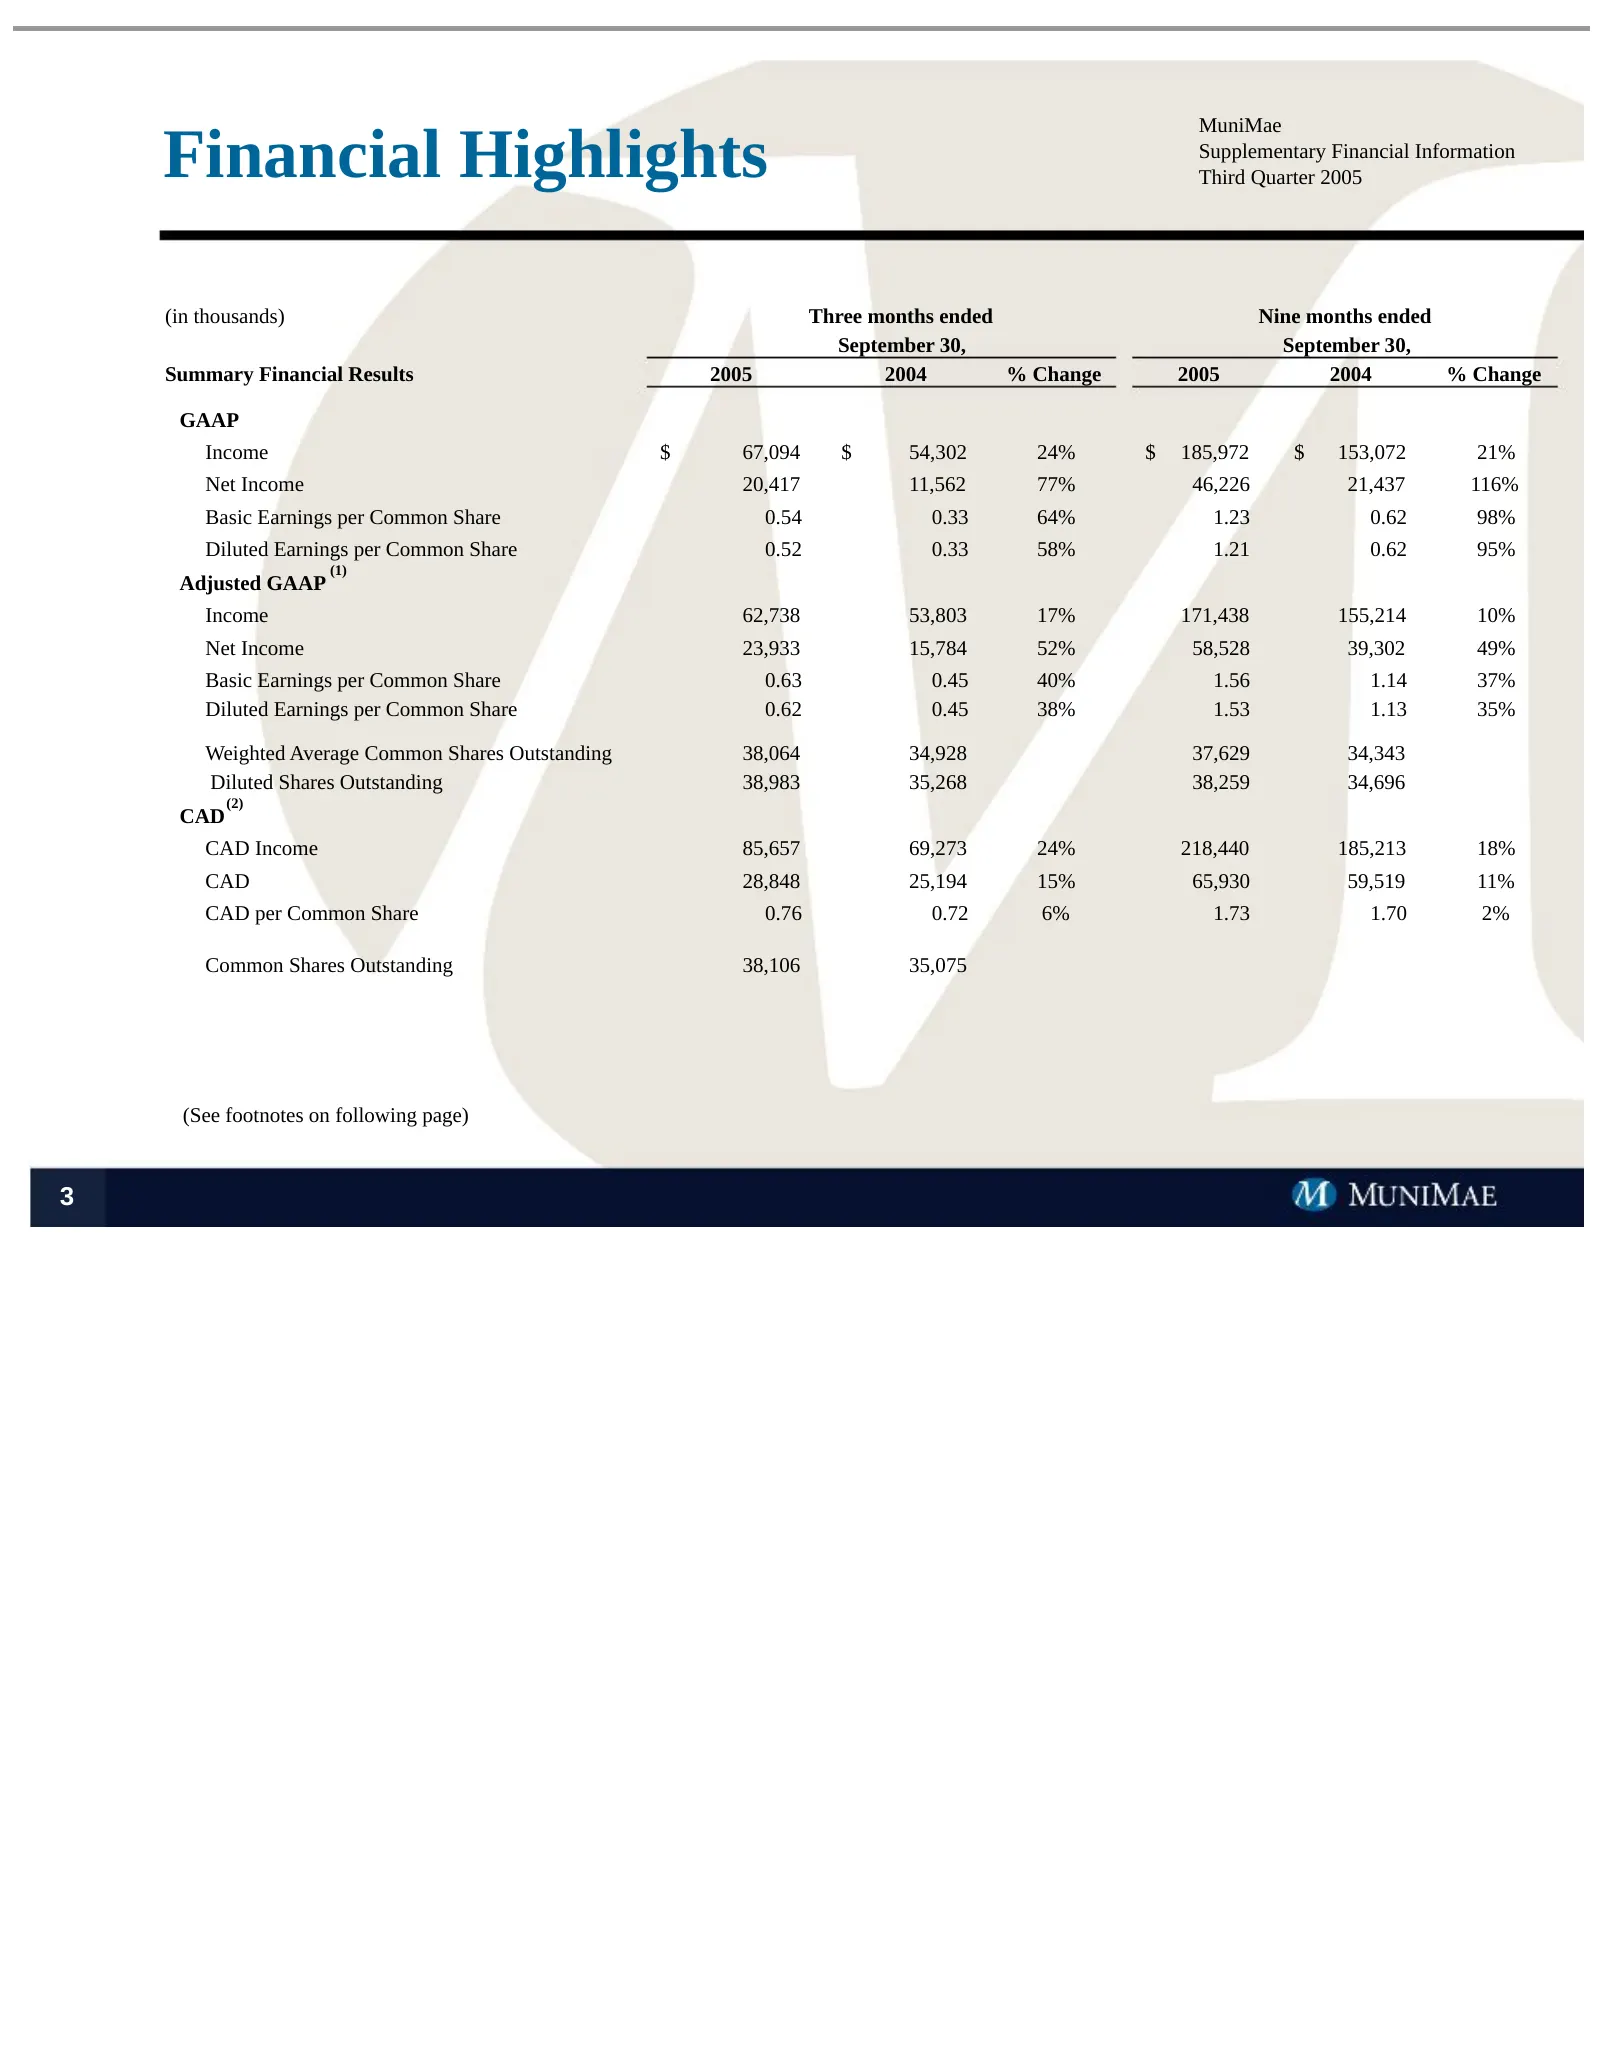
MuniMae Financial Highlights Supplementary Financial Information Third Quarter 2005 (in thousands) Three months ended Nine months ended September 30, September 30, Summary Financial Results 2005 2004 % Change 2005 2004 % Change GAAP Income $ 67,094 $ 54,302 24% $ 185,972 $ 153,072 21% Net Income 20,
Slide 5: Financial Highlights (notes)
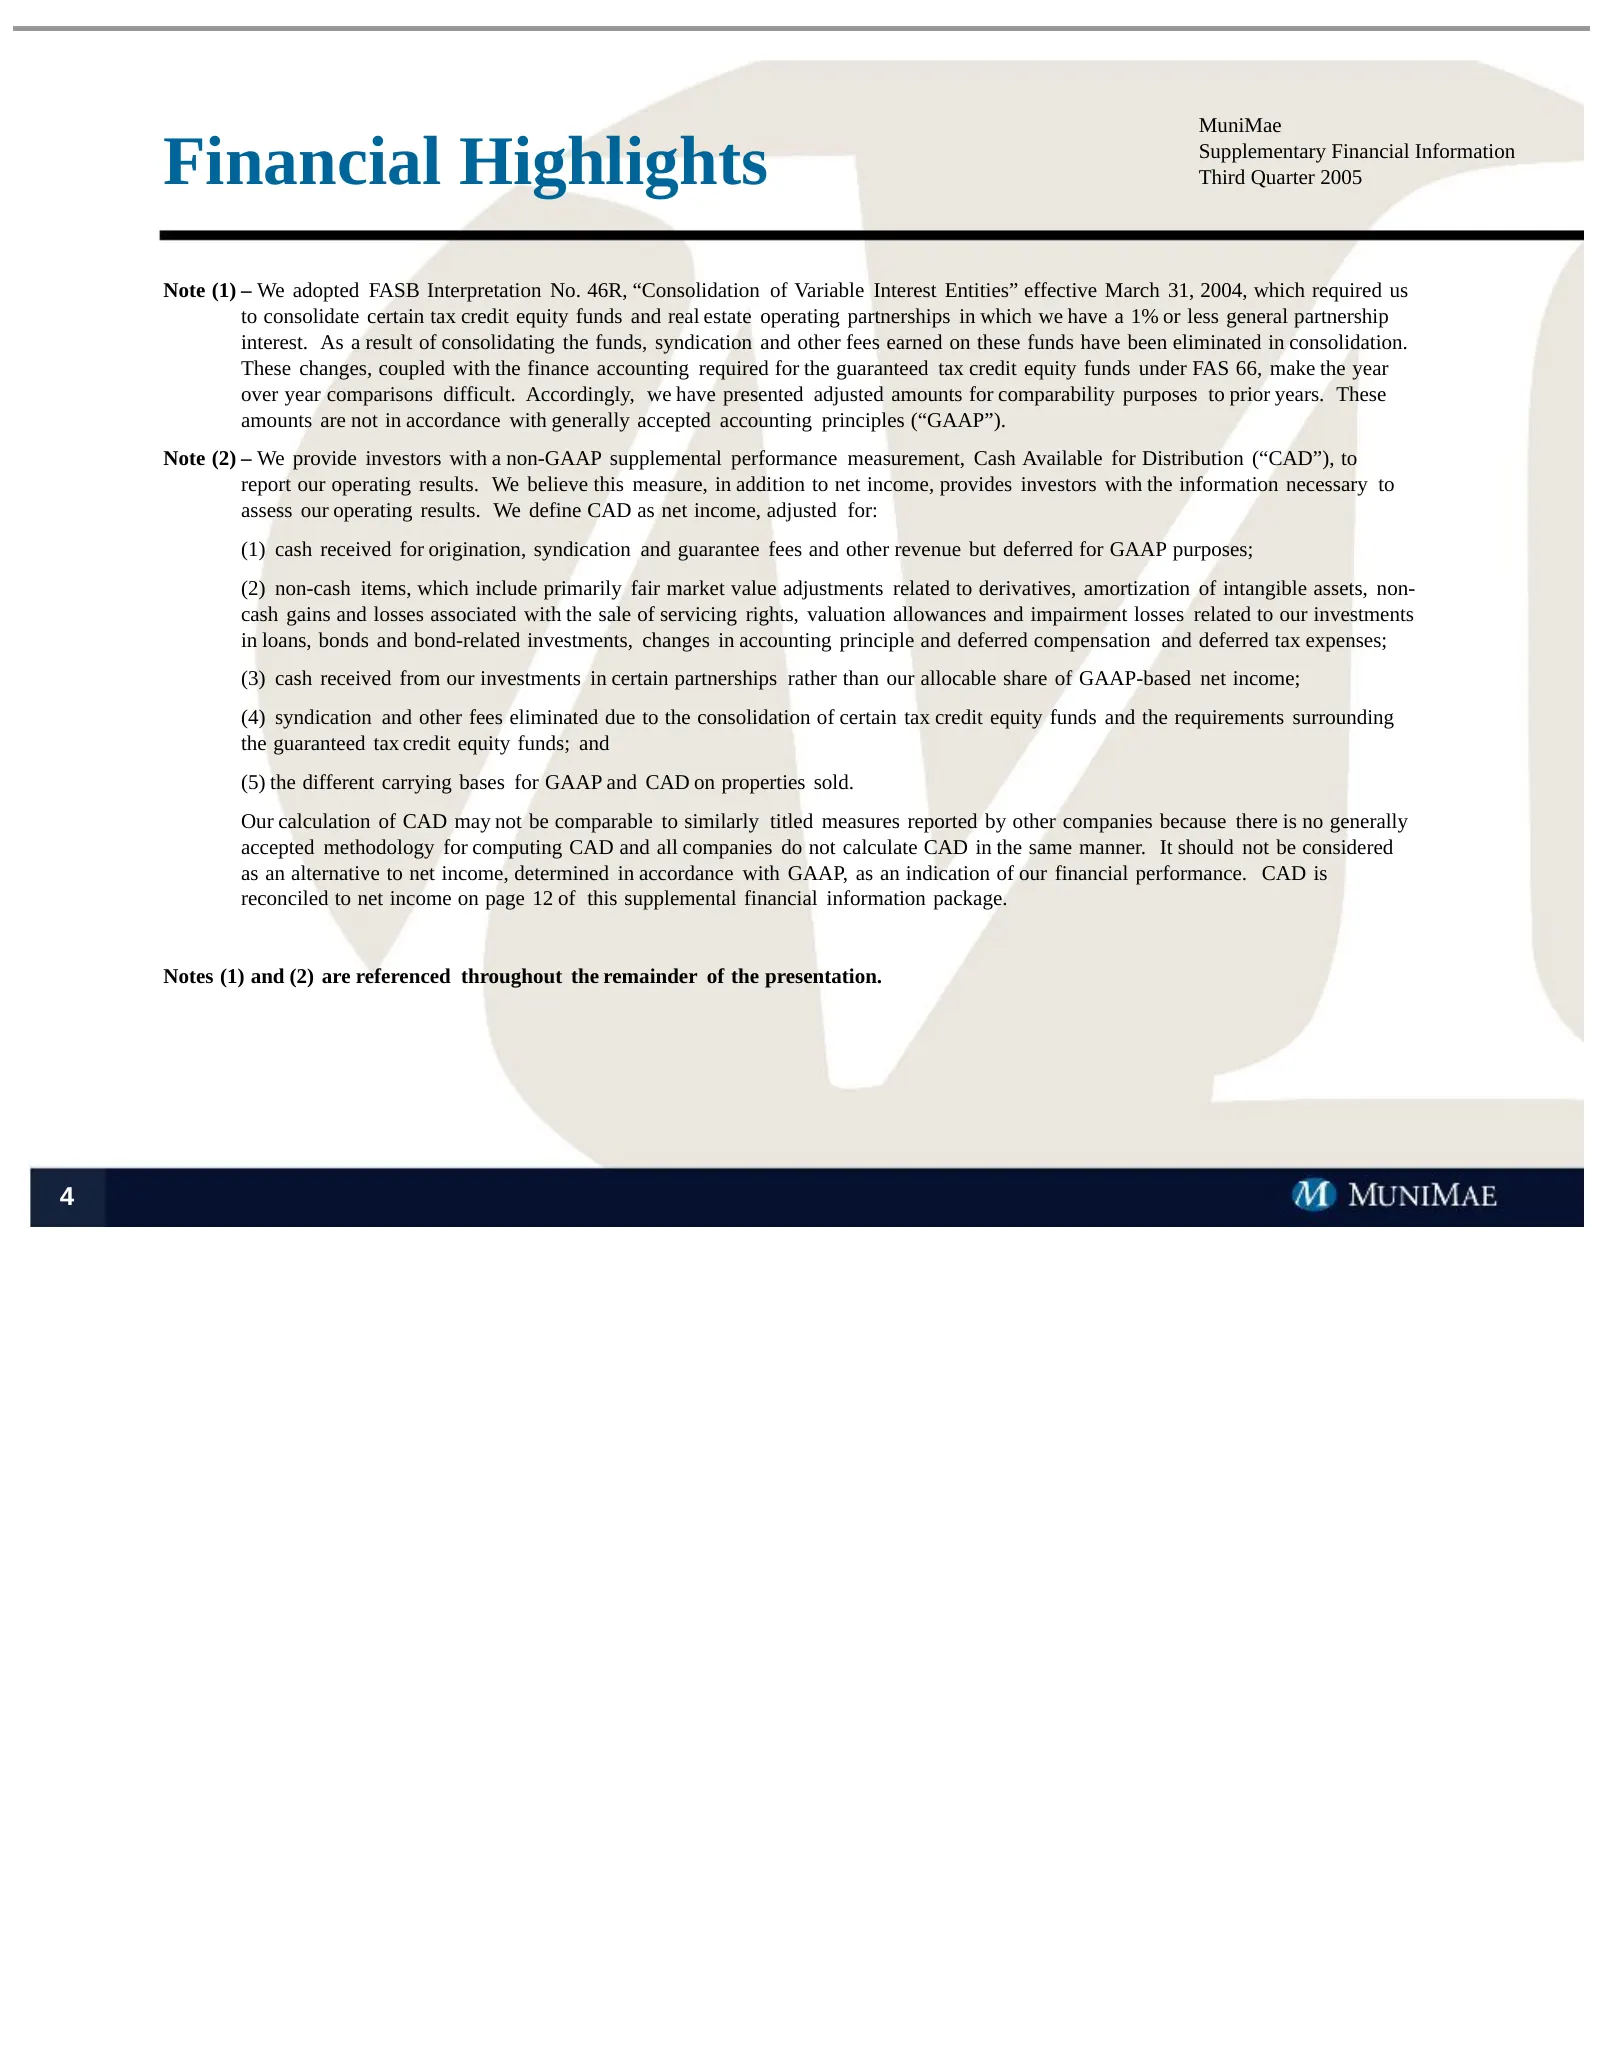
MuniMae Financial Highlights Supplementary Financial Information Third Quarter 2005 Note (1) – We adopted FASB Interpretation No. 46R, “Consolidation of Variable Interest Entities” effective March 31, 2004, which required us to consolidate certain tax credit equity funds and real estate operating pa
Slide 6: Coverage Ratios
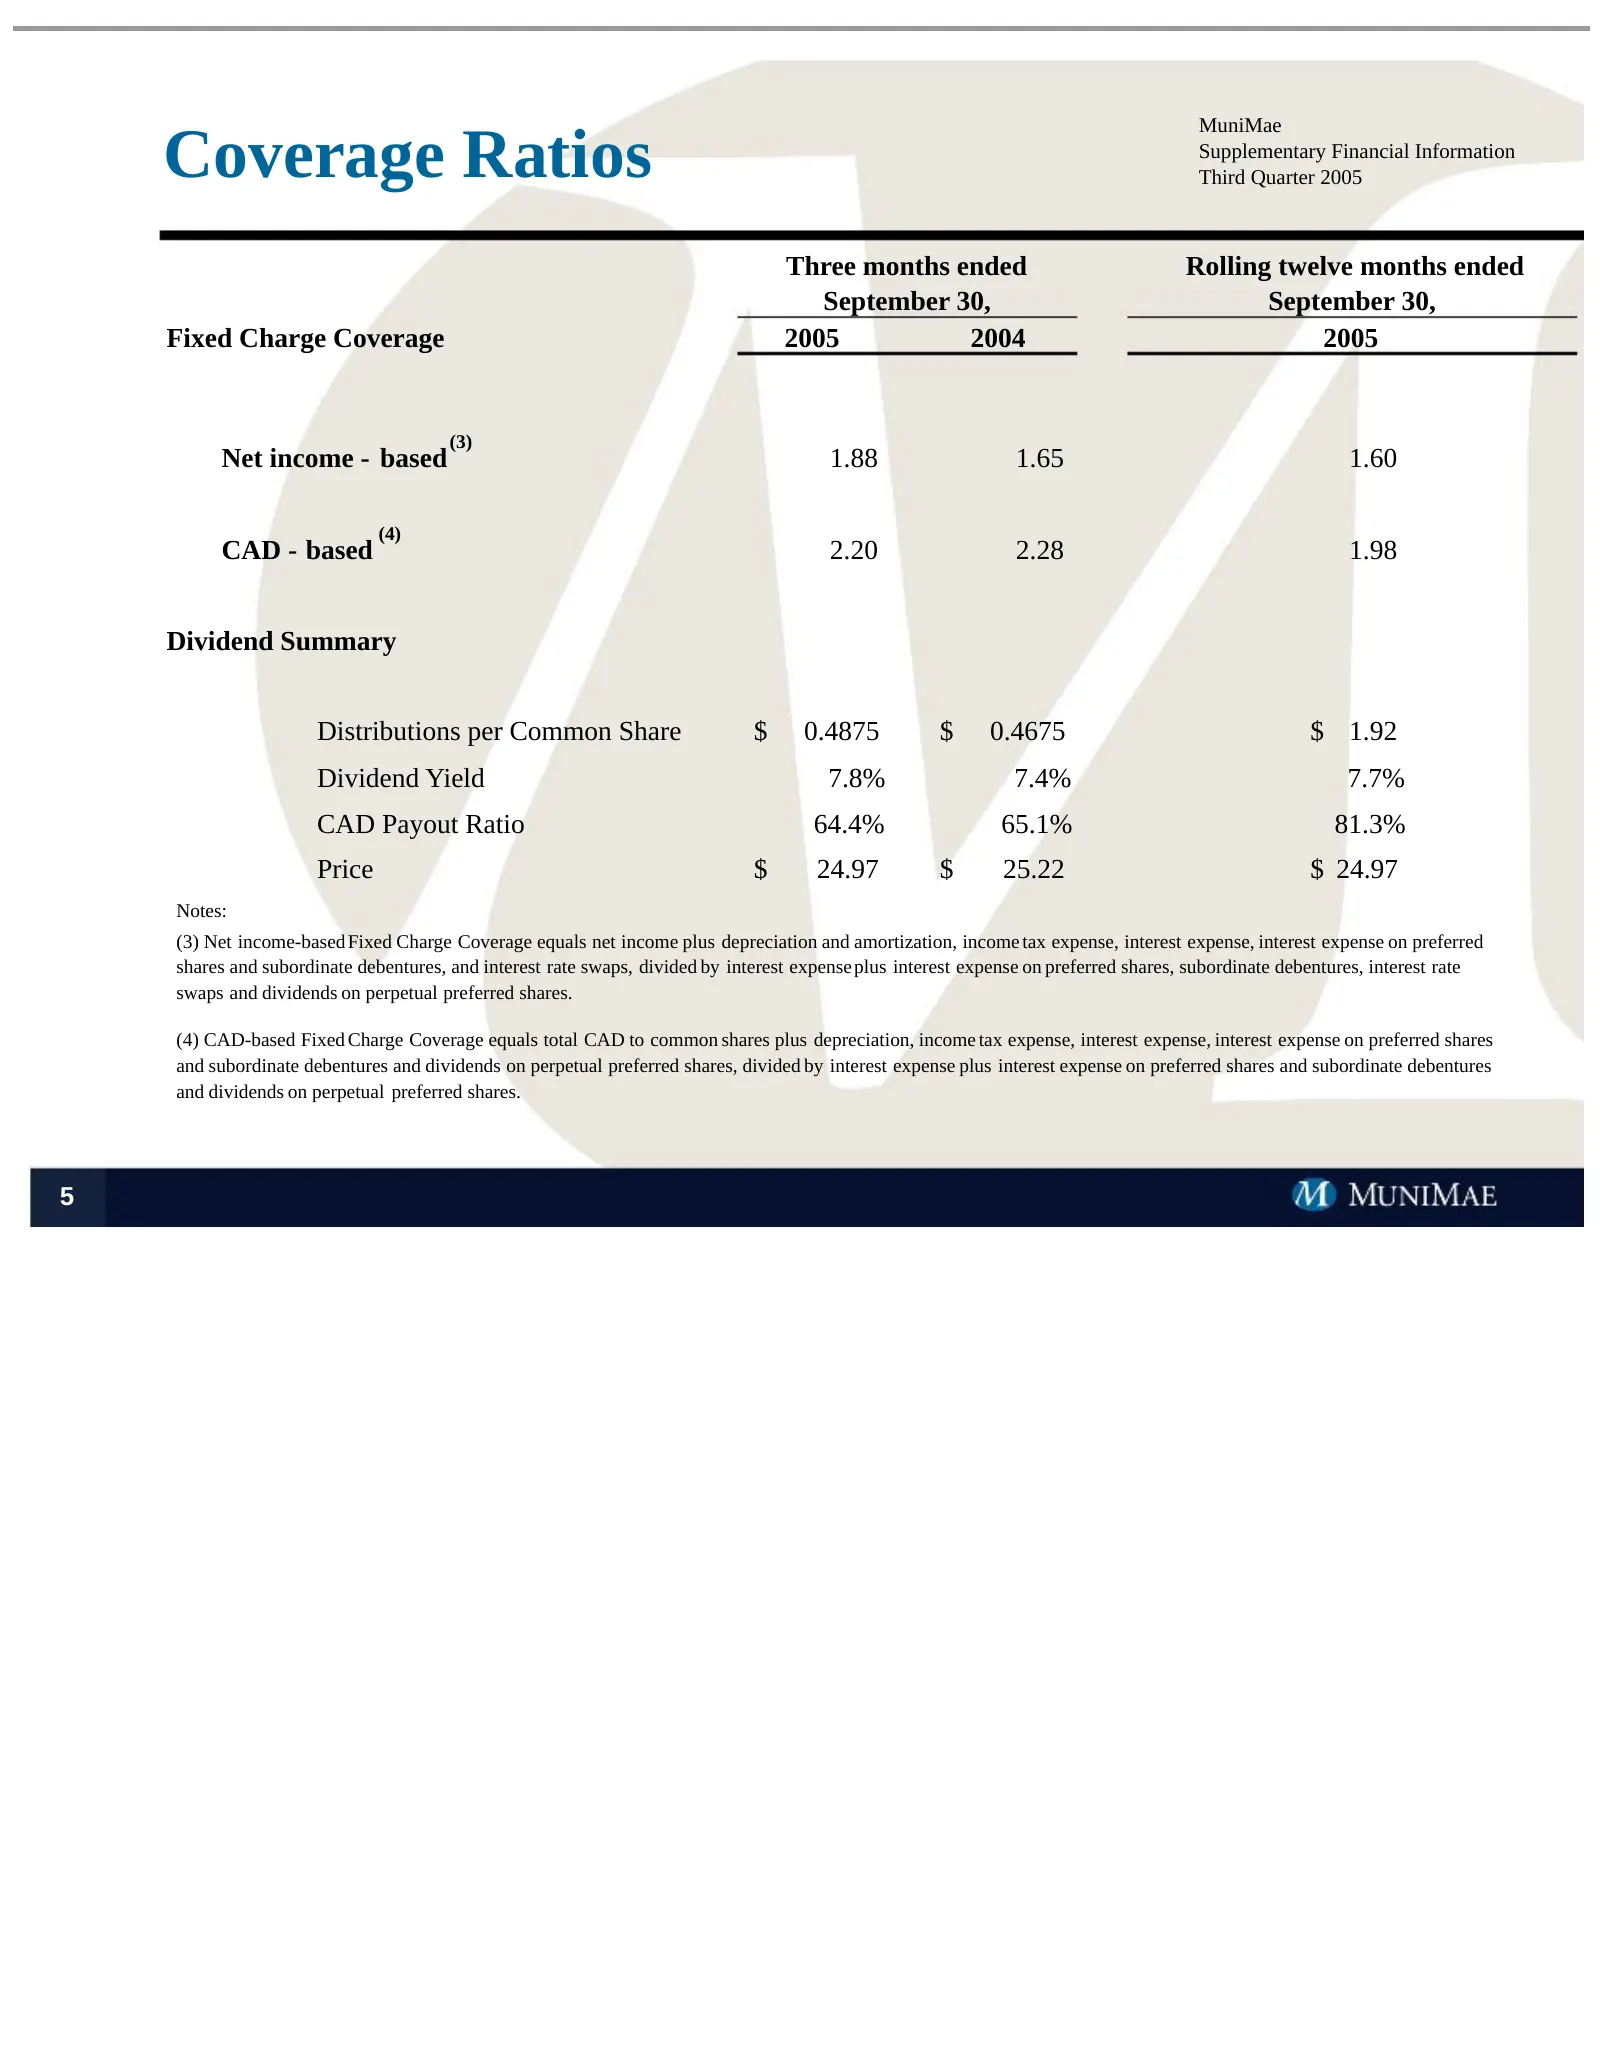
MuniMae Coverage Ratios Supplementary Financial Information Third Quarter 2005 Three months ended Rolling twelve months ended September 30, September 30, Fixed Charge Coverage 2005 2004 2005 (3) Net income - based 1.88 1.65 1.60 (4) CAD - based 2.20 2.28 1.98 Dividend Summary Distributions per Commo
Slide 7: Distribution Growth, CAD Growth, and Payout Ratio
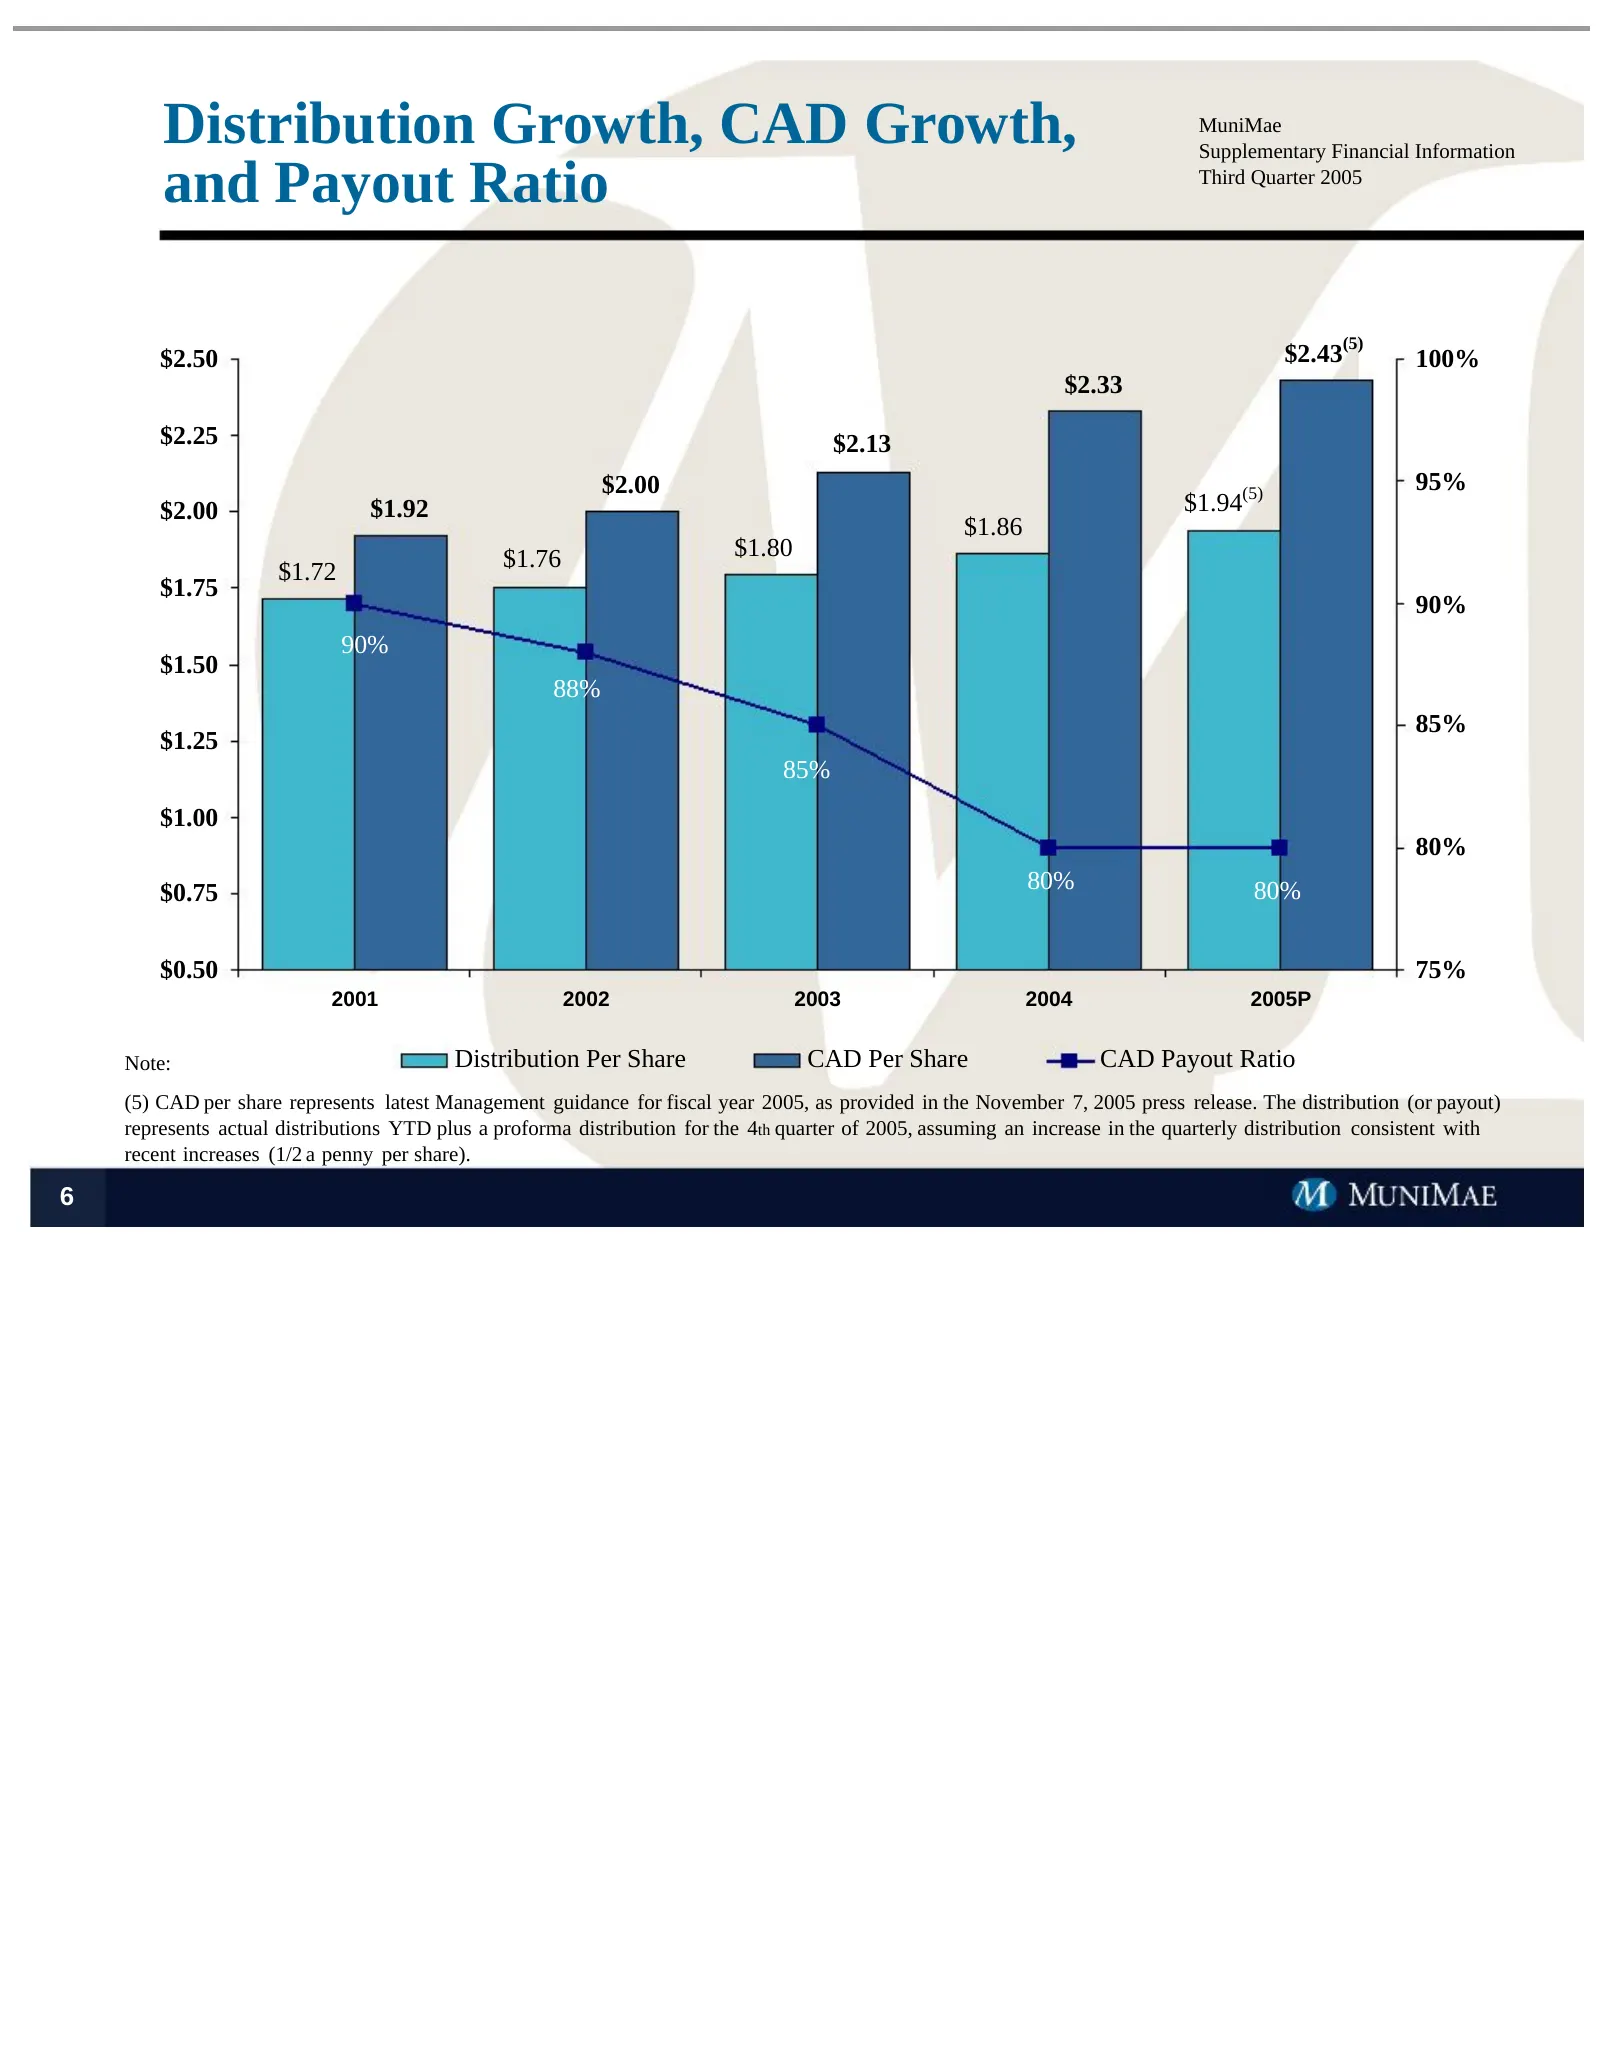
Distribution Growth, CAD Growth, MuniMae Supplementary Financial Information and Payout Ratio Third Quarter 2005 $2.50 $2.43(5) 100% $2.33 $2.25 $2.13 $2.00 95% $2.00 $1.92 $1.94(5) $1.86 $1.76 $1.80 $1.72 $1.75 90% 90% $1.50 88% 85% $1.25 85% $1.00 80% $0.75 80% 80% $0.50 75% 2001 2002 2003 2004 20
Slide 8: Market Capitalization and Leverage
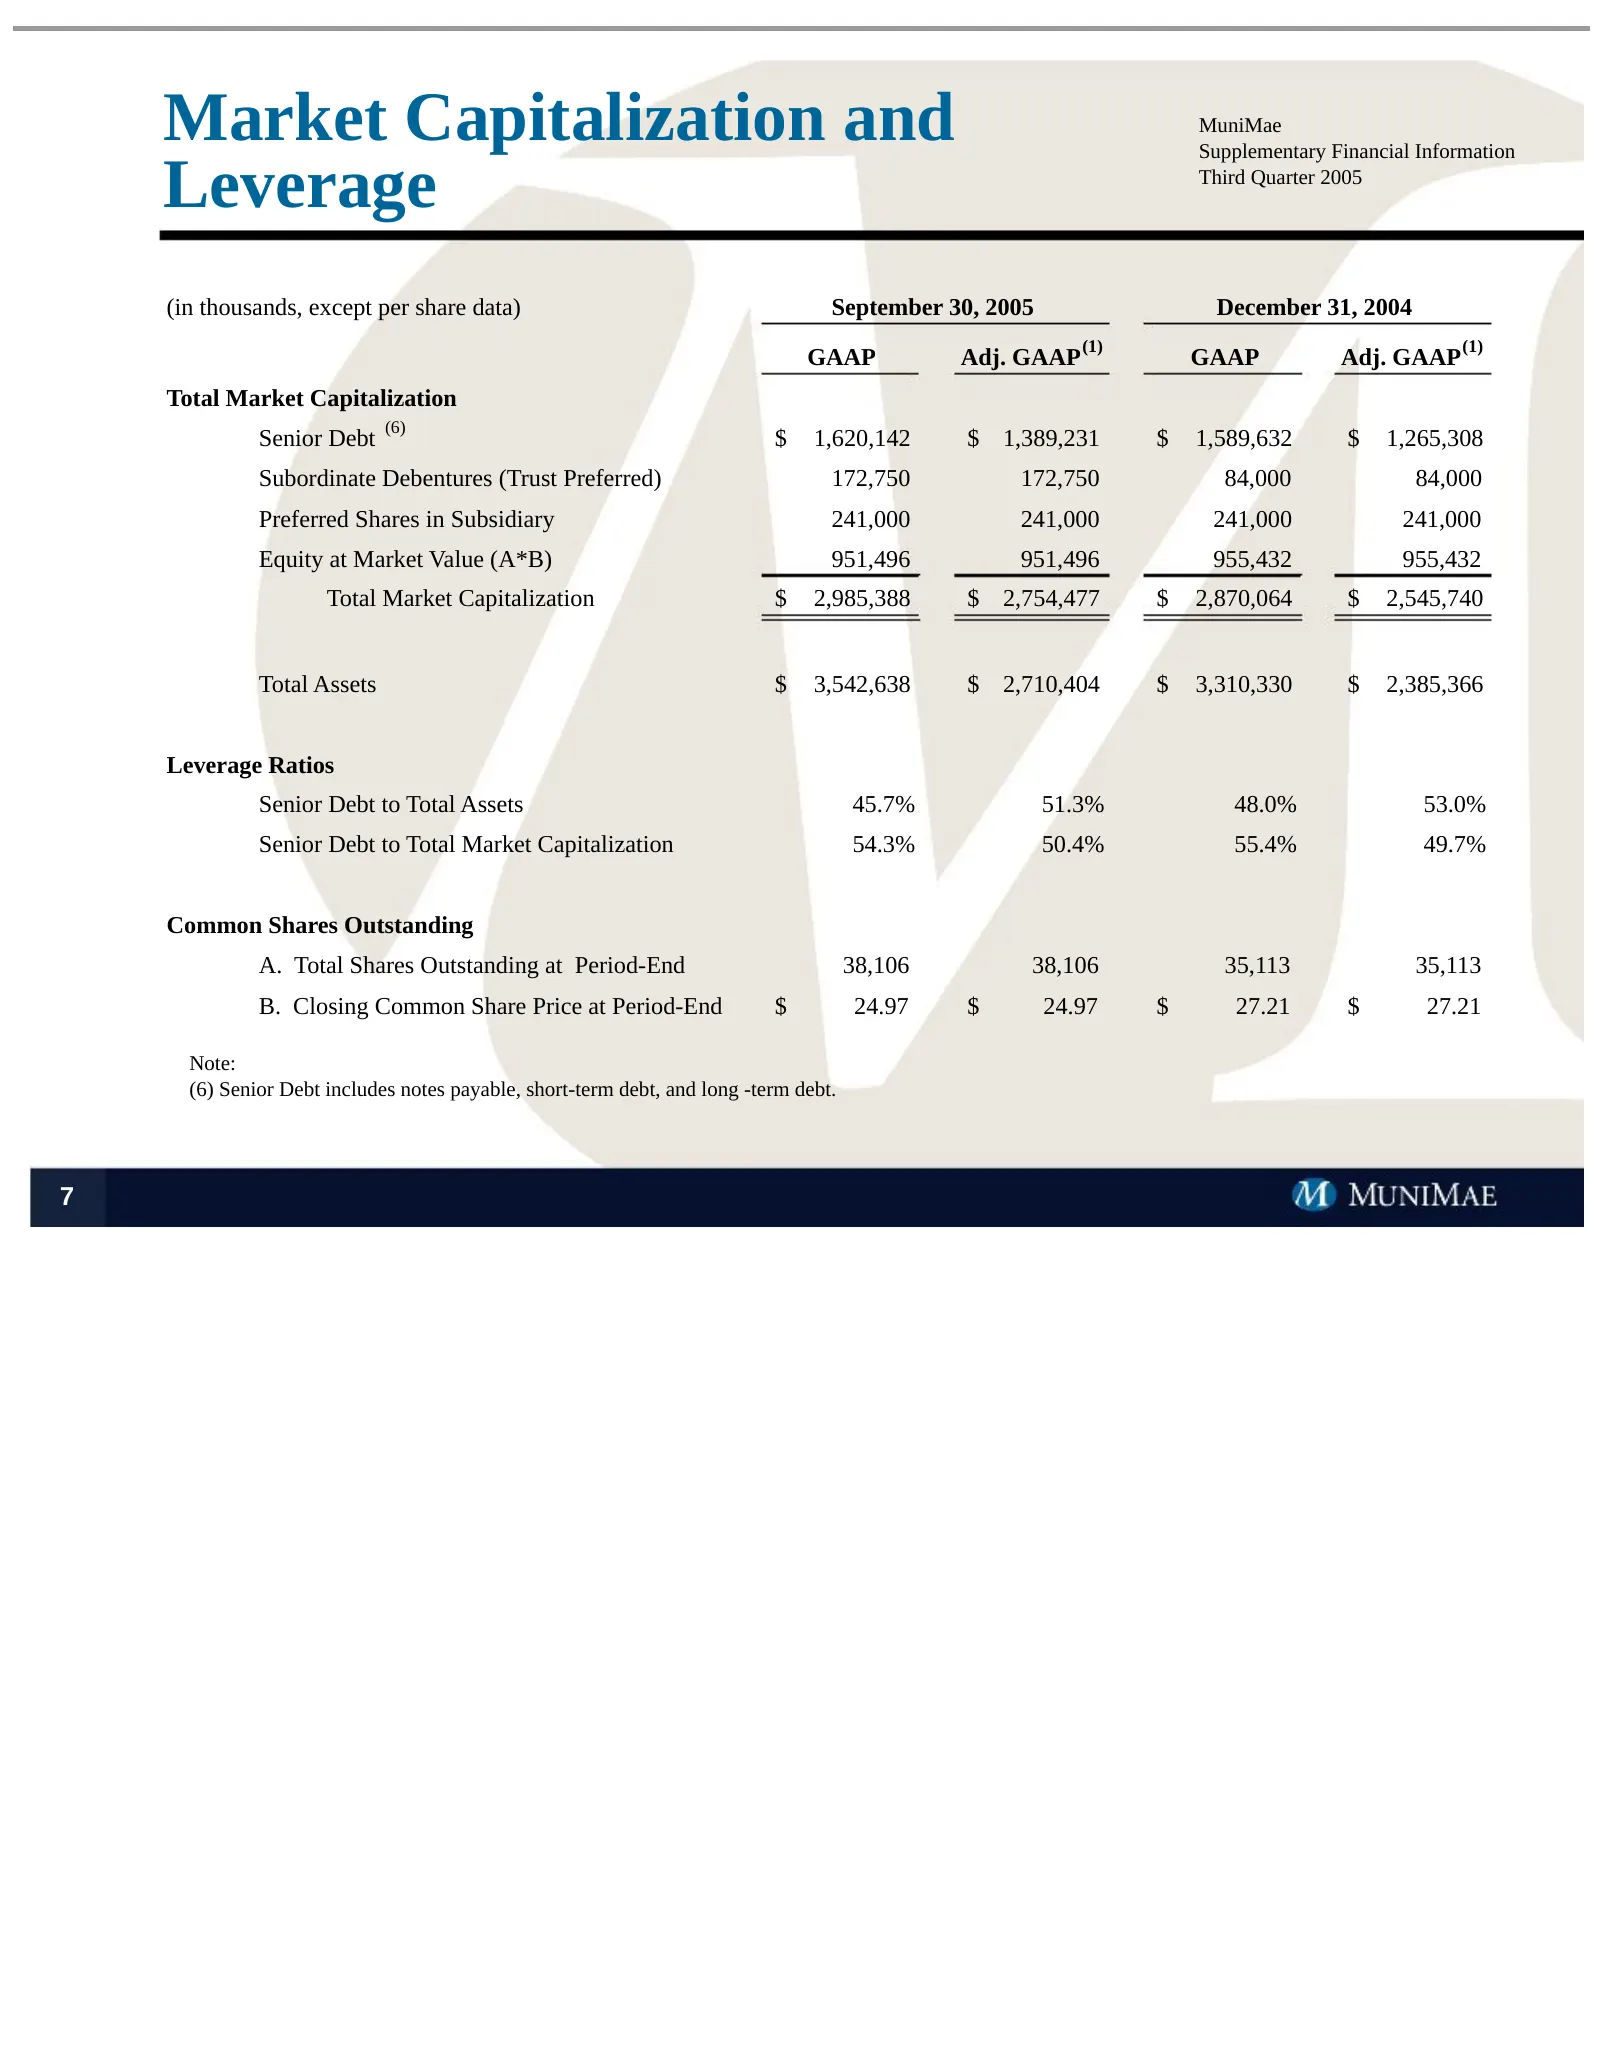
Market Capitalization and MuniMae Supplementary Financial Information Leverage Third Quarter 2005 (in thousands, except per share data) September 30, 2005 December 31, 2004 (1) (1) GAAP Adj. GAAP GAAP Adj. GAAP Total Market Capitalization (6) Senior Debt $ 1,620,142 $ 1,389,231 $ 1,589,632 $ 1,265,3
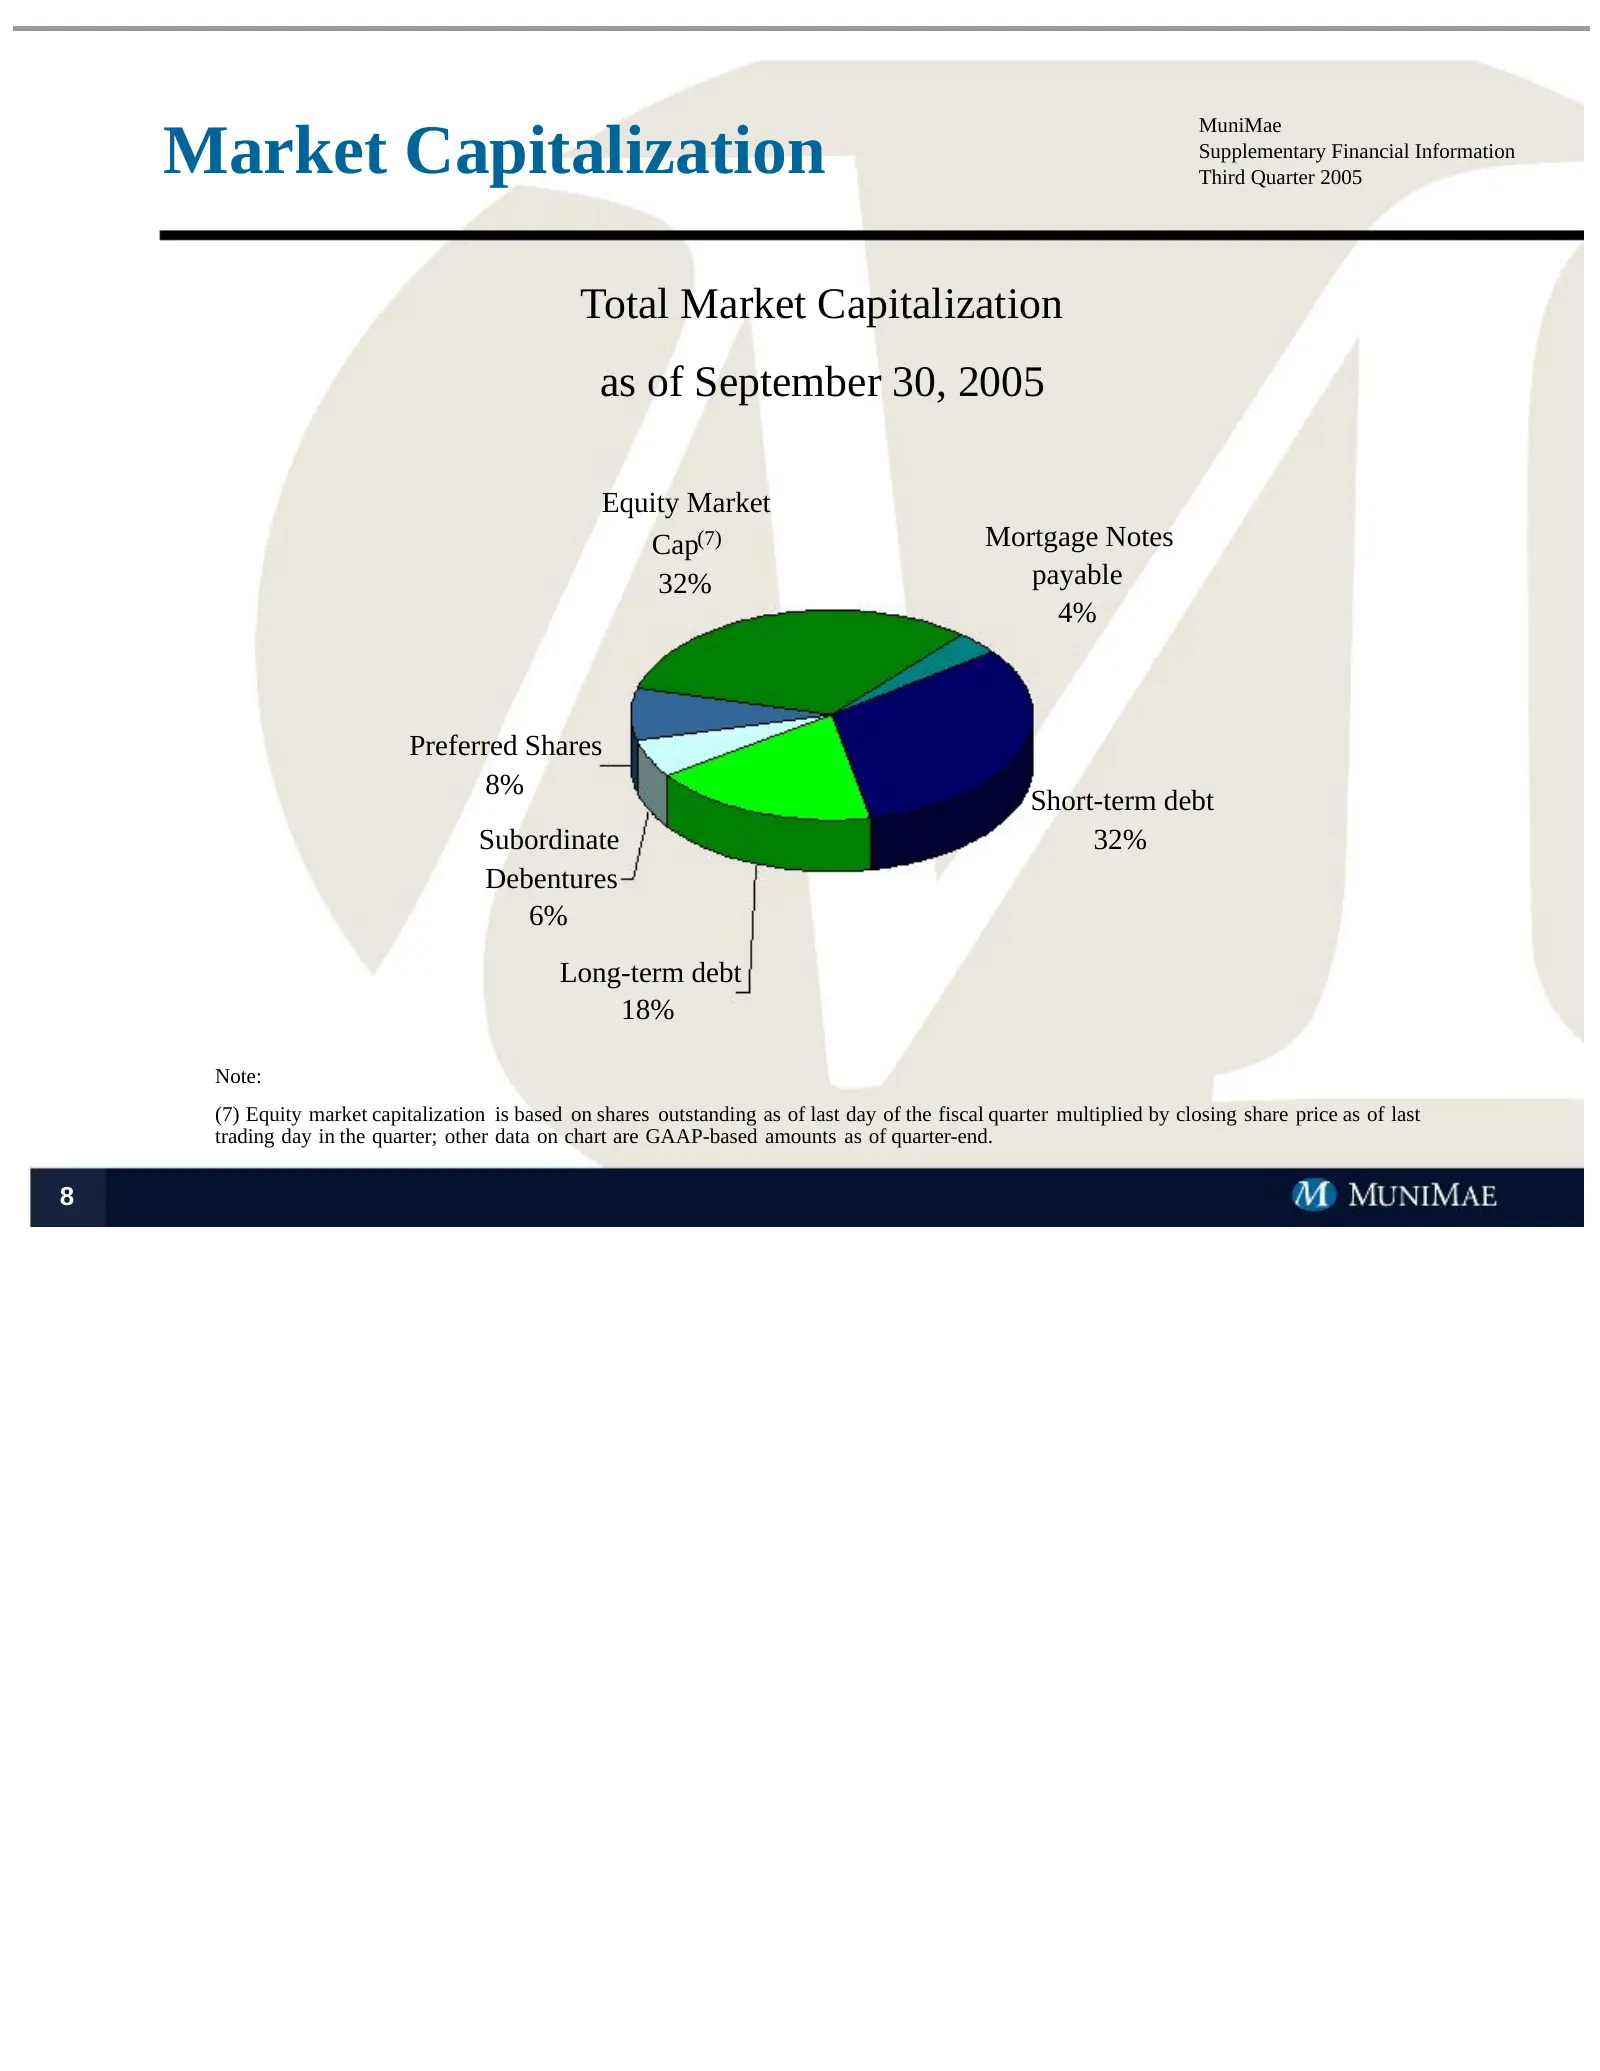
Slide 9: Market Capitalization
Market Capitalization MuniMae Supplementary Financial Information Third Quarter 2005 Total Market Capitalization as of September 30, 2005 Equity Market Cap(7) Mortgage Notes 32% payable 4% Preferred Shares 8% Short-term debt Subordinate 32% Debentures 6% Long-term debt 18% Note: (7) Equity market ca
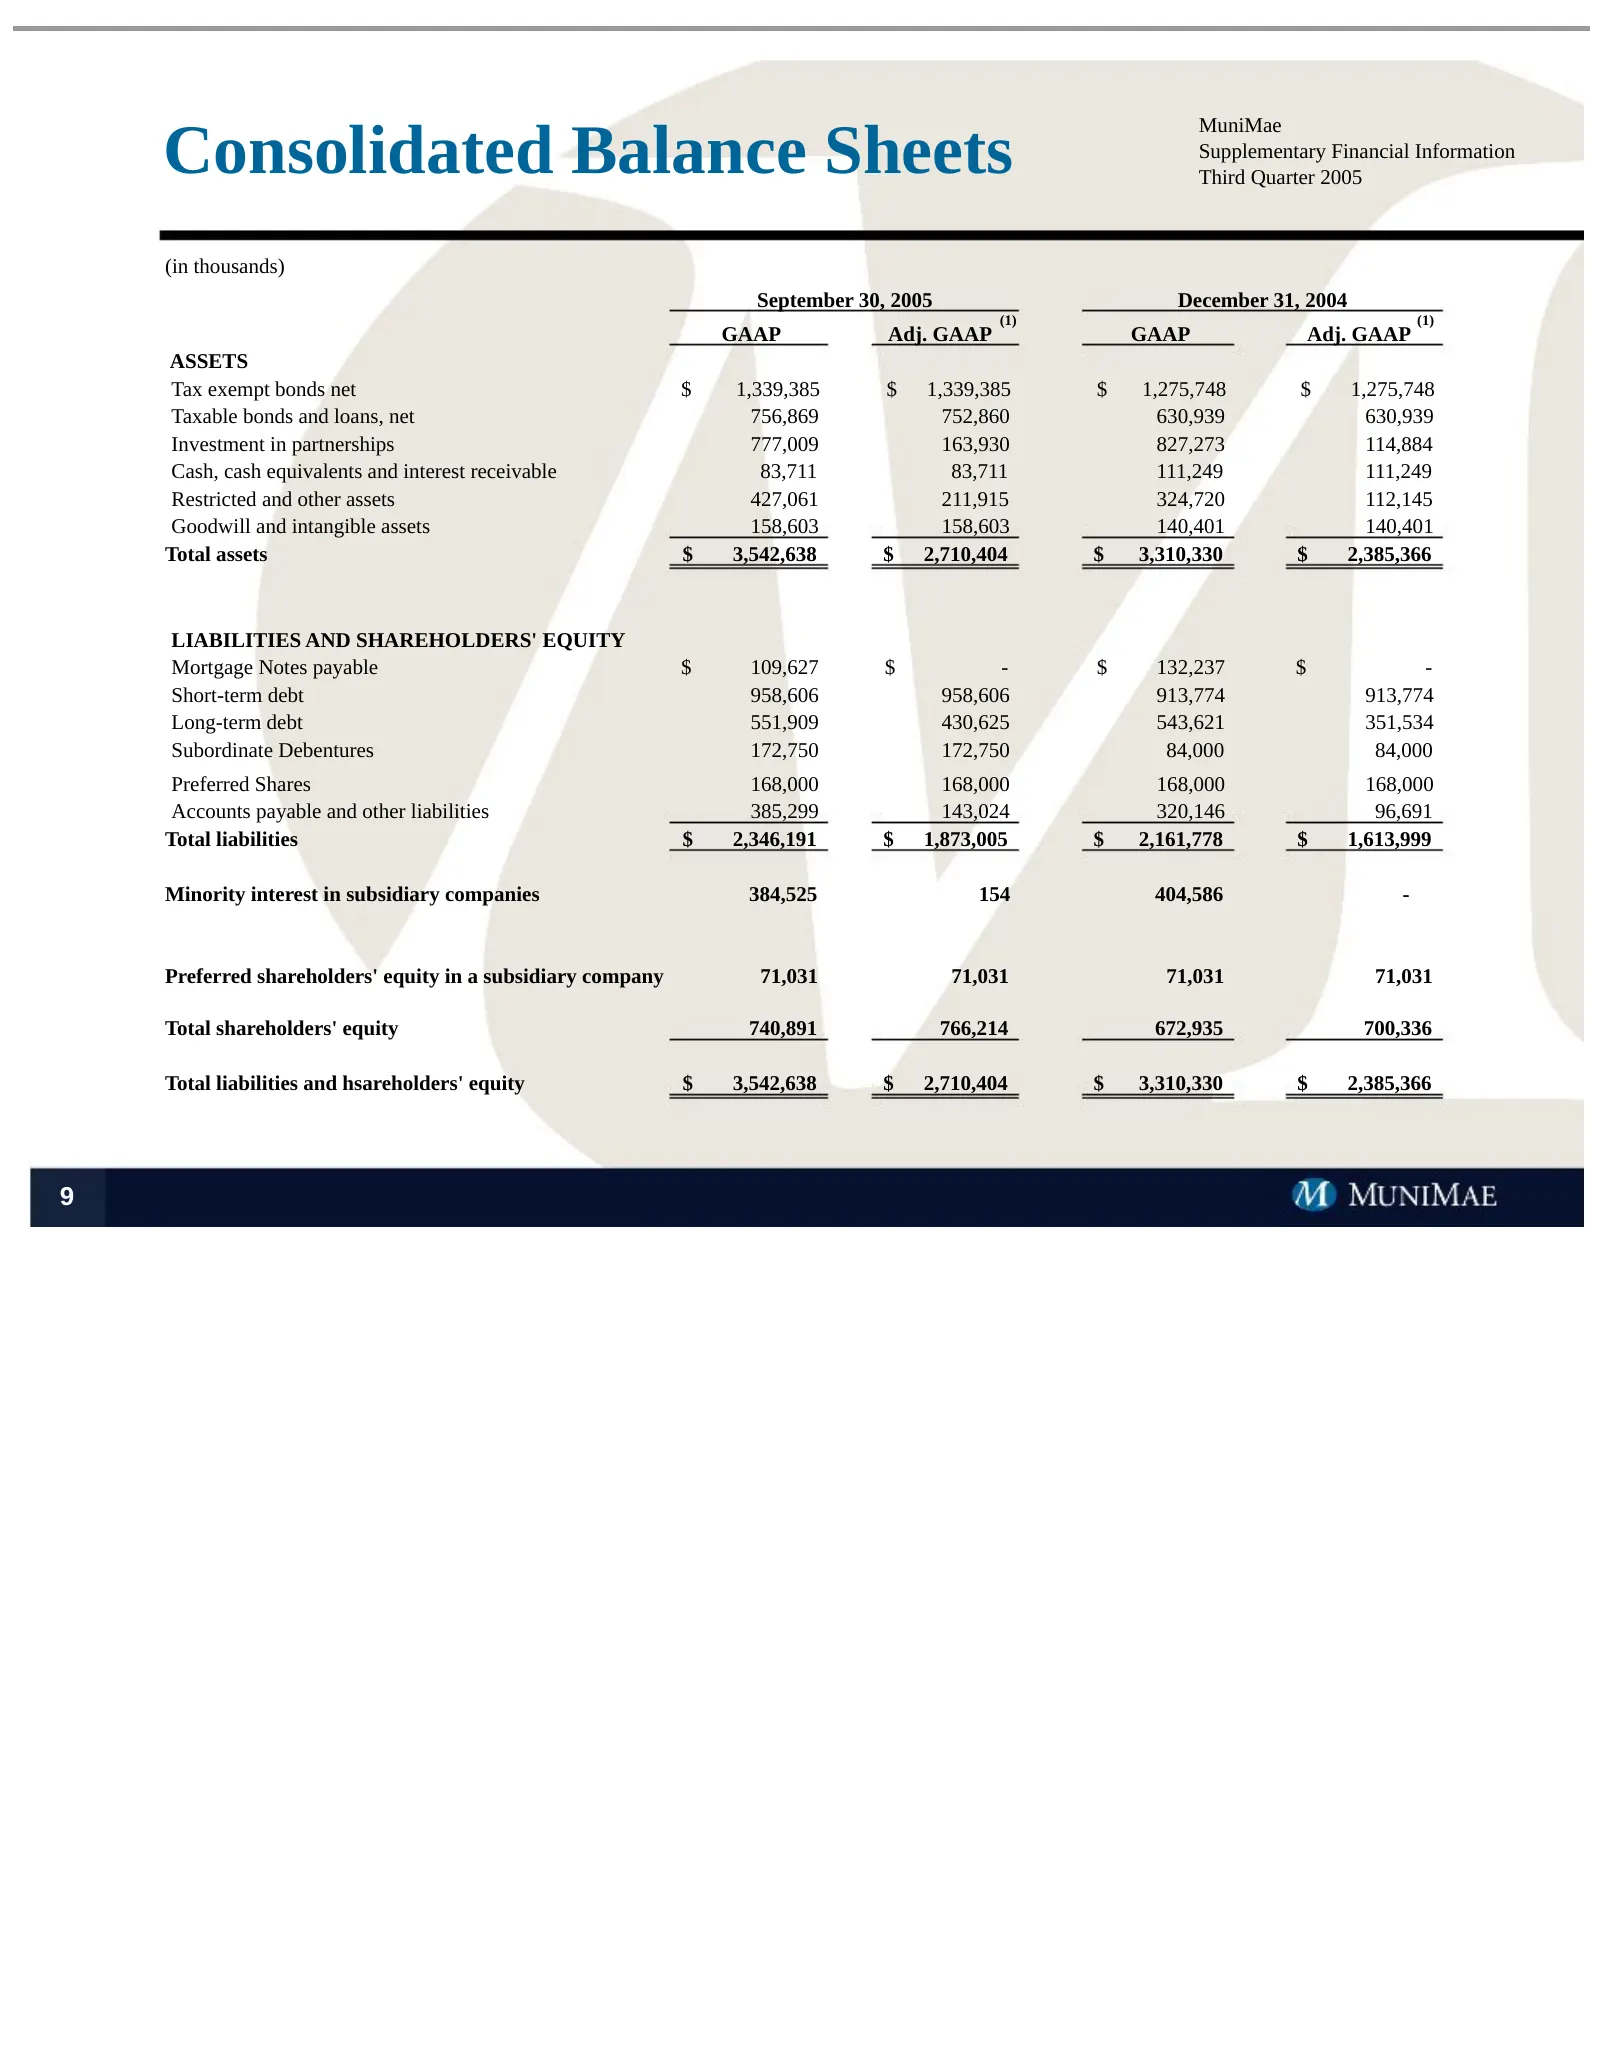
Slide 10: Consolidated Balance Sheets
Consolidated Balance Sheets MuniMae Supplementary Financial Information Third Quarter 2005 (in thousands) September 30, 2005 December 31, 2004 (1) (1) GAAP Adj. GAAP GAAP Adj. GAAP ASSETS Tax exempt bonds net $ 1,339,385 $ 1,339,385 $ 1,275,748 $ 1,275,748 Taxable bonds and loans, net 756,869 752,86
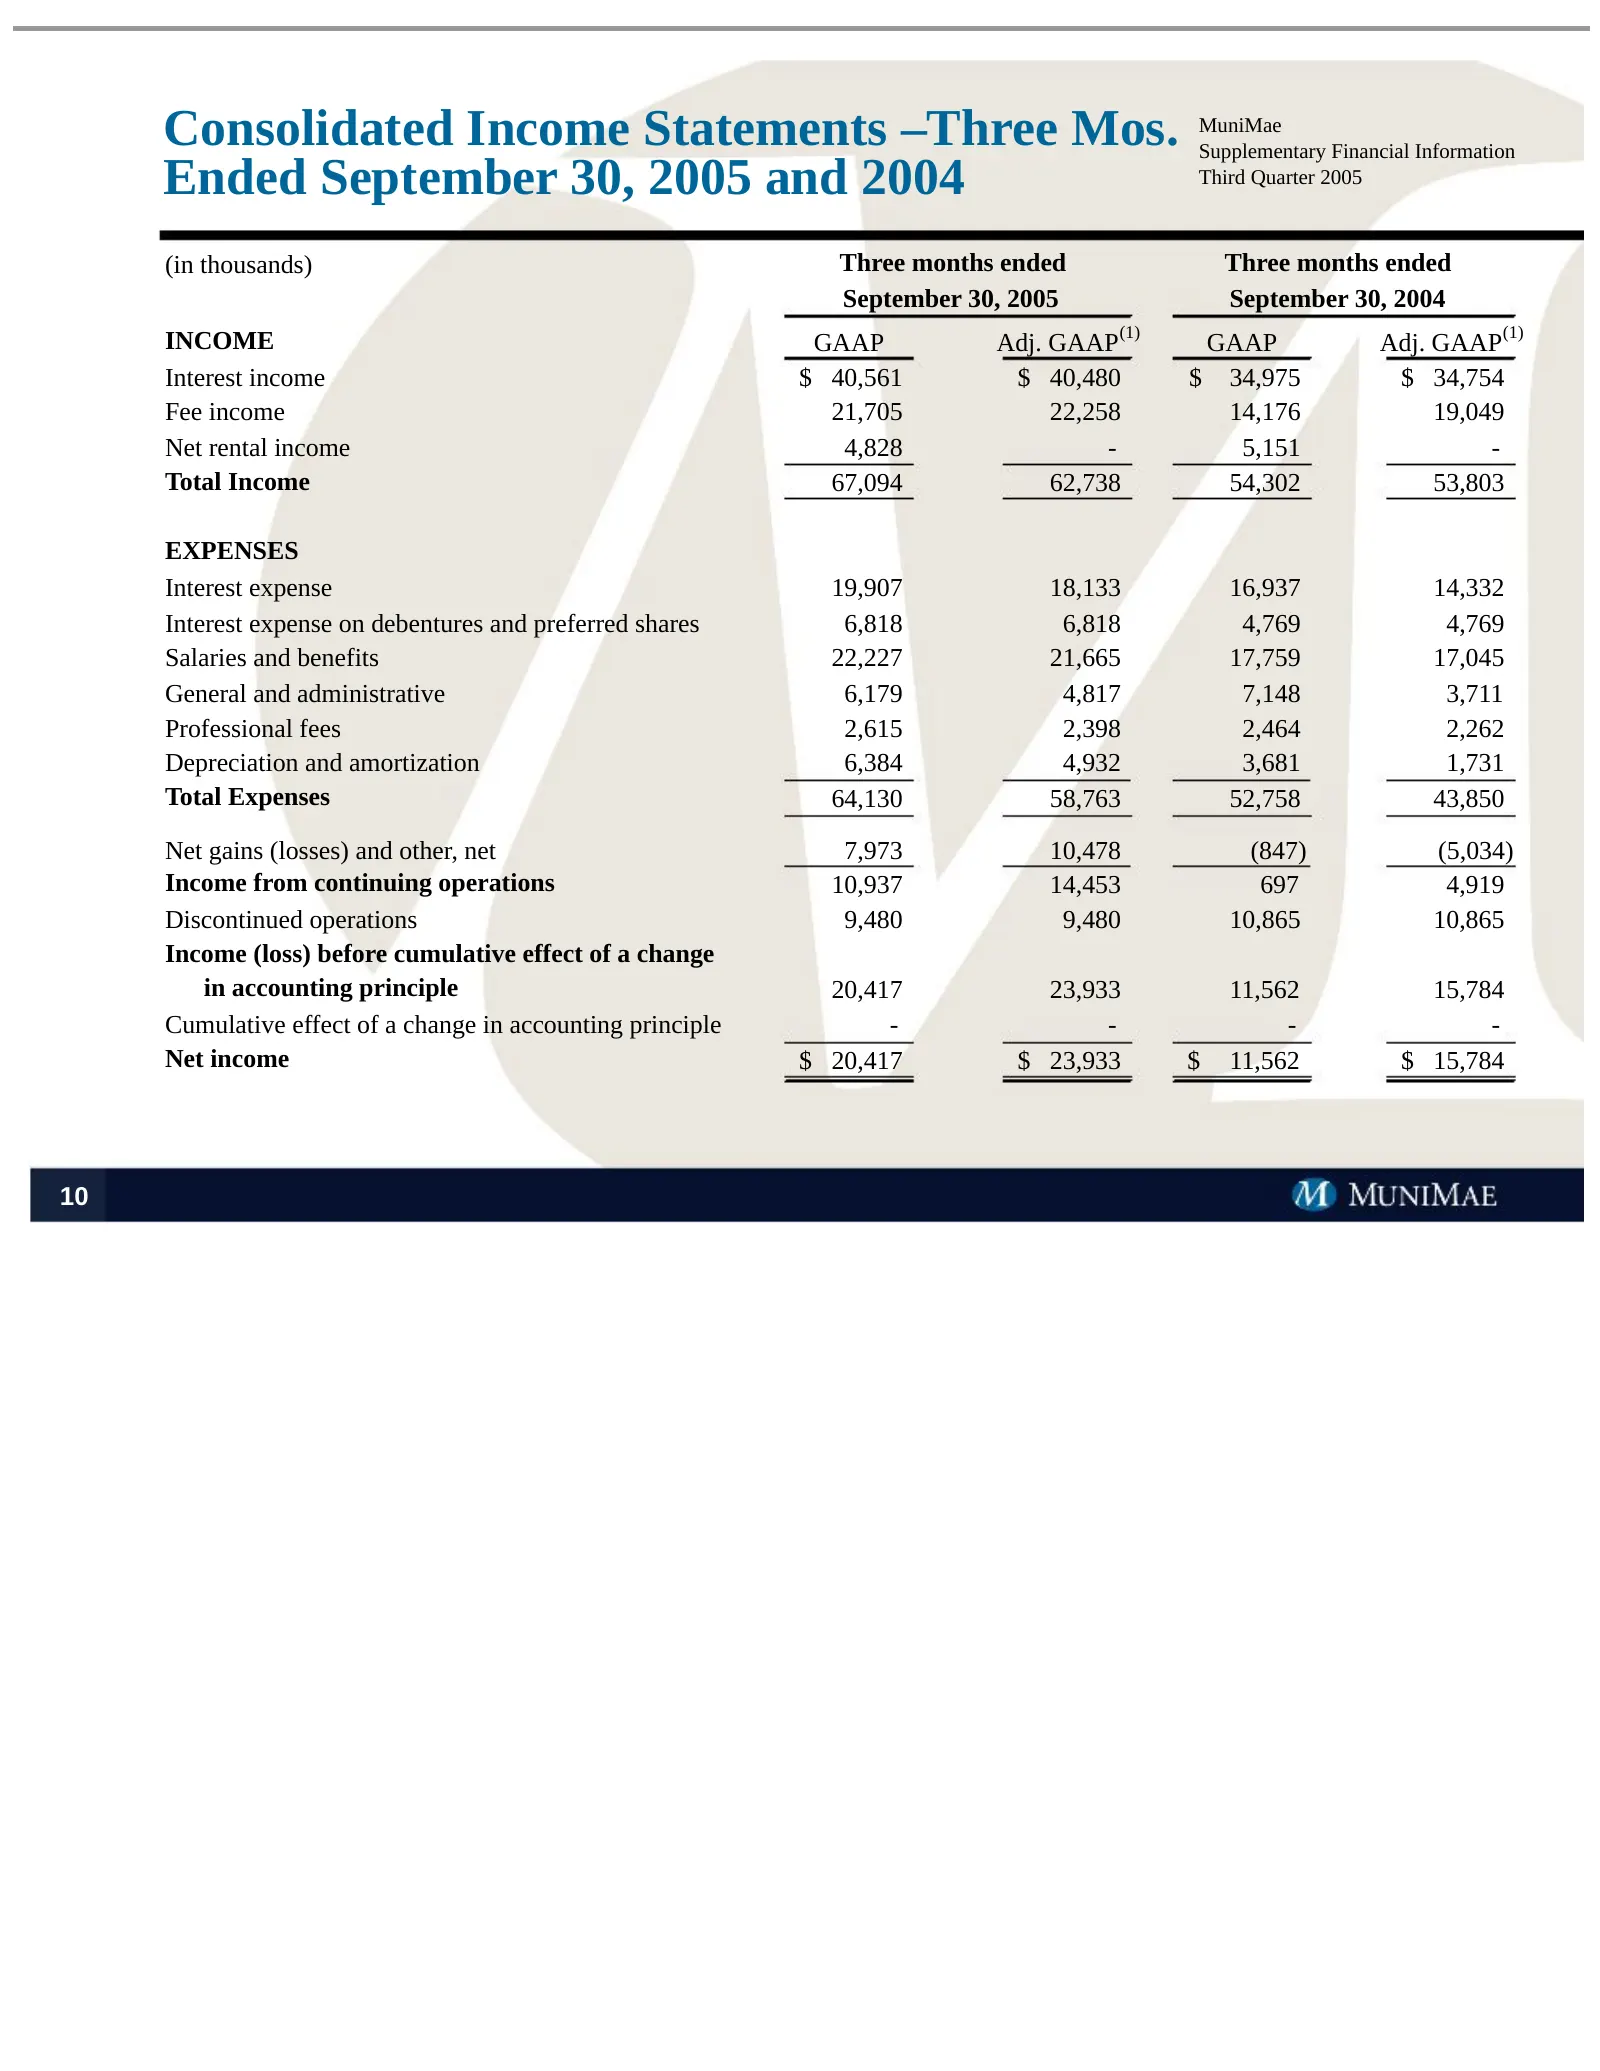
Slide 11: Consolidated Income Statements – Three Months Ended September 30, 2005 and 2004
Consolidated Income Statements –Three Mos. MuniMae Supplementary Financial Information Ended September 30, 2005 and 2004 Third Quarter 2005 (in thousands) Three months ended Three months ended September 30, 2005 September 30, 2004 INCOME GAAP Adj. GAAP(1) GAAP Adj. GAAP(1) Interest income $ 40,561 $
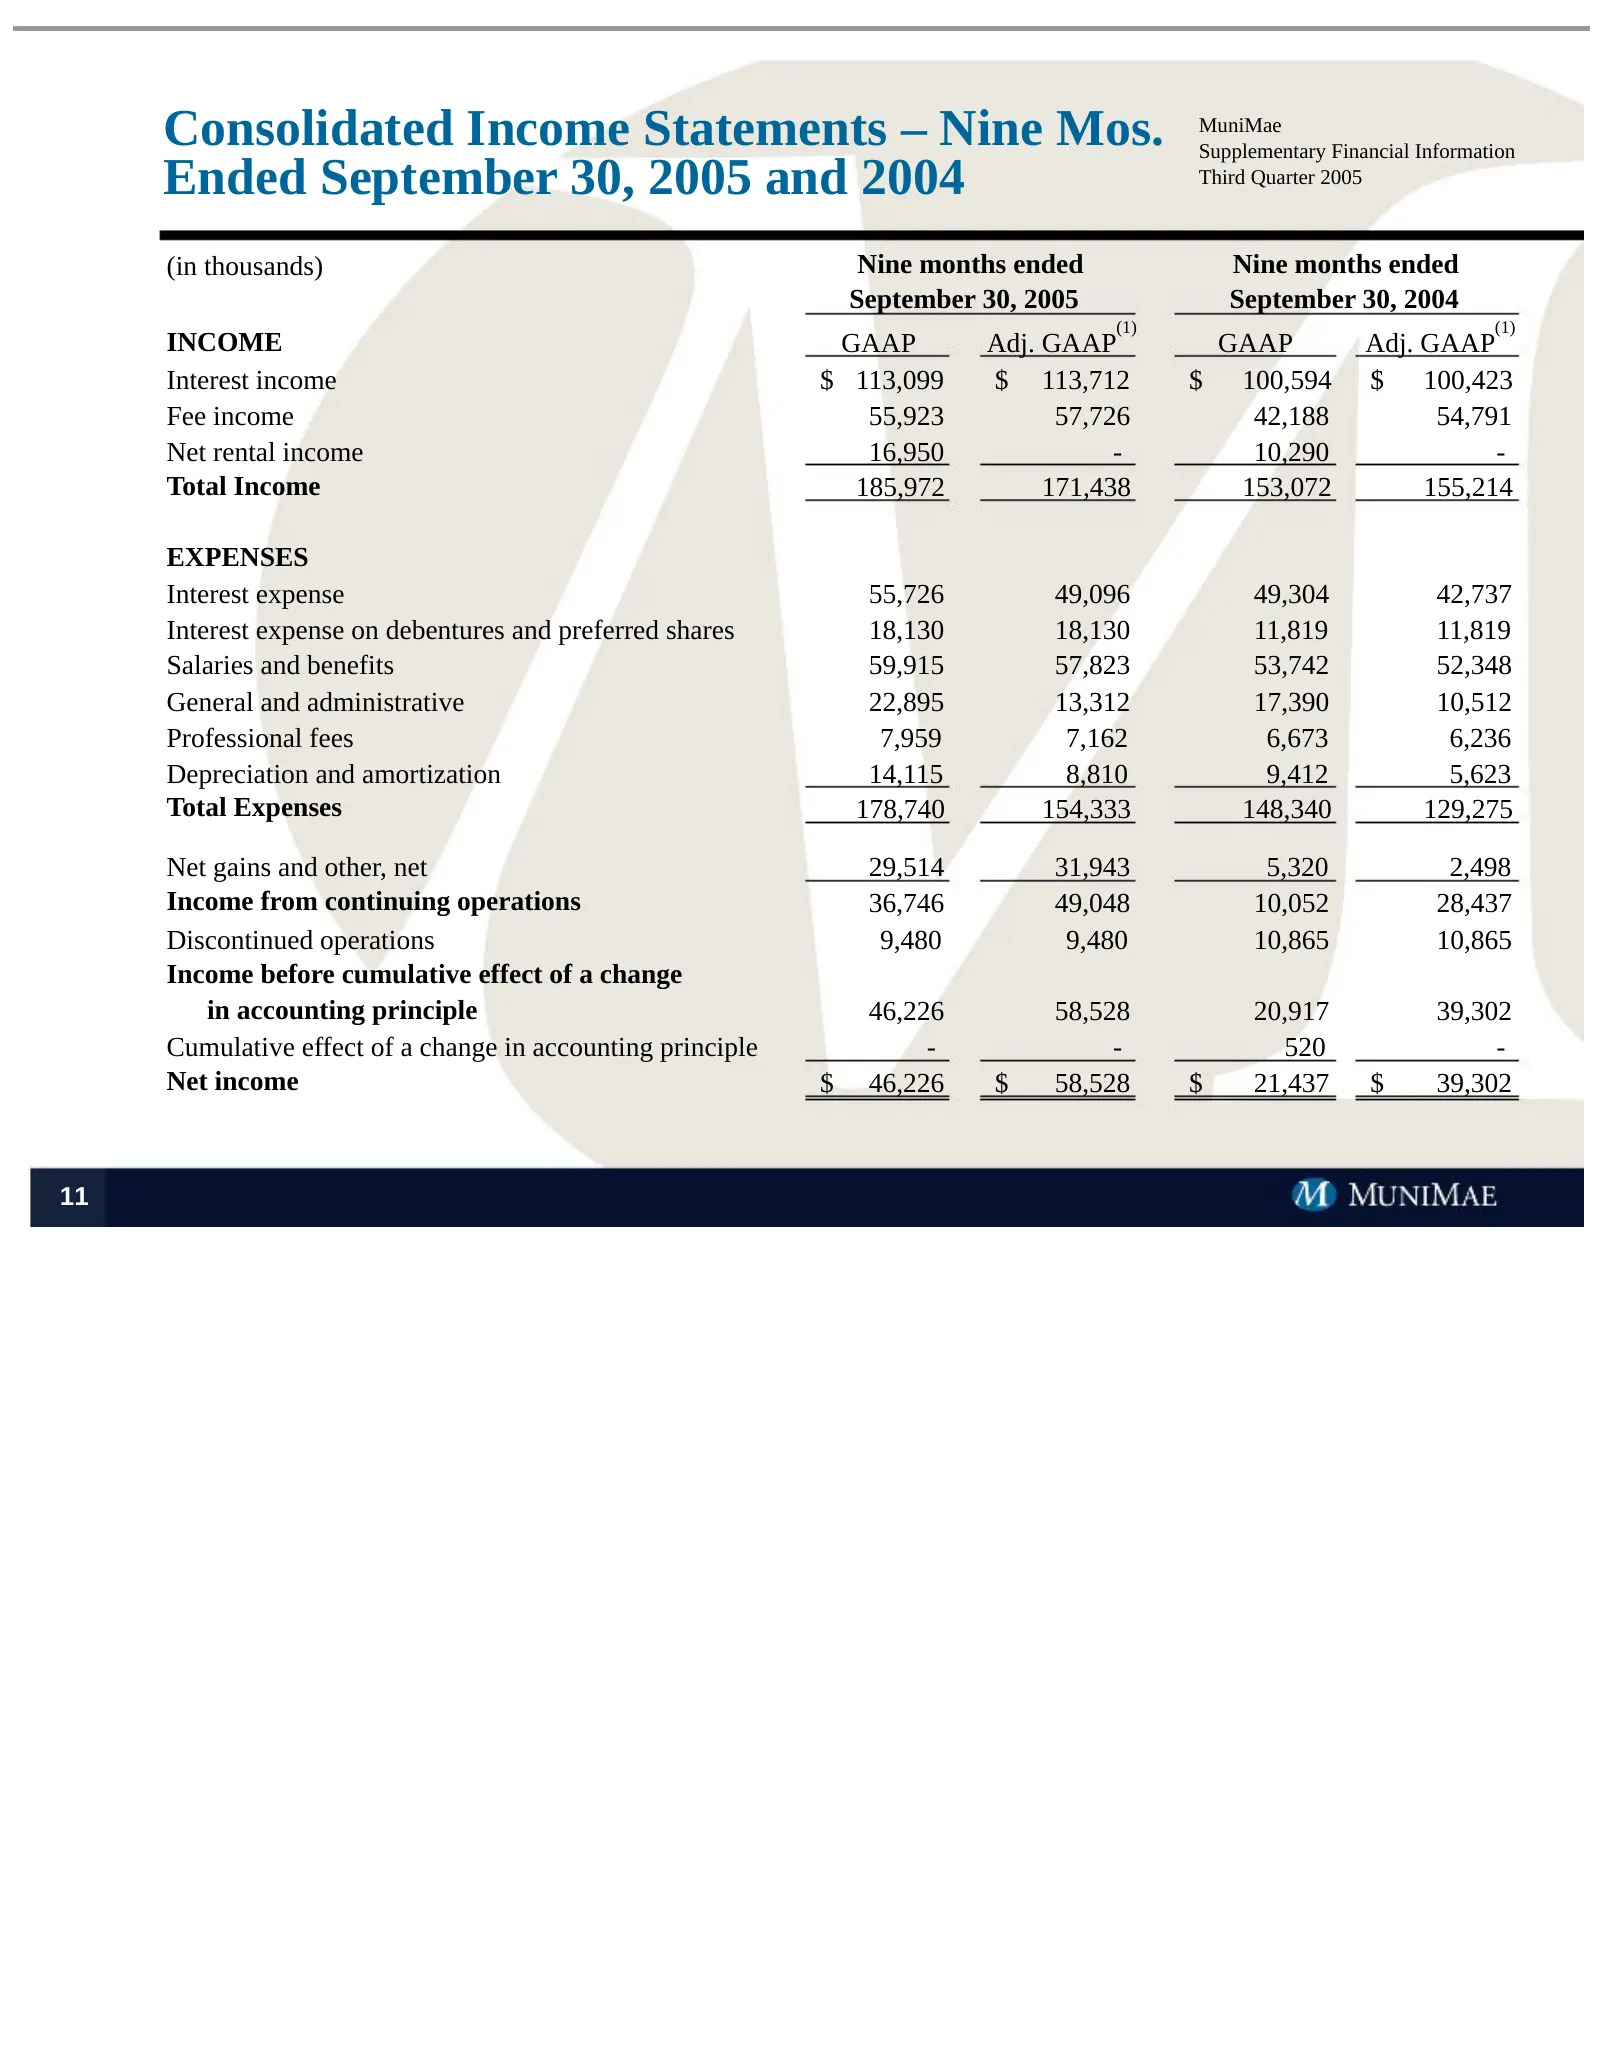
Slide 12: Consolidated Income Statements – Nine Months Ended September 30, 2005 and 2004
Consolidated Income Statements – Nine Mos. MuniMae Supplementary Financial Information Ended September 30, 2005 and 2004 Third Quarter 2005 (in thousands) Nine months ended Nine months ended September 30, 2005 September 30, 2004 (1) (1) INCOME GAAP Adj. GAAP GAAP Adj. GAAP Interest income $ 113,099
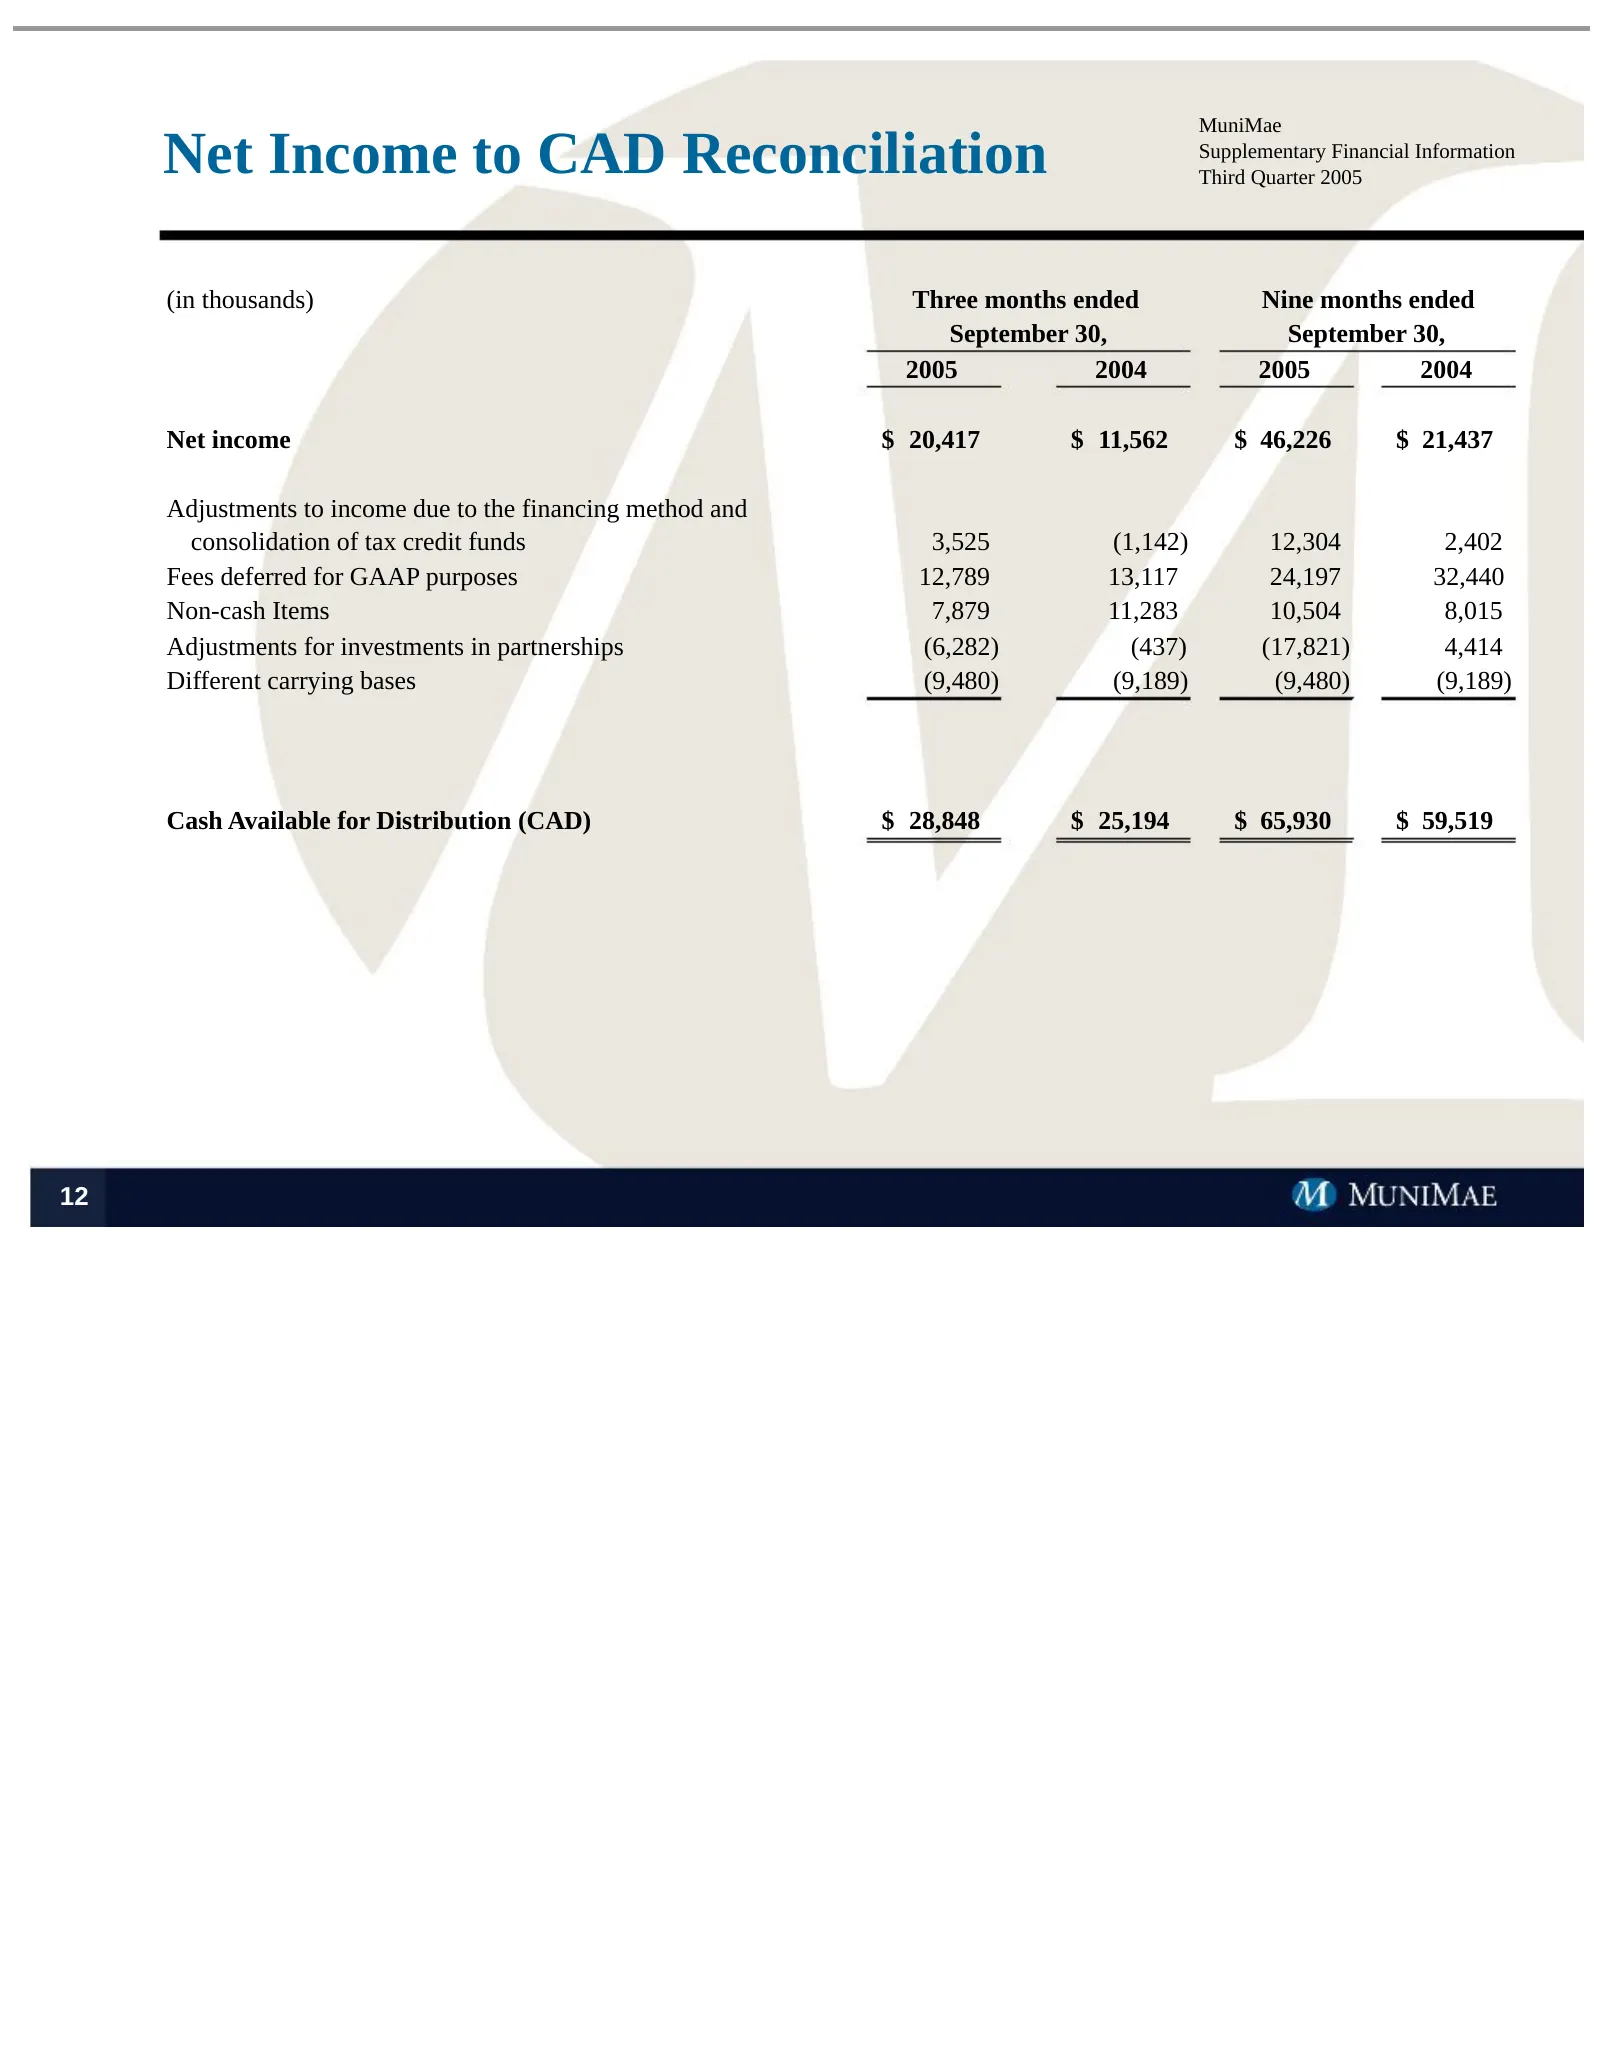
Slide 13: Net Income to CAD Reconciliation
MuniMae Net Income to CAD Reconciliation Supplementary Financial Information Third Quarter 2005 (in thousands) Three months ended Nine months ended September 30, September 30, 2005 2004 2005 2004 Net income $ 20,417 $ 11,562 $ 46,226 $ 21,437 Adjustments to income due to the financing method and con
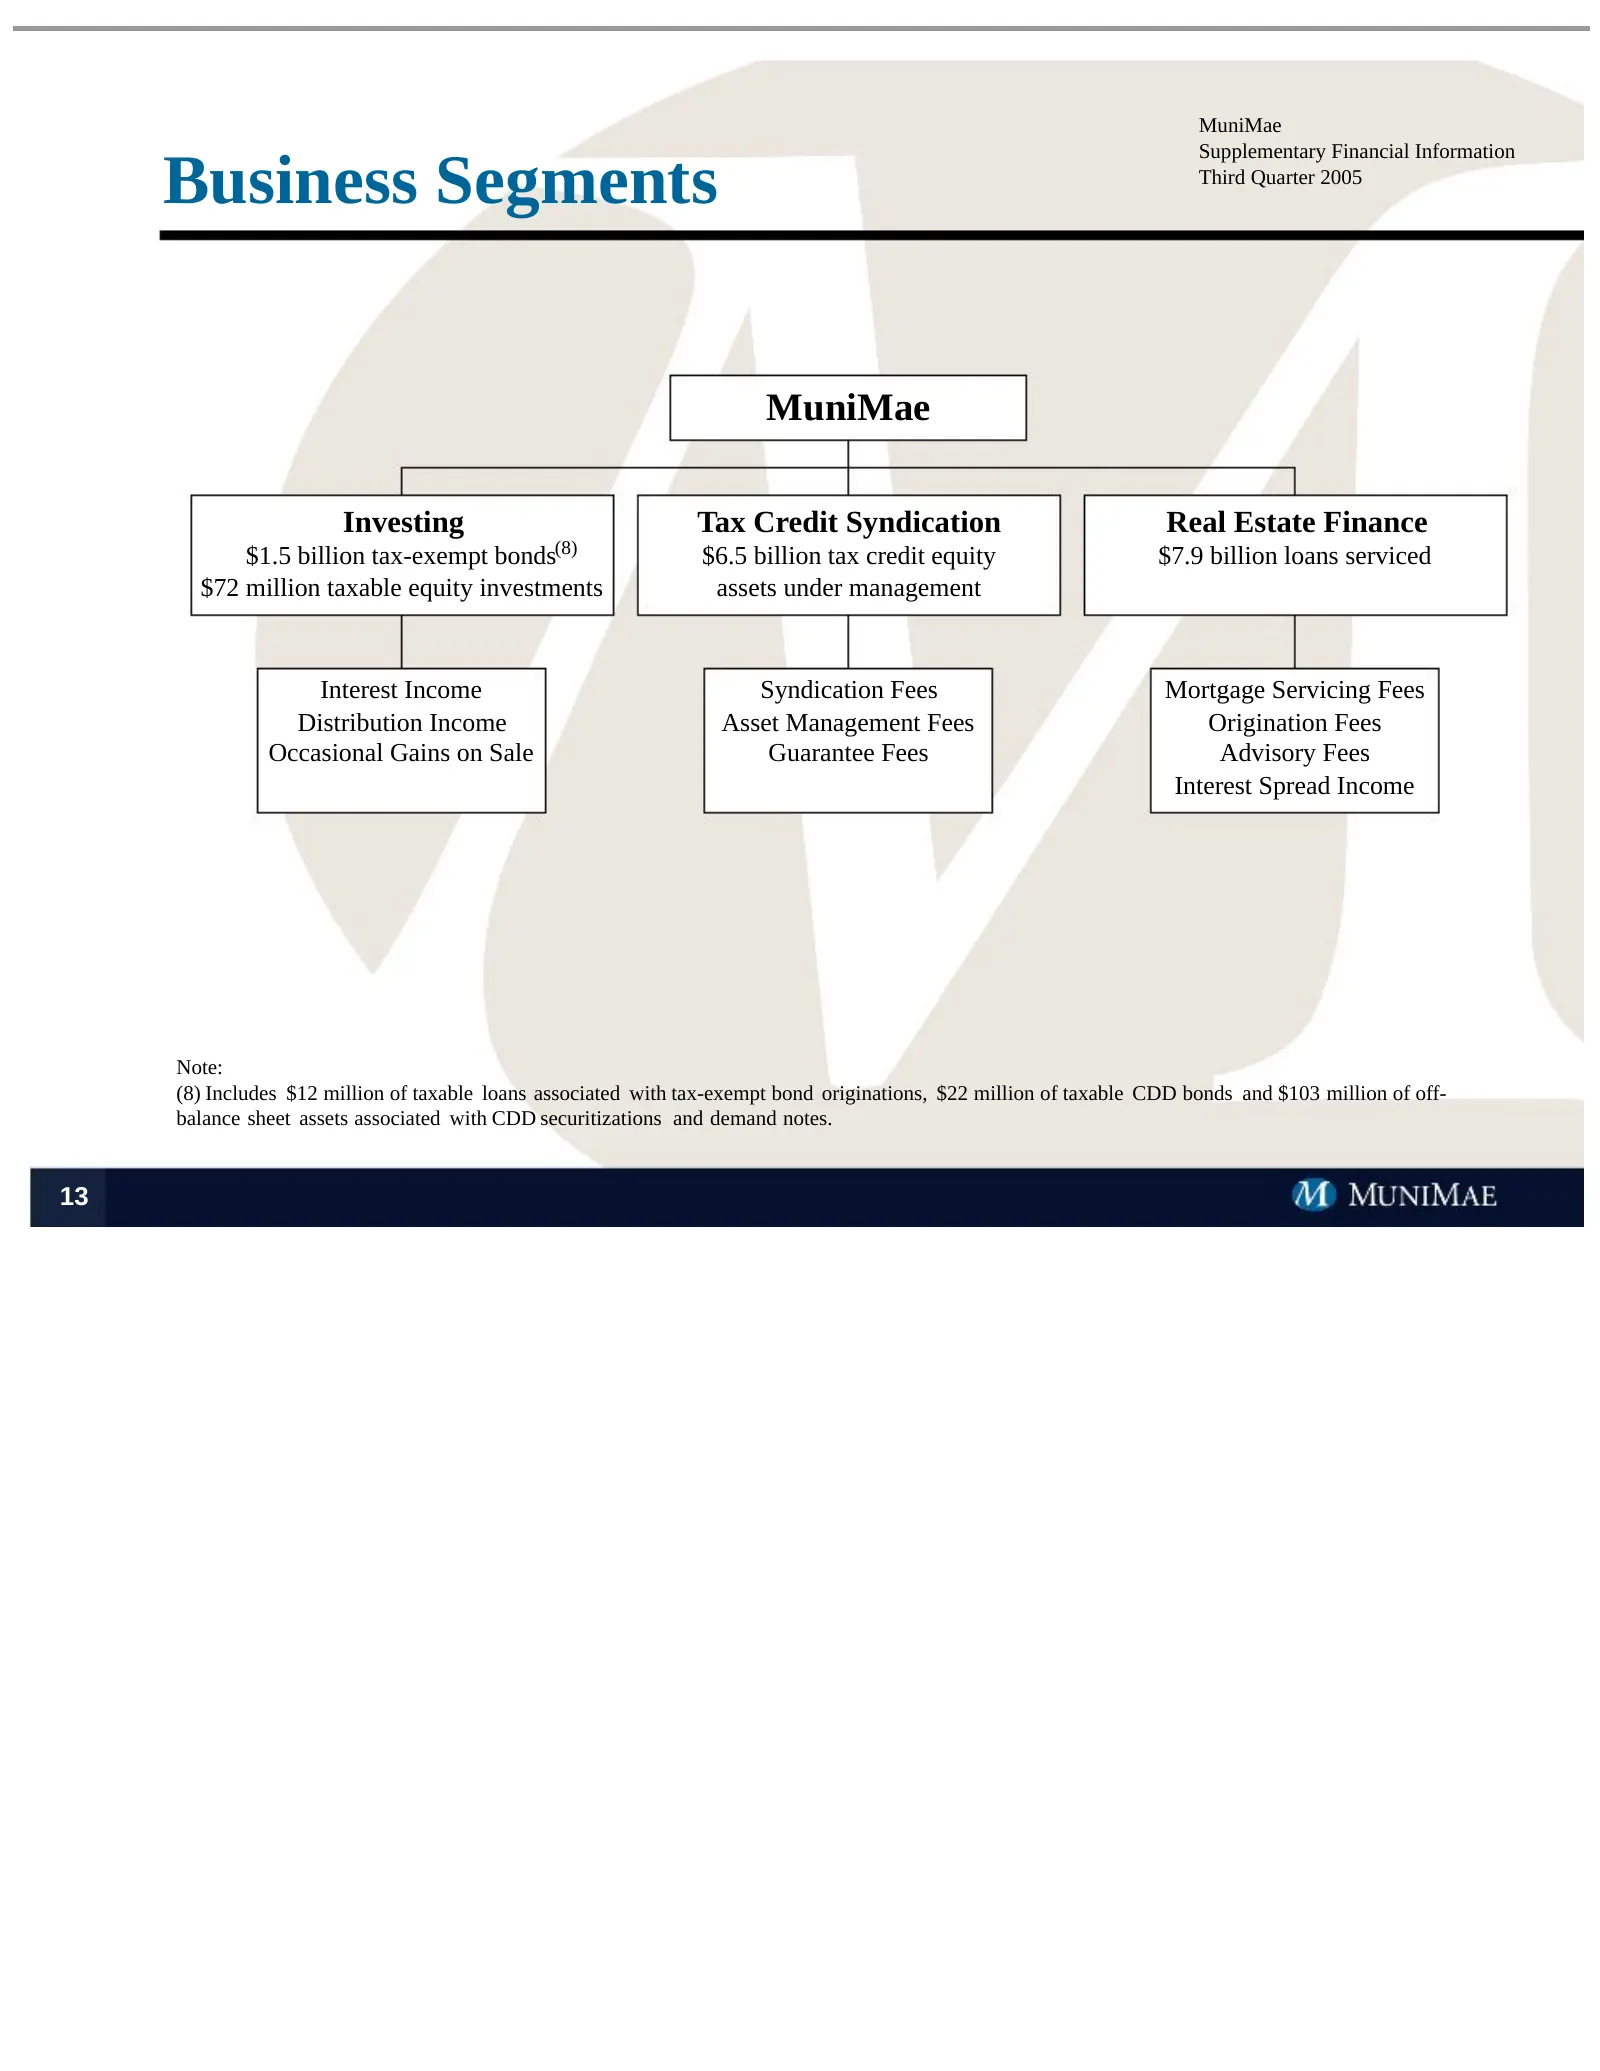
Slide 14: Business Segments
MuniMae Supplementary Financial Information Business Segments Third Quarter 2005 MuniMae Investing Tax Credit Syndication Real Estate Finance $1.5 billion tax-exempt bonds(8) $6.5 billion tax credit equity $7.9 billion loans serviced $72 million taxable equity investments assets under management Int
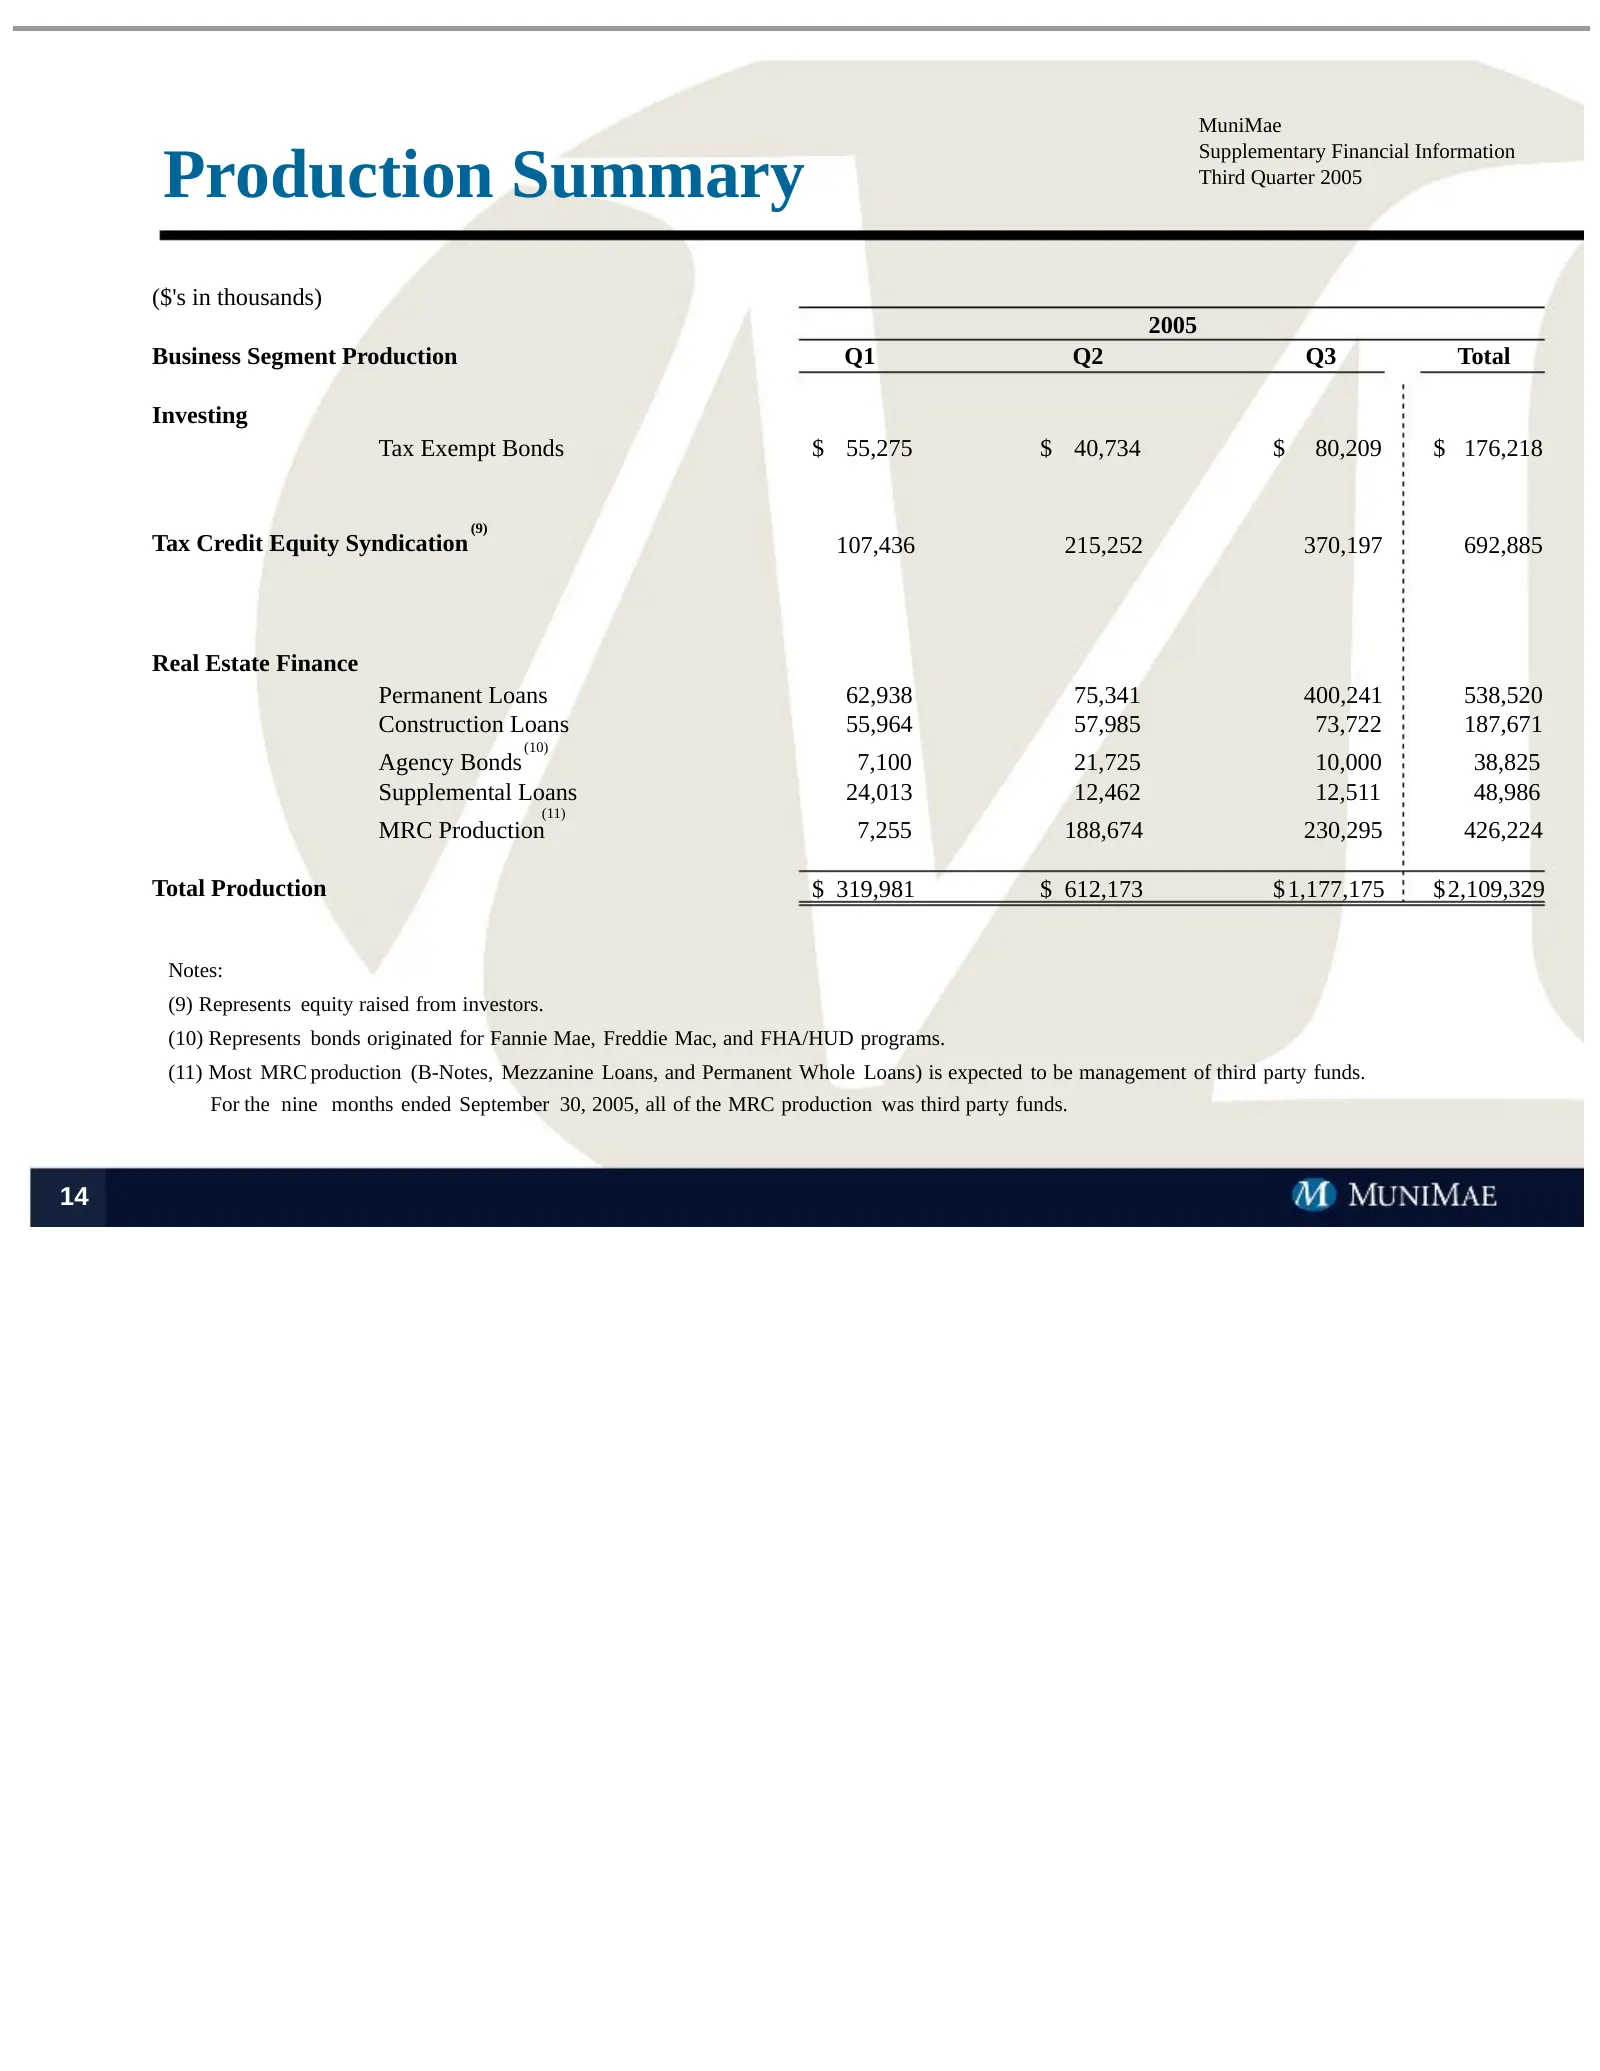
Slide 15: Production Summary
MuniMae Production Summary Supplementary Financial Information Third Quarter 2005 ($'s in thousands) 2005 Business Segment Production Q1 Q2 Q3 Total Investing Tax Exempt Bonds $ 55,275 $ 40,734 $ 80,209 $ 176,218 (9) Tax Credit Equity Syndication 107,436 215,252 370,197 692,885 Real Estate Finance P
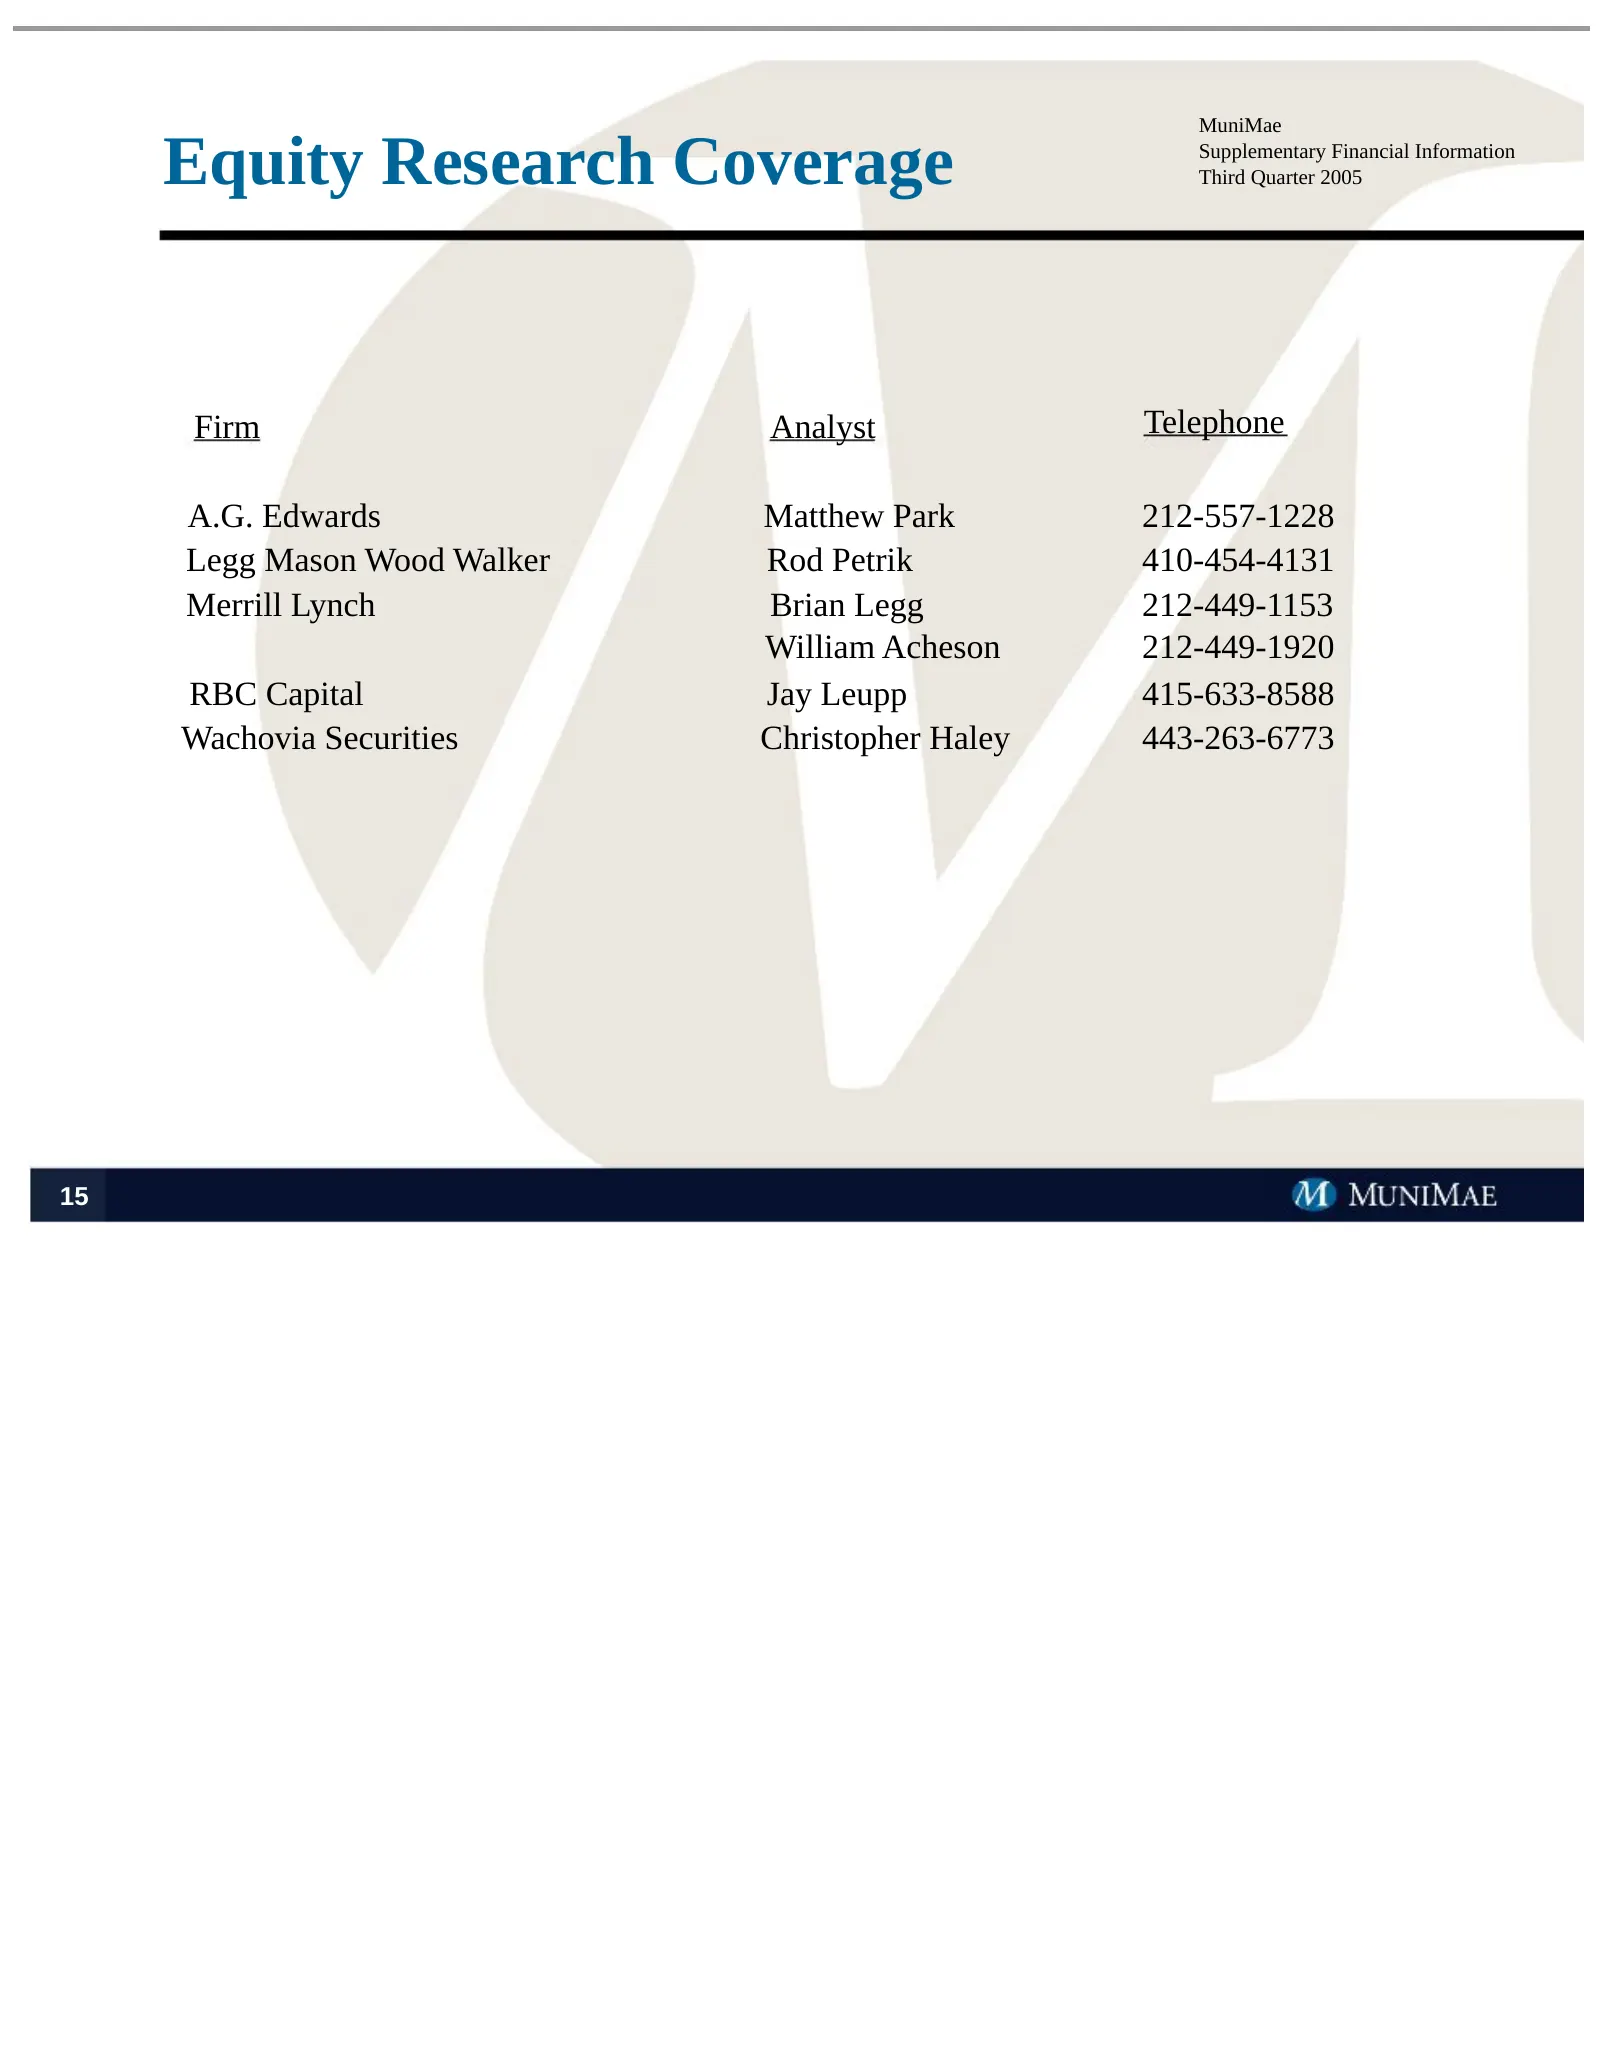
Slide 16: Equity Research Coverage
MuniMae Equity Research Coverage Supplementary Financial Information Third Quarter 2005 Firm Analyst Telephone A.G. Edwards Matthew Park 212-557-1228 Legg Mason Wood Walker Rod Petrik 410-454-4131 Merrill Lynch Brian Legg 212-449-1153 William Acheson 212-449-1920 RBC Capital Jay Leupp 415-633-8588 W
Slide 17: Appendix
MuniMae Appendix Supplementary Financial Information Third Quarter 2005 Supplemental Information on Bond Portfolio 17-19 Bond Portfolio Distribution 17 Bond Portfolio Cash Flow Hedging 18-19 Analysis of Balance Sheet Components 20-21 CAD Income Statement 22 CAD Variance Analysis 23-24 Contact Inform
Slide 18: Bond Portfolio Distribution
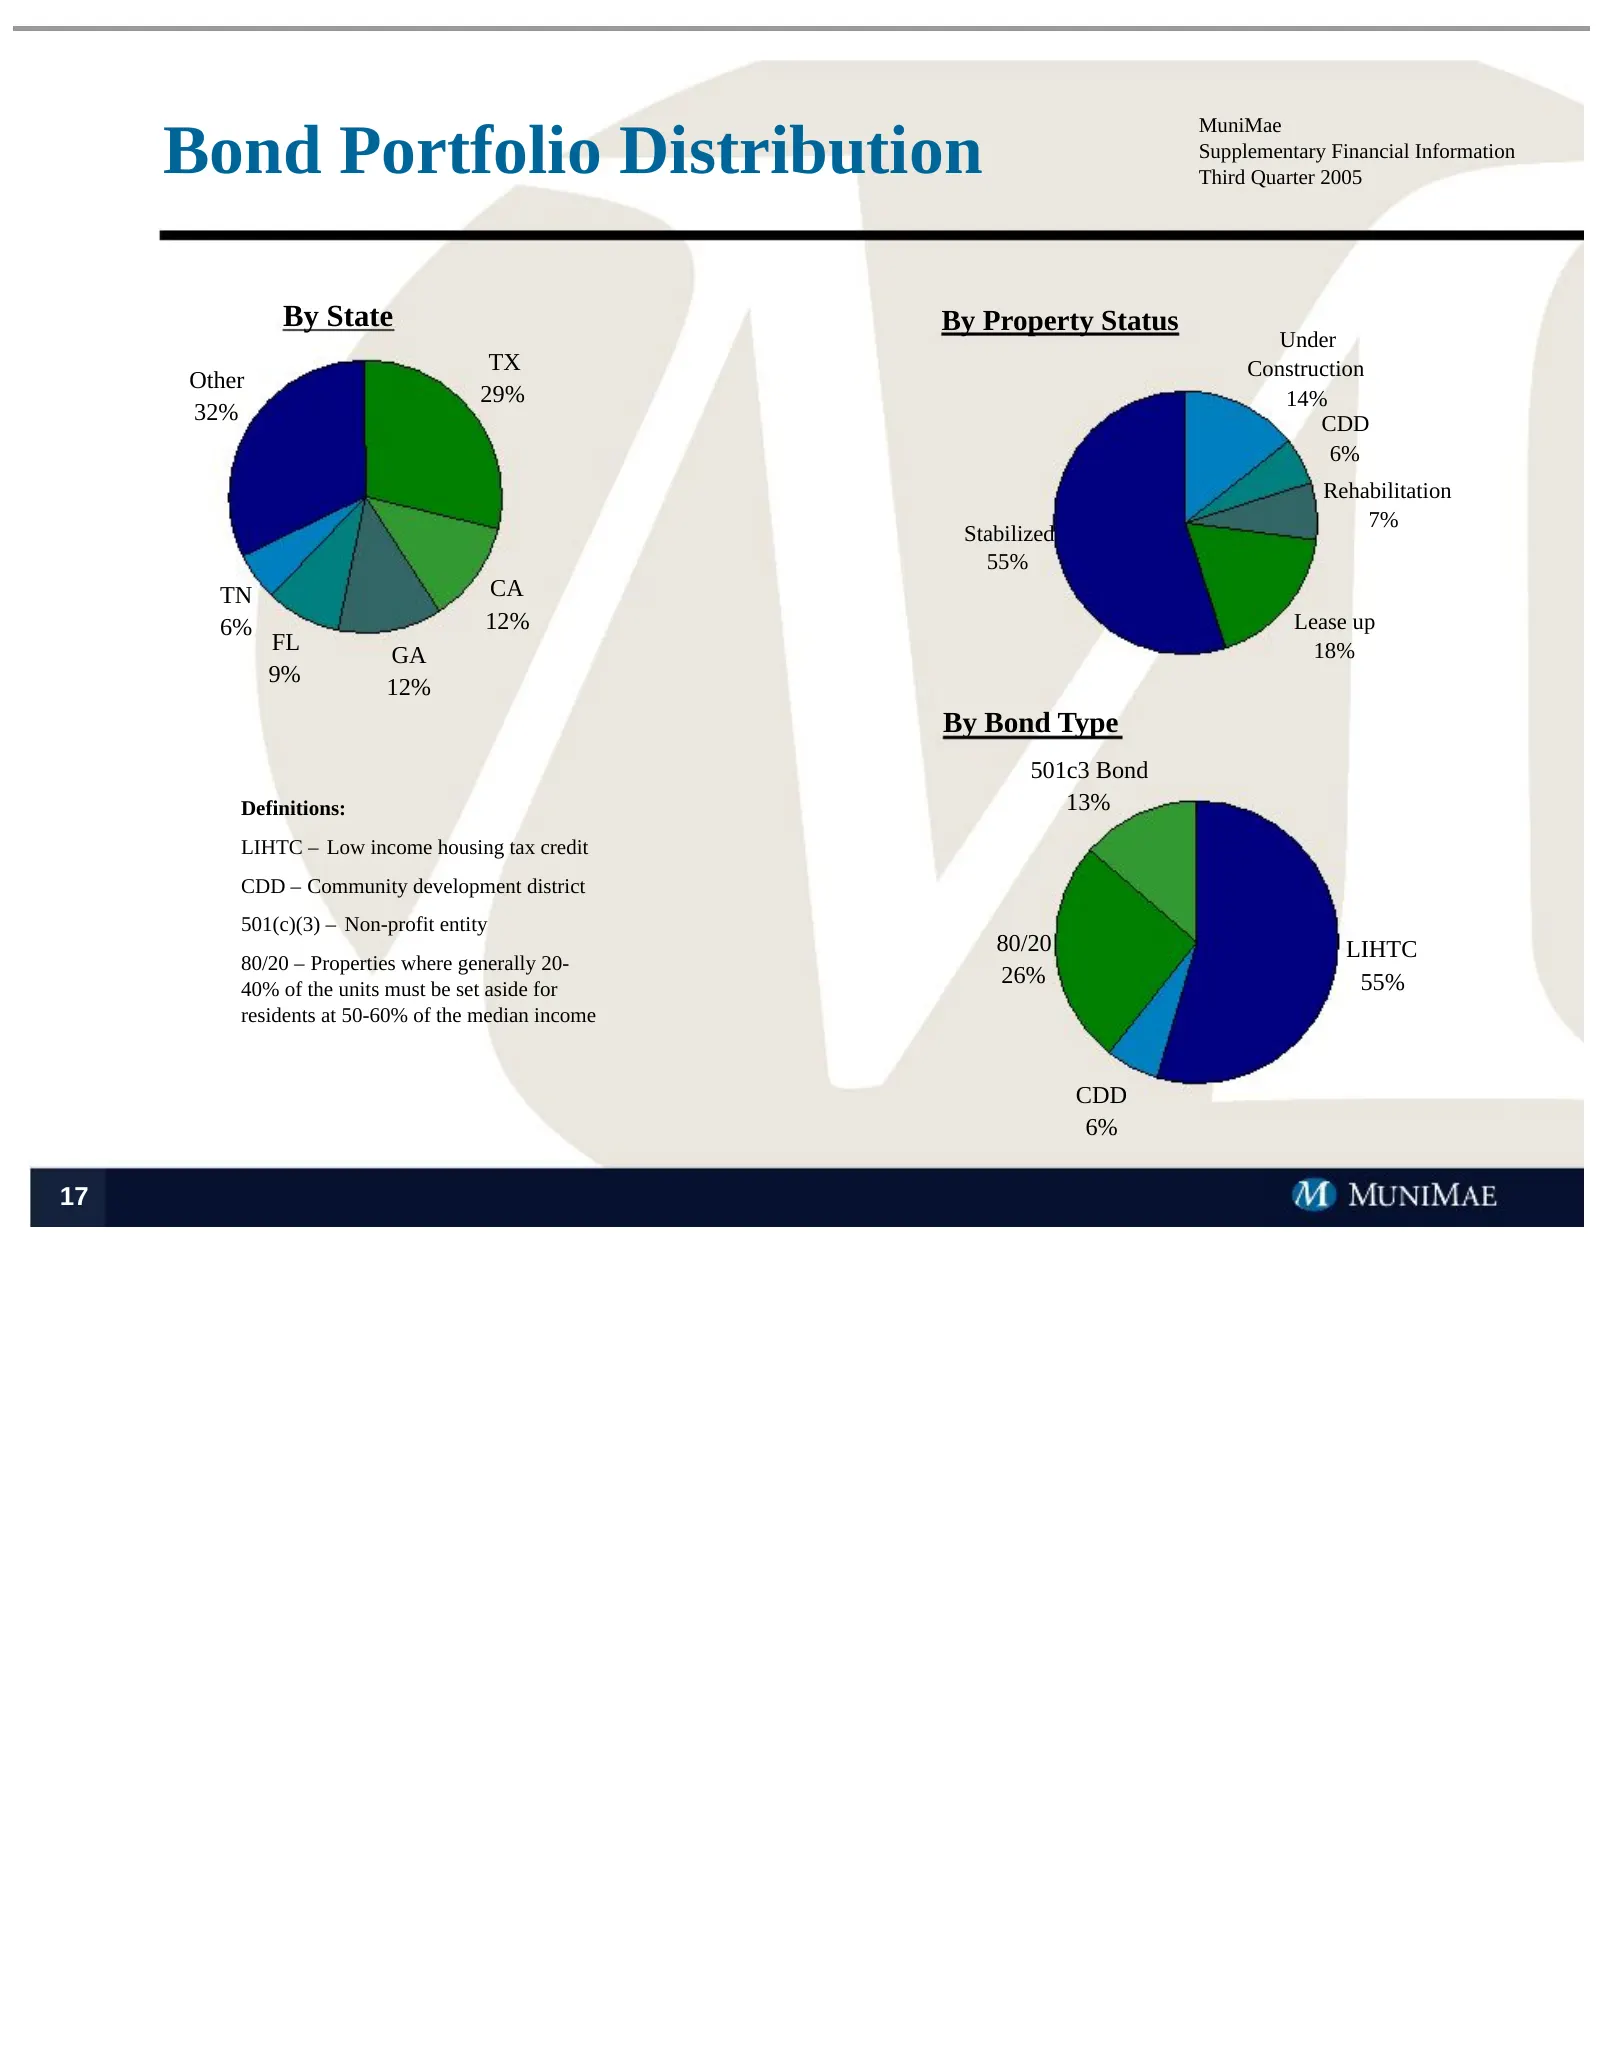
Bond Portfolio Distribution MuniMae Supplementary Financial Information Third Quarter 2005 By State By Property Status Under TX Construction Other 29% 14% 32% CDD 6% Rehabilitation 7% Stabilized 55% TN CA 6% 12% Lease up FL 18% GA 9% 12% By Bond Type 501c3 Bond Definitions: 13% LIHTC – Low income ho
Slide 19: Bond Portfolio Cash Flow Hedging
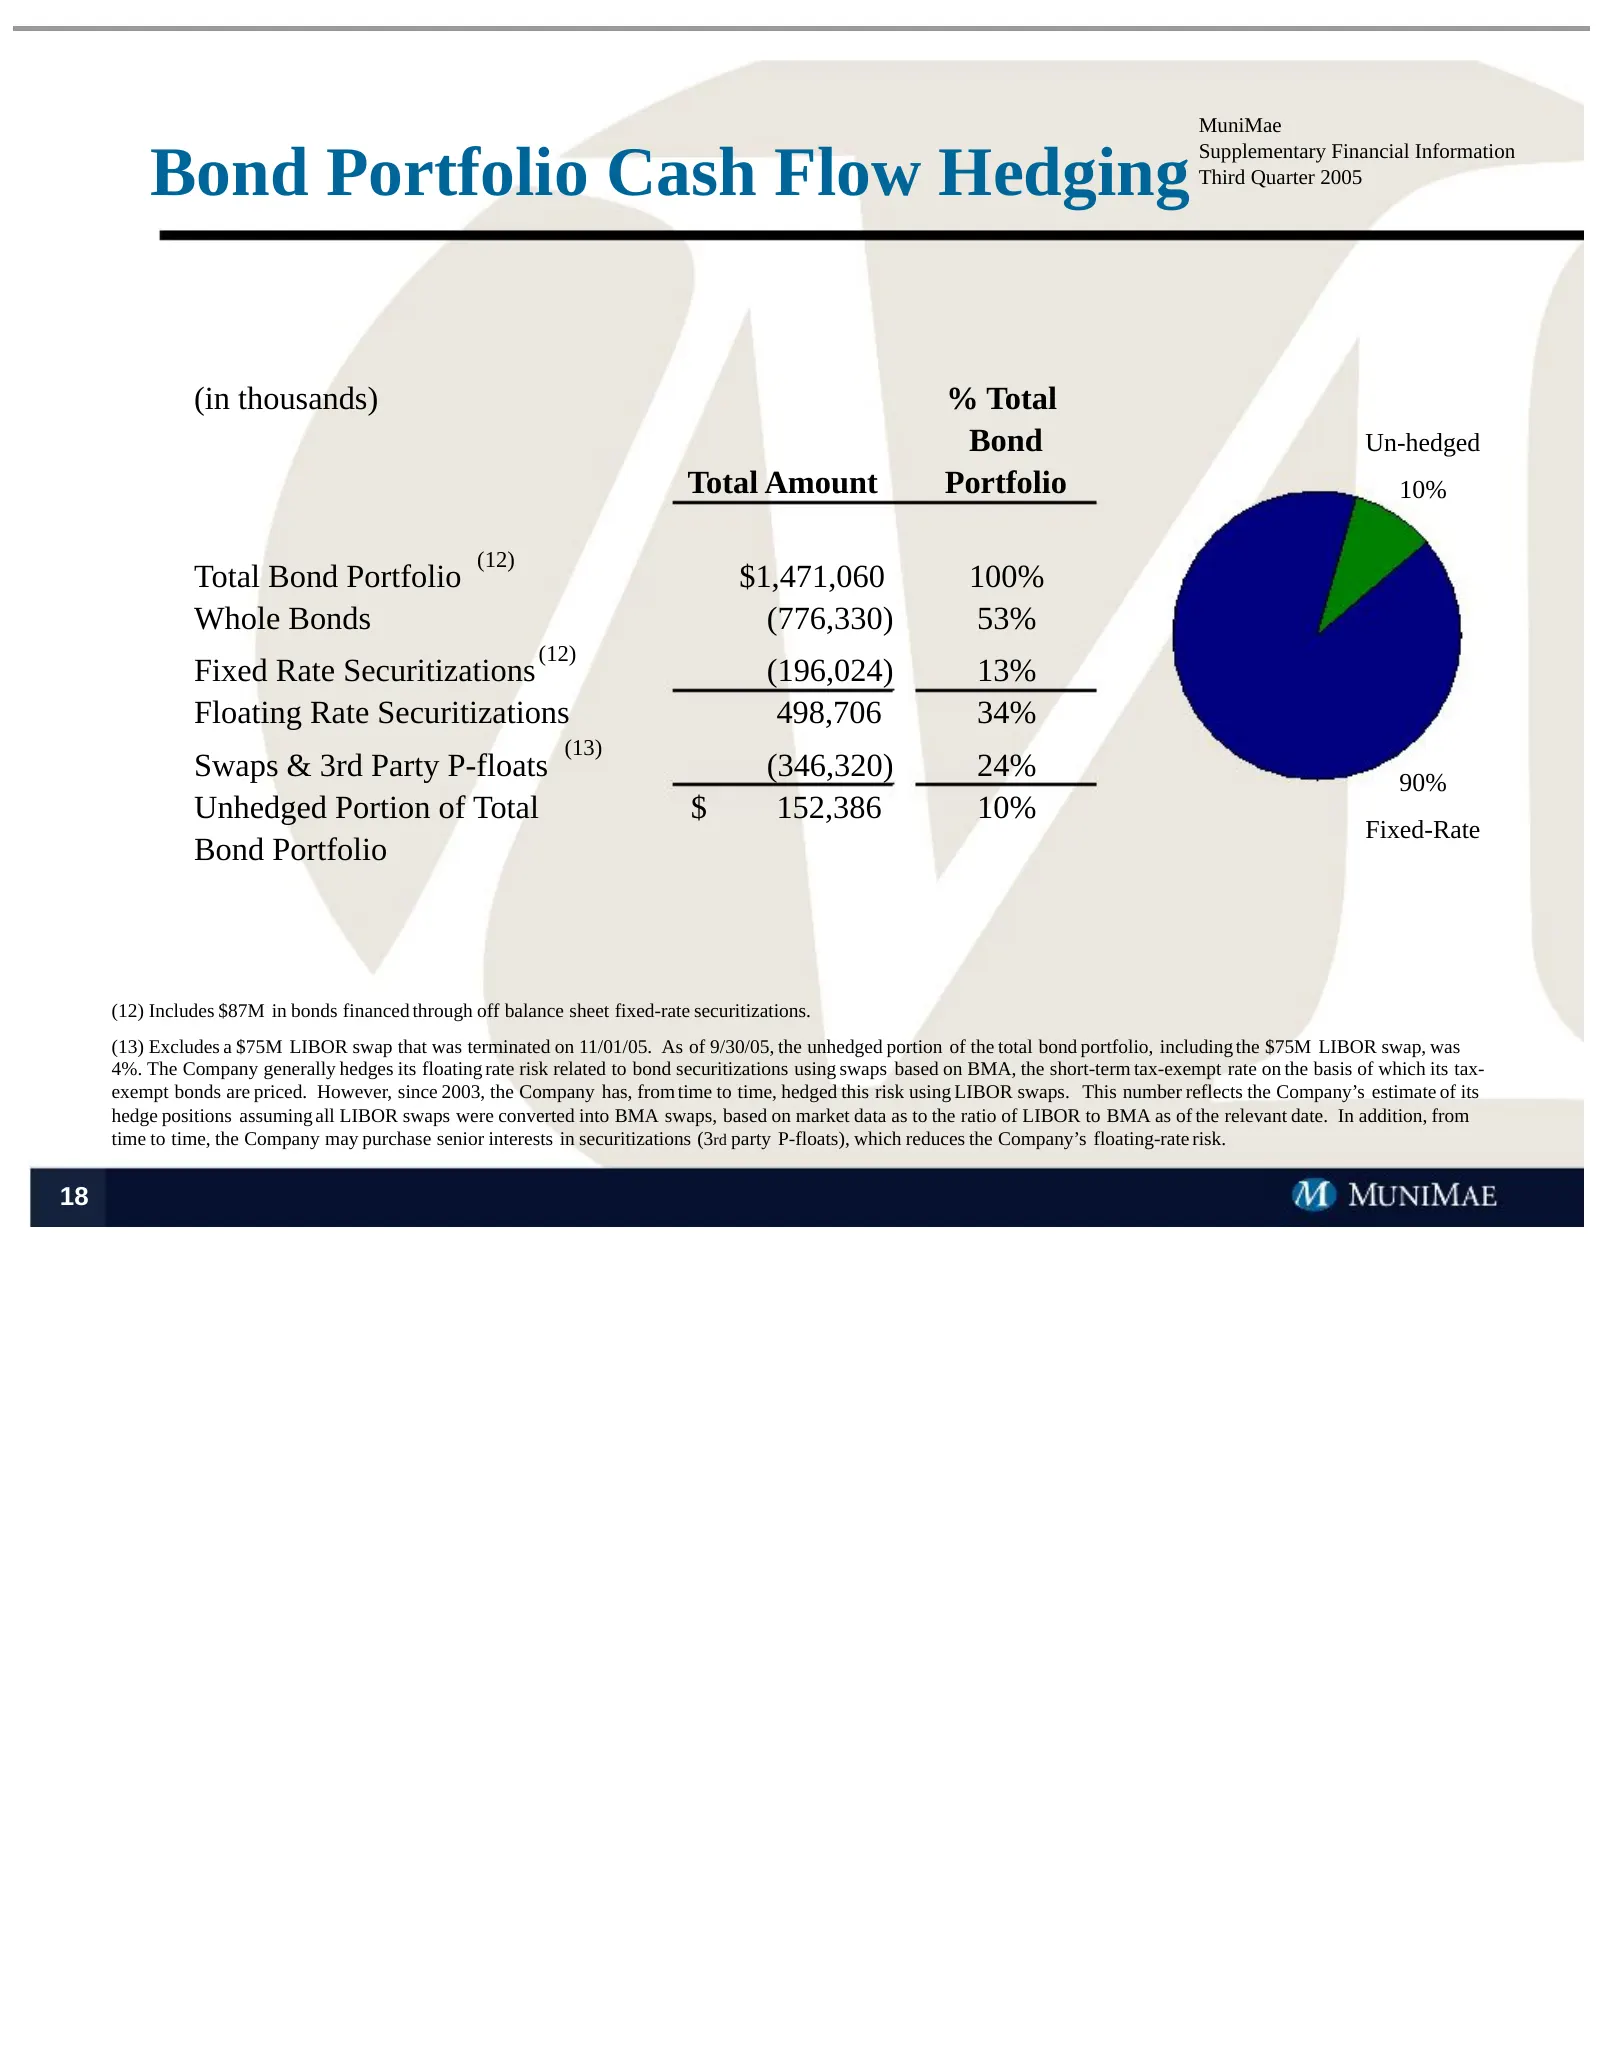
MuniMae Bond Portfolio Cash Flow Hedging Supplementary Financial Information Third Quarter 2005 (in thousands) % Total Bond Un-hedged Total Amount Portfolio 10% (12) Total Bond Portfolio $1,471,060 100% Whole Bonds (776,330) 53% (12) Fixed Rate Securitizations (196,024) 13% Floating Rate Securitizat
Slide 20: Cash Flow Hedging
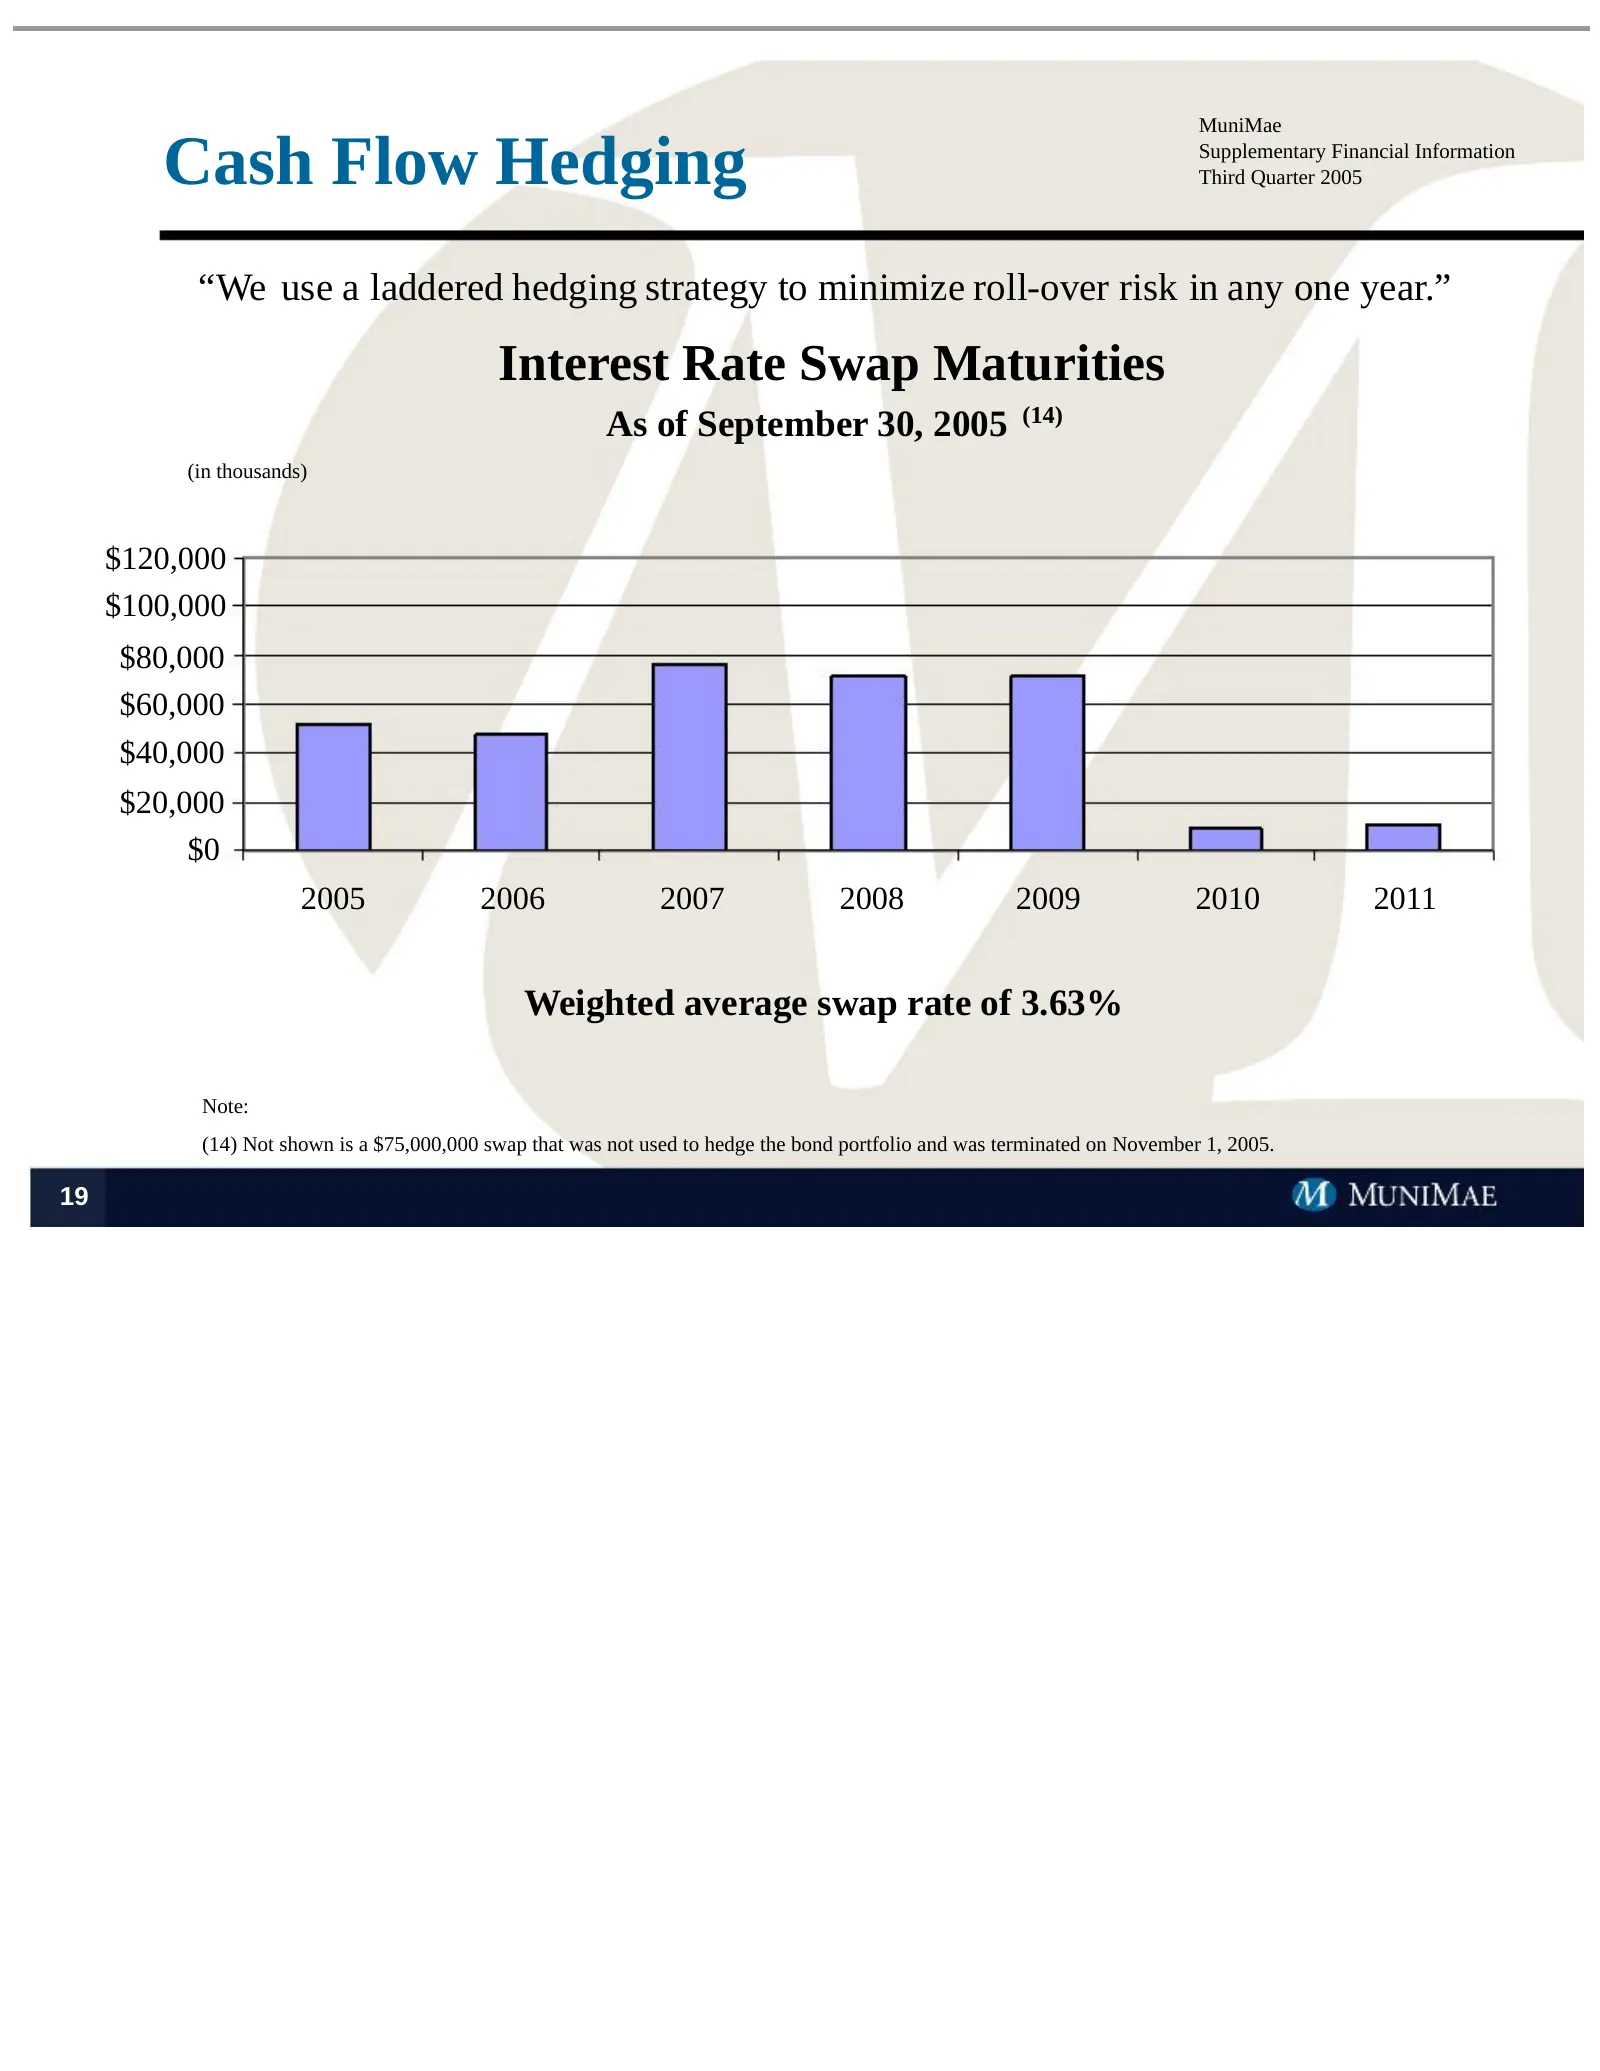
MuniMae Cash Flow Hedging Supplementary Financial Information Third Quarter 2005 “We use a laddered hedging strategy to minimize roll-over risk in any one year.” Interest Rate Swap Maturities As of September 30, 2005 (14) (in thousands) $120,000 $100,000 $80,000 $60,000 $40,000 $20,000 $0 2005 2006
Slide 21: Analysis of GAAP Balance Sheet Components
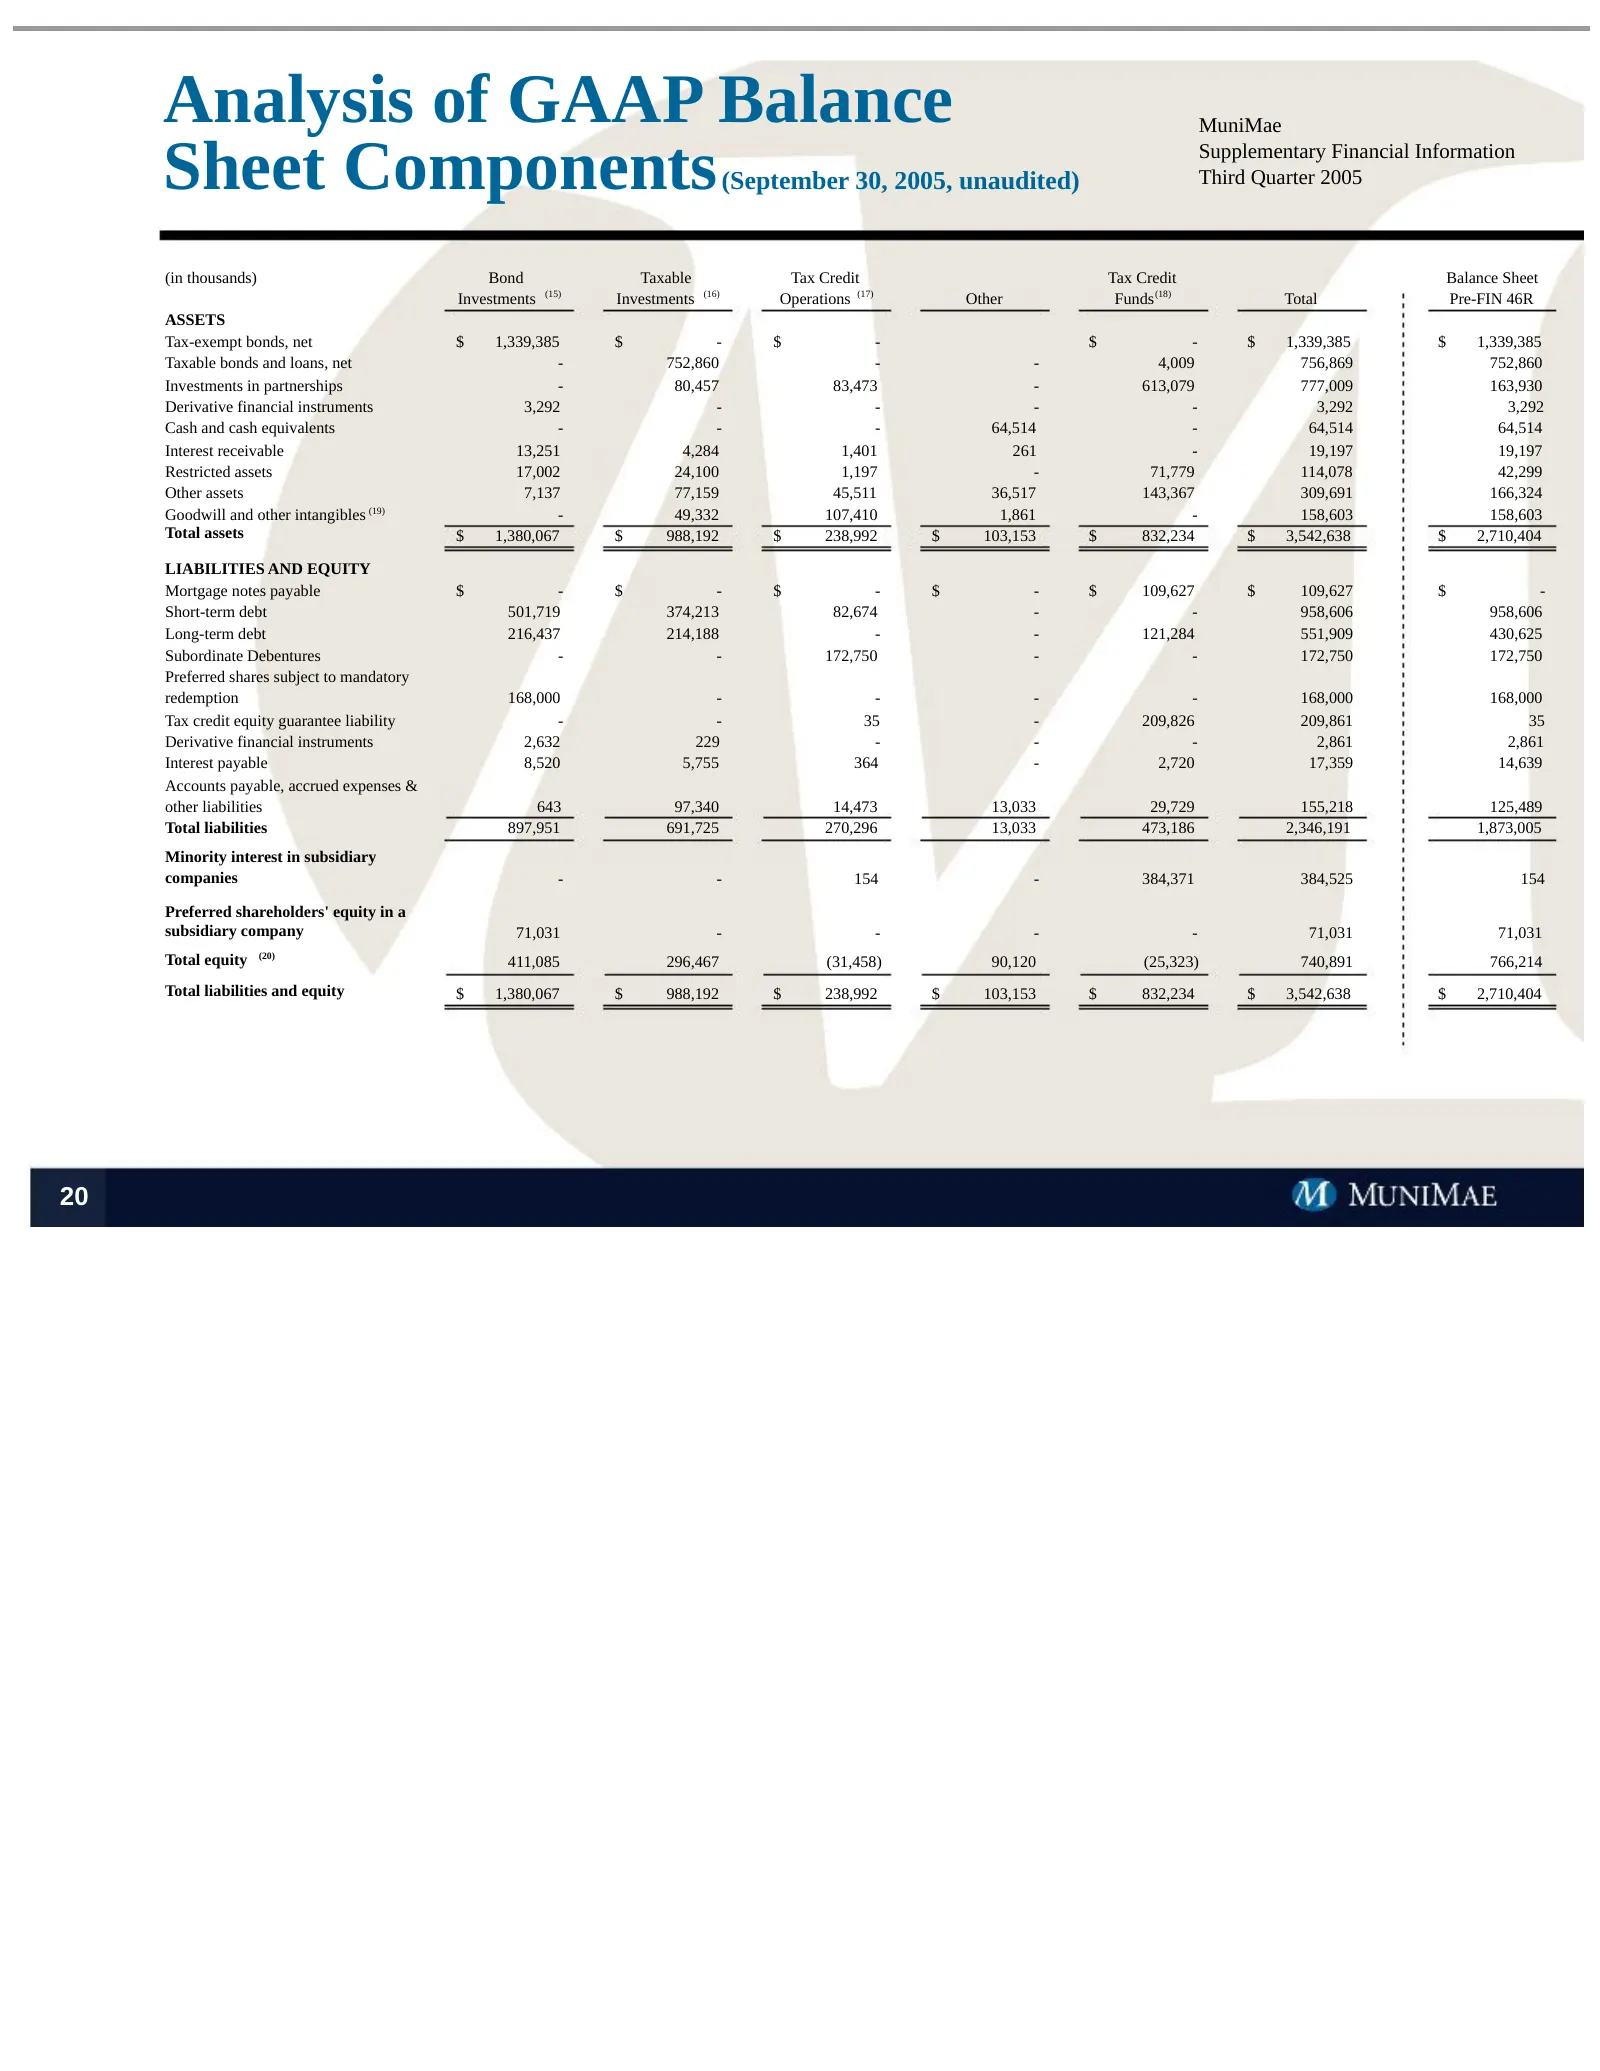
Analysis of GAAP Balance MuniMae Sheet Components (September 30, 2005, unaudited) Supplementary Financial Information Third Quarter 2005 (in thousands) Bond Taxable Tax Credit Tax Credit Balance Sheet Investments (15) Investments (16) Operations (17) Other Funds (18) Total Pre-FIN 46R ASSETS Tax-exe
Slide 22: Analysis of GAAP Balance Sheet Components (footnotes)
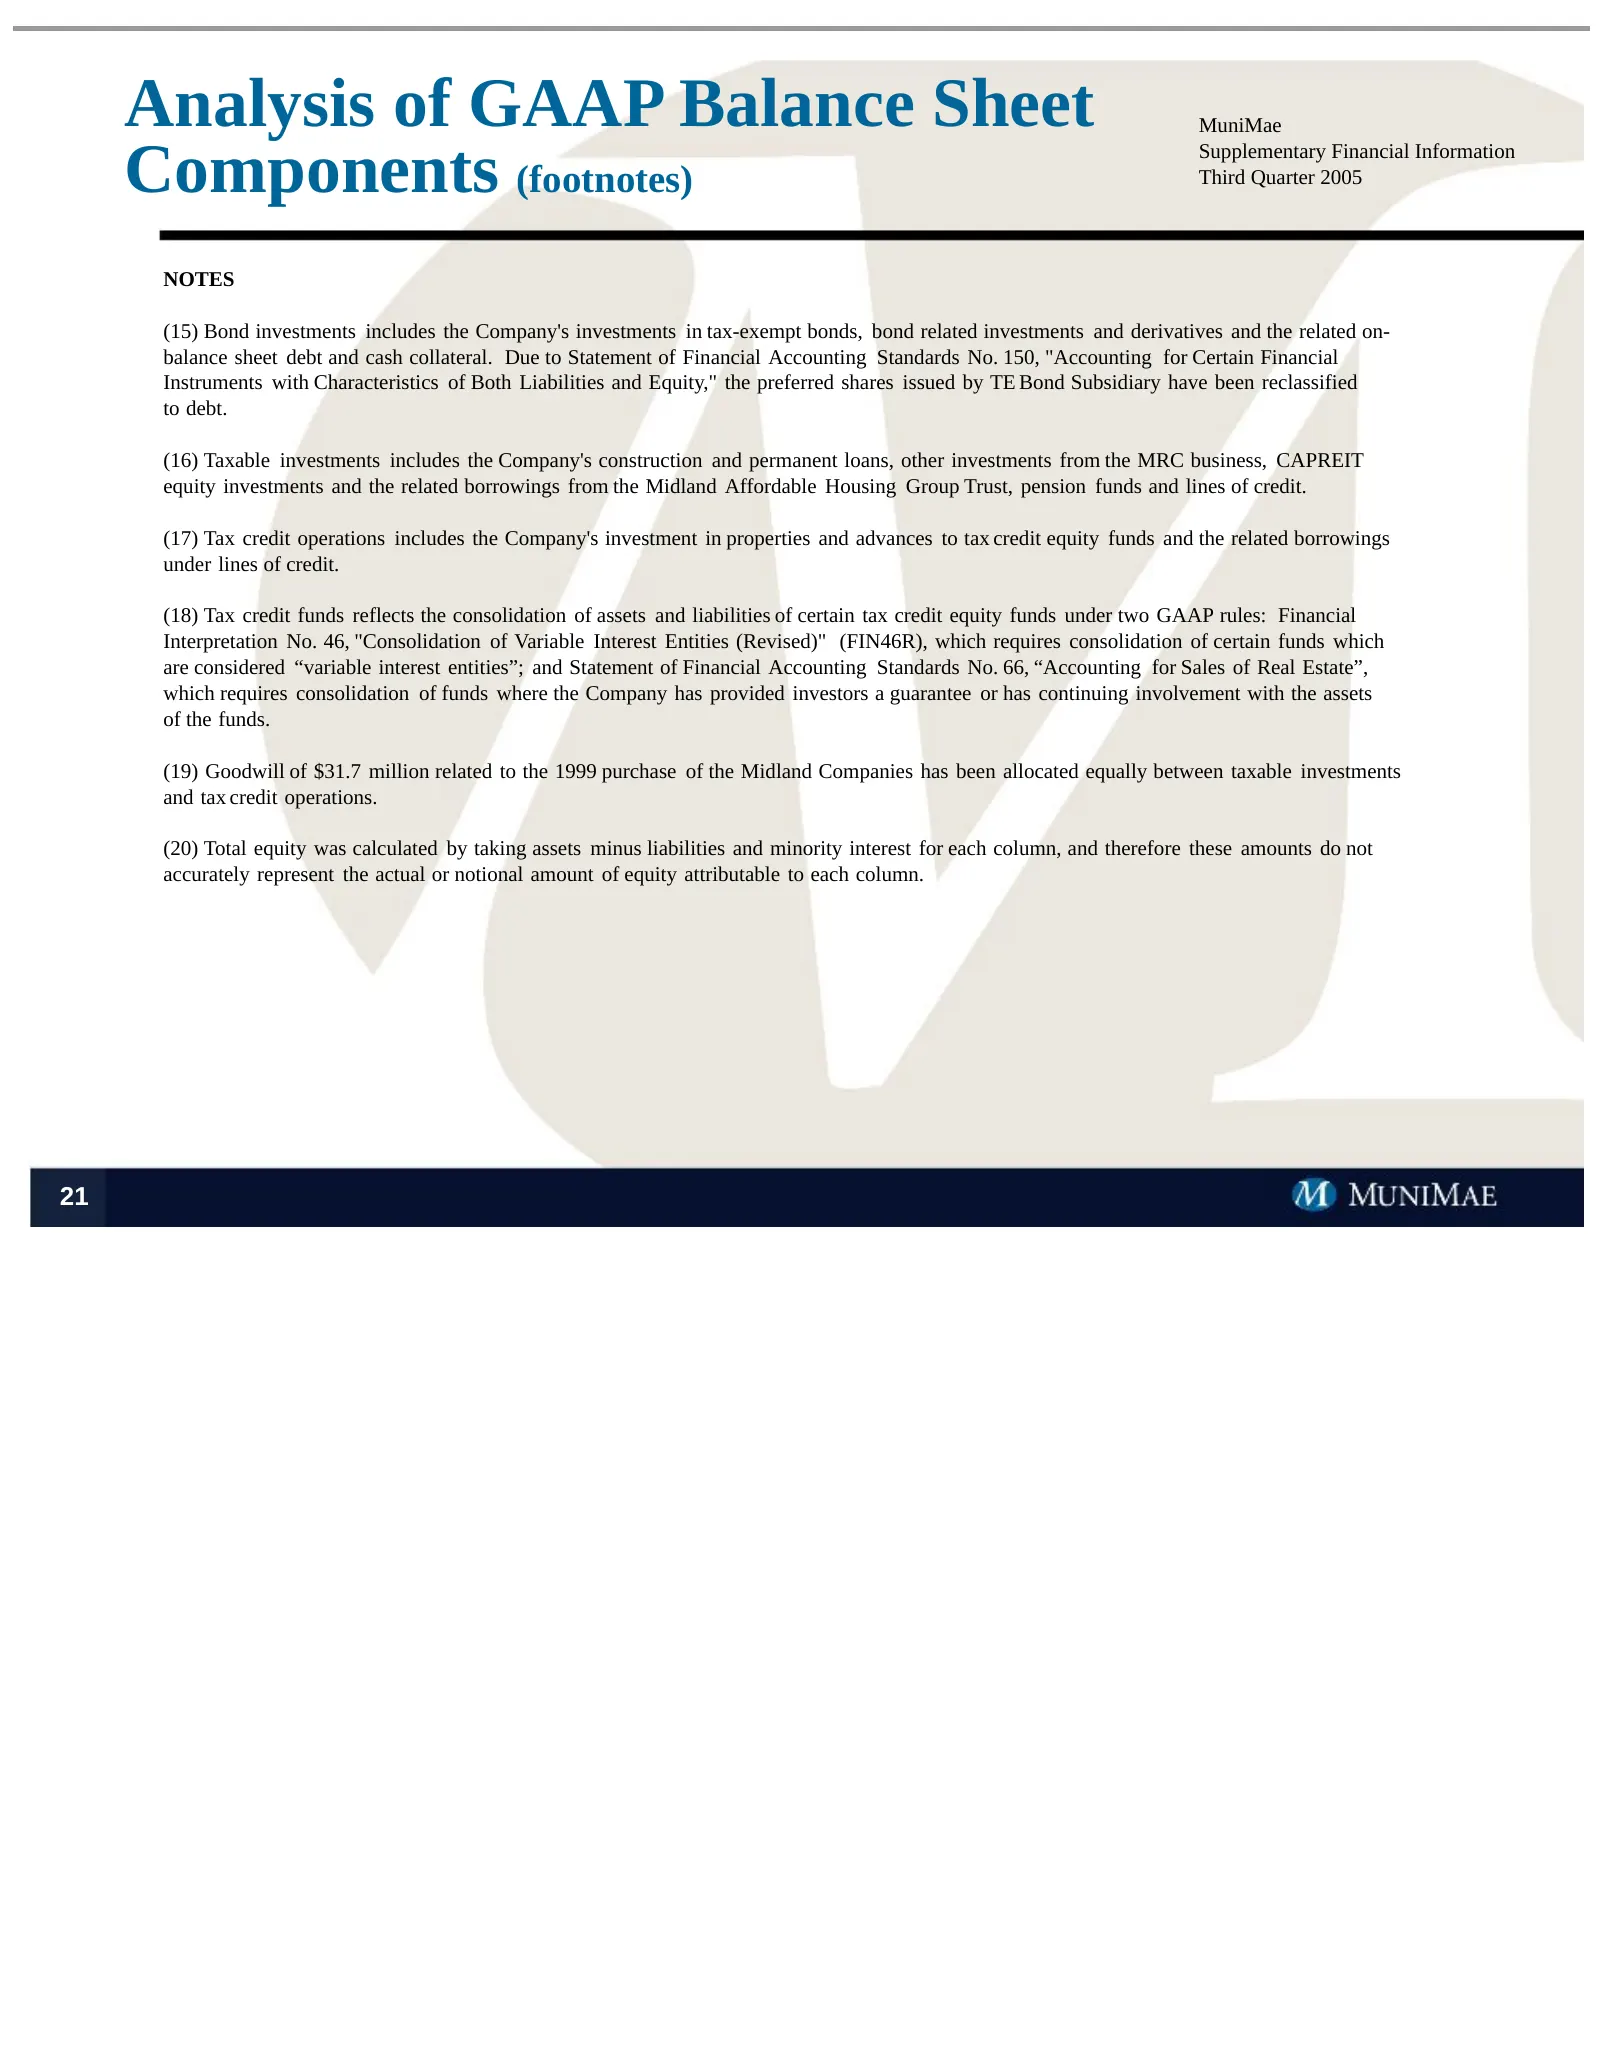
Analysis of GAAP Balance Sheet MuniMae Components (footnotes) Supplementary Financial Information Third Quarter 2005 NOTES (15) Bond investments includes the Company's investments in tax-exempt bonds, bond related investments and derivatives and the related on- balance sheet debt and cash collateral
Slide 23: Cash Available For Distribution
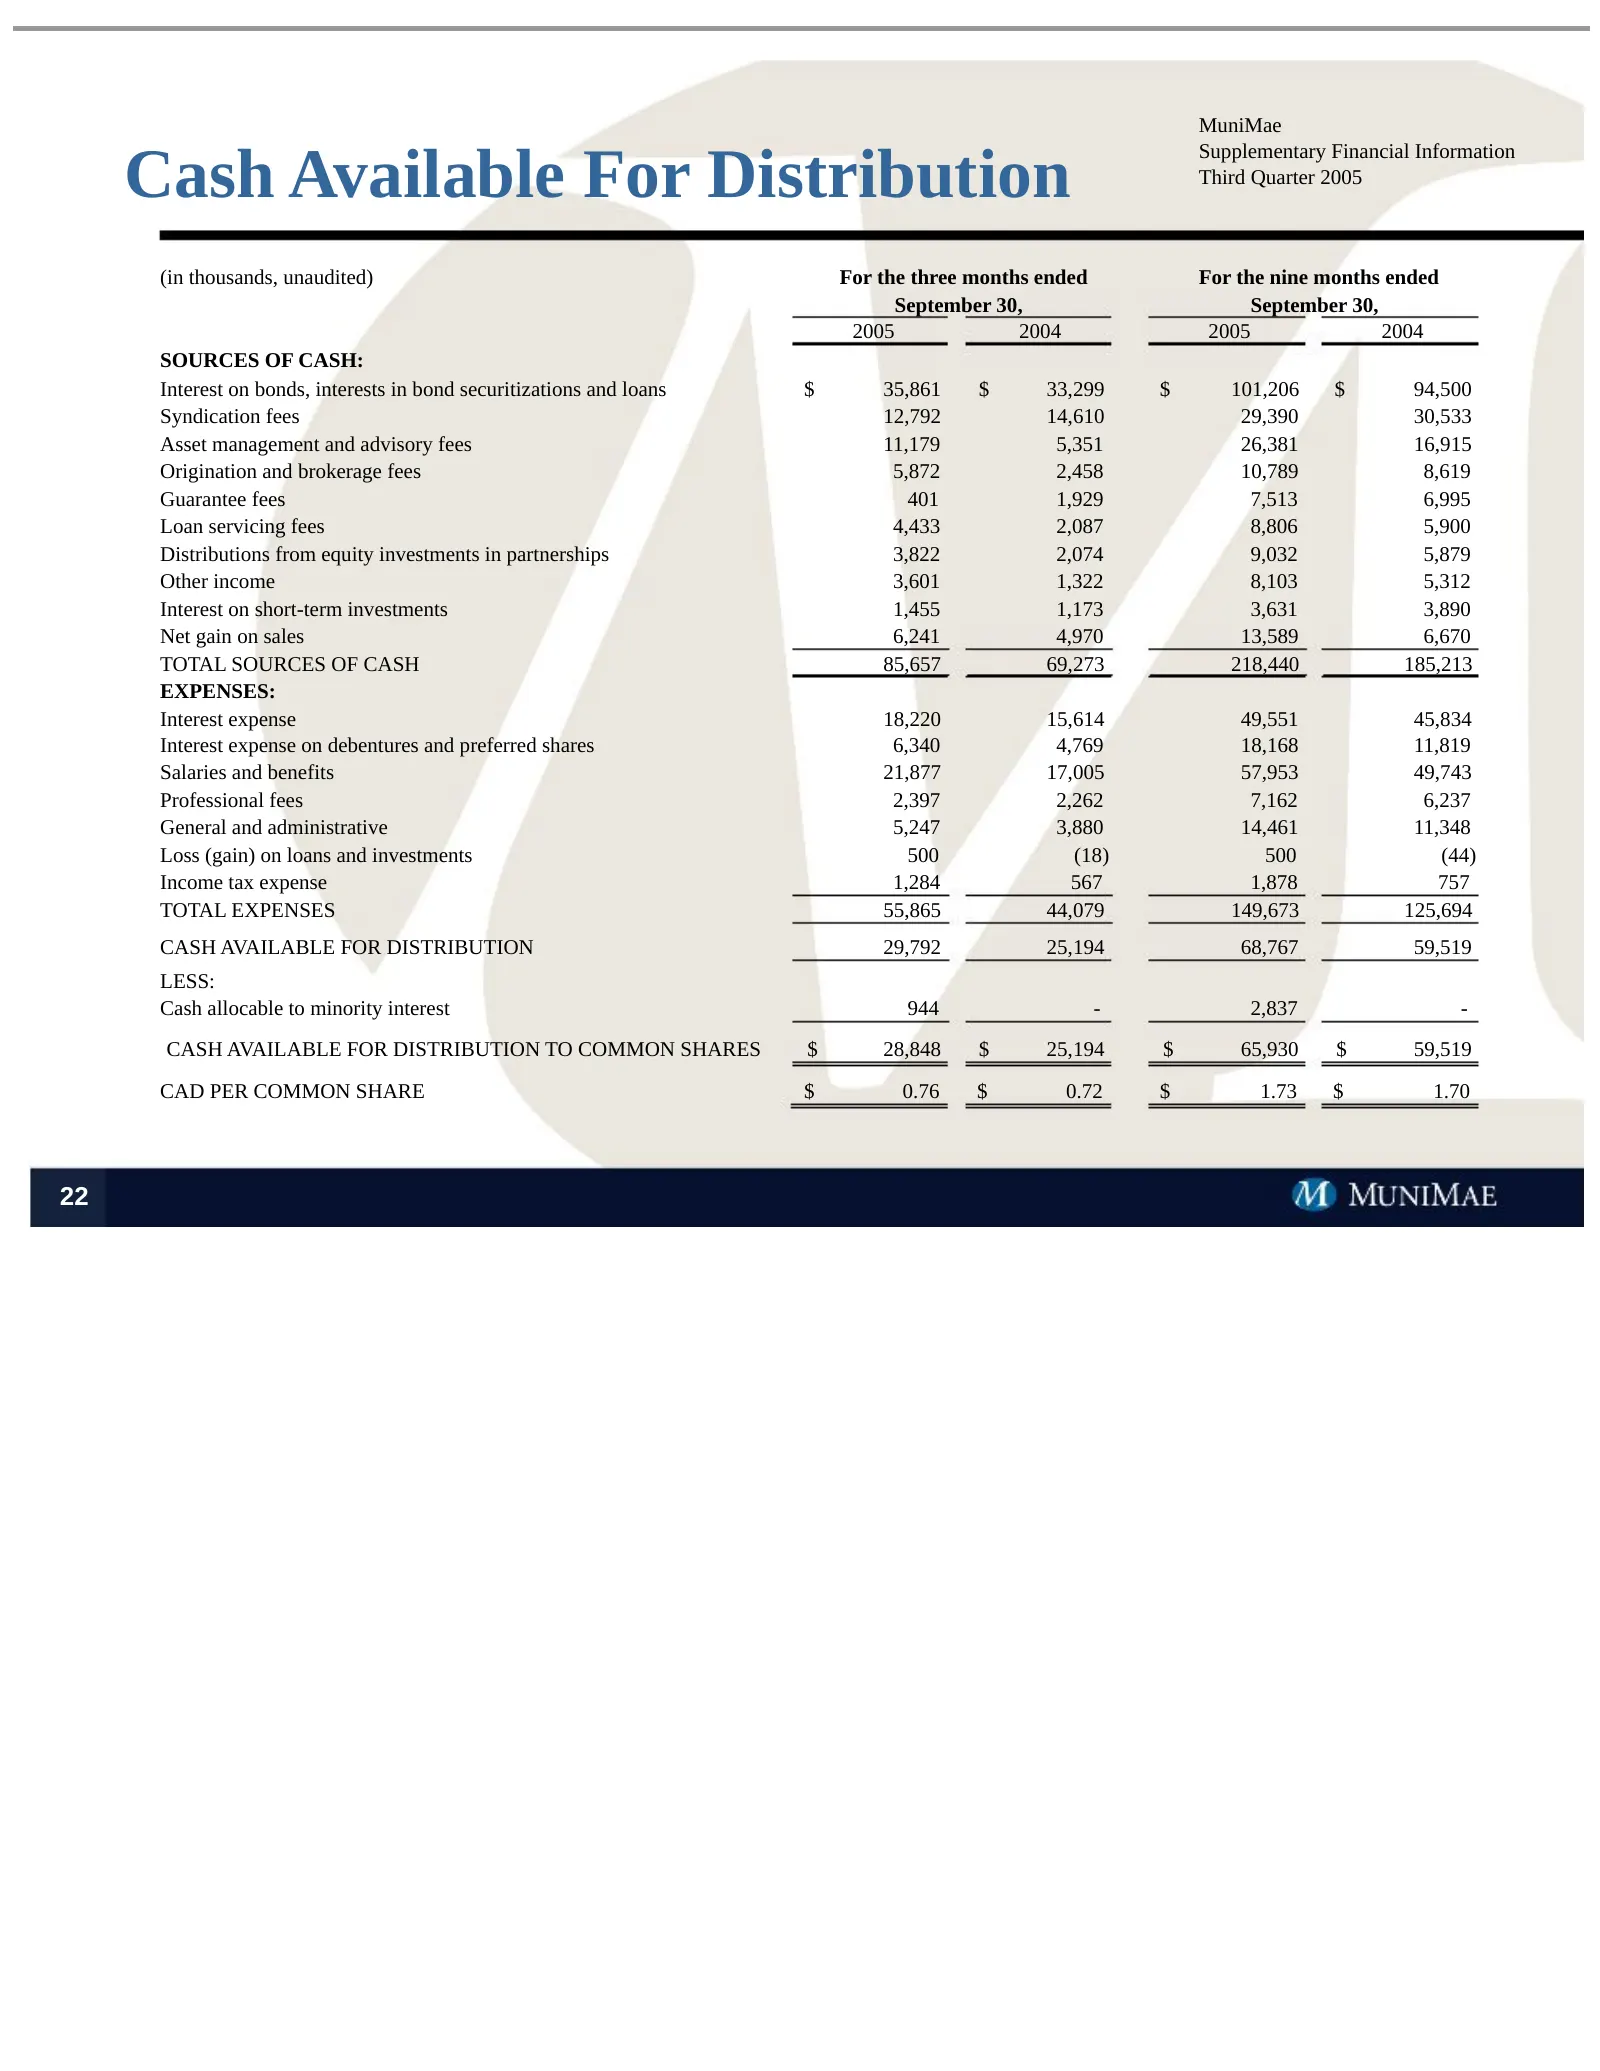
MuniMae Cash Available For Distribution Supplementary Financial Information Third Quarter 2005 (in thousands, unaudited) For the three months ended For the nine months ended September 30, September 30, 2005 2004 2005 2004 SOURCES OF CASH: Interest on bonds, interests in bond securitizations and loan
Slide 24: CAD Variance Analysis
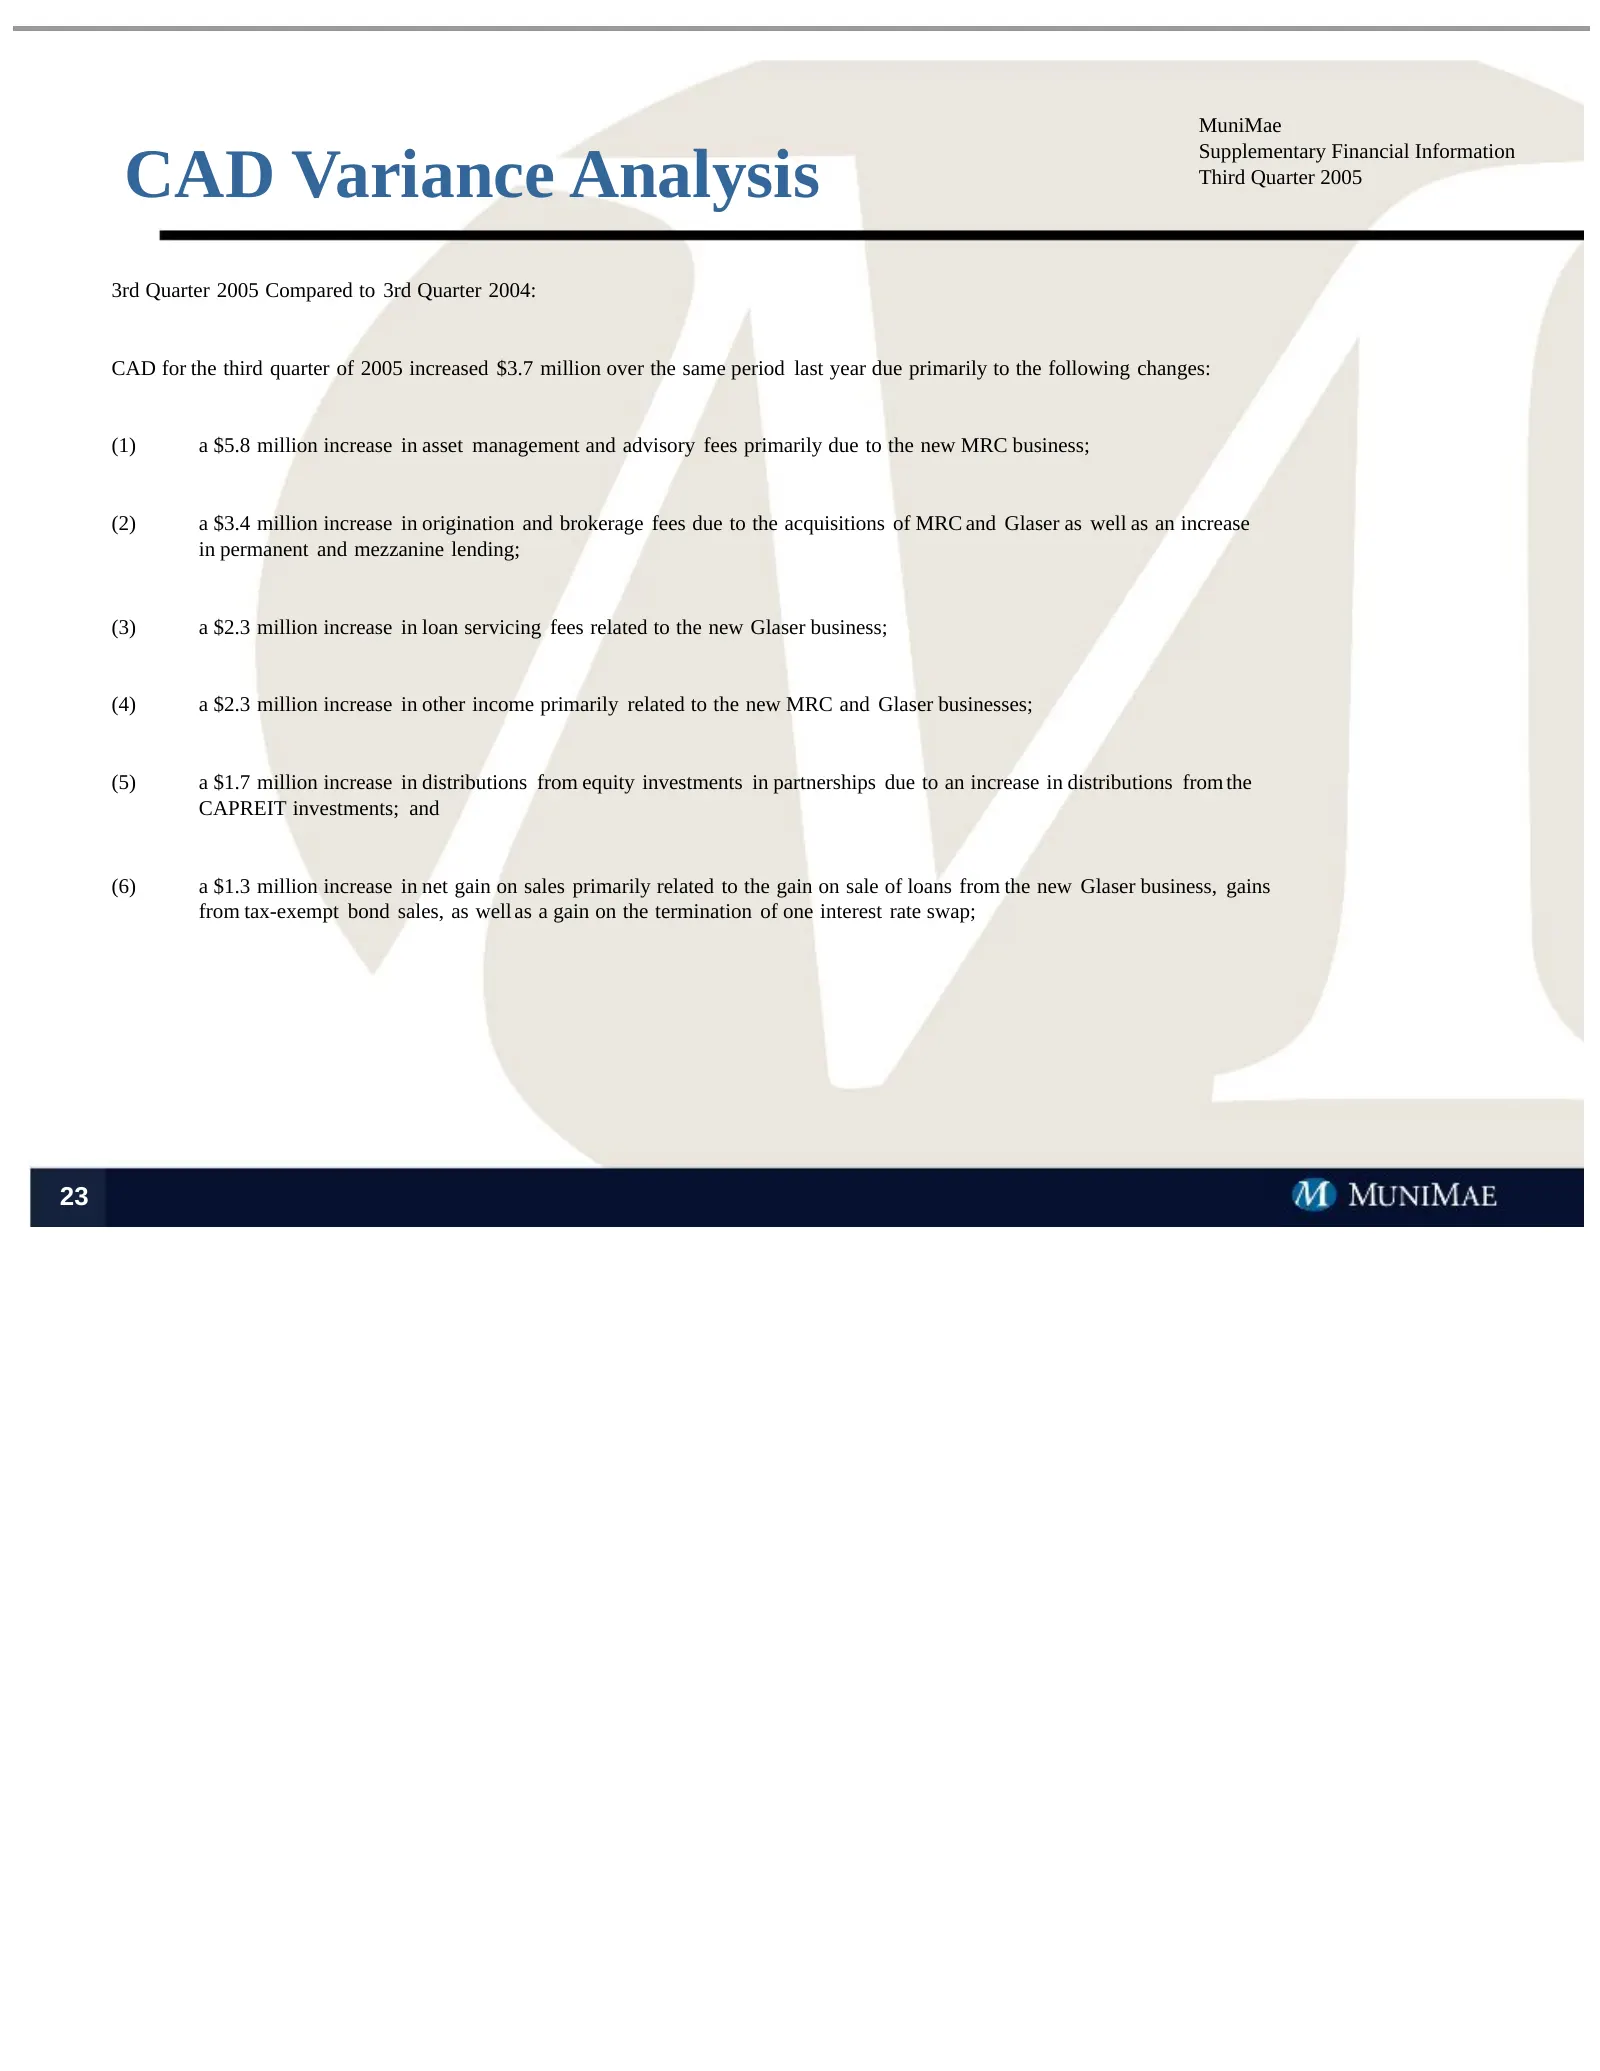
MuniMae CAD Variance Analysis Supplementary Financial Information Third Quarter 2005 3rd Quarter 2005 Compared to 3rd Quarter 2004: CAD for the third quarter of 2005 increased $3.7 million over the same period last year due primarily to the following changes: (1) a $5.8 million increase in asset man
Slide 25: CAD Variance Analysis
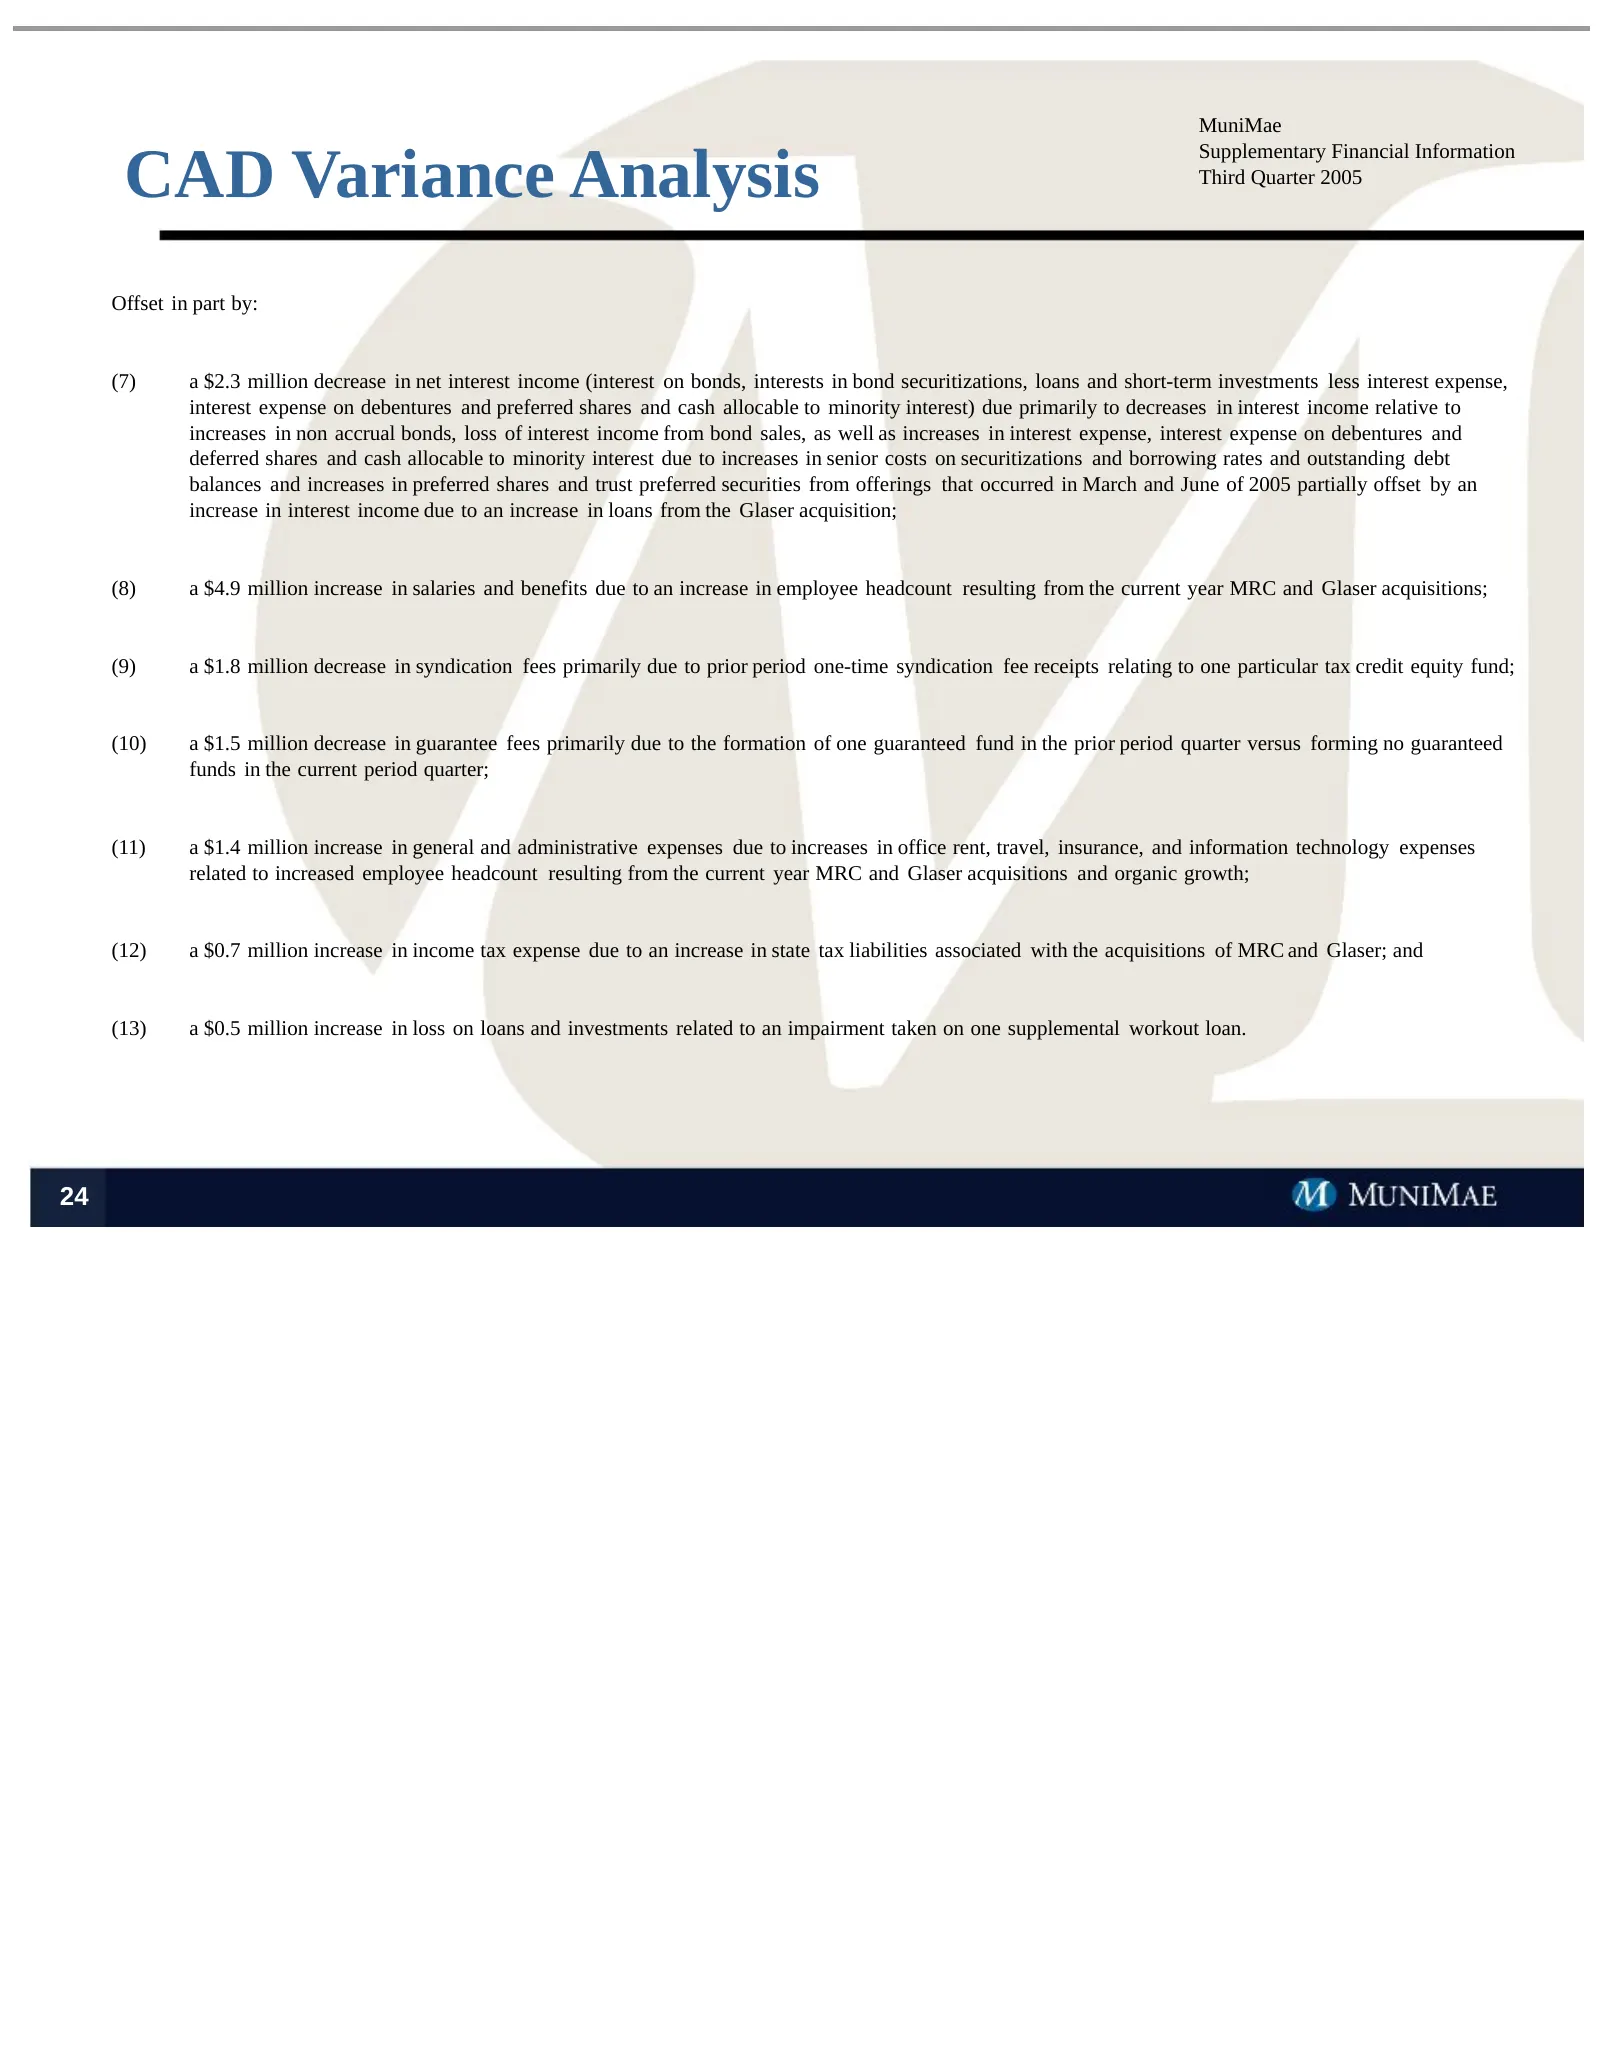
MuniMae CAD Variance Analysis Supplementary Financial Information Third Quarter 2005 Offset in part by: (7) a $2.3 million decrease in net interest income (interest on bonds, interests in bond securitizations, loans and short-term investments less interest expense, interest expense on debentures and
Slide 26: Contact Information
Contact Information MuniMae Supplementary Financial Information Third Quarter 2005 MuniMae 621 East Pratt Street, Suite 300 Baltimore, Maryland 21202-3140 Phone: 877-461-4895 Fax: 410-727-5387 Investor Contacts: Mike Rulf Principal, Investor Relations 443-263-2921 Angela Richardson Investor Relation
Source: SEC EDGAR · 8-K filed Nov 10, 2005
More decks from MMA Capital Holdings Inc
 Q1 2021 Earnings Presentation20 slides · May 18, 2021
 Investor Presentation (April 2021)21 slides · Apr 5, 2021
 Q3 2020 Earnings Presentation20 slides · Nov 10, 2020
 Q2 2020 Earnings Presentation20 slides · Aug 12, 2020
 Q1 2020 Earnings Presentation20 slides · May 11, 2020
 Investor Presentation (March 2020)20 slides · Mar 17, 2020