Boston Private Financial Holdings Inc
Boston Private Financial — Q1 2004 Earnings Presentation
17 slides from Boston Private Financial's earnings presentation, Apr 26, 2004
Slide 1: Forward Looking Statements
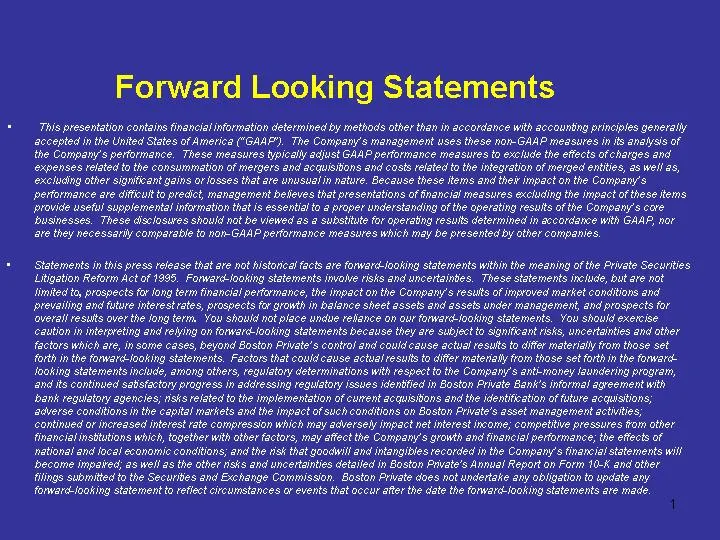
Forward Looking Statements This presentation contains financial information determined by methods otter than in accordance with accountng principles generally accepted in the United States of America ("GAAP"). The Company's management uses these non-GAAP measures in its analysts of the Company's per
Slide 2: Earnings Growth
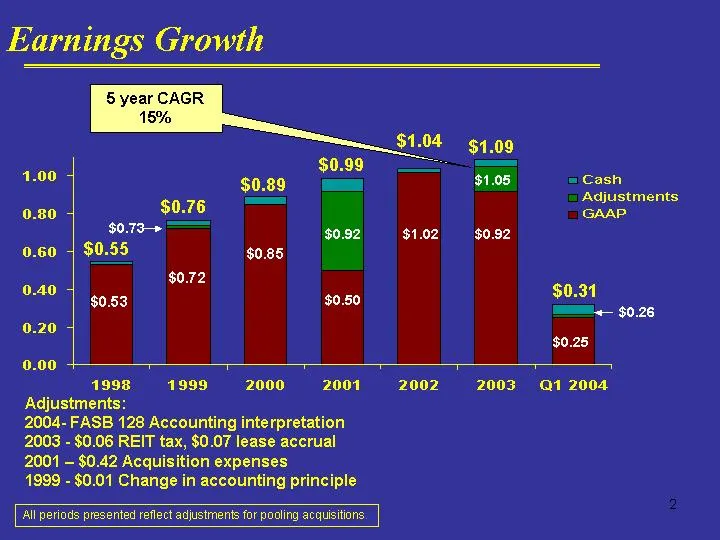
Earnings Growth 1998 1999, 2000 2001 2002 Adjustments: 2004- FASB 128 Accounting interpretation 2003 - $0.06 REIT tax, $0.07 lease accrual 2001 — $0.42 Acquisition expenses 1999 - $0.01 Change in accounting principle | Allperiods presented reflect adjustments for pooling acquisitions
Slide 3: Total Operating Revenue
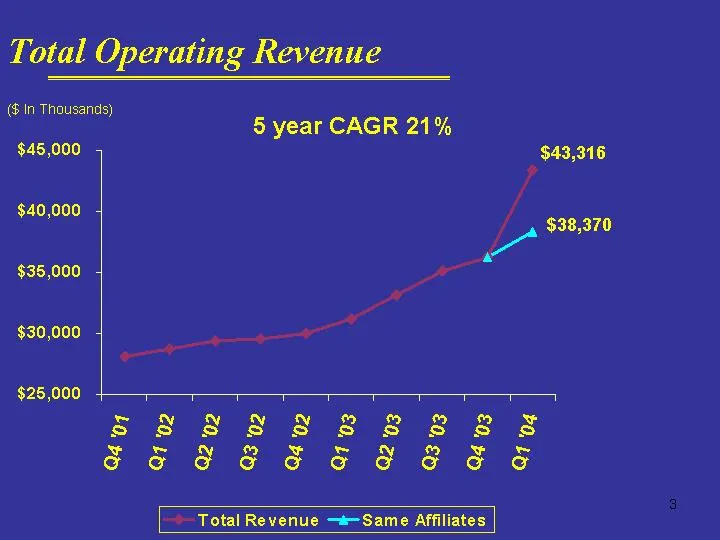
Total Operating Revenue 5 year CAGR 21% $45,000 $43,316 % $40,000. / a $38,370 a $36,000 a ye $30,000 os esi $25,000 —— — .
Slide 4: Assets Under Management
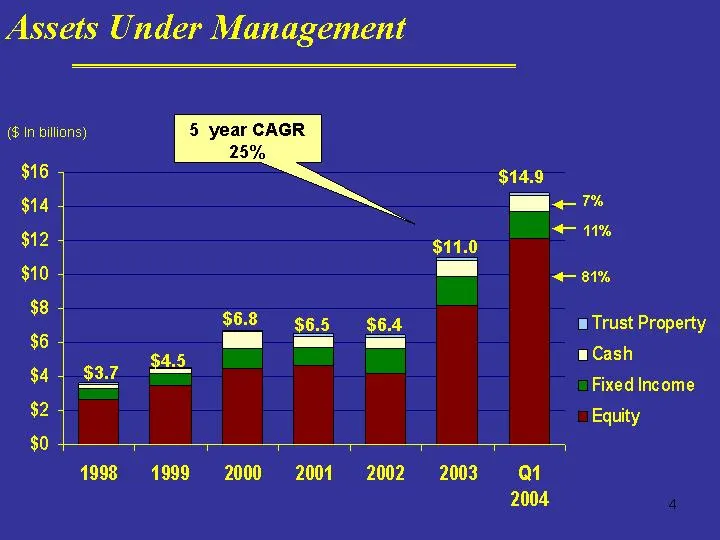
Assets Under Management ($ In billions) $11.0
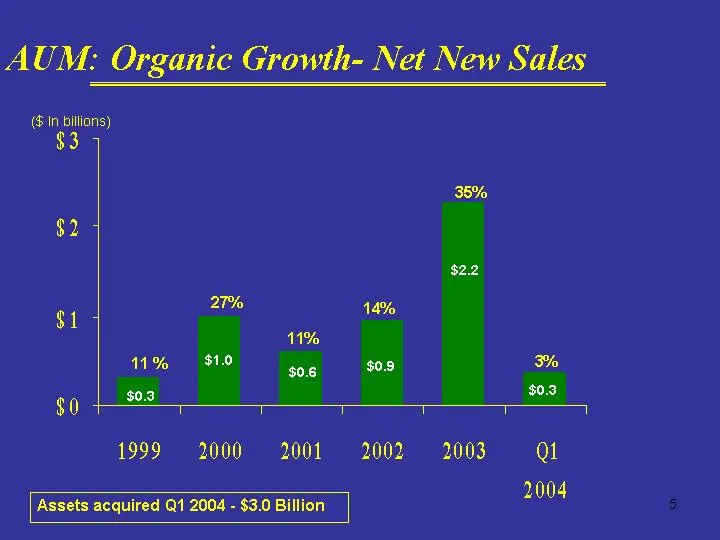
Slide 5: Link to searchable text
Link to searchable text of slide shown above
Slide 6: AUM: Market Action
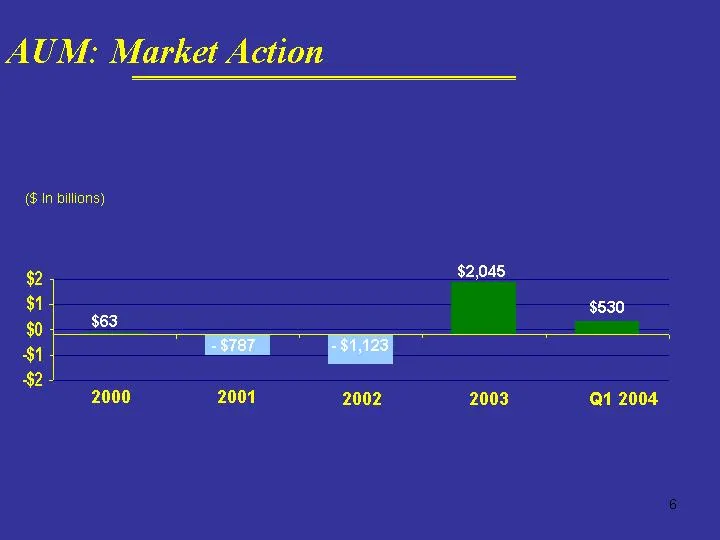
AU™M: Market Action in bition) 2 $2,045 S| “ $0 ~ st ey ee _| $2 2000 2001 2002 2003 Q1 2004
Slide 7: Net Interest Income
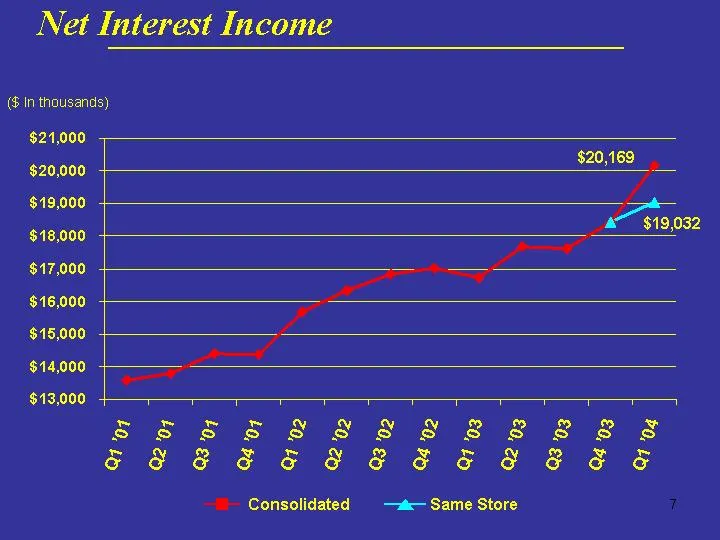
Net Interest Income (¢ In thousands) $21,000 iS oo Bos ons 6 oc Coe soe ¢é&e@ FESS FGESESEEES Consolidated = —s&— Same Store
Slide 8: Net Interest Margin Trend
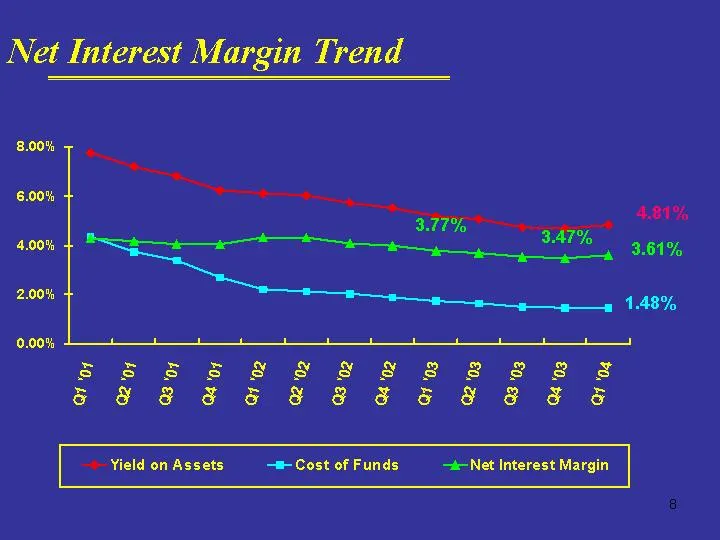
Net Interest Margin Trend 2.00% 1.48% Yield on Assets —= Cost of Funds 4--Net Interest Margin
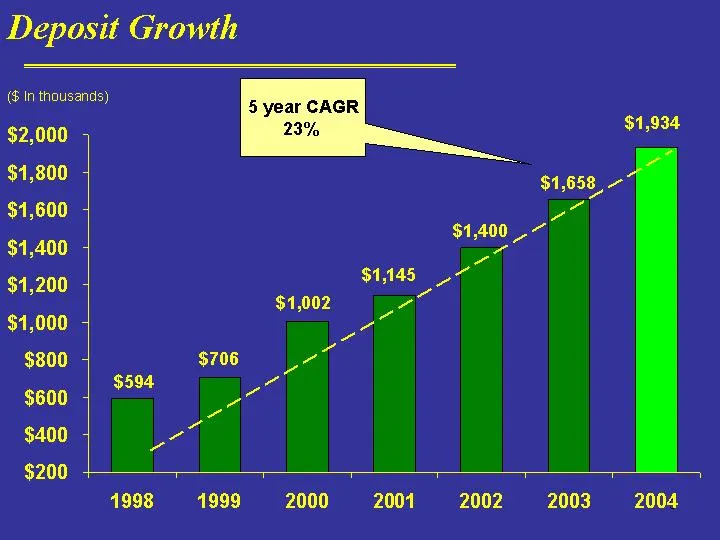
Slide 9: Deposit Growth
Deposit Growth (@ In thousands) $2,000 $1,800 $1,600 $1,400 $1,200 4 an 2 $1,400 $1,002 9 ail 1998 1999 ©2000 ©=. 2007 2002 2003 2004
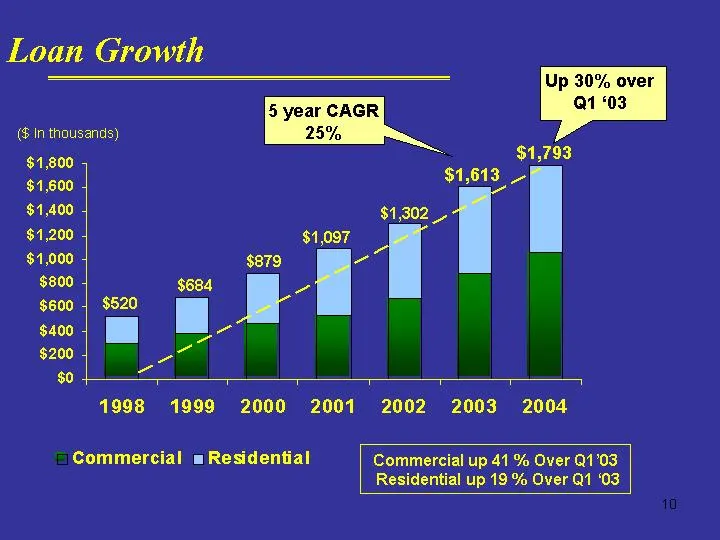
Slide 10: Loan Growth
Loan Growth ($ In thousands) os a 2 $1,400 $1,200 SS $1,000 $800 $600 $400 $200 $0 1998 "990 2000. 2001 "2002 “2003 004 Commercial = Residential Commercial up 41 % Over Q1°03 Residential up 19 % Over Q1 ‘03 10
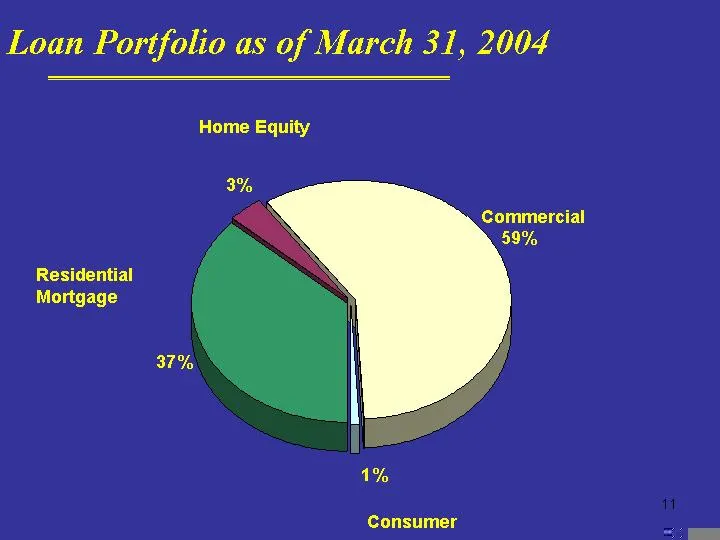
Slide 11: Loan Portfolio as of March 31, 2004
Loan Portfolio as of March 31, 2004
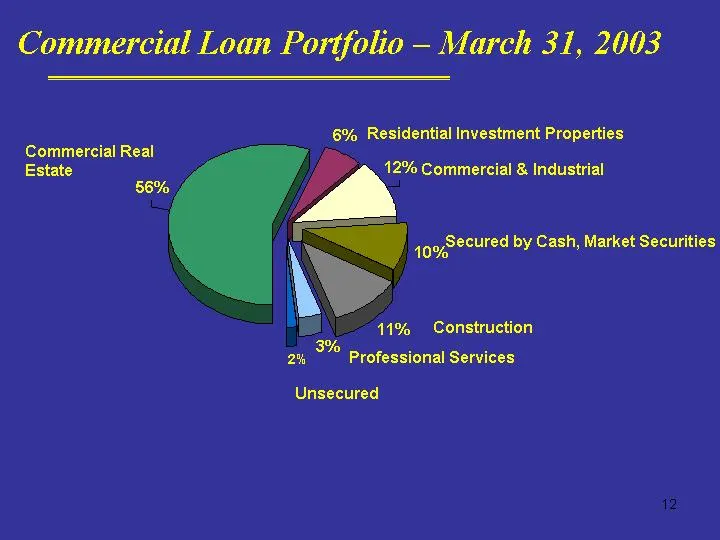
Slide 12: Commercial Loan Portfolio
Commercial Loan Portfolio — March 31, 2003 6% Residential Investment Properties 12
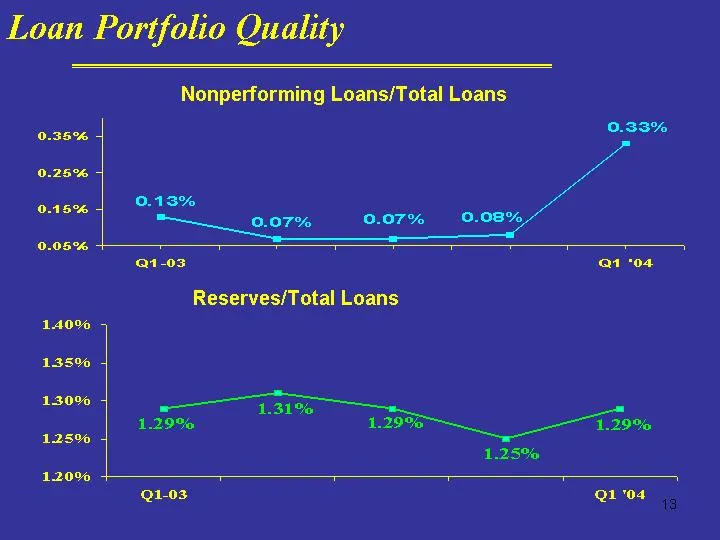
Slide 13: Loan Portfolio Quality
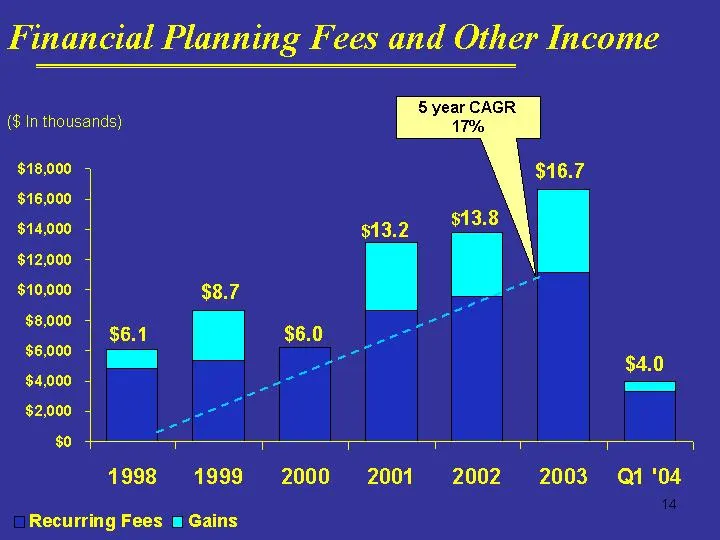
Slide 14: Financial Planning Fees and Other Income
Financial Planning Fees and Other Income ($ In thousands) i $14,000 $12, itcie 1998 1999 2000 2001 2002 2003 Q1'04 14 _ Recurring Fees = Gains
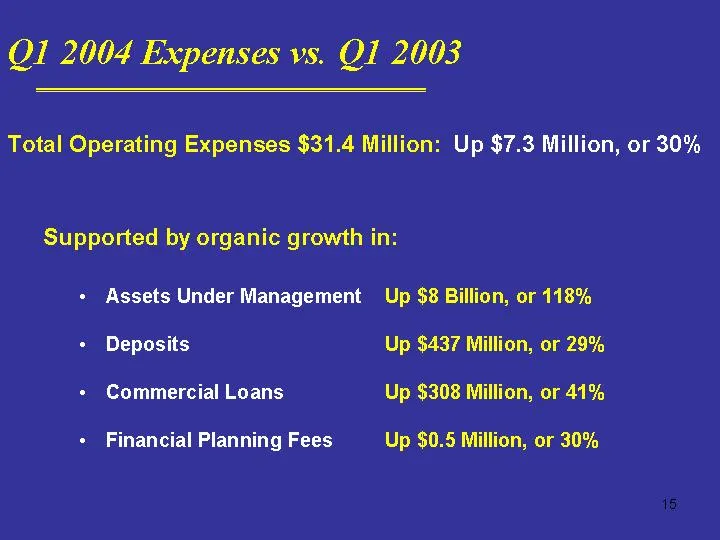
Slide 15: Q1 2004 Expenses vs. Q1 2003
QI 2004 Expenses vs. QI 2003 Total Operating Expenses $31.4 Million: Up $7.3 Million, or 30% Supported by organic growth in: + Assets Under Management Up $8 Billion, or 118% + Deposits Up $437 Million, or 29% + Commercial Loans Up $308 Million, or 41% + Financial Planning Fees Up $0.5 Million, or 30
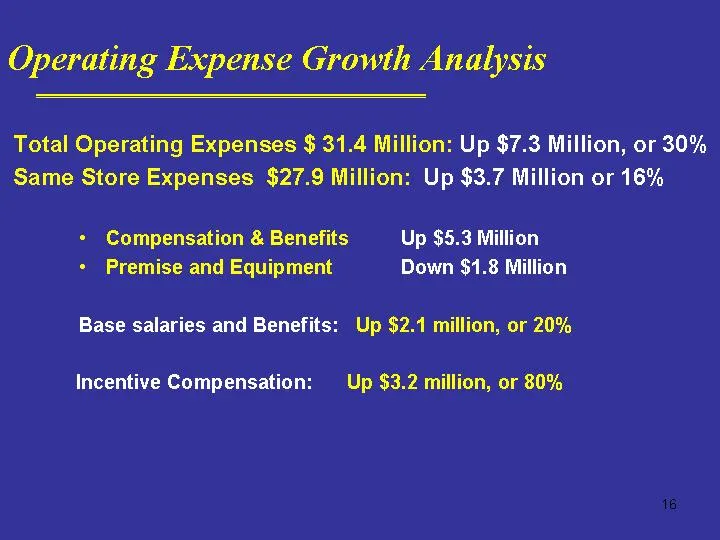
Slide 16: Operating Expense Growth Analysis
Operating Expense Growth Analysis Total Operating Expenses $ 31.4 Million: Up $7.3 Million, or 30% Same Store Expenses $27.9 Million: Up $3.7 Million or 16% + Compensation & Benefits Up $5.3 Million + Premise and Equipment Down $1.8 Million Base salaries and Benefits: Up $2.1 million, or 20% Incenti
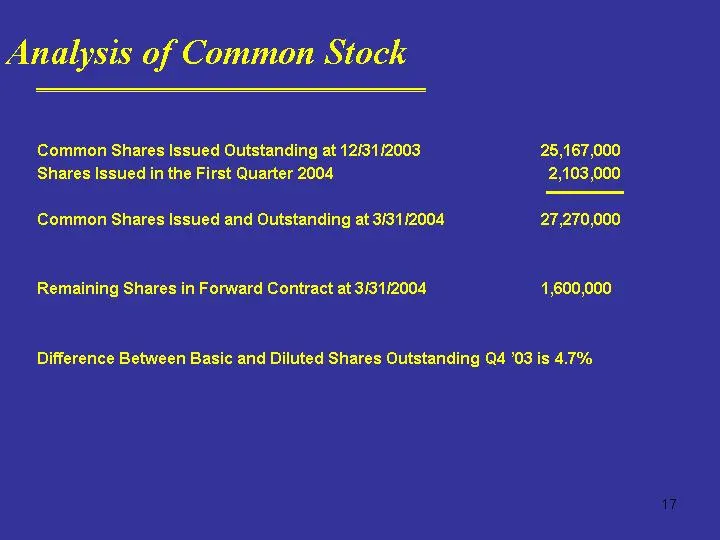
Slide 17: Searchable text: Forward Looking Statements
Searchable text section of graphics shown above For ward Looking Statements • This presentation contains financial information determined by methods other than in accordance with accounting principles generally accepted in the United States of America (“GAAP”). The Company’s management uses these no
Source: SEC EDGAR · 8-K filed Apr 26, 2004
More decks from Boston Private Financial Holdings Inc
 Proxy Contest (April 2021)28 slides · Apr 9, 2021
 Merger or Acquisition (April 2021)24 slides · Apr 7, 2021
 Proxy Contest (March 2021)50 slides · Mar 30, 2021
 Proxy Contest (February 2021)67 slides · Feb 2, 2021
 Merger or Acquisition (January 2021)15 slides · Jan 4, 2021
 Investor Day (May 2019)52 slides · May 6, 2019