MedEquities Realty Trust — Investor Presentation (February 2018)
27 slides from MedEquities Realty Trust's investor presentation, Feb 21, 2018

Slide 1: Investor Presentation Q1 2018
Investor Presentation Q1 2018 Exhibit 99.3
Slide 2: Disclaimer
Disclaimer Forward-looking Statements Various statements in this presentation are “forward-looking statements” within the meaning of the U.S. federal securities laws. Forward-looking statements provide our current expectations or forecasts of future events and are not statements of historical fact.
Slide 3: MedEquities Overview
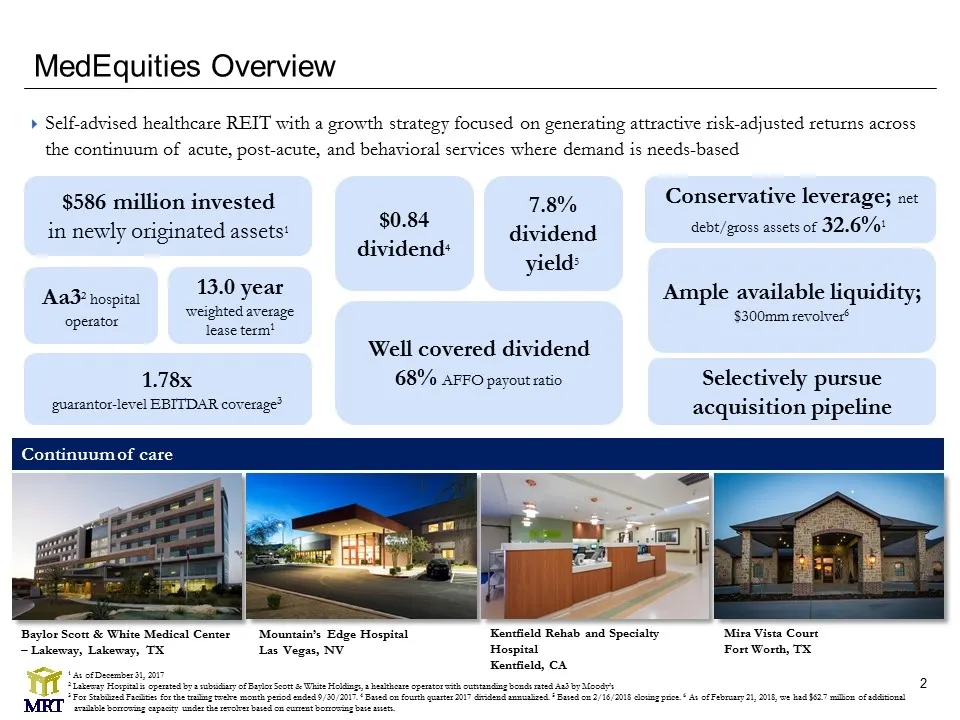
MedEquities Overview Self-advised healthcare REIT with a growth strategy focused on generating attractive risk-adjusted returns across the continuum of acute, post-acute, and behavioral services where demand is needs-based $586 million invested in newly originated assets1 1.78x guarantor-level EBITD
Slide 4: Summary of Healthcare Portfolio
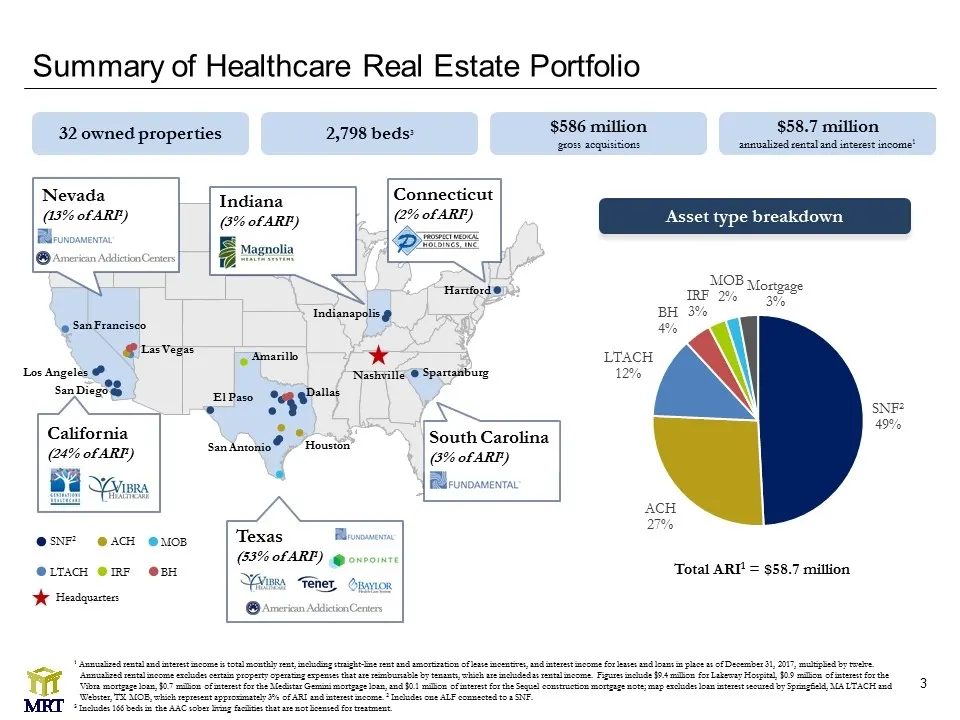
1 Annualized rental and interest income is total monthly rent, including straight-line rent and amortization of lease incentives, and interest income for leases and loans in place as of December 31, 2017, multiplied by twelve. Annualized rental income excludes certain property operating expenses tha
Slide 5: Capital Partner for Experienced, Growth-Minded Operators
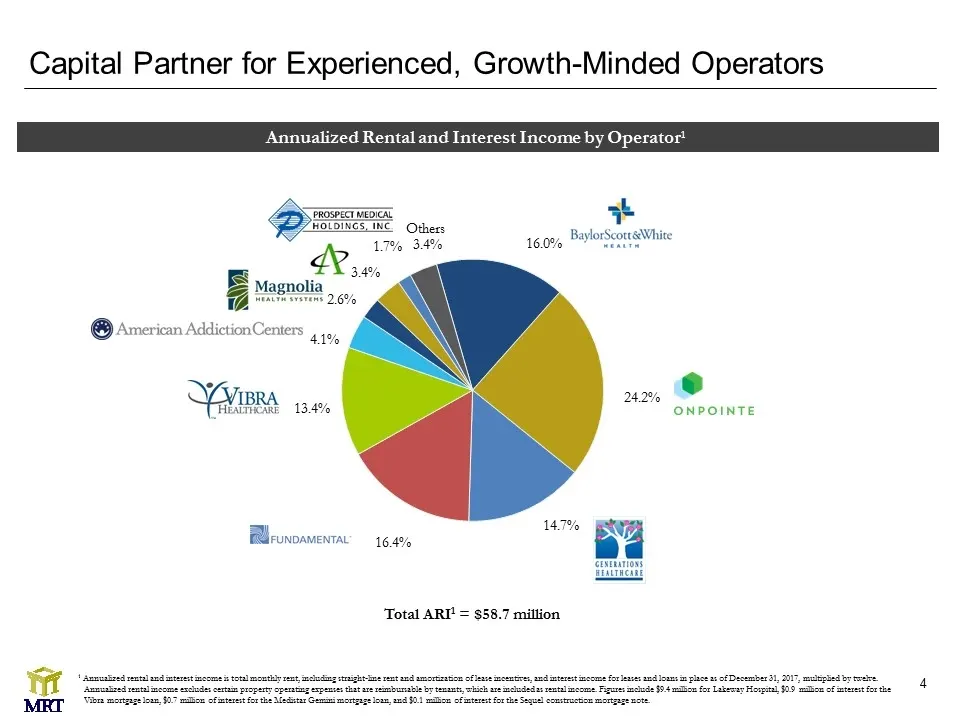
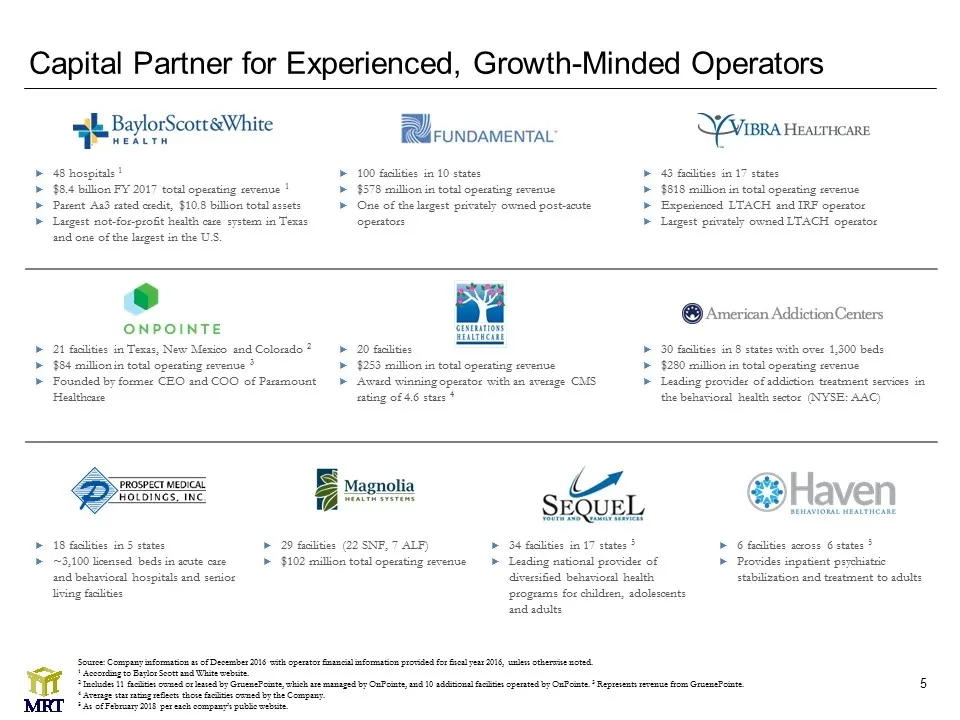
Capital Partner for Experienced, Growth-Minded Operators 1 Annualized rental and interest income is total monthly rent, including straight-line rent and amortization of lease incentives, and interest income for leases and loans in place as of December 31, 2017, multiplied by twelve. Annualized renta
Slide 6: Operator Profiles
18 facilities in 5 states ~3,100 licensed beds in acute care and behavioral hospitals and senior living facilities 29 facilities (22 SNF, 7 ALF) $102 million total operating revenue 34 facilities in 17 states 5 Leading national provider of diversified behavioral health programs for children, adolesc
Slide 7: Facility and Guarantor Lease Coverage and Lease Expirations
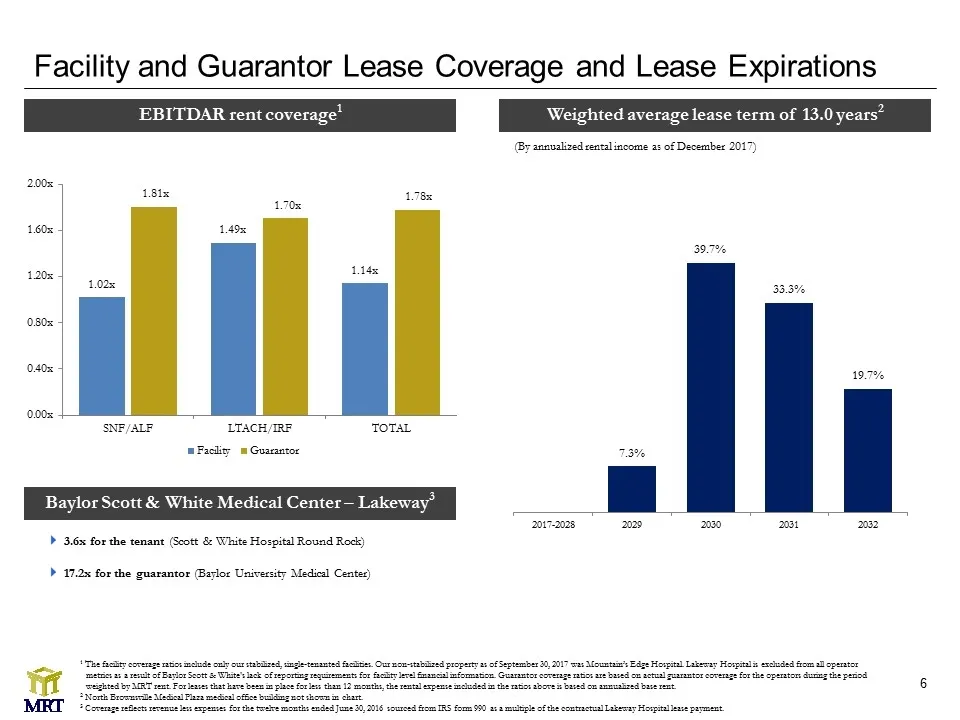
Facility and Guarantor Lease Coverage and Lease Expirations EBITDAR rent coverage1 Weighted average lease term of 13.0 years2 (By annualized rental income as of December 2017) Baylor Scott & White Medical Center – Lakeway3 3.6x for the tenant (Scott & White Hospital Round Rock) 17.2x for the guarant
Slide 8: Differentiated Investment Strategy
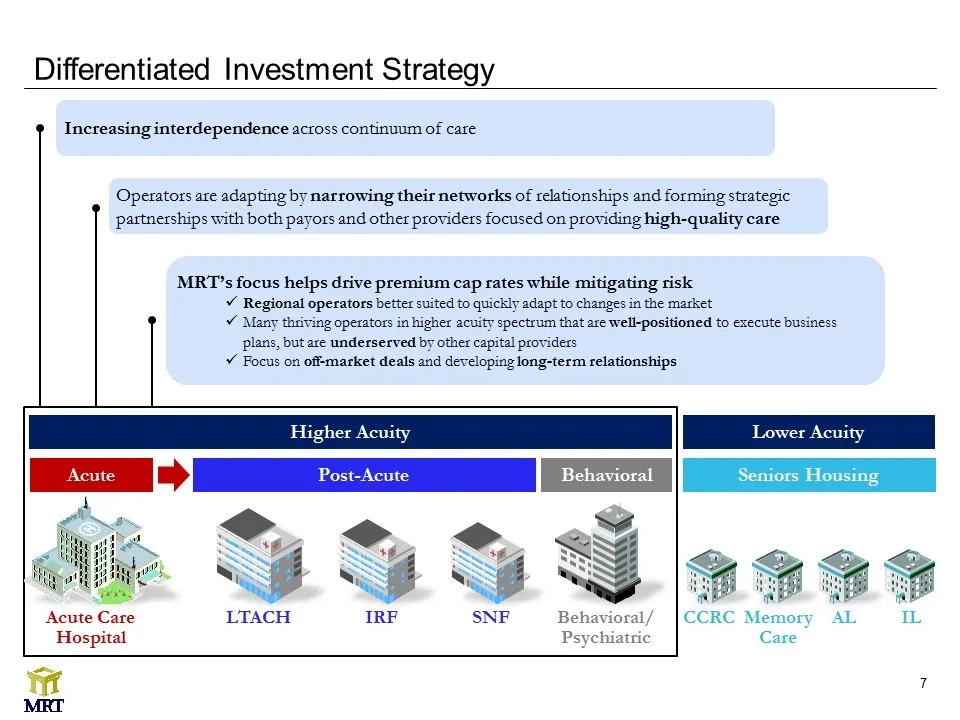
Differentiated Investment Strategy Acute Highest acuity Post-Acute LTACH IRF SNF Acute Care Hospital Seniors Housing CCRC Memory Care AL IL Behavioral Behavioral/ Psychiatric Higher Acuity Lower Acuity Increasing interdependence across continuum of care Operators are adapting by narrowing their netw
Slide 9: Acquisition Opportunities
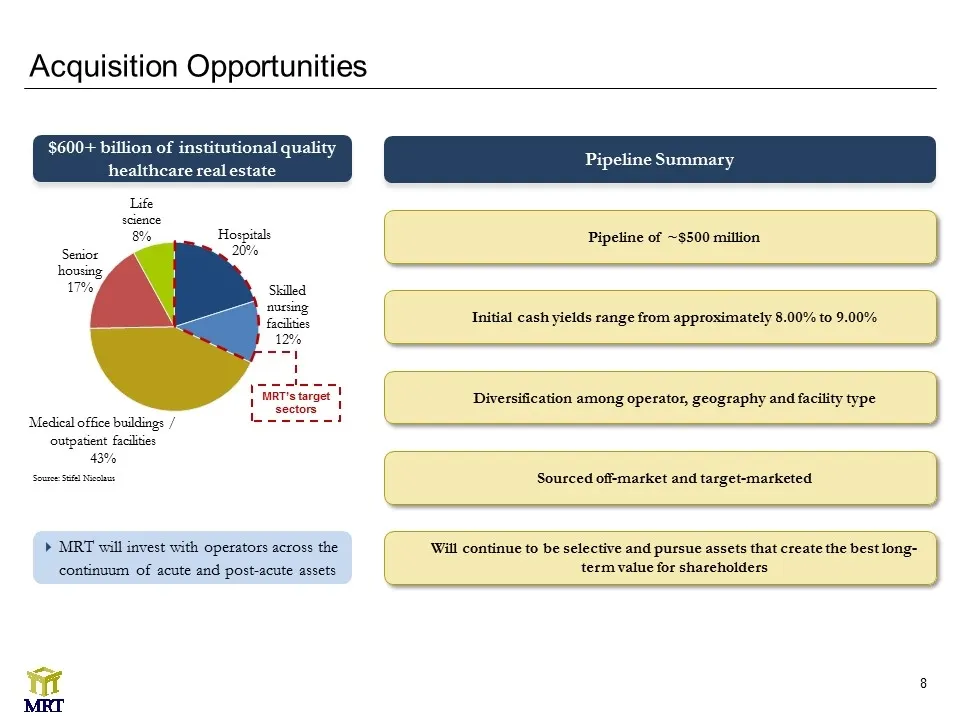
Acquisition Opportunities $600+ billion of institutional quality healthcare real estate MRT will invest with operators across the continuum of acute and post-acute assets Source: Stifel Nicolaus Medical office buildings / outpatient facilities 43% MRT’s target sectors Pipeline Summary Pipeline of ~$
Slide 10: Accelerating Improvement in Operating Results
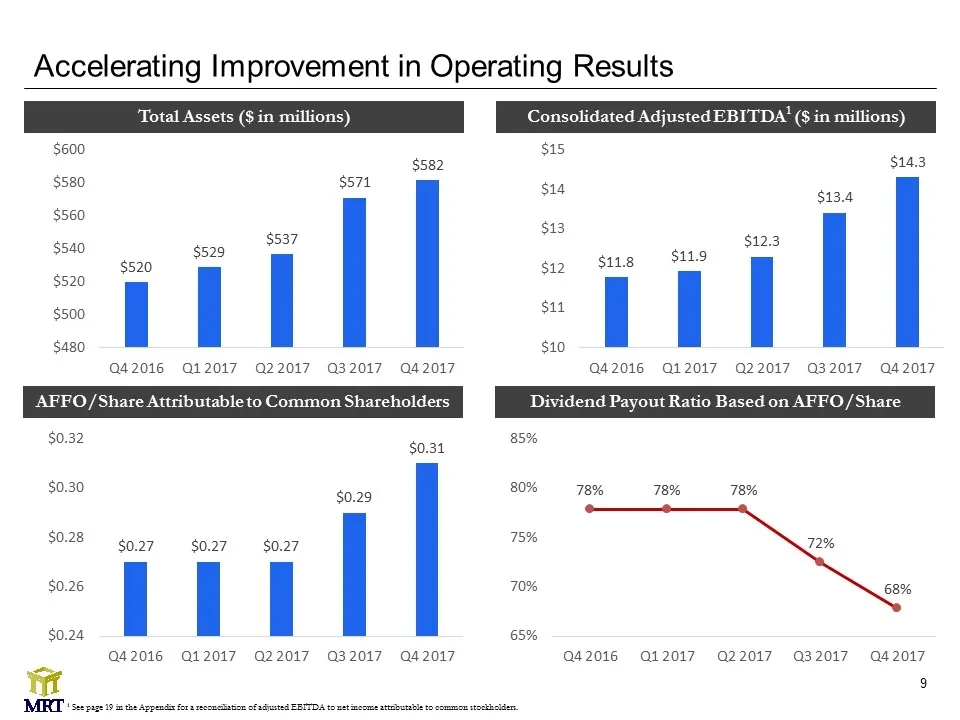
Accelerating Improvement in Operating Results Total Assets ($ in millions) Consolidated Adjusted EBITDA1 ($ in millions) AFFO/Share Attributable to Common Shareholders Dividend Payout Ratio Based on AFFO/Share 1 See page 19 in the Appendix for a reconciliation of adjusted EBITDA to net income attrib
Slide 11: Flexible Debt Capital
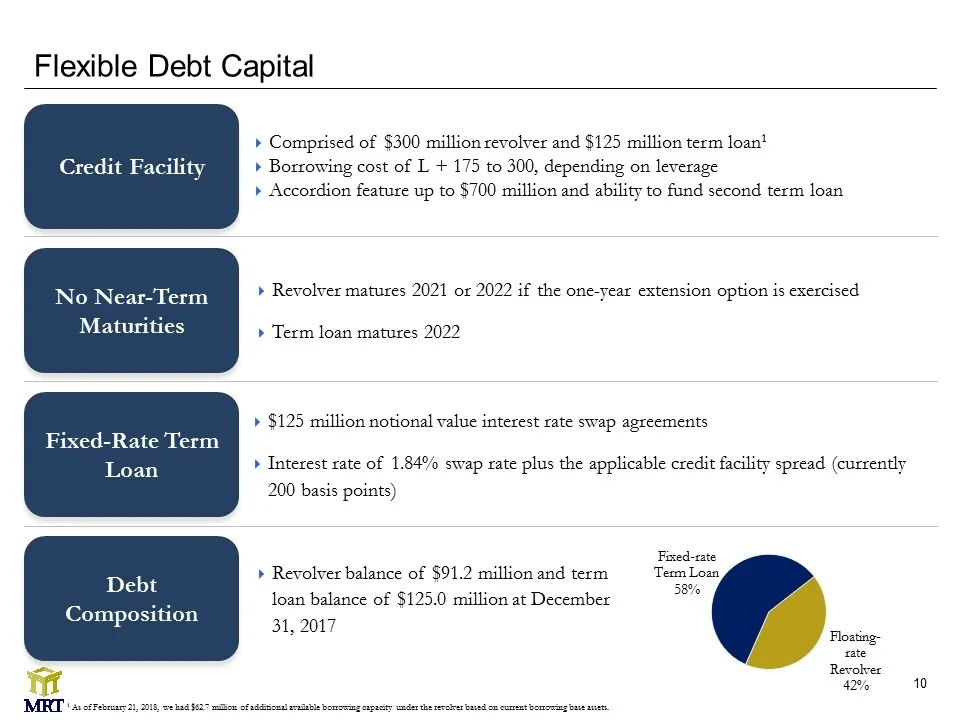
Flexible Debt Capital Comprised of $300 million revolver and $125 million term loan1 Borrowing cost of L + 175 to 300, depending on leverage Accordion feature up to $700 million and ability to fund second term loan Credit Facility Fixed-Rate Term Loan Debt Composition $125 million notional value int
Slide 12: Balance Sheet Positioned for Growth
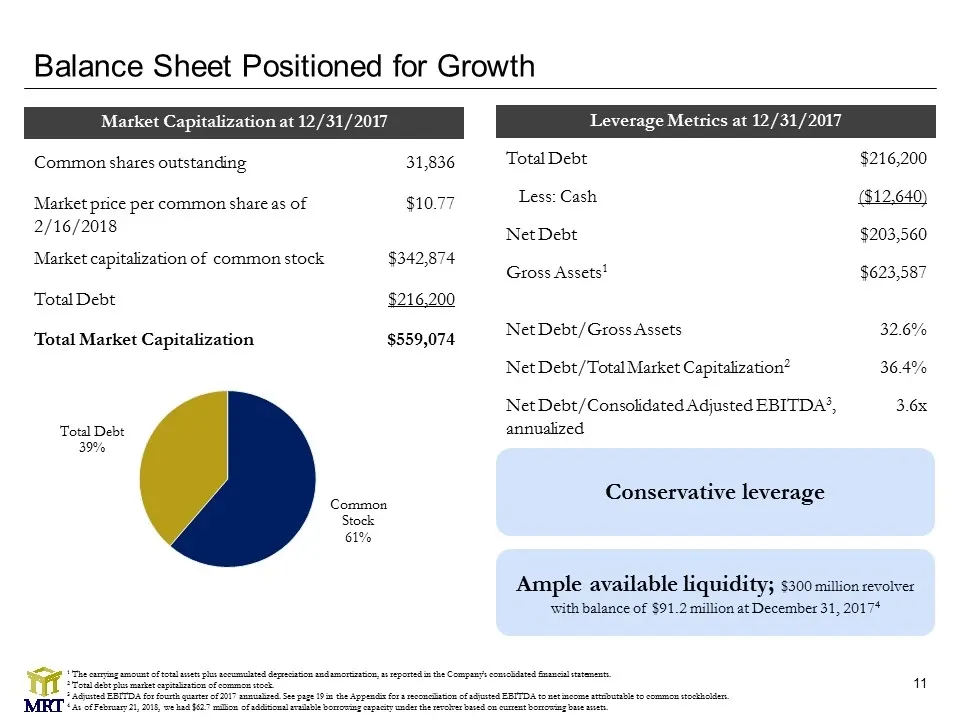
Common shares outstanding 31,836 Market price per common share as of 2/16/2018 $10.77 Market capitalization of common stock $342,874 Total Debt $216,200 Total Market Capitalization $559,074 Balance Sheet Positioned for Growth Total Debt $216,200 Less: Cash ($12,640) Net Debt $203,560 Gross Assets1 $
Slide 13: Opportunities to Increase Shareholder Value
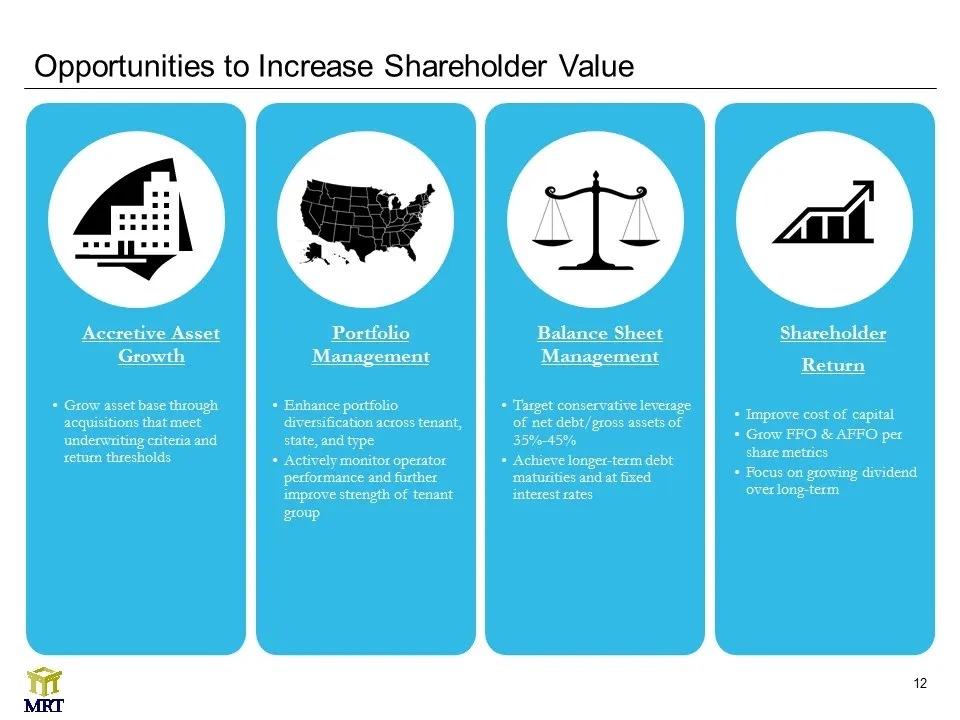
Opportunities to Increase Shareholder Value Accretive Asset Growth Grow asset base through acquisitions that meet underwriting criteria and return thresholds Portfolio Management Enhance portfolio diversification across tenant, state, and type Actively monitor operator performance and further improv
Slide 14: Appendix
Appendix
Slide 15: Timeline and Operating Statistics for GPH & Texas SNF Portfolio
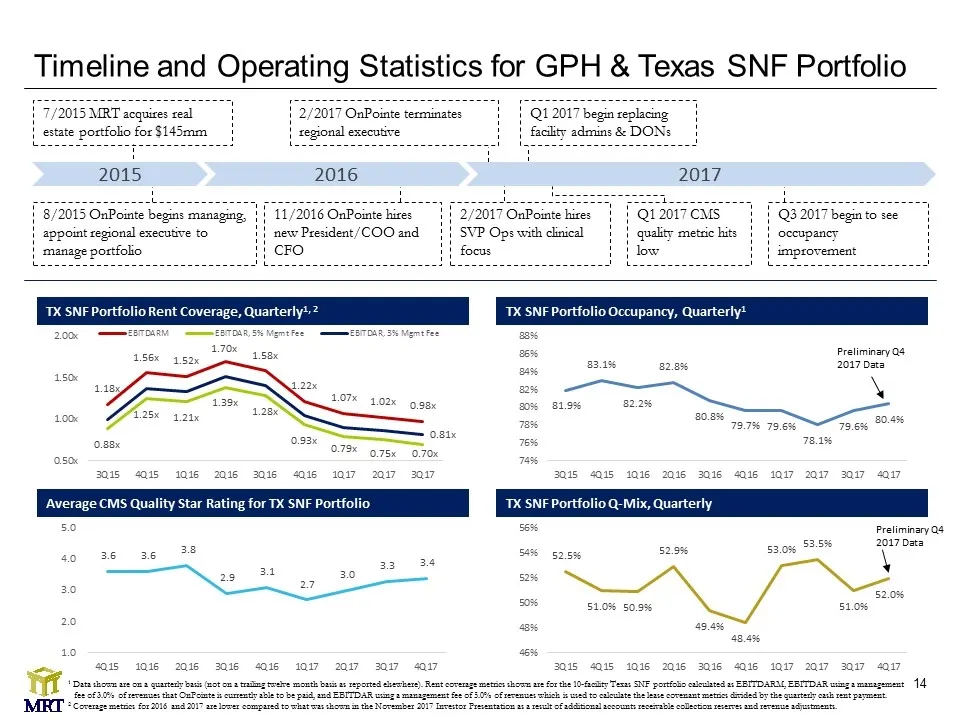
Timeline and Operating Statistics for GPH & Texas SNF Portfolio 2015 2016 2017 7/2015 MRT acquires real estate portfolio for $145mm 11/2016 OnPointe hires new President/COO and CFO 2/2017 OnPointe hires SVP Ops with clinical focus 8/2015 OnPointe begins managing, appoint regional executive to manage
Slide 16: GPH Ownership, Management, and Guarantee Structure
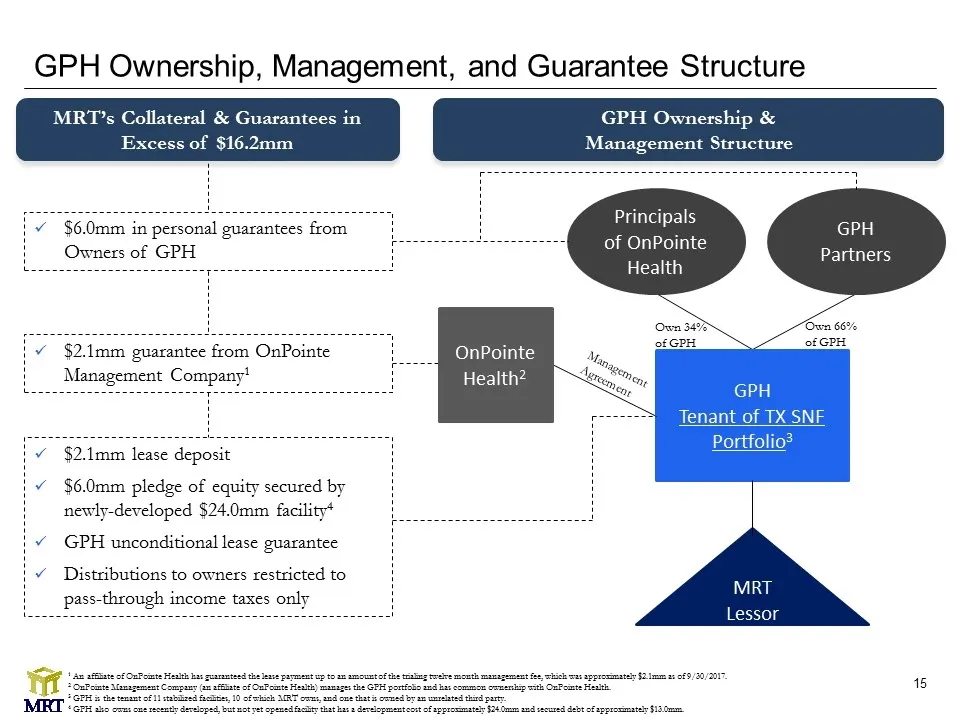
GPH Ownership, Management, and Guarantee Structure GPH Tenant of TX SNF Portfolio3 Principals of OnPointe Health GPH Partners MRT Lessor OnPointe Health2 Own 34% of GPH Own 66% of GPH $6.0mm in personal guarantees from Owners of GPH $2.1mm lease deposit $6.0mm pledge of equity secured by newly-devel
Slide 17: Consolidated Balance Sheets
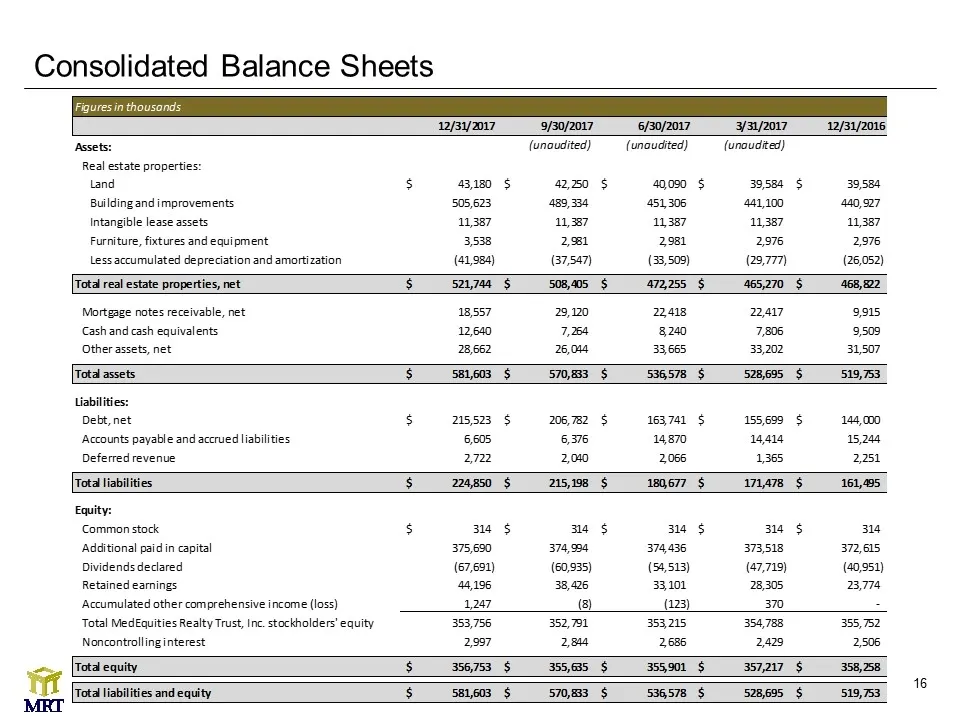
Consolidated Balance Sheets
Slide 18: Consolidated Statements of Operations – GAAP
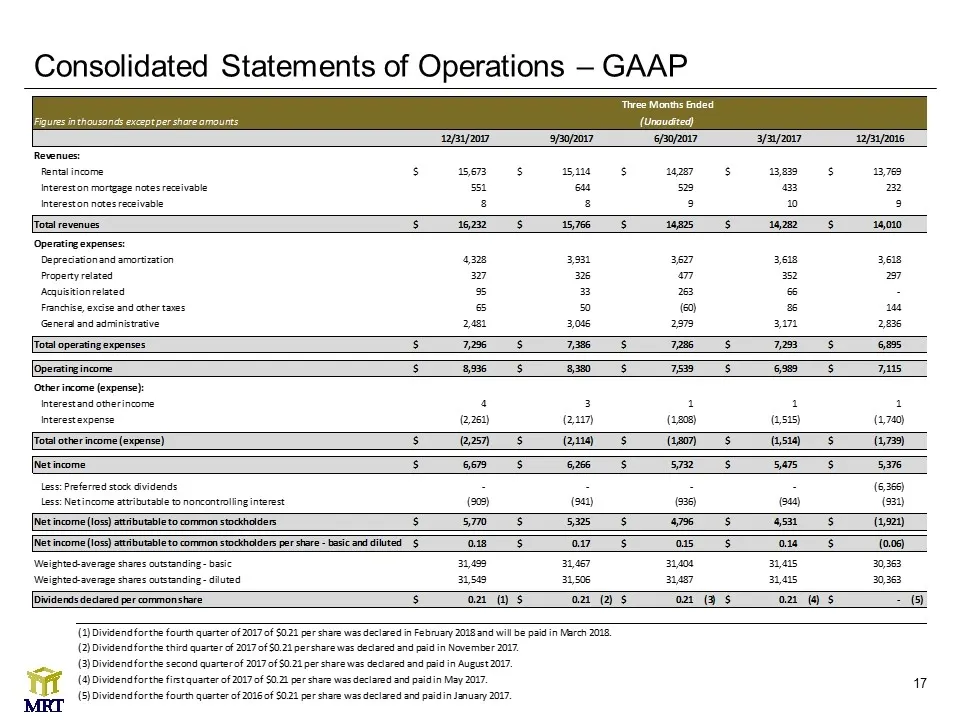
Consolidated Statements of Operations – GAAP
Slide 19: Reconciliations of Non-GAAP Measures
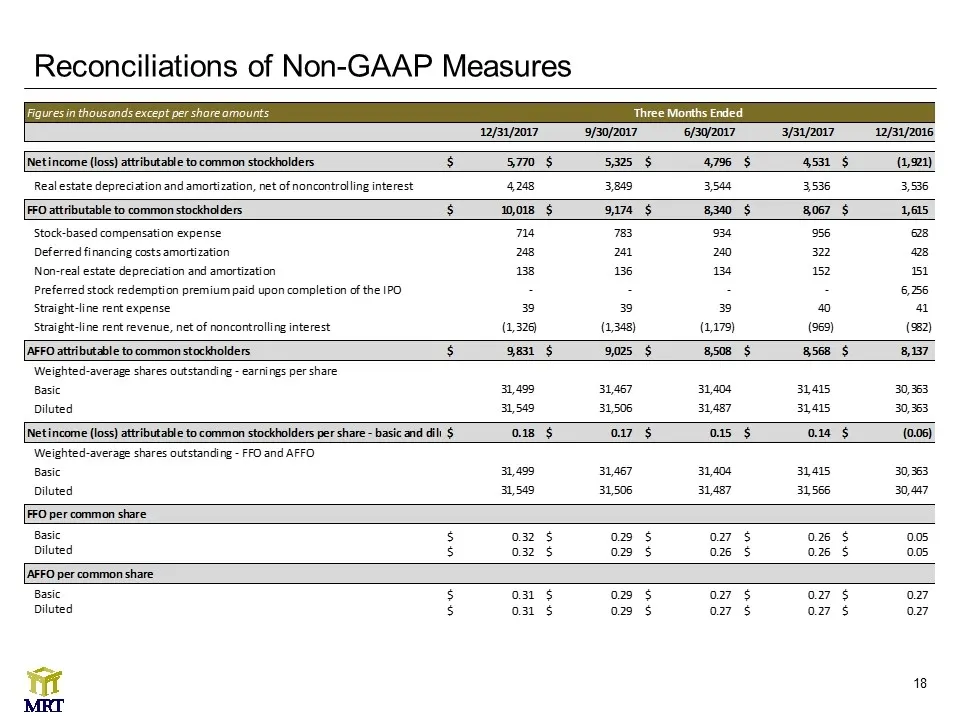
Reconciliations of Non-GAAP Measures Figures in thousands except per share amounts
Slide 20: Reconciliations of Non-GAAP Measures
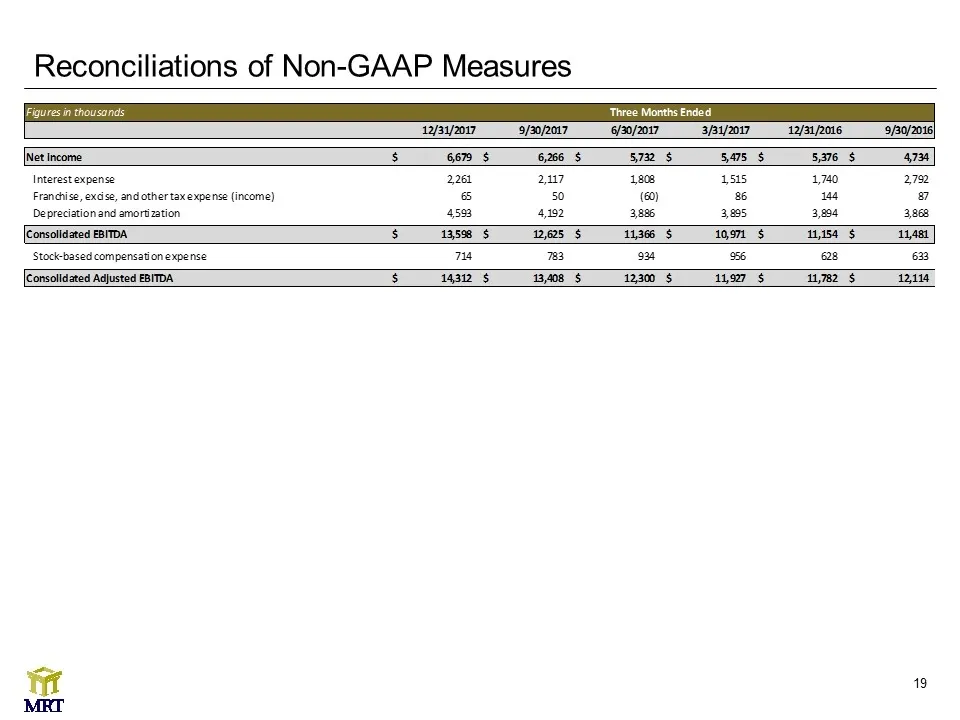
Reconciliations of Non-GAAP Measures Figures in thousands except per share amounts
Slide 21: Acute Care Hospitals
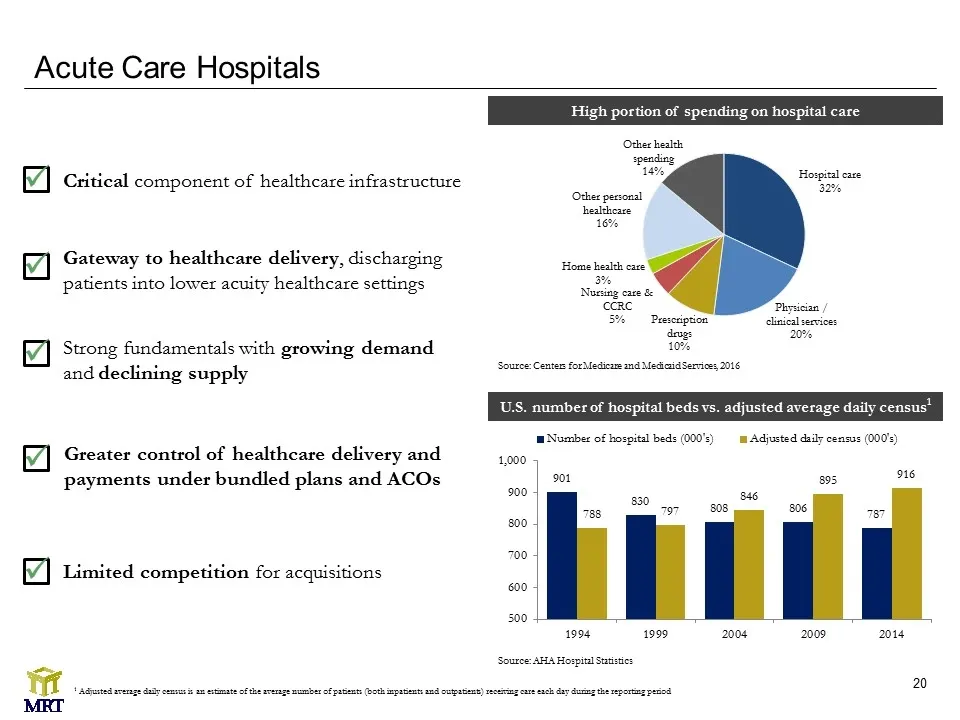
Acute Care Hospitals High portion of spending on hospital care Critical component of healthcare infrastructure ü Gateway to healthcare delivery, discharging patients into lower acuity healthcare settings ü Greater control of healthcare delivery and payments under bundled plans and ACOs ü Strong fund
Slide 22: Skilled Nursing Facilities
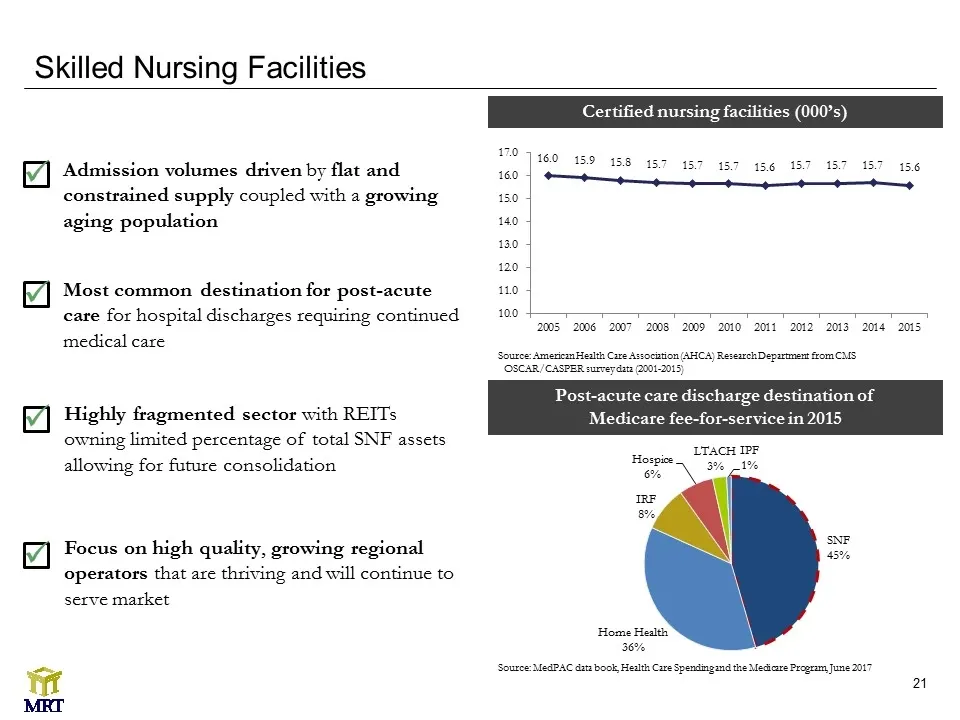
Skilled Nursing Facilities Certified nursing facilities (000’s) Post-acute care discharge destination of Medicare fee-for-service in 2015 Most common destination for post-acute care for hospital discharges requiring continued medical care ü Admission volumes driven by flat and constrained supply cou
Slide 23: Favorable Demographic Trends are Driving Industry Growth
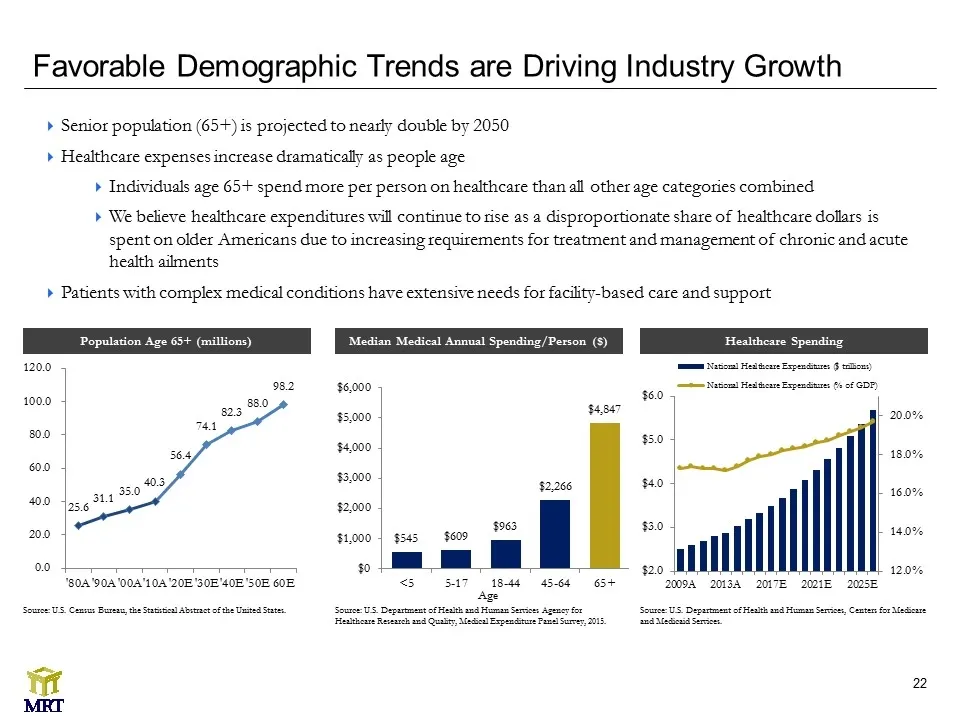
Favorable Demographic Trends are Driving Industry Growth Source: U.S. Department of Health and Human Services Agency for Healthcare Research and Quality, Medical Expenditure Panel Survey, 2015. Median Medical Annual Spending/Person ($) Population Age 65+ (millions) Healthcare Spending Senior populat
Slide 24: Glossary
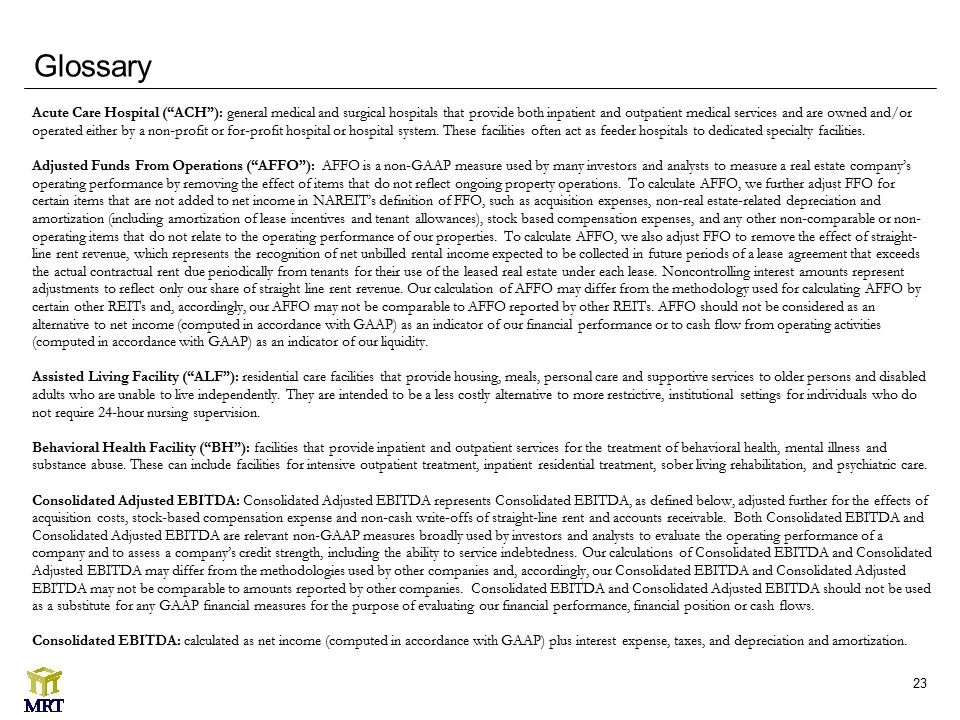
Glossary Acute Care Hospital (“ACH”): general medical and surgical hospitals that provide both inpatient and outpatient medical services and are owned and/or operated either by a non-profit or for-profit hospital or hospital system. These facilities often act as feeder hospitals to dedicated special
Slide 25: Glossary
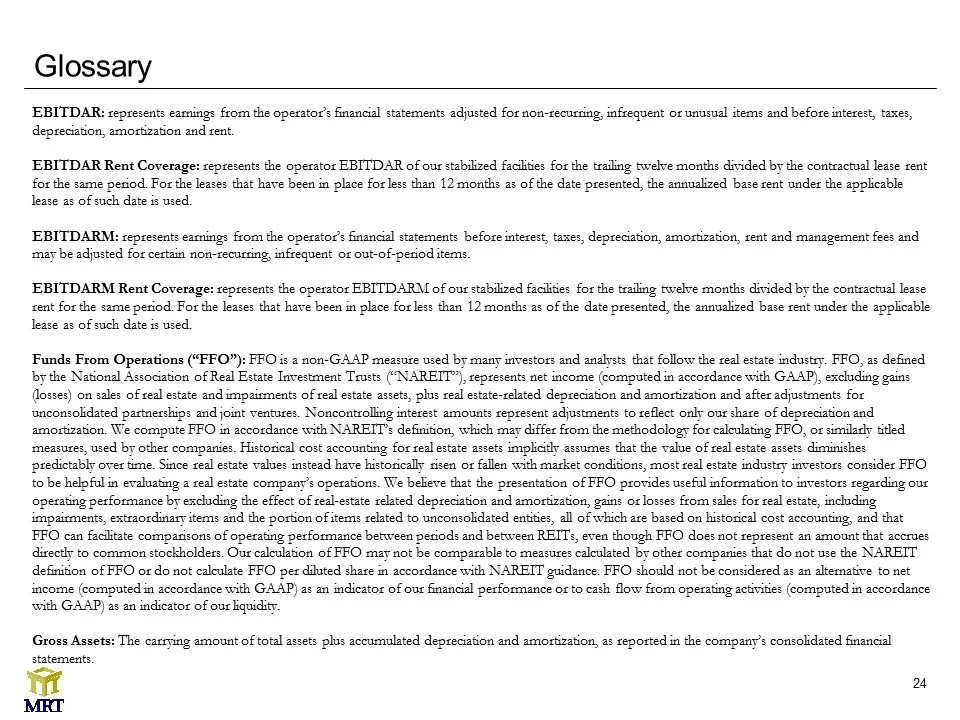
Glossary EBITDAR: represents earnings from the operator’s financial statements adjusted for non-recurring, infrequent or unusual items and before interest, taxes, depreciation, amortization and rent. EBITDAR Rent Coverage: represents the operator EBITDAR of our stabilized facilities for the trailing
Slide 26: Glossary
Glossary Inpatient Rehabilitation Facility (“IRF”): facilities that provide inpatient rehabilitation services for patients recovering from injuries, organ transplants, amputations, cardiovascular surgery, strokes, and complex neurological, orthopedic and other medical conditions following stabilizat
Slide 27: Mission Statement
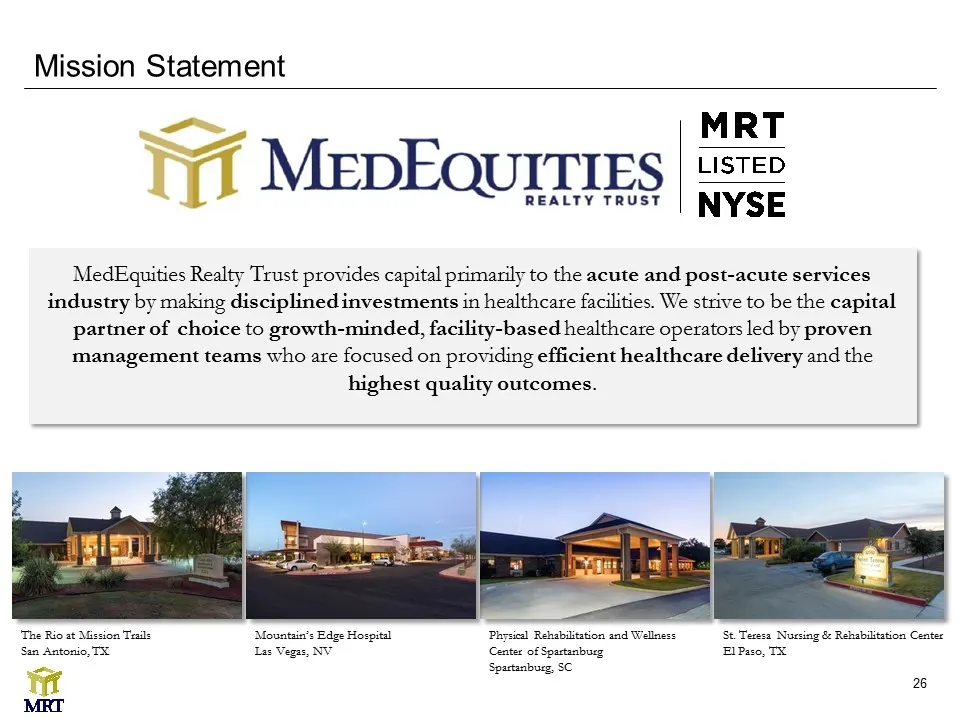
Mission Statement MedEquities Realty Trust provides capital primarily to the acute and post-acute services industry by making disciplined investments in healthcare facilities. We strive to be the capital partner of choice to growth-minded, facility-based healthcare operators led by proven management
Source: SEC EDGAR · 8-K filed Feb 21, 2018
More decks from MedEquities Realty Trust Inc
 Q3 2018 Earnings Presentation18 slides · Nov 9, 2018
 Q2 2018 Earnings Presentation26 slides · Aug 8, 2018
 Q2 2018 Earnings Presentation18 slides · Aug 8, 2018
 Q1 2018 Earnings Presentation18 slides · May 10, 2018
 Q1 2018 Earnings Presentation28 slides · May 10, 2018
 Q4 2017 Earnings Presentation18 slides · Feb 21, 2018