Expressjet — Merrill Lynch Global Transportation Conference 2004
12 slides from Expressjet's conference presentation, Jun 16, 2004
Slide 1: Merrill Lynch Global Transportation Conference
EXHIBIT 99.1 Merrill Lynch Global Transportation Conference ee June 16, 2004 ExpressJet Holdings, Inc.
Slide 2: Forward-looking statements
Expressjet. This presentation contains forward-looking statements not limited to historical facts, but reflecting our current beliefs, expectations or intentions regarding future events. A number of factors could cause actual results to differ maternally from those in the forward-looking statements,
Slide 3: ExpressJet Airlines
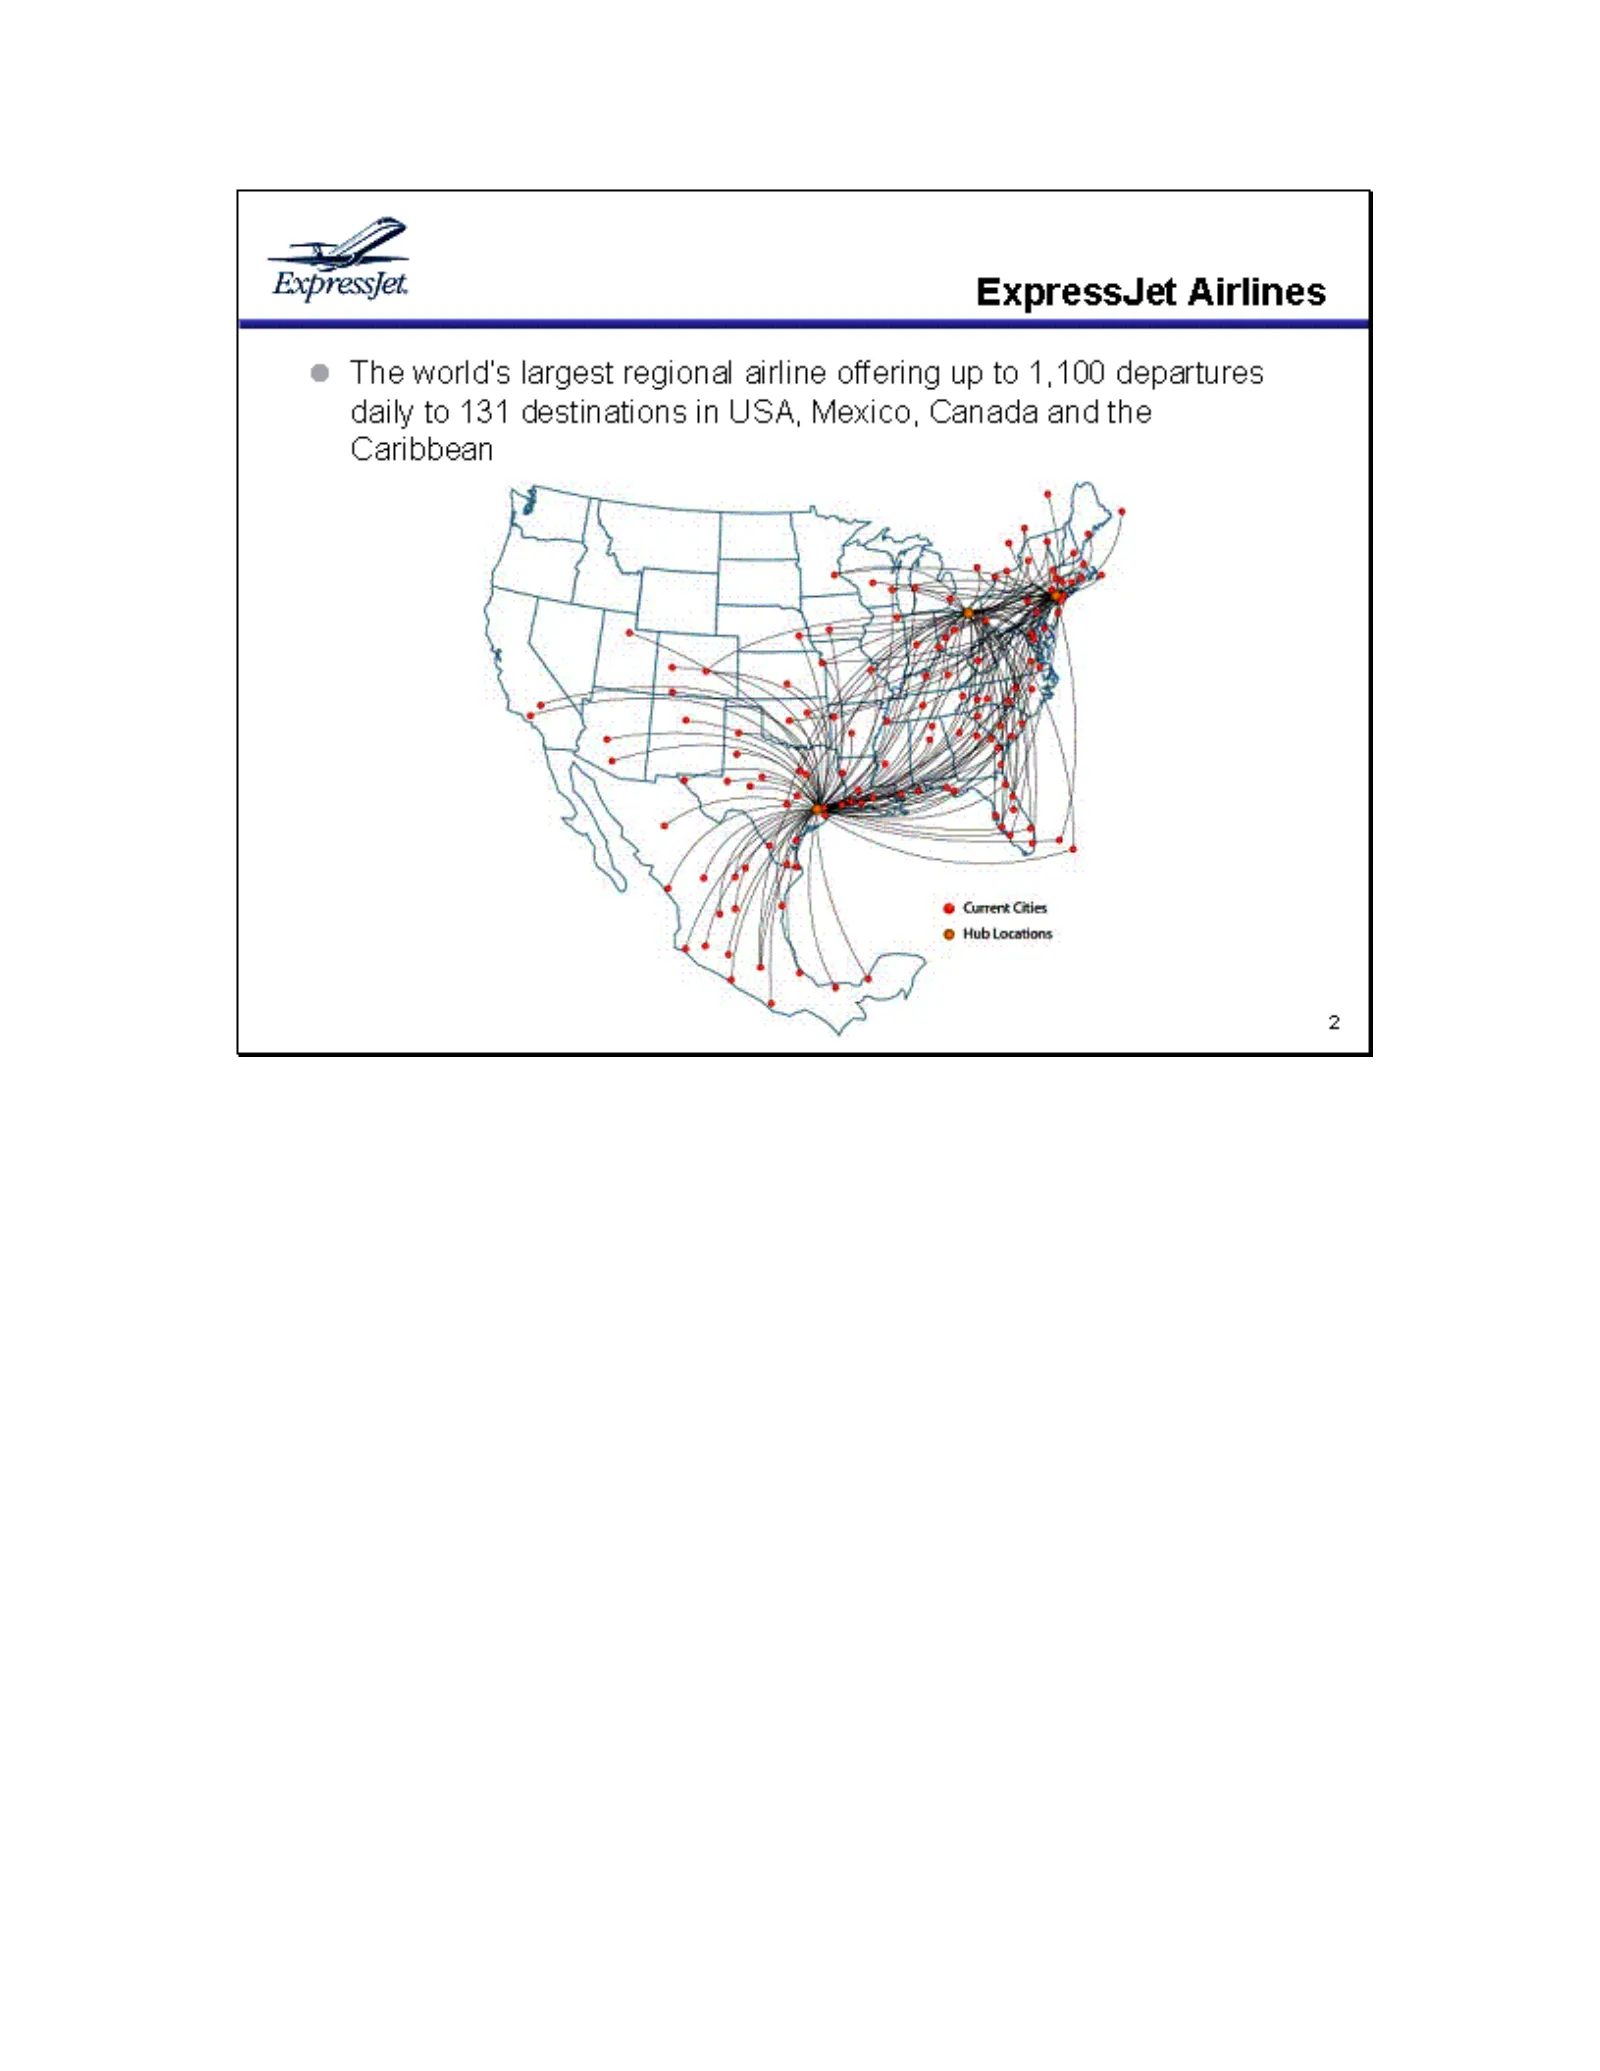
Expressjet. ExpressJet Airlines ® The world's largest regional airline offering up to 1,100 departures daily to 131 destinations in USA, Mexico, Canada and the Caribbean
Slide 4: ExpressJet Fleet
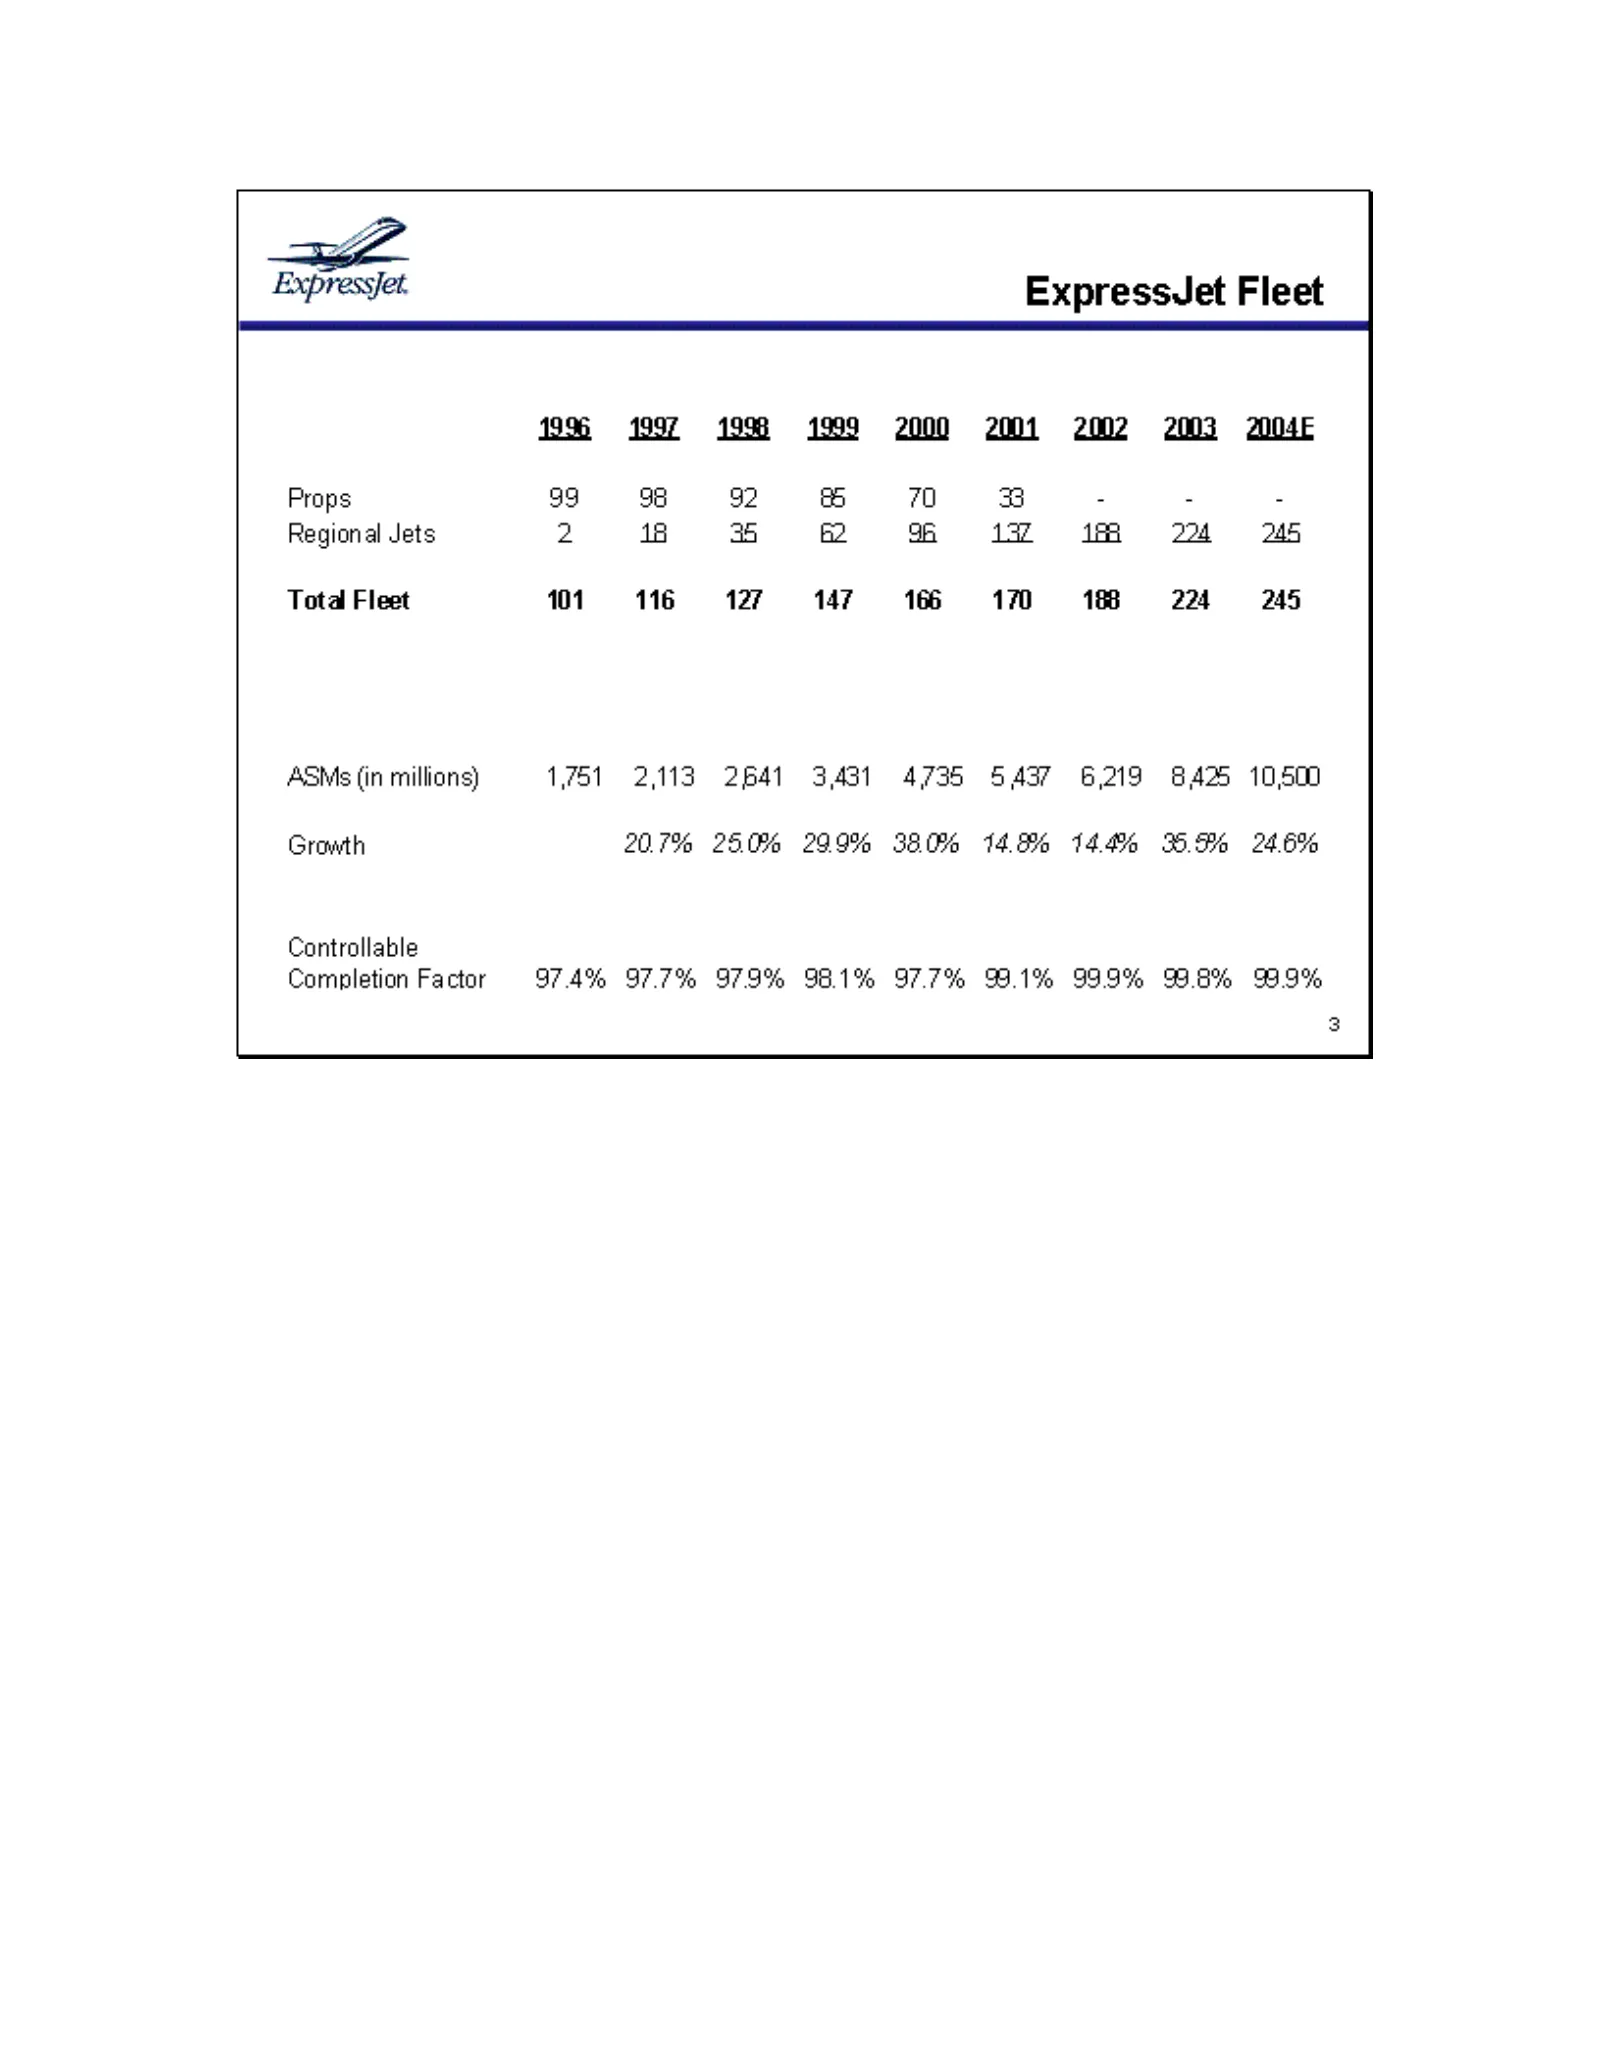
Expressjet. Props Regional Jets Tota Fleet ASMs (in millians) Growth Controllable Completion Factor ExpressJet Fleet 9% a 1998 1989 2000 2001 2002 2003 anode 99 98 92 ia] 70 3 : - - 2 18 36 &2 SR 12 1m Dd 101 «1160 «61270 = 147 166 170188 224 245 1751 2,113 2641 3431 4735 5437 6219 8425 10,500 207%
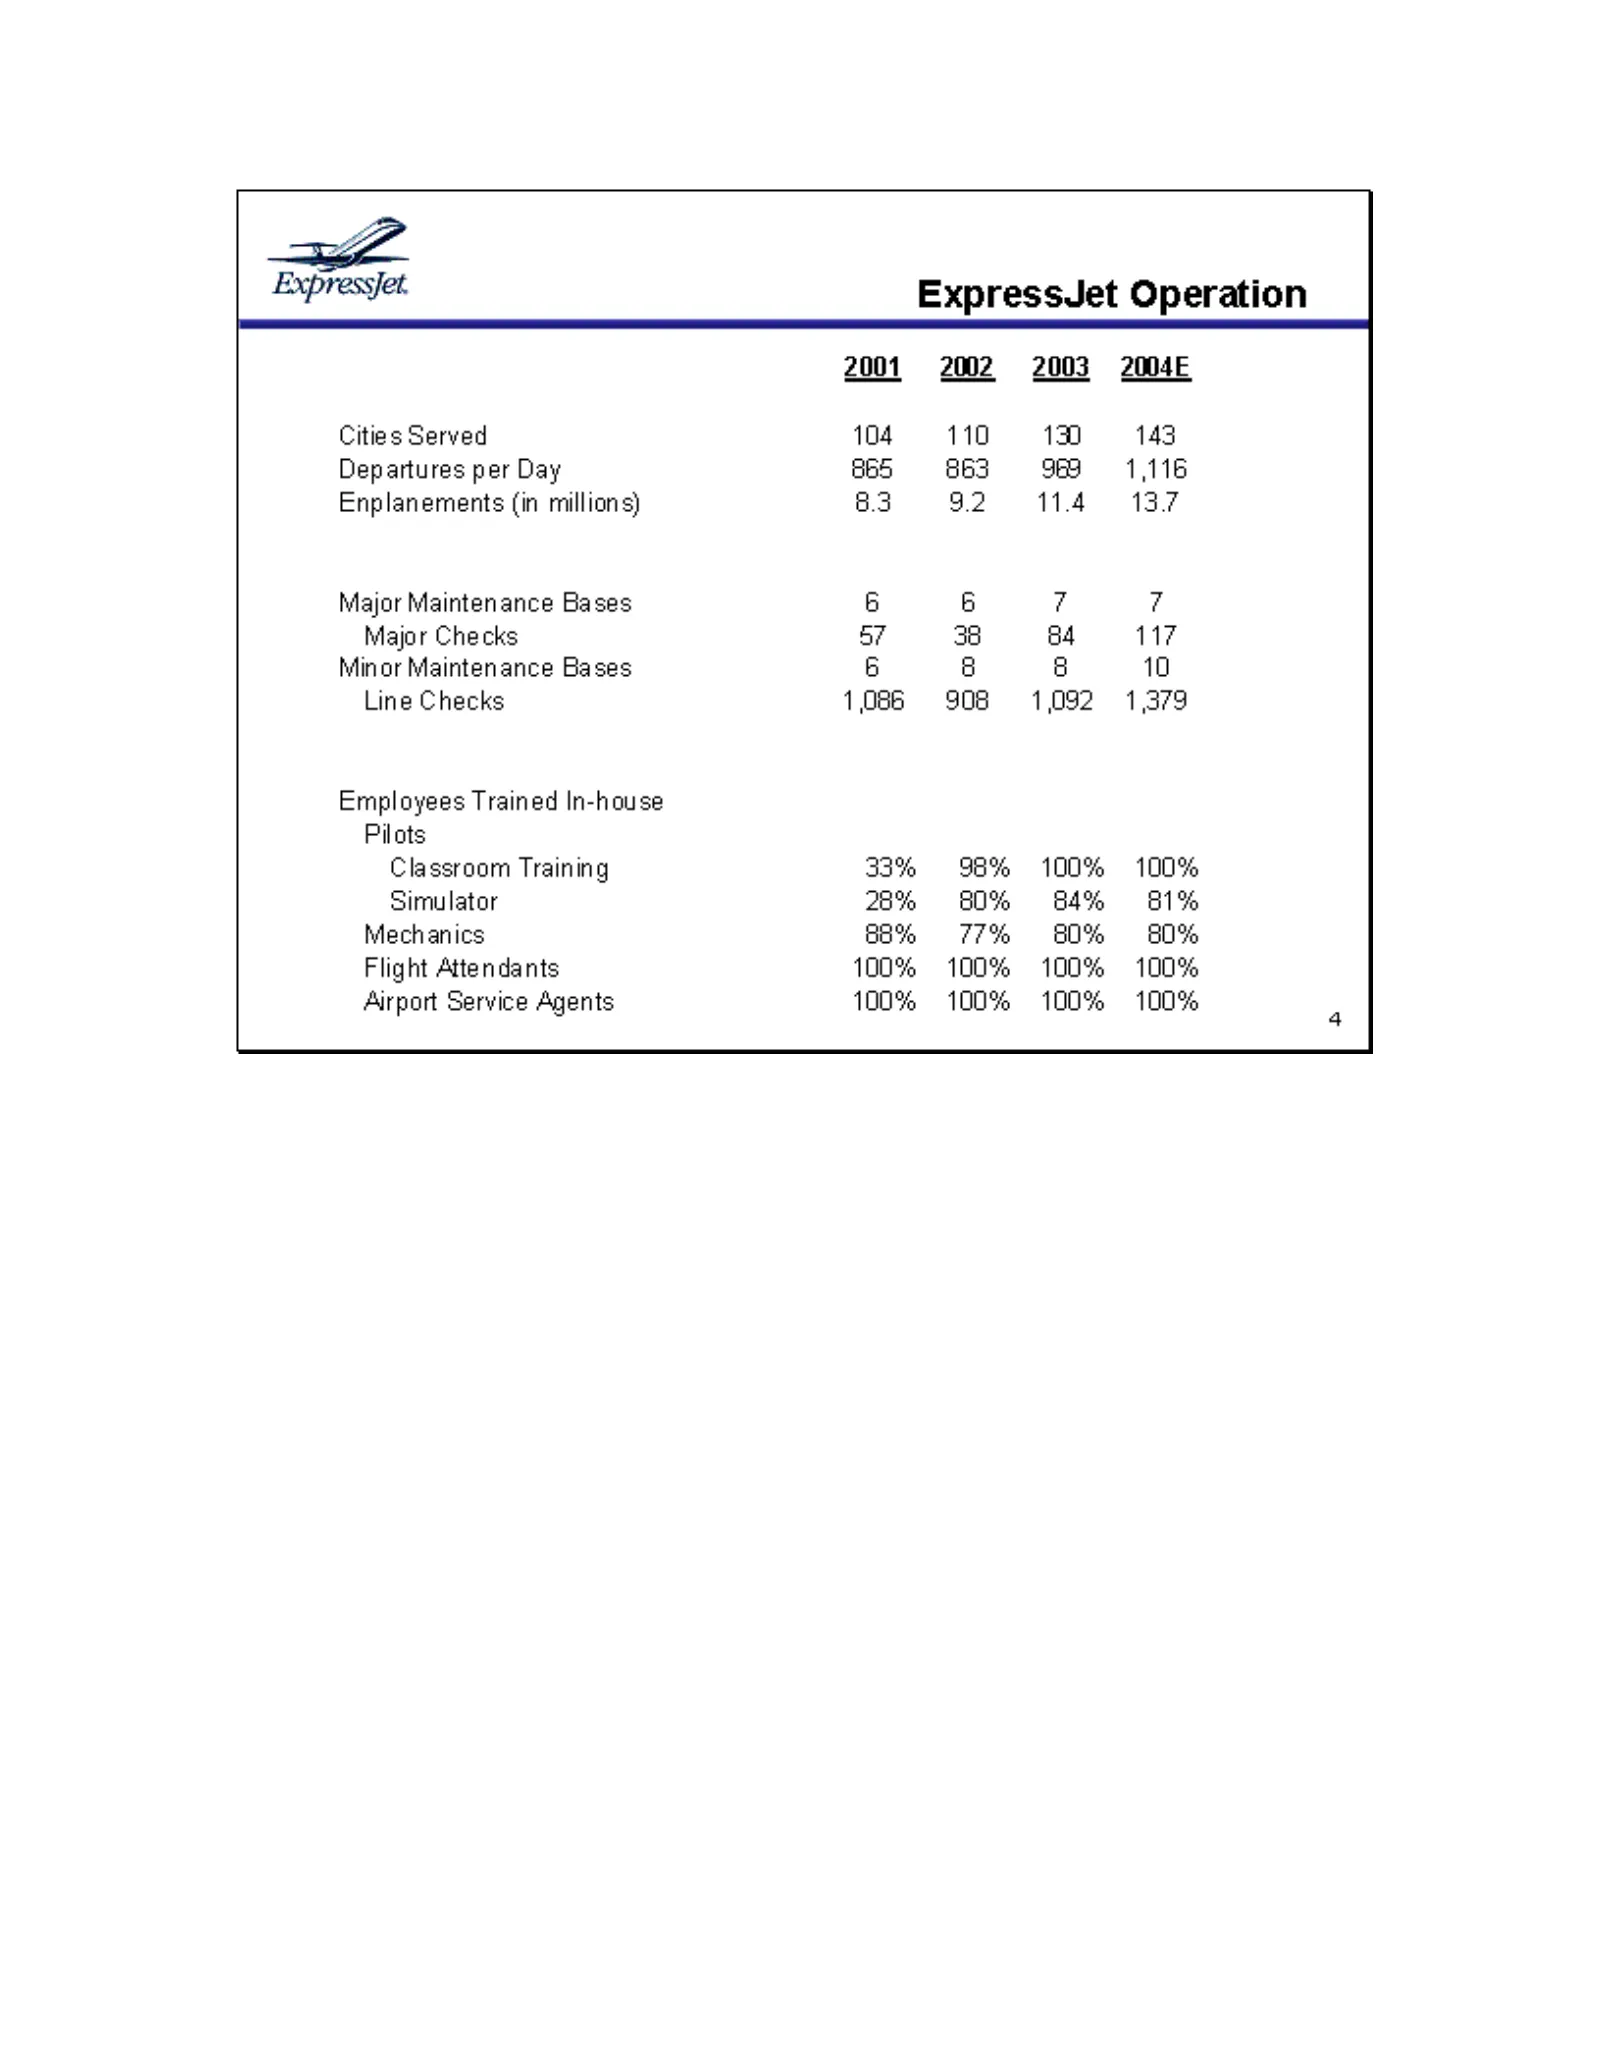
Slide 5: ExpressJet Operation
Expressjet ExpressJet Operation 001 2002 2003 2004E Cities Served 104 110 130 143 Departures per Day 865 863 969 =61,116 Enplanements (in rnillions) 8.3 9.2 14 137 Major Maintenance Bases 6 6 rd rd Major Checks 57 38 84 117 Minor Maintenance Bases 6 8 8 10 Line Checks 1086 908 1,092 1,379 Employees
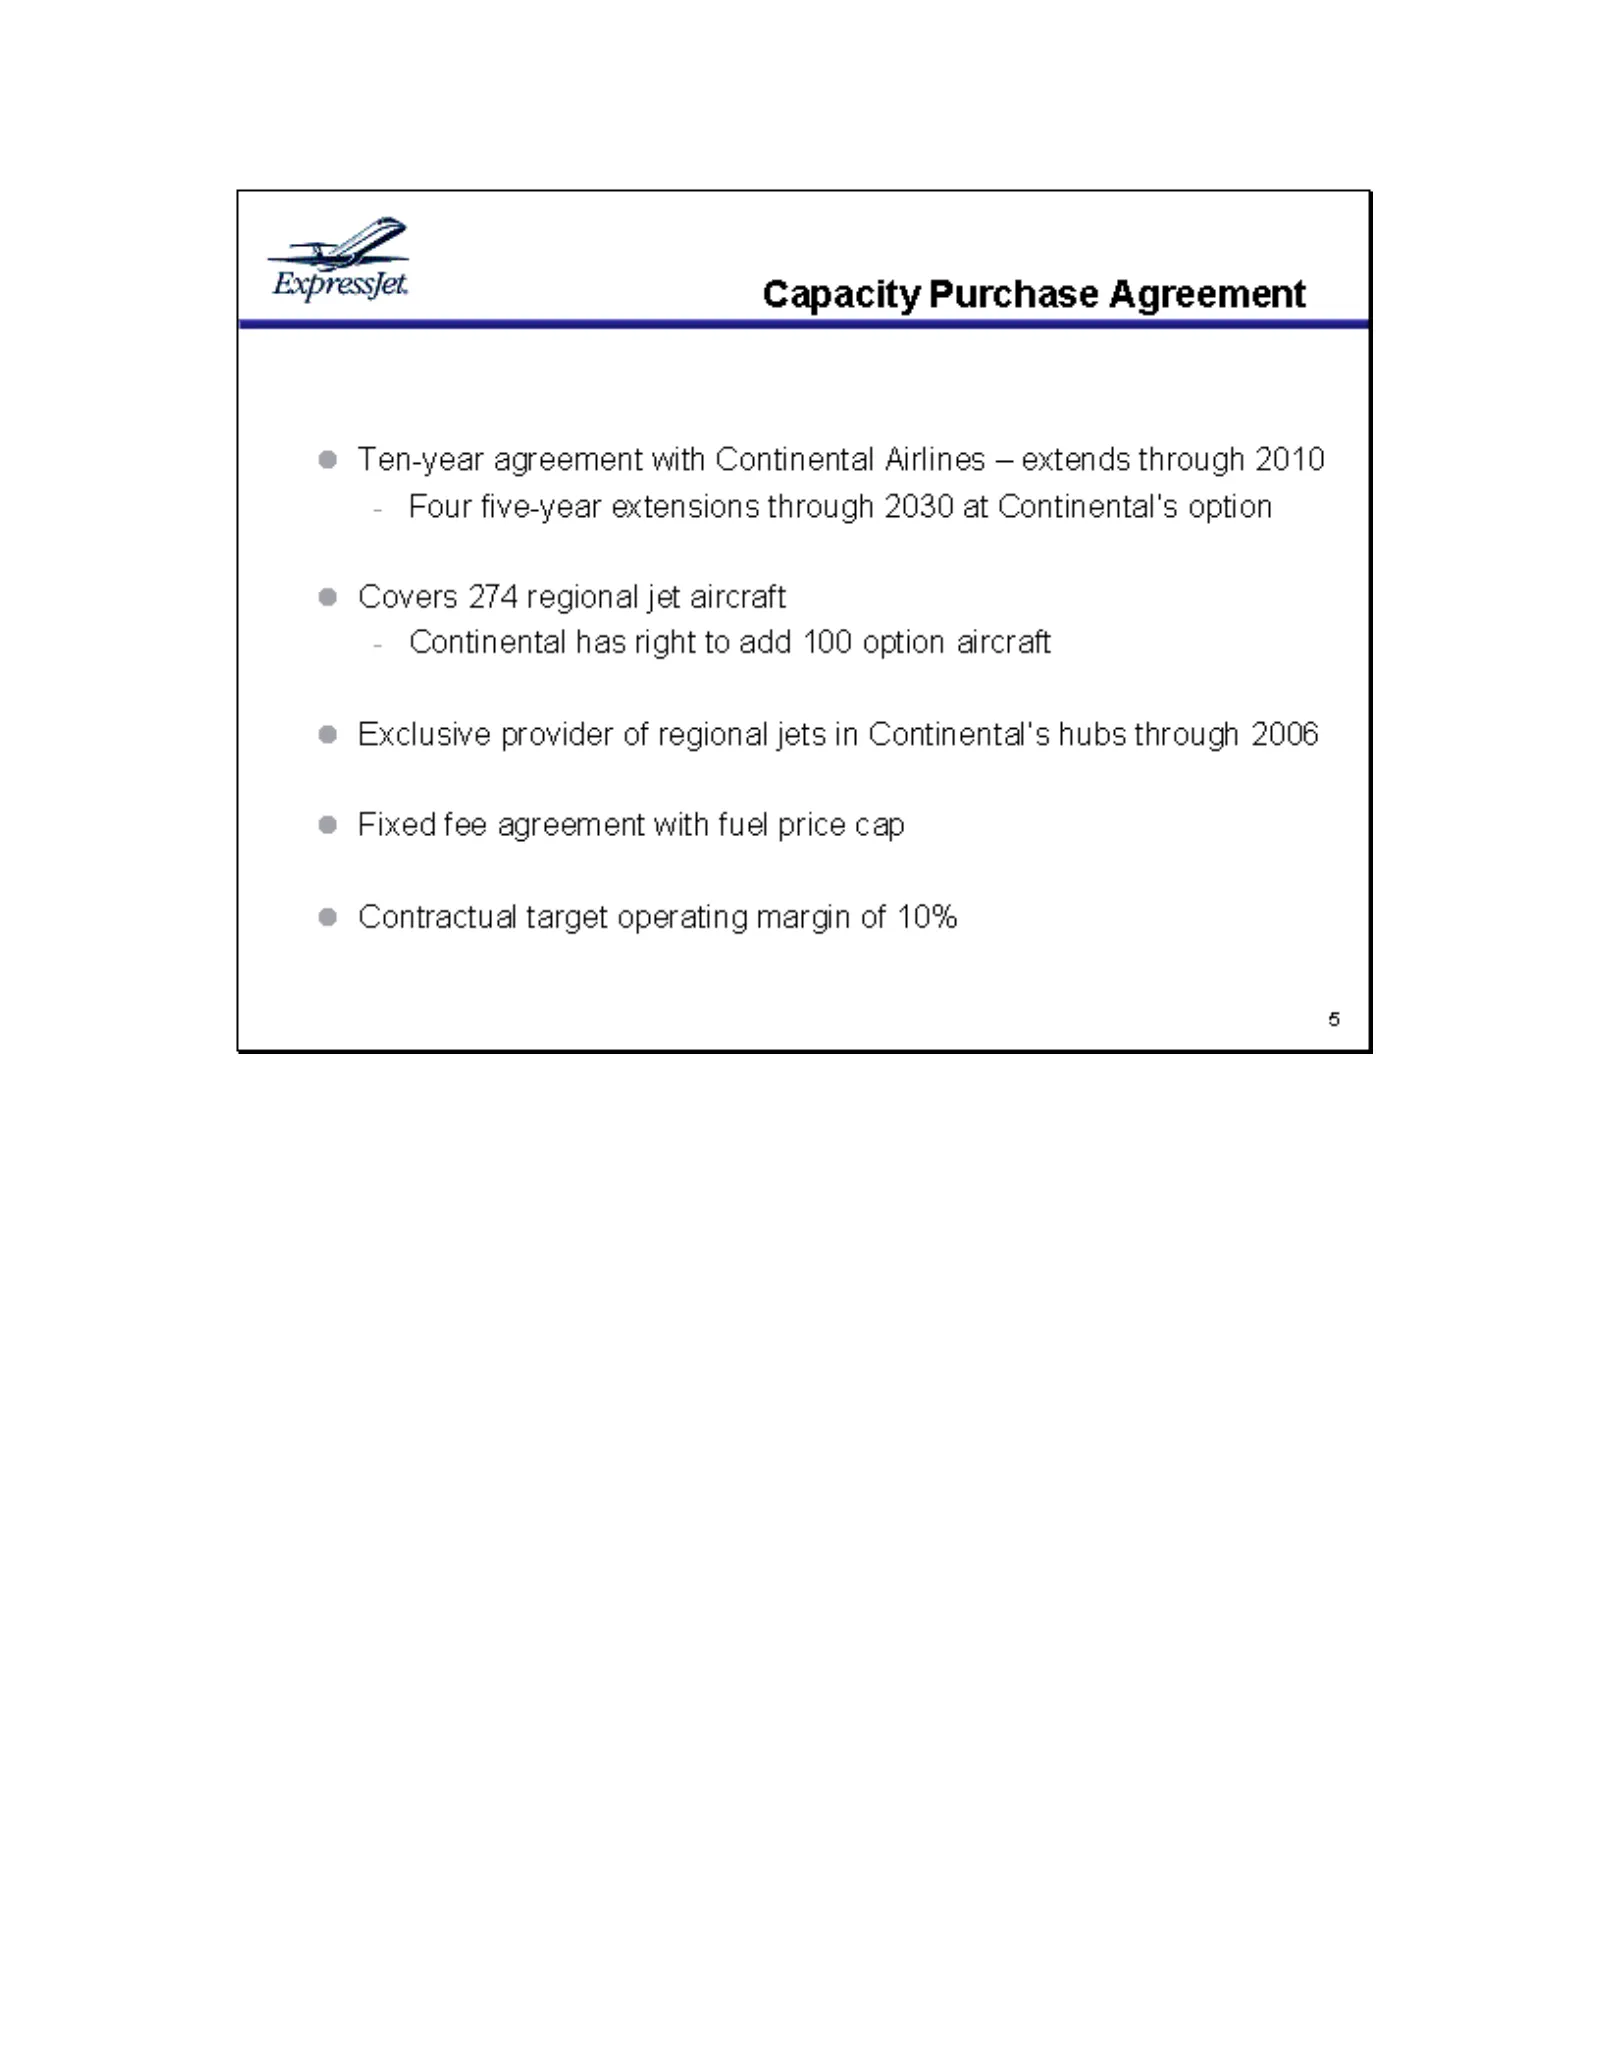
Slide 6: ExpressJet Capacity Purchase Agreement
Expressfet Capacity Purchase Agreement Ten-year agreement with Continental Airlines — extends through 2010 Four five-year extensions through 2030 at Continental's option Covers 274 regional jet aircraft Continental has right to add 100 option aircraft Exclusive provider of regional jets in Continent
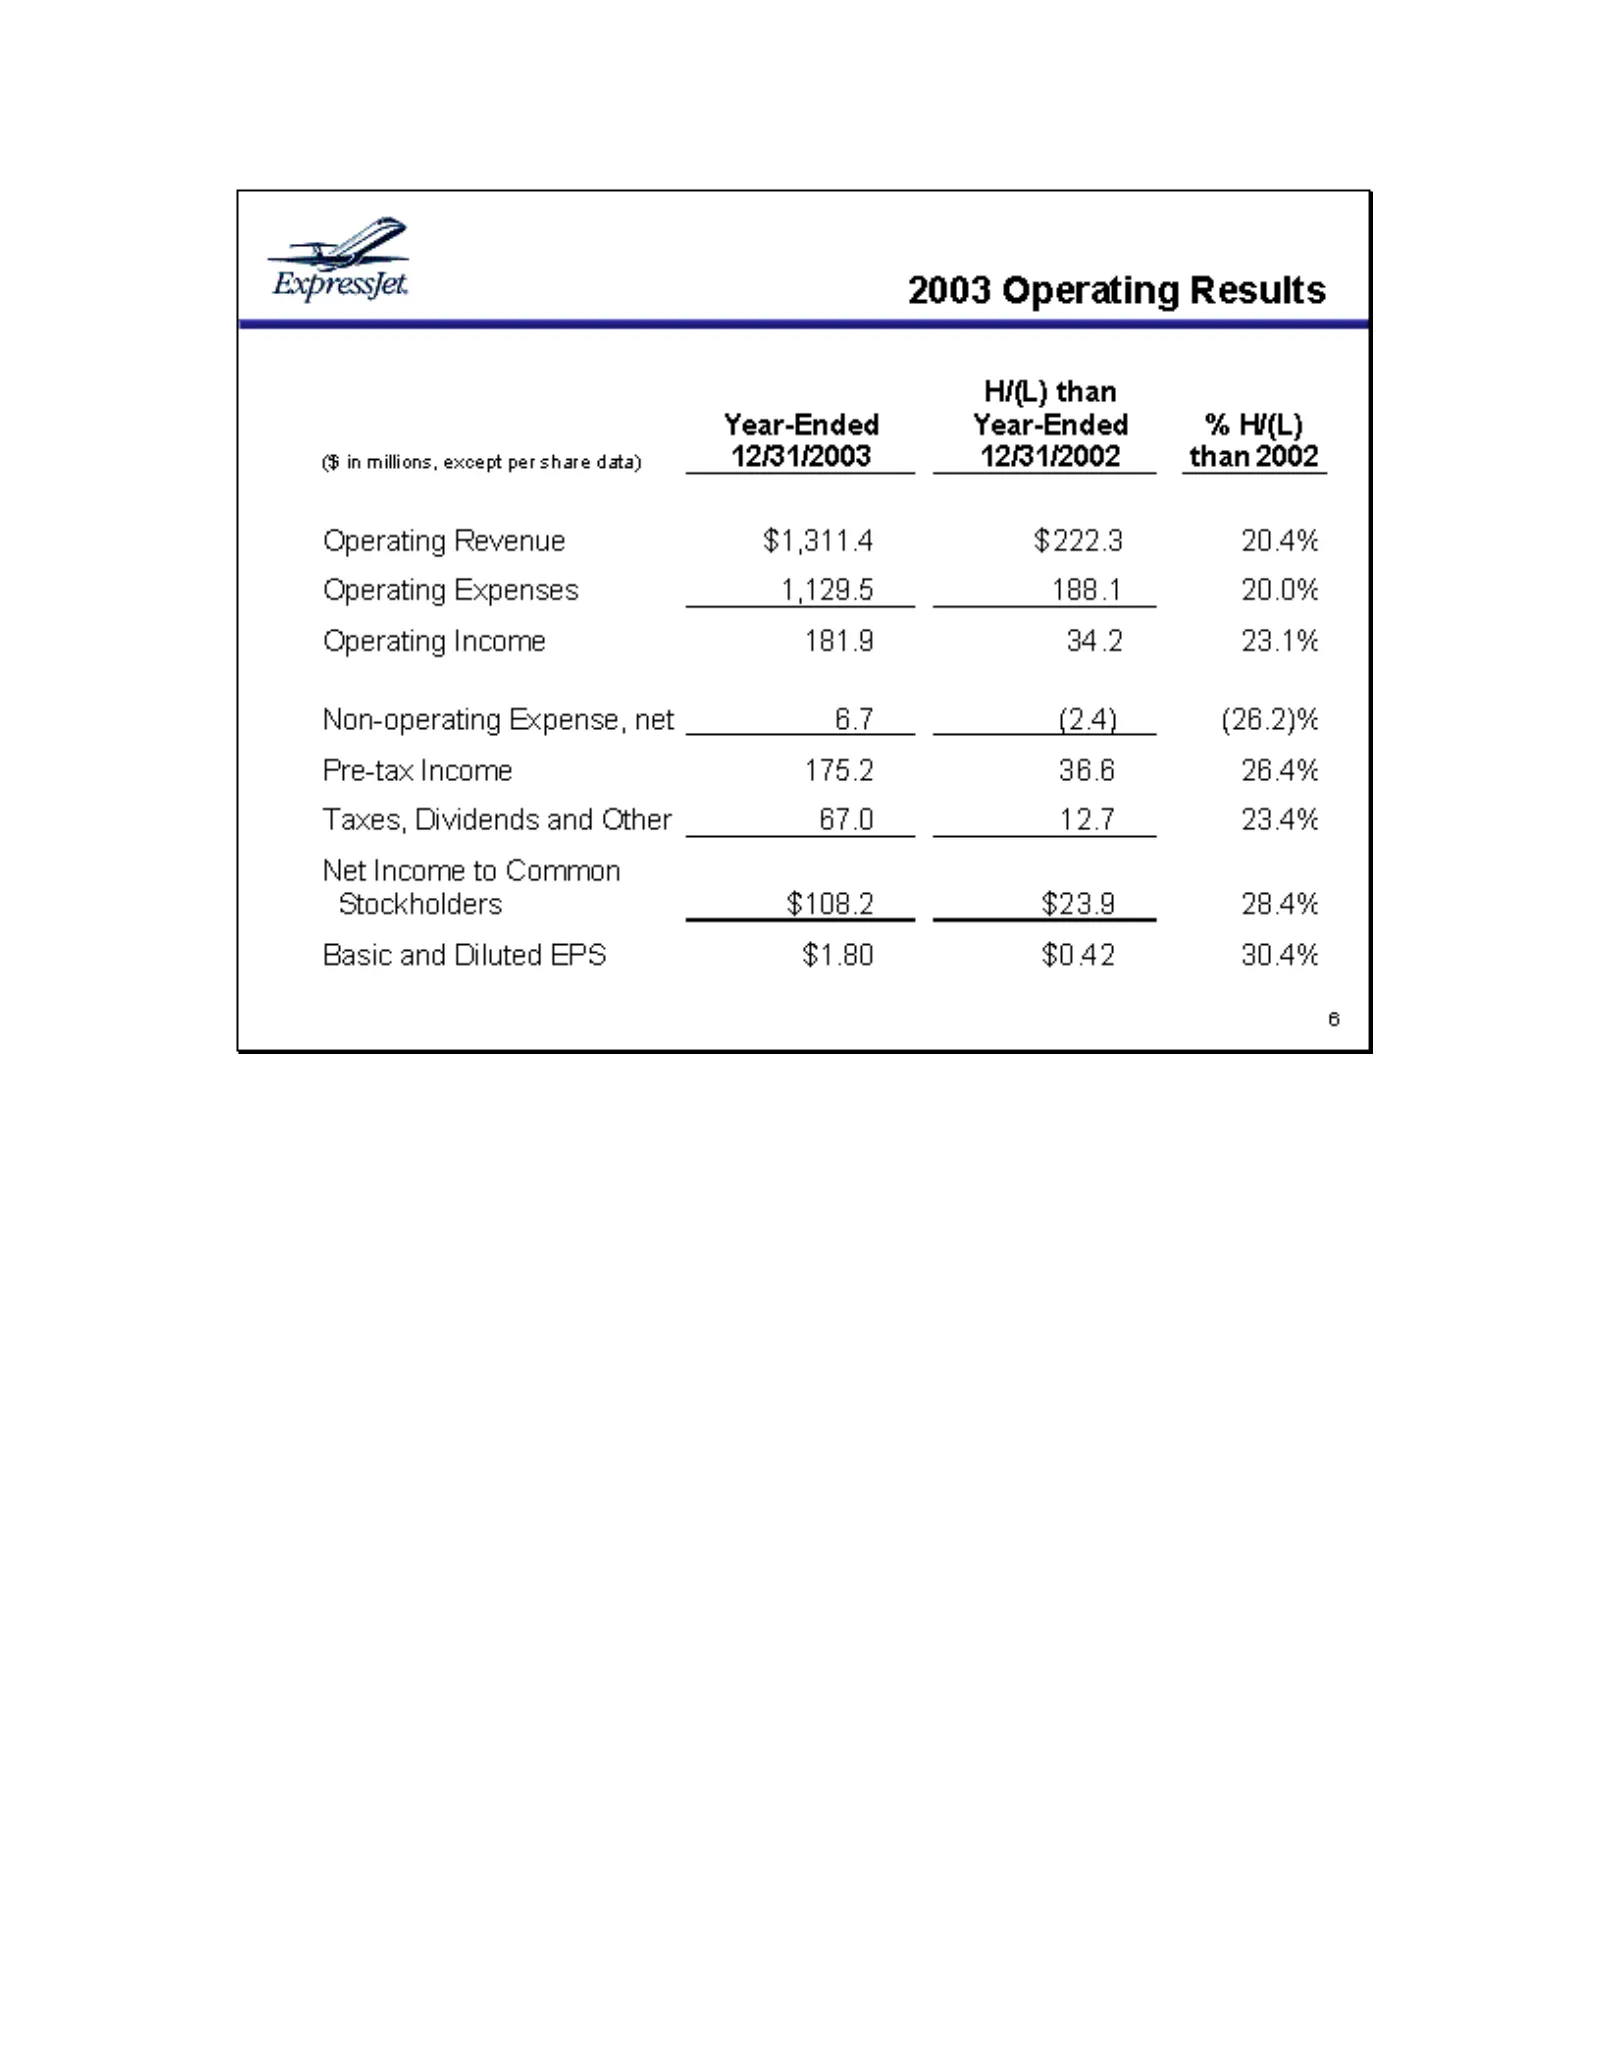
Slide 7: 2003 Operating Results
Expressfet. 2003 Operating Results Hi(L) than Year-Ended Year-Ended % Hi(L) (B in millions, except per share data) 1213142003 12/31/2002 than 2002 Operating Revenue $1,3114 $222.3 20.4% Operating Expenses 1,129.5 188.1 20.0% Operating Income 181.9 34.2 23.1% Non-operating Expense, net G7 (24) (26.2)
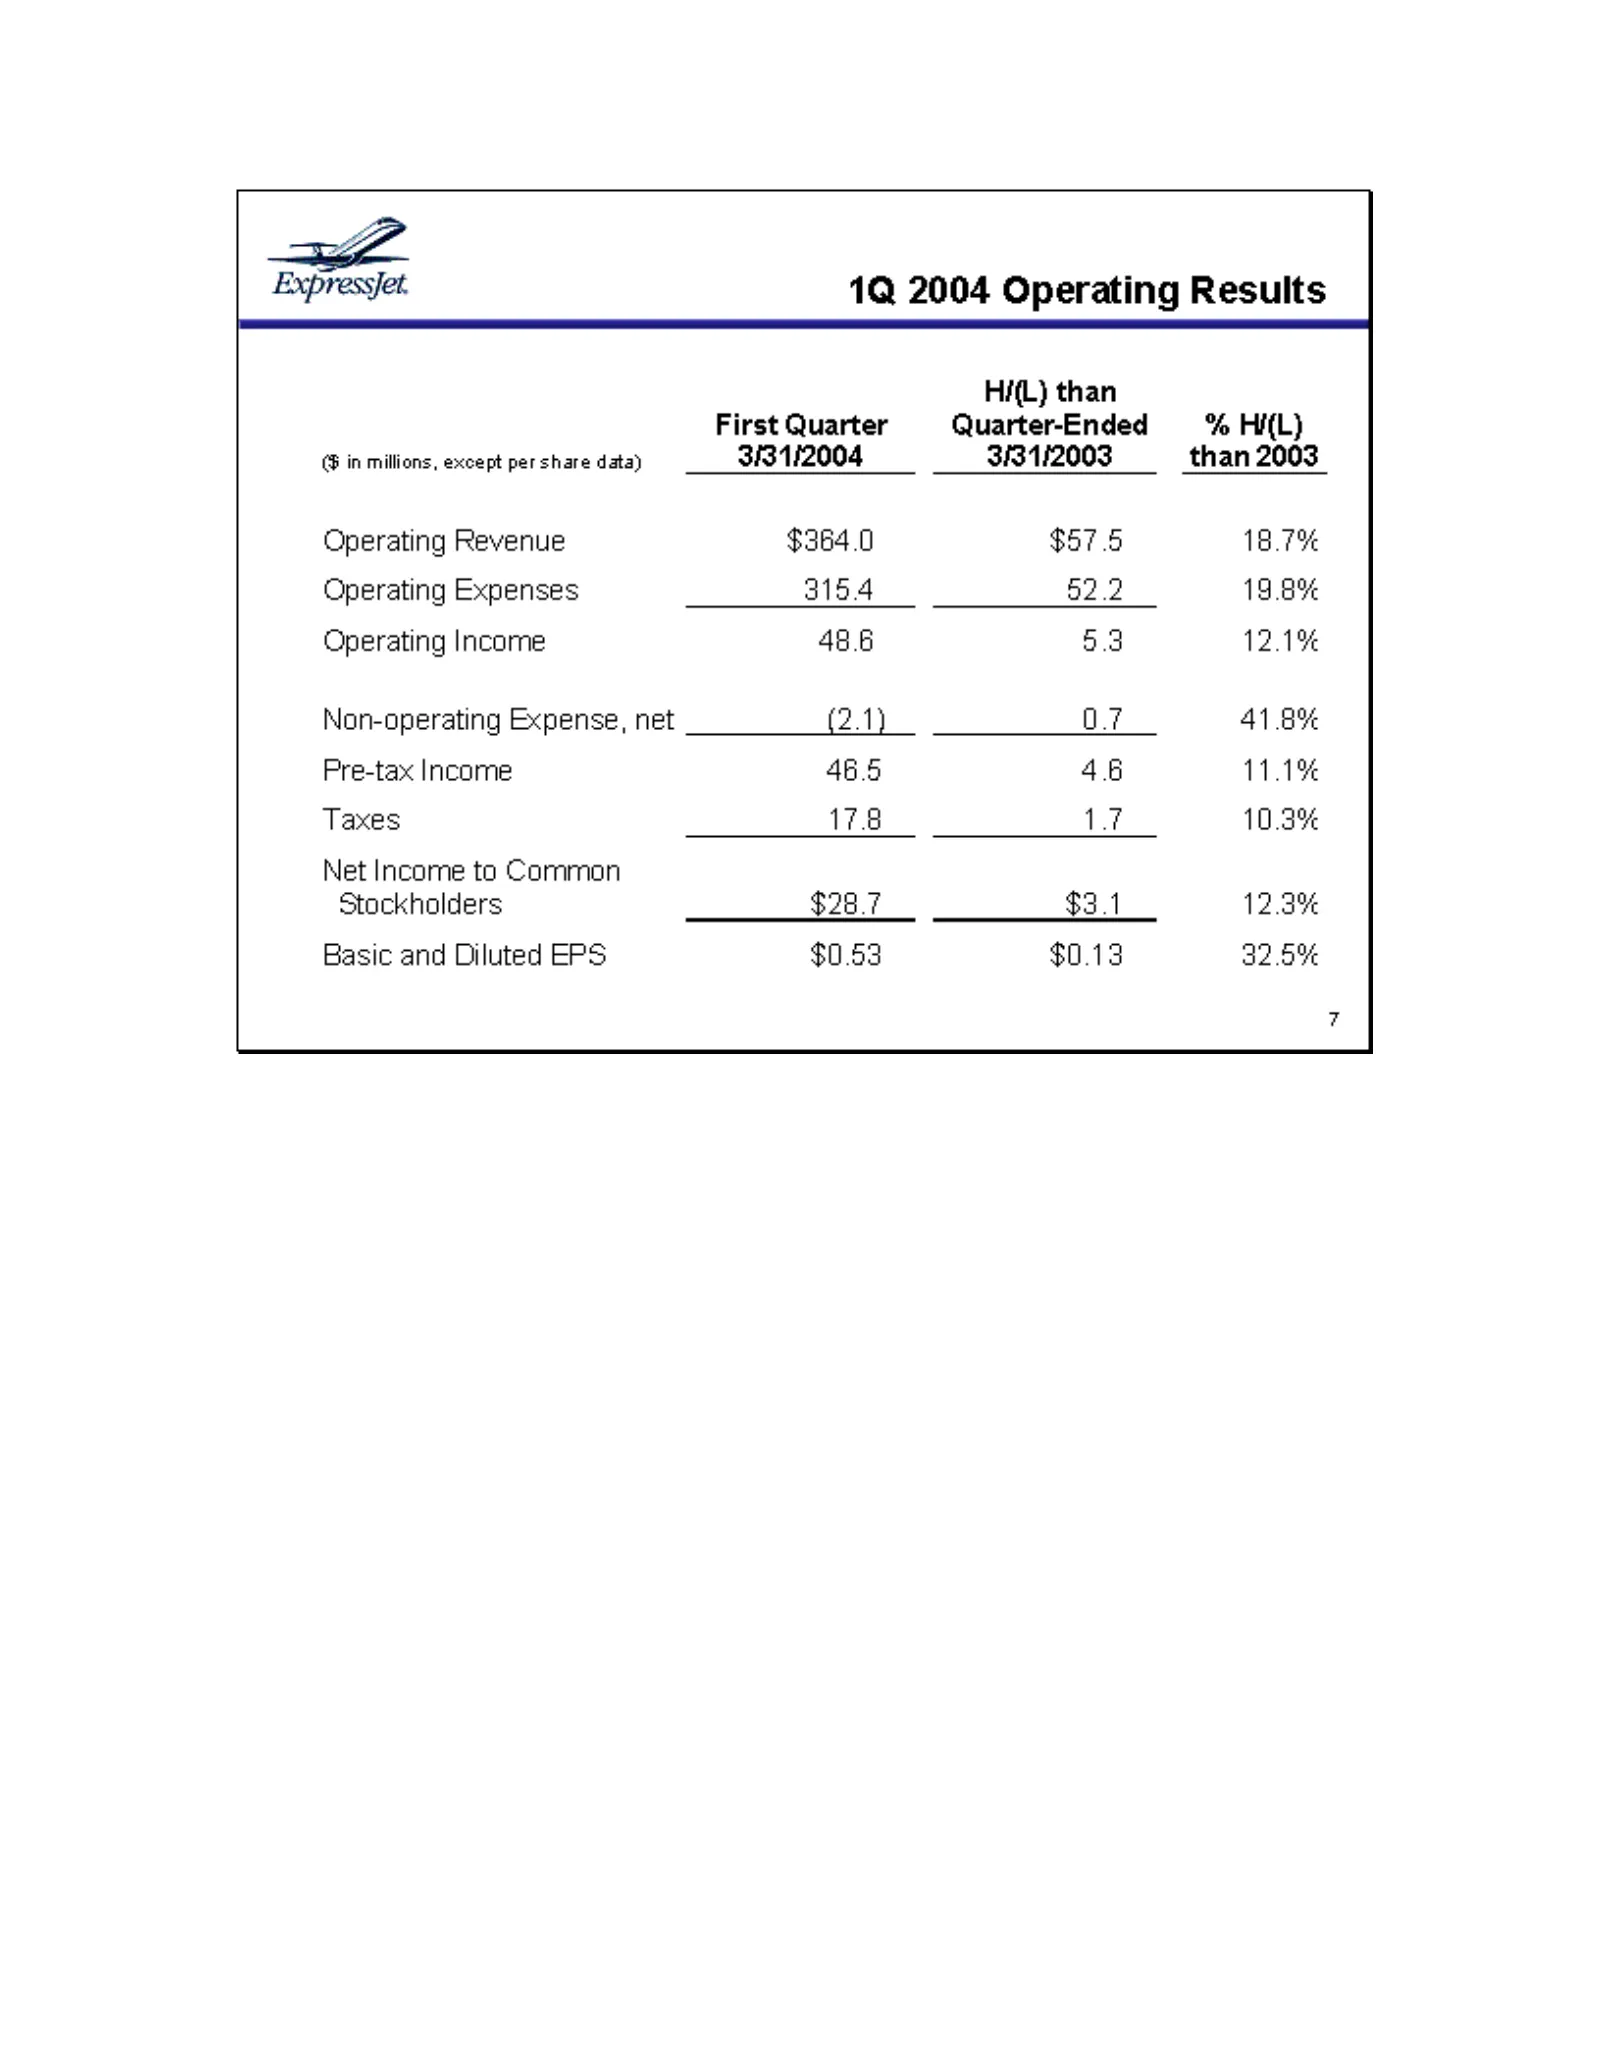
Slide 8: 1Q 2004 Operating Results
Expressjet 1Q 2004 Operating Results Hi(L) than First Quarter Quarter-Ended % Hi(L) (B in millions, except per share data) 3#3112004 3/31/2003 than 2003 Operating Revenue $364.0 $57.5 18.7% Operating Expenses 3154 52.2 19.8% Operating Income 48.6 5.3 12.1% Non-operating Expense, net (2.1) o7 41.8% P
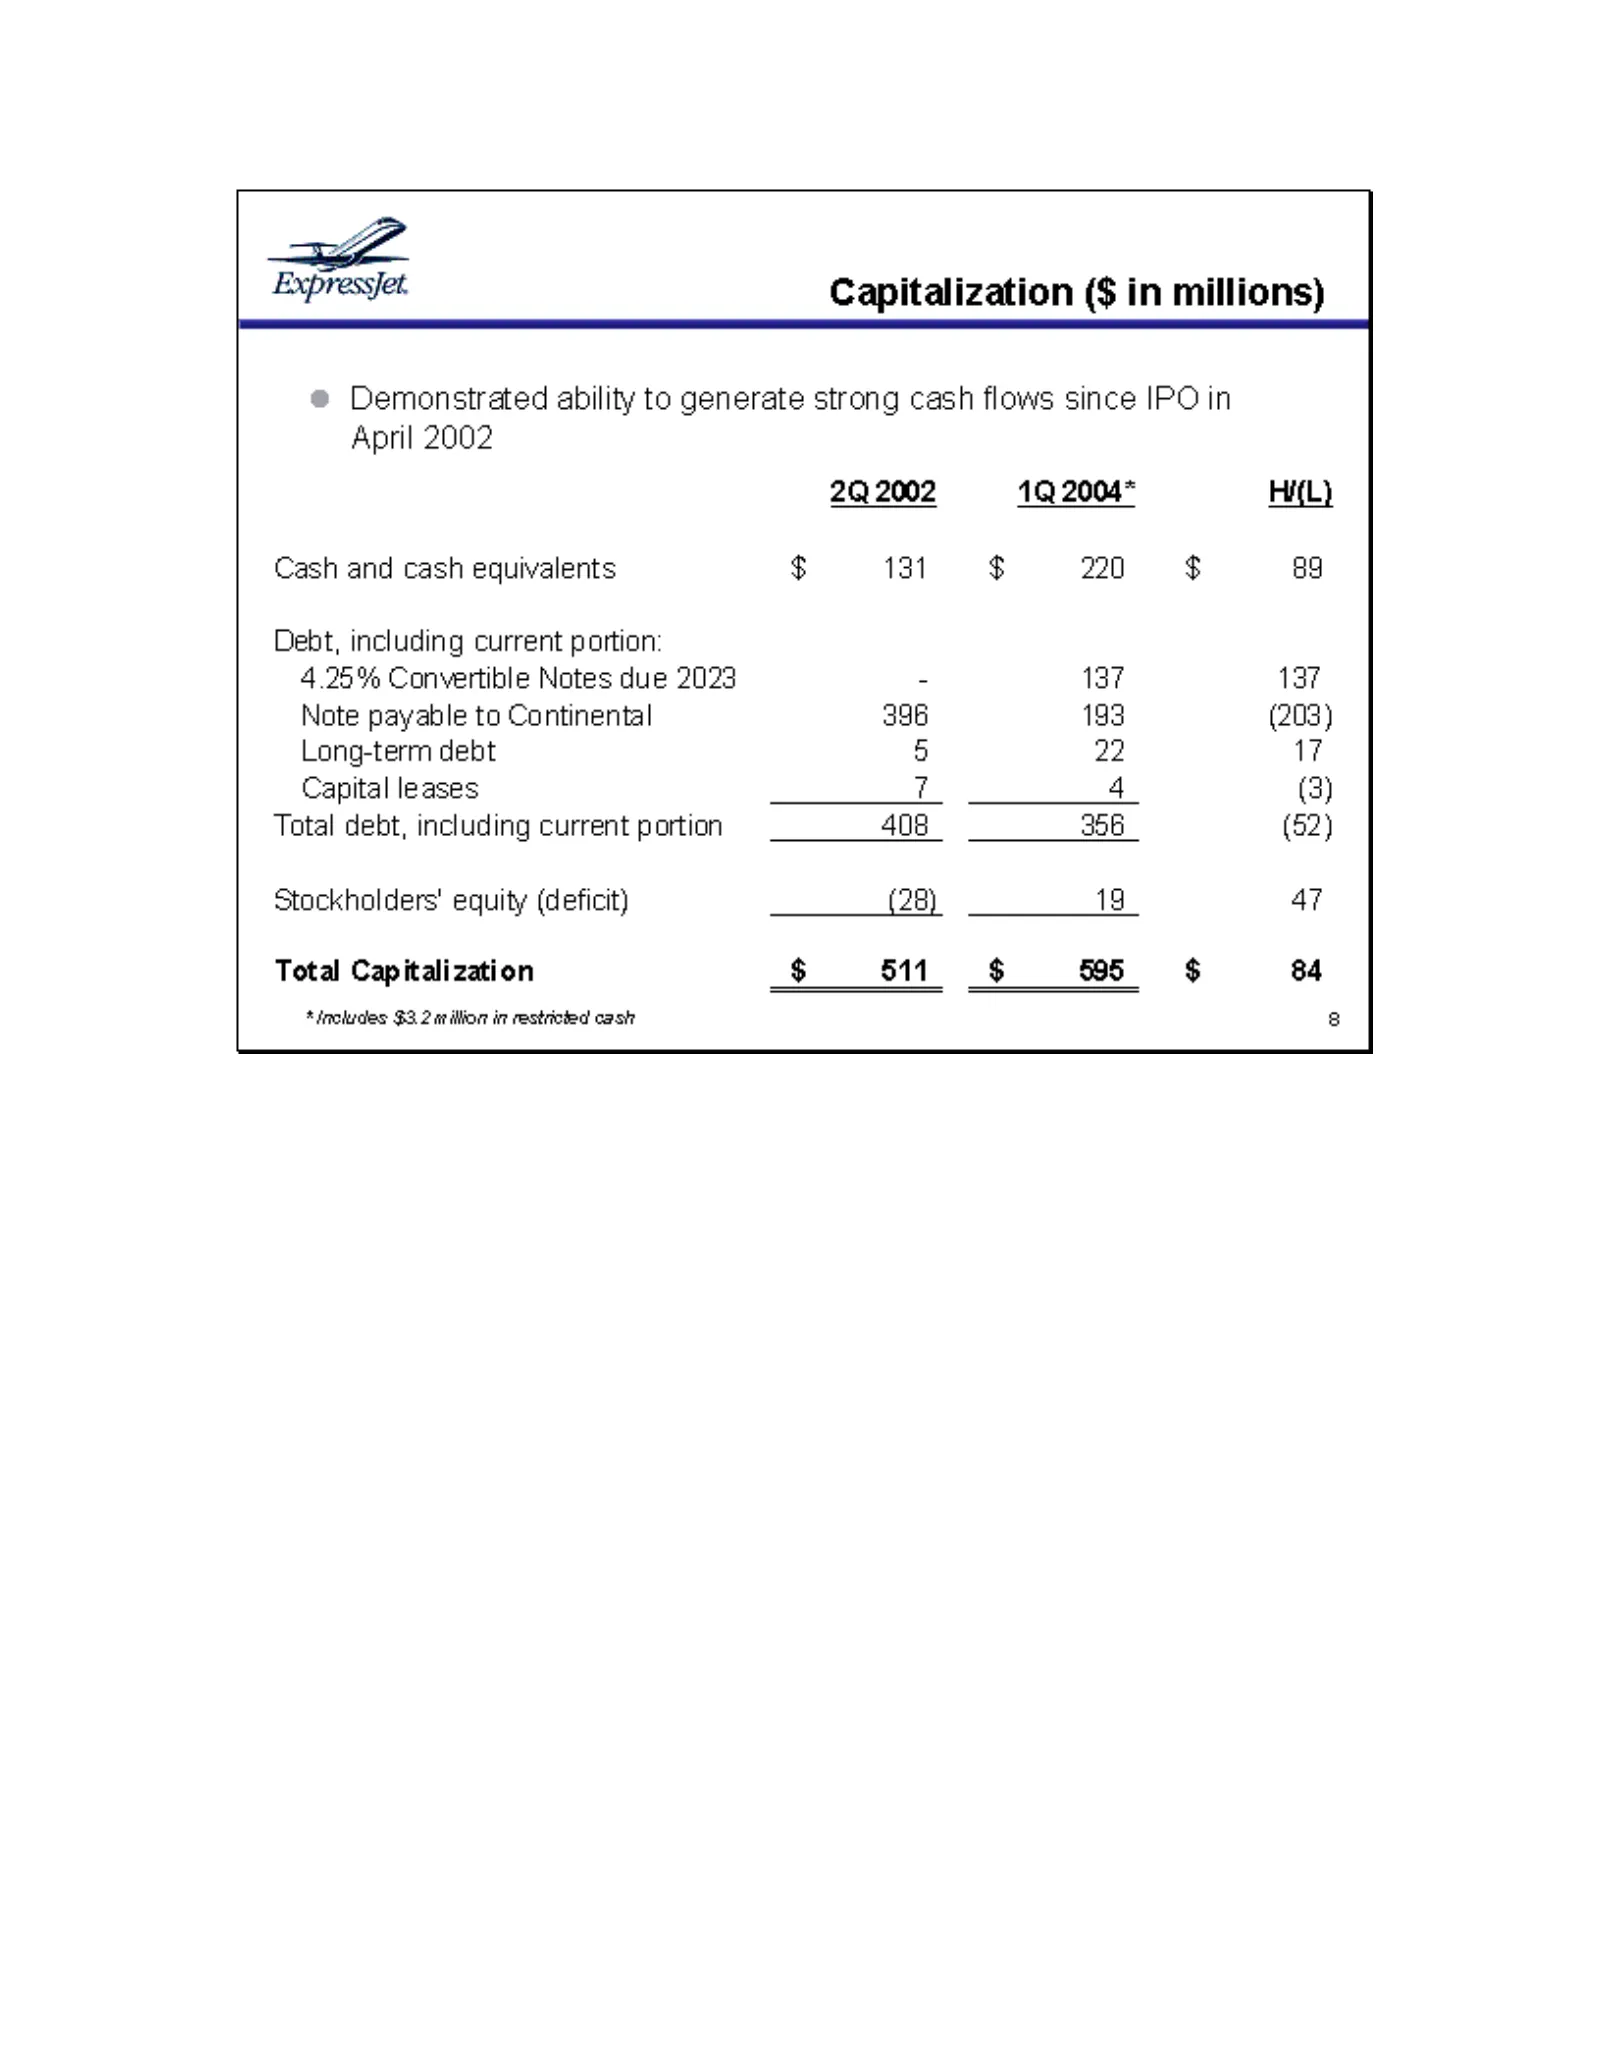
Slide 9: Capitalization ($ in millions)
Expressfet. Capitalization ($ in millions) Demonstrated ability to generate strong cash flows since IPO in April 2002 2Q 2002 1Q 2004* Hi(L) Cash and cash equivalents $ 131 $ 220 $ 8g Debt, including current partion: 4.25% Convertible Notes due 2023 - 137 137 Note payable to Continental 396 193 (203
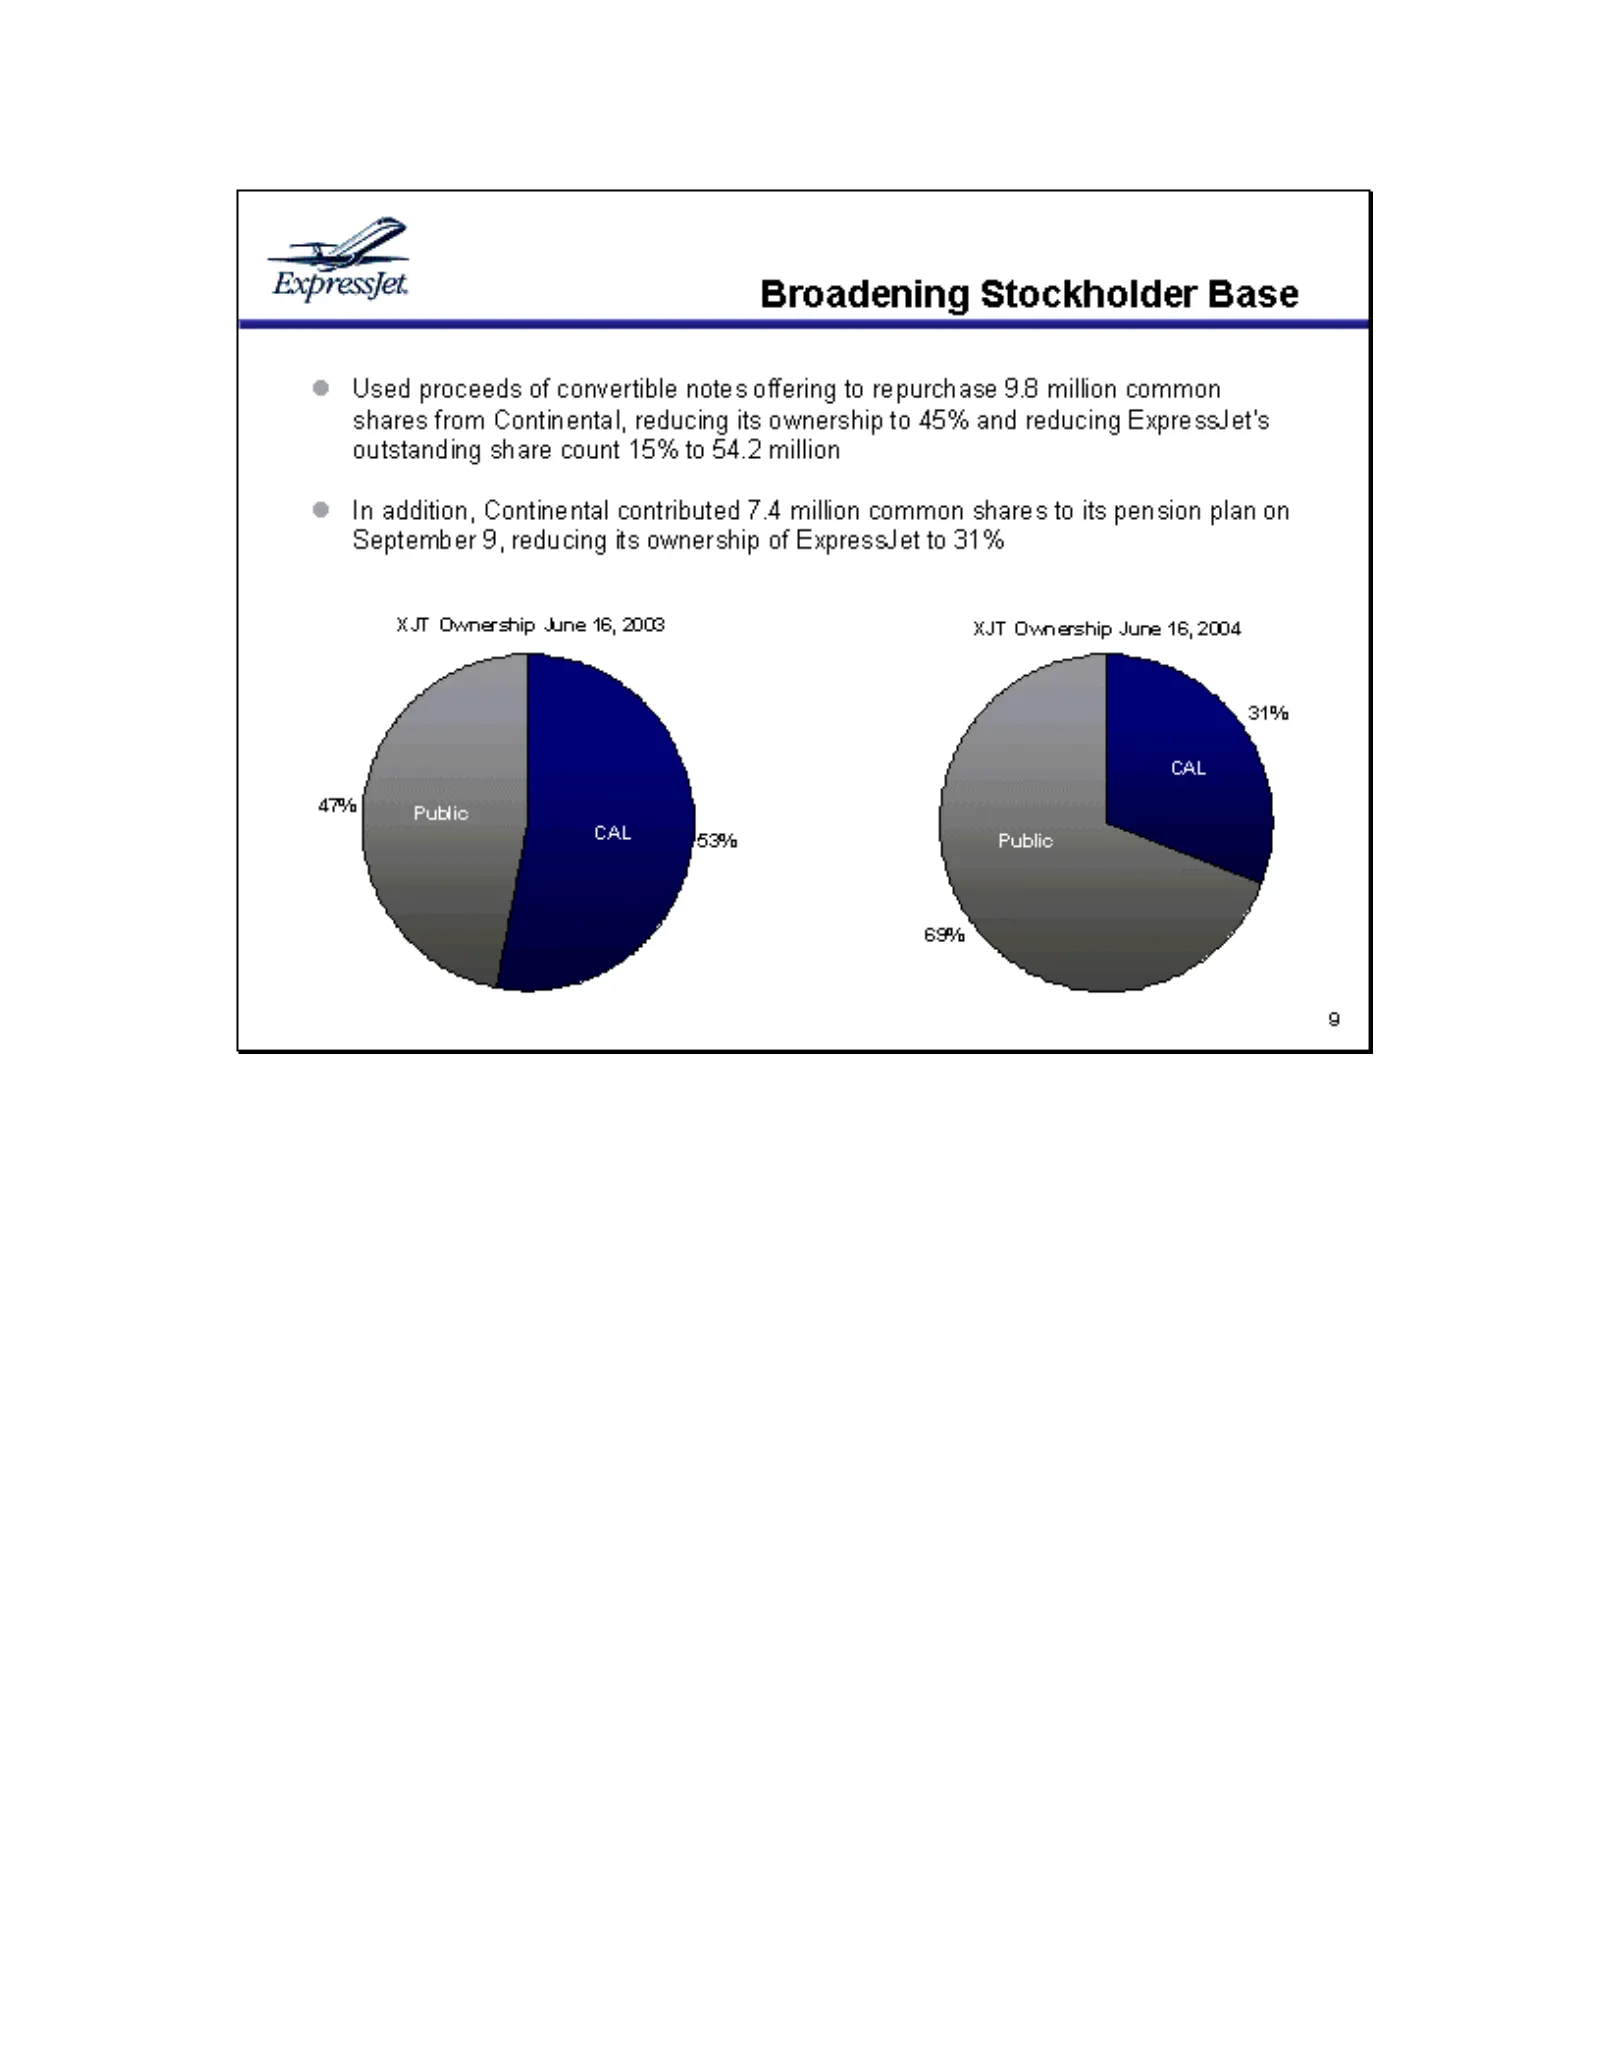
Slide 10: Broadening Stockholder Base
Expressjet Broadening Stockholder Base © Used proceeds of convertible notes offering to repurchase 9.8 million cormmon shares from Continental, reducing its ownership to 45% and reducing ExpressJet's outstanding share count 15% to 54.2 million © In addition, Continental contributed 7.4 million cormm
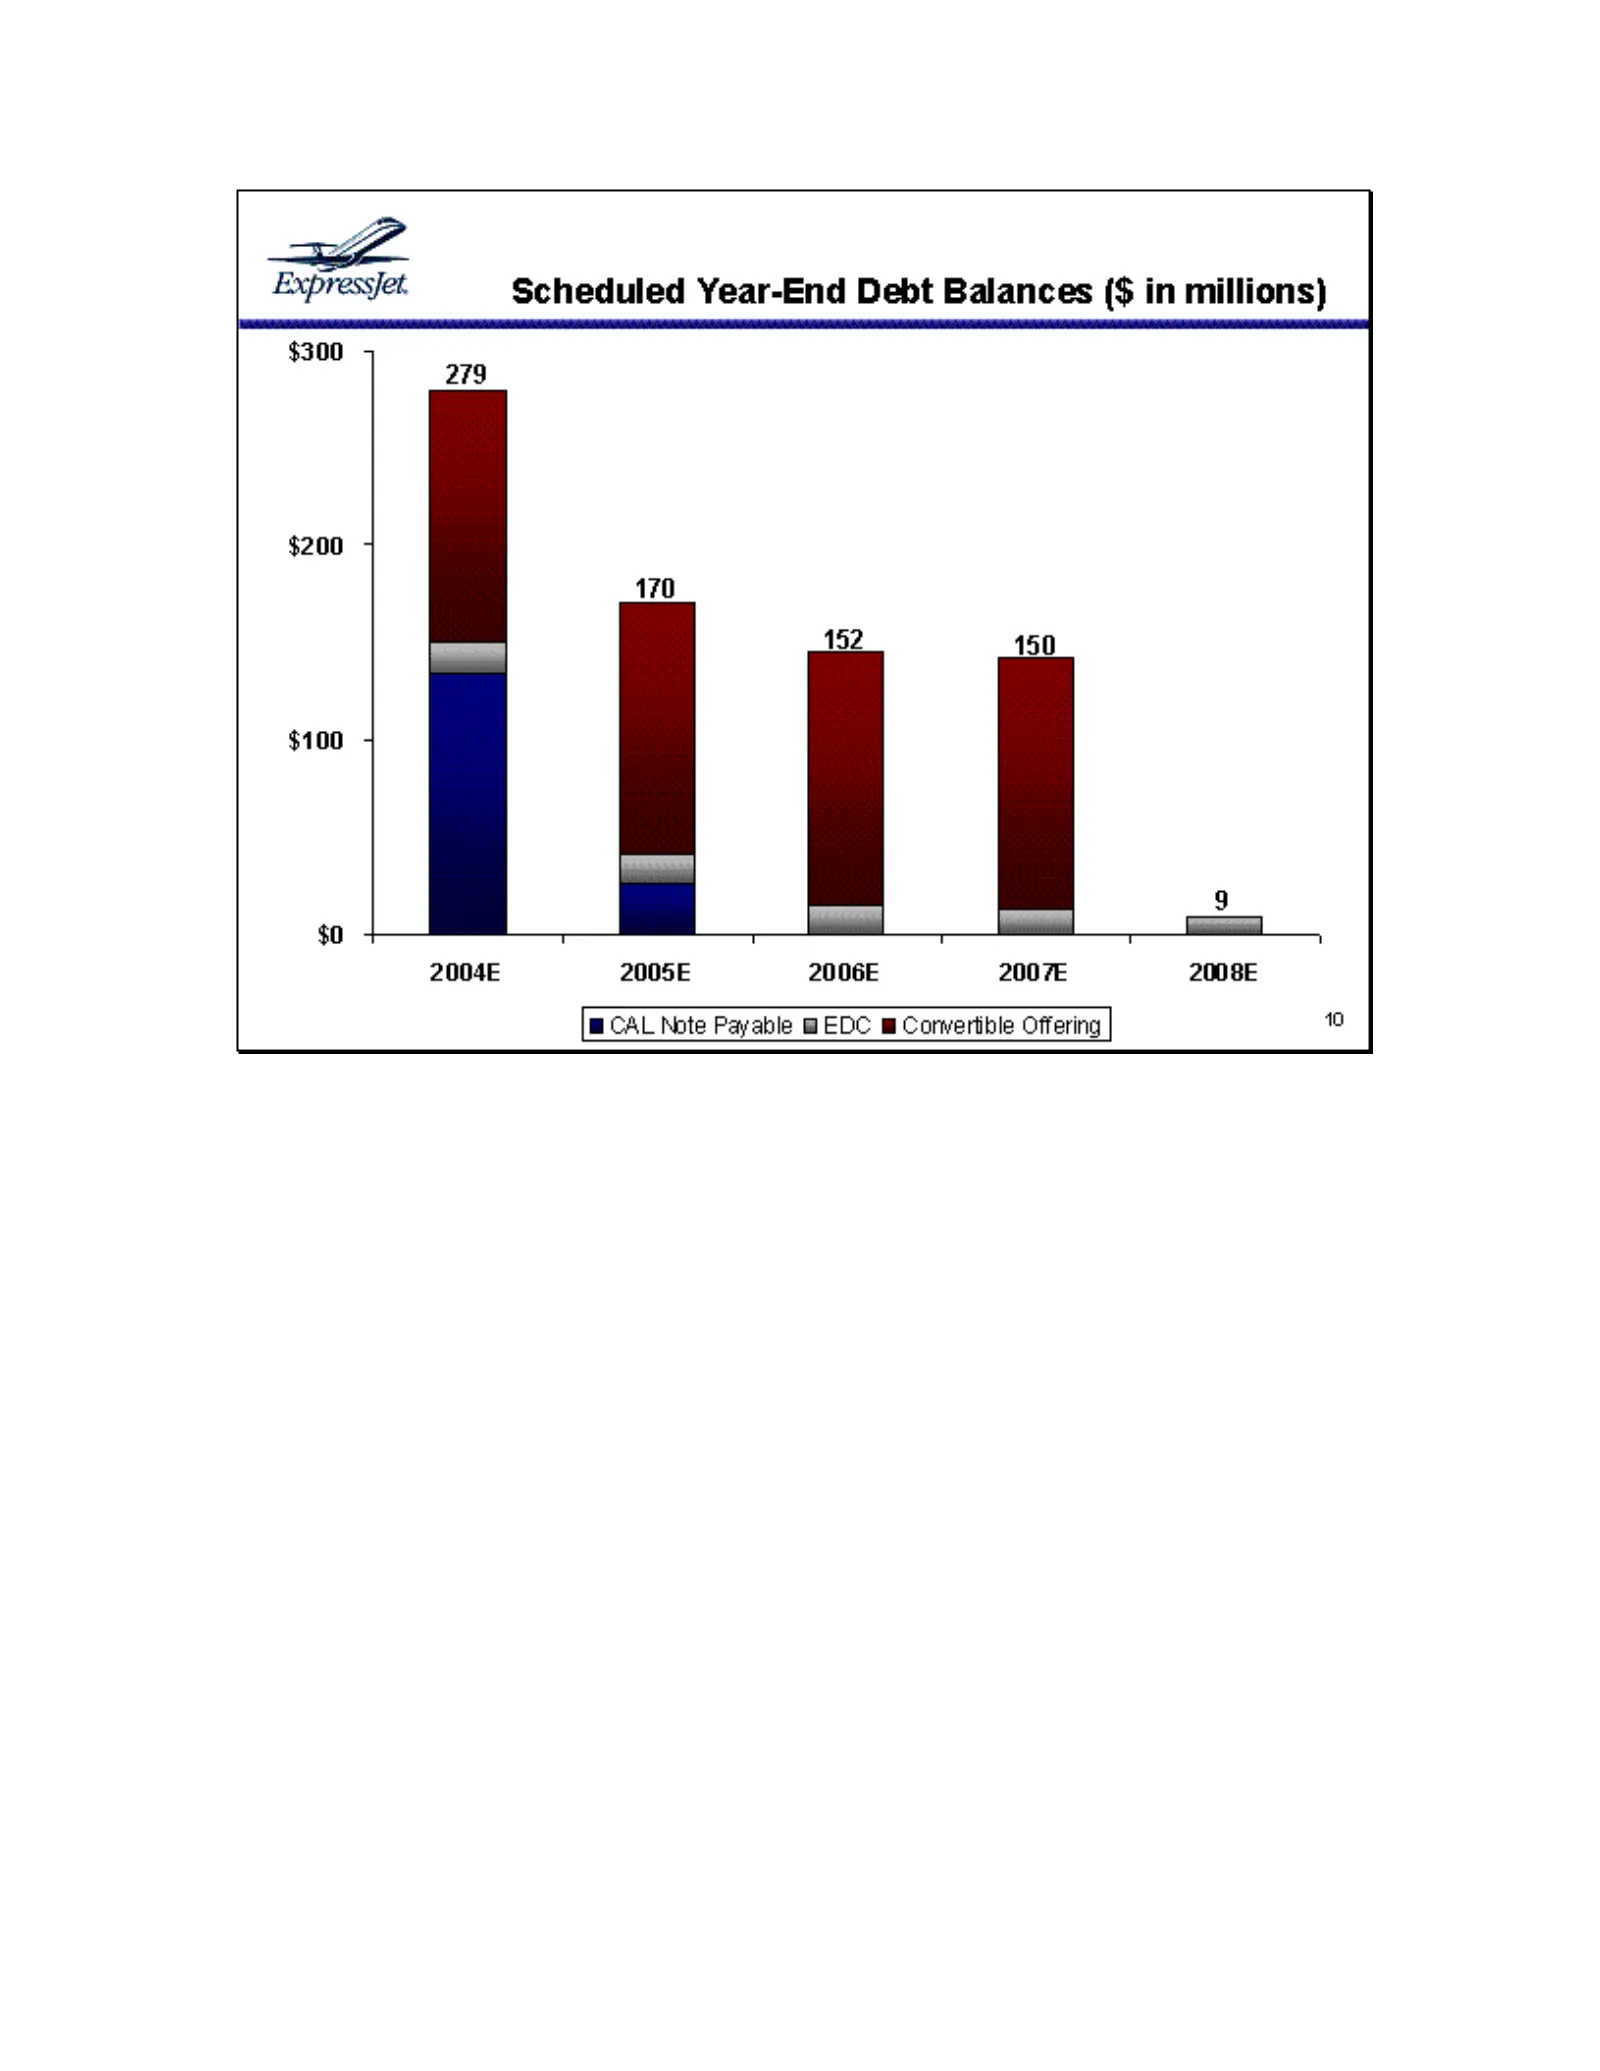
Slide 11: Scheduled Year-End Debt Balances
Expressjet. $300 4 $200 + $100 + $0 Scheduled Year-End Debt Balances ($ in millions) 279 170 152 150 . . 9 T T T T ere 2004E 2005E 2006E 2007E [m CAL Note Payable @EDC m Corvertible Offering | 2008E 410
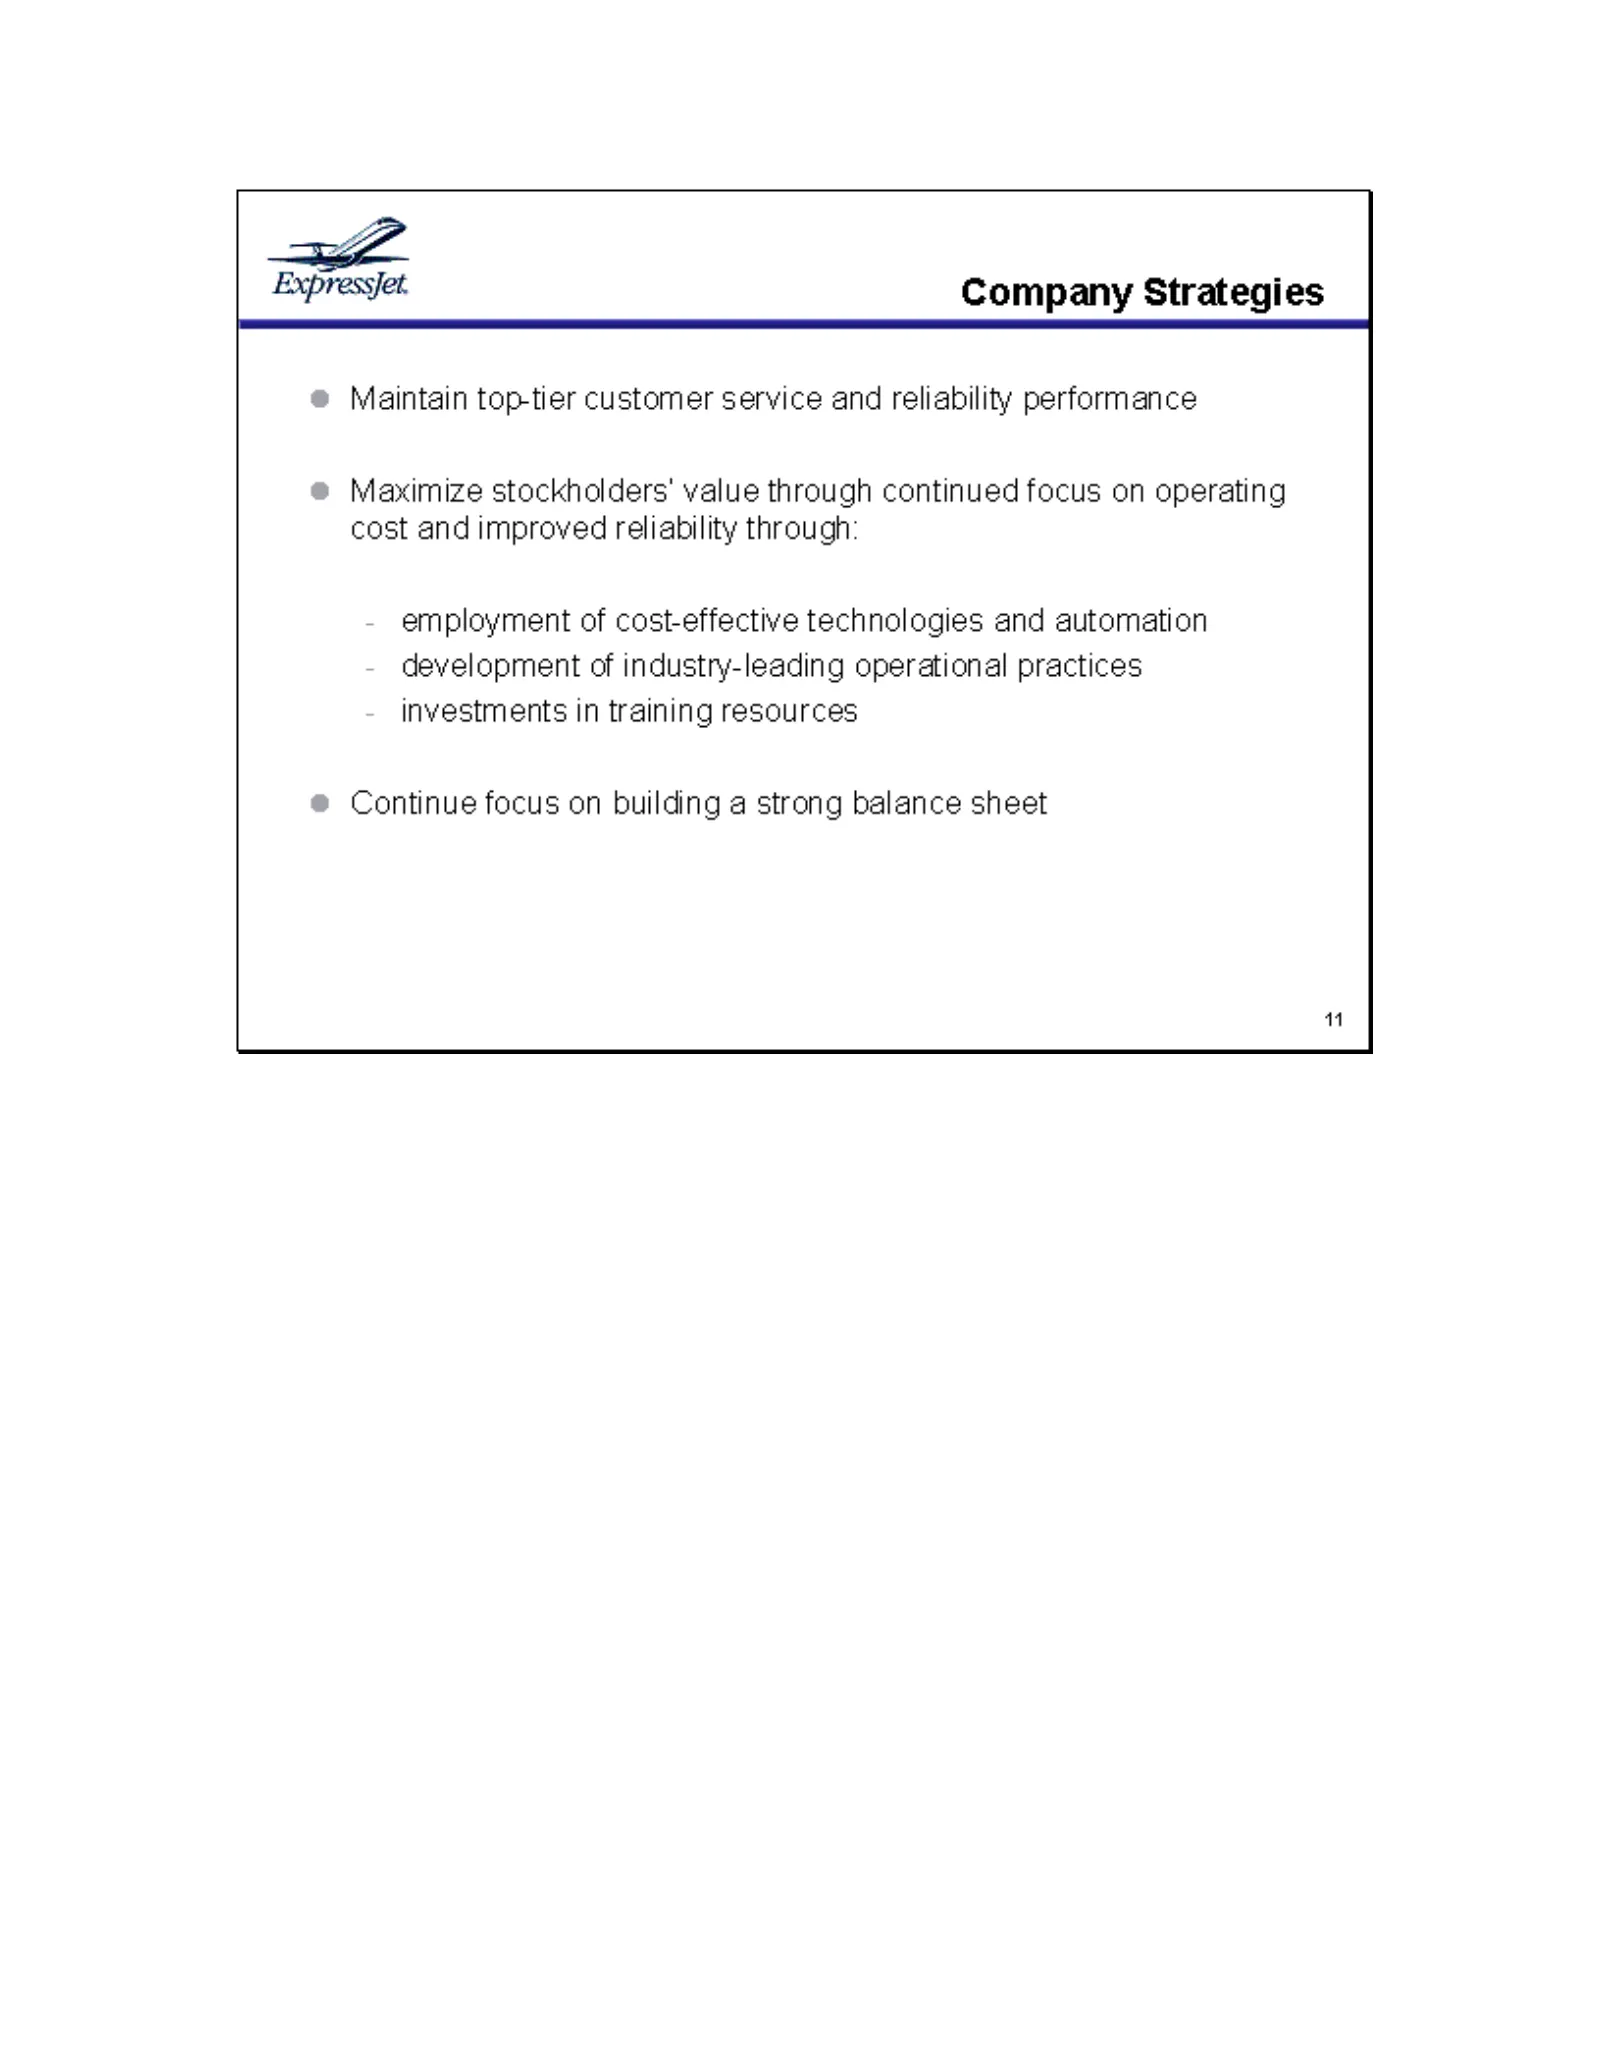
Slide 12: ExpressJet Company Strategies
Expressjet Company Strategies ® Maintain top-tier customer service and reliability performance ® Maximize stockholders’ value through continued focus on operating cost and improved reliability through: employment of cost-effective technologies and automation development of industry-leading operation
Source: SEC EDGAR · 8-K filed Jun 16, 2004
More decks from Expressjet Holdings Inc
 Investor Presentation (June 2010)13 slides · Jun 8, 2010
 Credit Suisse 2008 Global Airlines Conference12 slides · Dec 3, 2008
 Credit Suisse Conference February 200813 slides · Feb 27, 2008
 Raymond James Growth Airline Conference (February 2007)13 slides · Feb 1, 2007
 Smith Barney Citigroup 2004 Transportation Conference12 slides · Nov 9, 2004
 Shareholder Meeting (May 2004)12 slides · May 5, 2004