COPT Defense Properties · NYSE:CDP
COPT Defense Properties — Nareit REITworld: 2026 Investor Conference
35 slides from COPT Defense Properties's conference presentation, November 2026
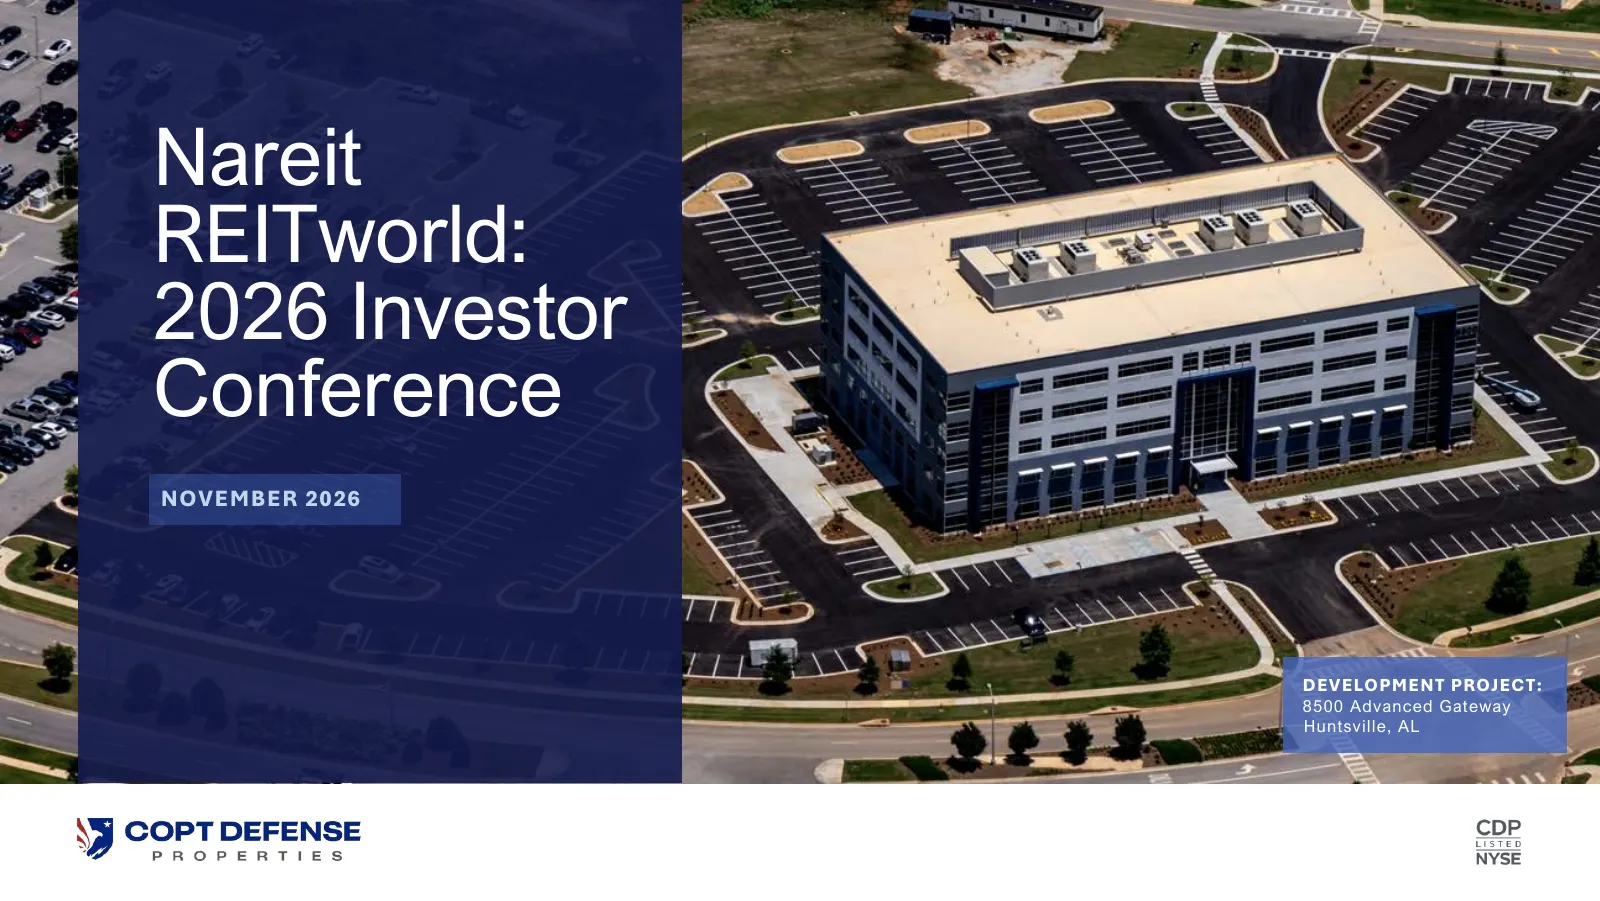
Slide 1: Nareit REITworld: 2026 Investor Conference
Nareit REITworld: 2026 Investor Conference NOVEMBER 2026 DEVELOPMENT PROJECT: 8500 Advanced Gateway Huntsville, AL
Slide 2: Table of Contents
Table of Contents RESULTS FOR 3RD QUARTER 2026 3 UPDATED 2026 GUIDANCE 6 FACTORS SUPPORTING GROWTH 9 PORTFOLIO UPDATE 16 CONCLUSION 20 APPENDICES: 25 Safe Harbor 26 Definitions + Glossary 27 Reconciliations 32 2

Slide 3: Results for 3rd Quarter 2026
Results for 3rd Quarter 2026 3
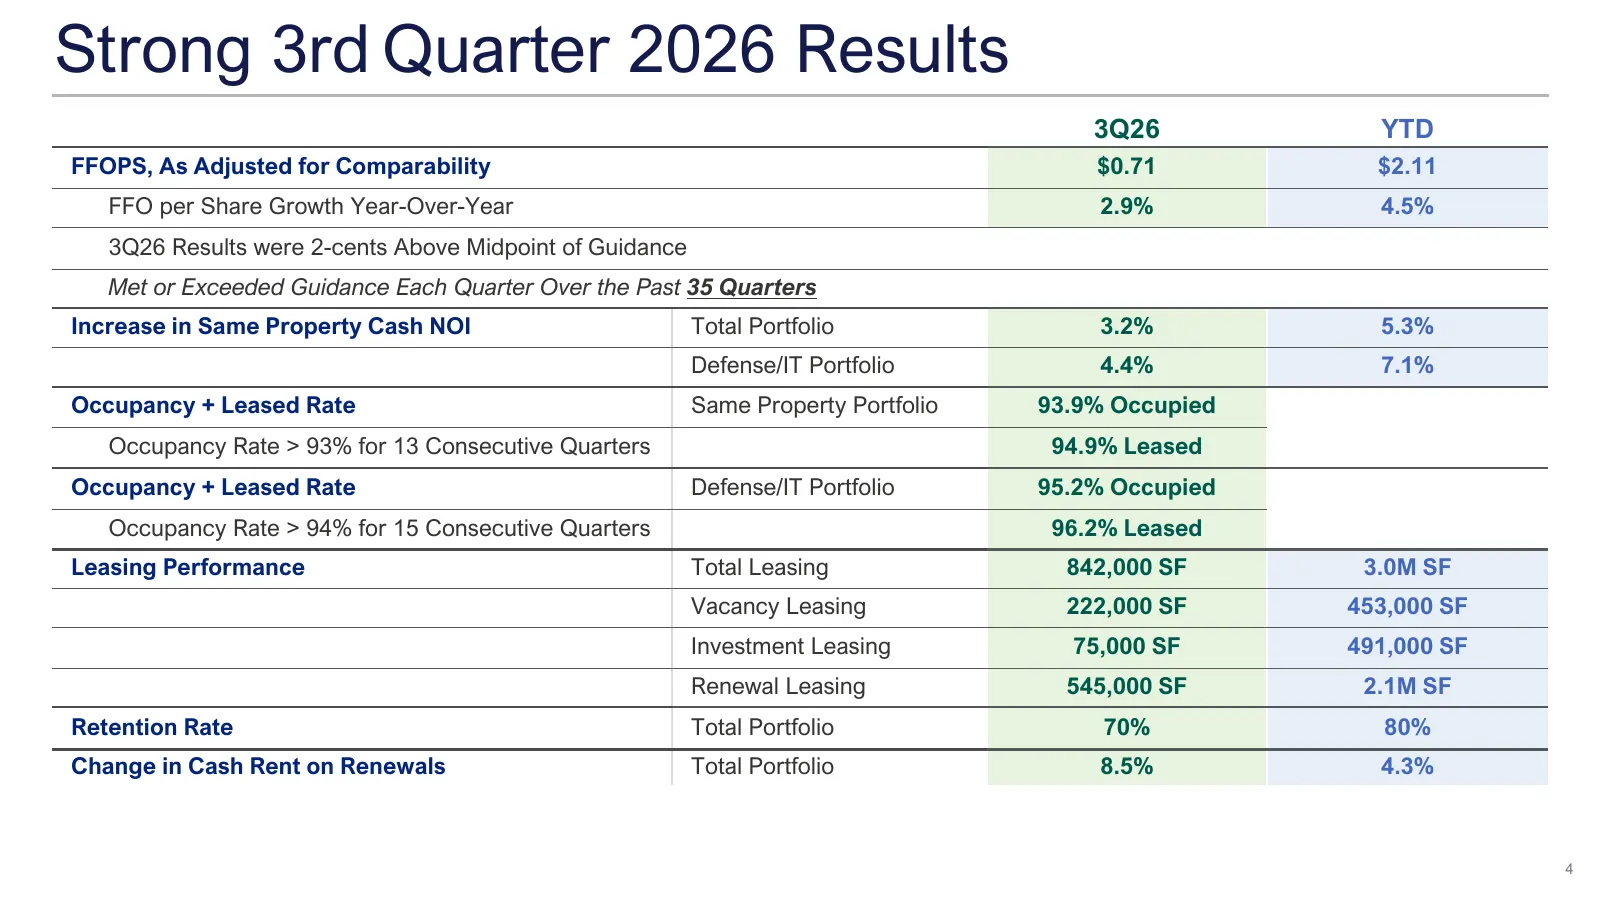
Slide 4: Strong 3rd Quarter 2026 Results
Strong 3rd Quarter 2026 Results 3Q26 YTD FFOPS, As Adjusted for Comparability $0.71 $2.11 FFO per Share Growth Year-Over-Year 2.9% 4.5% 3Q26 Results were 2-cents Above Midpoint of Guidance Met or Exceeded Guidance Each Quarter Over the Past 35 Quarters Increase in Same Property Cash NOI Total Portfo
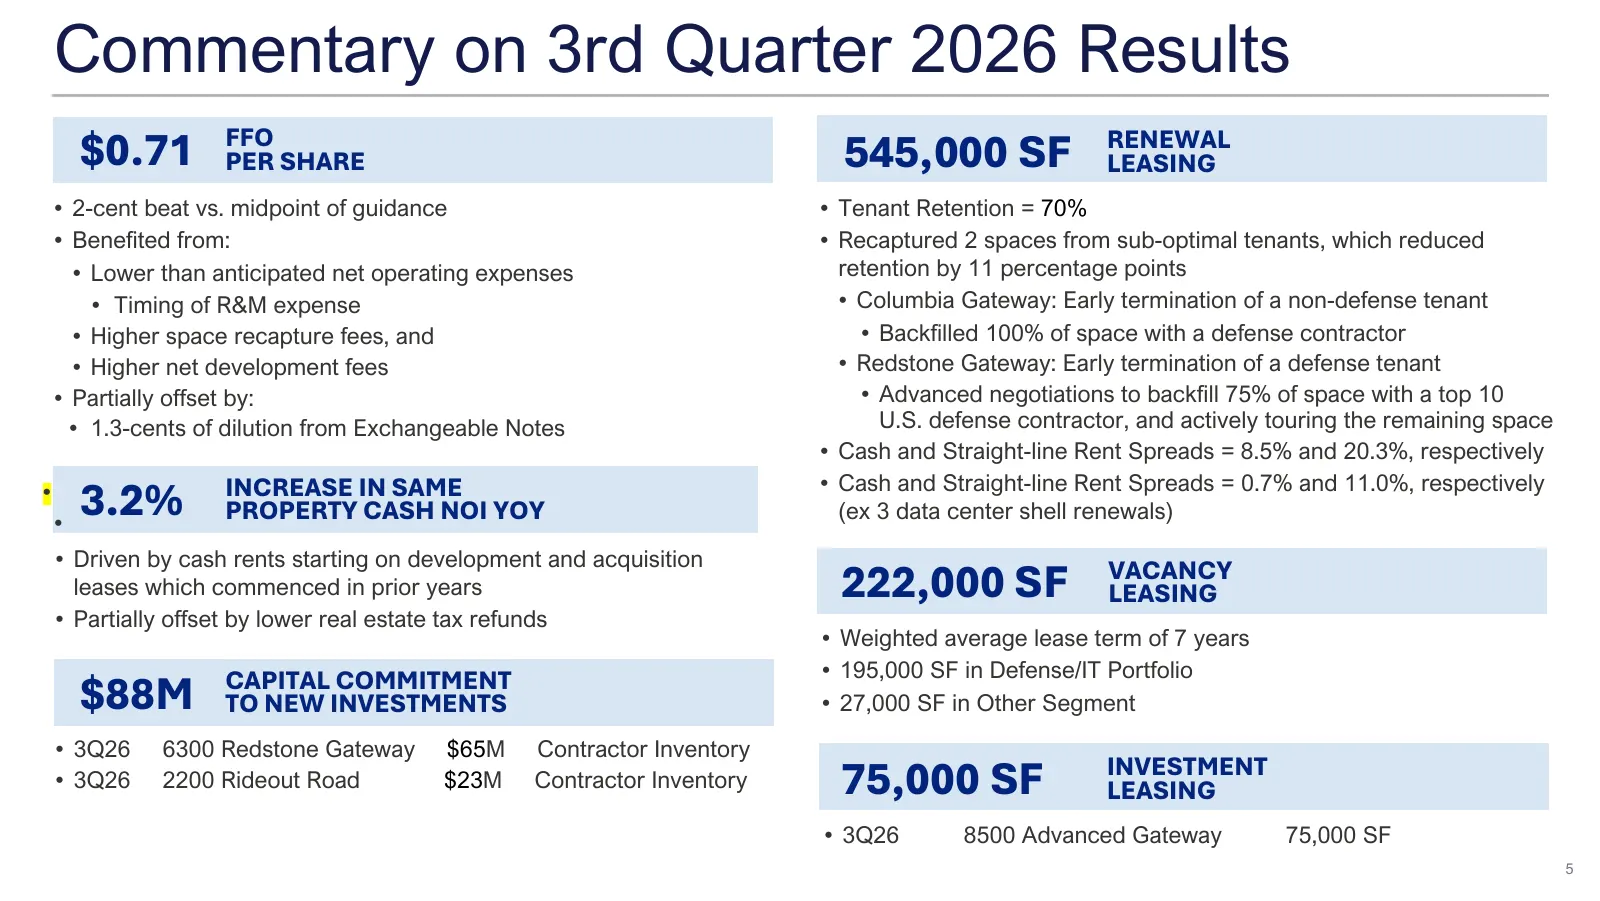
Slide 5: Commentary on 3rd Quarter 2026 Results
Commentary on 3rd Quarter 2026 Results $0.71 FFO PER SHARE 545,000 SF RENEWAL LEASING • 2-cent beat vs. midpoint of guidance • Tenant Retention = 70% • Benefited from: • Recaptured 2 spaces from sub-optimal tenants, which reduced • Lower than anticipated net operating expenses retention by 11 percen
Slide 6: Updated 2026 Guidance
aE eB \" cig 2,8. ee Updated 2026 Guidance
Slide 7: FY 2026 Guidance Summary
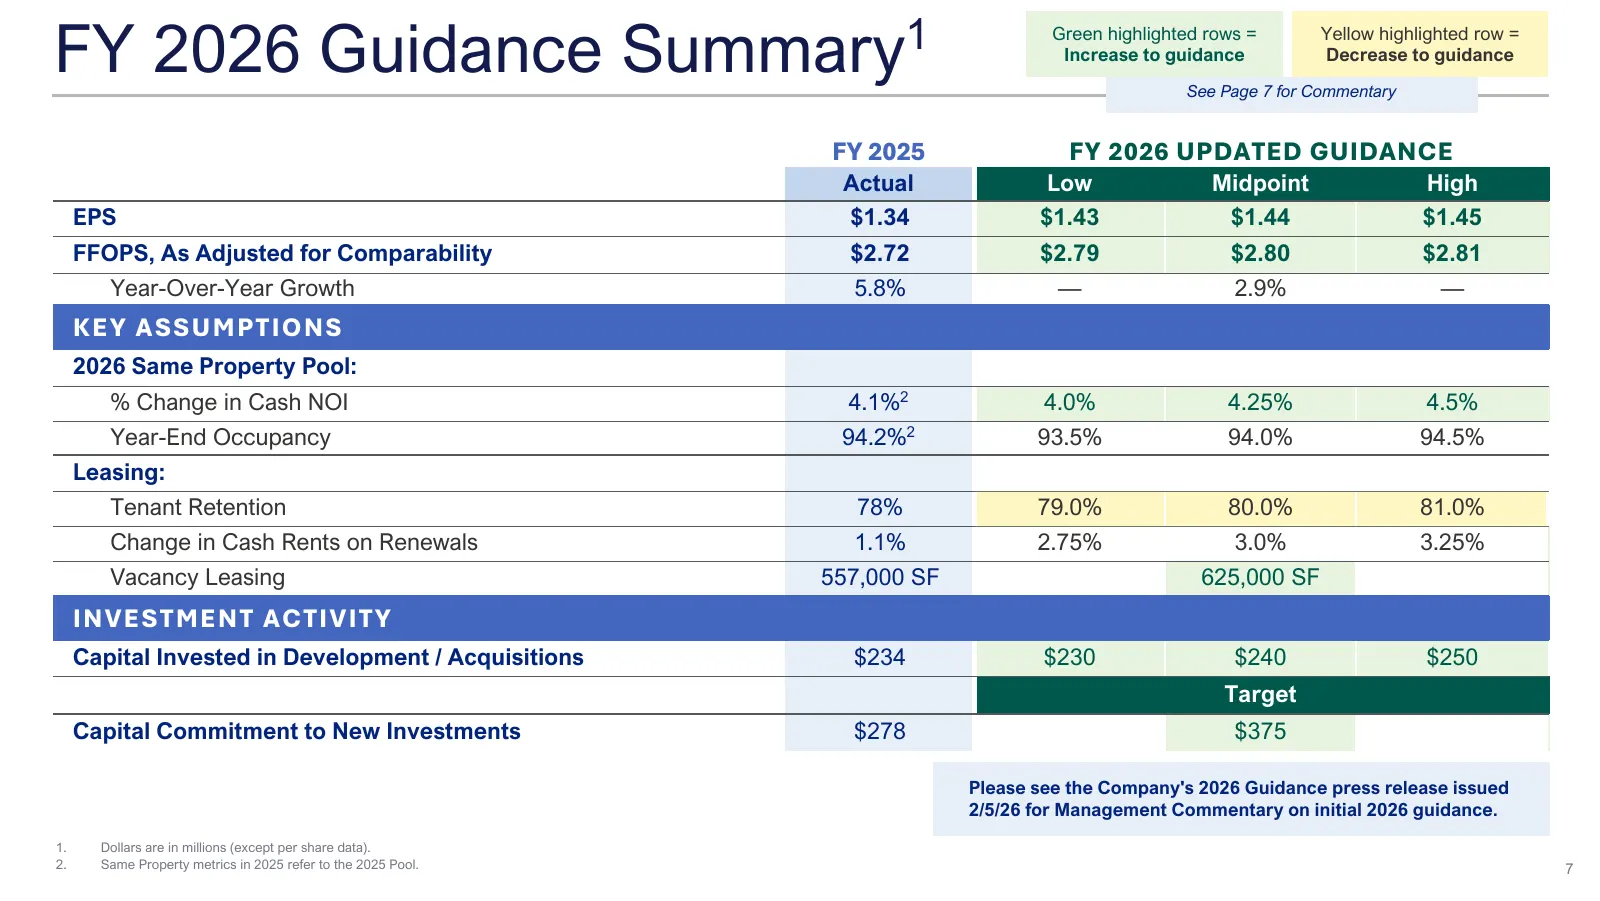
FY 2026 Guidance Summary 1 Green highlighted rows = Increase to guidance Yellow highlighted row = Decrease to guidance See Page 7 for Commentary FY 2025 FY 2026 UPDATED GUIDANCE Actual Low Midpoint High EPS $1.34 $1.43 $1.44 $1.45 FFOPS, As Adjusted for Comparability $2.72 $2.79 $2.80 $2.81 Year-Ove
Slide 8: FY 2026 Guidance Updates
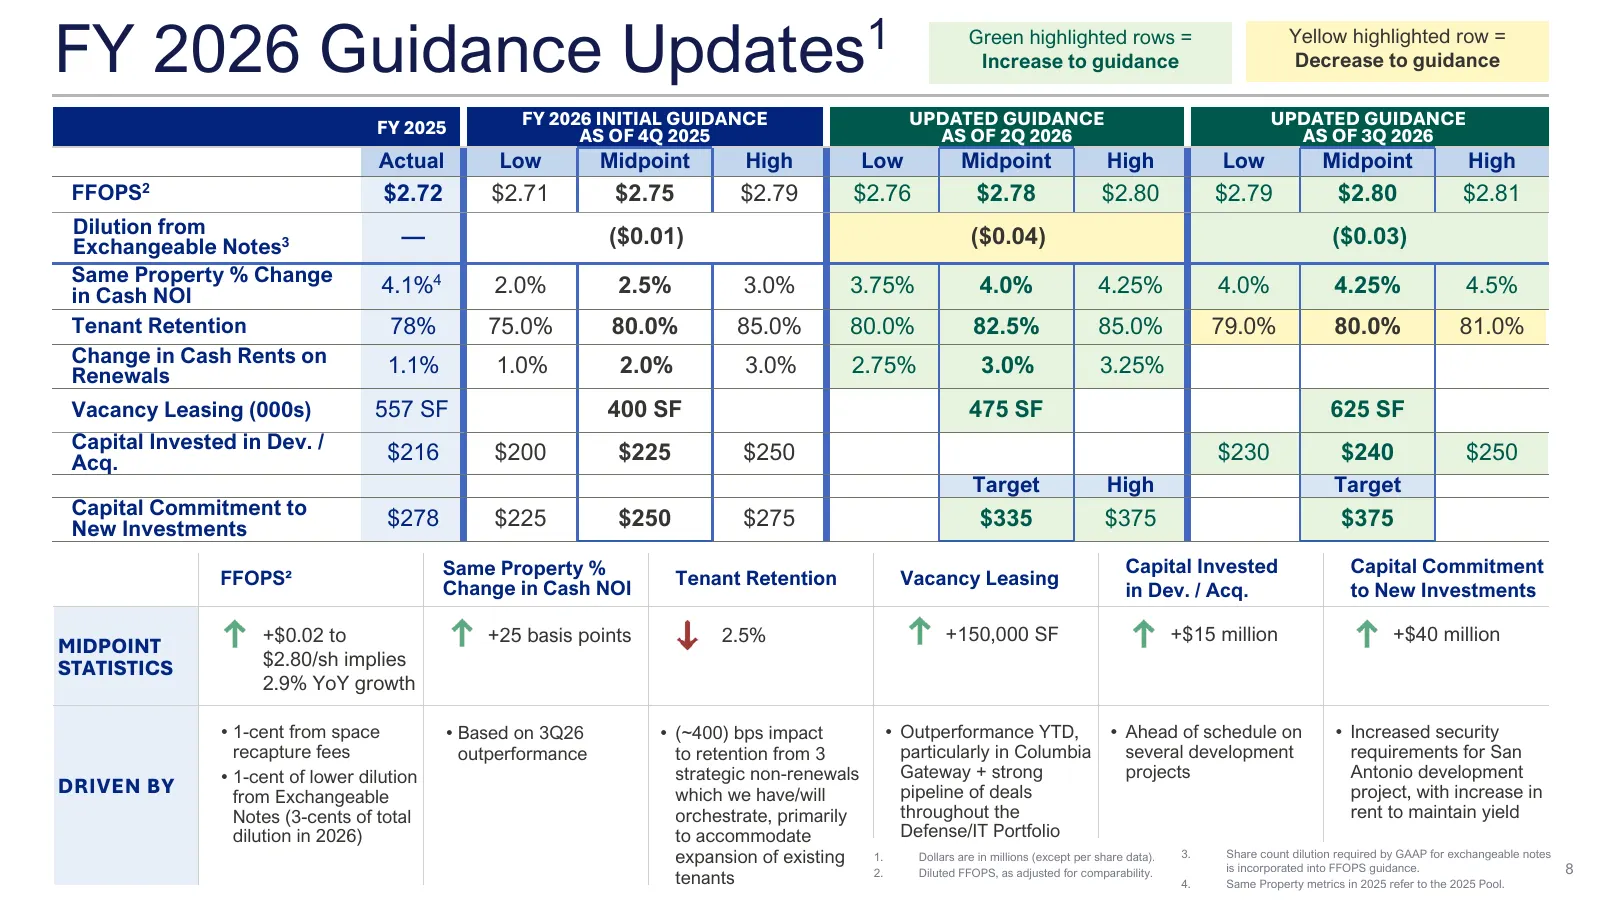
FY 2026 Guidance Updates 1 Green highlighted rows = Increase to guidance Yellow highlighted row = Decrease to guidance FY 2025 FY 2026 INITIAL GUIDANCE UPDATED GUIDANCE UPDATED GUIDANCE AS OF 4Q 2025 AS OF 2Q 2026 AS OF 3Q 2026 Actual Low Midpoint High Low Midpoint High Low Midpoint High FFOPS 2 $2.

Slide 9: Factors Supporting Growth
Factors Supporting Growth a, F-F; ee
Slide 10: Tenant Relationships are Key to Our Success
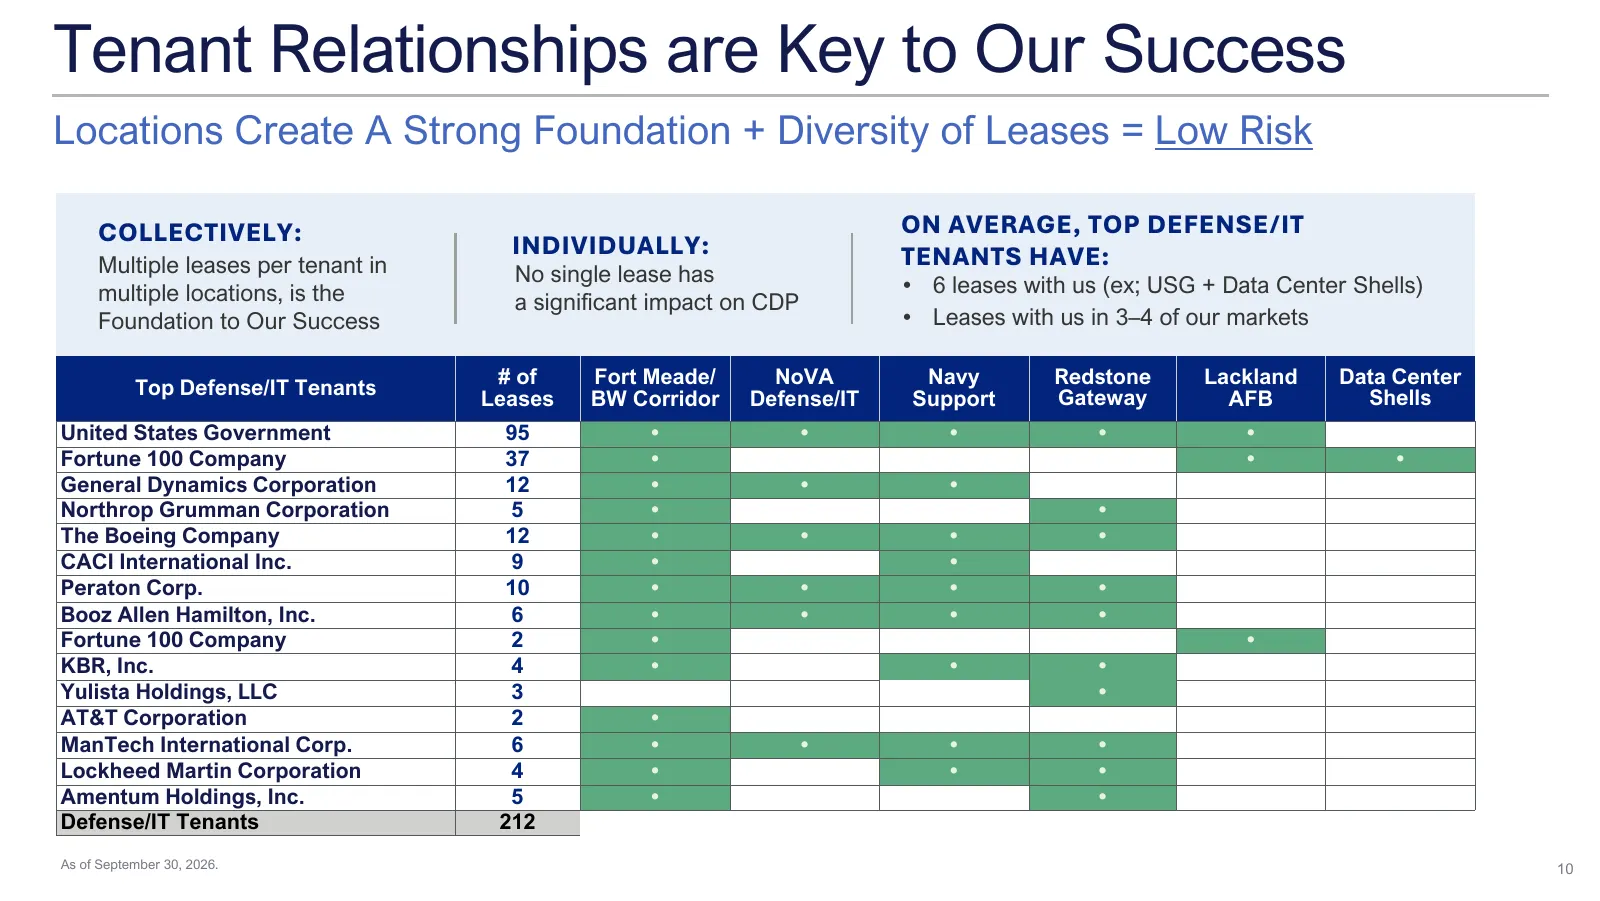
Tenant Relationships are Key to Our Success Locations Create A Strong Foundation + Diversity of Leases = Low Risk COLLECTIVELY: ON AVERAGE, TOP DEFENSE/IT INDIVIDUALLY: TENANTS HAVE: Multiple leases per tenant in No single lease has multiple locations, is the • 6 leases with us (ex; USG + Data Cente
Slide 11: FY 2027 DOD Base Budget Request
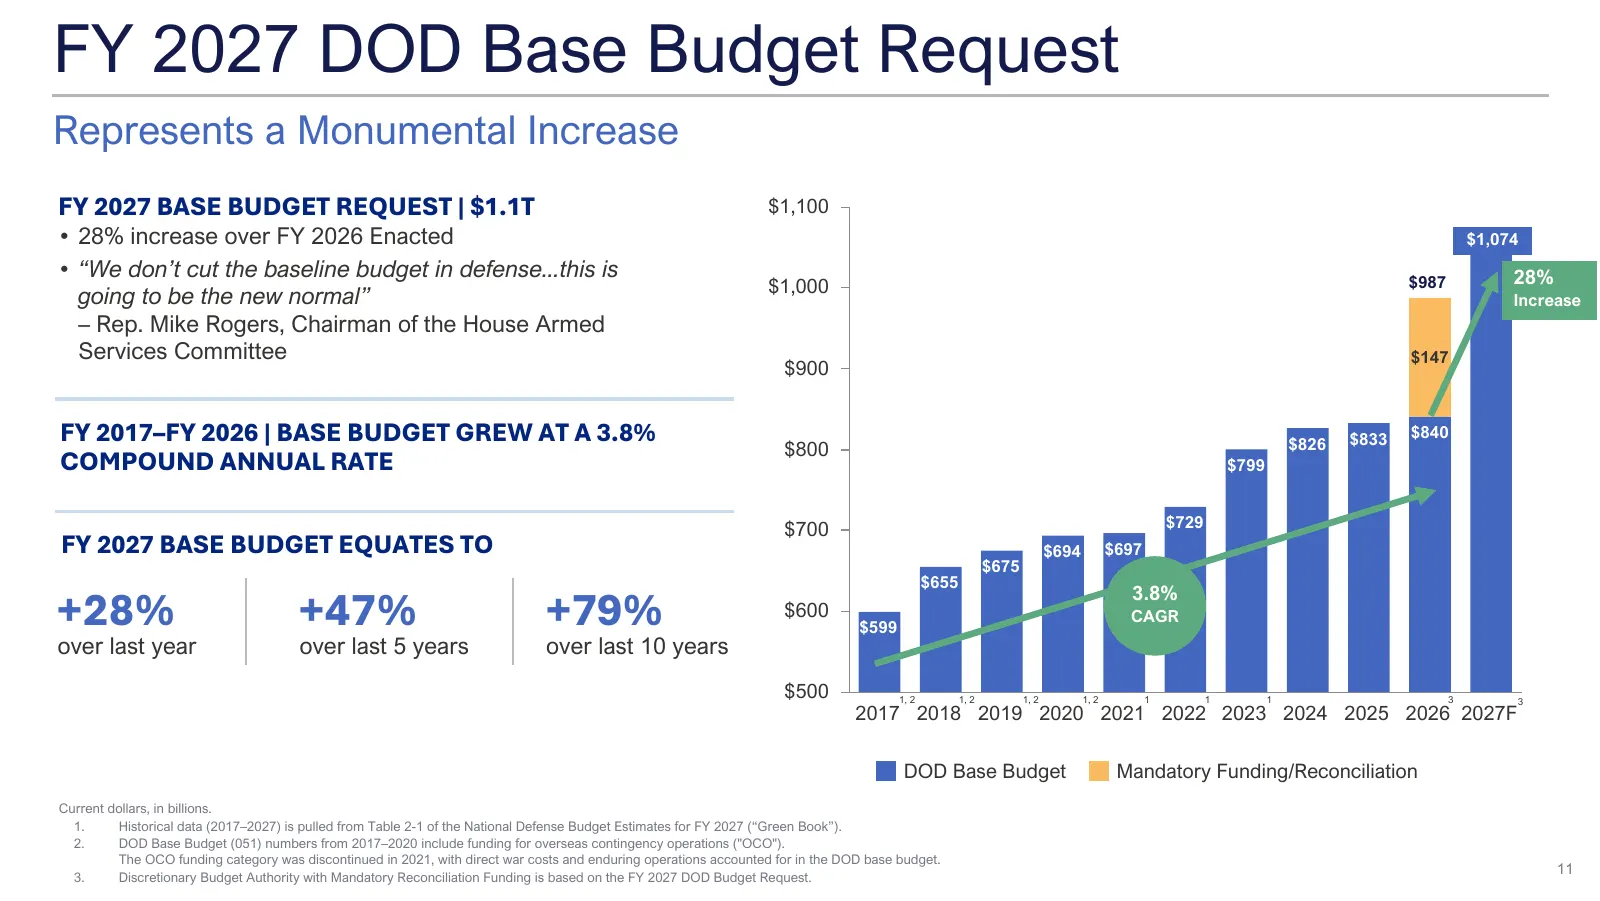
FY 2027 DOD Base Budget Request Represents a Monumental Increase FY 2027 BASE BUDGET REQUEST | $1.1T $1,100 • 28% increase over FY 2026 Enacted $1,074 $1,074 • “We don’t cut the baseline budget in defense...this is $987 28% $1,000 going to be the new normal” Increase – Rep. Mike Rogers, Chairman of
Slide 12: Portfolio Supports Priority DOD Missions
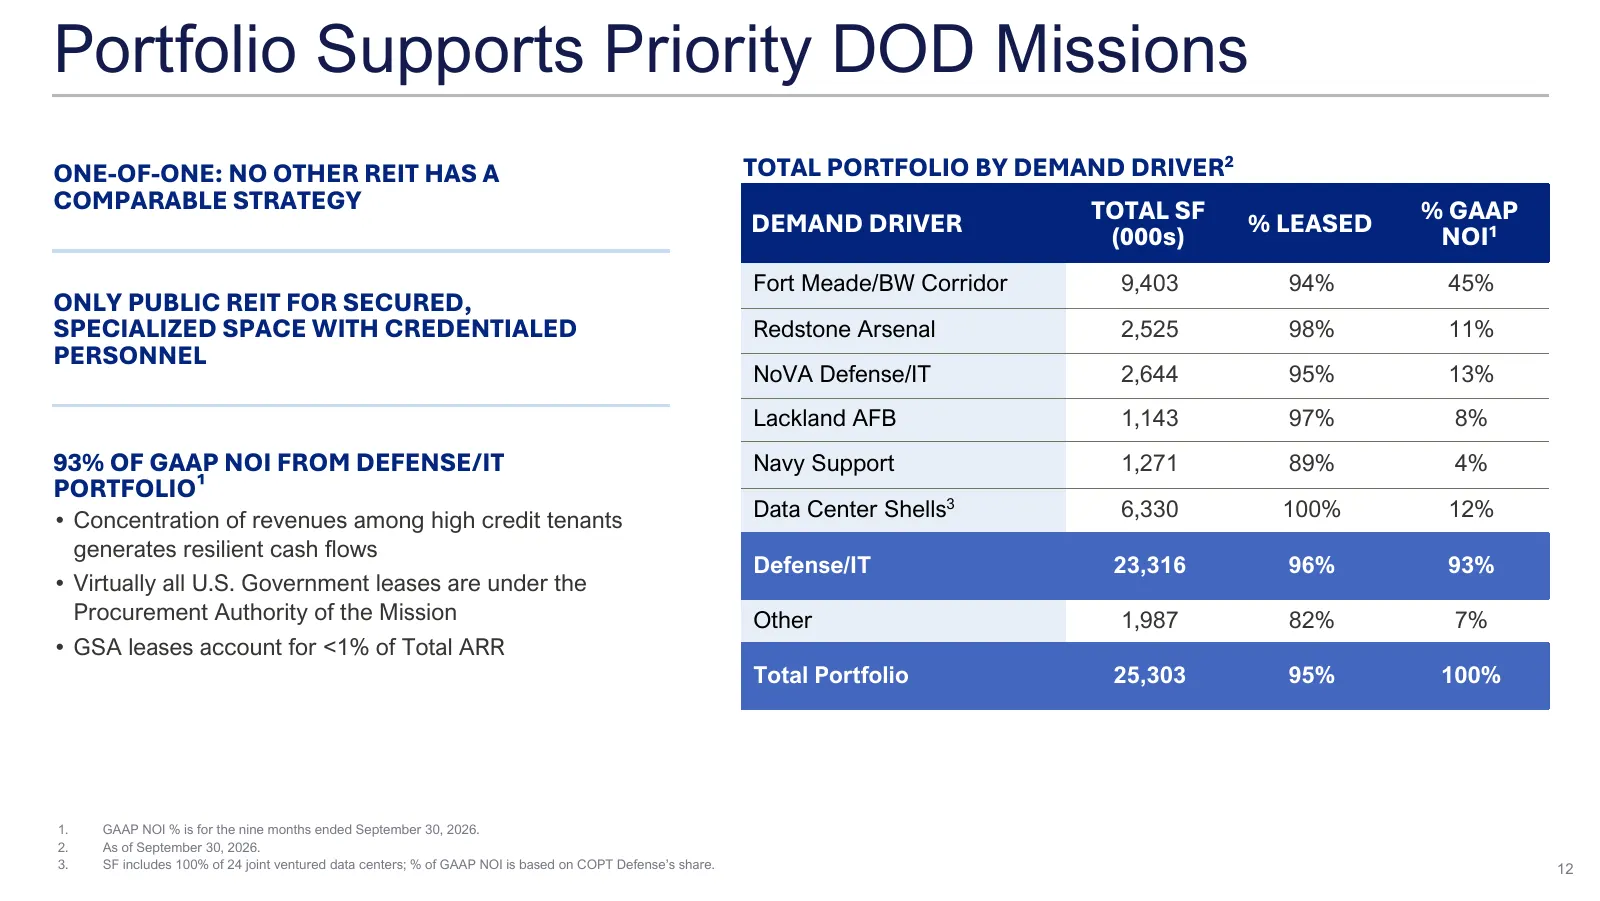
Portfolio Supports Priority DOD Missions ONE-OF-ONE: NO OTHER REIT HAS A TOTAL PORTFOLIO BY DEMAND DRIVER2 COMPARABLE STRATEGY TOTAL SF % GAAP DEMAND DRIVER (000s) % LEASED NOI1 Fort Meade/BW Corridor 9,403 94% 45% ONLY PUBLIC REIT FOR SECURED, SPECIALIZED SPACE WITH CREDENTIALED Redstone Arsenal 2,
Slide 13: External Growth from Investment
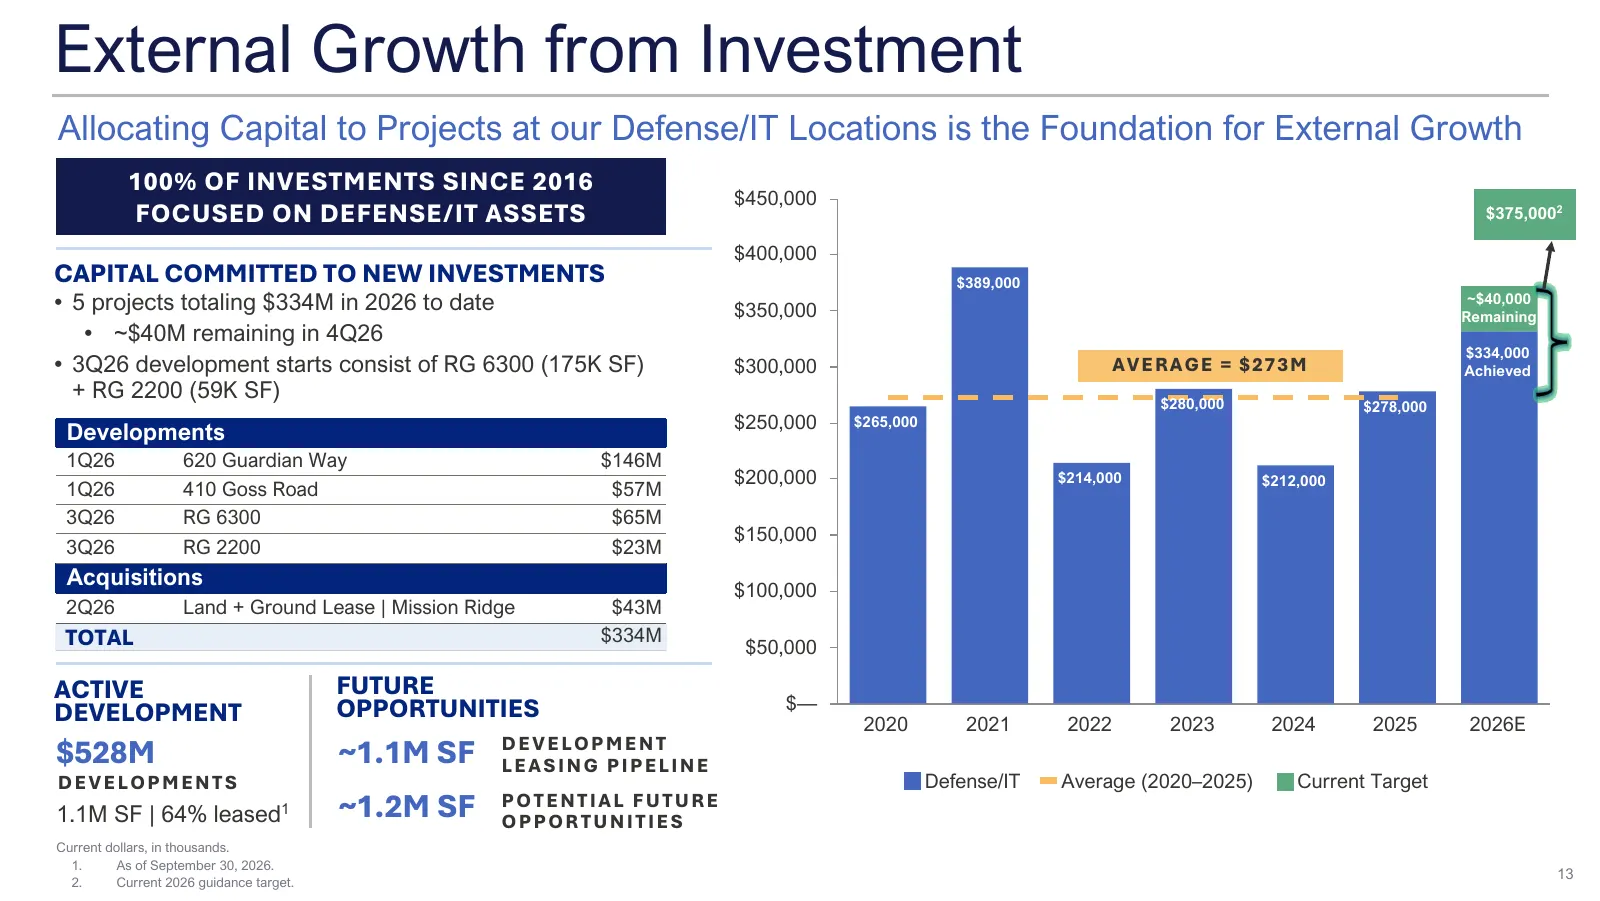
External Growth from Investment Allocating Capital to Projects at our Defense/IT Locations is the Foundation for External Growth 100% OF INVESTMENTS SINCE 2016 $450,000 FOCUSED ON DEFENSE/IT ASSETS $375,0002 $400,000 CAPITAL COMMITTED TO NEW INVESTMENTS $389,000 • 5 projects totaling $334M in 2026 t
Slide 14: Strong Balance Sheet Supports Growth
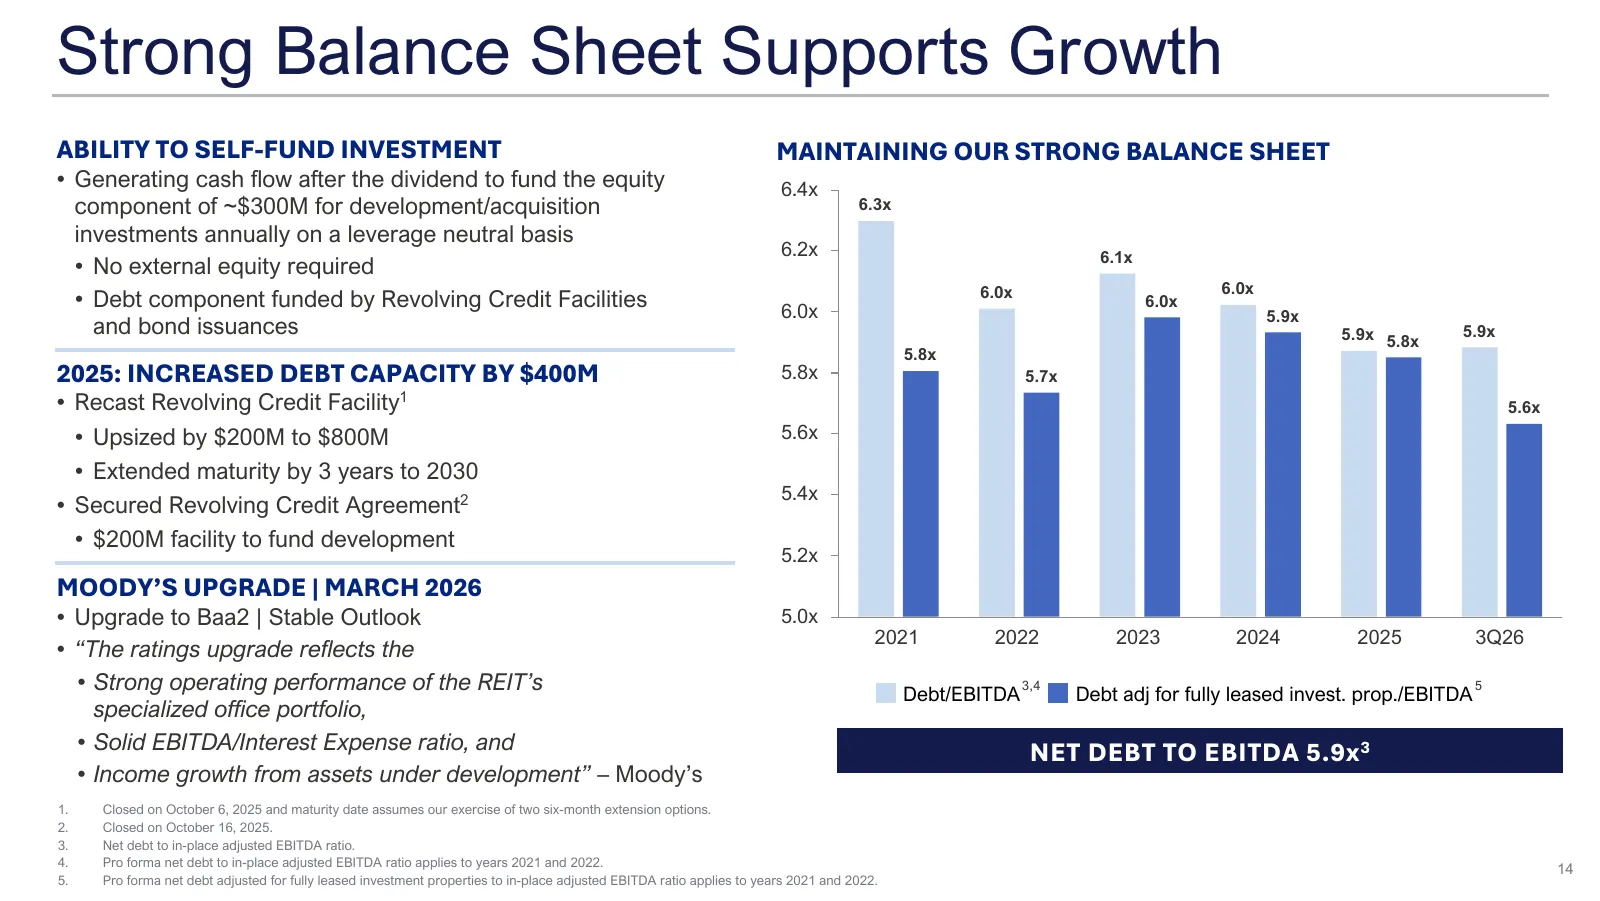
Strong Balance Sheet Supports Growth ABILITY TO SELF-FUND INVESTMENT MAINTAINING OUR STRONG BALANCE SHEET • Generating cash flow after the dividend to fund the equity 6.4x component of ~$300M for development/acquisition 6.3x investments annually on a leverage neutral basis 6.2x 6.1x • No external eq
Slide 15: Well-Staggered Debt Maturity Schedule
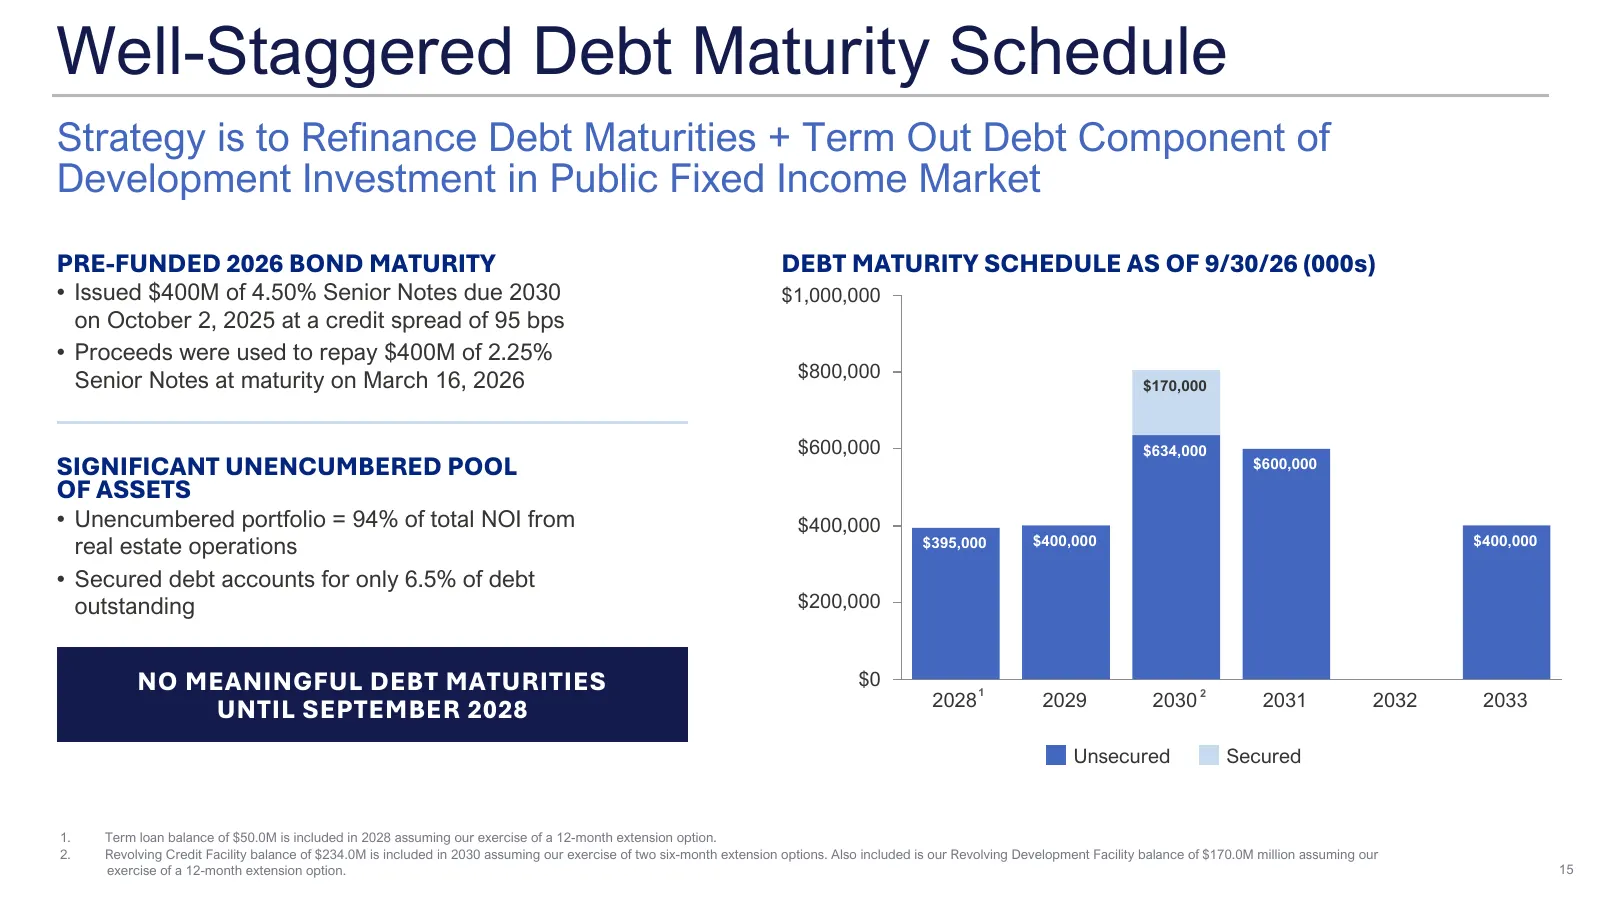
Well-Staggered Debt Maturity Schedule Strategy is to Refinance Debt Maturities + Term Out Debt Component of Development Investment in Public Fixed Income Market PRE-FUNDED 2026 BOND MATURITY DEBT MATURITY SCHEDULE AS OF 9/30/26 (000s) • Issued $400M of 4.50% Senior Notes due 2030 $1,000,000 on Octob
Slide 16: Portfolio Update
Portfolio Update 16
Slide 17: Defense/IT Portfolio % Leased + Occupied
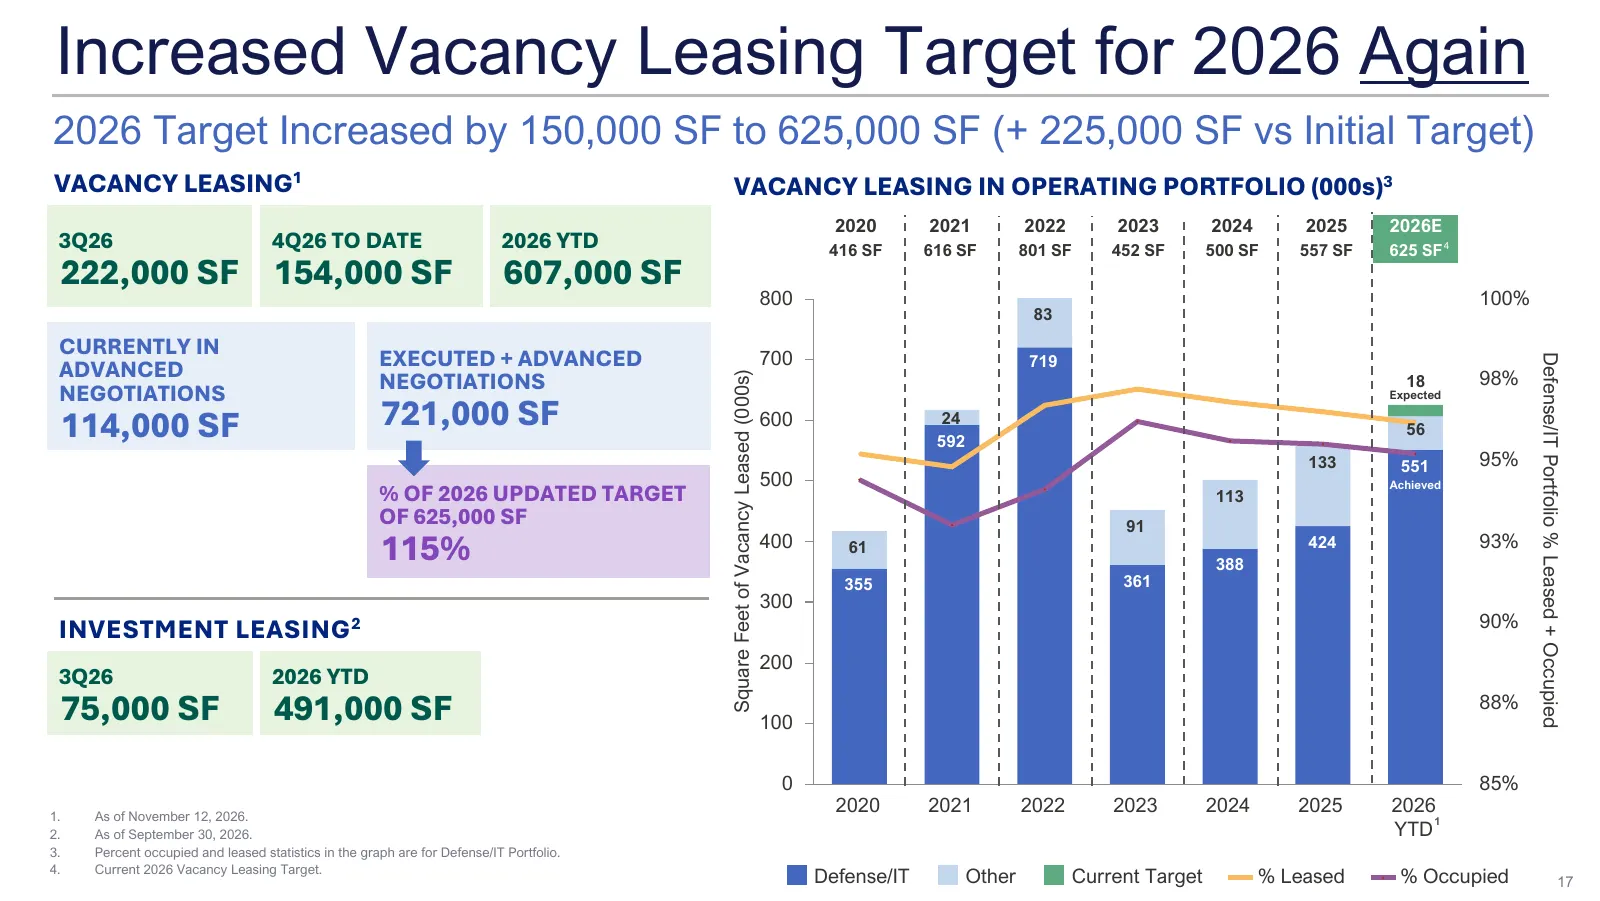
Increased Vacancy Leasing Target for 2026 Again 2026 Target Increased by 150,000 SF to 625,000 SF (+ 225,000 SF vs Initial Target) VACANCY LEASING1 VACANCY LEASING IN OPERATING PORTFOLIO (000s)3 2020 2021 2022 2023 2024 2025 2026E 3Q26 4Q26 TO DATE 2026 YTD 416 SF 616 SF 801 SF 452 SF 500 SF 557 SF
Slide 18: Sector-Leading Tenant Retention
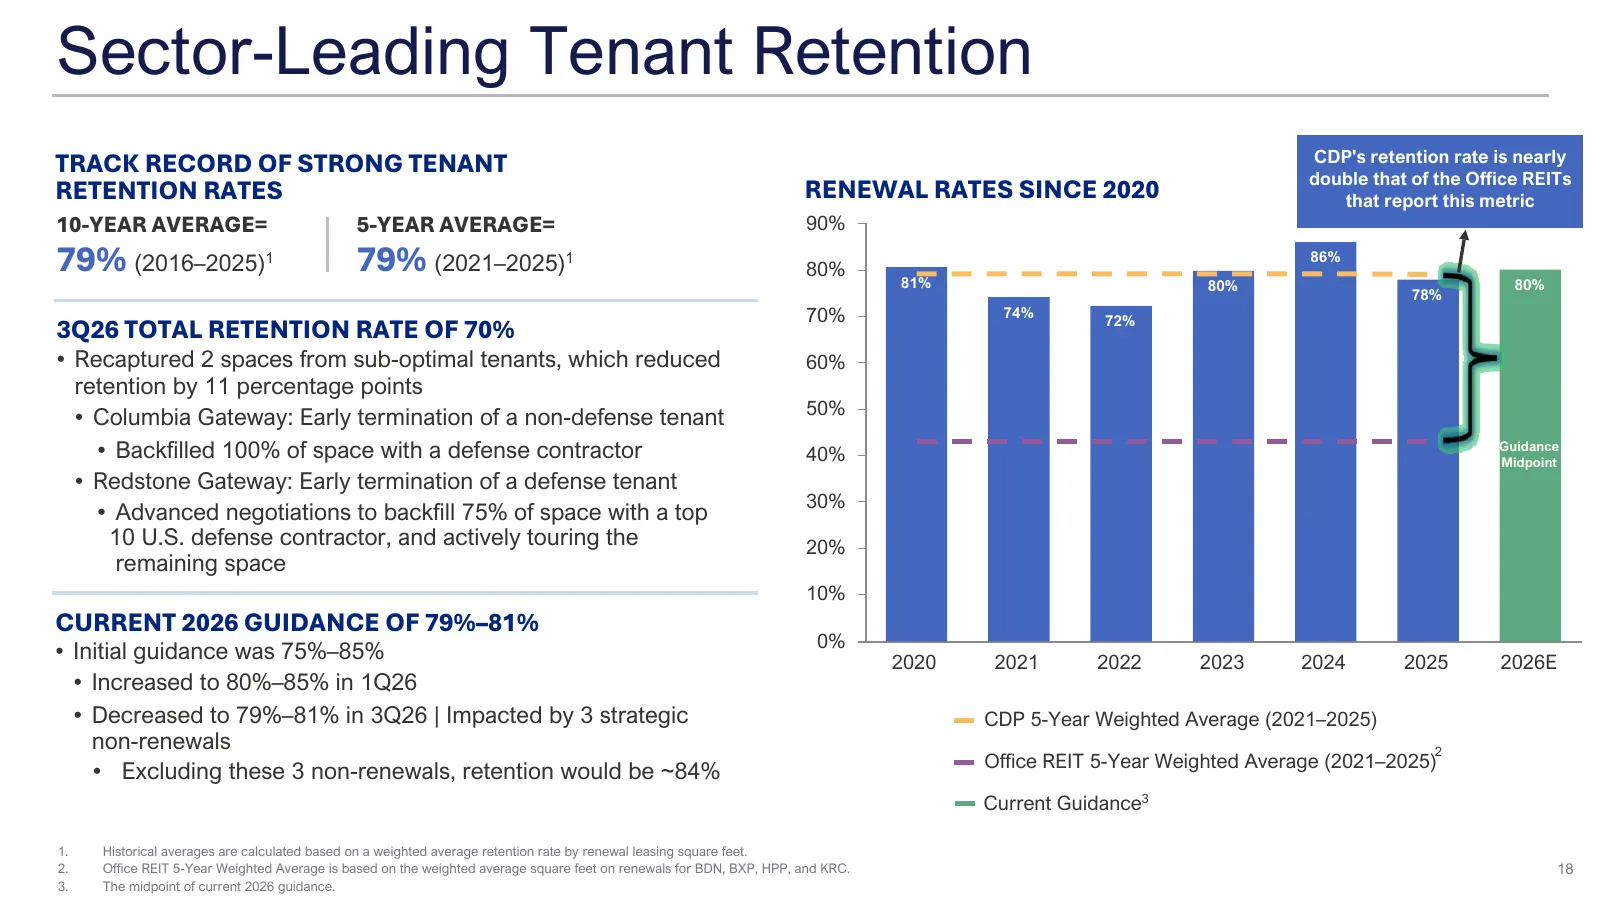
Sector-Leading Tenant Retention CDP's retention rate is nearly TRACK RECORD OF STRONG TENANT double that of the Office REITs RETENTION RATES RENEWAL RATES SINCE 2020 that report this metric 10-YEAR AVERAGE= 5-YEAR AVERAGE= 90% 79% (2016–2025)1 79% (2021–2025)1 80% 81% 86% 80% 80% 78% 70% 74% 72% 3Q2
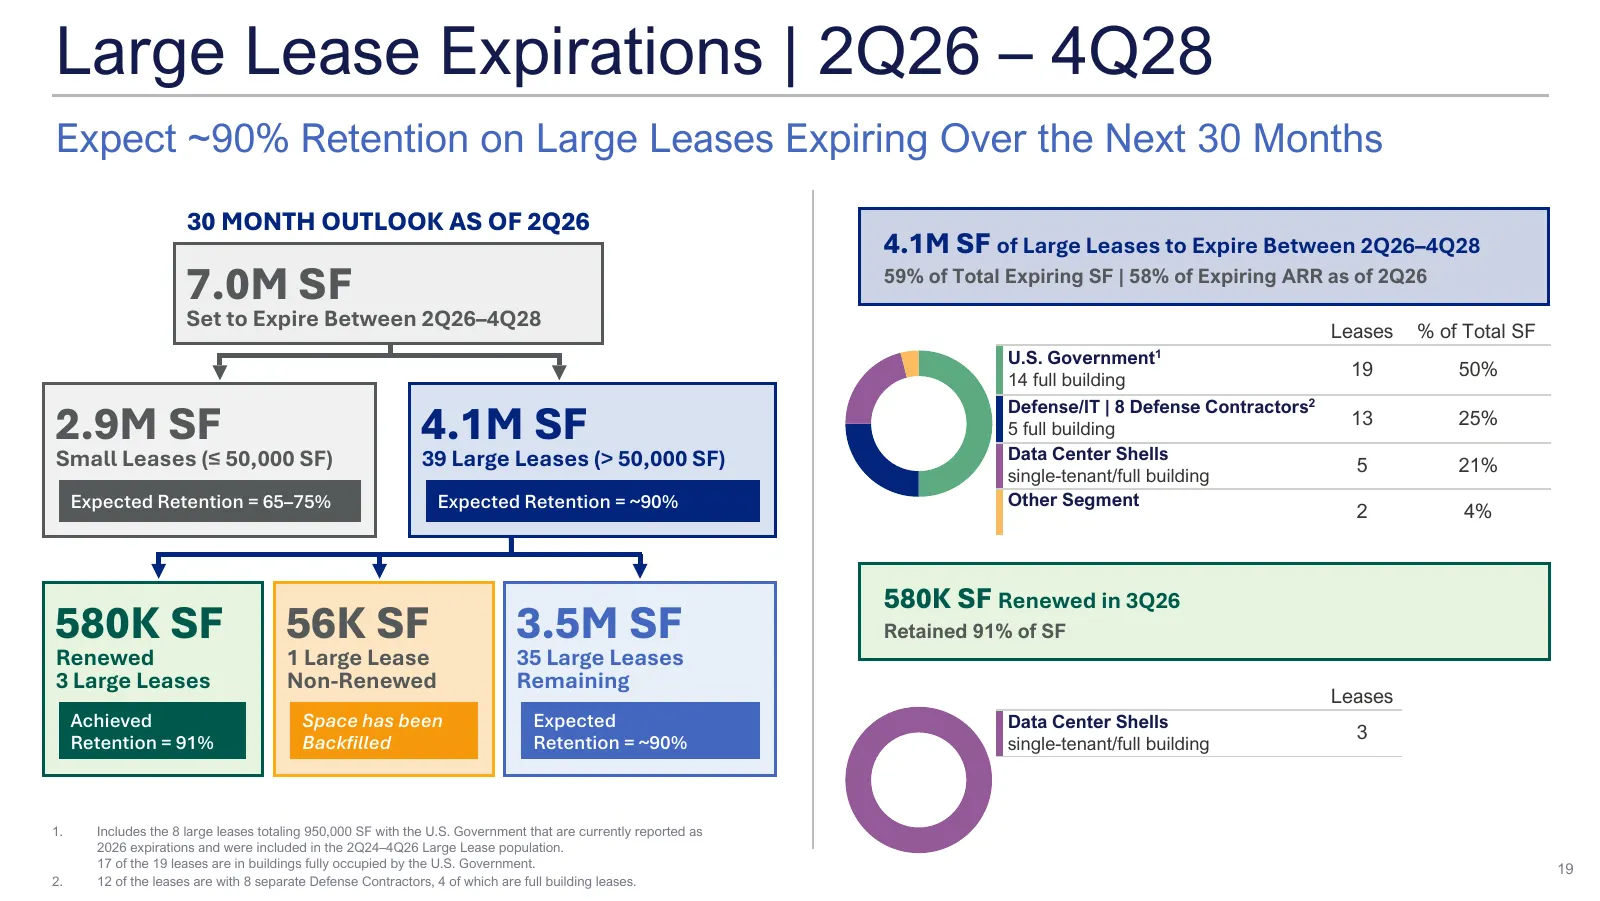
Slide 19: Large Lease Expirations | 2Q26 – 4Q28
Large Lease Expirations | 2Q26 – 4Q28 Expect ~90% Retention on Large Leases Expiring Over the Next 30 Months 30 MONTH OUTLOOK AS OF 2Q26 4.1M SF of Large Leases to Expire Between 2Q26–4Q28 7.0M SF 59% of Total Expiring SF | 58% of Expiring ARR as of 2Q26 Set to Expire Between 2Q26–4Q28 Leases % of T
Slide 20: Conclusion
Conclusion STRONG RESULTS + CONTINUED GROWTH 20
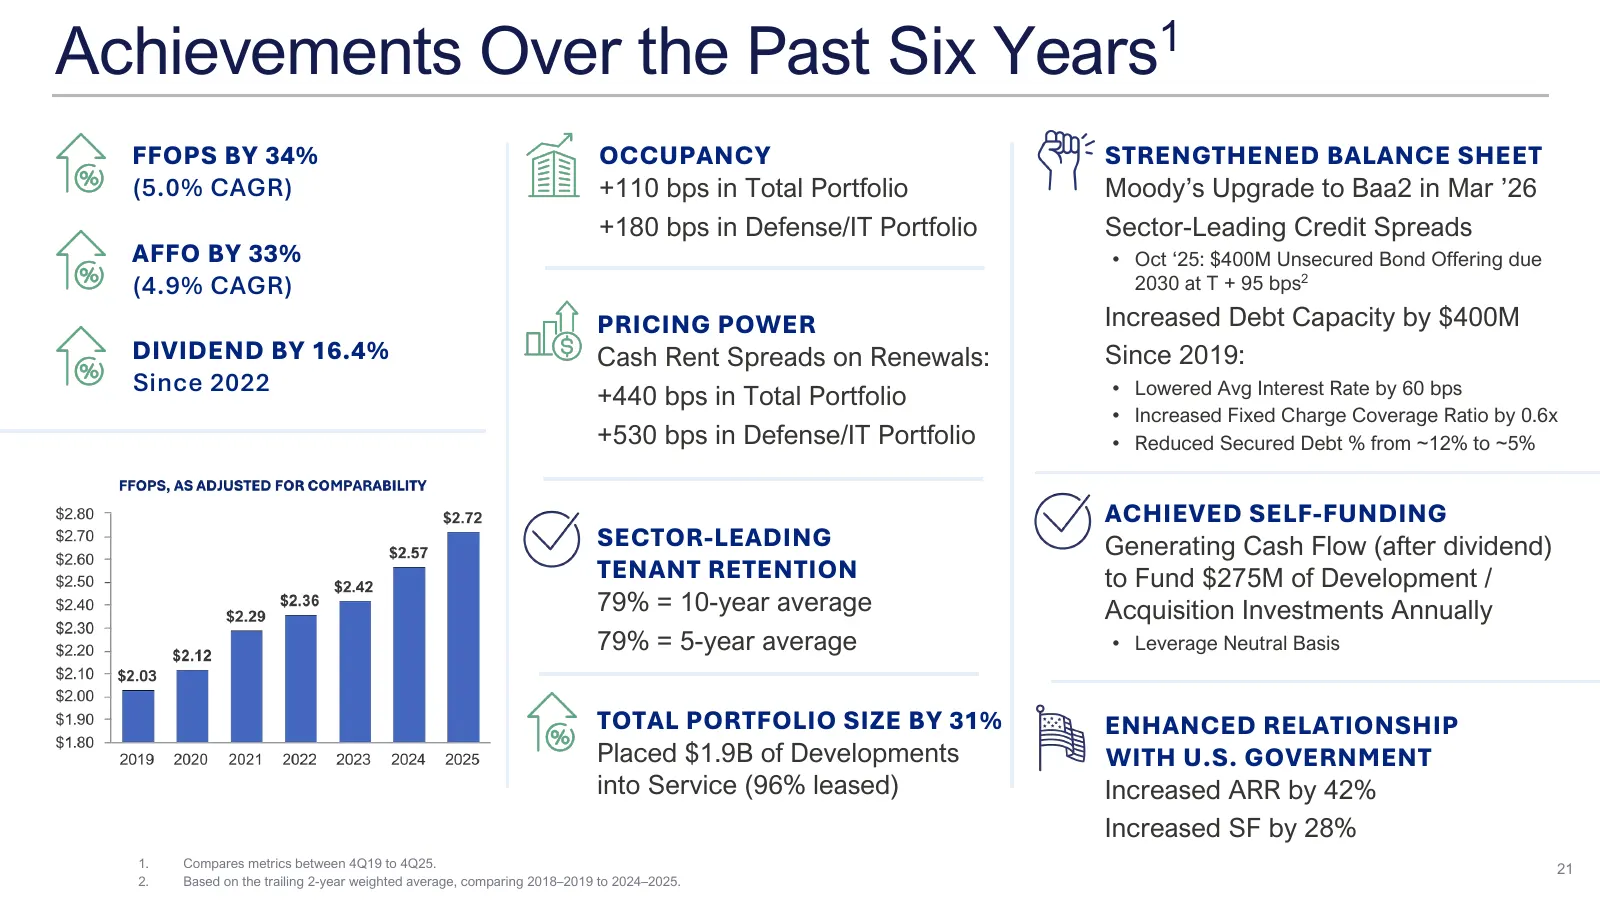
Slide 21: Achievements Over the Past Six Years
Achievements Over the Past Six Years 1 FFOPS BY 34% OCCUPANCY STRENGTHENED BALANCE SHEET (5.0% CAGR) +110 bps in Total Portfolio Moody’s Upgrade to Baa2 in Mar ’26 +180 bps in Defense/IT Portfolio Sector-Leading Credit Spreads AFFO BY 33% • Oct ‘25: $400M Unsecured Bond Offering due (4.9% CAGR) 2030
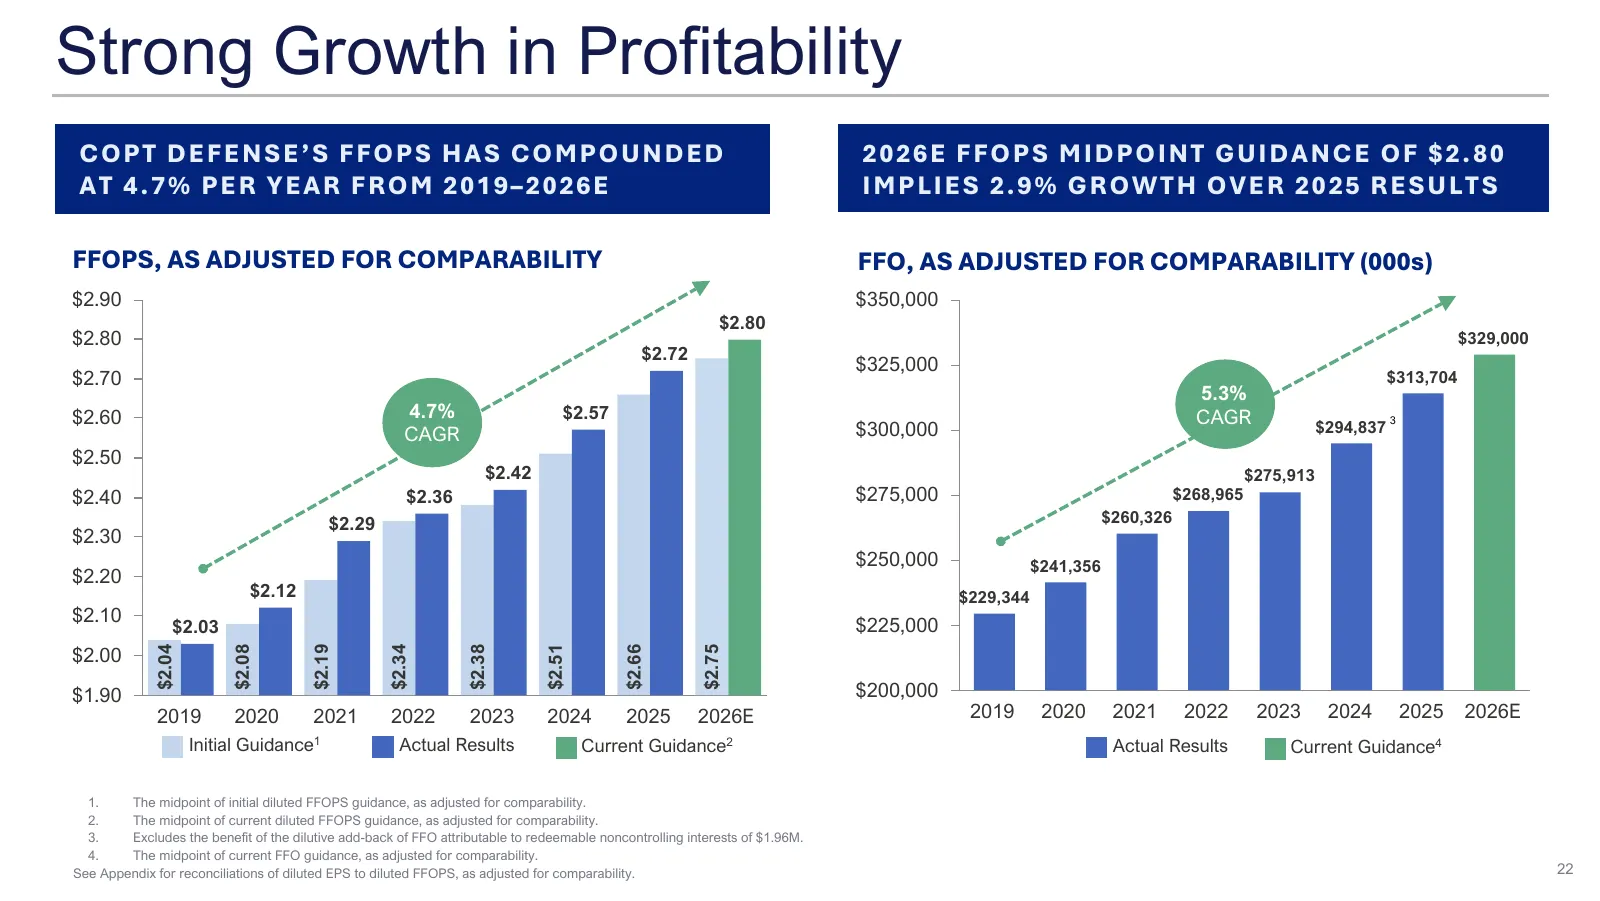
Slide 22: Strong Growth in Profitability
Strong Growth in Profitability COPT DEFENSE’S FFOPS H AS COMPOUN D E D 2026E FFOPS MID POIN T GUID AN CE OF $2.80 AT 4.7% PER YEAR FROM 2019–2026E IMPLIE S 2.9% GR OWTH OVE R 2025 R E S ULTS FFOPS, AS ADJUSTED FOR COMPARABILITY FFO, AS ADJUSTED FOR COMPARABILITY (000s) $2.90 $350,000 $2.80 $2.80 $32
Slide 23: Attractive Investment Opportunity
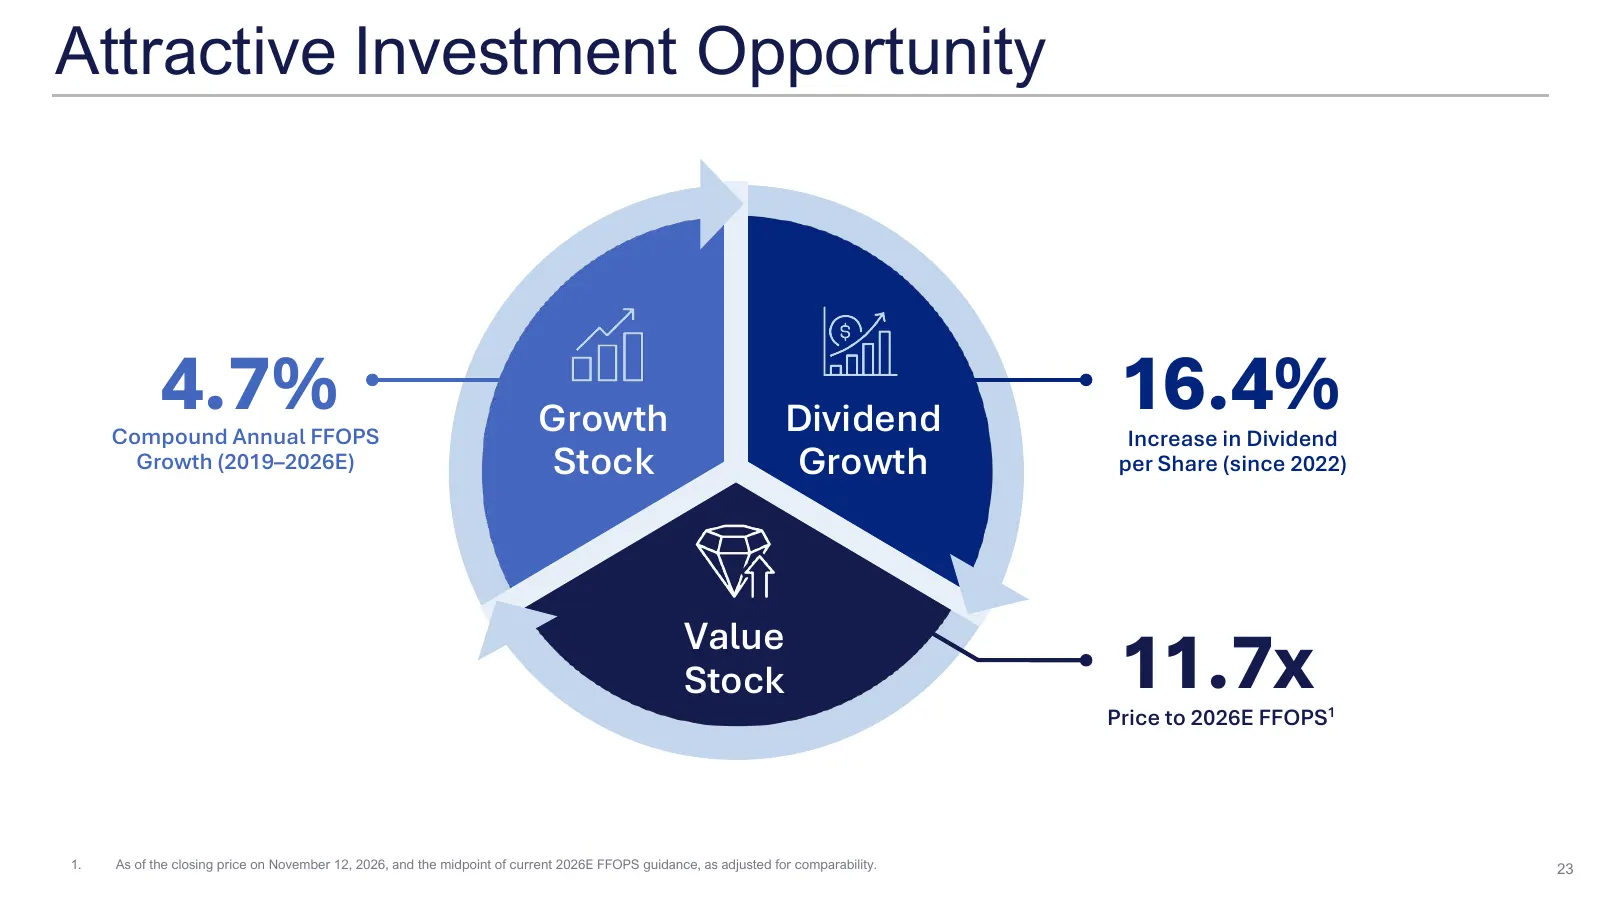
Attractive Investment Opportunity 4.7% Compound Annual FFOPS Growth Dividend 16.4% Increase in Dividend Growth (2019–2026E) Stock Growth per Share (since 2022) Value Stock 11.7x Price to 2026E FFOPS1 1. As of the closing price on November 12, 2026, and the midpoint of current 2026E FFOPS guidance, a
Slide 24: Continued Growth
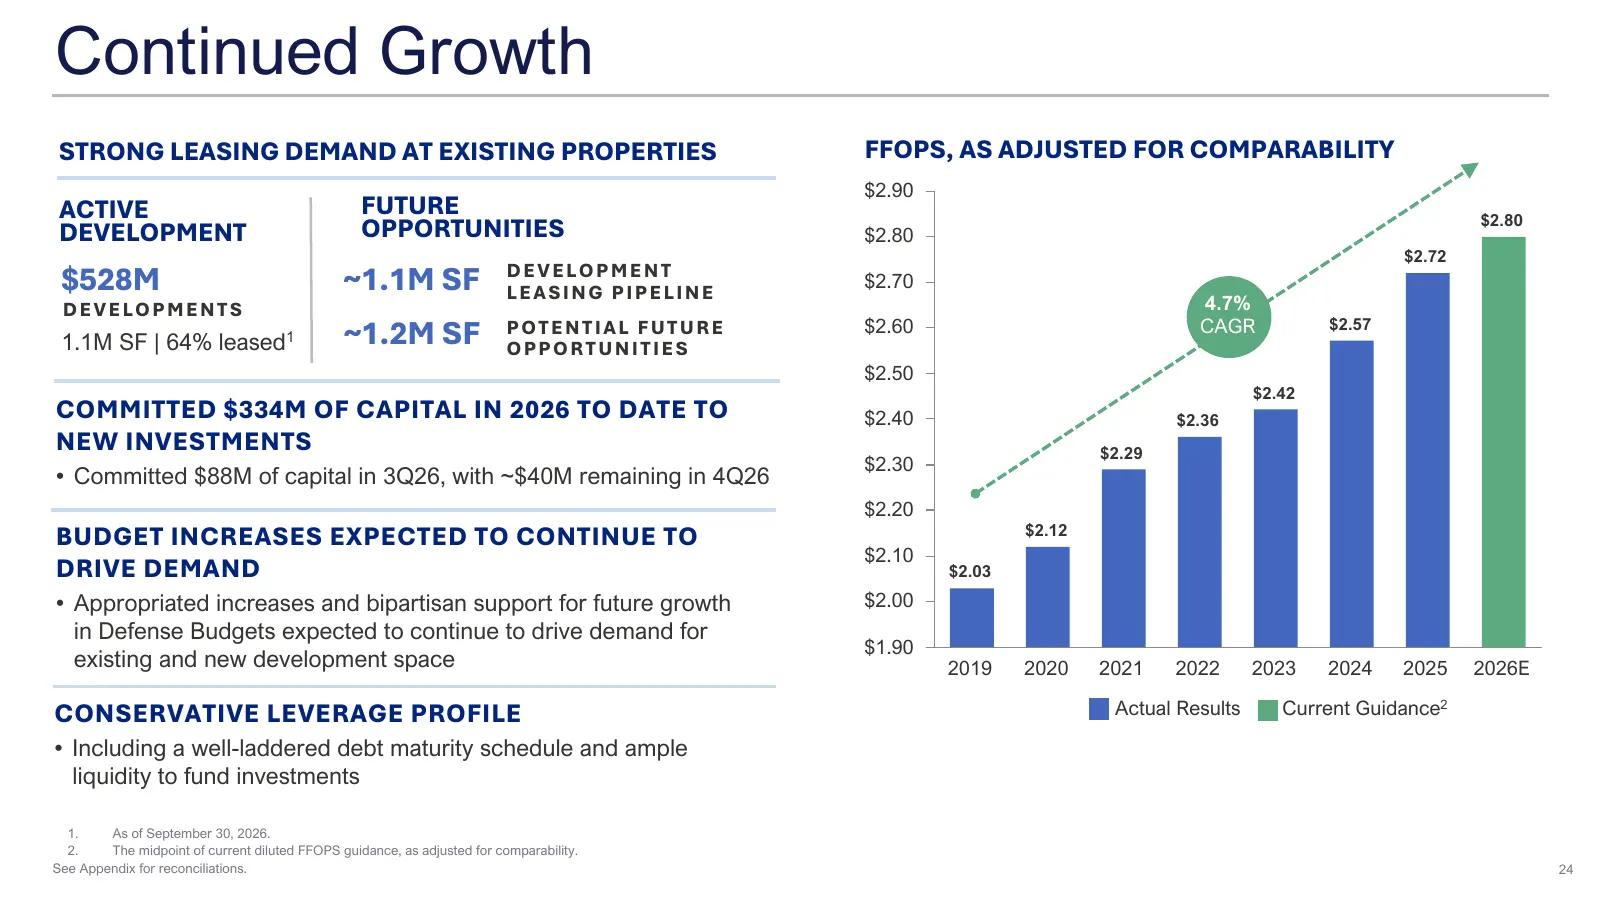
Continued Growth STRONG LEASING DEMAND AT EXISTING PROPERTIES FFOPS, AS ADJUSTED FOR COMPARABILITY $2.90 ACTIVE FUTURE $2.80 DEVELOPMENT OPPORTUNITIES $2.80 $2.72 $528M ~1.1M SF DEVELOPMENT LEASING PIPELINE $2.70 DEVELOPMENTS 4.7% 1.1M SF | 64% leased1 ~1.2M SF POTENTIAL FUTURE OPPORTUNITIES $2.60 C
Slide 25: Appendices
Appendices SAFE HARBOR 26 DEFINITIONS + GLOSSARY 27 RECONCILIATIONS 32 25
Slide 26: Safe Harbor
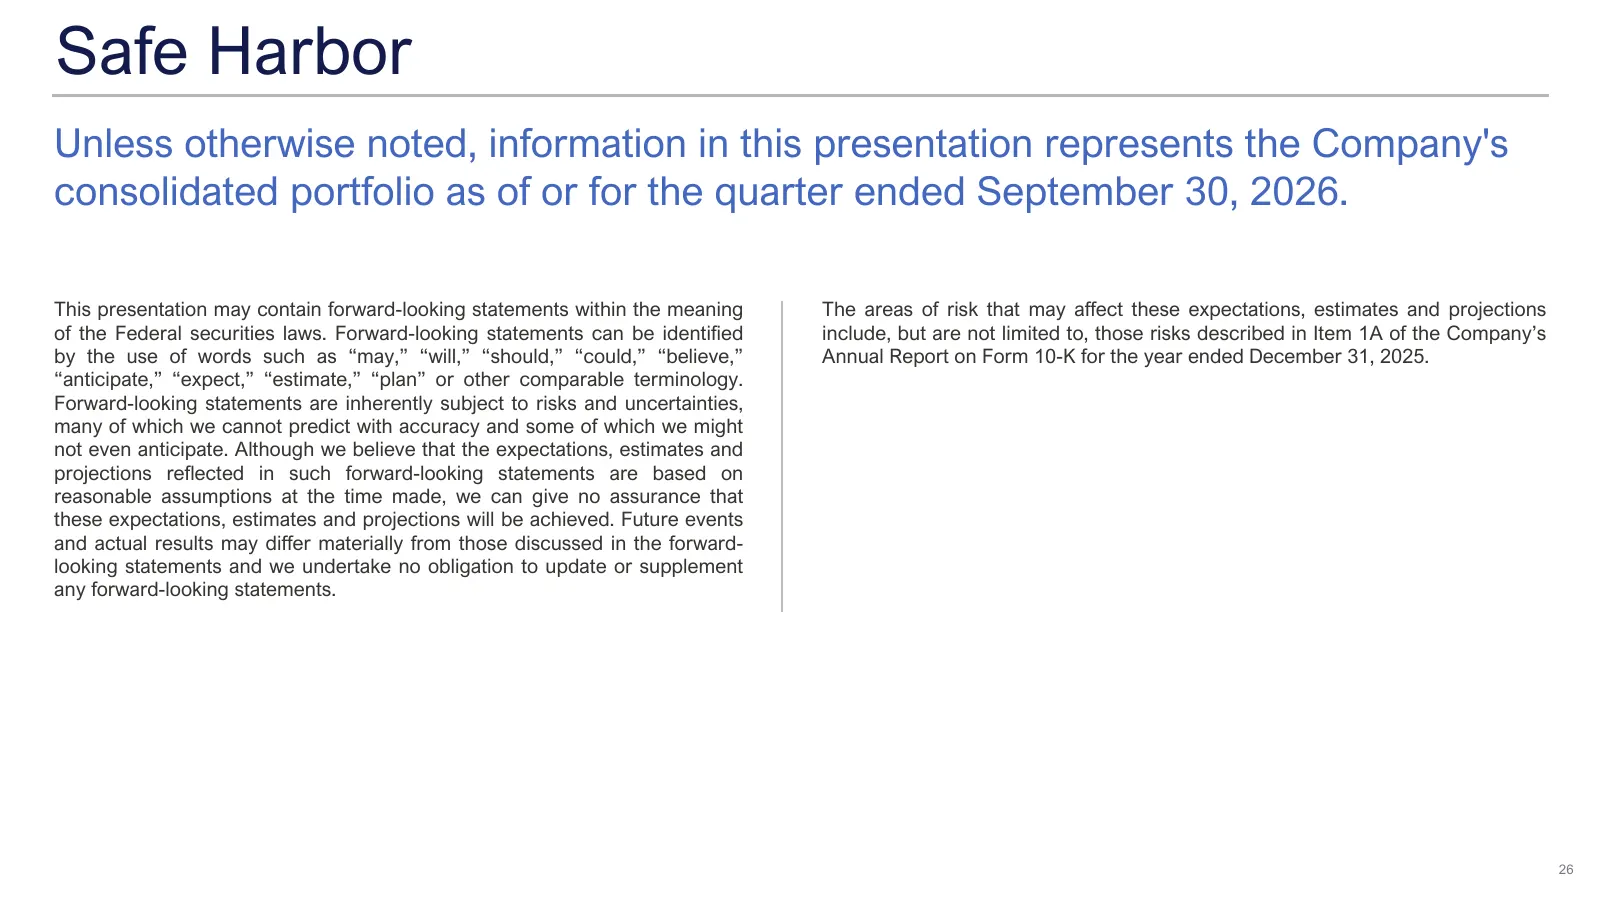
Safe Harbor Harbor Unless otherwise noted, information in this presentation represents the Company's consolidated portfolio as of or for the quarter ended September 30, 2026. This presentation may contain forward-looking statements within the meaning The areas of risk that may affect these expectati
Slide 27: Definitions + Glossary
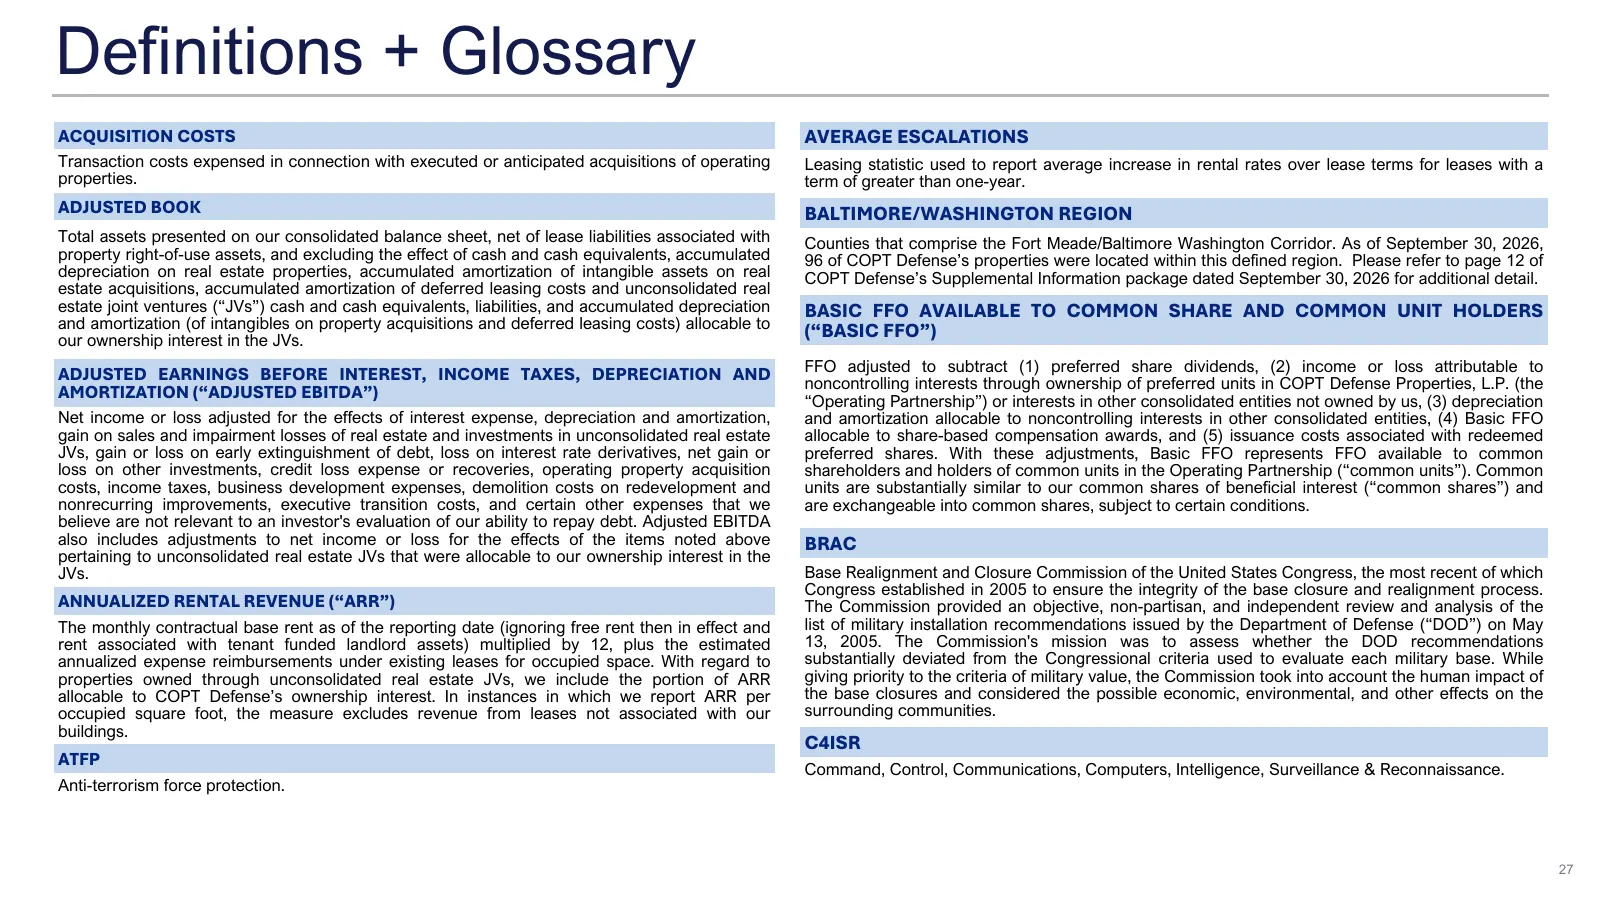
Definitions Definitions ++ Glossary Glossary ACQUISITION COSTS AVERAGE ESCALATIONS Transaction costs expensed in connection with executed or anticipated acquisitions of operating Leasing statistic used to report average increase in rental rates over lease terms for leases with a properties. term of
Slide 28: Definitions + Glossary (continued)
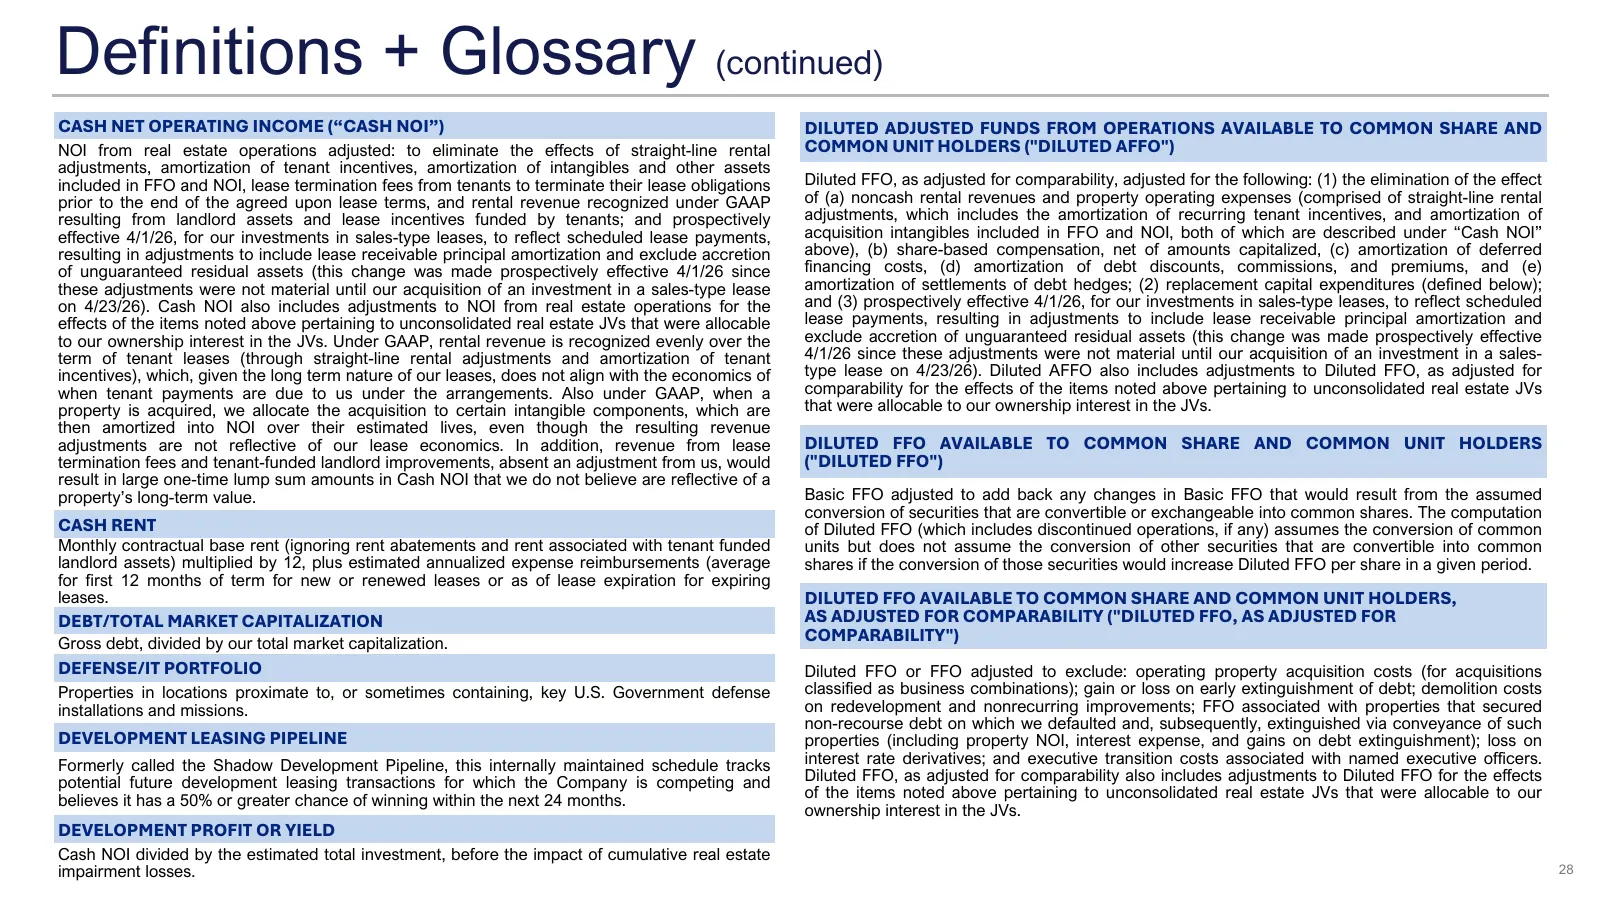
Definitions Definitions + Glossary + Glossary (continued)(continued) CASH NET OPERATING INCOME (“CASH NOI”) DILUTED ADJUSTED FUNDS FROM OPERATIONS AVAILABLE TO COMMON SHARE AND NOI from real estate operations adjusted: to eliminate the effects of straight-line rental COMMON UNIT HOLDERS ("DILUTED AF
Slide 29: Definitions + Glossary (continued)
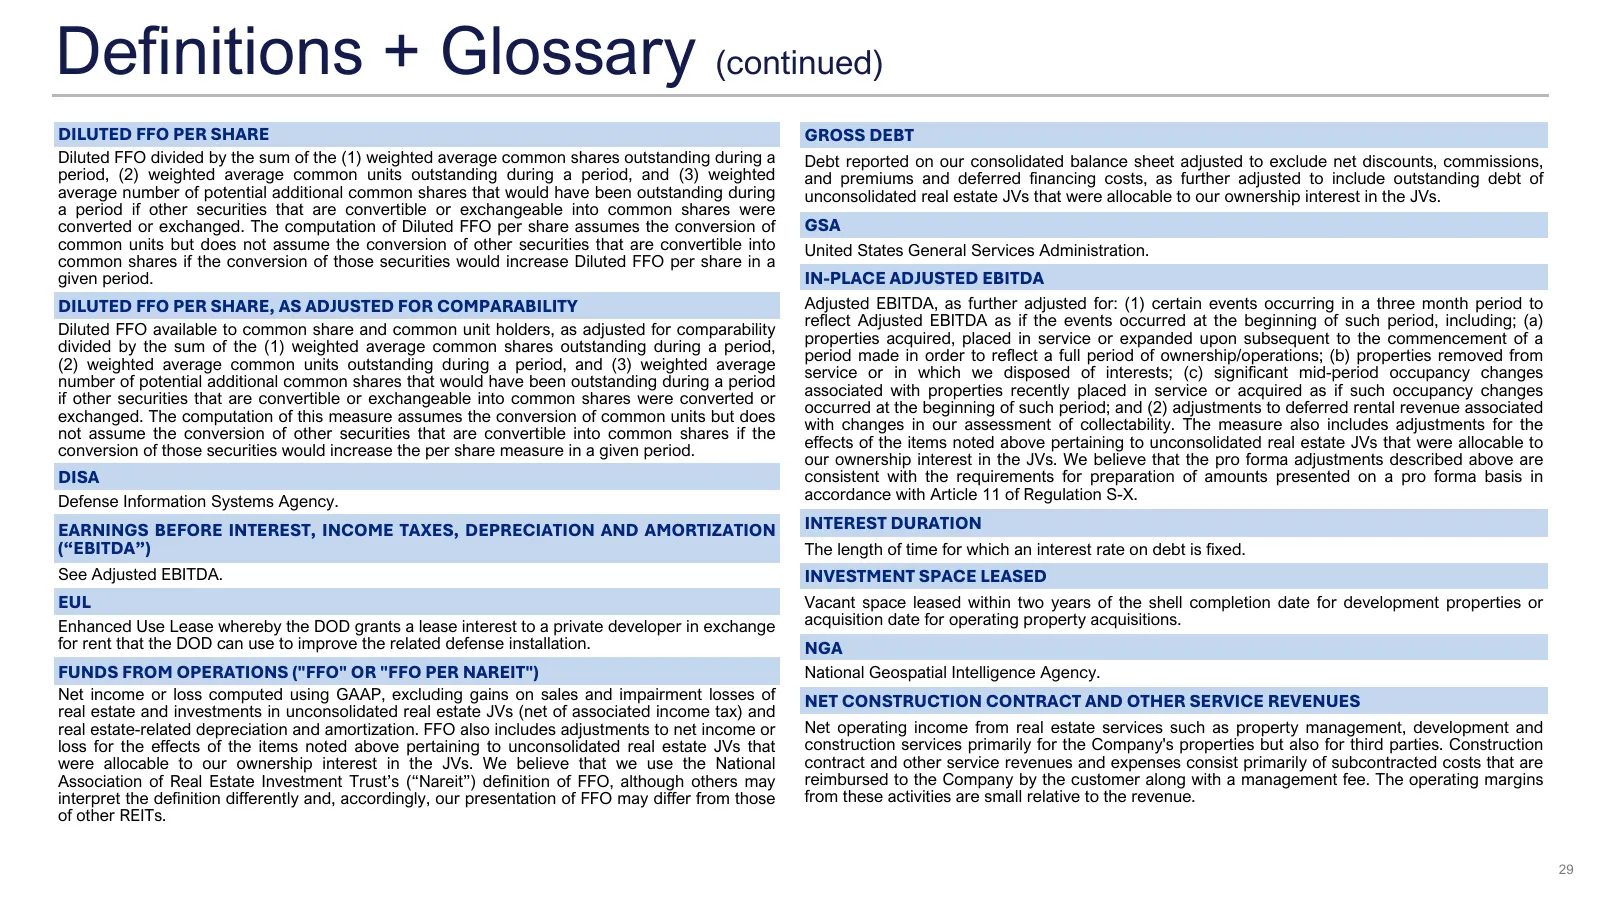
Definitions Definitions + Glossary + Glossary (continued)(continued) DILUTED FFO PER SHARE GROSS DEBT Diluted FFO divided by the sum of the (1) weighted average common shares outstanding during a Debt reported on our consolidated balance sheet adjusted to exclude net discounts, commissions, period,
Slide 30: Definitions + Glossary (continued)
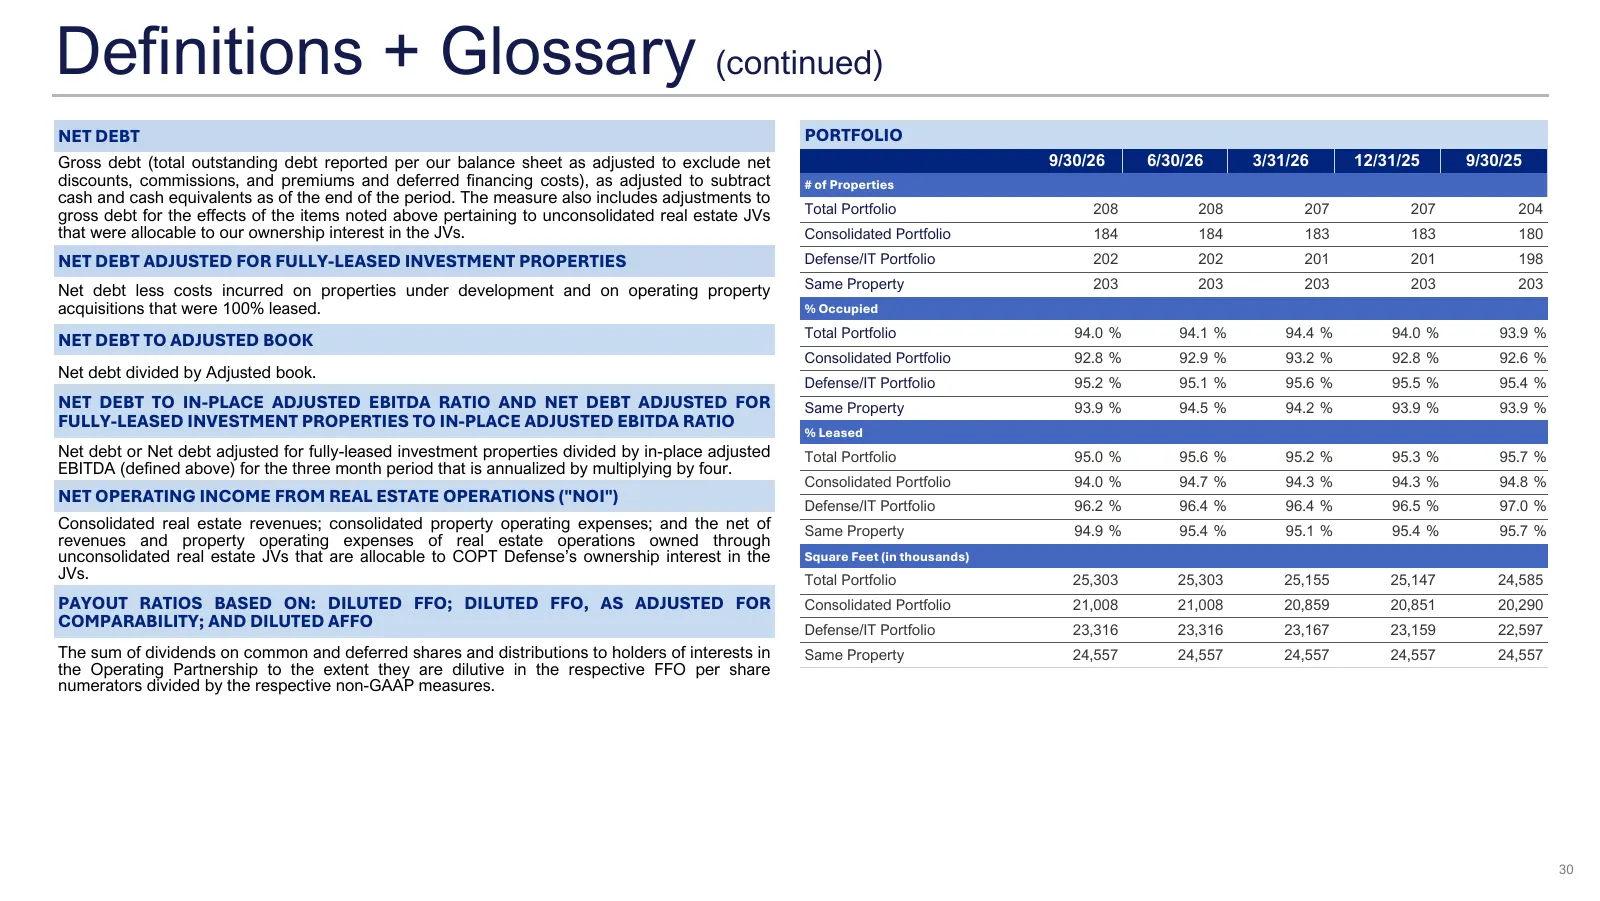
Definitions Definitions + Glossary + Glossary (continued)(continued) NET DEBT PORTFOLIO Gross debt (total outstanding debt reported per our balance sheet as adjusted to exclude net 9/30/26 6/30/26 3/31/26 12/31/25 9/30/25 discounts, commissions, and premiums and deferred financing costs), as adjuste
Slide 31: Definitions + Glossary (continued)
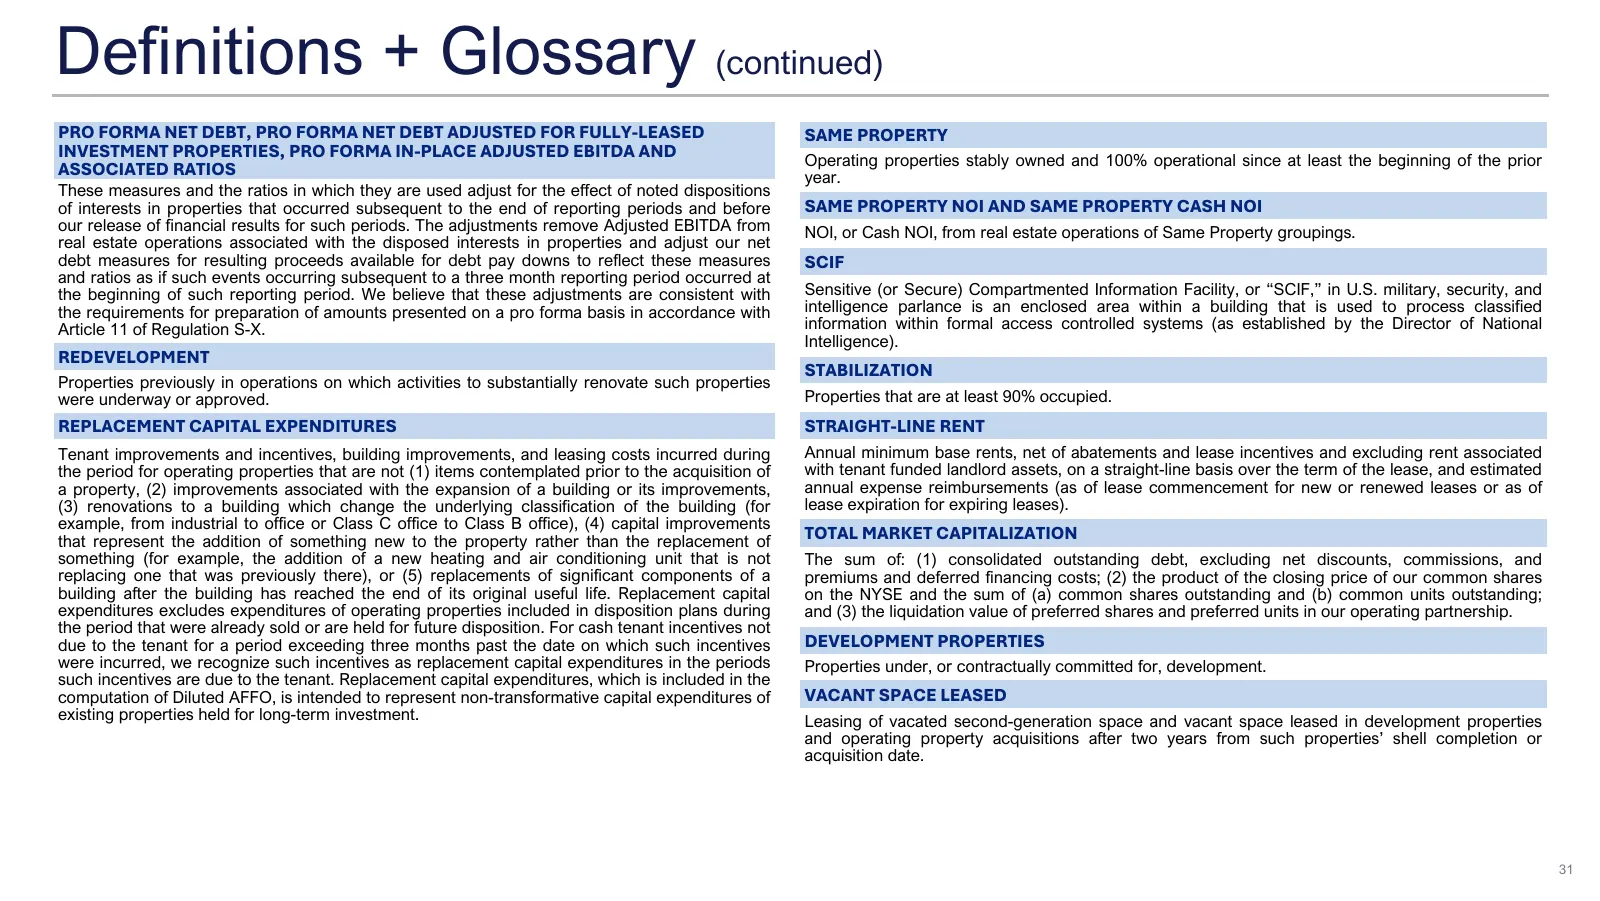
Definitions Definitions + Glossary + Glossary (continued)(continued) PRO FORMA NET DEBT, PRO FORMA NET DEBT ADJUSTED FOR FULLY-LEASED SAME PROPERTY INVESTMENT PROPERTIES, PRO FORMA IN-PLACE ADJUSTED EBITDA AND Operating properties stably owned and 100% operational since at least the beginning of the
Slide 32: Reconciliations
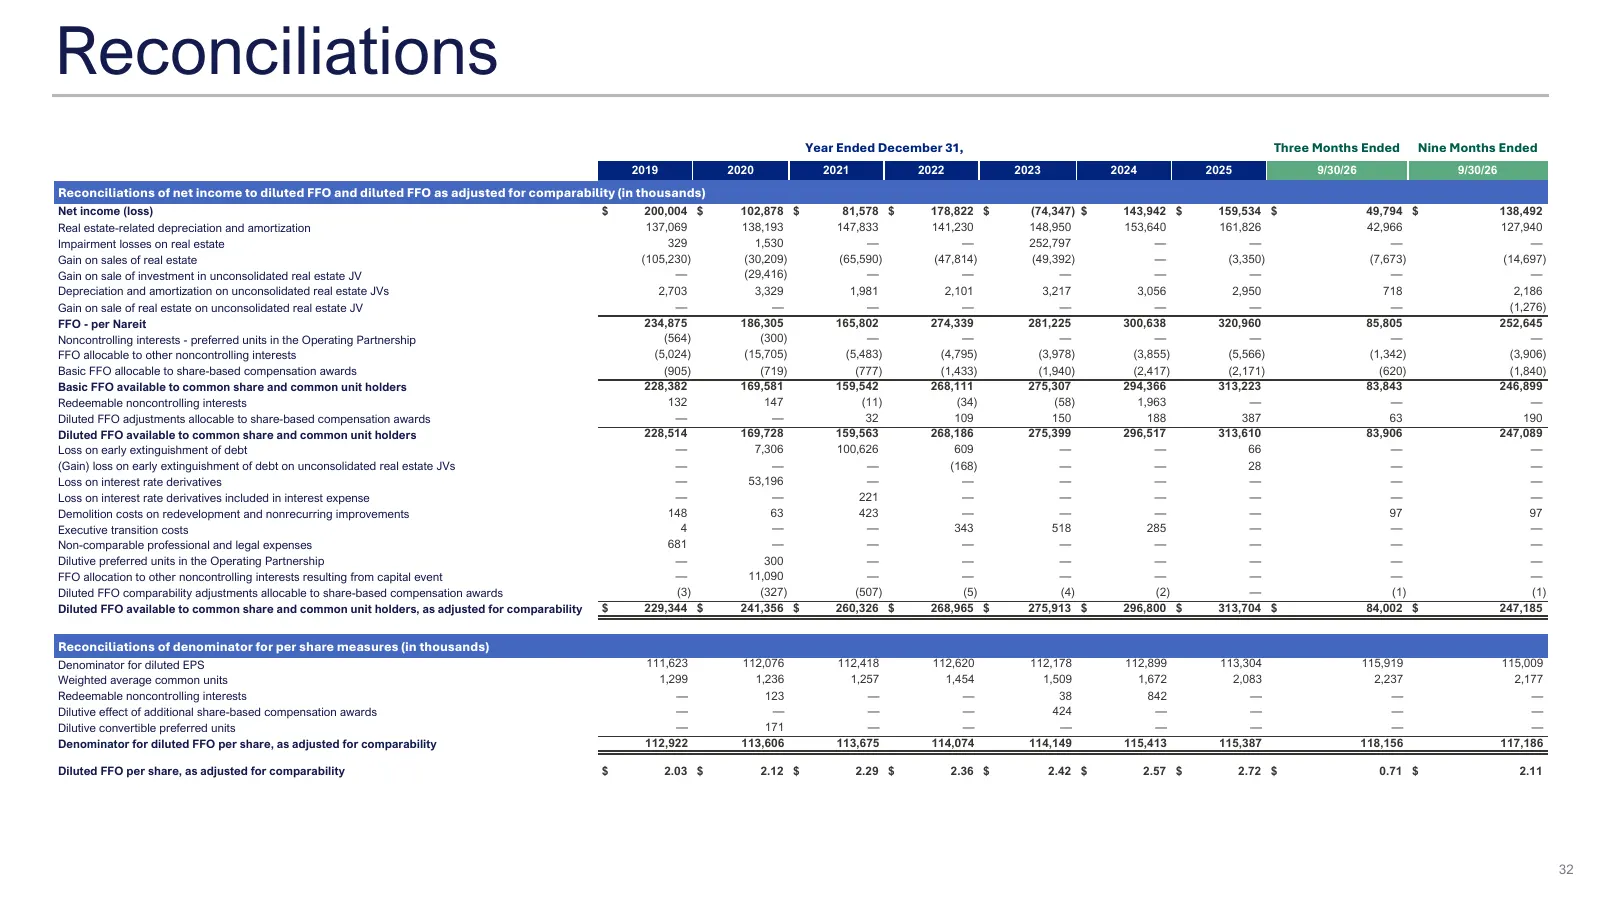
Reconciliations Reconciliations Year Ended December 31, Three Months Ended Nine Months Ended 2019 2020 2021 2022 2023 2024 2025 9/30/26 9/30/26 Reconciliations of net income to diluted FFO and diluted FFO as adjusted for comparability (in thousands) Net income (loss) $ 200,004 $ 102,878 $ 81,578 $ 1
Slide 33: Reconciliations (continued)
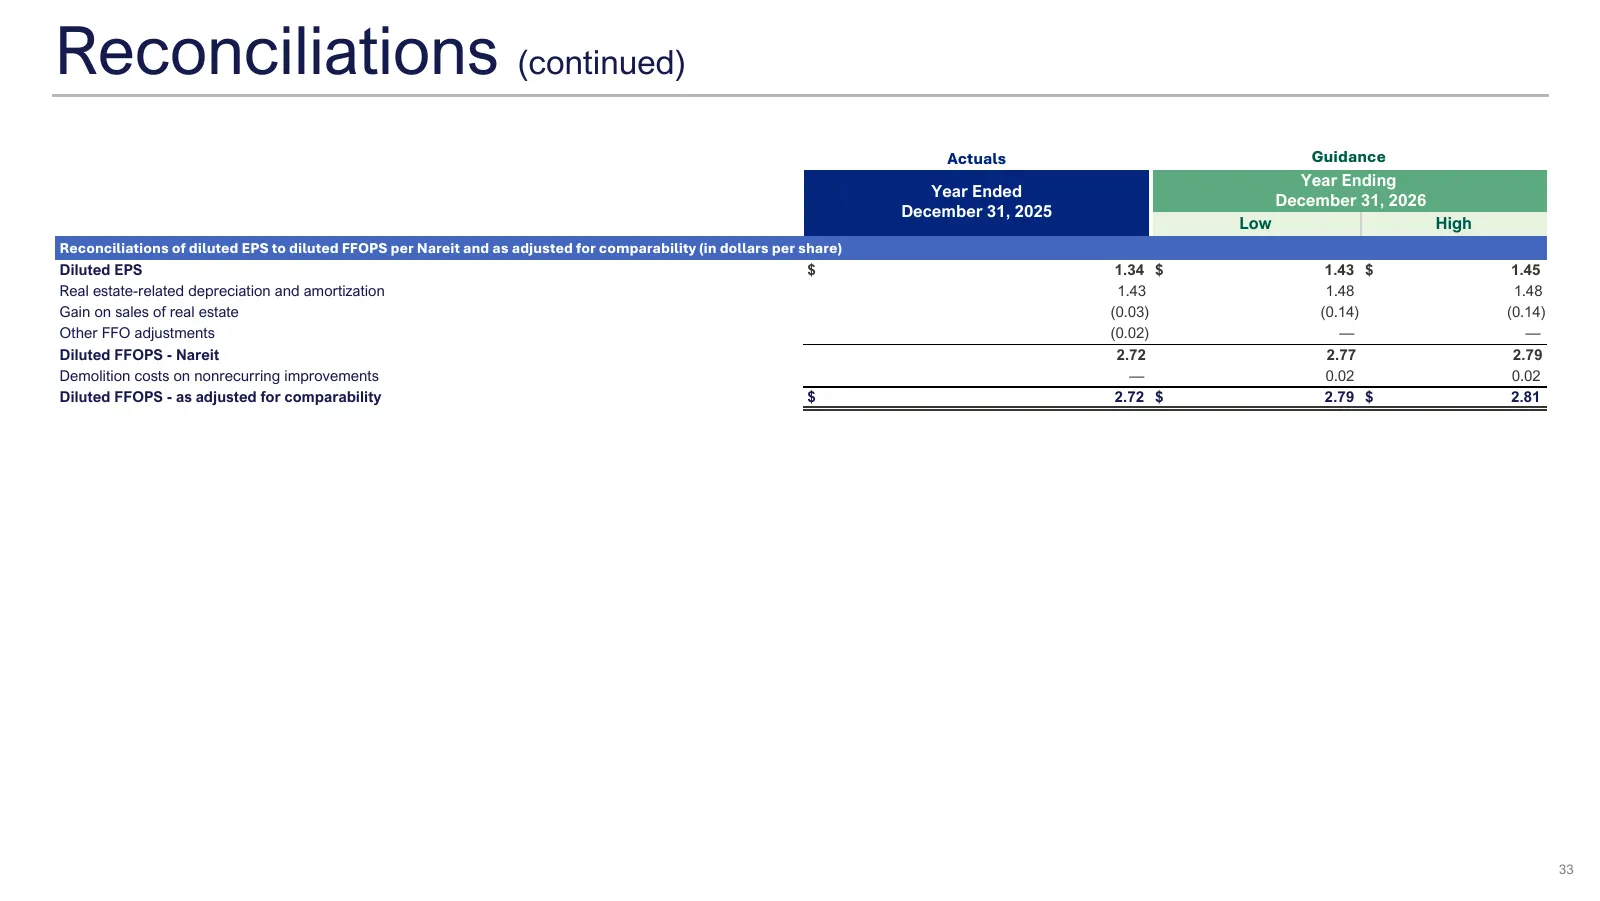
Reconciliations Reconciliations (continued) (continued) Actuals Guidance Year Ending Year Ended December 31, 2026 December 31, 2025 Low High Reconciliations of diluted EPS to diluted FFOPS per Nareit and as adjusted for comparability (in dollars per share) Diluted EPS $ 1.34 $ 1.43 $ 1.45 Real estat
Slide 34: Reconciliations (continued)
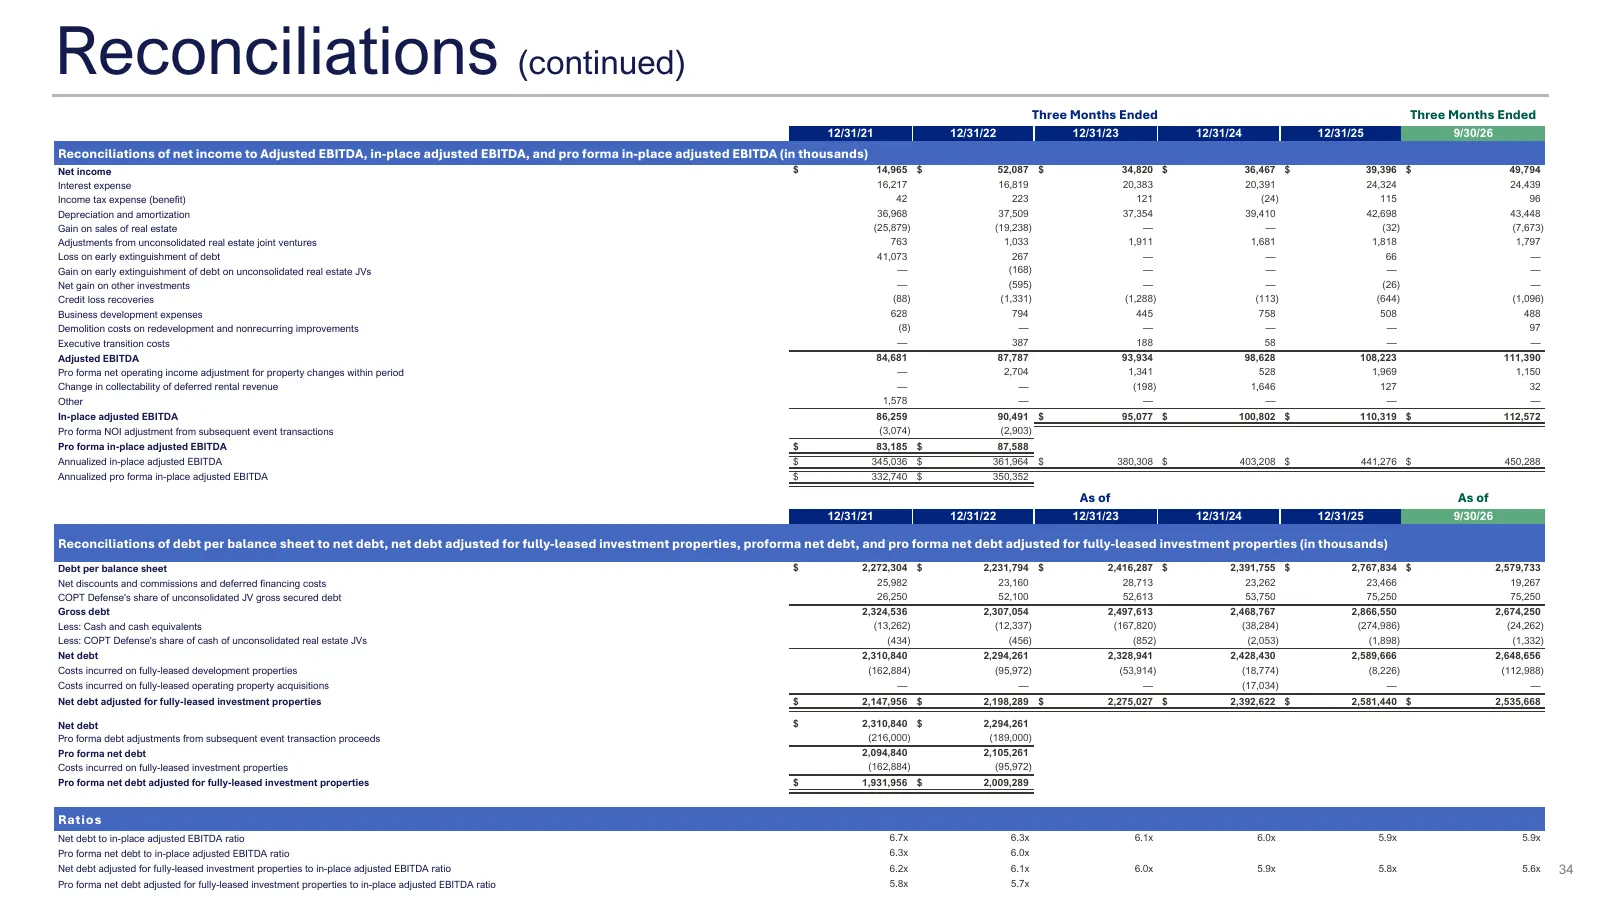
Reconciliations Reconciliations (continued) (continued) Three Months Ended Three Months Ended 12/31/21 12/31/22 12/31/23 12/31/24 12/31/25 9/30/26 Reconciliations of net income to Adjusted EBITDA, in-place adjusted EBITDA, and pro forma in-place adjusted EBITDA (in thousands) Net income $ 14,965 $ 5

Slide 35: INVESTORS.COPT.COM
} i mE rs F dai mie Sa | | ee wi Ee, " COPT DEFENSE INVESTORS.COPT.COM PROPERTIES
Source: company website
More decks from COPT Defense Properties
 Q3 2026 Earnings Presentation33 slides · Oct 29, 2026
 Evercore Real Estate Conference 202640 slides · September 2026
 Q2 2026 Earnings Presentation37 slides · Jul 28, 2026
 Nareit REITweek: 2026 Investor Conference40 slides · June 2026
 Shareholder Meeting (May 2026)24 slides · May 14, 2026
 Q1 2026 Earnings Presentation37 slides · Apr 28, 2026