Cytec Industries — Q1 2010 Earnings Presentation
15 slides from Cytec Industries's earnings presentation, Apr 23, 2010
Slide 1: First Quarter 2010 Earnings Review
First Quarter 2010 Earnings Review Shane Fleming – Chairman, President and CEO Dave Drillock – Vice President and CFO April 23, 2010
Slide 2: Forward Looking Statement
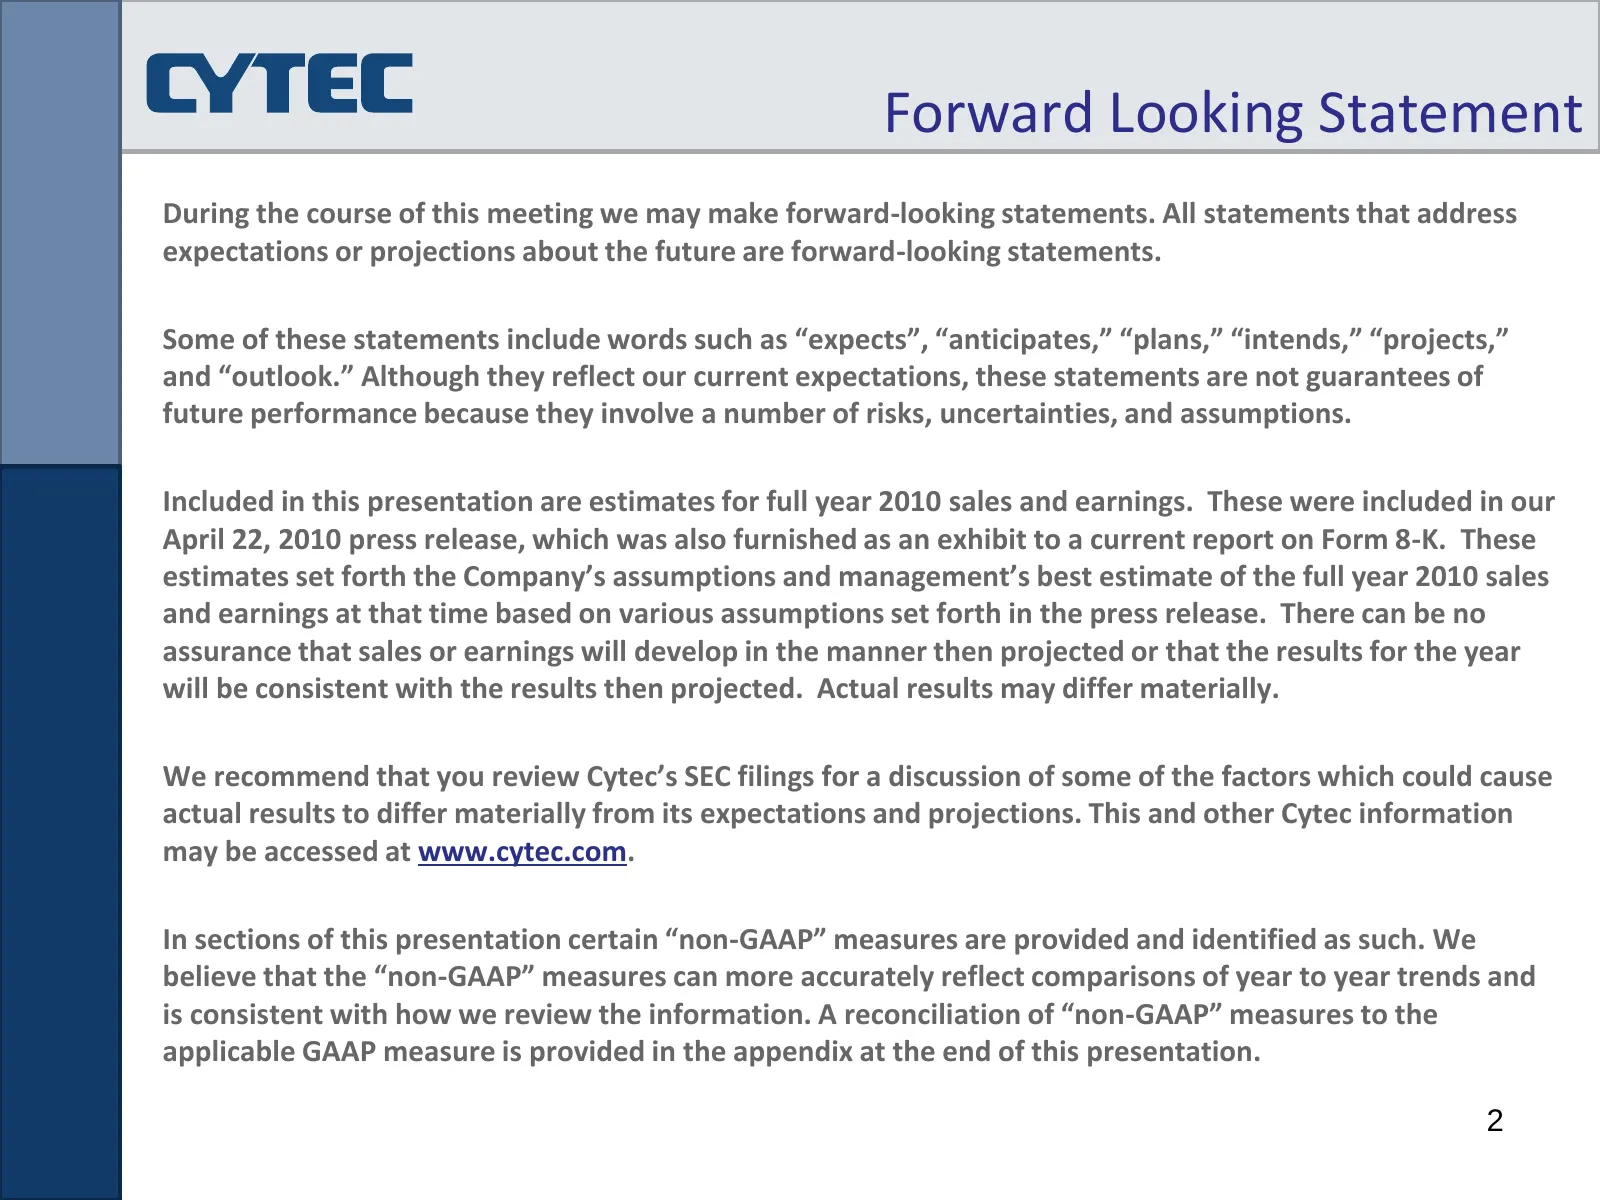
Forward Looking Statement During the course of this meeting we may make forward-looking statements. All statements that address expectations or projections about the future are forward-looking statements. Some of these statements include words such as “expects”, “anticipates,” “plans,” “intends,” “p
Slide 3: Results Overview
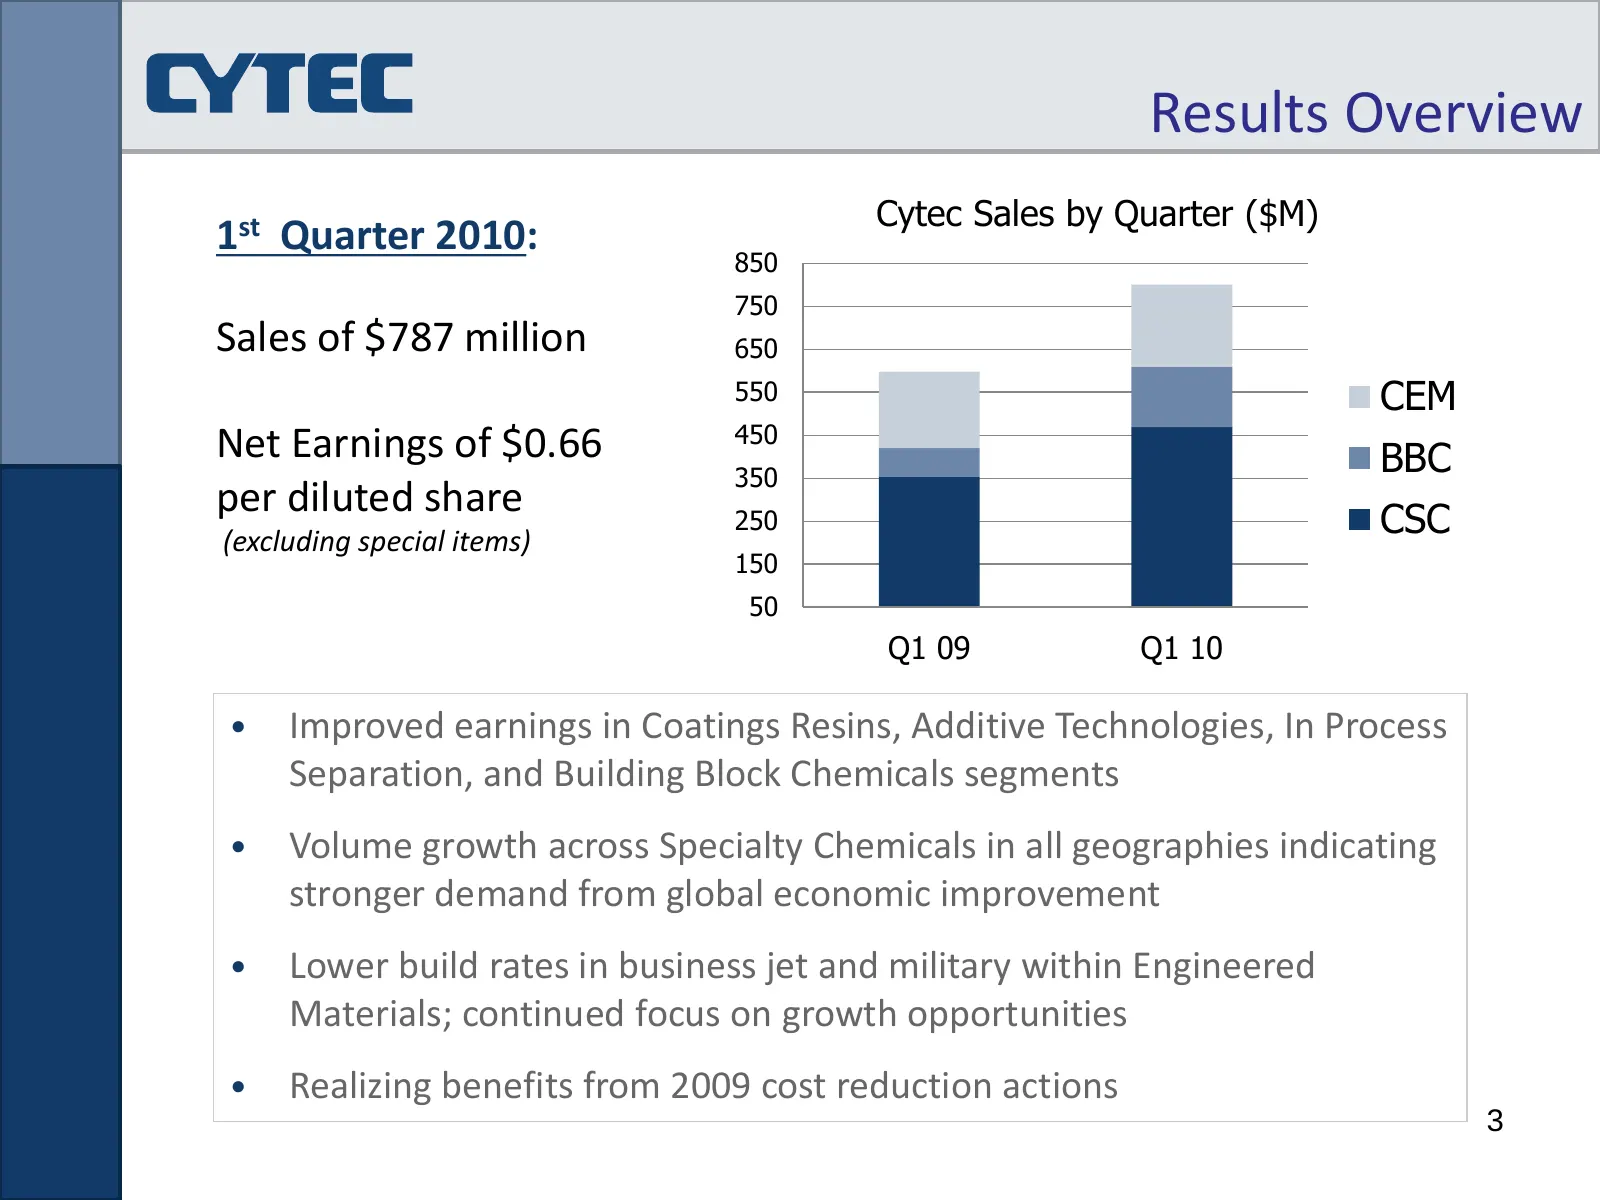
Results Overview Cytec Sales by Quarter ($M) 1st Quarter 2010: 850 750 Sales of $787 million 650 550 CEM Net Earnings of $0.66 450 350 BBC per diluted share 250 CSC (excluding special items) 150 50 Q1 09 Q1 10 • Improved earnings in Coatings Resins, Additive Technologies, In Process Separation, and
Slide 4: Business Segment Results: Coating Resins
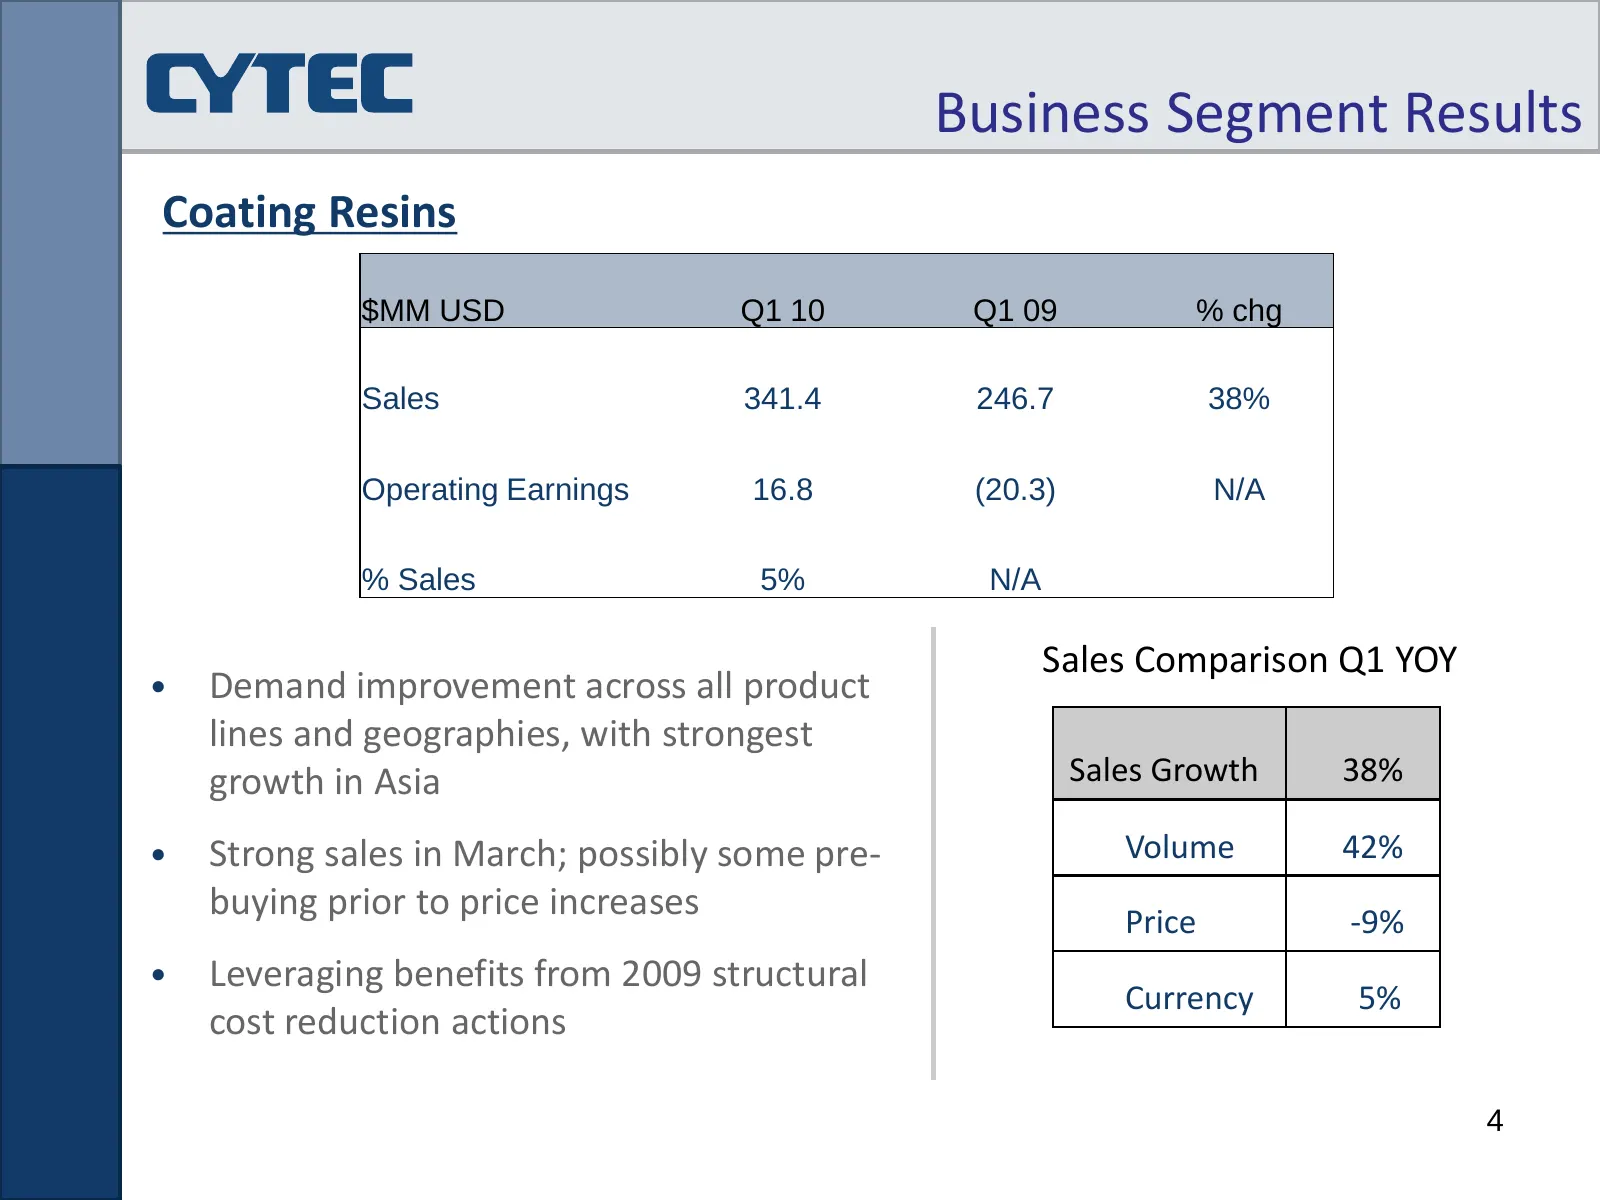
Business Segment Results Coating Resins $MM USD Q1 10 Q1 09 % chg Sales 341.4 246.7 38% Operating Earnings 16.8 (20.3) N/A % Sales 5% N/A Sales Comparison Q1 YOY • Demand improvement across all product lines and geographies, with strongest growth in Asia Sales Growth 38% • Strong sales in March; pos
Slide 5: Coating Resins Monthly Sales Trend
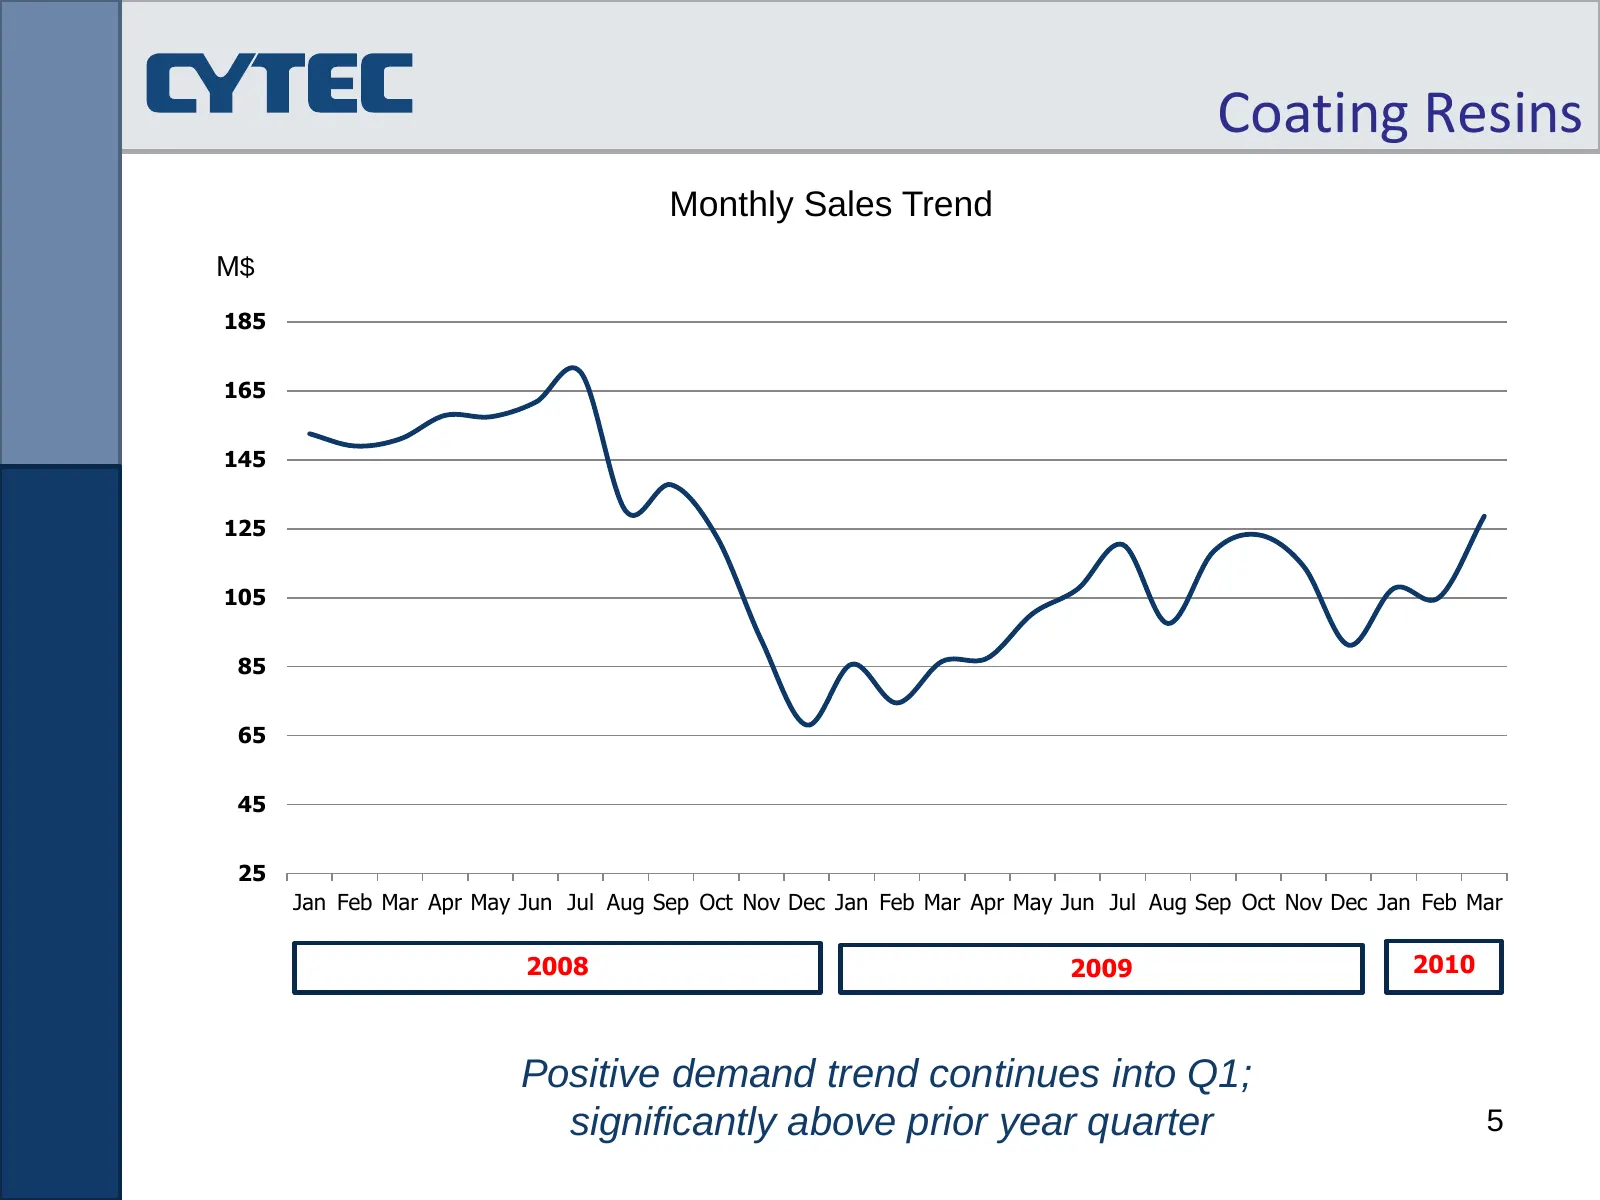
Coating Resins Monthly Sales Trend M$ 185 165 145 125 105 85 65 45 25 Jan Feb Mar Apr May Jun Jul Aug Sep Oct Nov Dec Jan Feb Mar Apr May Jun Jul Aug Sep Oct Nov Dec Jan Feb Mar 2008 2009 2010 Positive demand trend continues into Q1; significantly above prior year quarter 5
Slide 6: Business Segment Results: Additive Technologies
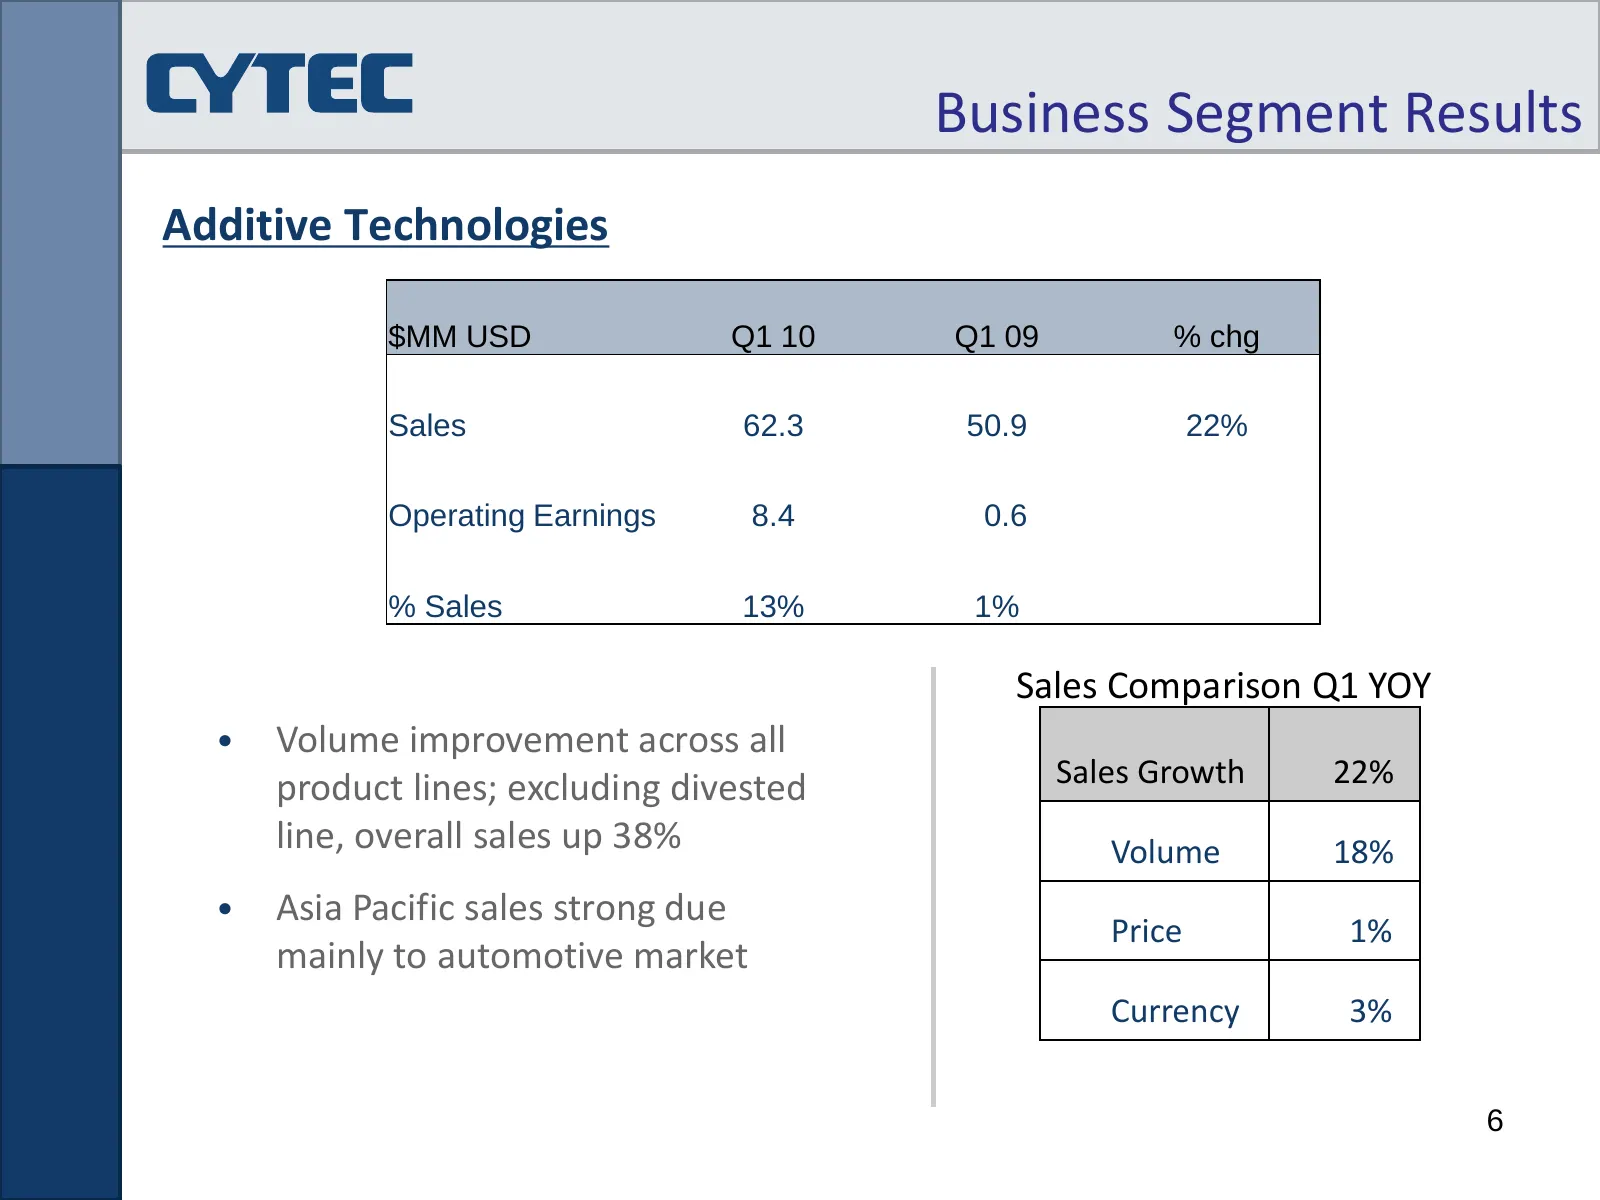
Business Segment Results Additive Technologies $MM USD Q1 10 Q1 09 % chg Sales 62.3 50.9 22% Operating Earnings 8.4 0.6 % Sales 13% 1% Sales Comparison Q1 YOY • Volume improvement across all product lines; excluding divested Sales Growth 22% line, overall sales up 38% Volume 18% • Asia Pacific sales
Slide 7: Business Segment Results: In Process Separation
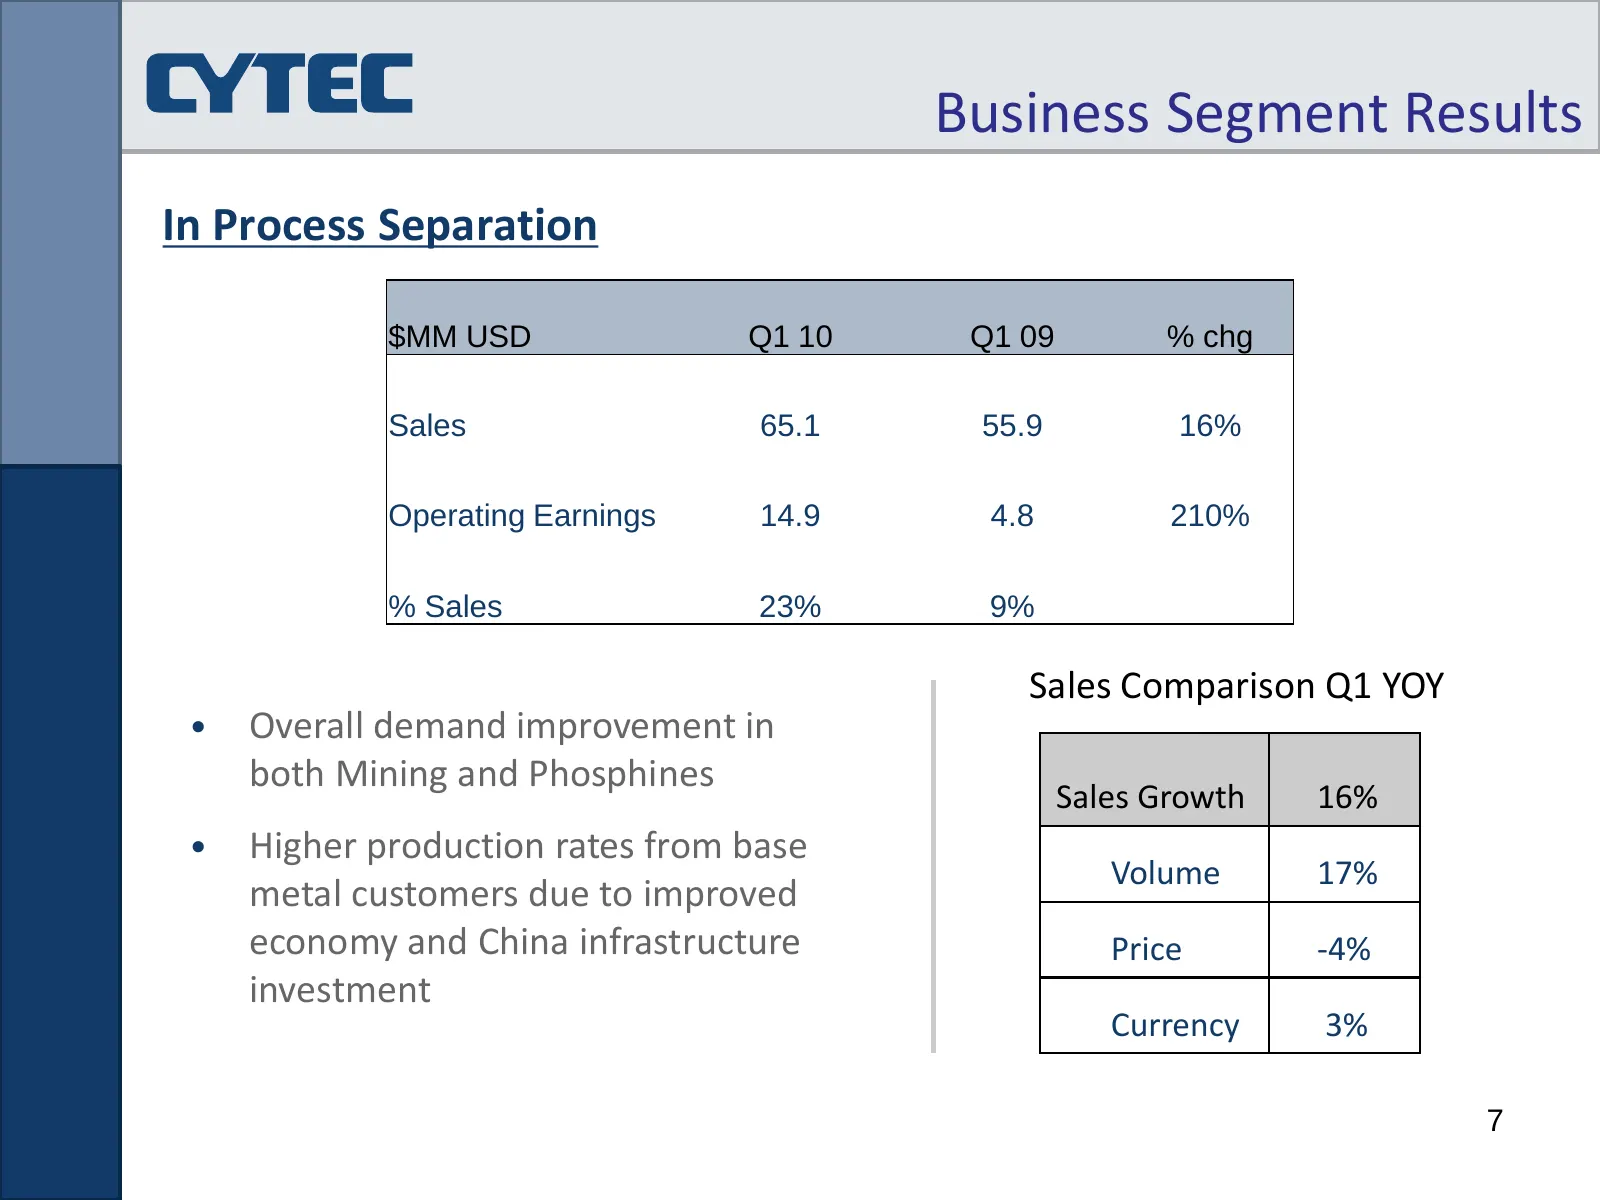
Business Segment Results In Process Separation $MM USD Q1 10 Q1 09 % chg Sales 65.1 55.9 16% Operating Earnings 14.9 4.8 210% % Sales 23% 9% Sales Comparison Q1 YOY • Overall demand improvement in both Mining and Phosphines Sales Growth 16% • Higher production rates from base Volume 17% metal custom
Slide 8: Business Segment Results: Engineered Materials
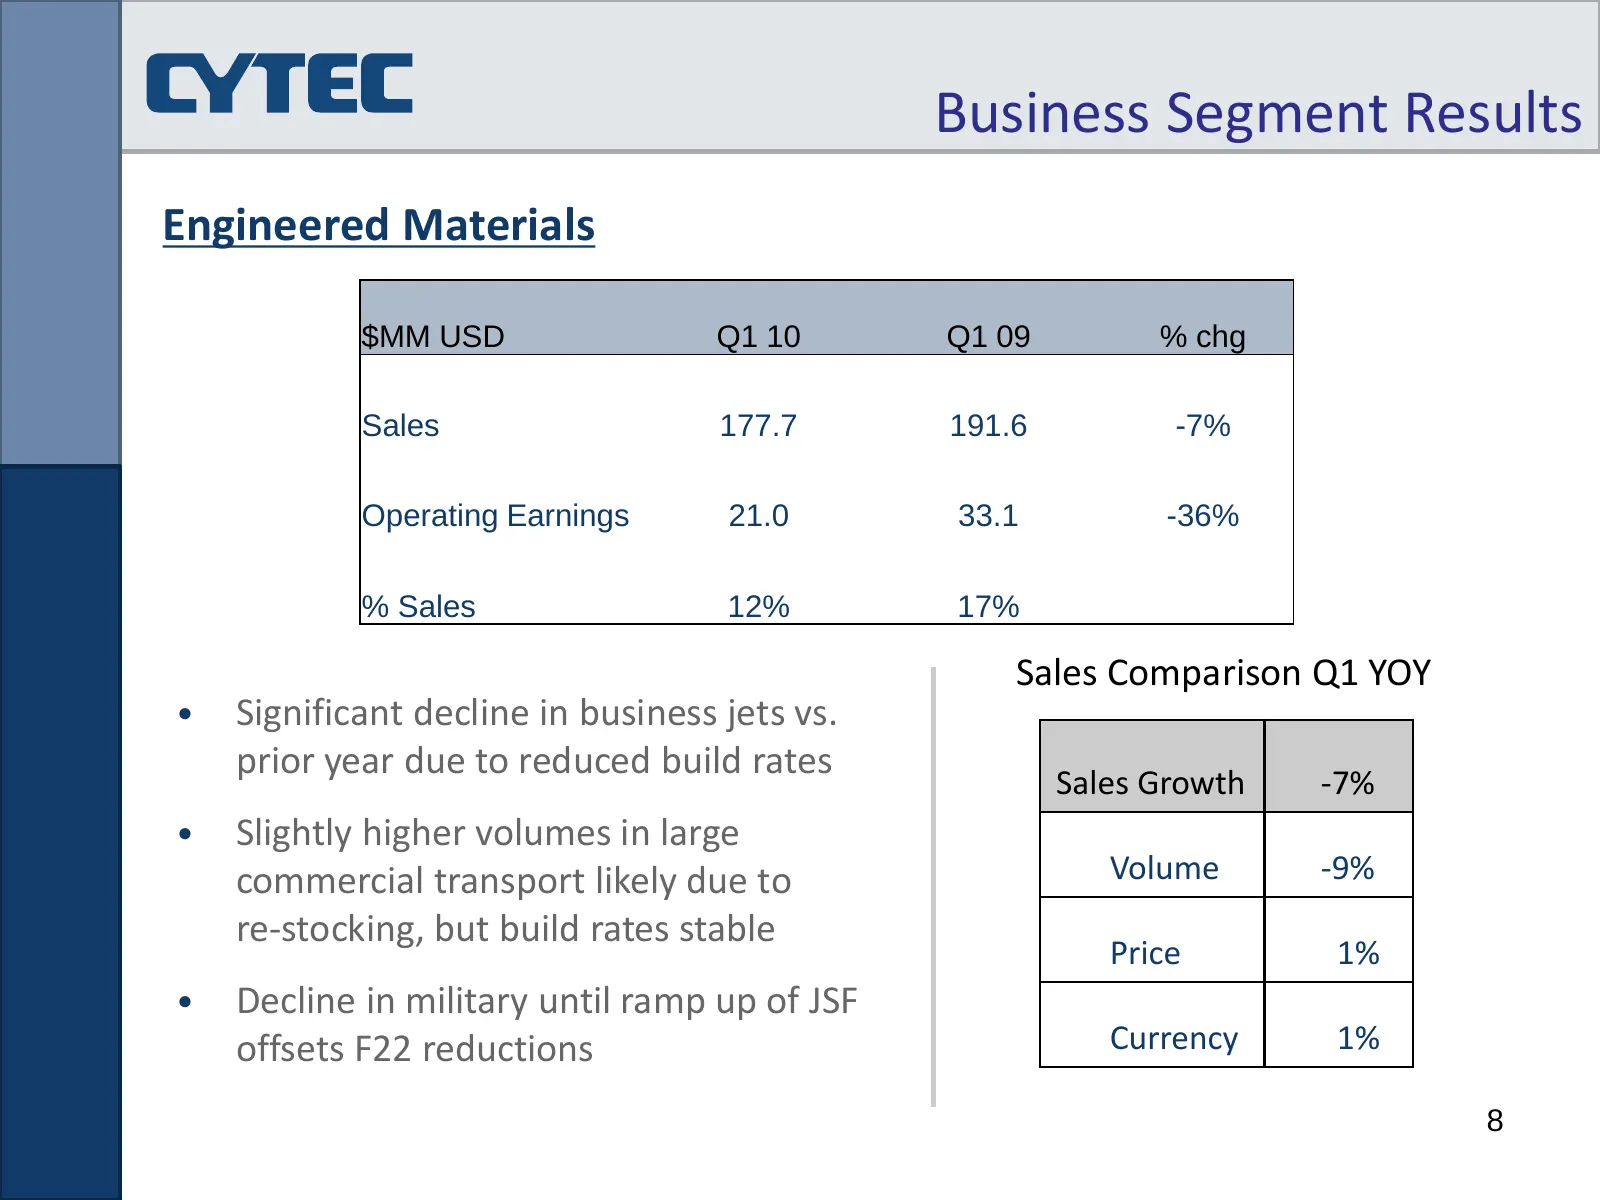
Business Segment Results Engineered Materials $MM USD Q1 10 Q1 09 % chg Sales 177.7 191.6 -7% Operating Earnings 21.0 33.1 -36% % Sales 12% 17% Sales Comparison Q1 YOY • Significant decline in business jets vs. prior year due to reduced build rates Sales Growth -7% • Slightly higher volumes in large
Slide 9: Business Segment Results: Building Block Chemicals
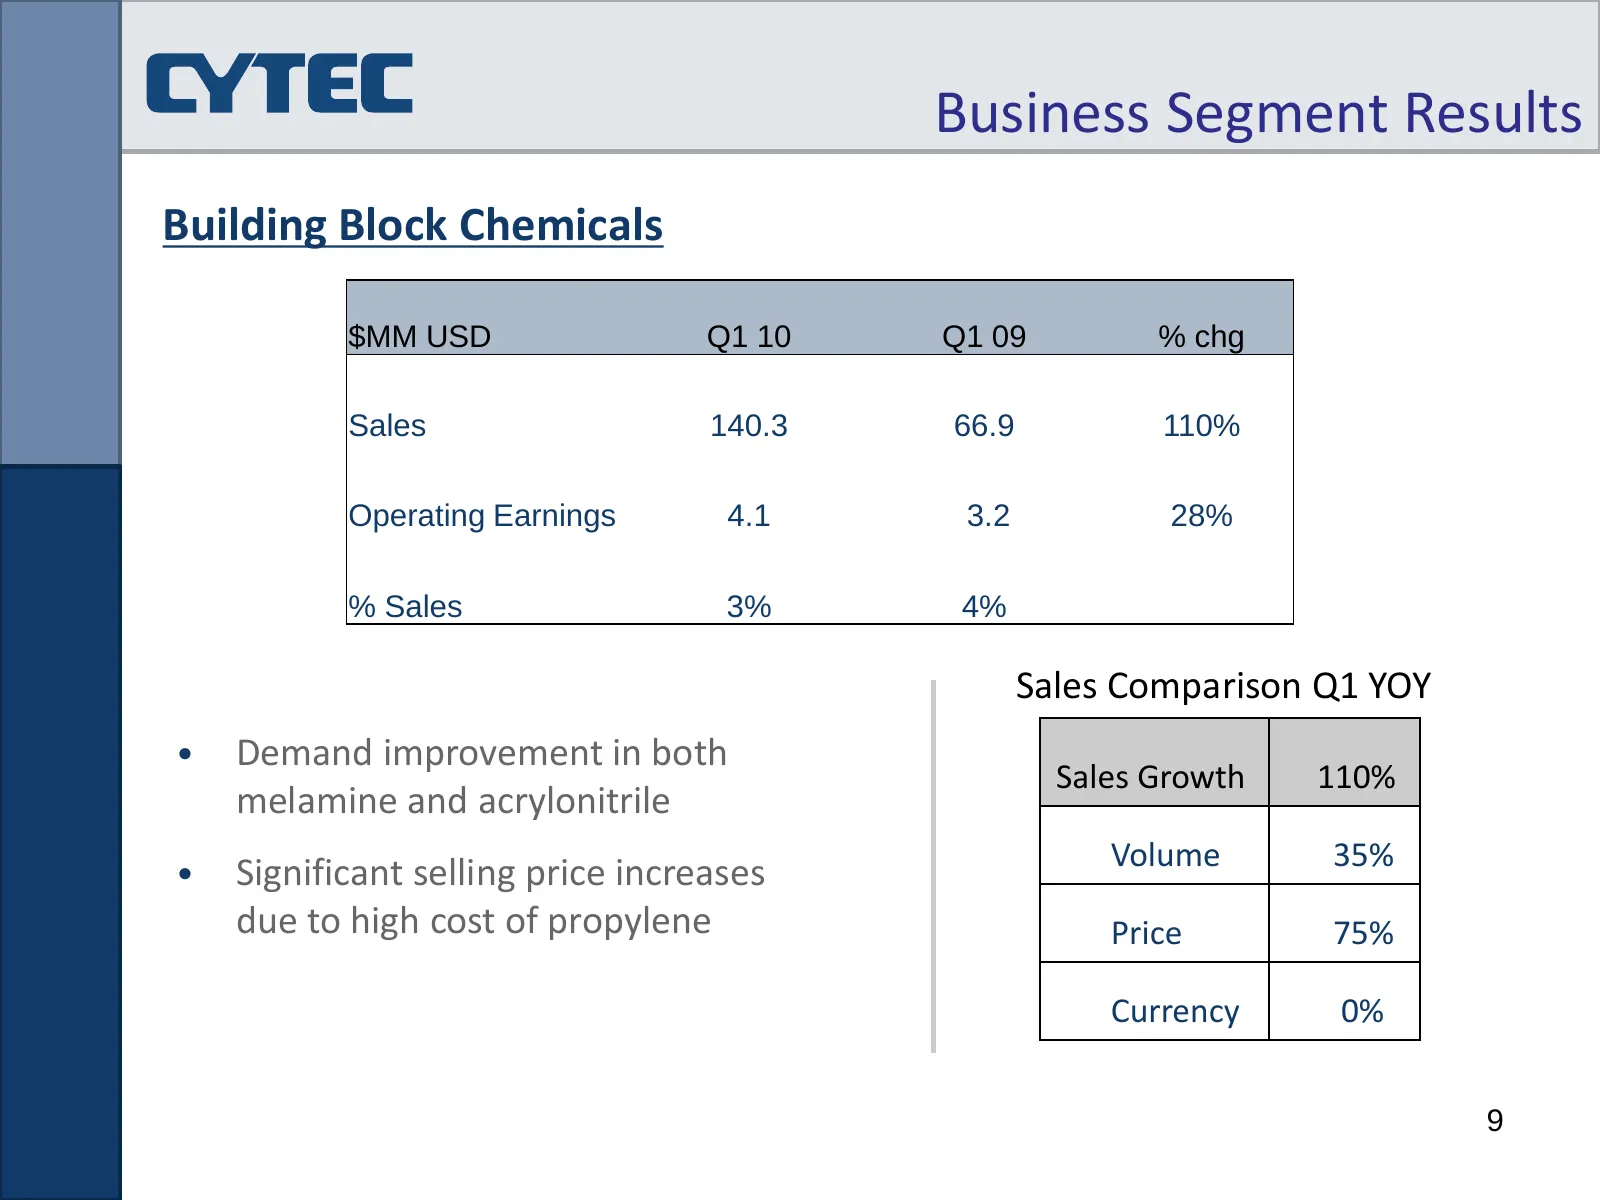
Business Segment Results Building Block Chemicals $MM USD Q1 10 Q1 09 % chg Sales 140.3 66.9 110% Operating Earnings 4.1 3.2 28% % Sales 3% 4% Sales Comparison Q1 YOY • Demand improvement in both Sales Growth 110% melamine and acrylonitrile Volume 35% • Significant selling price increases due to hig
Slide 10: Financial Results
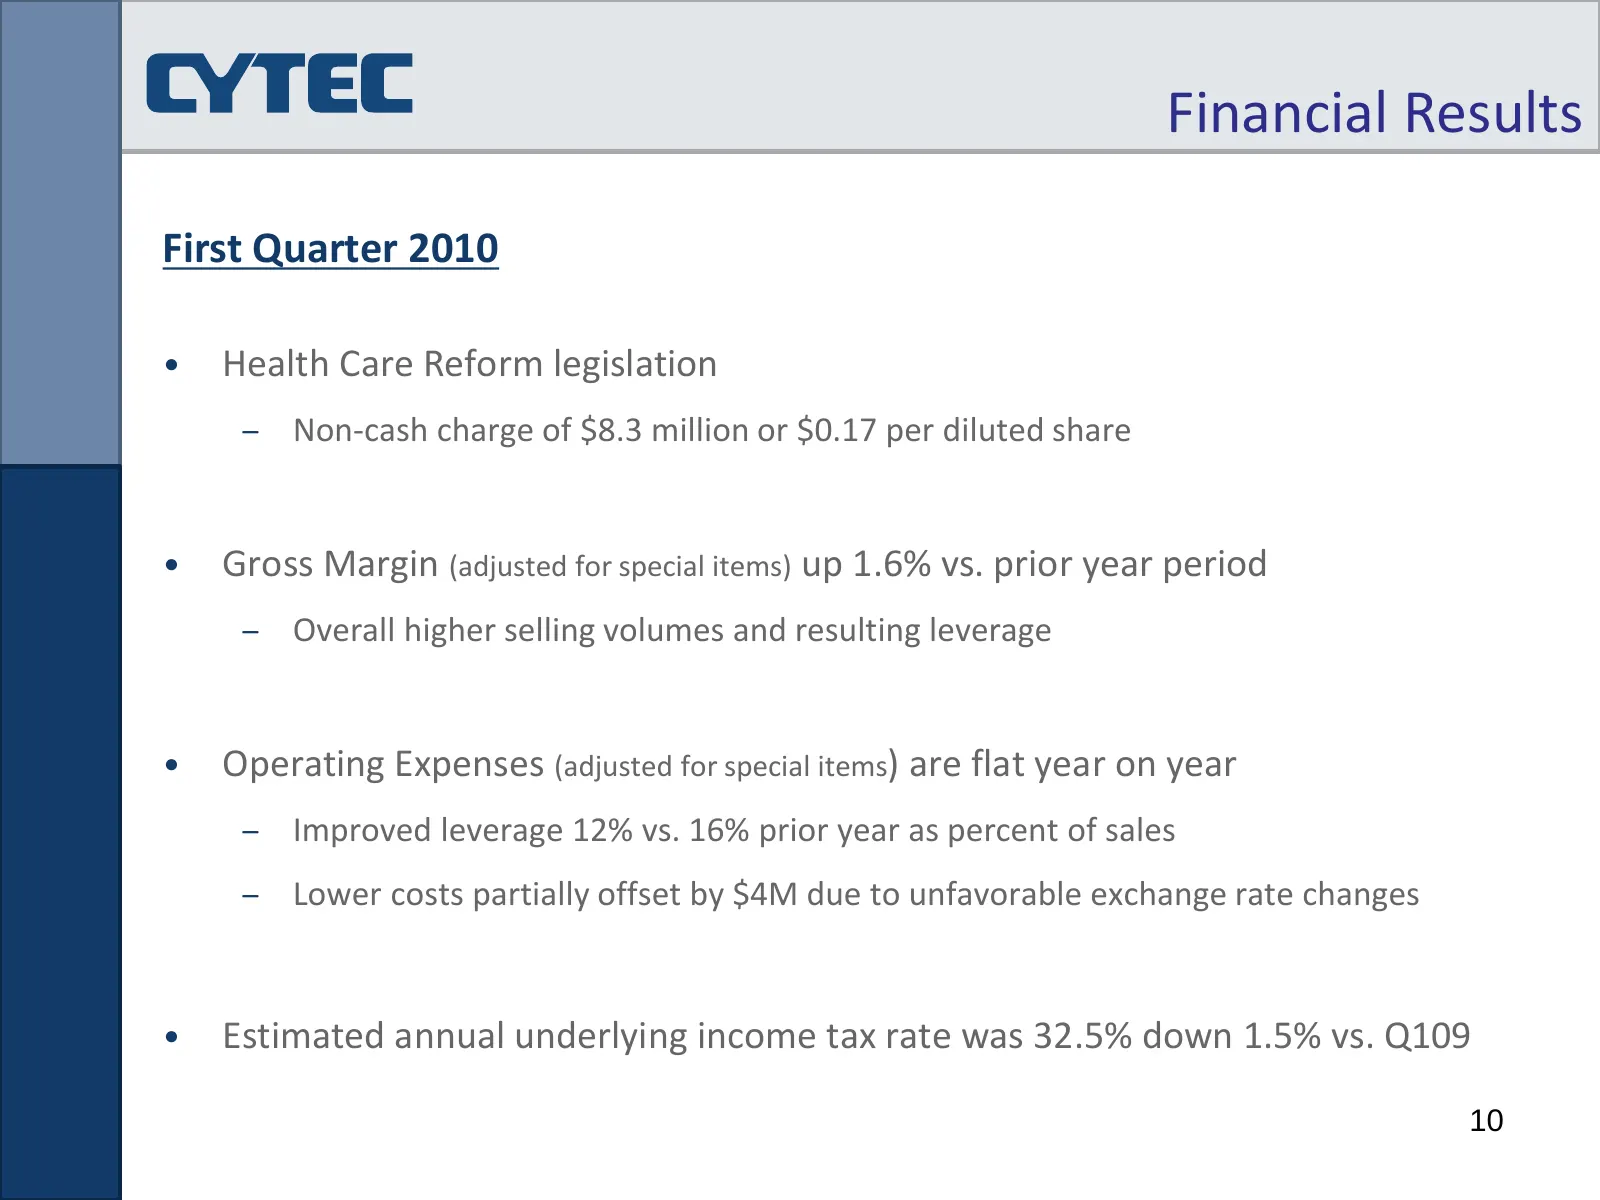
Financial Results First Quarter 2010 • Health Care Reform legislation – Non-cash charge of $8.3 million or $0.17 per diluted share • Gross Margin (adjusted for special items) up 1.6% vs. prior year period – Overall higher selling volumes and resulting leverage • Operating Expenses (adjusted for spec
Slide 11: Cash Flow
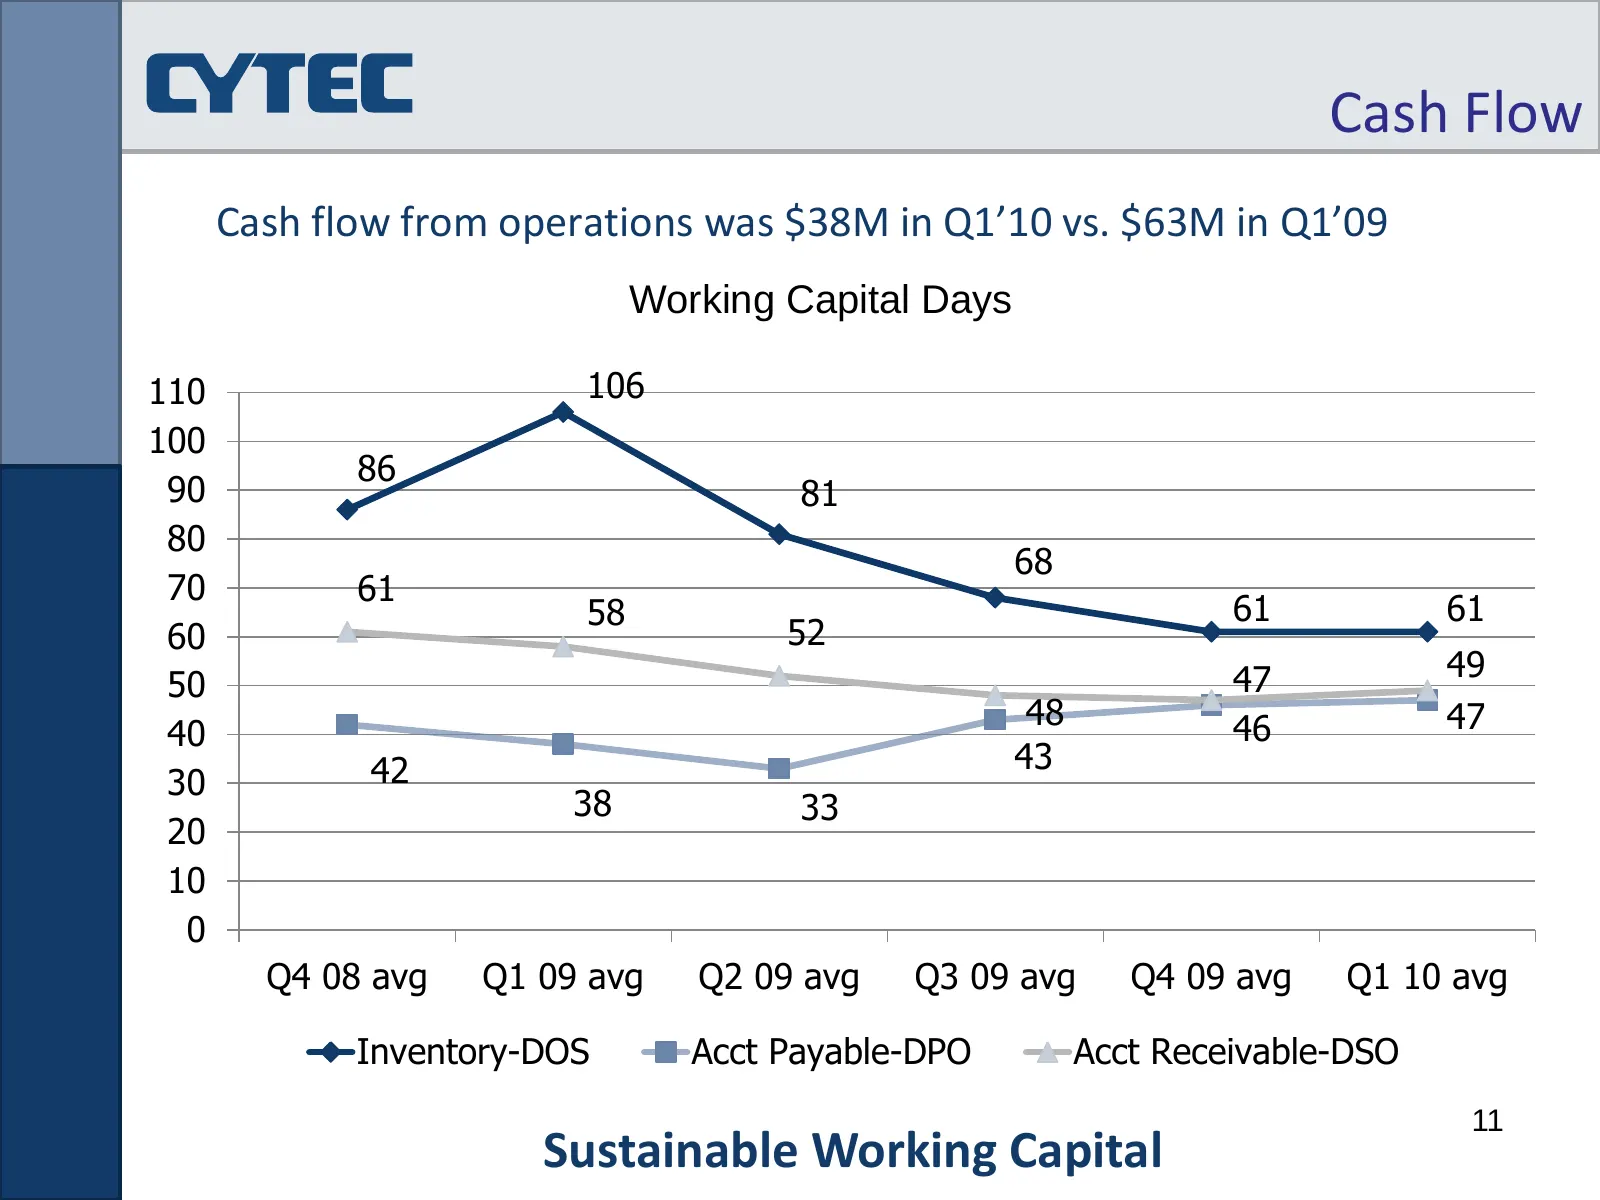
Cash Flow Cash flow from operations was $38M in Q1’10 vs. $63M in Q1’09 Working Capital Days 110 106 100 86 90 81 80 68 70 61 58 61 61 60 52 47 49 50 48 46 47 40 42 43 30 38 33 20 10 0 Q4 08 avg Q1 09 avg Q2 09 avg Q3 09 avg Q4 09 avg Q1 10 avg Inventory-DOS Acct Payable-DPO Acct Receivable-DSO 11 S
Slide 12: Balance Sheet
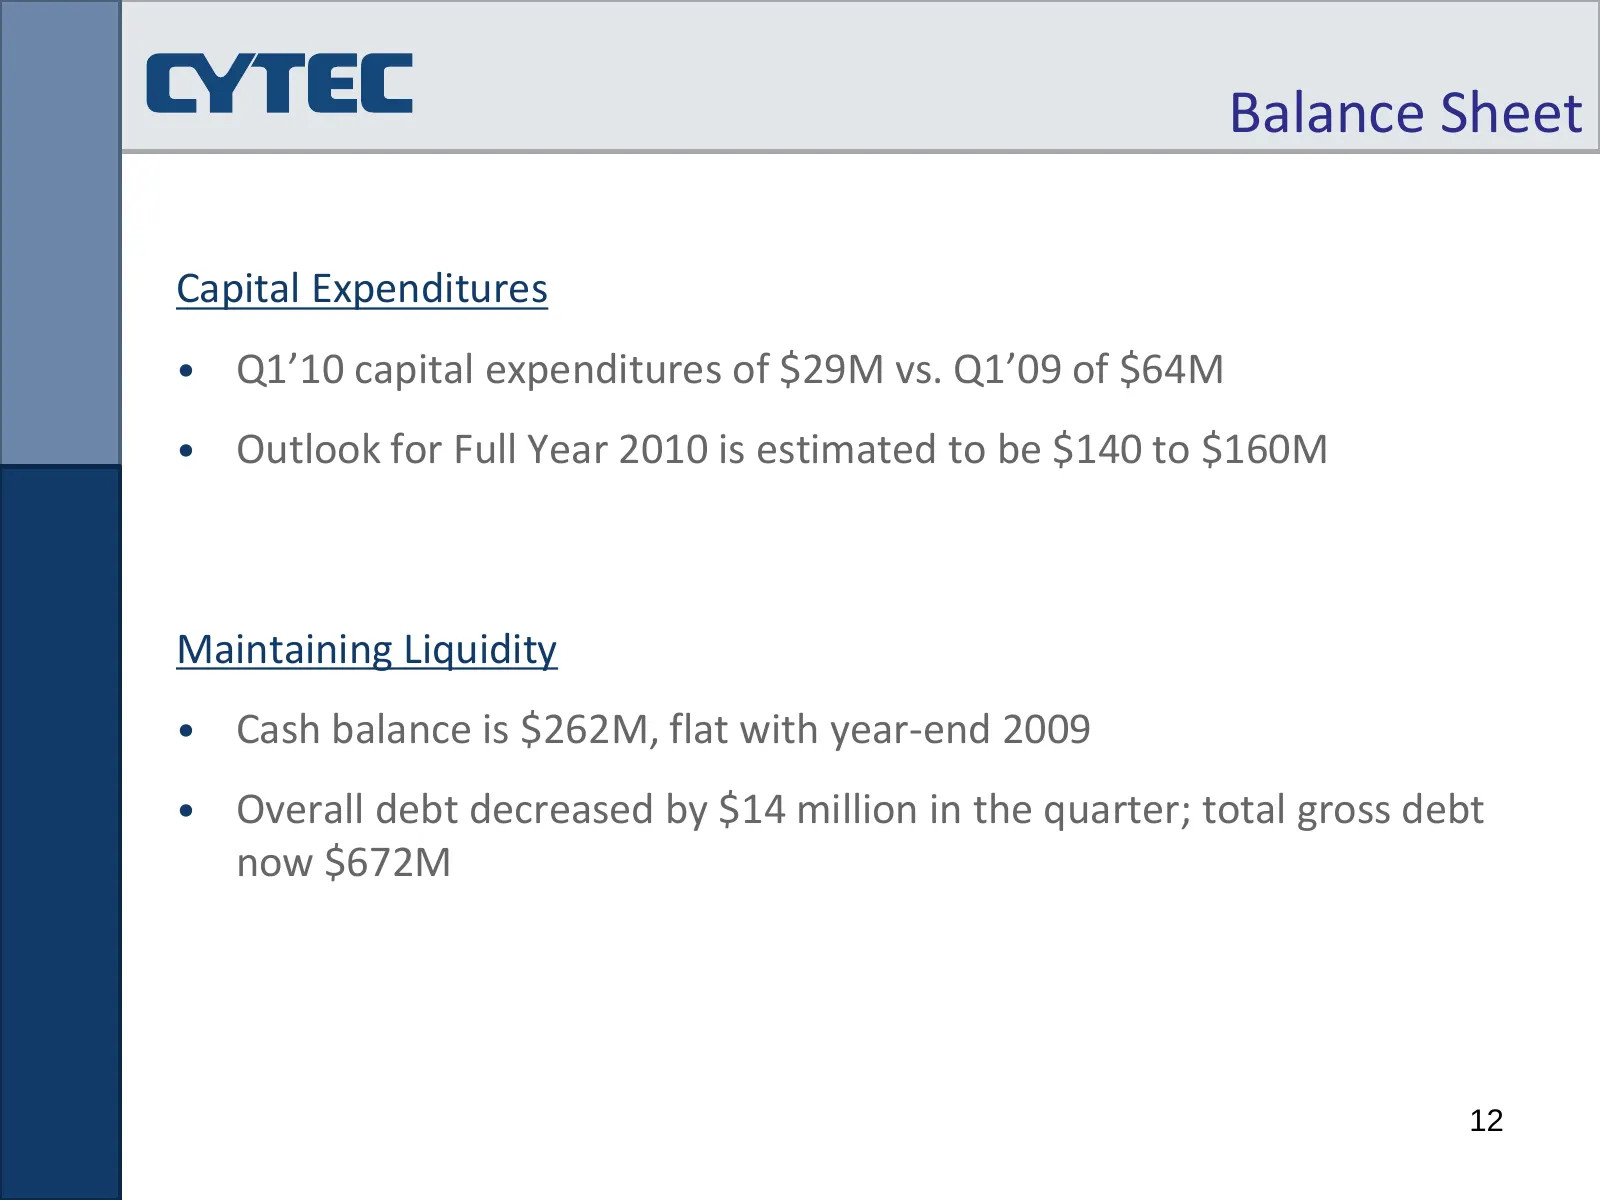
Balance Sheet Capital Expenditures • Q1’10 capital expenditures of $29M vs. Q1’09 of $64M • Outlook for Full Year 2010 is estimated to be $140 to $160M Maintaining Liquidity • Cash balance is $262M, flat with year-end 2009 • Overall debt decreased by $14 million in the quarter; total gross debt now
Slide 13: 2010 Outlook
2010 Outlook Outlook for 2010 full year adjusted EPS is $1.90 to $2.40 with possibility of modestly exceeding the high end of the guidance. Factors include: • Sustainability of economic recovery • Raw material price increases • Raw material supply shortages 13
Slide 14: Cytec: Delivering Technology Beyond Our Customers' Imagination
CYTEC Delivering Technology Beyond Our Customers’ Imagination™ CYT : NYSE
Slide 15: Appendix: Reconciliation of Non-GAAP Measures to GAAP Measures
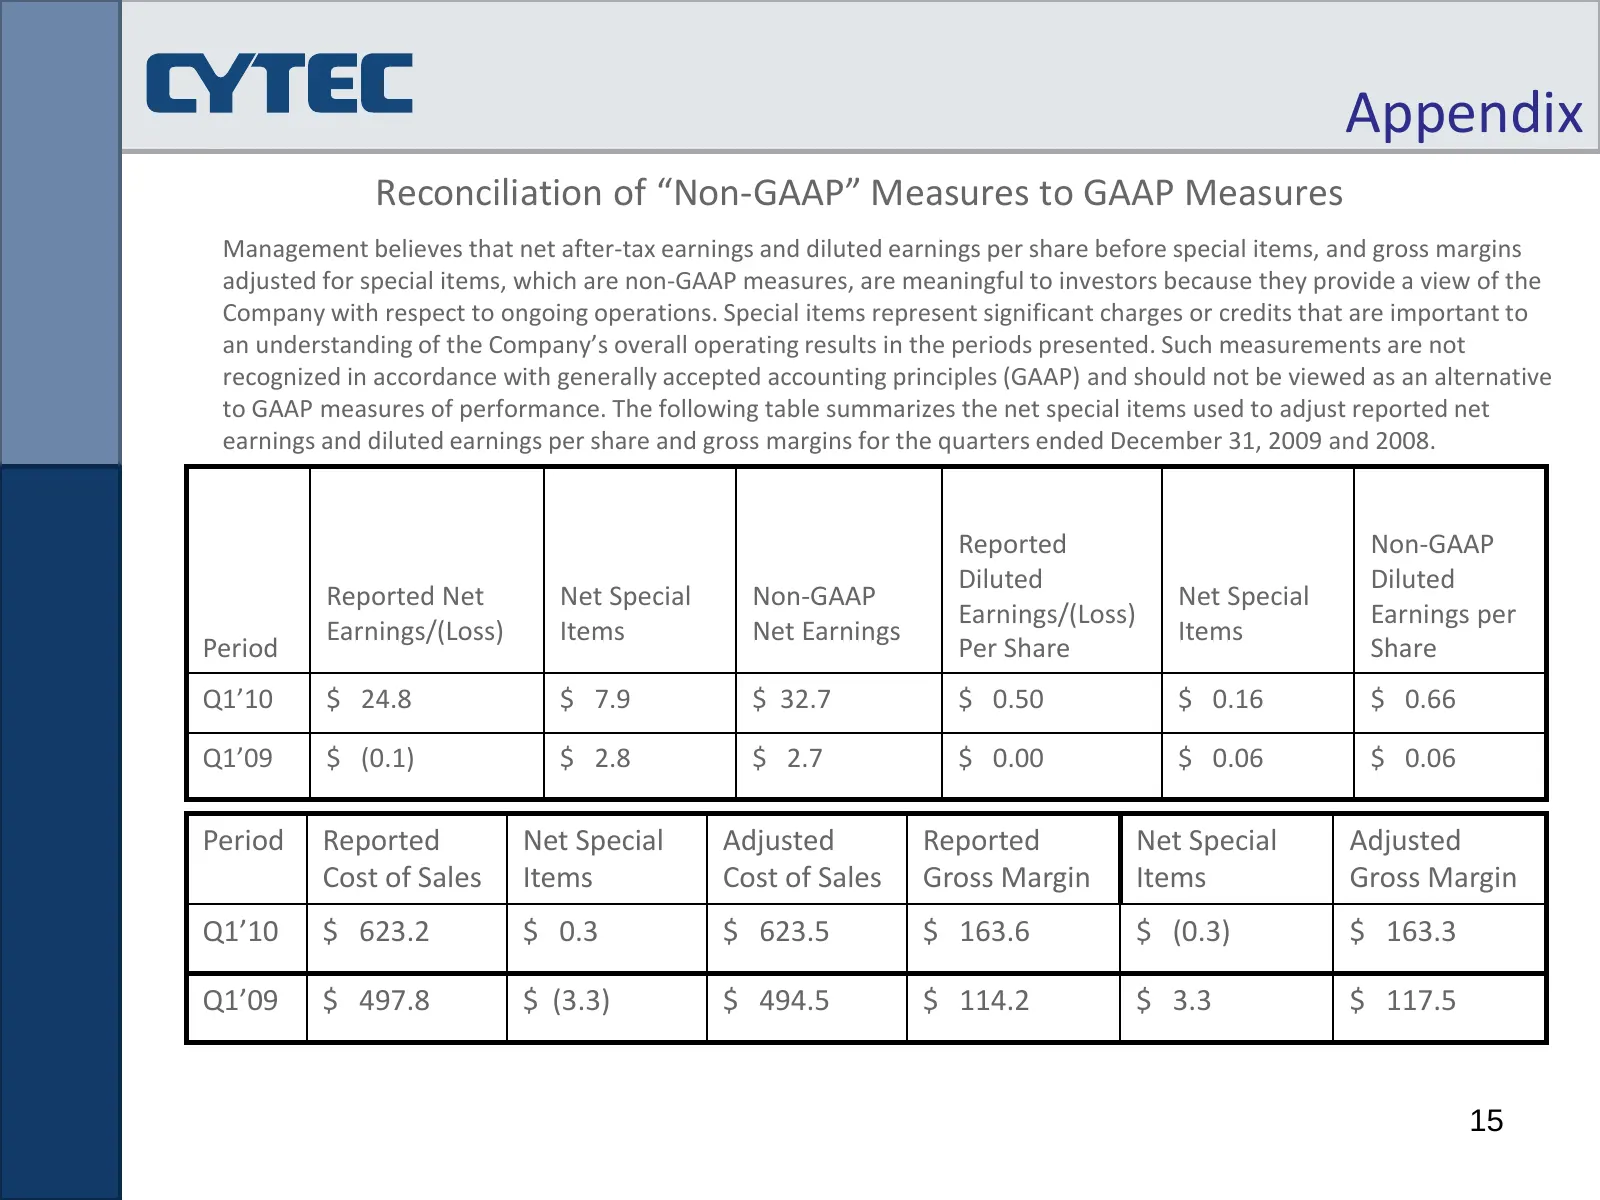
Appendix Reconciliation of “Non‐GAAP” Measures to GAAP Measures Management believes that net after‐tax earnings and diluted earnings per share before special items, and gross margins adjusted for special items, which are non‐GAAP measures, are meaningful to investors because they provide a view of t
Source: Internet Archive copy of solvay.com
More decks from Cytec Industries Inc
 Q2 2015 Earnings Presentation12 slides · Jul 17, 2015
 Q1 2015 Earnings Presentation12 slides · April 2015
 Q4 2014 Earnings Presentation14 slides · Jan 28, 2015
 Q3 2014 Earnings Presentation14 slides · Oct 17, 2014
 Q2 2014 Earnings Presentation14 slides · Jul 18, 2014
 Q1 2014 Earnings Presentation13 slides · Apr 23, 2014