Ascom Holding AG · SIX:ASCN
Ascom — Investor Presentation (April 2011)
62 slides from Ascom's investor presentation, April 2011

Slide 1: Ascom IR Presentation
ASCOM IR PRESENTATION I IR Presentation@ascom 1
Slide 2: Agenda
[ ] AGENDA ABOUT ASCOM 2010 RESULTS AT A GLANCE DIVISIONAL HIGHLIGHTS 2010 FINANCIAL RESULTS OUTLOOK IR Presentation@ascom 2
Slide 3: About Ascom
ABOUT ASCOM IR Presentation@ascom 3
Slide 4: The Ascom Group at a Glance
[ ASCOM GROUP ] THE ASCOM GROUP AT A GLANCE Focus on Mission-Critical Communication • Wireless Solutions • Network Testing • Security Communication Workforce of some 2’100 employees worldwide Subsidiaries in 19 countries Yearly sales of approx. CHF 570 million 2010 EBITDA margin of 12% A
Slide 5: Mission-Critical Communication Strategy Since 2004
[ ASCOM GROUP ] MISSION-CRITICAL COMMUNICATION STRATEGY SINCE 2004 Customer needs: Communication systems and solutions, which enable quicker and very reliable responses, when security, safety or efficiency is mission critical Constant innovation, which ensures efficient use of customers’ investm
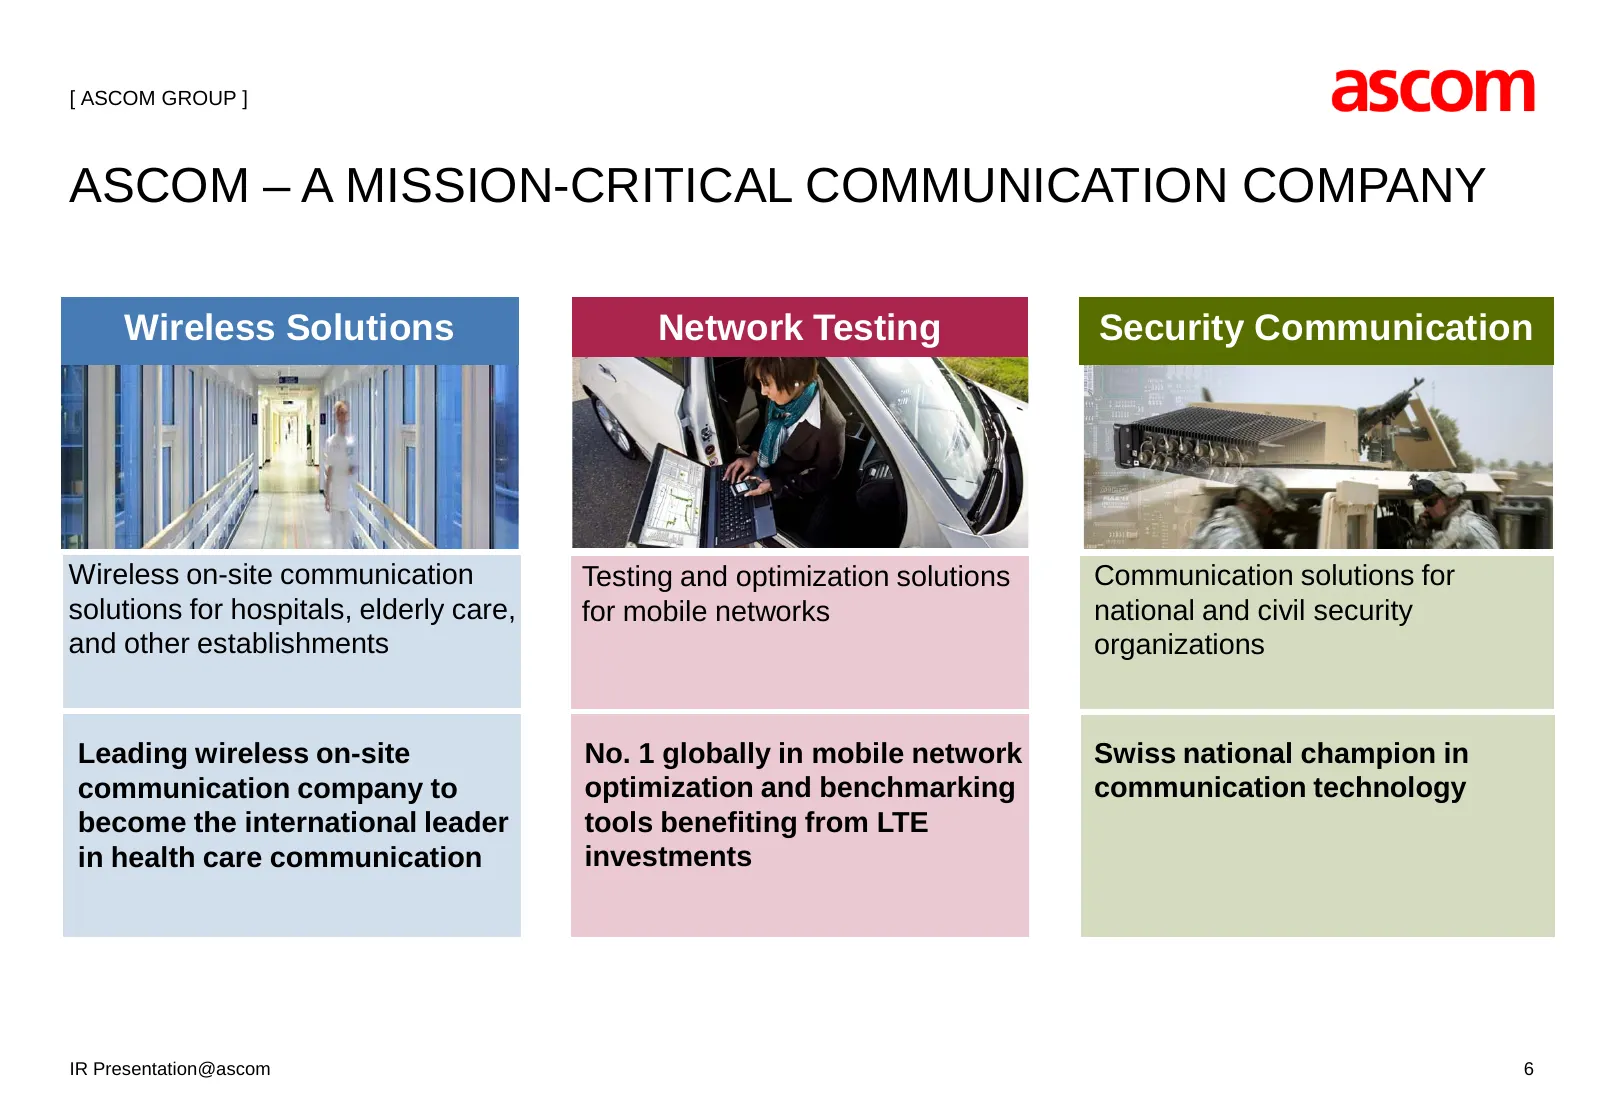
Slide 6: Ascom – A Mission-Critical Communication Company
[ ASCOM GROUP ] ASCOM – A MISSION-CRITICAL COMMUNICATION COMPANY Wireless Solutions Network Testing Security Communication Wireless on-site communication Testing and optimization solutions Communication solutions for solutions for hospitals, elderly care, for mobile networks national and civil secur
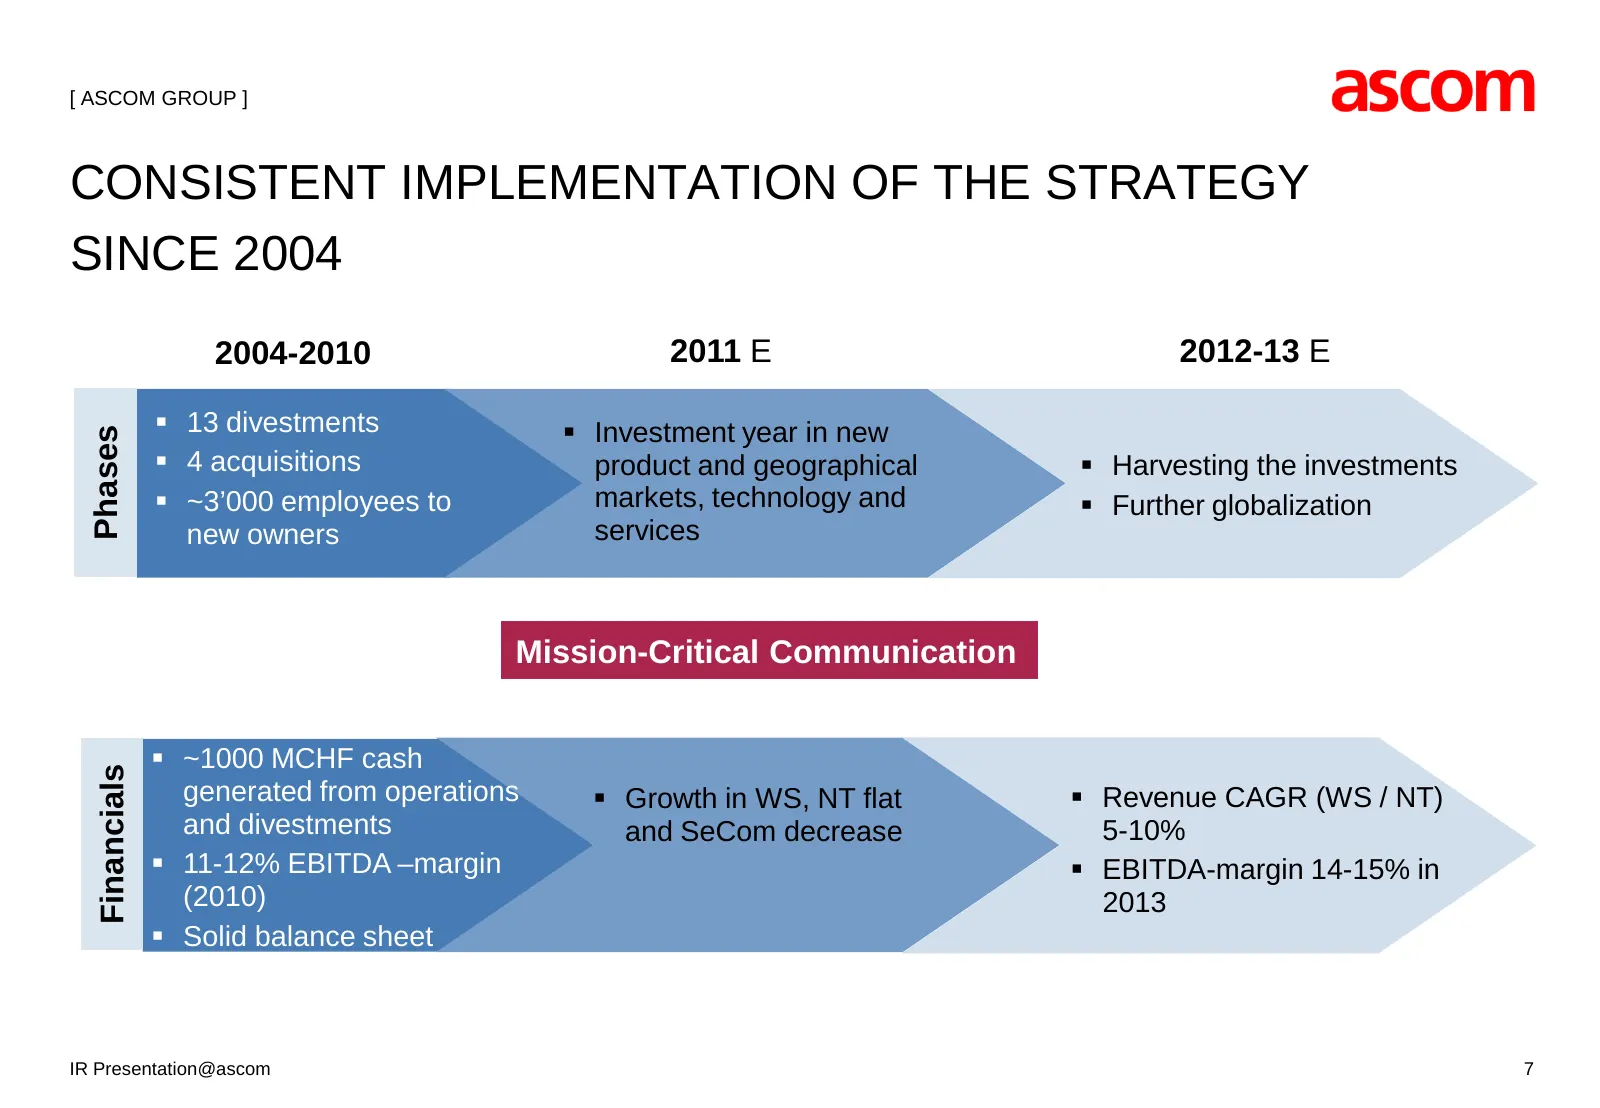
Slide 7: Consistent Implementation of the Strategy Since 2004
[ ASCOM GROUP ] CONSISTENT IMPLEMENTATION OF THE STRATEGY SINCE 2004 2004-2010 2011 E 2012-13 E 13 divestments Investment year in new Phases 4 acquisitions product and geographical Harvesting the investments ~3’000 employees to markets, technology and Further globalization new owners ser
Slide 8: Strategic Plan 2011-2013: 'In 13: 14 to 15'
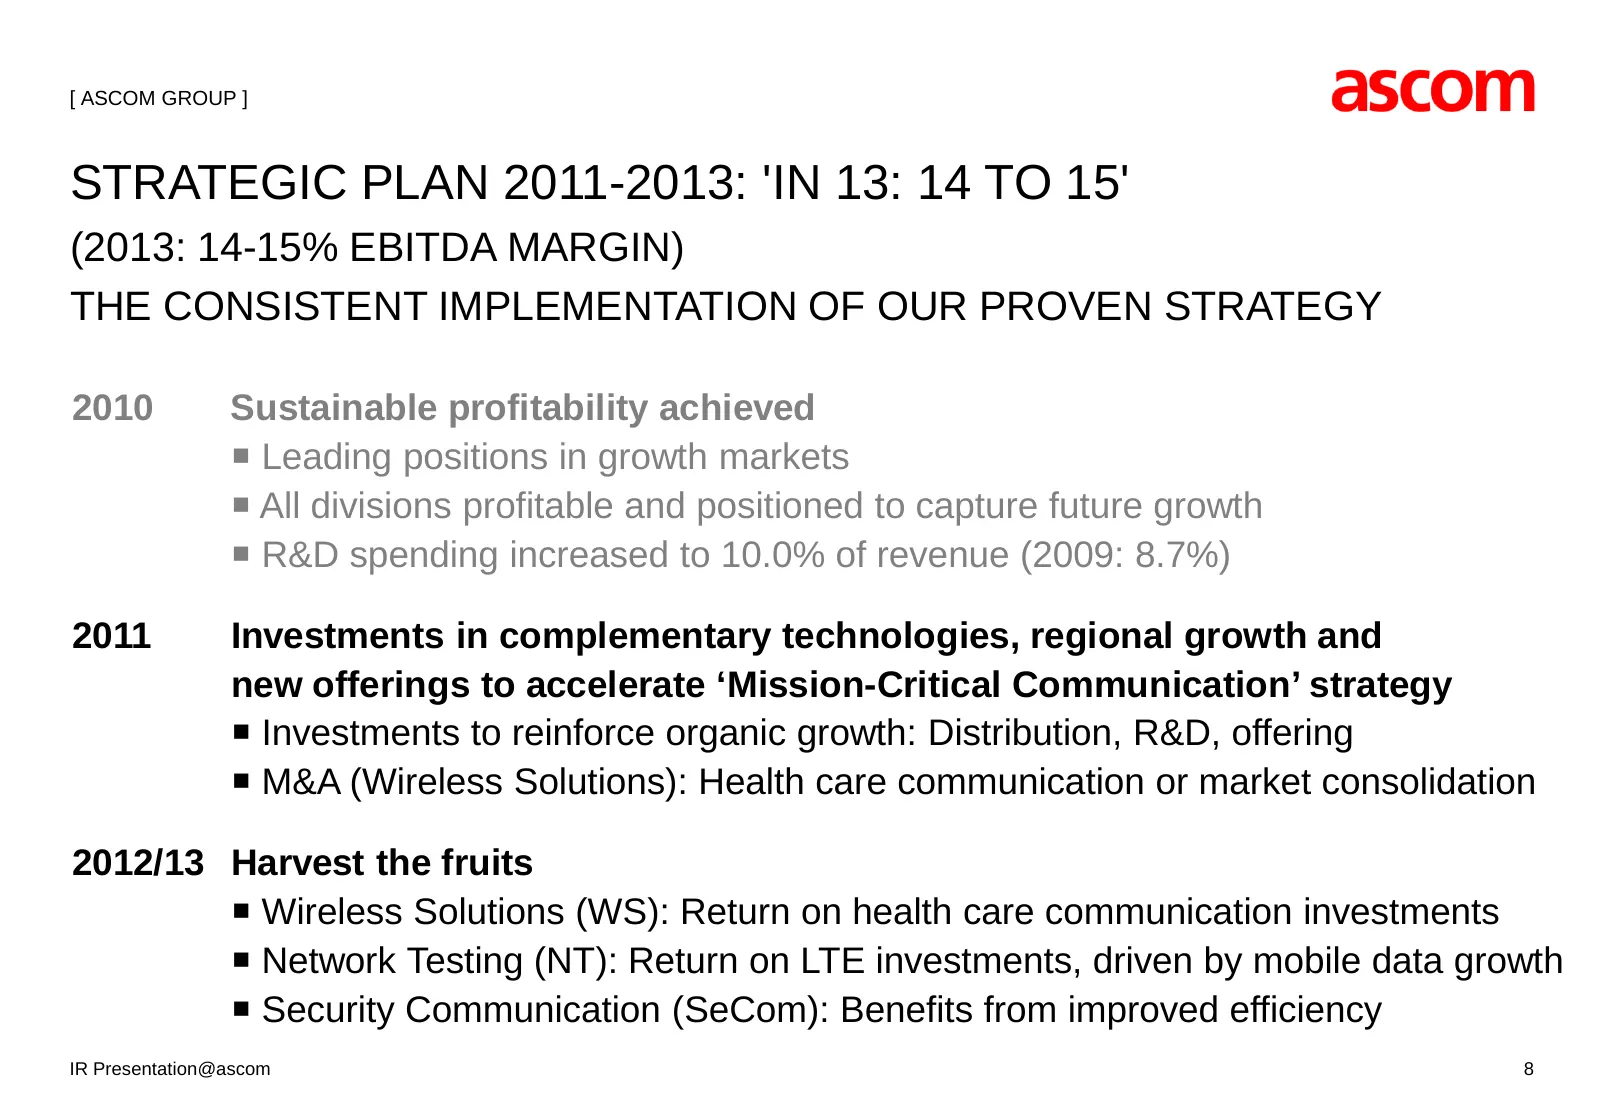
[ ASCOM GROUP ] STRATEGIC PLAN 2011-2013: 'IN 13: 14 TO 15' (2013: 14-15% EBITDA MARGIN) THE CONSISTENT IMPLEMENTATION OF OUR PROVEN STRATEGY 2010 Sustainable profitability achieved Leading positions in growth markets All divisions profitable and positioned to capture future growth R&D spendin
Slide 9: Ascom – Global Presence
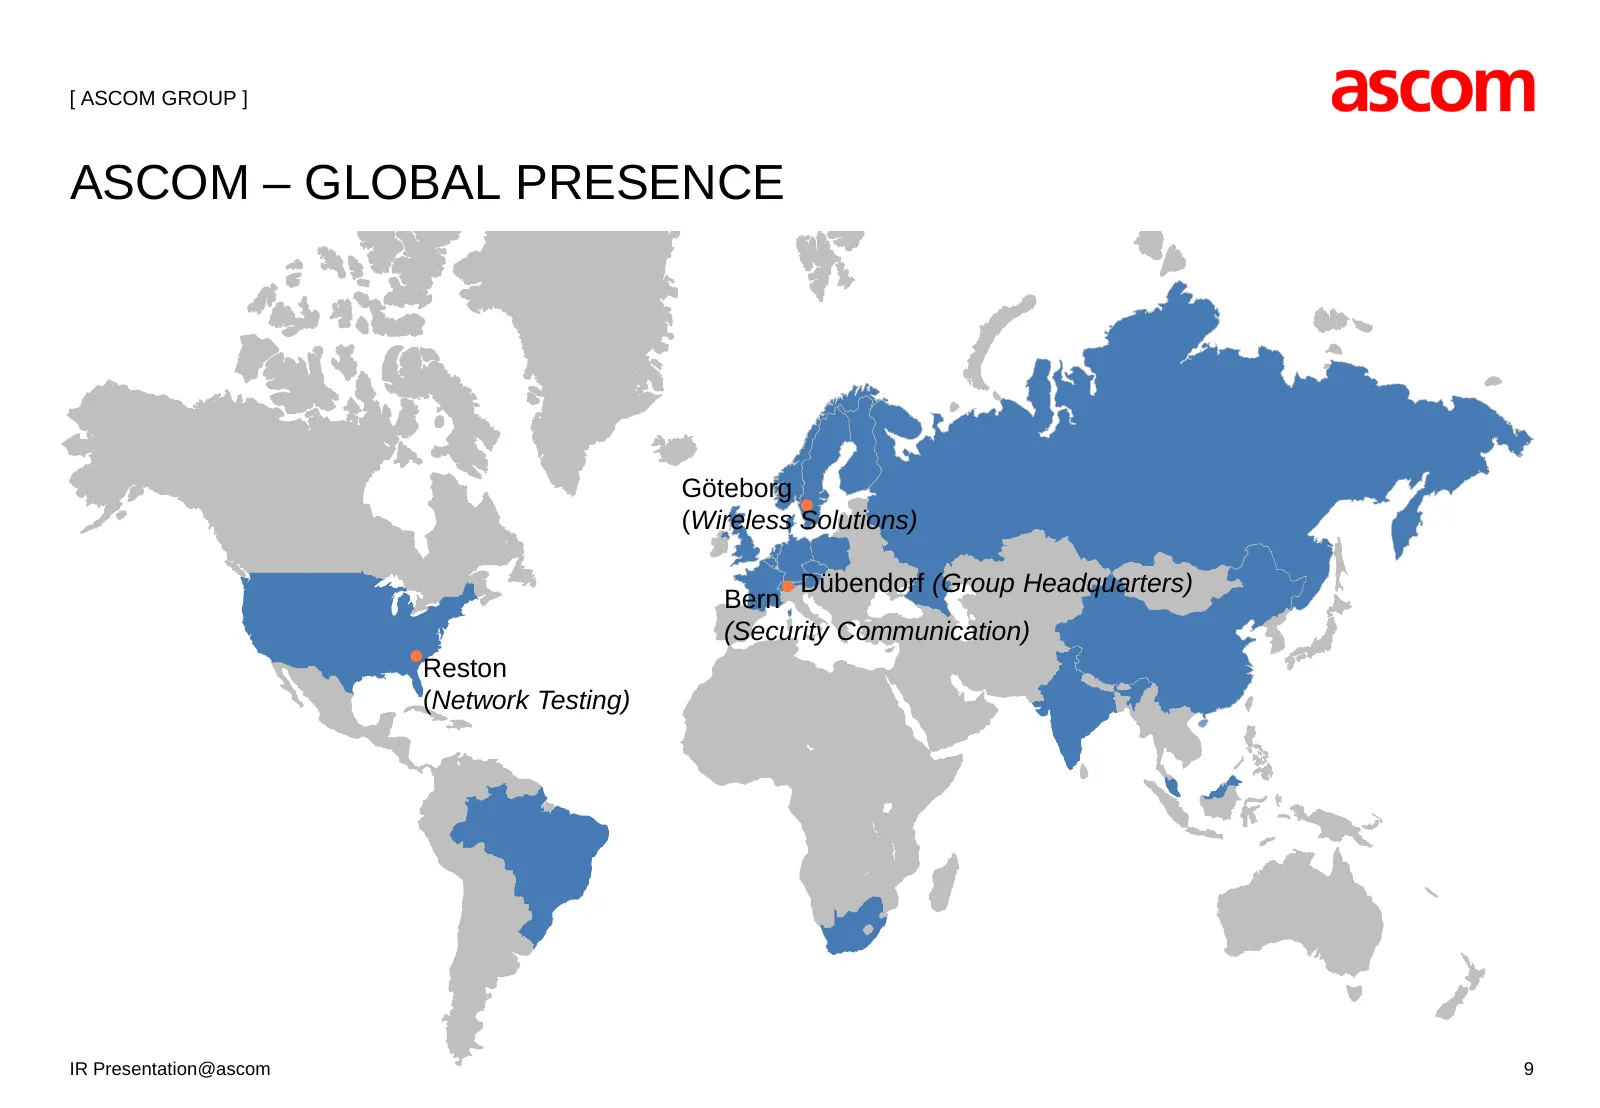
[ ASCOM GROUP ] ASCOM – GLOBAL PRESENCE Göteborg (Wireless Solutions) Dübendorf (Group Headquarters) Bern (Security Communication) Reston (Network Testing) IR Presentation@ascom 9
Slide 10: Management Team as of April 2011
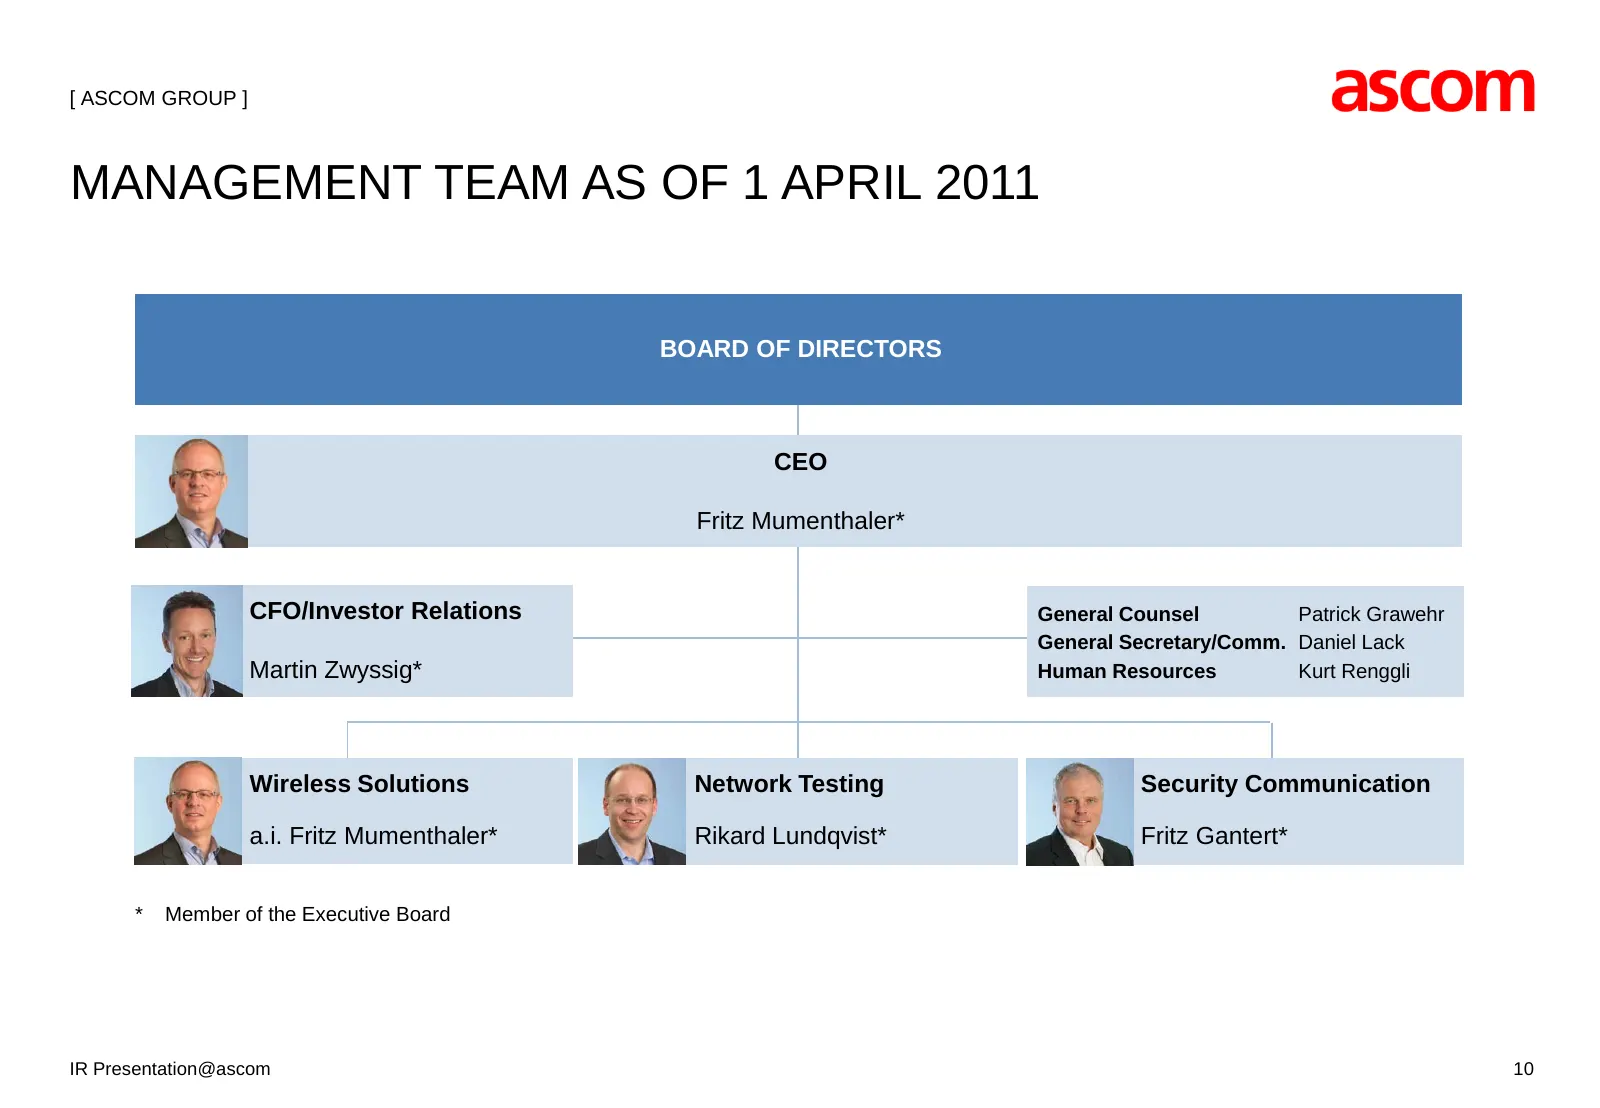
[ ASCOM GROUP ] MANAGEMENT TEAM AS OF 1 APRIL 2011 BOARD OF DIRECTORS CEO Fritz Mumenthaler* CFO/Investor Relations General Counsel Patrick Grawehr General Secretary/Comm. Daniel Lack v Martin Zwyssig* Human Resources Kurt Renggli Wireless Solutions Network Testing Security Communication a.i. Fritz
Slide 11: Starting from a Very Good 2010: 2011 First Step
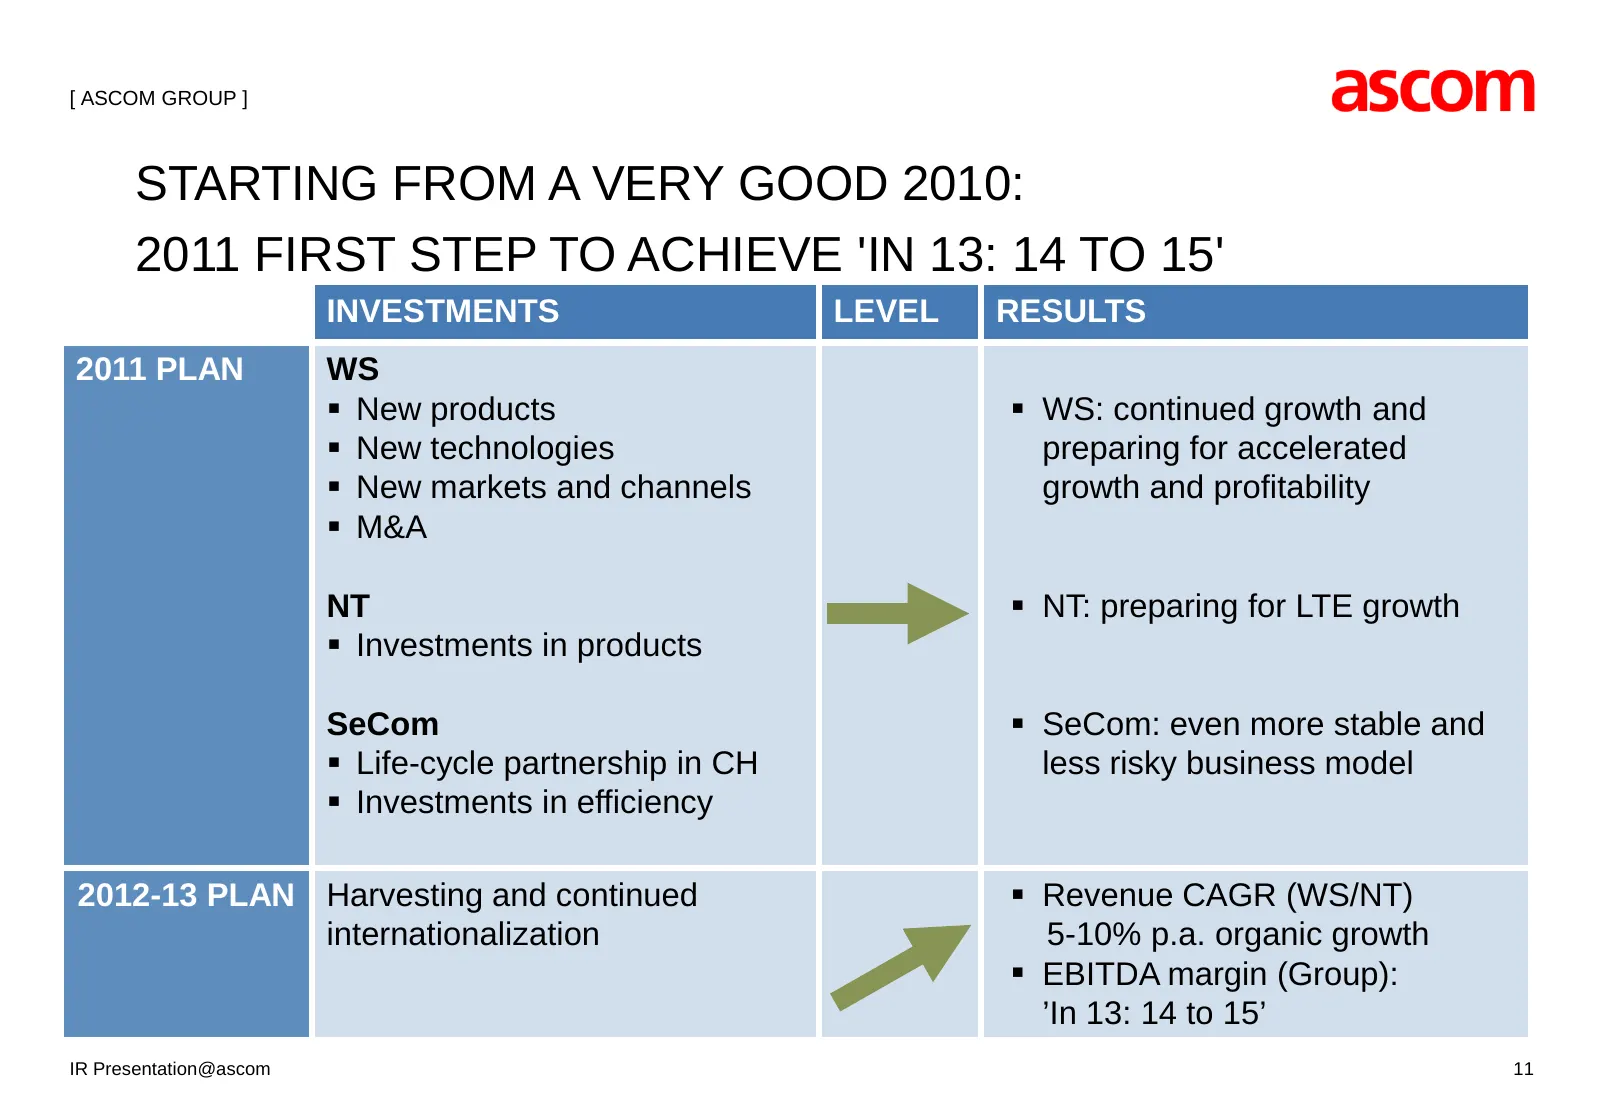
[ ASCOM GROUP ] STARTING FROM A VERY GOOD 2010: 2011 FIRST STEP TO ACHIEVE 'IN 13: 14 TO 15' INVESTMENTS LEVEL RESULTS 1st priority WS 2011 PLAN New products WS: continued growth and New technologies preparing for accelerated New markets and channels growth and profitability M&A NT NT: p
Slide 12: 2010 Results at a Glance
ascom 2010 RESULTS AT A GLANCE
Slide 13: 2010: Bounce Back to Profitable Growth
[ 2010 RESULTS AT A GLANCE ] 2010: BOUNCE BACK TO PROFITABLE GROWTH Substantial growth on Group level Total revenue: CHF 571.2m (2009: CHF 537.2m) (Growth at constant exchange rates: +9.5%, in Swiss Francs: +6.3%) Organic growth: +5.3% Strong increase in incoming orders Incoming orders: CH
Slide 14: Profitability – EBITDA Increased by One Third
[ 2010 RESULTS AT A GLANCE ] PROFITABILITY – EBITDA INCREASED BY ONE THIRD EBITDA margin at remarkable level of 12.0% EBITDA: CHF 68.4m (2009: CHF 49.8m); +37.3% EBITDA margin 12.0% (2009: 9.3%) EBIT: CHF 48.4m (2009: CHF 32.8m); +47.6% EBIT margin: 8.5% Substantial increase in Group pro
Slide 15: Shareholders – Pay Out of a Dividend of 28%
[ 2010 RESULTS AT A GLANCE ] SHAREHOLDERS – PAY OUT OF A DIVIDEND OF 28% Given the marked improvement in profit, the Board of Directors proposes a dividend to the Annual General Meeting 2011 Dividend proposal Pay out of CHF 0.25 per share Pay-out ratio of 28% Dividend of CHF 9m Very posi
Slide 16: Wireless Solutions and Network Testing Show Excellent Results
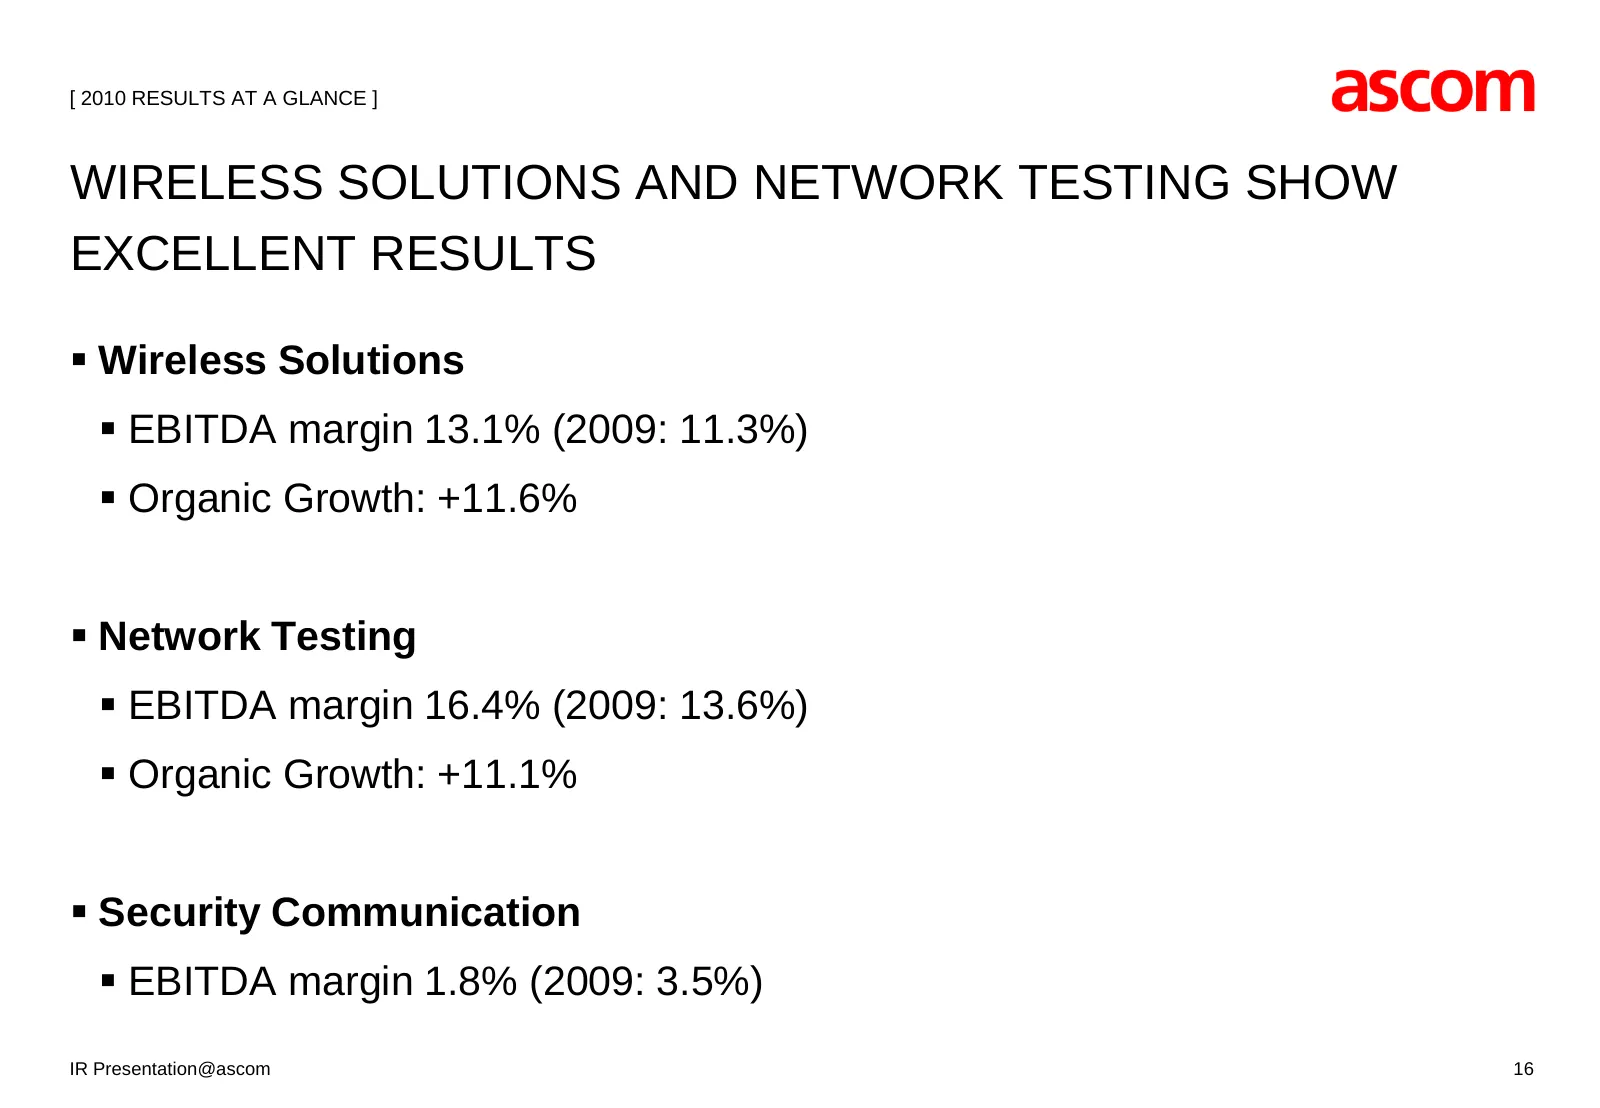
[ 2010 RESULTS AT A GLANCE ] WIRELESS SOLUTIONS AND NETWORK TESTING SHOW EXCELLENT RESULTS Wireless Solutions EBITDA margin 13.1% (2009: 11.3%) Organic Growth: +11.6% Network Testing EBITDA margin 16.4% (2009: 13.6%) Organic Growth: +11.1% Security Communication EBITDA margin 1.8% (2
Slide 17: 2010 Financial Results Overview
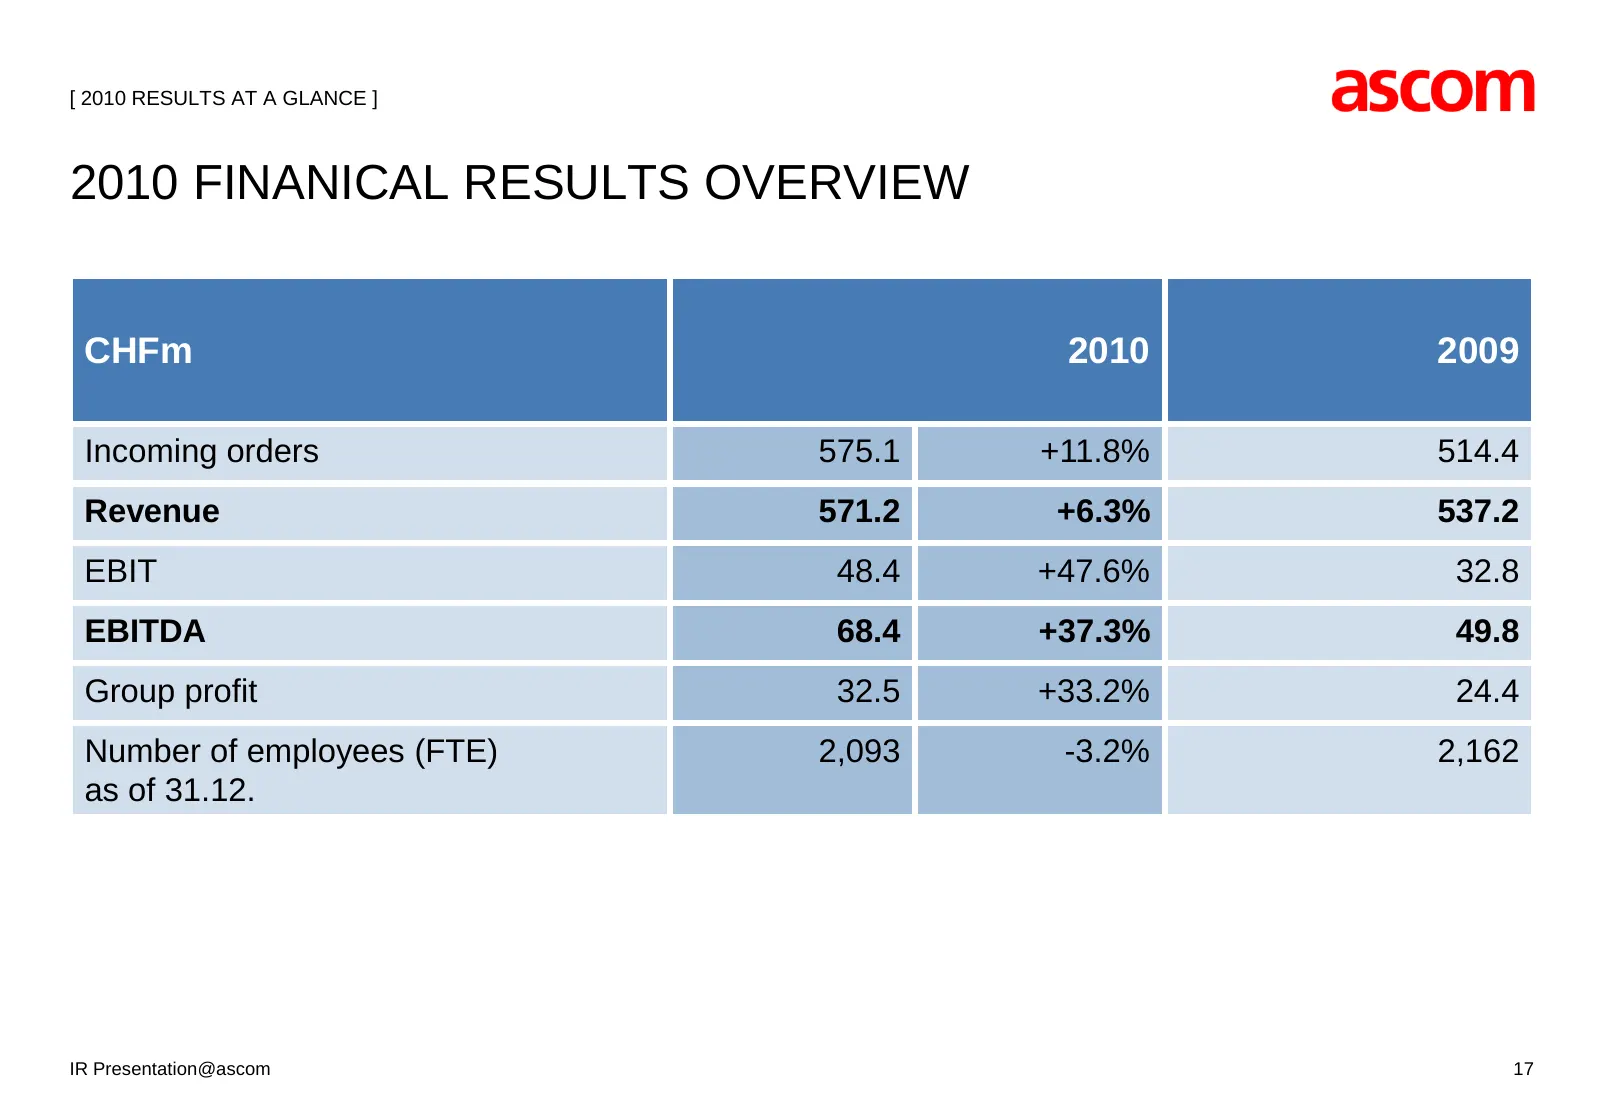
[ 2010 RESULTS AT A GLANCE ] 2010 FINANICAL RESULTS OVERVIEW CHFm 2010 2009 Incoming orders 575.1 +11.8% 514.4 Revenue 571.2 +6.3% 537.2 EBIT 48.4 +47.6% 32.8 EBITDA 68.4 +37.3% 49.8 Group profit 32.5 +33.2% 24.4 Number of employees (FTE) 2,093 -3.2% 2,162 as of 31.12. IR Presentation@ascom 17
Slide 18: Division Highlights
ascom DIVISION HIGHLIGHTS
Slide 19: Wireless Solutions
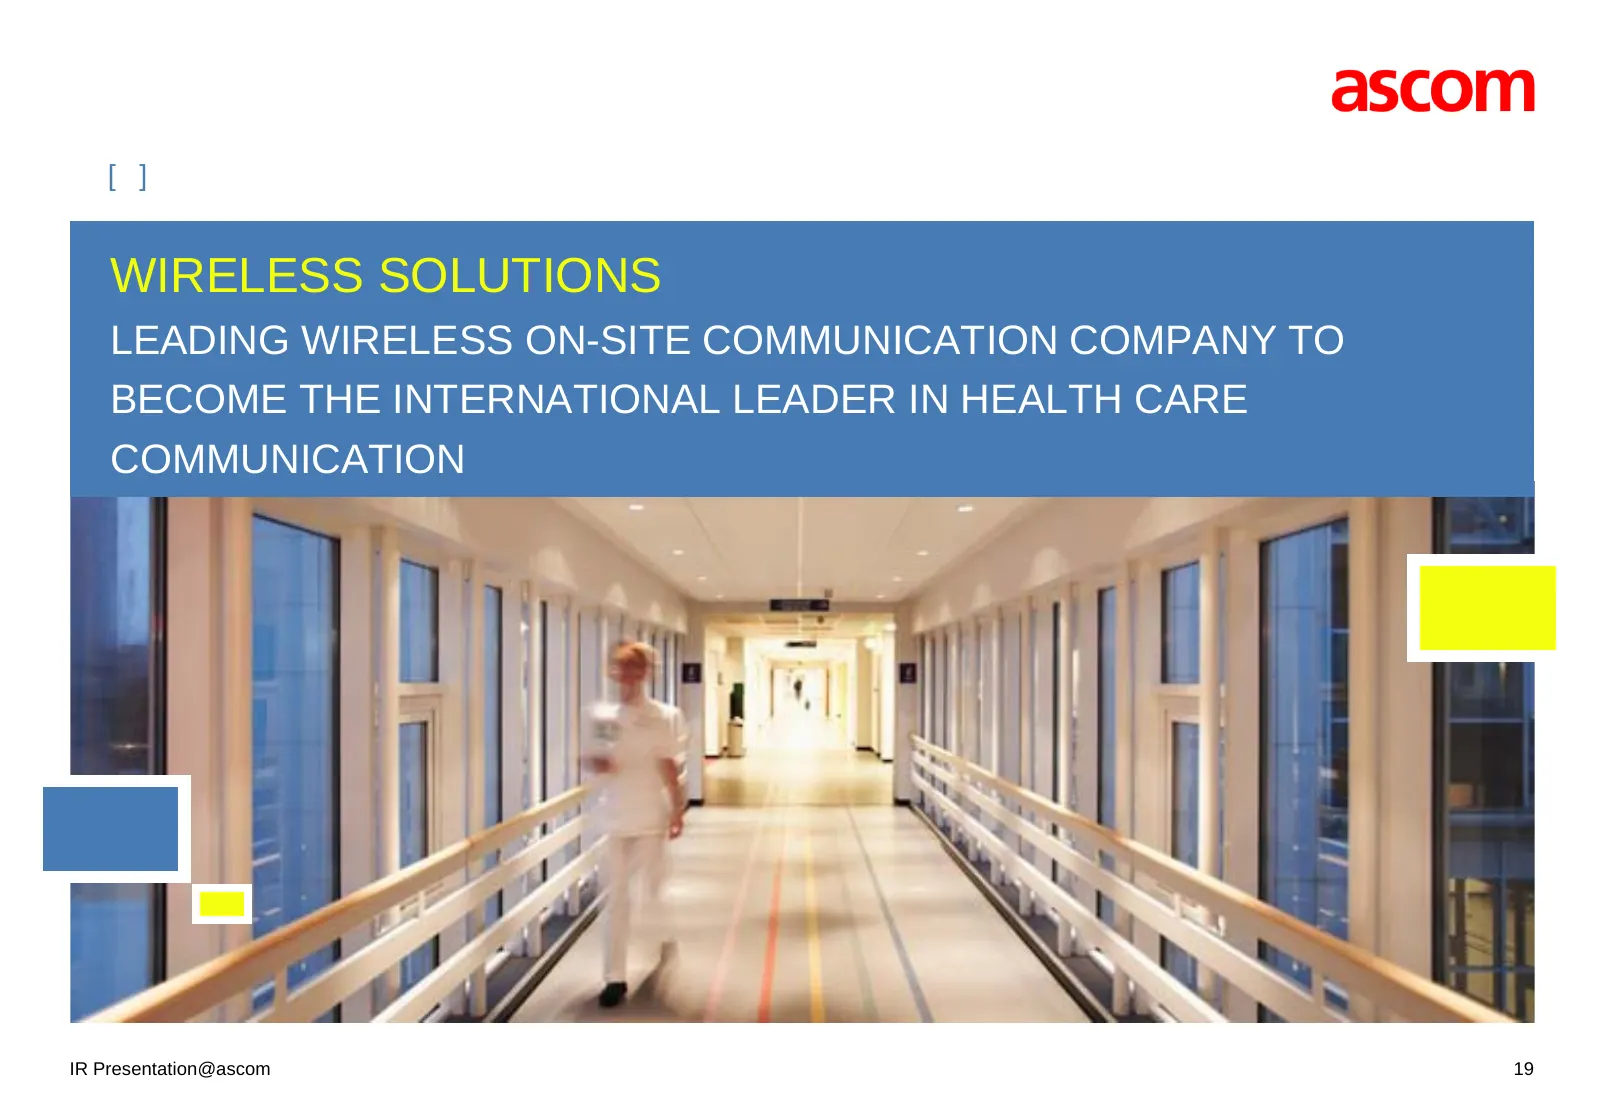
[ ] WIRELESS SOLUTIONS LEADING WIRELESS ON-SITE COMMUNICATION COMPANY TO BECOME THE INTERNATIONAL LEADER IN HEALTH CARE COMMUNICATION IR Presentation@ascom 19
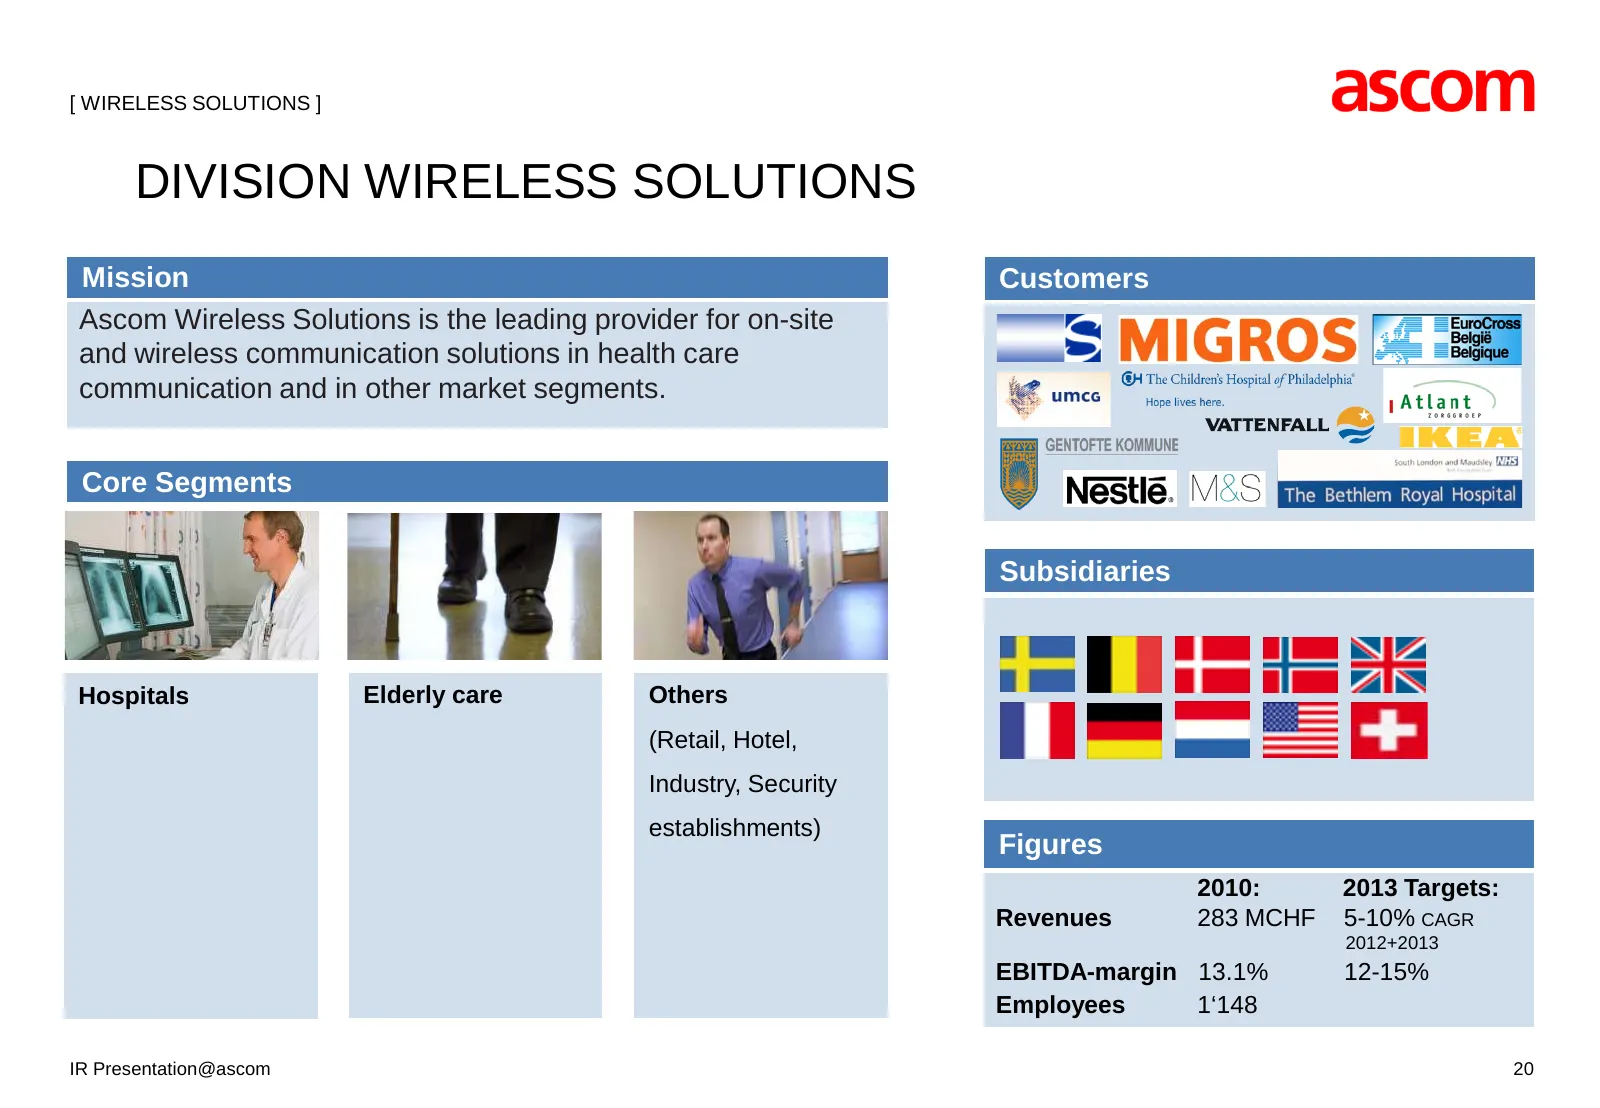
Slide 20: Division Wireless Solutions
[ WIRELESS SOLUTIONS ] DIVISION WIRELESS SOLUTIONS Mission Customers Ascom Wireless Solutions is the leading provider for on-site and wireless communication solutions in health care communication and in other market segments. Core Segments Subsidiaries Hospitals Elderly care Others (Retail, Hotel, I
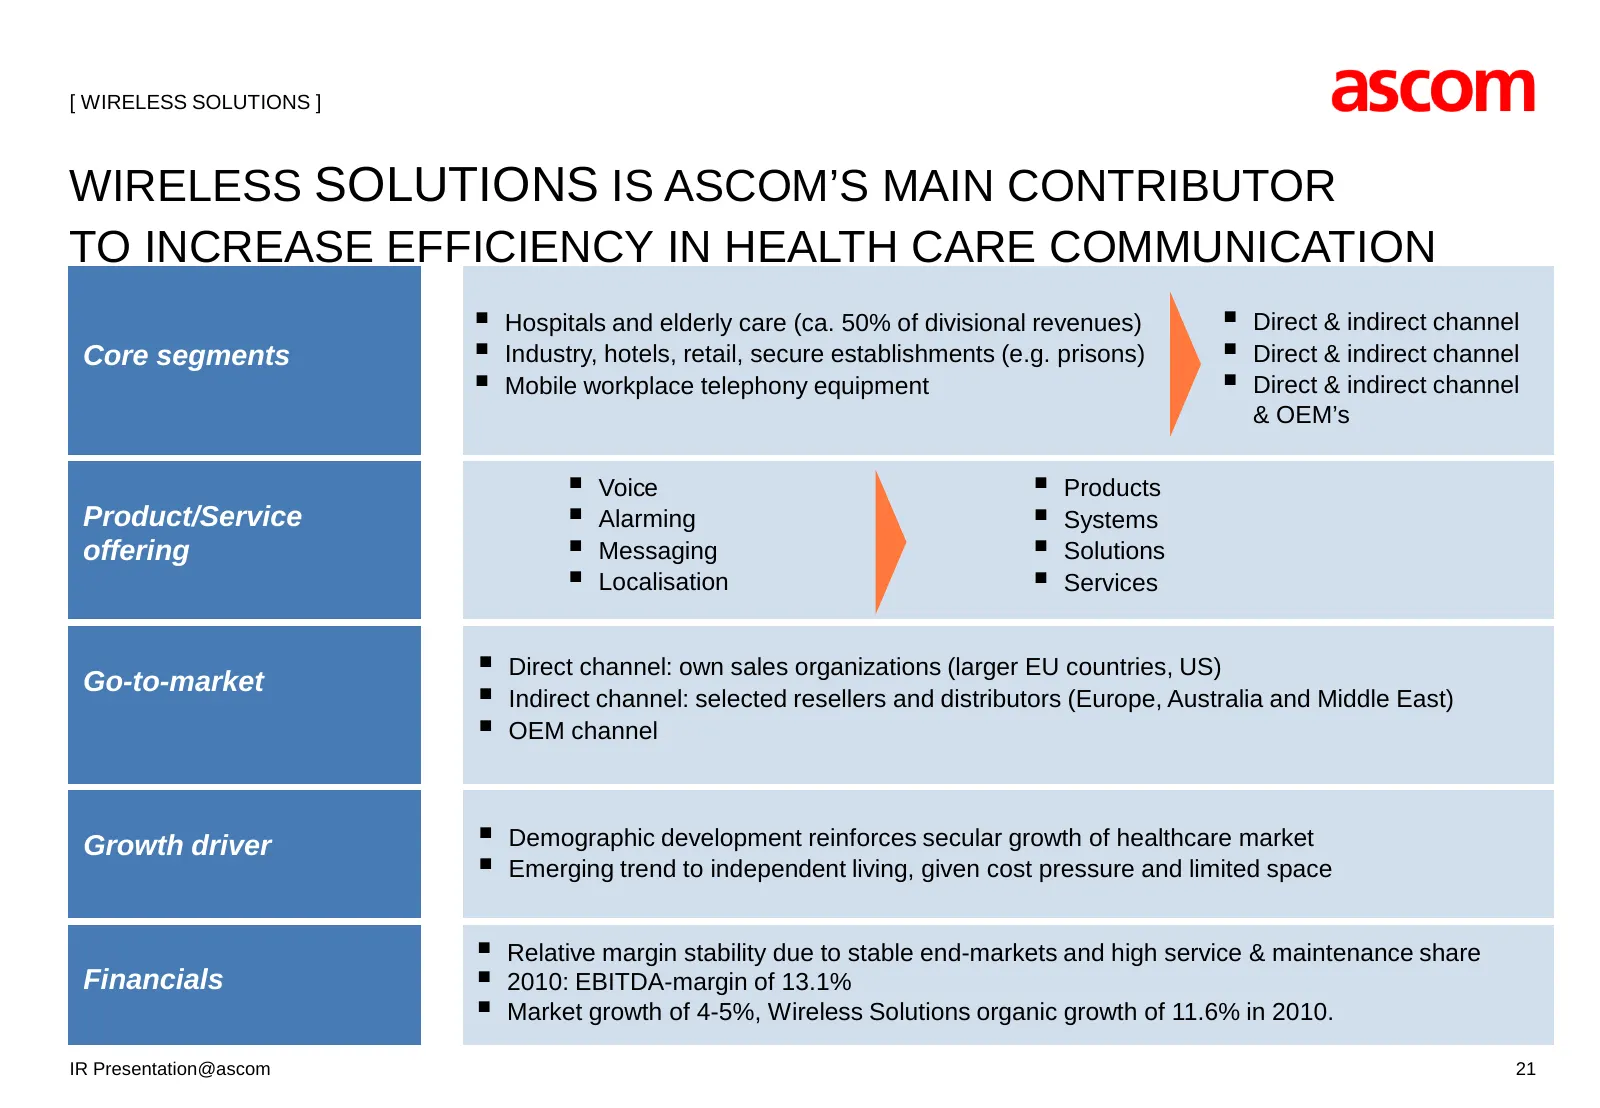
Slide 21: Wireless Solutions Main Contributor to Efficiency in Health Care Communication
[ WIRELESS SOLUTIONS ] WIRELESS SOLUTIONS IS ASCOM’S MAIN CONTRIBUTOR TO INCREASE EFFICIENCY IN HEALTH CARE COMMUNICATION Hospitals and elderly care (ca. 50% of divisional revenues) Direct & indirect channel Core segments Industry, hotels, retail, secure establishments (e.g. prisons) Direct
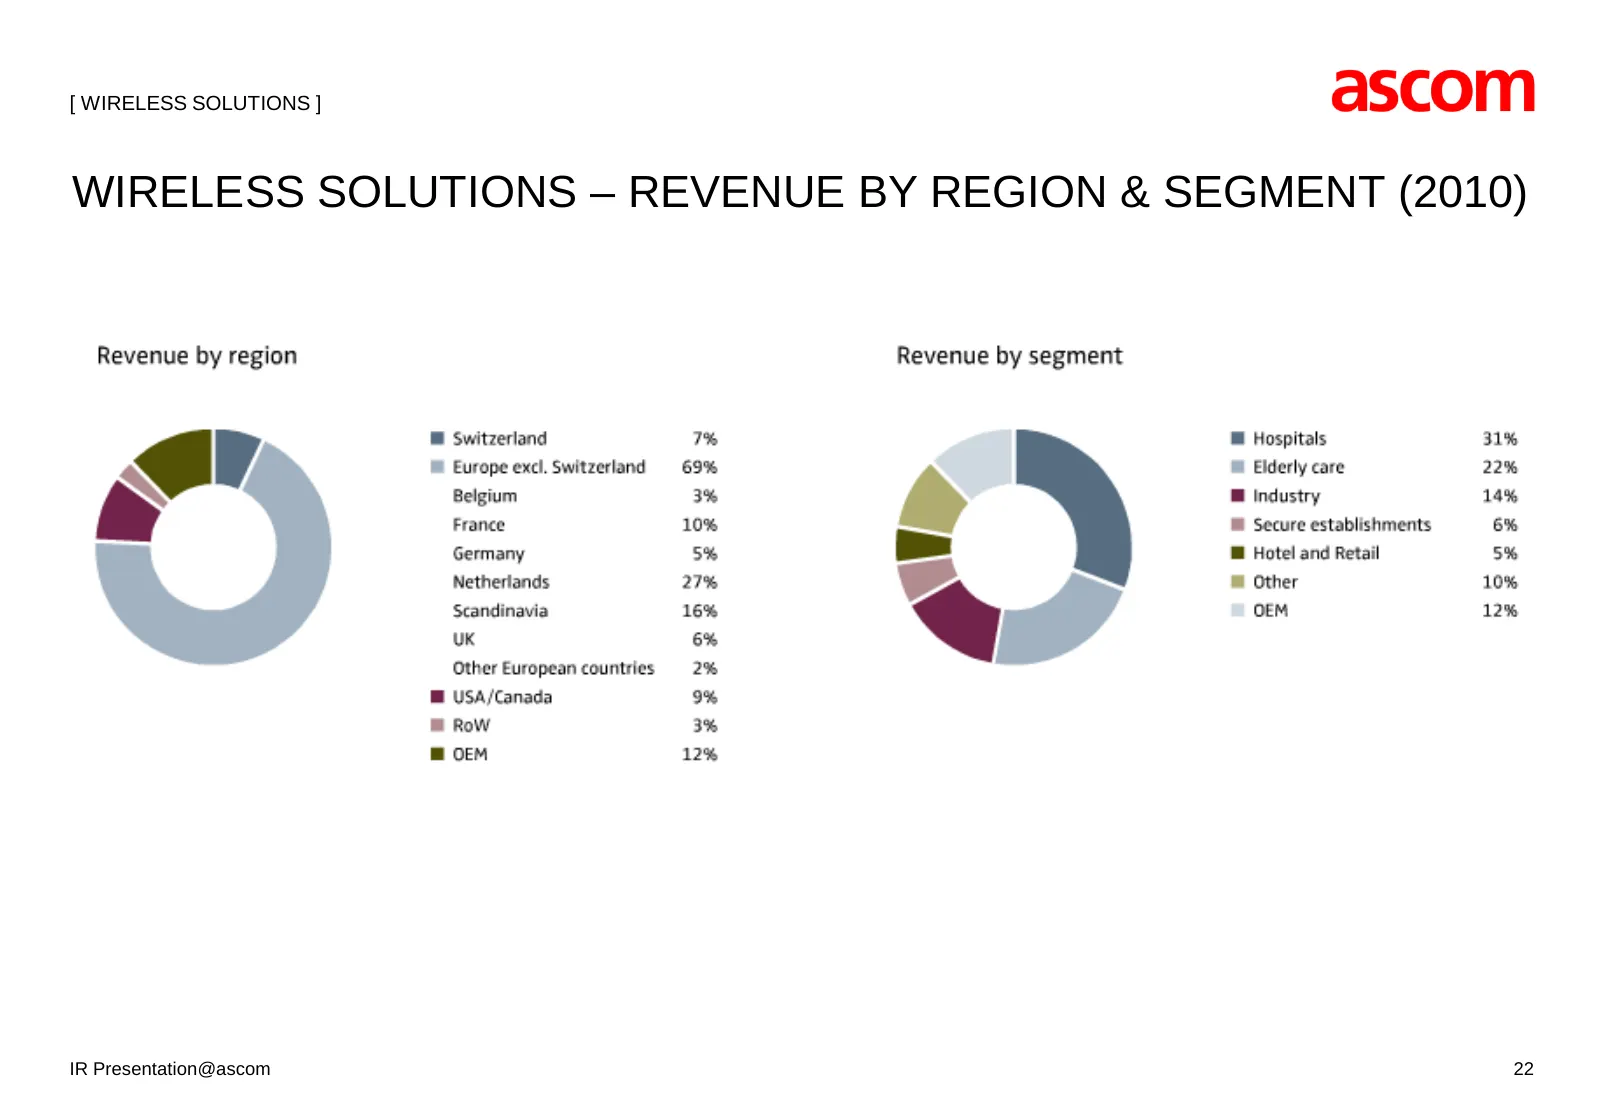
Slide 22: Wireless Solutions – Revenue by Region & Segment (2010)
[ WIRELESS SOLUTIONS ] WIRELESS SOLUTIONS – REVENUE BY REGION & SEGMENT (2010) IR Presentation@ascom 22
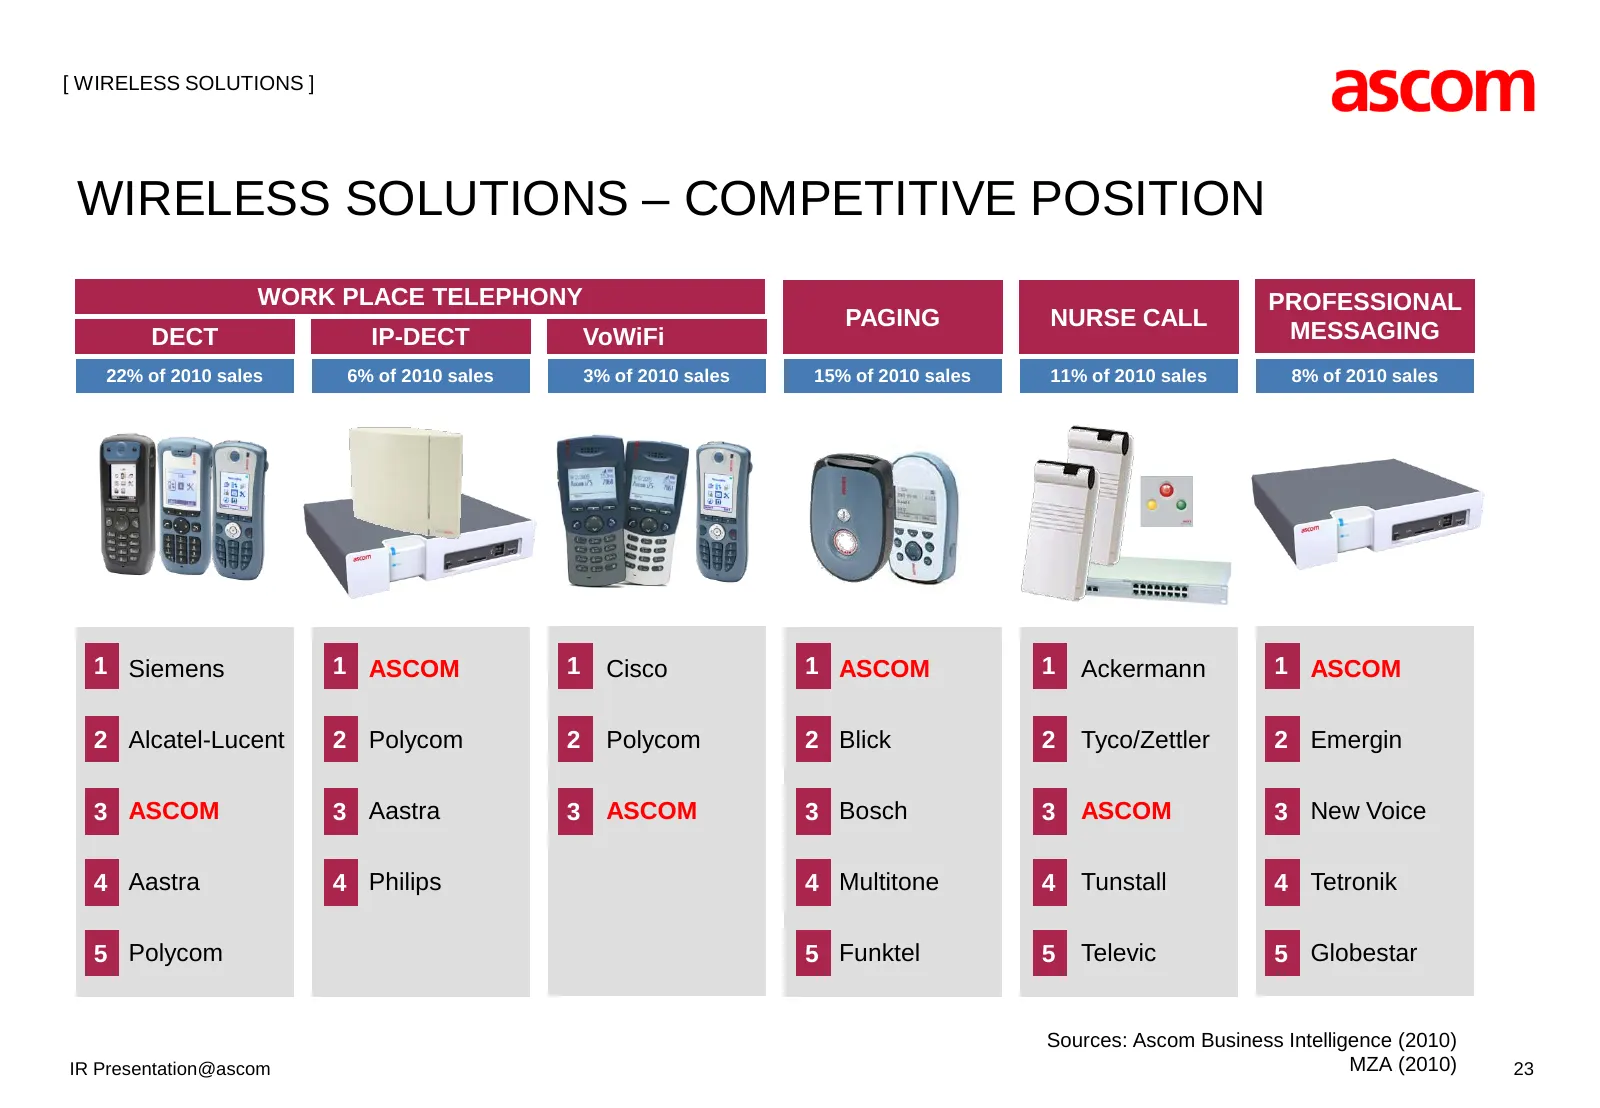
Slide 23: Wireless Solutions – Competitive Position
[ WIRELESS SOLUTIONS ] WIRELESS SOLUTIONS – COMPETITIVE POSITION WORK PLACE TELEPHONY PROFESSIONAL PAGING NURSE CALL DECT IP-DECT VoWiFi MESSAGING 22% of 2010 sales 6% of 2010 sales 3% of 2010 sales 15% of 2010 sales 11% of 2010 sales 8% of 2010 sales 1 Siemens 1 ASCOM 1 Cisco 1 ASCOM 1 Ackermann 1
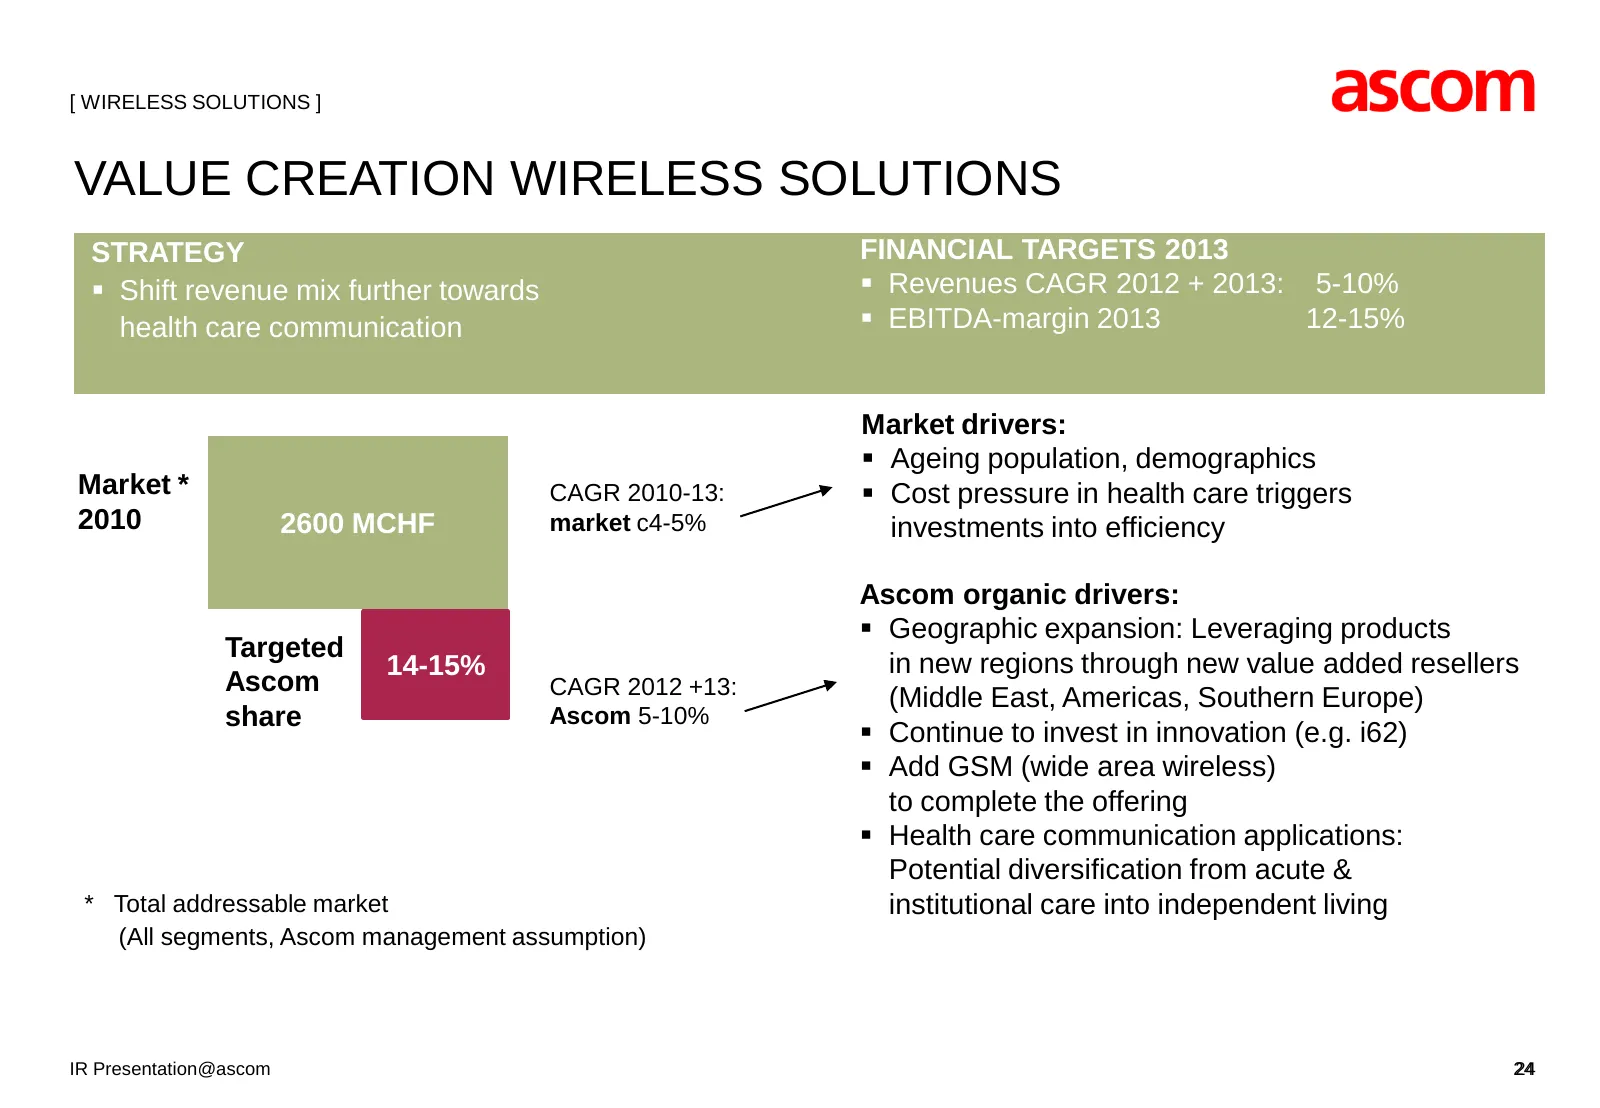
Slide 24: Value Creation Wireless Solutions
[ WIRELESS SOLUTIONS ] VALUE CREATION WIRELESS SOLUTIONS STRATEGY FINANCIAL TARGETS 2013 Shift revenue mix further towards Revenues CAGR 2012 + 2013: 5-10% health care communication EBITDA-margin 2013 12-15% Market drivers: Ageing population, demographics Market * CAGR 2010-13: Cost pressu
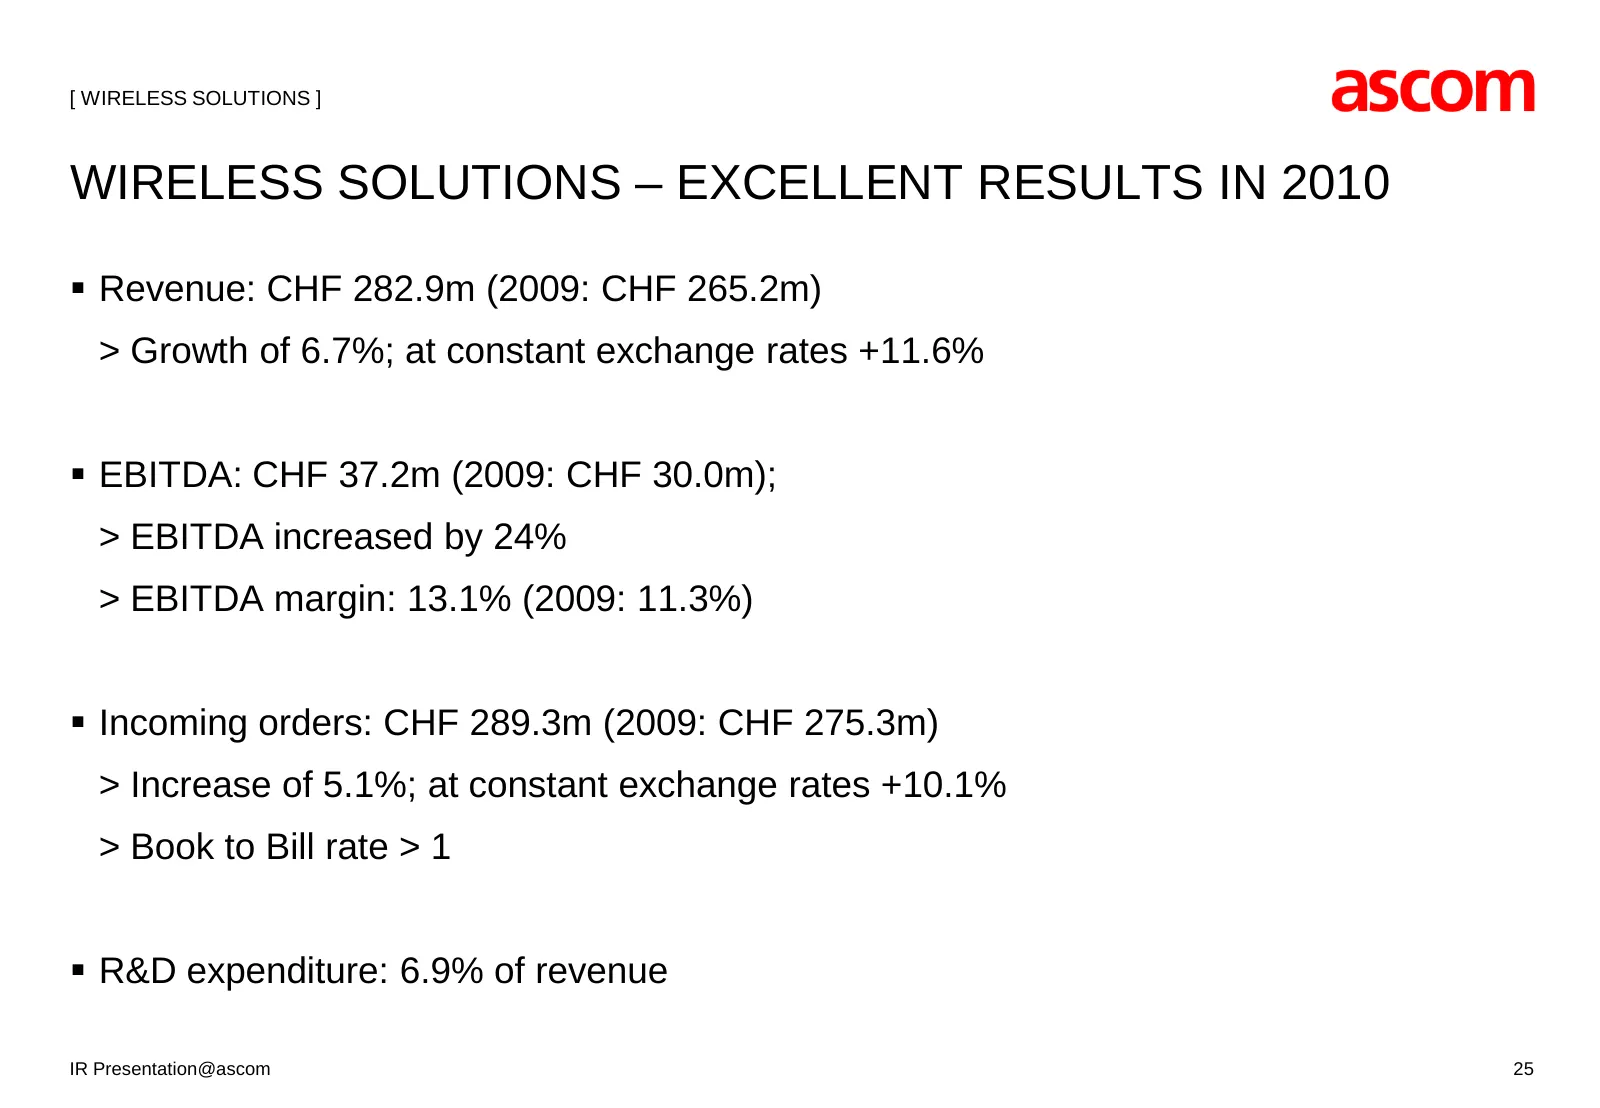
Slide 25: Wireless Solutions – Excellent Results in 2010
[ WIRELESS SOLUTIONS ] WIRELESS SOLUTIONS – EXCELLENT RESULTS IN 2010 Revenue: CHF 282.9m (2009: CHF 265.2m) > Growth of 6.7%; at constant exchange rates +11.6% EBITDA: CHF 37.2m (2009: CHF 30.0m); > EBITDA increased by 24% > EBITDA margin: 13.1% (2009: 11.3%) Incoming orders: CHF 289.3m (2009
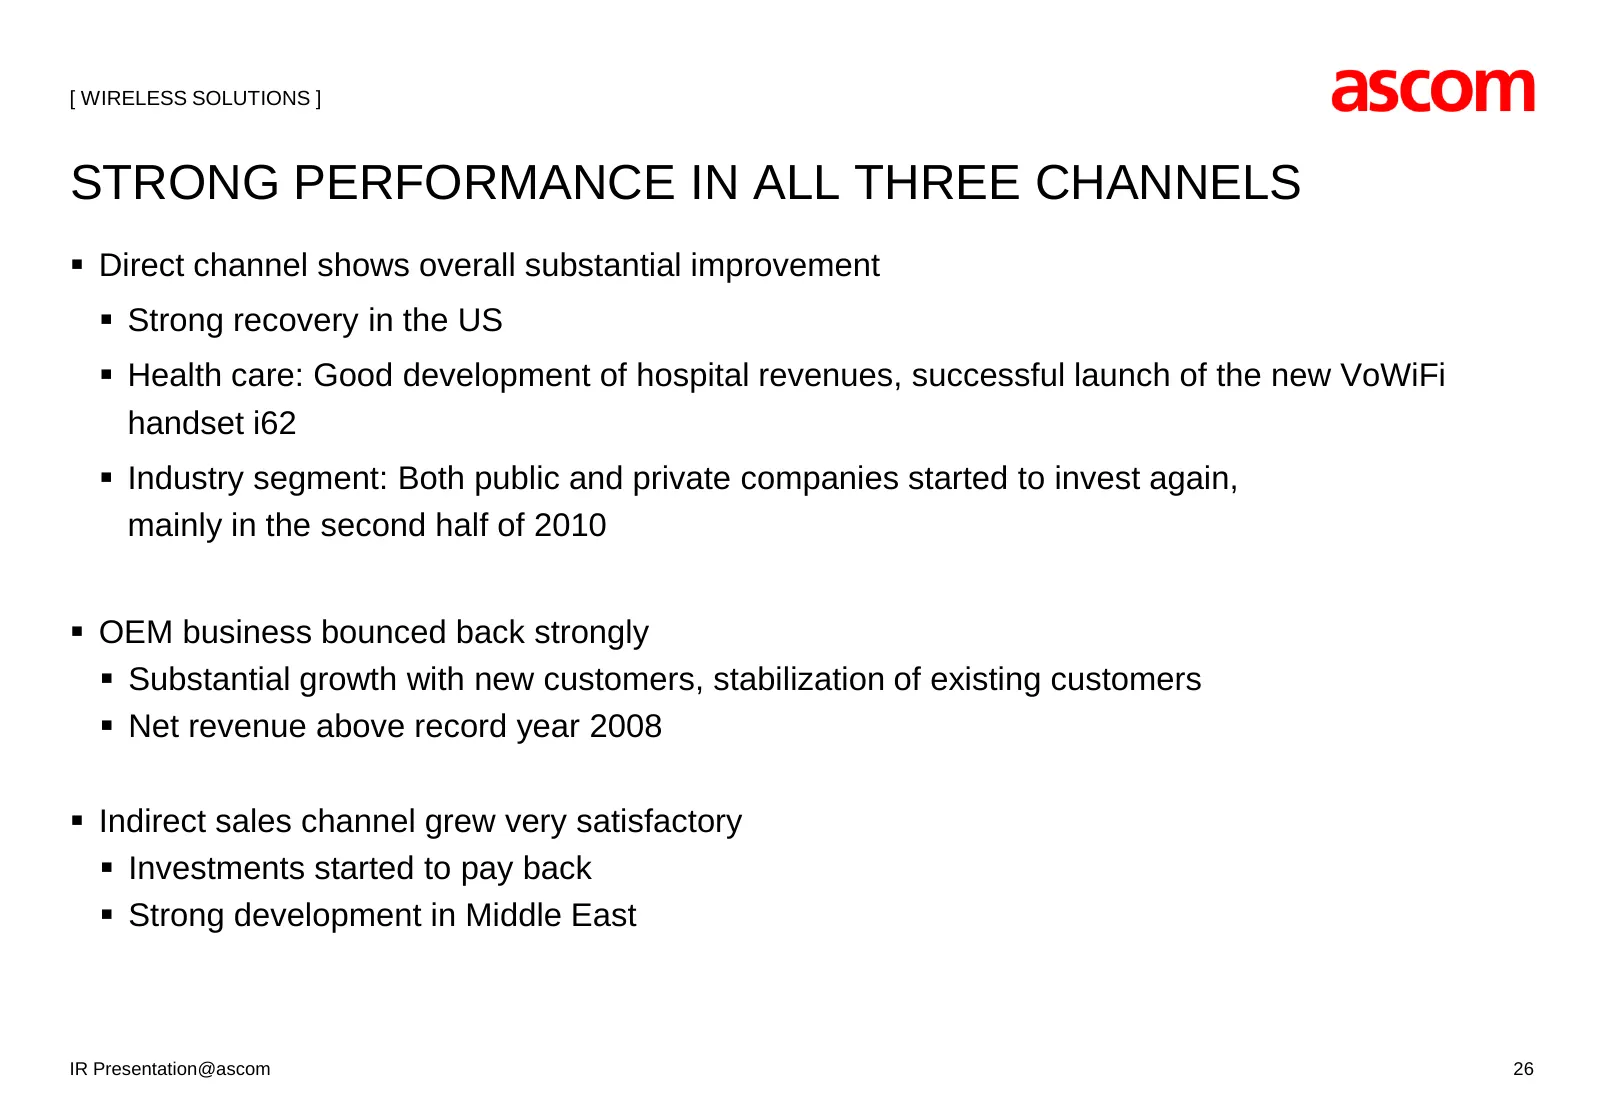
Slide 26: Strong Performance in All Three Channels
[ WIRELESS SOLUTIONS ] STRONG PERFORMANCE IN ALL THREE CHANNELS Direct channel shows overall substantial improvement Strong recovery in the US Health care: Good development of hospital revenues, successful launch of the new VoWiFi handset i62 Industry segment: Both public and private compani
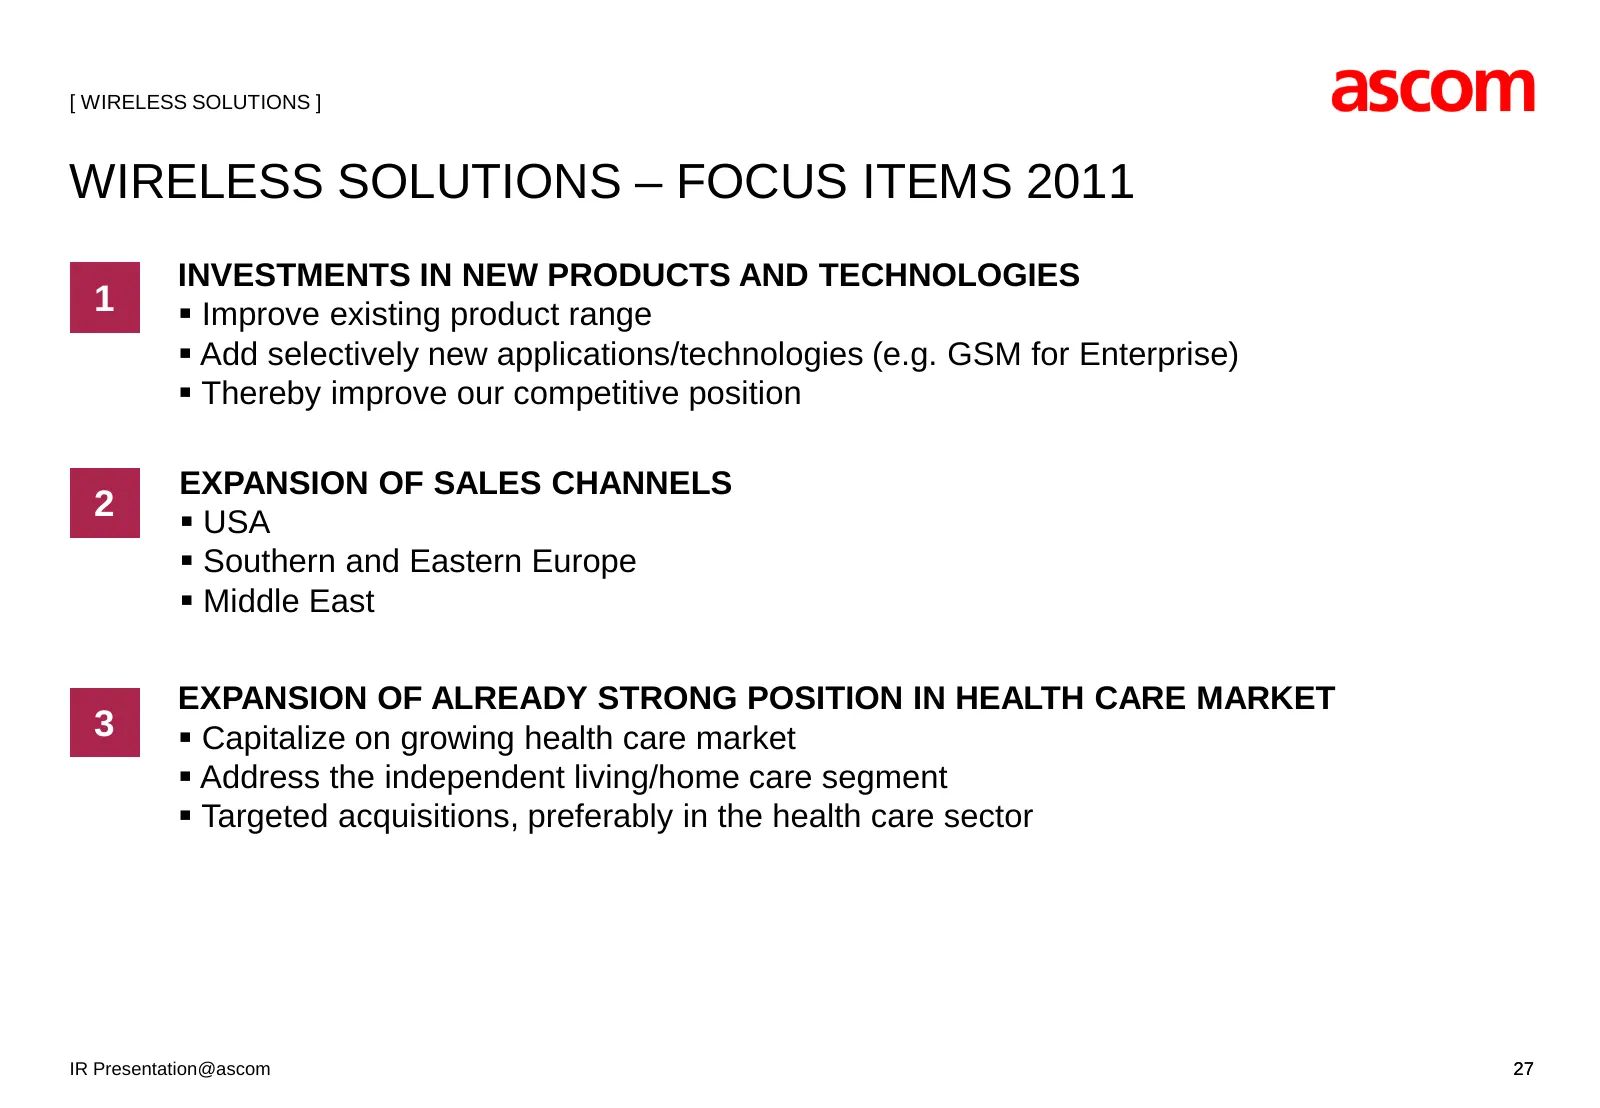
Slide 27: Wireless Solutions – Focus Items 2011
[ WIRELESS SOLUTIONS ] WIRELESS SOLUTIONS – FOCUS ITEMS 2011 INVESTMENTS IN NEW PRODUCTS AND TECHNOLOGIES 1 Improve existing product range Add selectively new applications/technologies (e.g. GSM for Enterprise) Thereby improve our competitive position EXPANSION OF SALES CHANNELS 2 USA Sout
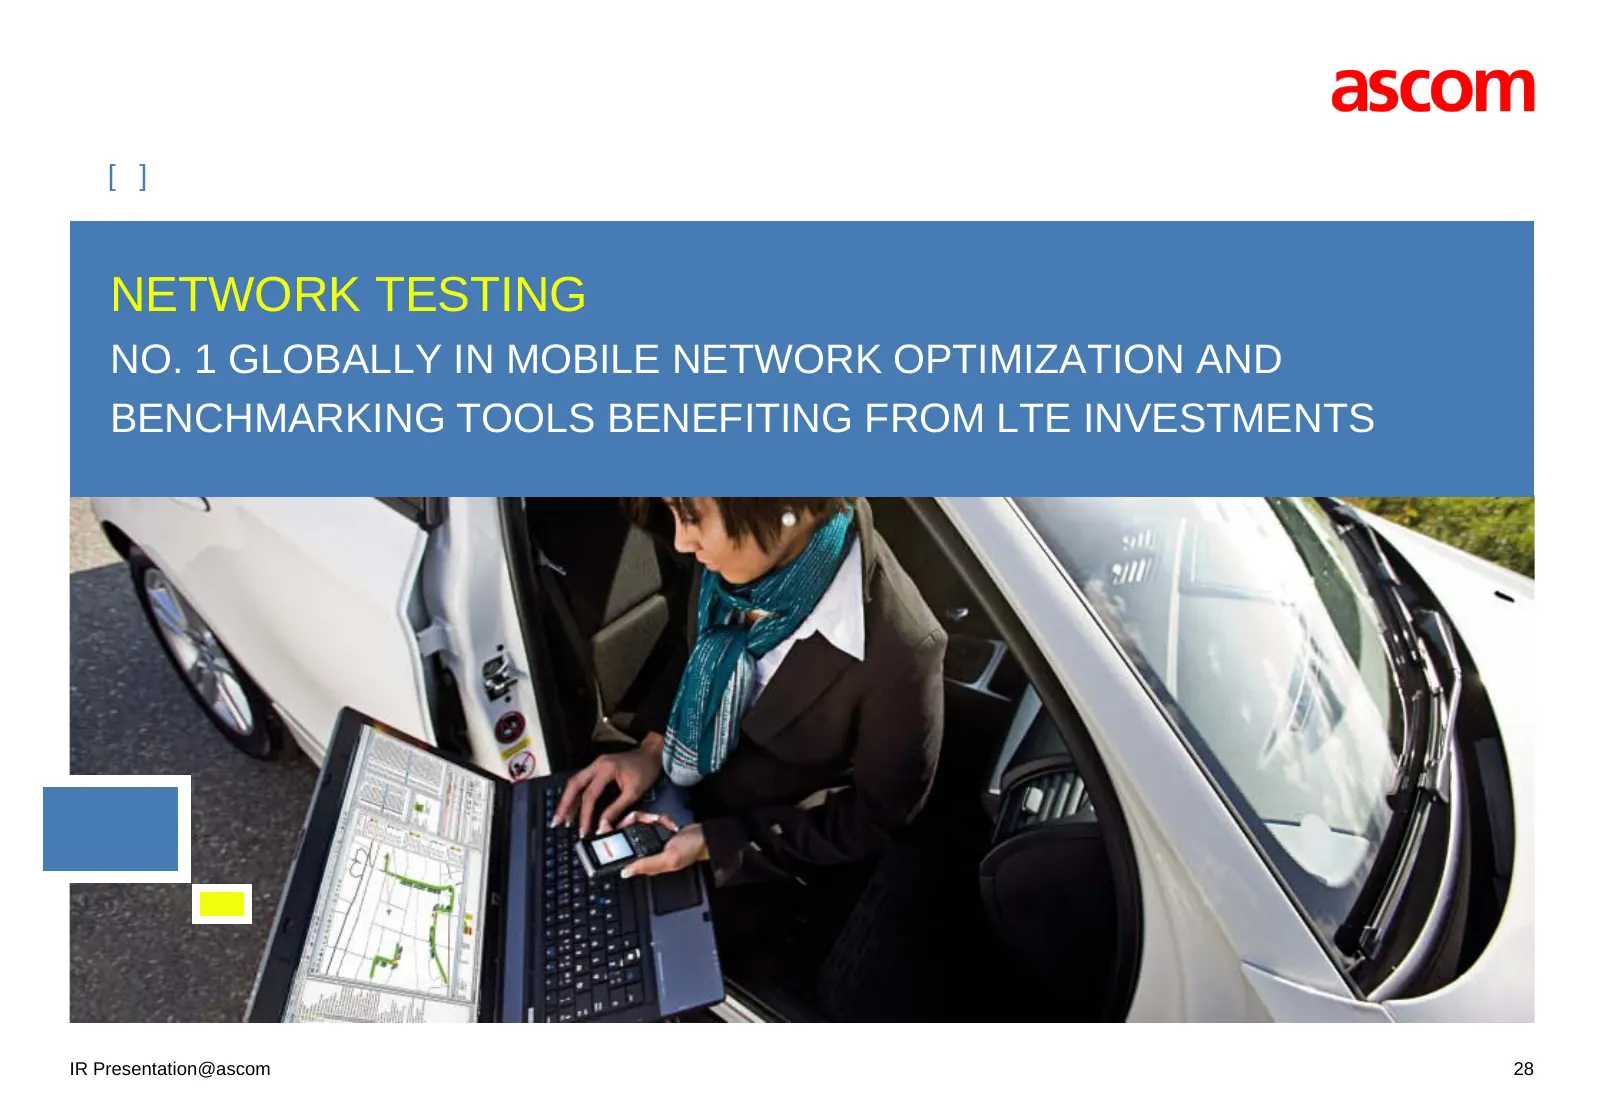
Slide 28: Network Testing
[ ] NETWORK TESTING NO. 1 GLOBALLY IN MOBILE NETWORK OPTIMIZATION AND BENCHMARKING TOOLS BENEFITING FROM LTE INVESTMENTS IR Presentation@ascom 28
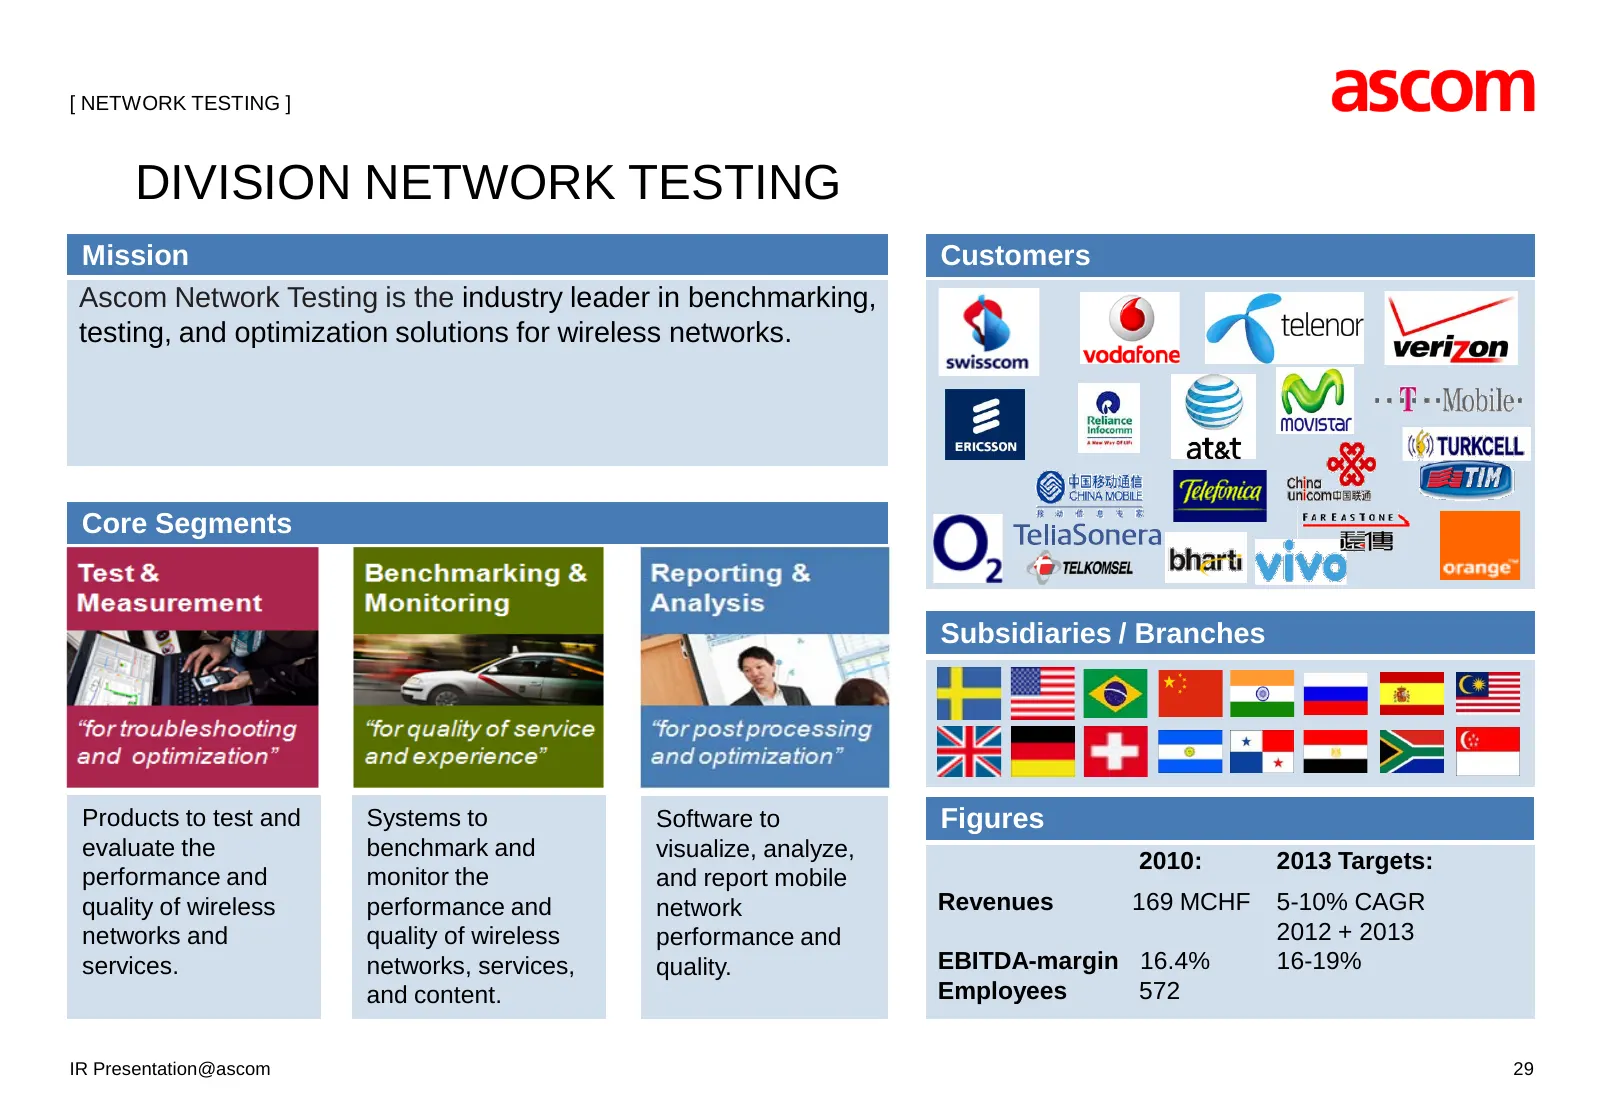
Slide 29: Division Network Testing
[ NETWORK TESTING ] DIVISION NETWORK TESTING Mission Customers Ascom Network Testing is the industry leader in benchmarking, testing, and optimization solutions for wireless networks. Core Segments Subsidiaries / Branches Products to test and Systems to Software to Figures evaluate the benchmark and
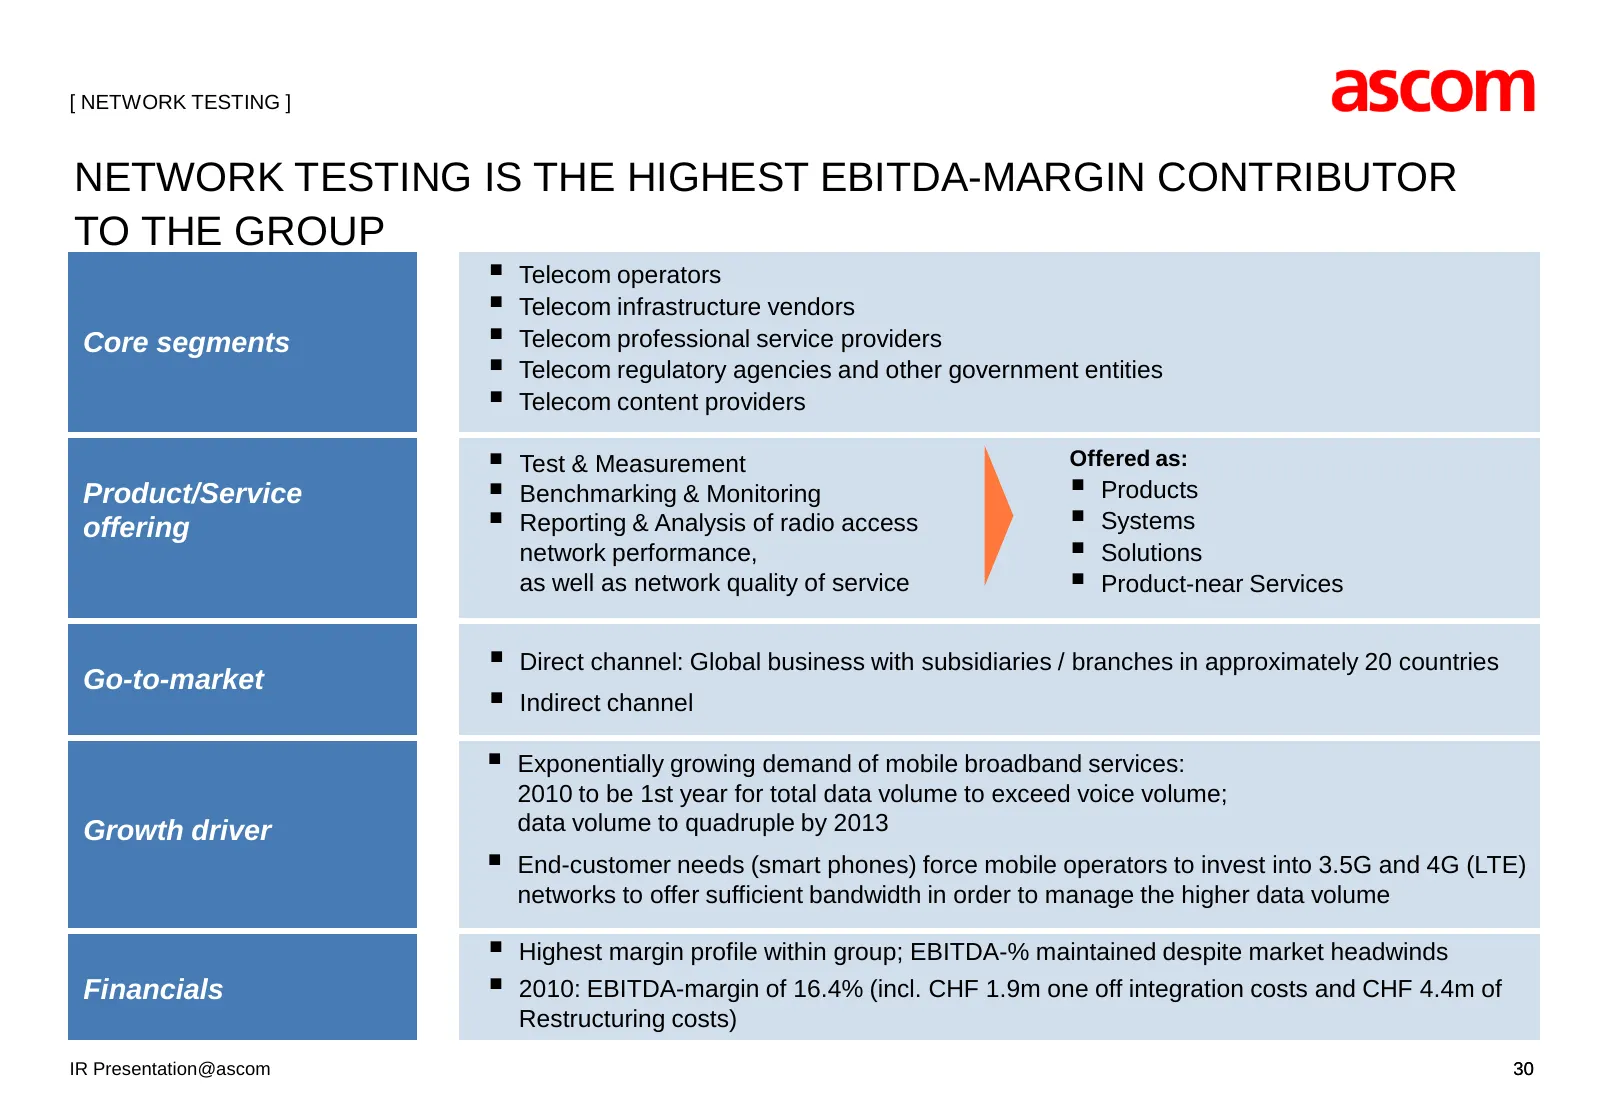
Slide 30: Network Testing Is the Highest EBITDA-Margin Contributor
[ NETWORK TESTING ] NETWORK TESTING IS THE HIGHEST EBITDA-MARGIN CONTRIBUTOR TO THE GROUP Telecom operators Telecom infrastructure vendors Core segments Telecom professional service providers Telecom regulatory agencies and other government entities Telecom content providers Test & Measu
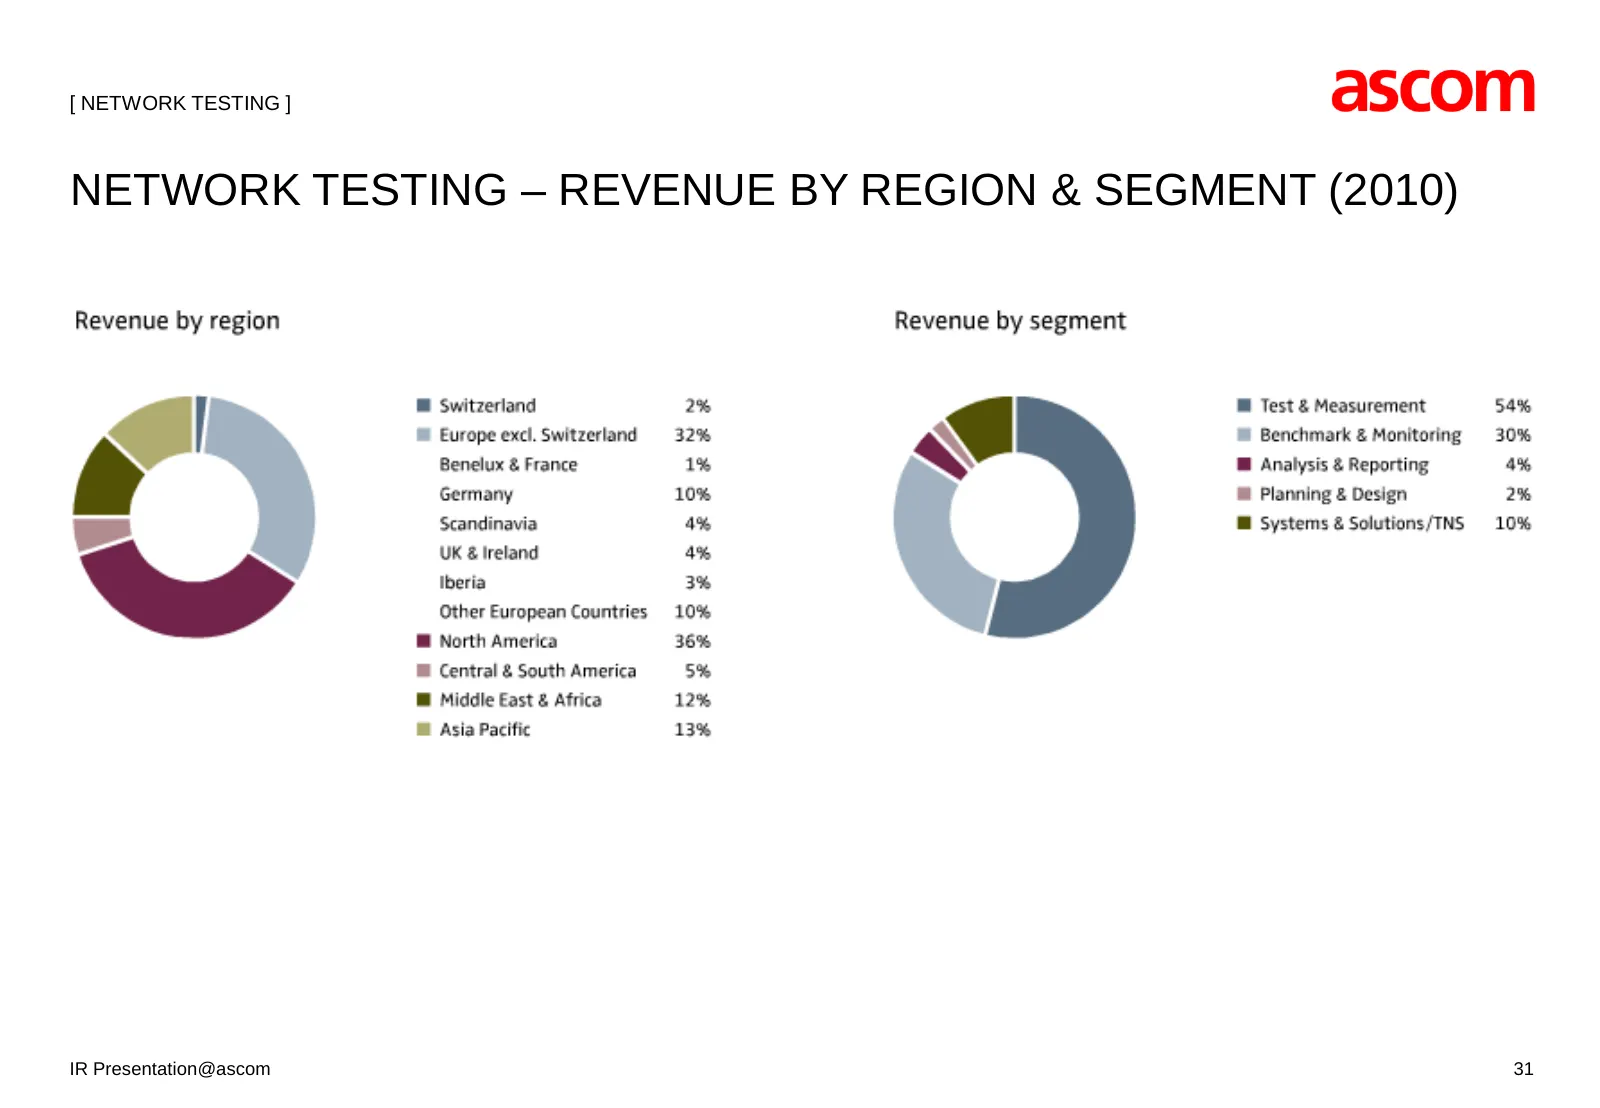
Slide 31: Network Testing – Revenue by Region & Segment (2010)
[ NETWORK TESTING ] NETWORK TESTING – REVENUE BY REGION & SEGMENT (2010) IR Presentation@ascom 31
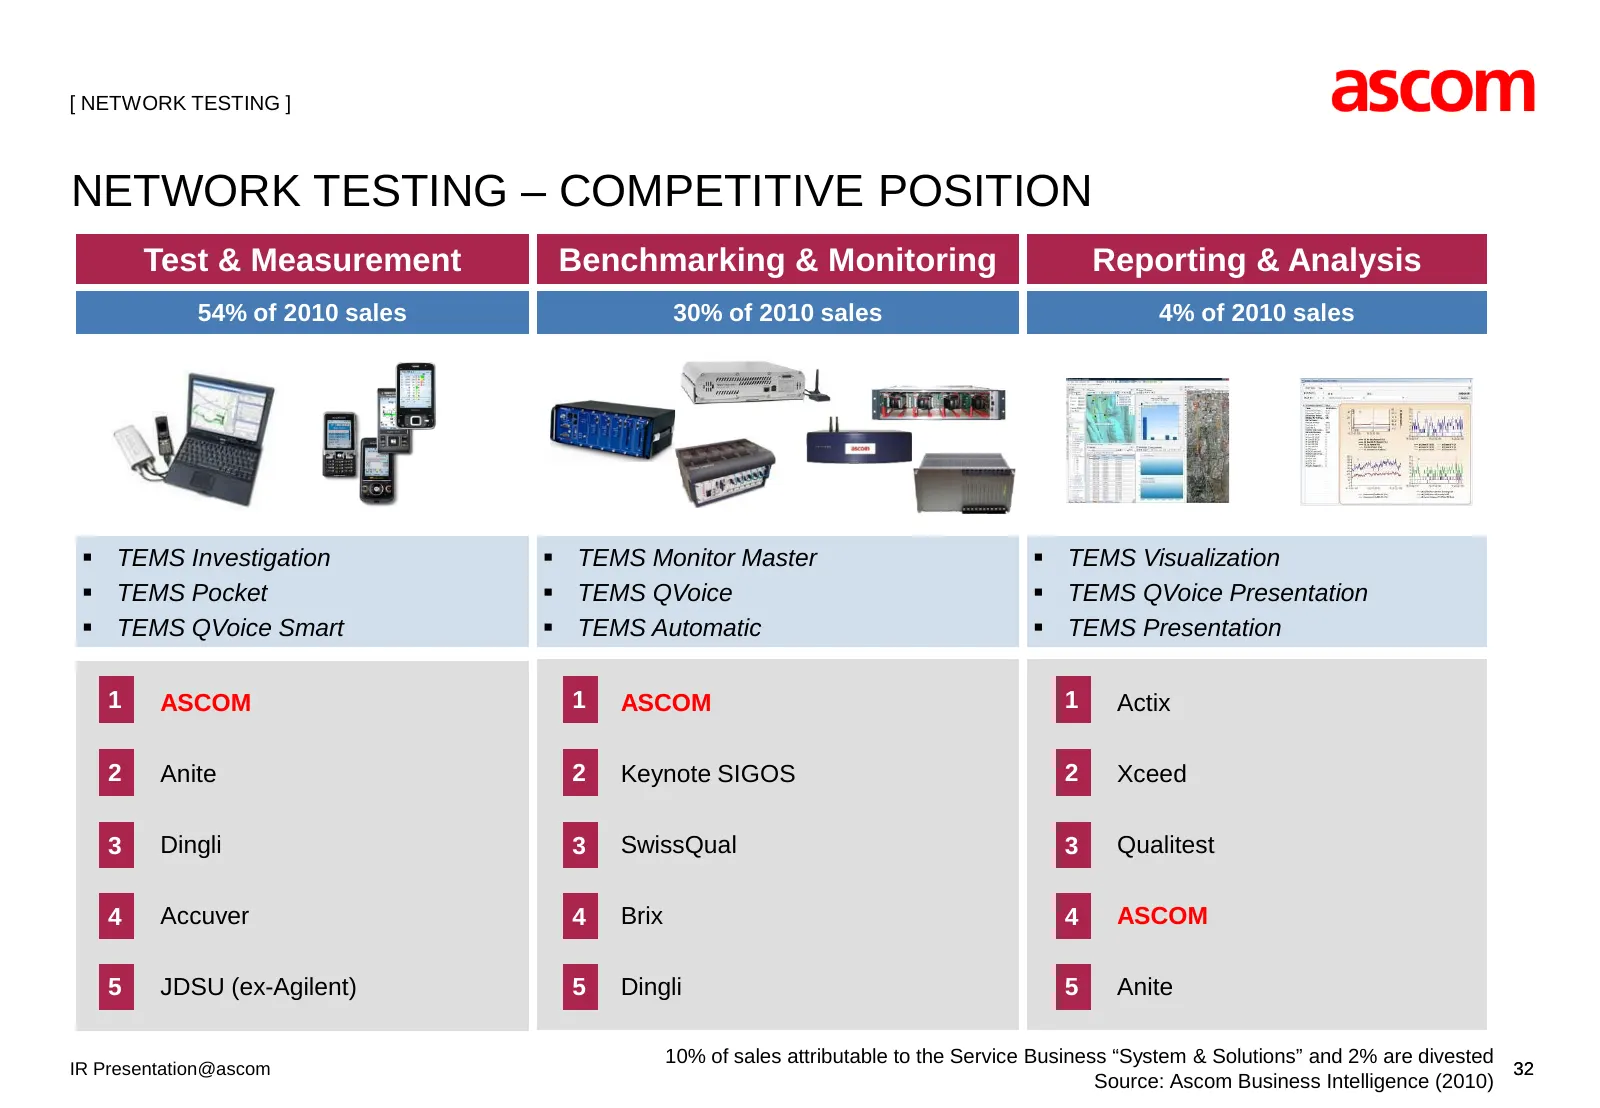
Slide 32: Network Testing – Competitive Position
[ NETWORK TESTING ] NETWORK TESTING – COMPETITIVE POSITION Test & Measurement Benchmarking & Monitoring Reporting & Analysis 54% of 2010 sales 30% of 2010 sales 4% of 2010 sales TEMS Investigation TEMS Monitor Master TEMS Visualization TEMS Pocket TEMS QVoice TEMS QVoice Presentation T
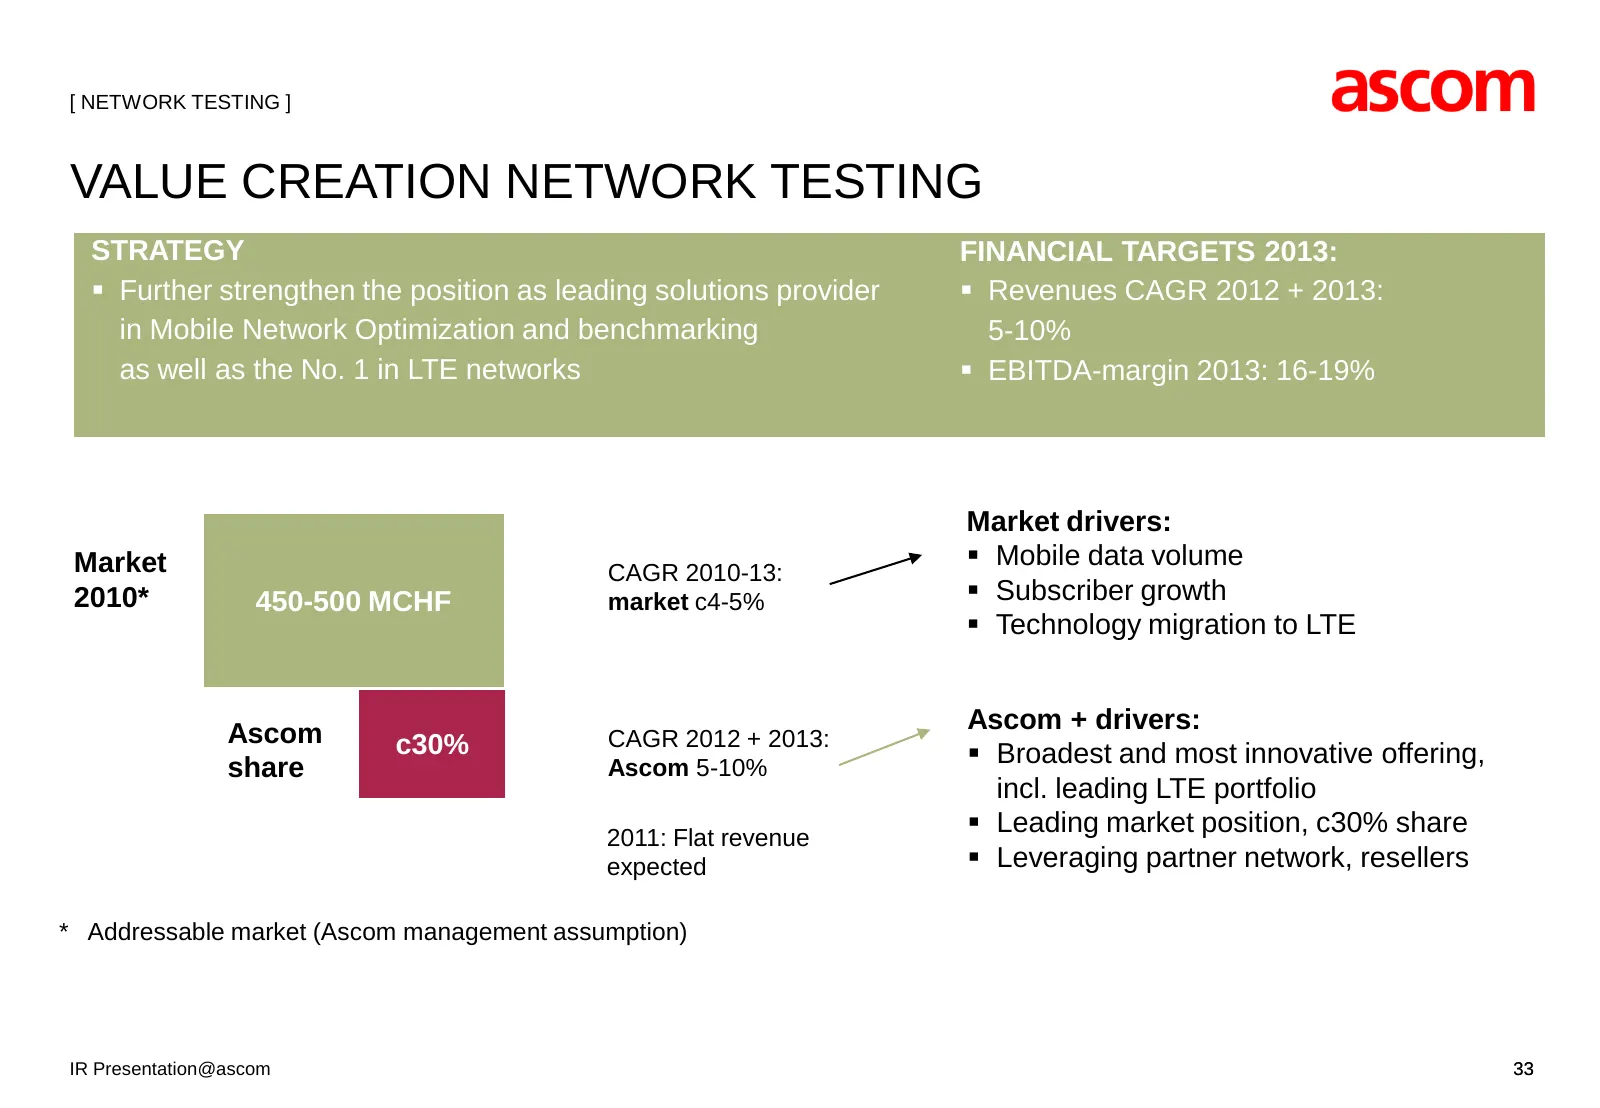
Slide 33: Value Creation Network Testing
[ NETWORK TESTING ] VALUE CREATION NETWORK TESTING STRATEGY FINANCIAL TARGETS 2013: Further strengthen the position as leading solutions provider Revenues CAGR 2012 + 2013: in Mobile Network Optimization and benchmarking 5-10% as well as the No. 1 in LTE networks EBITDA-margin 2013: 16-19% Mar
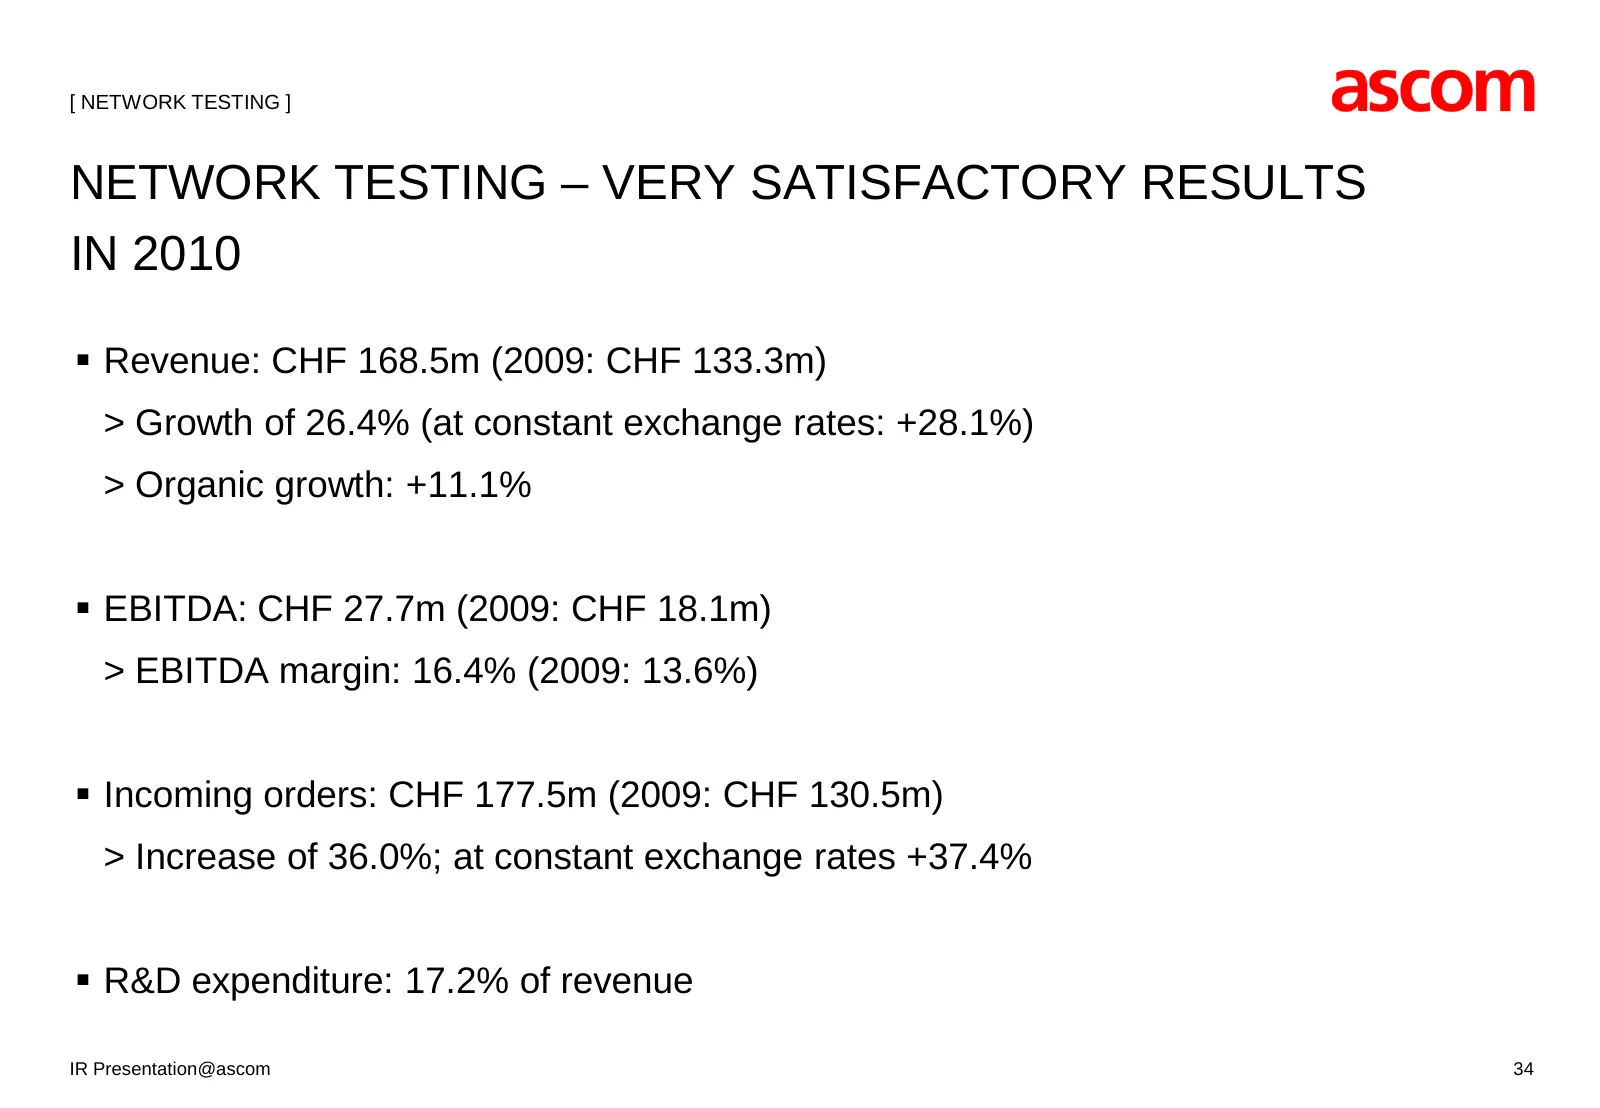
Slide 34: Network Testing – Very Satisfactory Results in 2010
[ NETWORK TESTING ] NETWORK TESTING – VERY SATISFACTORY RESULTS IN 2010 Revenue: CHF 168.5m (2009: CHF 133.3m) > Growth of 26.4% (at constant exchange rates: +28.1%) > Organic growth: +11.1% EBITDA: CHF 27.7m (2009: CHF 18.1m) > EBITDA margin: 16.4% (2009: 13.6%) Incoming orders: CHF 177.5m (2
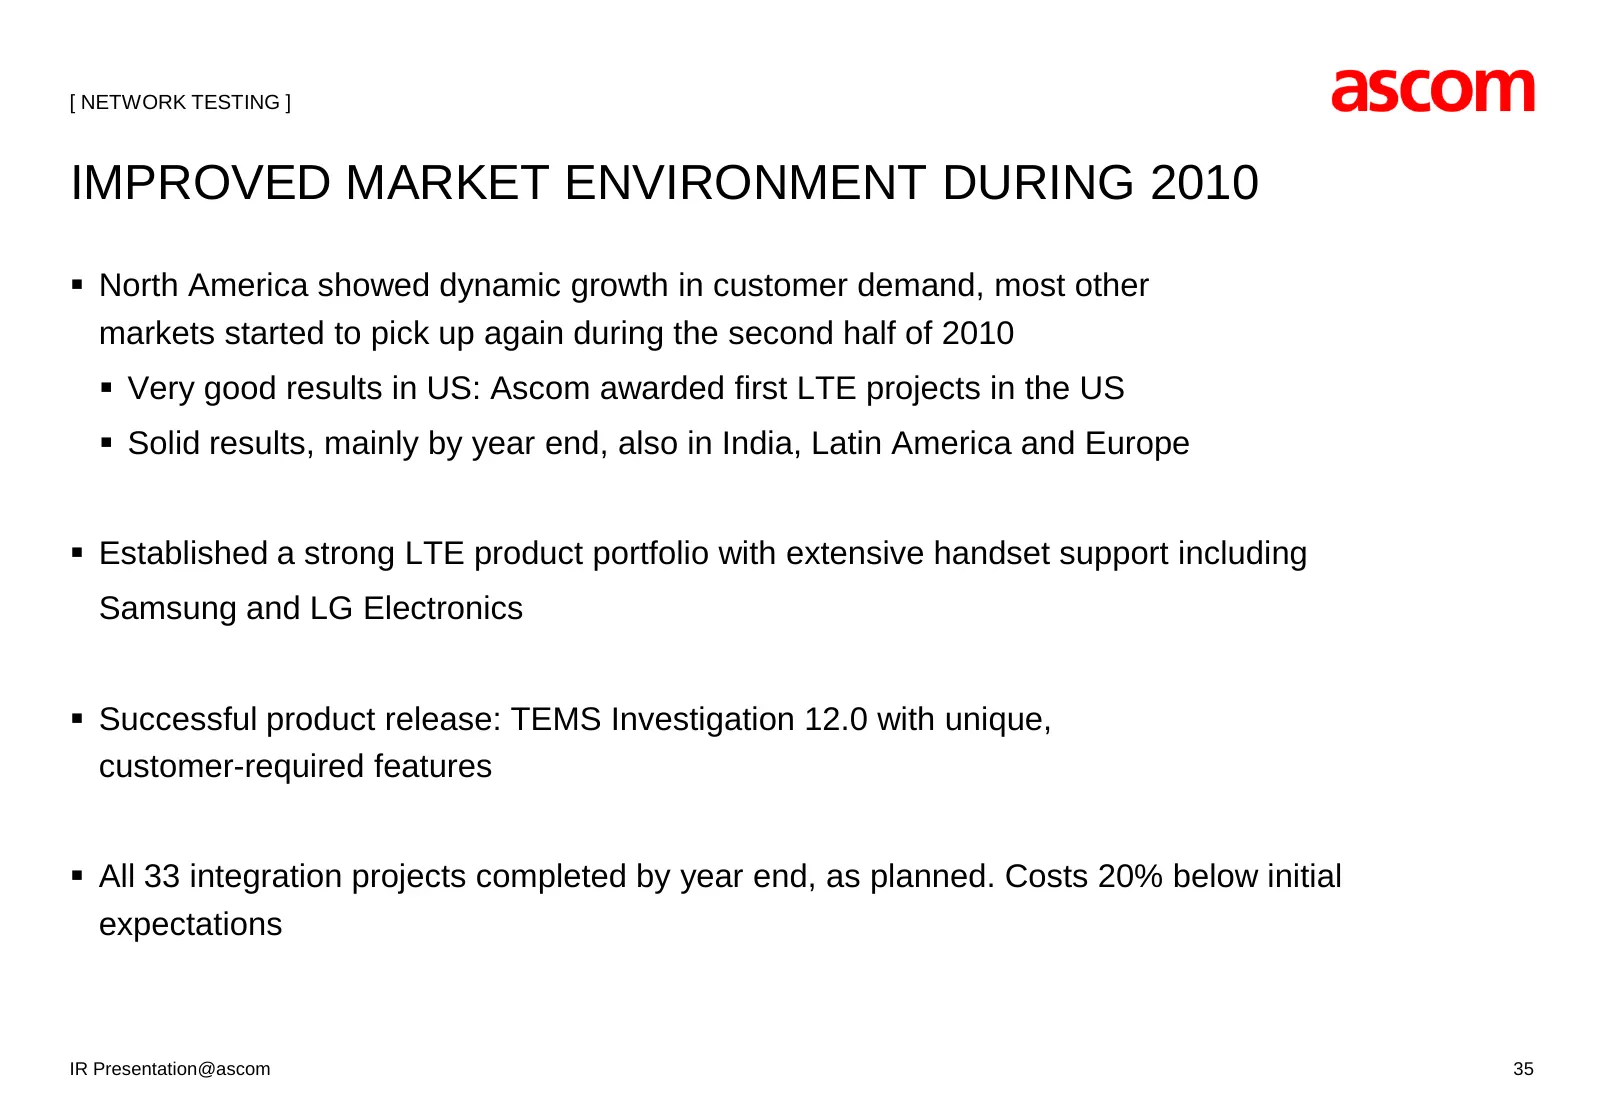
Slide 35: Improved Market Environment During 2010
[ NETWORK TESTING ] IMPROVED MARKET ENVIRONMENT DURING 2010 North America showed dynamic growth in customer demand, most other markets started to pick up again during the second half of 2010 Very good results in US: Ascom awarded first LTE projects in the US Solid results, mainly by year end,
Slide 36: Network Testing – Focus Items 2011
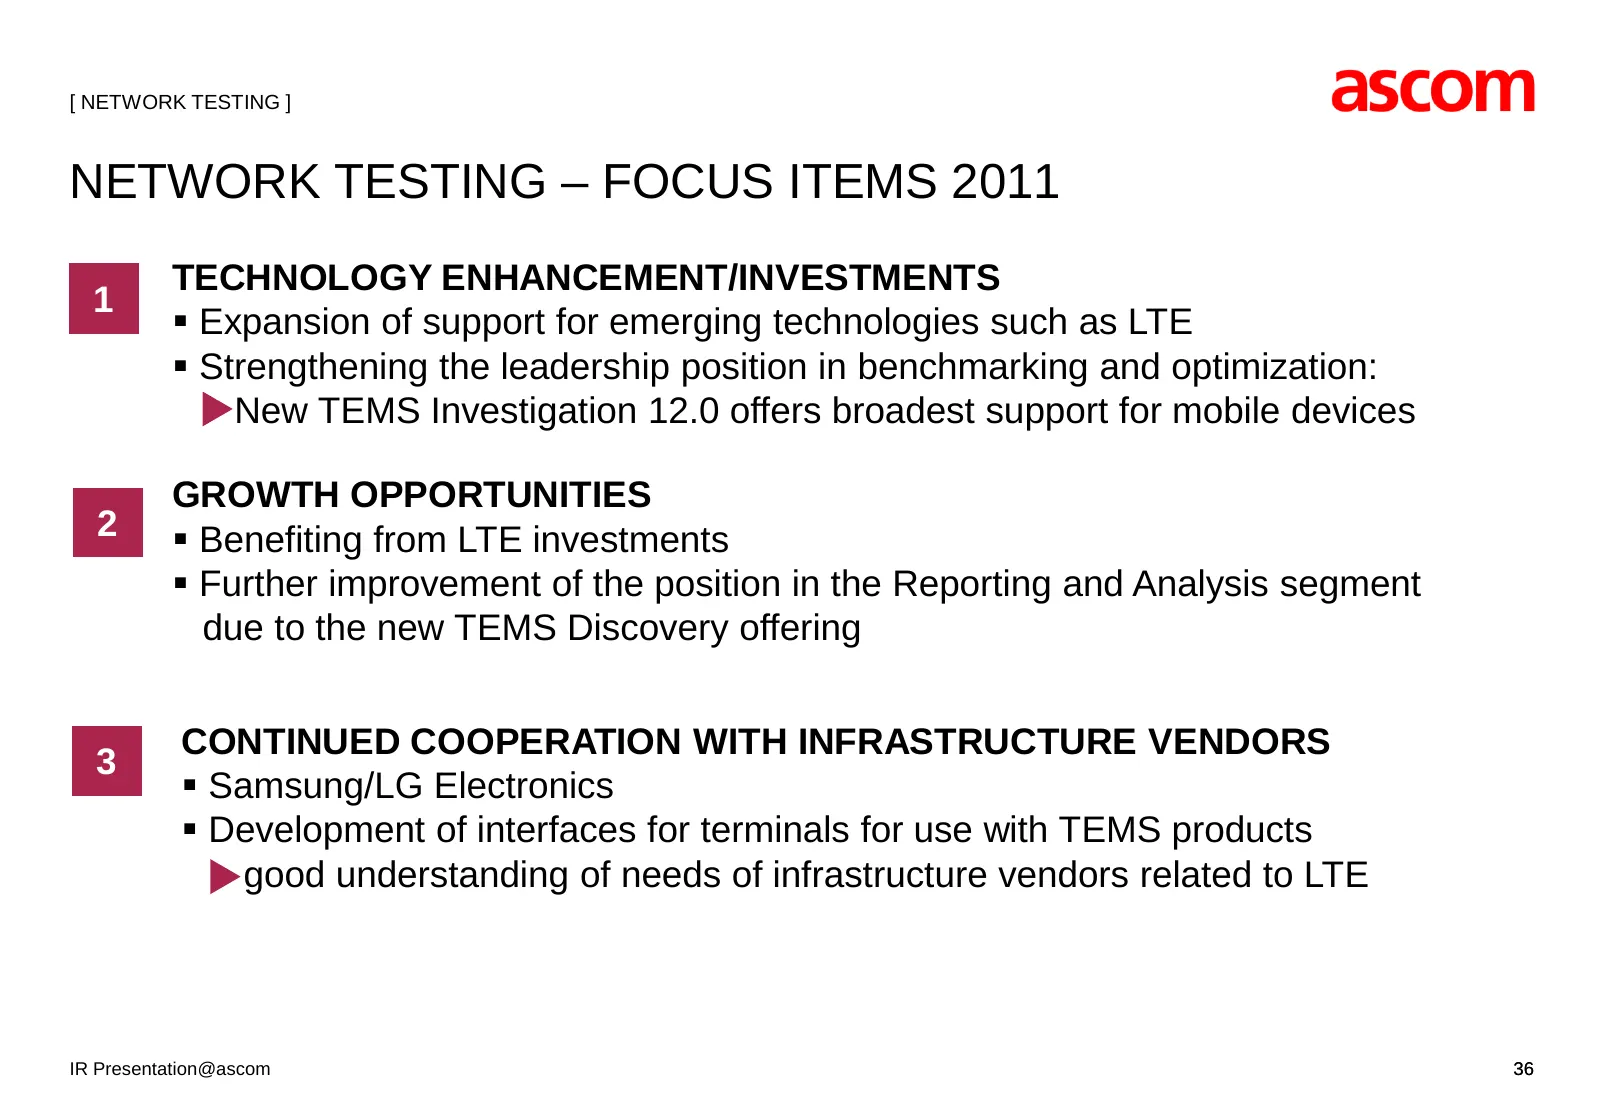
[ NETWORK TESTING ] NETWORK TESTING – FOCUS ITEMS 2011 TECHNOLOGY ENHANCEMENT/INVESTMENTS 1 Expansion of support for emerging technologies such as LTE Strengthening the leadership position in benchmarking and optimization: > New TEMS Investigation 12.0 offers broadest support for mobile devices
Slide 37: Network Testing – The New Division
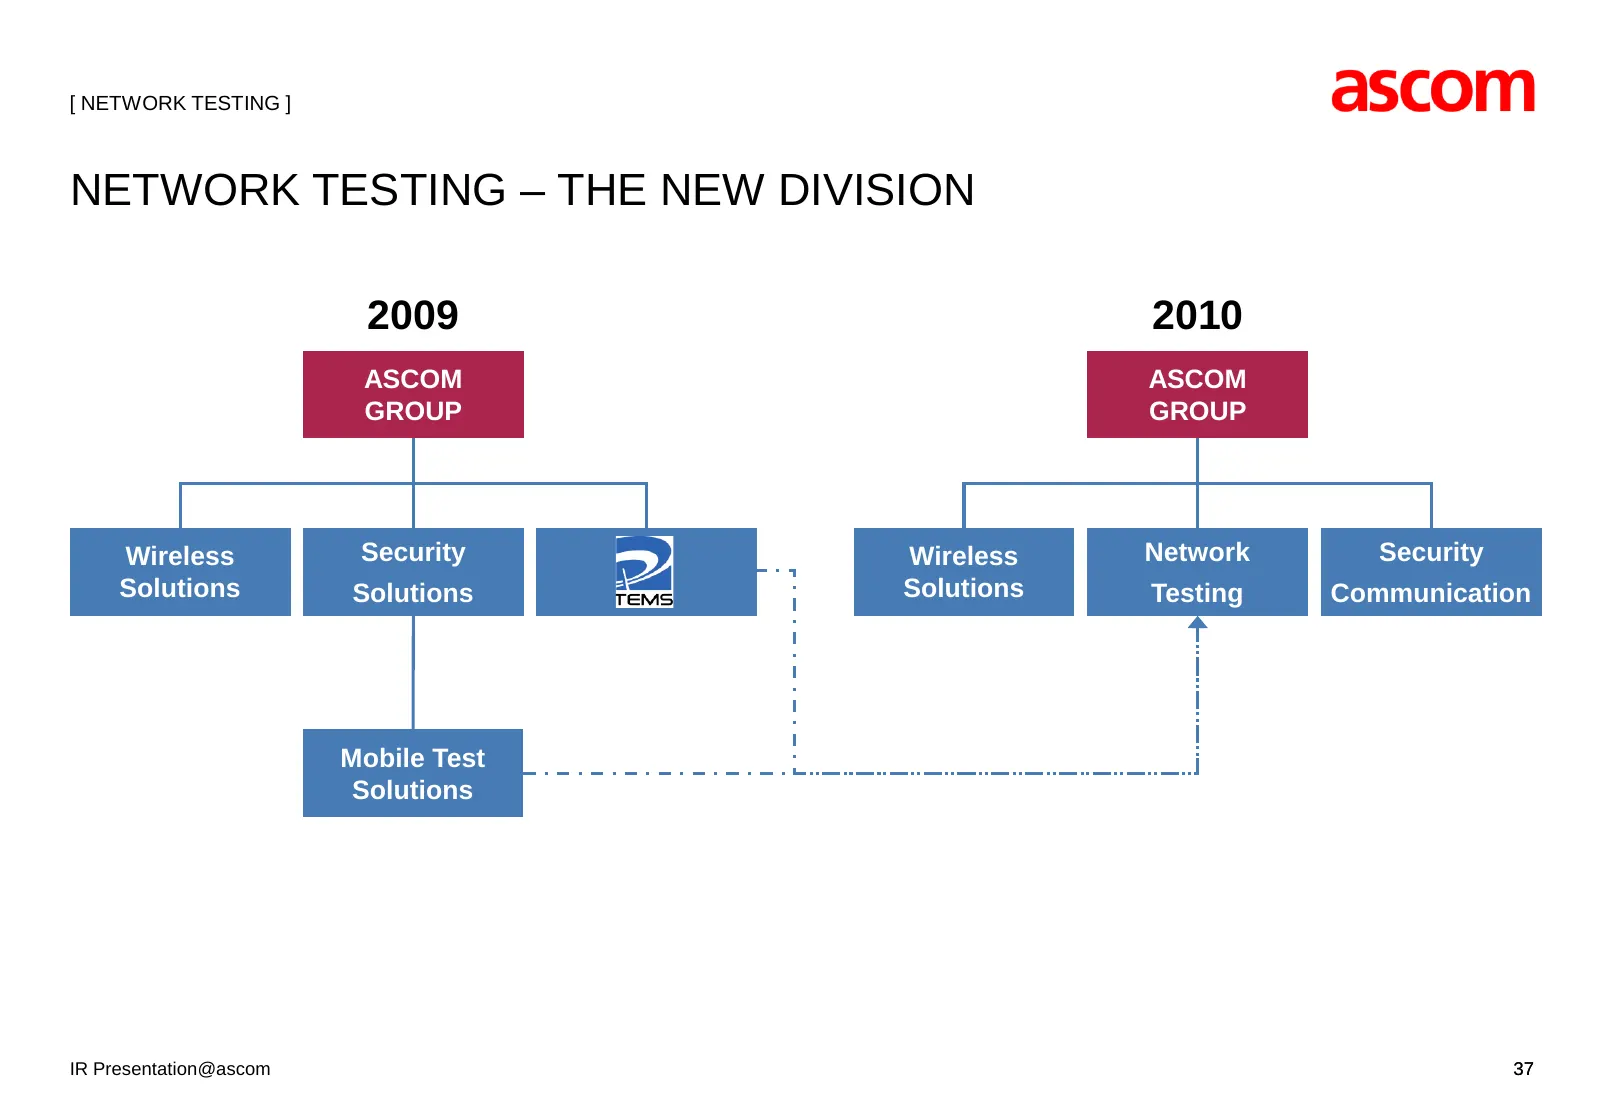
[ NETWORK TESTING ] NETWORK TESTING – THE NEW DIVISION 2009 2010 ASCOM ASCOM GROUP GROUP Wireless Security Wireless Network Security Solutions Solutions Solutions Testing Communication Mobile Test Solutions IR Presentation@ascom 37
Slide 38: Reduction of Dependency on Ericsson as a Reseller
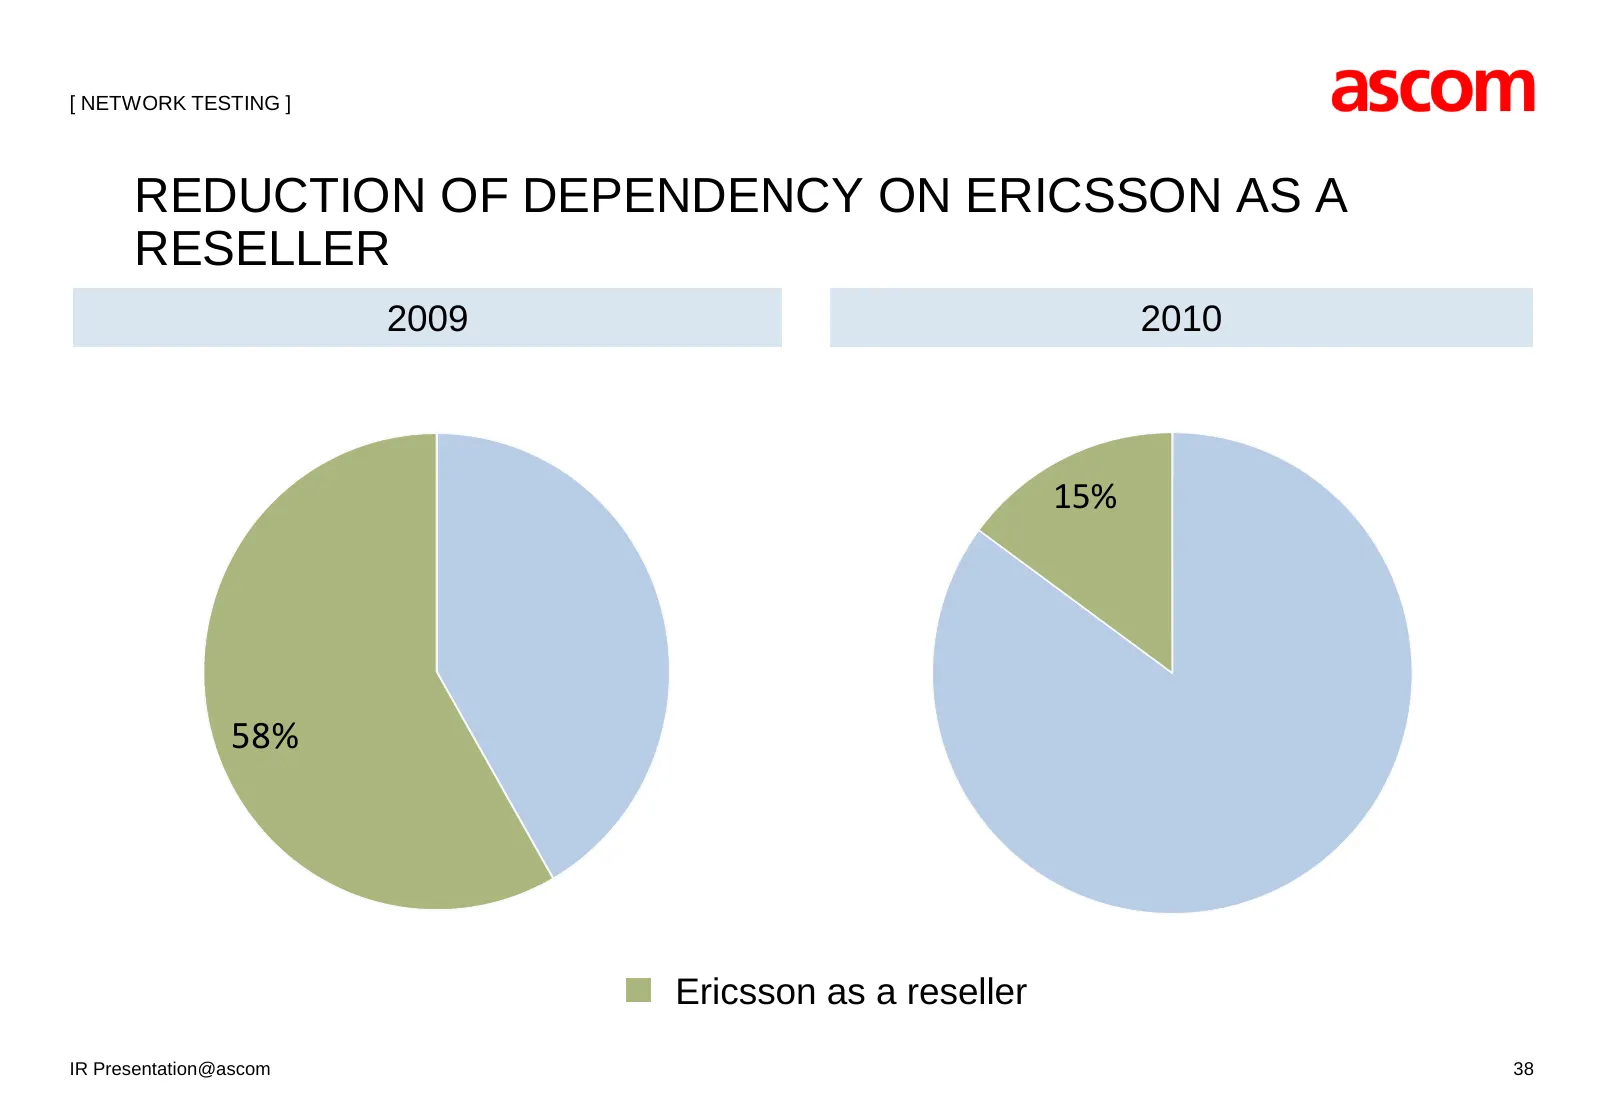
[ NETWORK TESTING ] REDUCTION OF DEPENDENCY ON ERICSSON AS A RESELLER 2009 2010 15% 58% Ericsson as a reseller IR Presentation@ascom 38
Slide 39: Security Communication
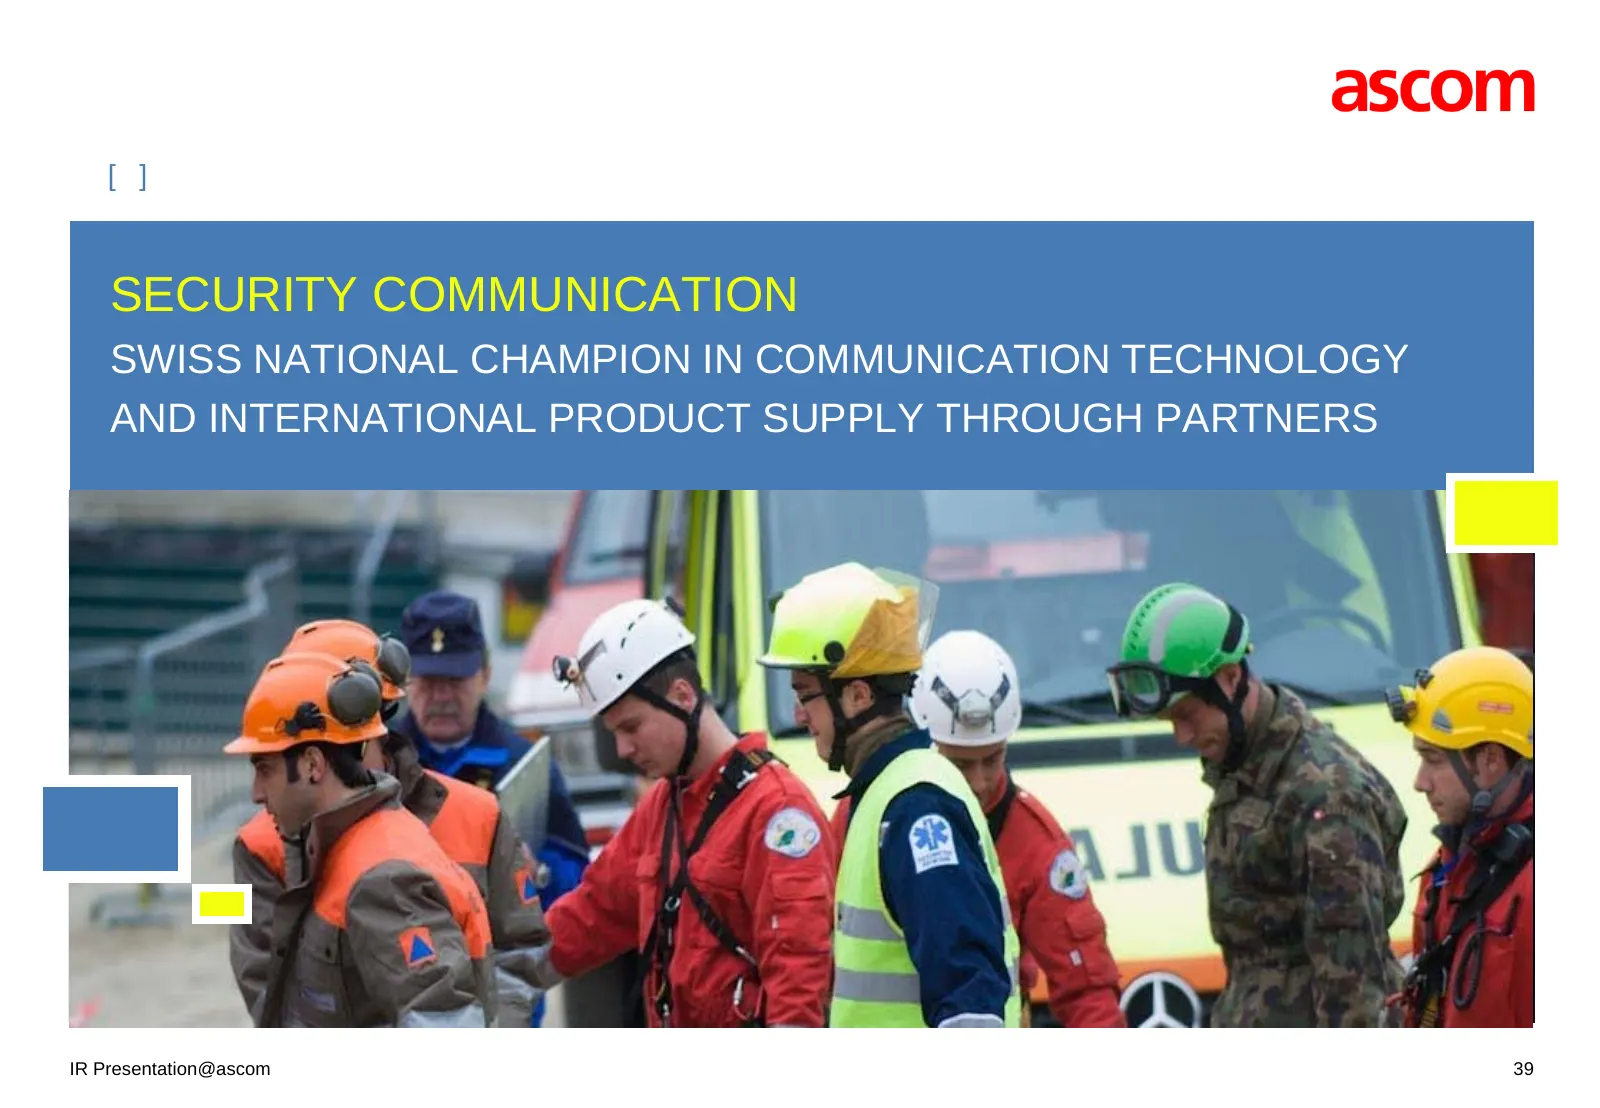
[ ] SECURITY COMMUNICATION SWISS NATIONAL CHAMPION IN COMMUNICATION TECHNOLOGY AND INTERNATIONAL PRODUCT SUPPLY THROUGH PARTNERS IR Presentation@ascom 39
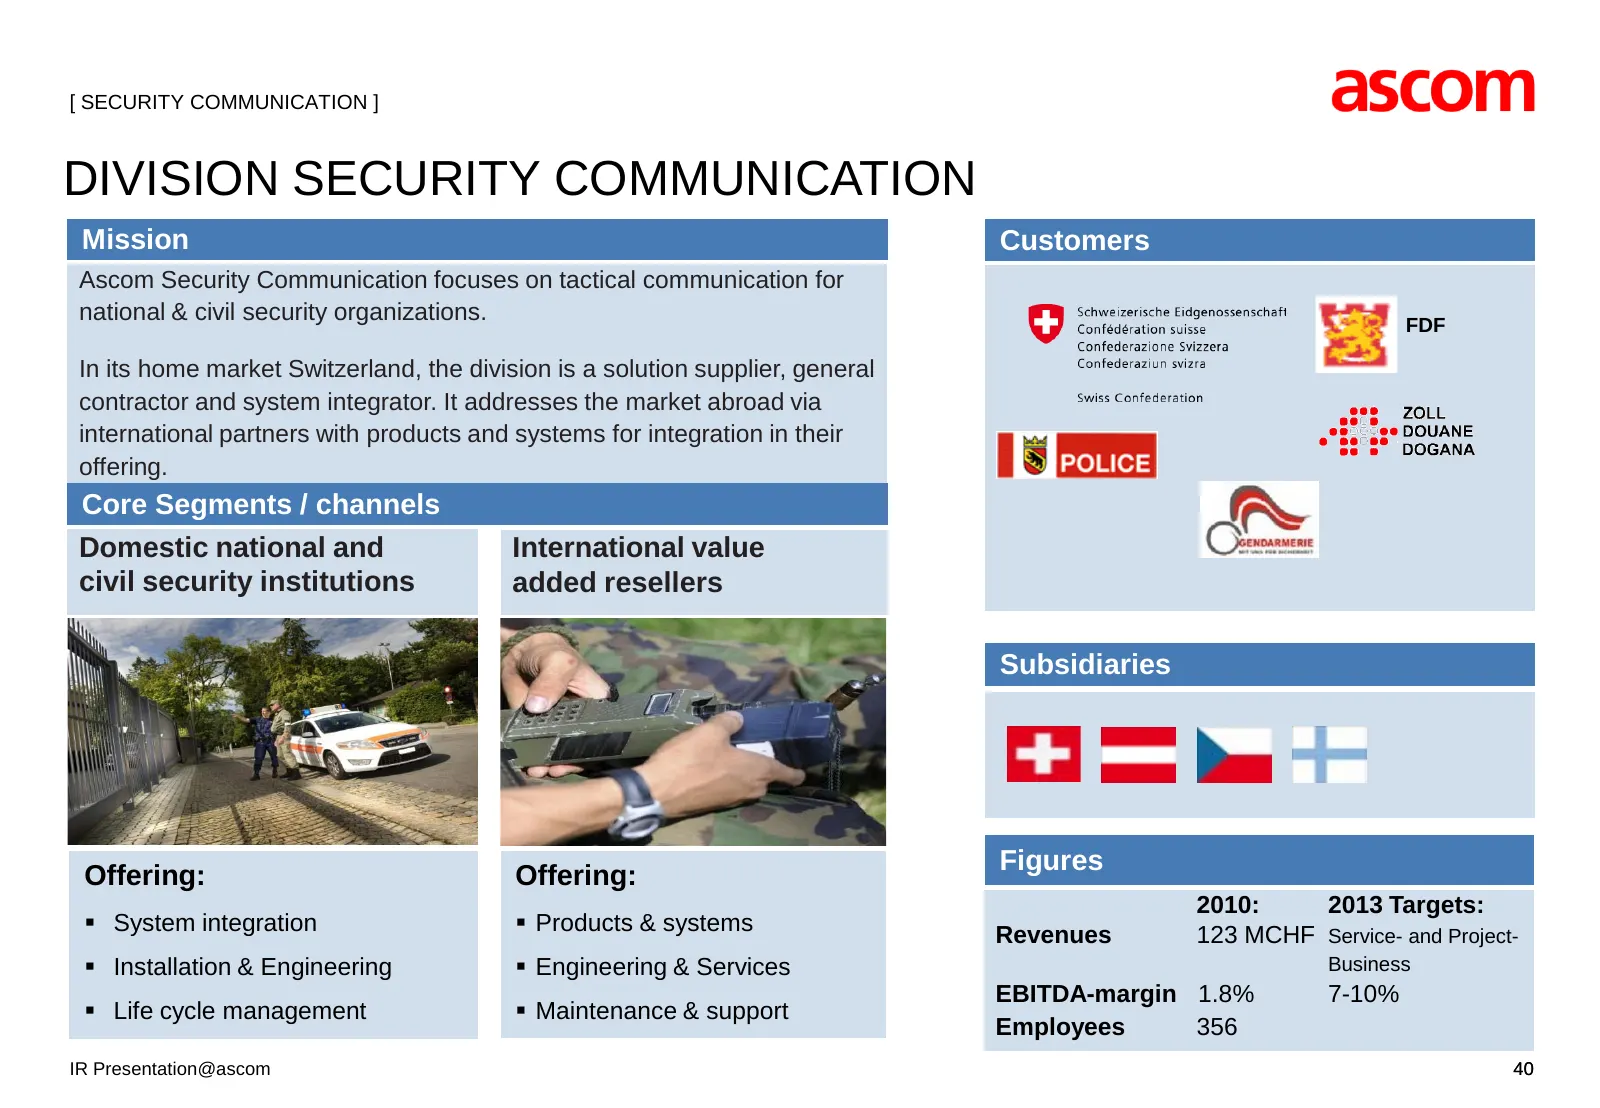
Slide 40: Division Security Communication
[ SECURITY COMMUNICATION ] DIVISION SECURITY COMMUNICATION Mission Customers Ascom Security Communication focuses on tactical communication for national & civil security organizations. FDF In its home market Switzerland, the division is a solution supplier, general contractor and system integrator.
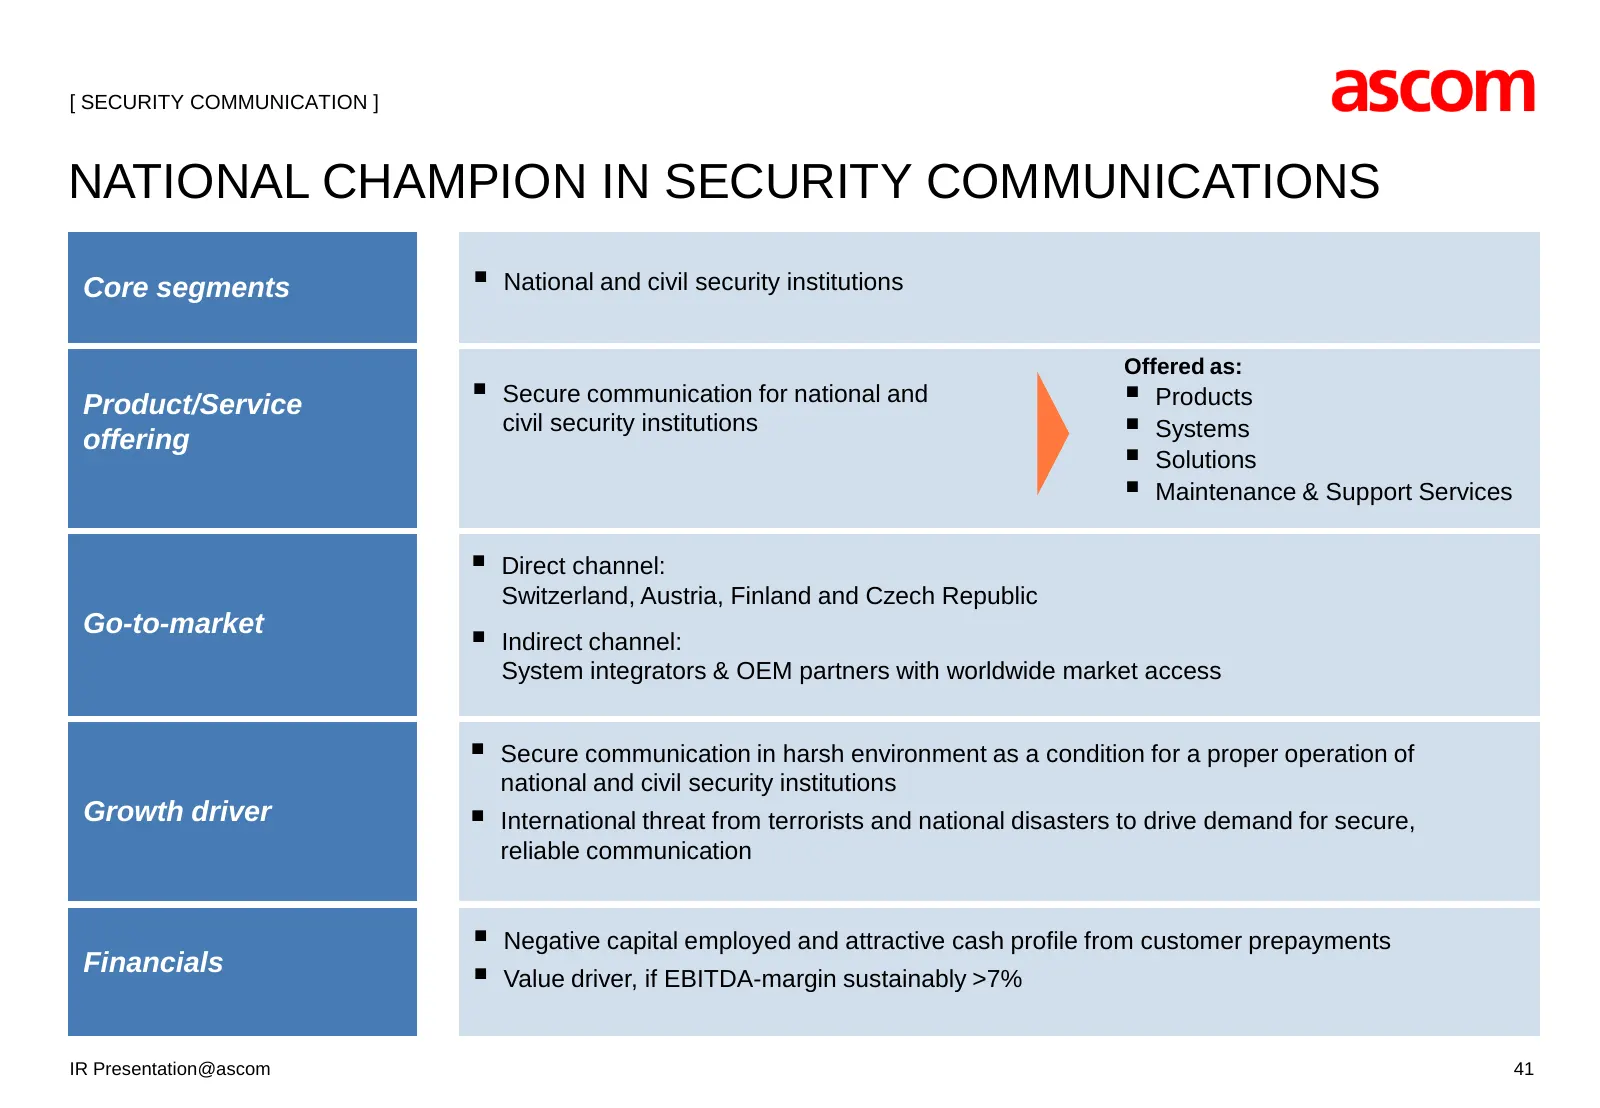
Slide 41: National Champion in Security Communications
[ SECURITY COMMUNICATION ] NATIONAL CHAMPION IN SECURITY COMMUNICATIONS Core segments National and civil security institutions Offered as: Product/Service Secure communication for national and Products offering civil security institutions Systems Solutions Maintenance & Support Services
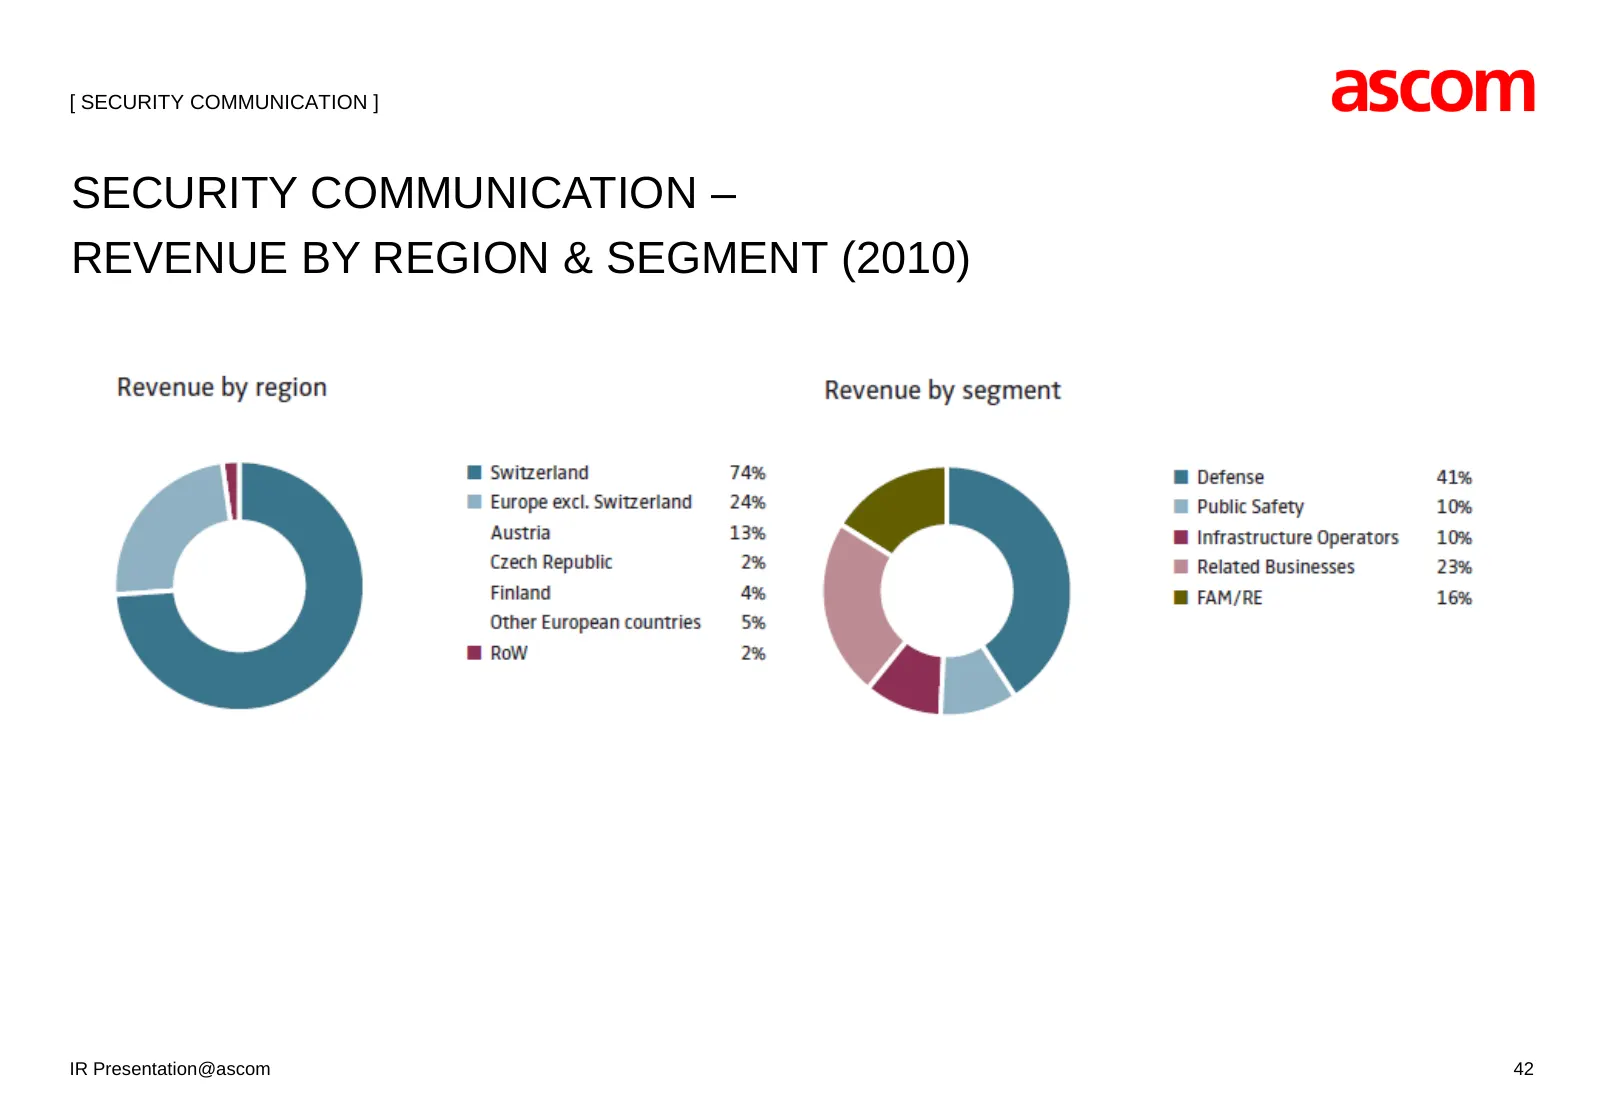
Slide 42: Security Communication – Revenue by Region & Segment (2010)
[ SECURITY COMMUNICATION ] SECURITY COMMUNICATION – REVENUE BY REGION & SEGMENT (2010) IR Presentation@ascom 42
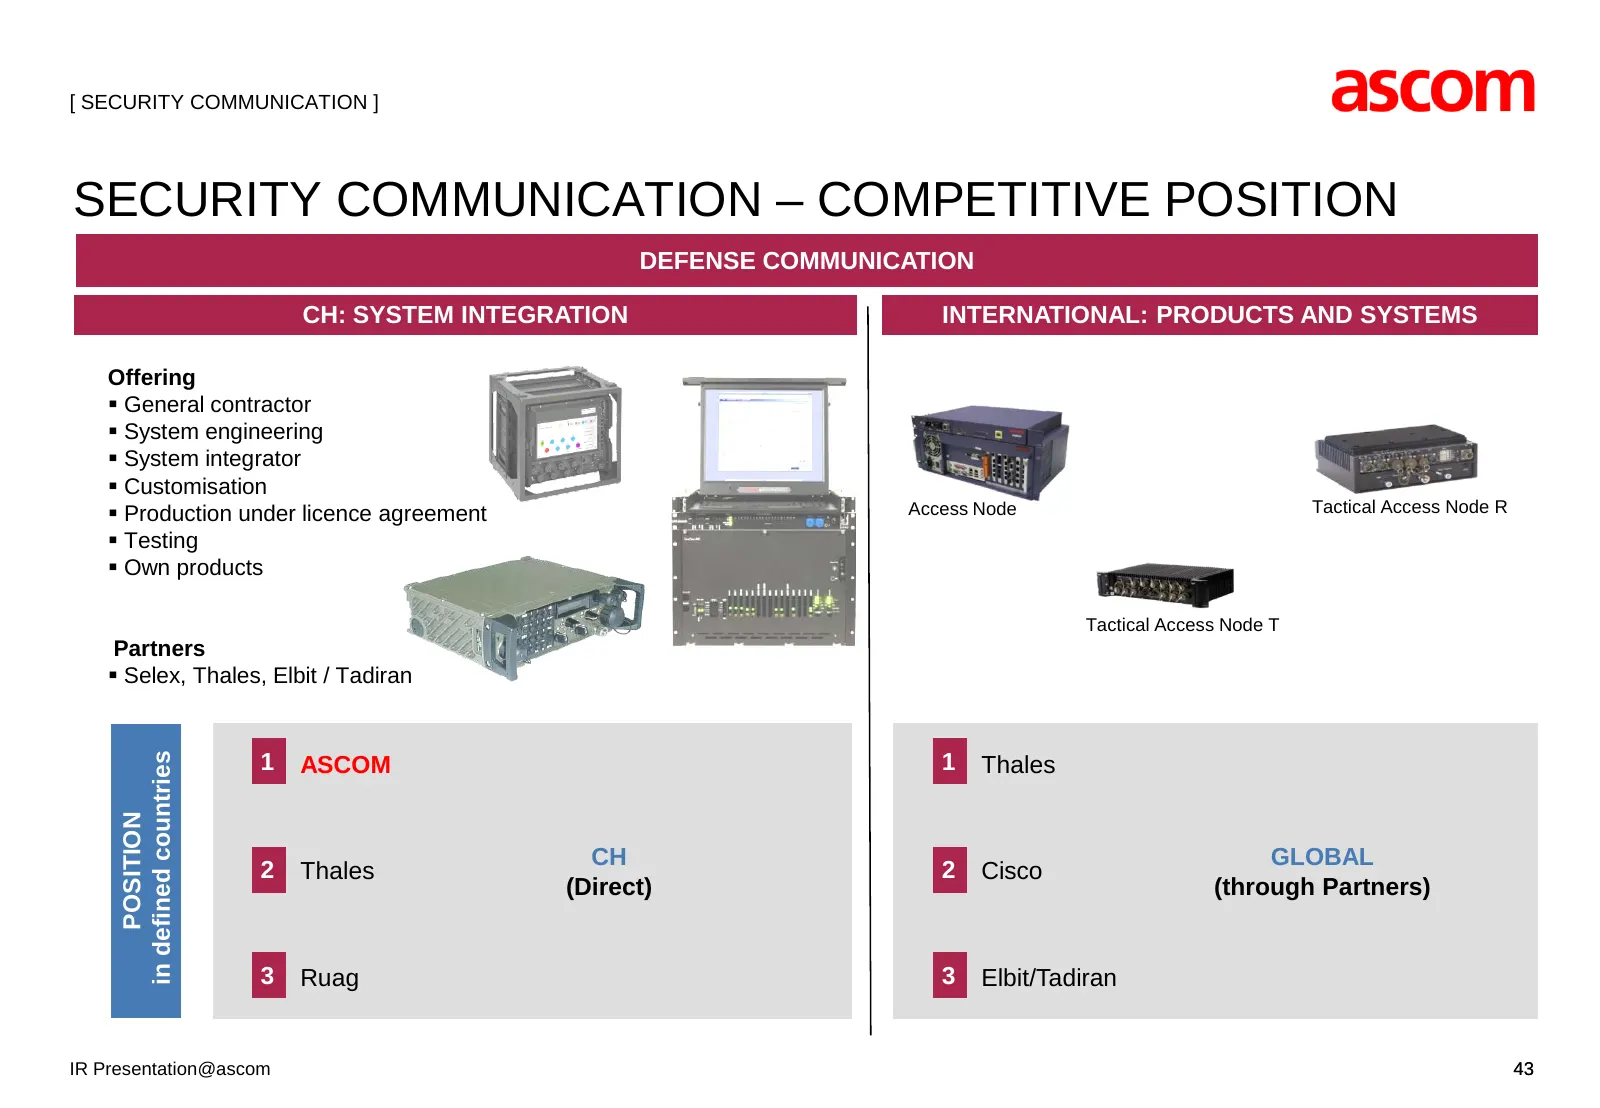
Slide 43: Security Communication – Competitive Position (Defense)
[ SECURITY COMMUNICATION ] SECURITY COMMUNICATION – COMPETITIVE POSITION DEFENSE COMMUNICATION CH: SYSTEM INTEGRATION INTERNATIONAL: PRODUCTS AND SYSTEMS Offering General contractor System engineering System integrator Customisation Production under licence agreement Access Node Tactical A
Slide 44: Security Communication – Competitive Position (Infrastructure, Public Safety)
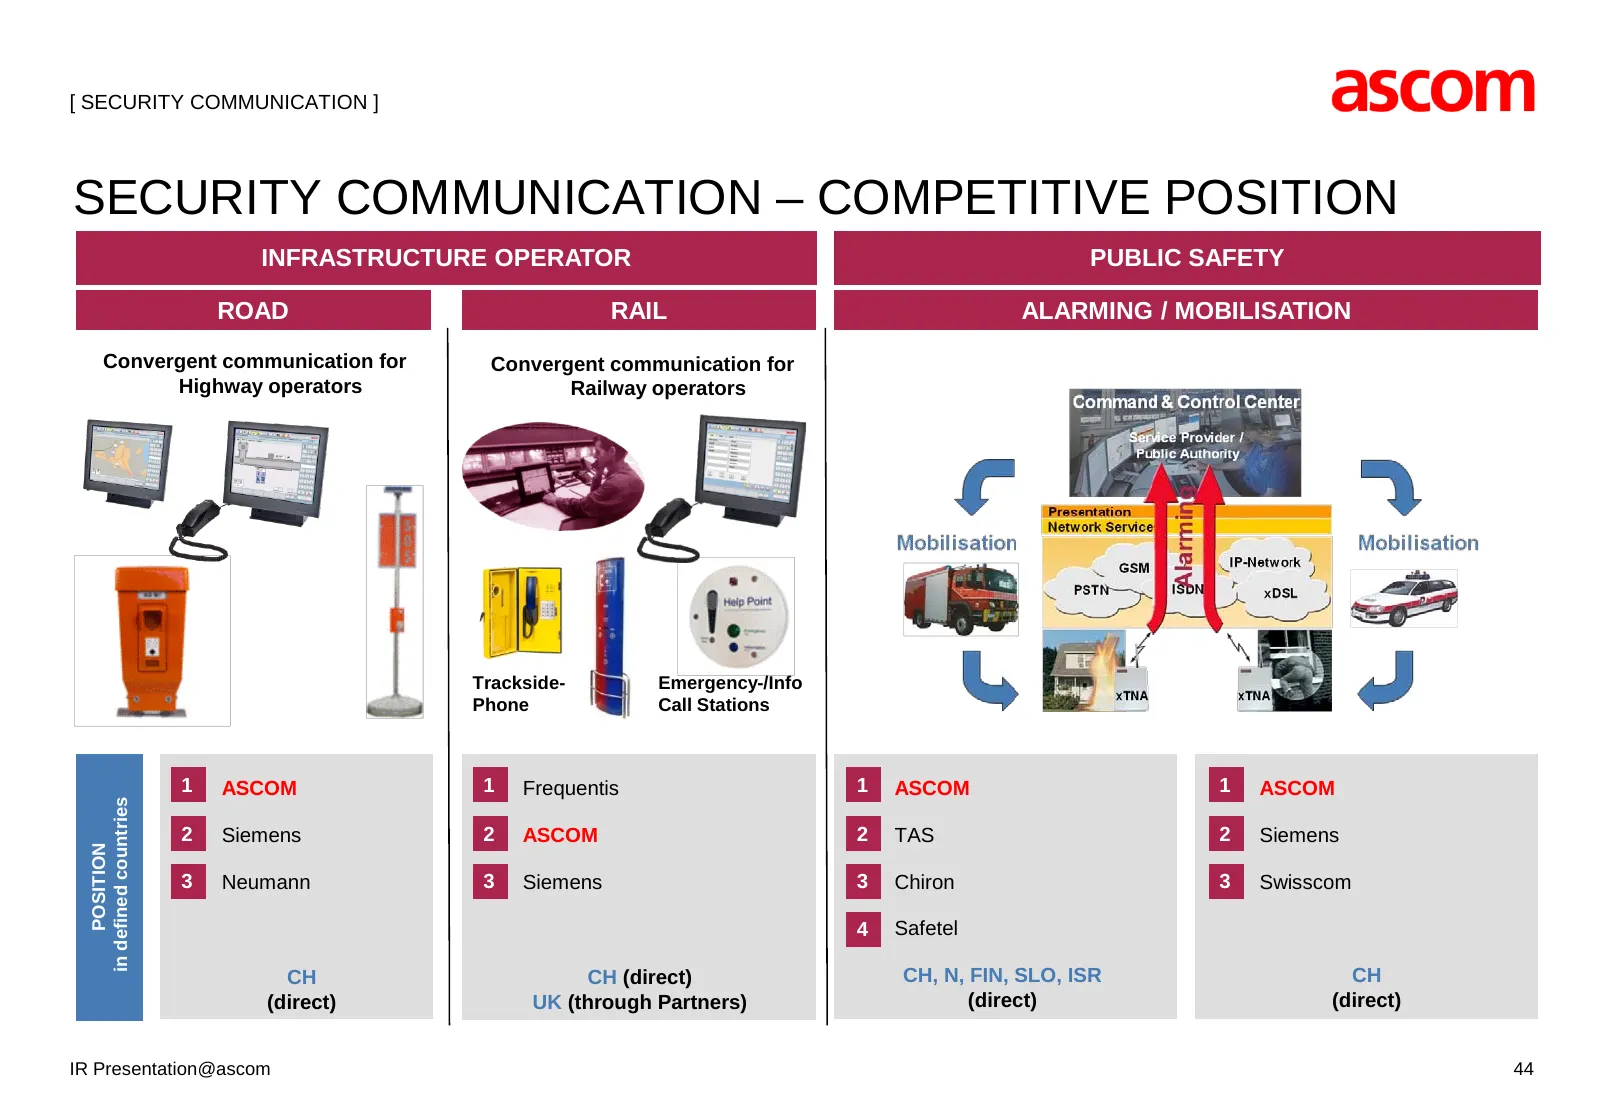
[ SECURITY COMMUNICATION ] SECURITY COMMUNICATION – COMPETITIVE POSITION INFRASTRUCTURE OPERATOR PUBLIC SAFETY ROAD RAIL ALARMING / MOBILISATION Convergent communication for Convergent communication for Highway operators Railway operators Trackside- Emergency-/Info Phone Call Stations 1 ASCOM 1 Freq
Slide 45: Value Creation Security Communication
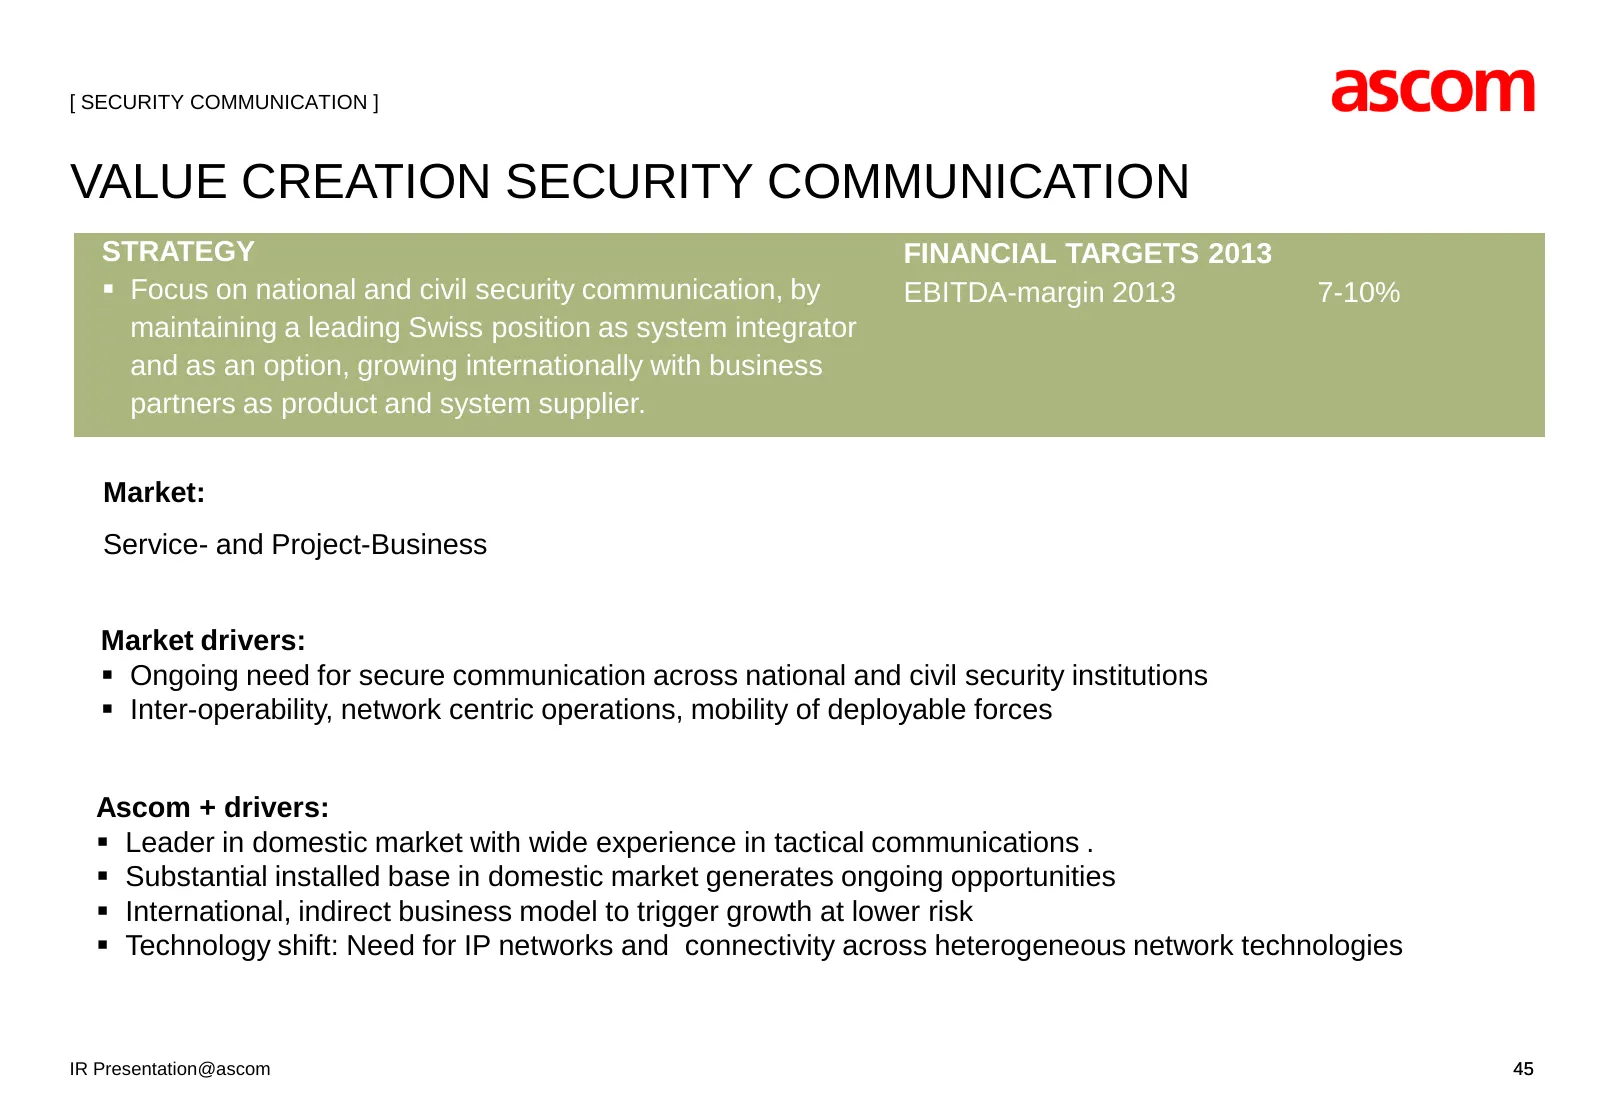
[ SECURITY COMMUNICATION ] VALUE CREATION SECURITY COMMUNICATION STRATEGY FINANCIAL TARGETS 2013 Focus on national and civil security communication, by EBITDA-margin 2013 7-10% maintaining a leading Swiss position as system integrator and as an option, growing internationally with business partner
Slide 46: Challenging Market Environment in 2010
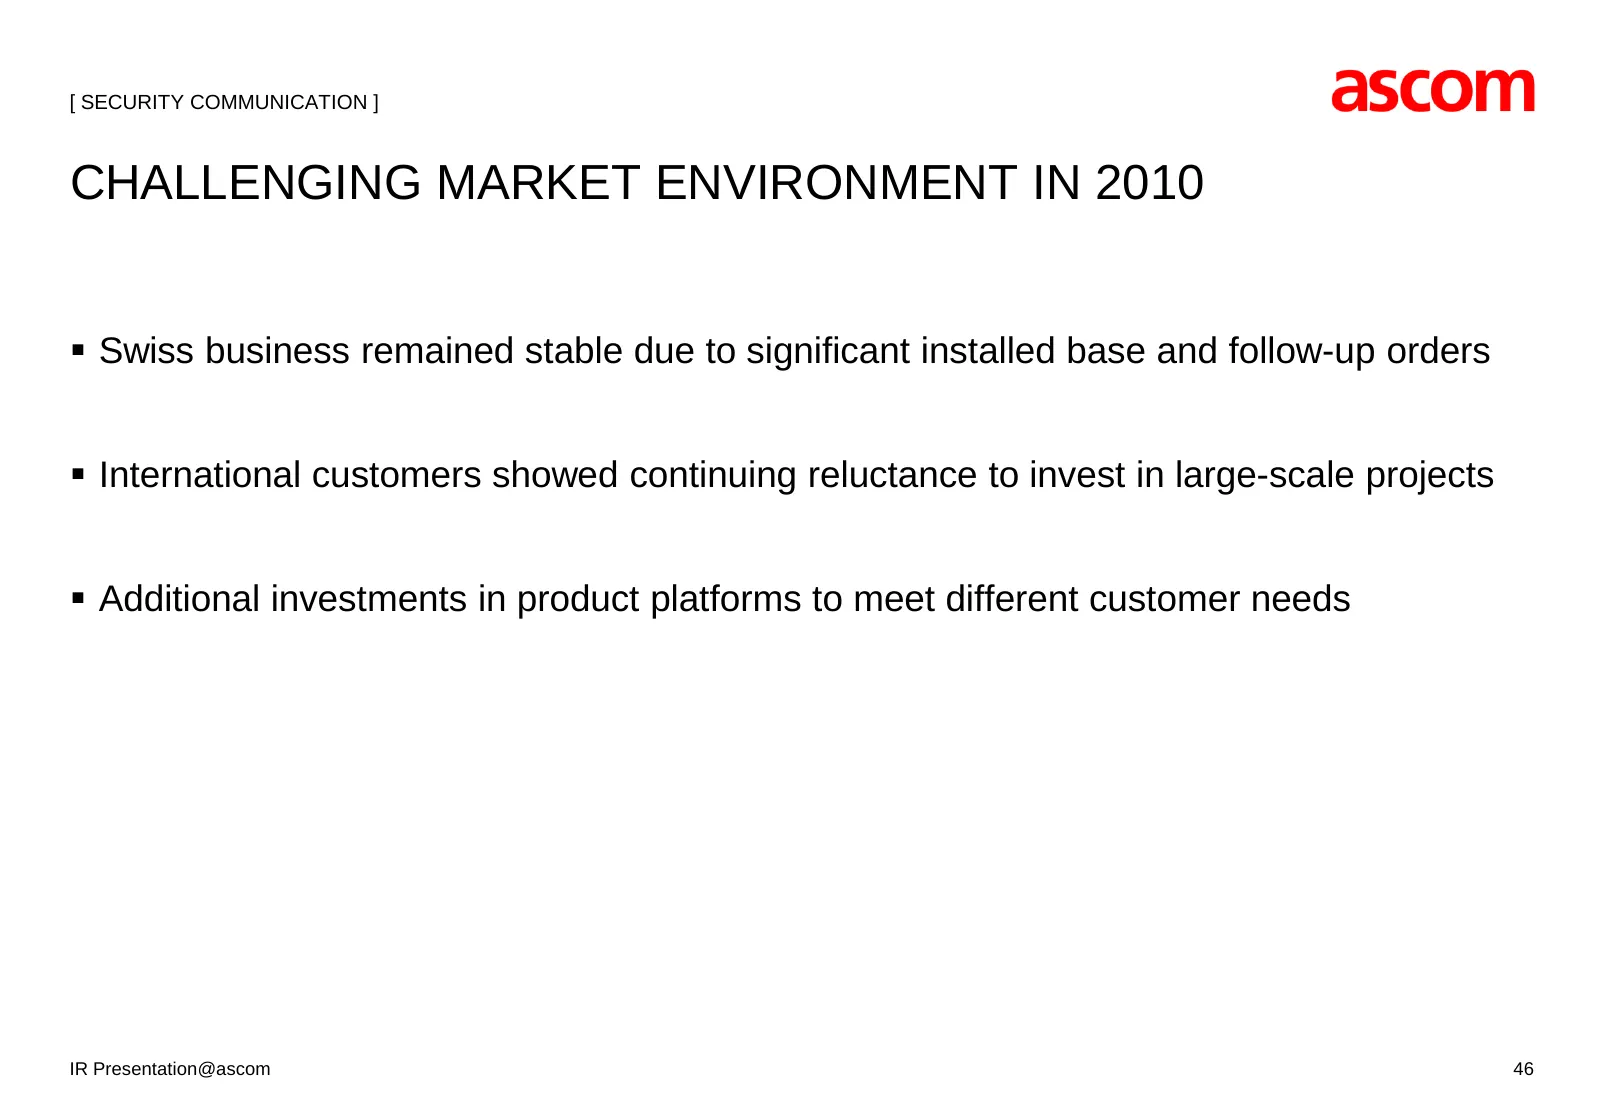
[ SECURITY COMMUNICATION ] CHALLENGING MARKET ENVIRONMENT IN 2010 Swiss business remained stable due to significant installed base and follow-up orders International customers showed continuing reluctance to invest in large-scale projects Additional investments in product platforms to meet dif
Slide 47: Security Communication – Lower Profitability but Increase in Incoming Orders
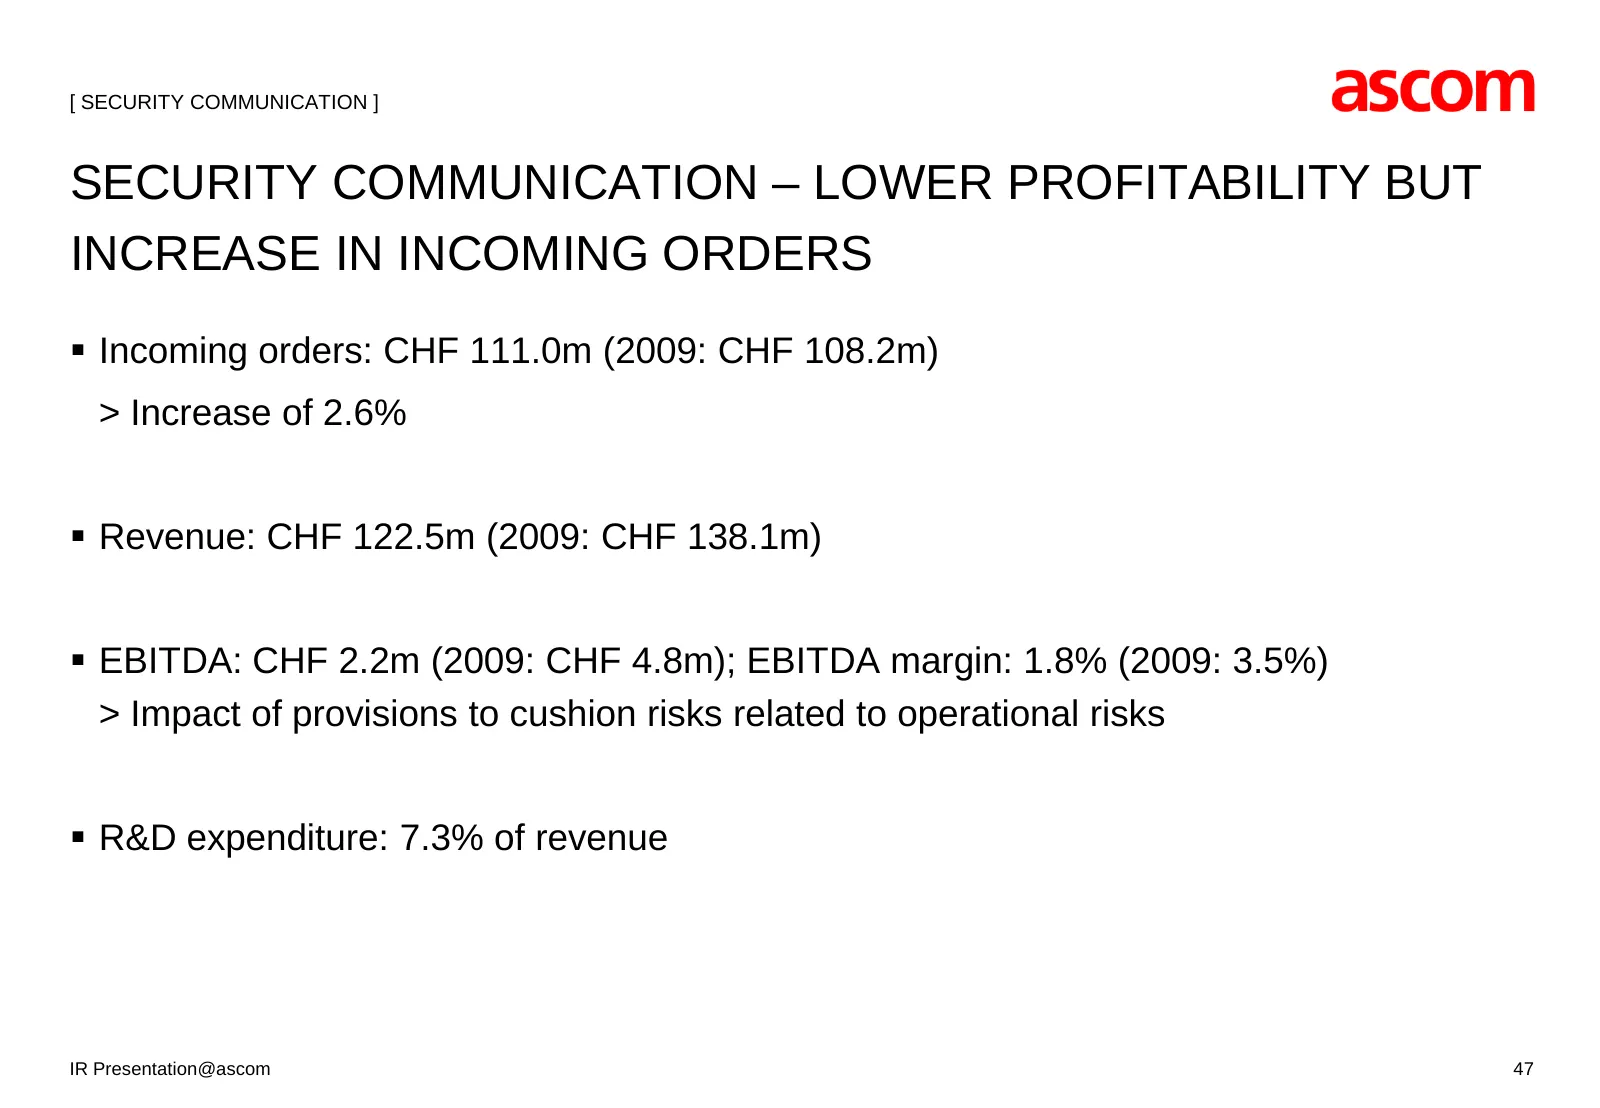
[ SECURITY COMMUNICATION ] SECURITY COMMUNICATION – LOWER PROFITABILITY BUT INCREASE IN INCOMING ORDERS Incoming orders: CHF 111.0m (2009: CHF 108.2m) > Increase of 2.6% Revenue: CHF 122.5m (2009: CHF 138.1m) EBITDA: CHF 2.2m (2009: CHF 4.8m); EBITDA margin: 1.8% (2009: 3.5%) > Impact of provi
Slide 48: Security Communication – Focus Items 2011
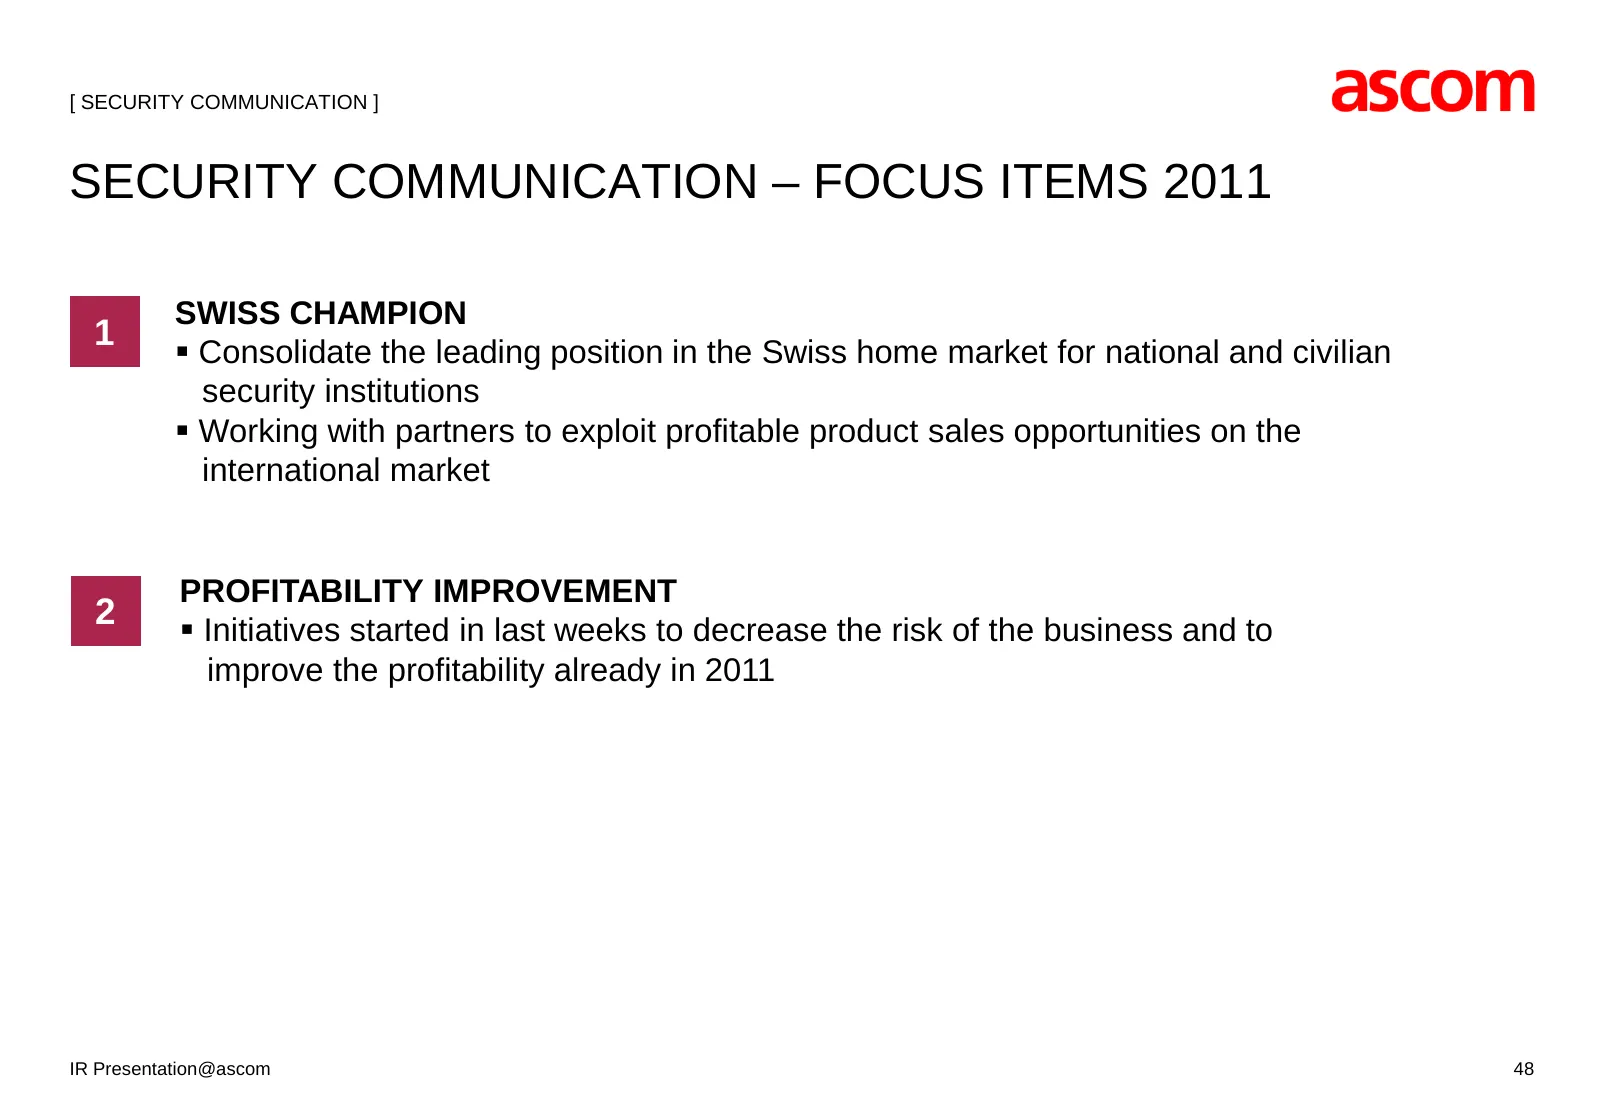
[ SECURITY COMMUNICATION ] SECURITY COMMUNICATION – FOCUS ITEMS 2011 SWISS CHAMPION 1 Consolidate the leading position in the Swiss home market for national and civilian security institutions Working with partners to exploit profitable product sales opportunities on the international market PROF
Slide 49: 2010 Financial Results
ascom 2010 FINANCIAL RESULTS
Slide 50: Consolidated Income Statement
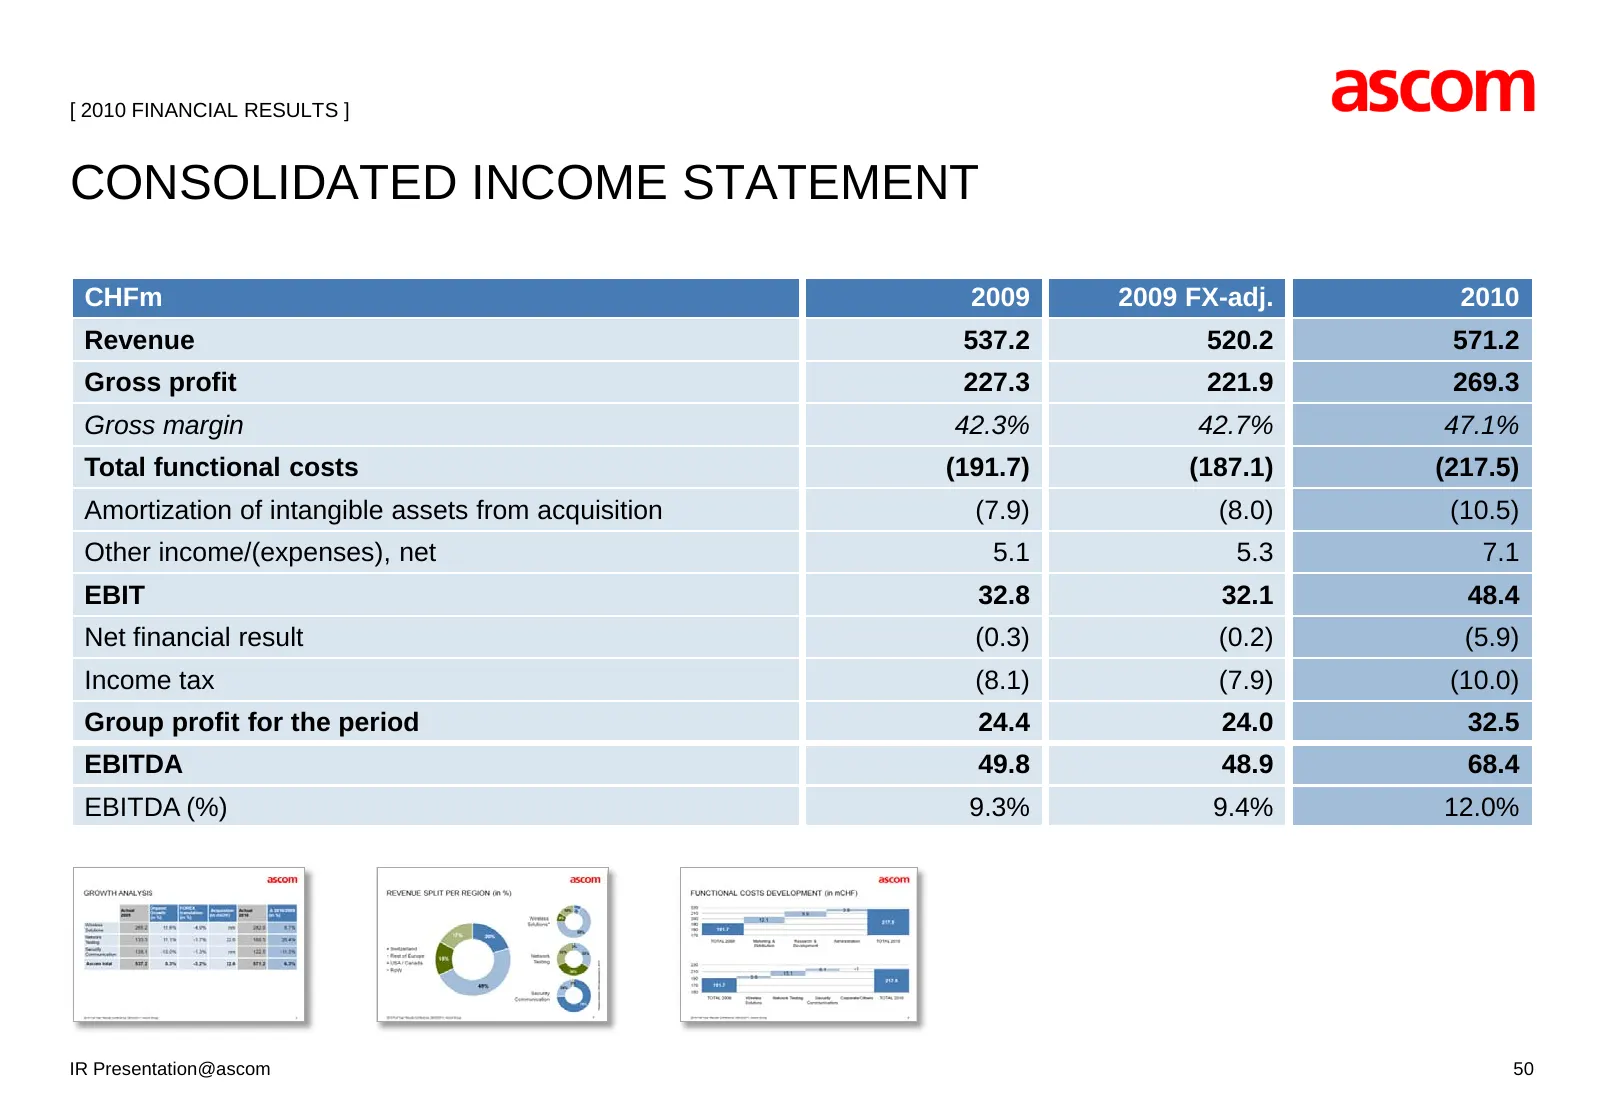
[ 2010 FINANCIAL RESULTS ] CONSOLIDATED INCOME STATEMENT CHFm 2009 2009 FX-adj. 2010 Revenue 537.2 520.2 571.2 Gross profit 227.3 221.9 269.3 Gross margin 42.3% 42.7% 47.1% Total functional costs (191.7) (187.1) (217.5) Amortization of intangible assets from acquisition (7.9) (8.0) (10.5) Other inco
Slide 51: Consolidated Balance Sheet
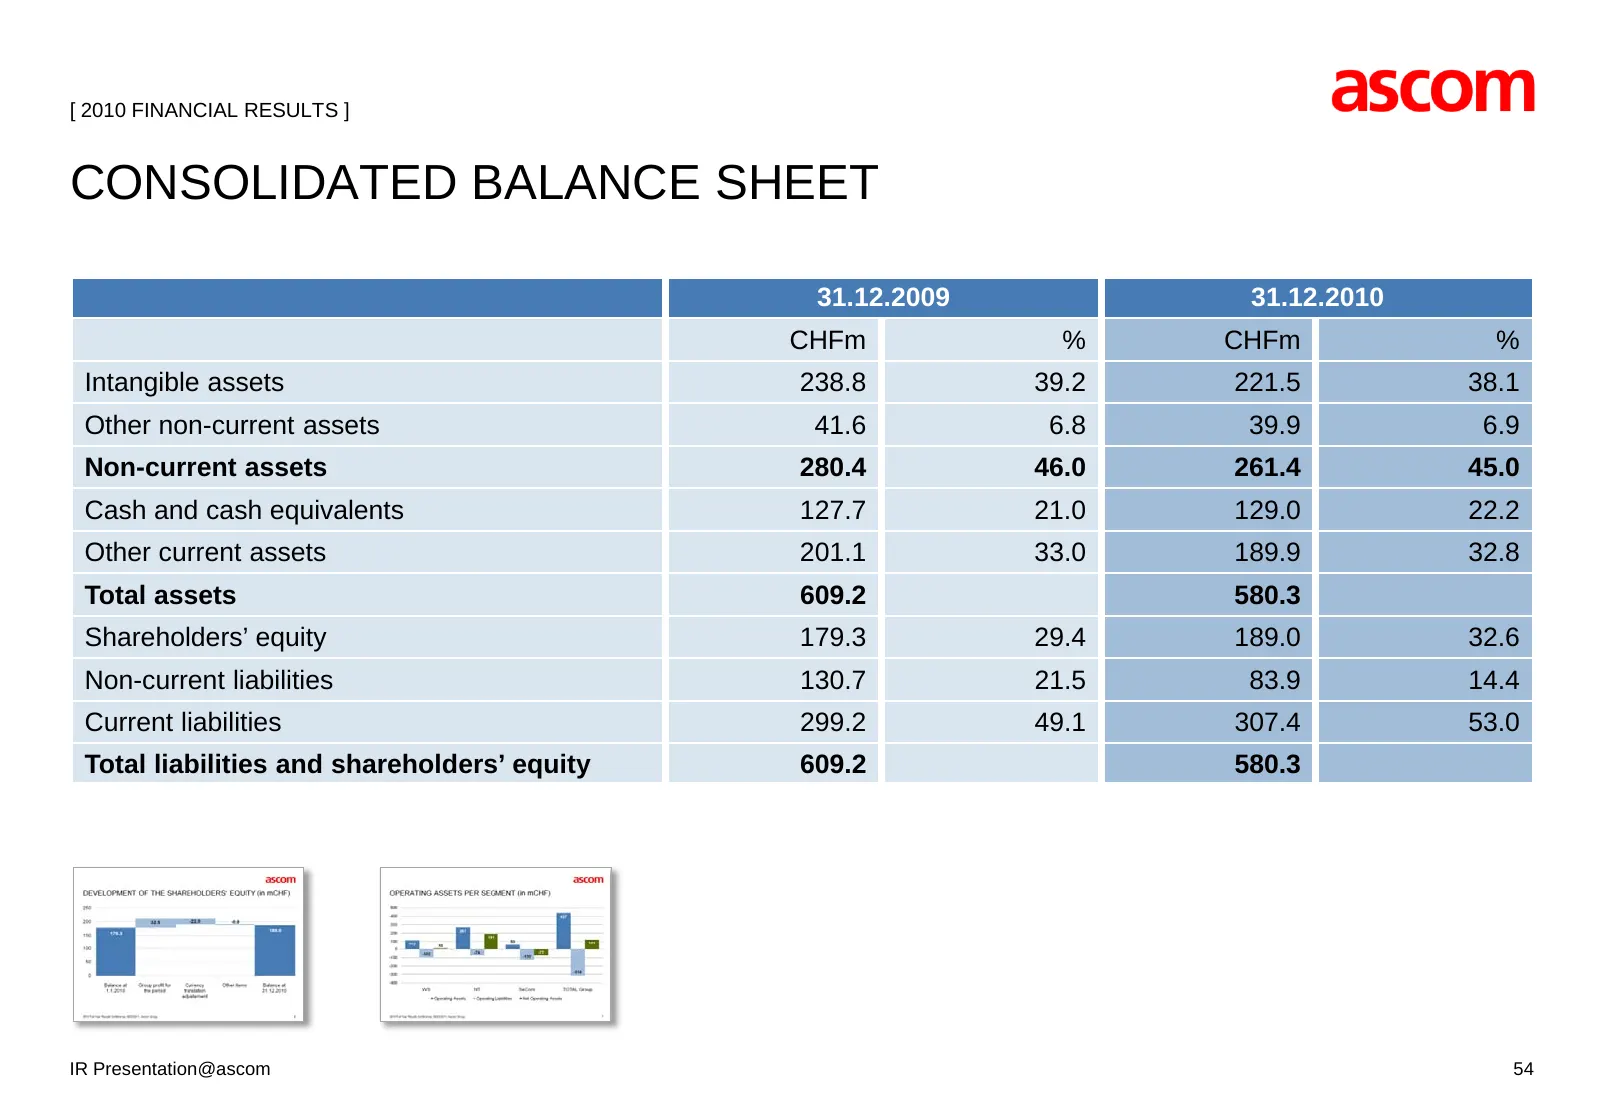
[ 2010 FINANCIAL RESULTS ] CONSOLIDATED BALANCE SHEET 31.12.2009 31.12.2010 CHFm % CHFm % Intangible assets 238.8 39.2 221.5 38.1 Other non-current assets 41.6 6.8 39.9 6.9 Non-current assets 280.4 46.0 261.4 45.0 Cash and cash equivalents 127.7 21.0 129.0 22.2 Other current assets 201.1 33.0 189.9
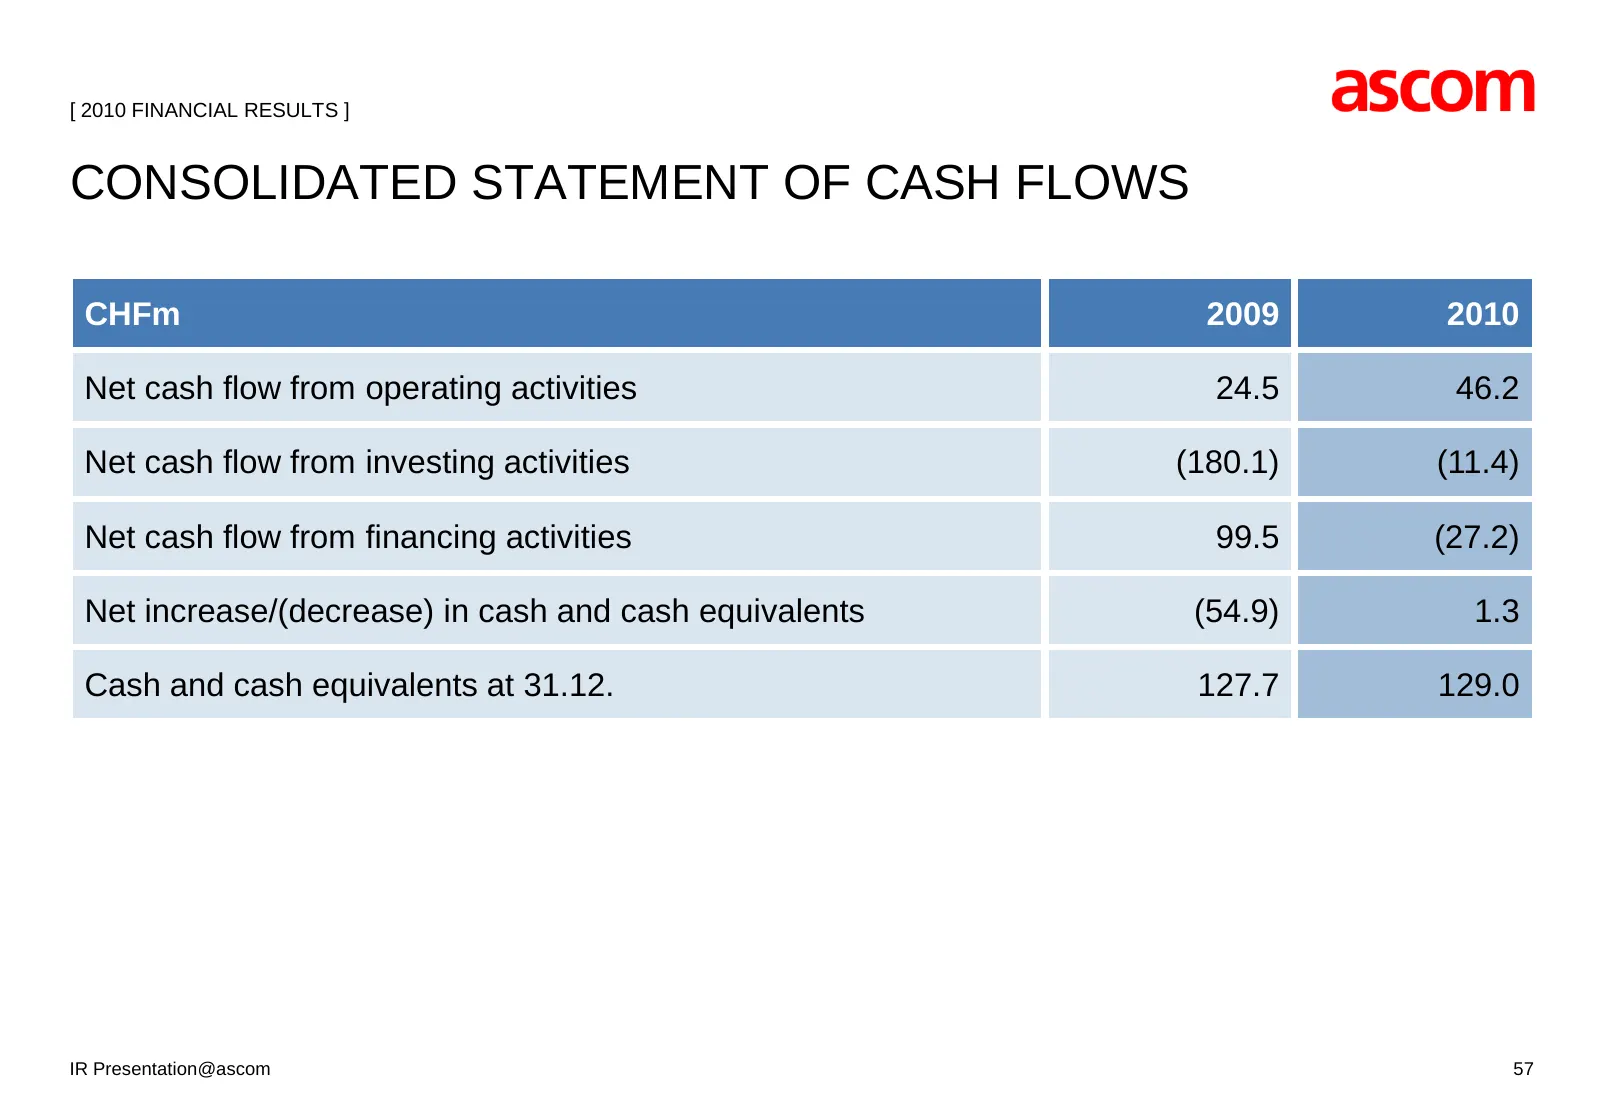
Slide 52: Consolidated Statement of Cash Flows
[ 2010 FINANCIAL RESULTS ] CONSOLIDATED STATEMENT OF CASH FLOWS CHFm 2009 2010 Net cash flow from operating activities 24.5 46.2 Net cash flow from investing activities (180.1) (11.4) Net cash flow from financing activities 99.5 (27.2) Net increase/(decrease) in cash and cash equivalents (54.9) 1.3
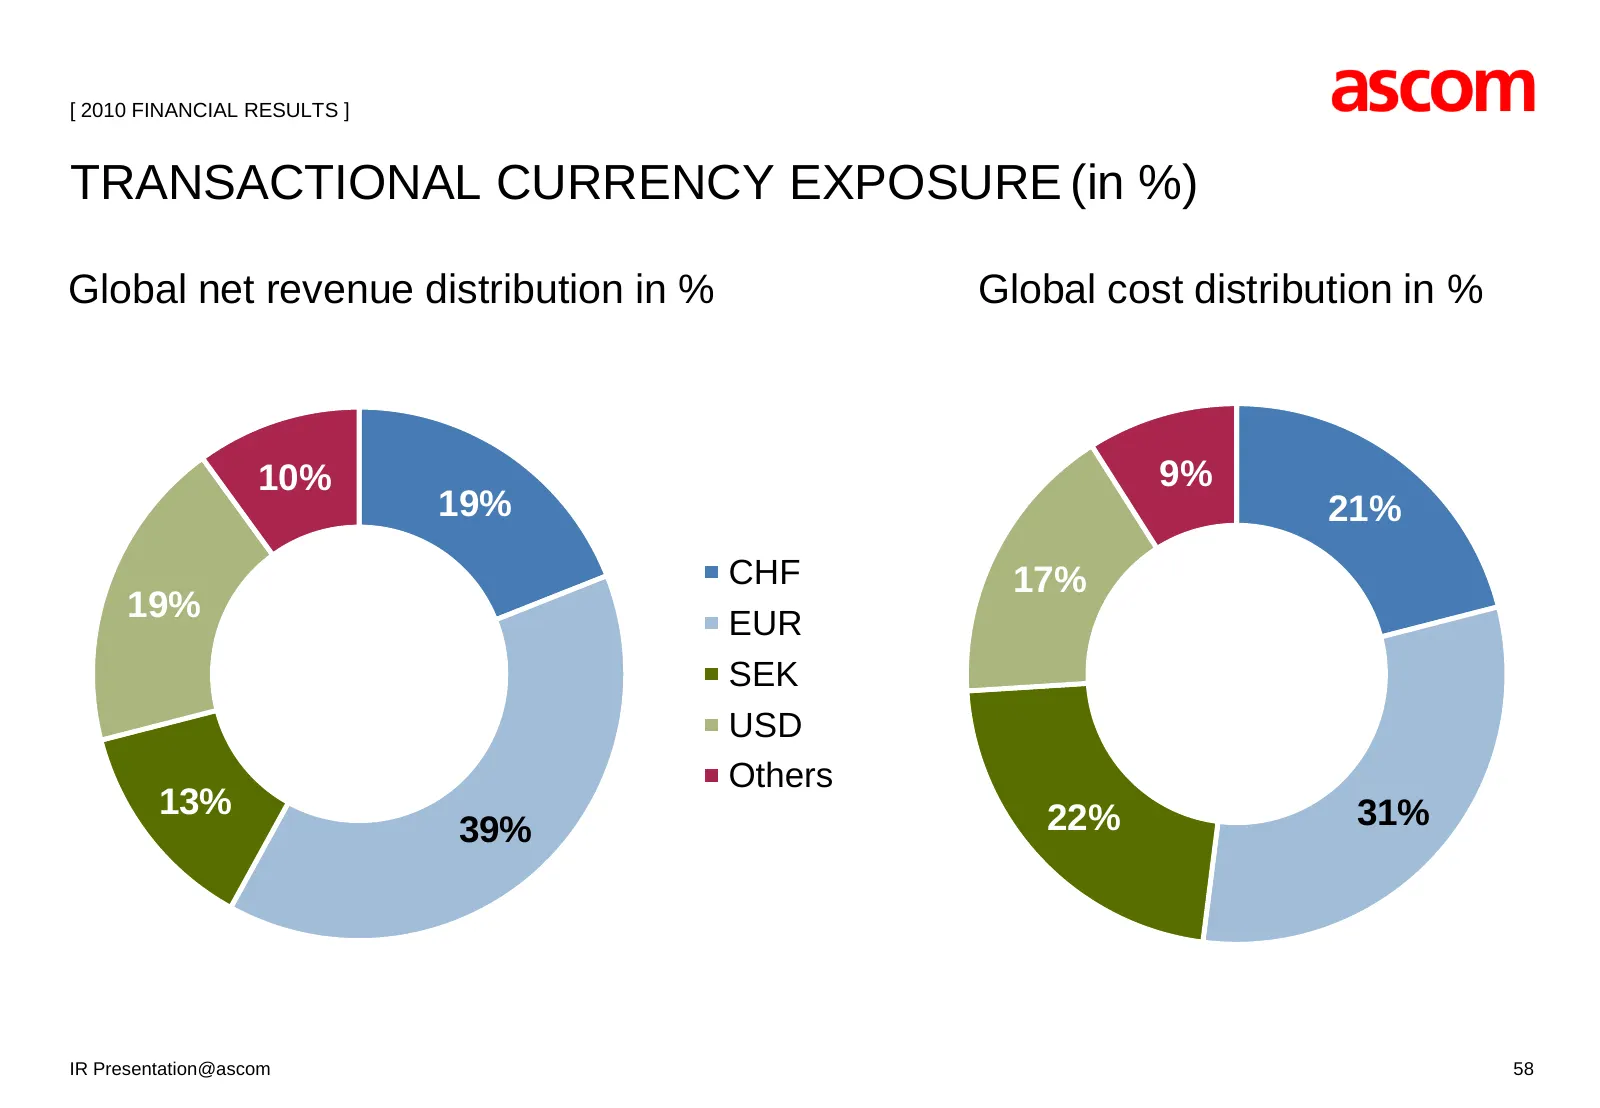
Slide 53: Transactional Currency Exposure
[ 2010 FINANCIAL RESULTS ] TRANSACTIONAL CURRENCY EXPOSURE (in %) Global net revenue distribution in % Global cost distribution in % 10% 9% 19% 21% CHF 17% 19% EUR SEK USD Others 13% 22% 31% 39% IR Presentation@ascom 58
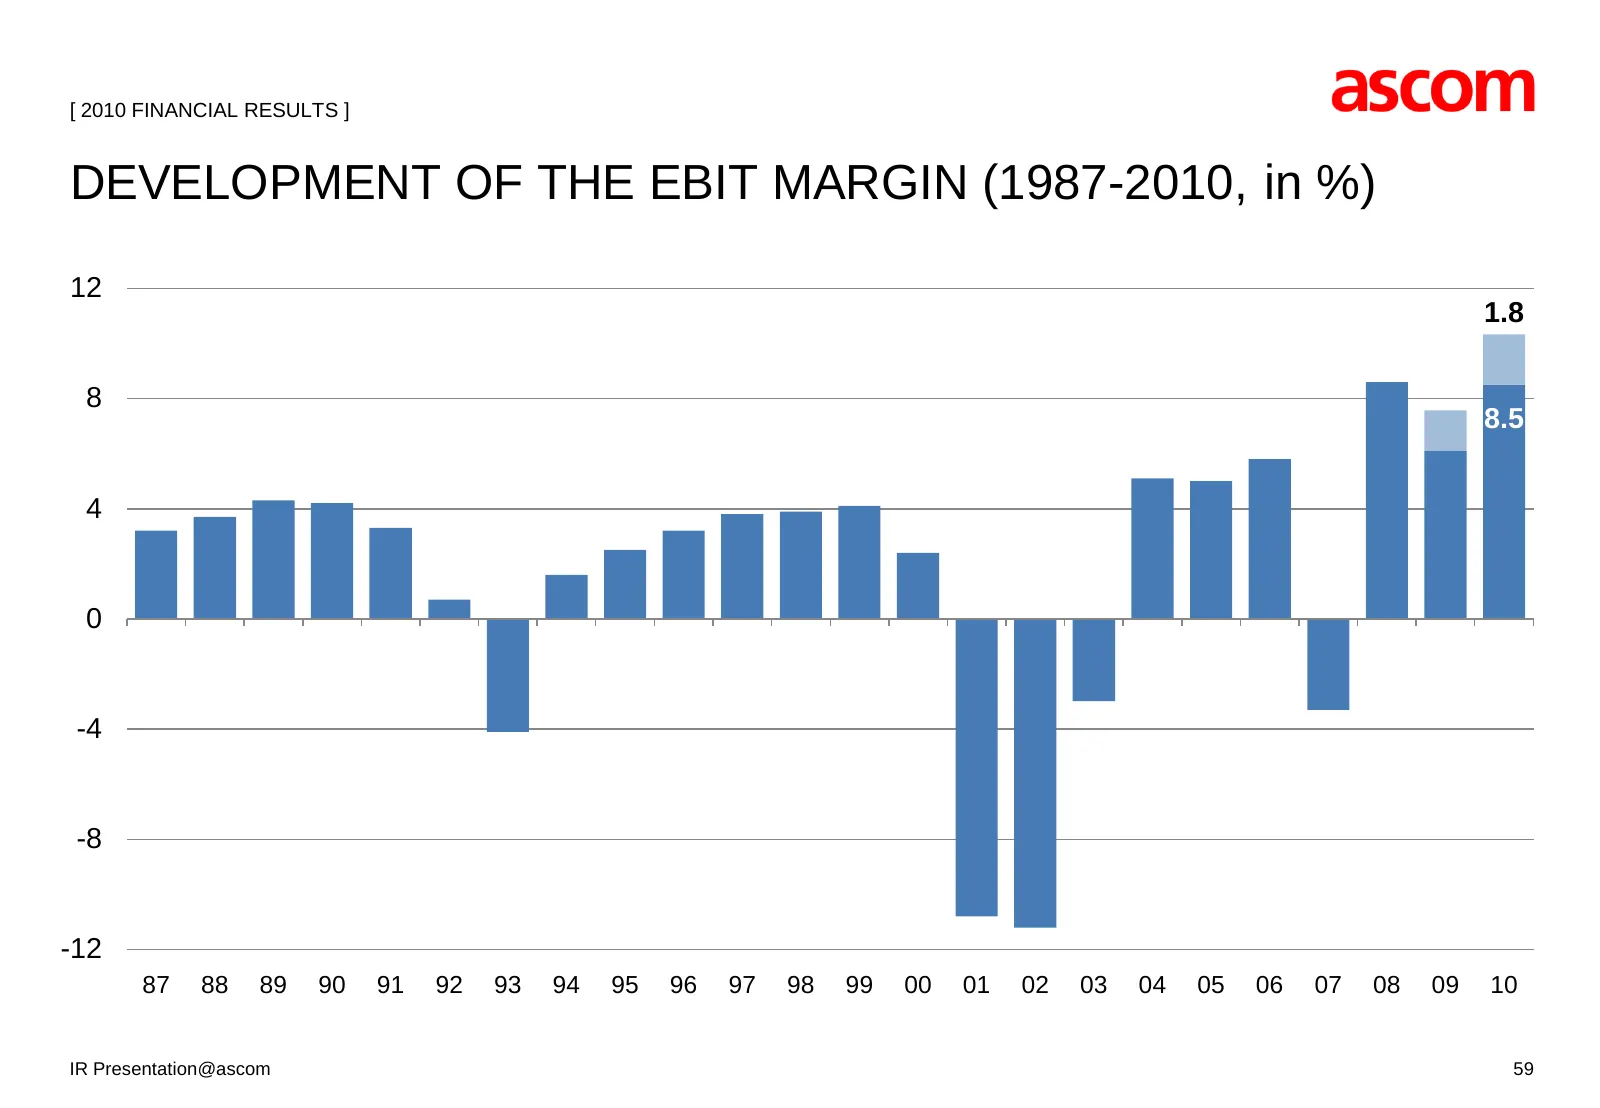
Slide 54: Development of the EBIT Margin (1987-2010)
[ 2010 FINANCIAL RESULTS ] DEVELOPMENT OF THE EBIT MARGIN (1987-2010, in %) 12 1.8 8 8.5 4 0 -4 -8 -12 87 88 89 90 91 92 93 94 95 96 97 98 99 00 01 02 03 04 05 06 07 08 09 10 IR Presentation@ascom 59
Slide 55: Outlook
[ ] OUTLOOK IR Presentation@ascom 60
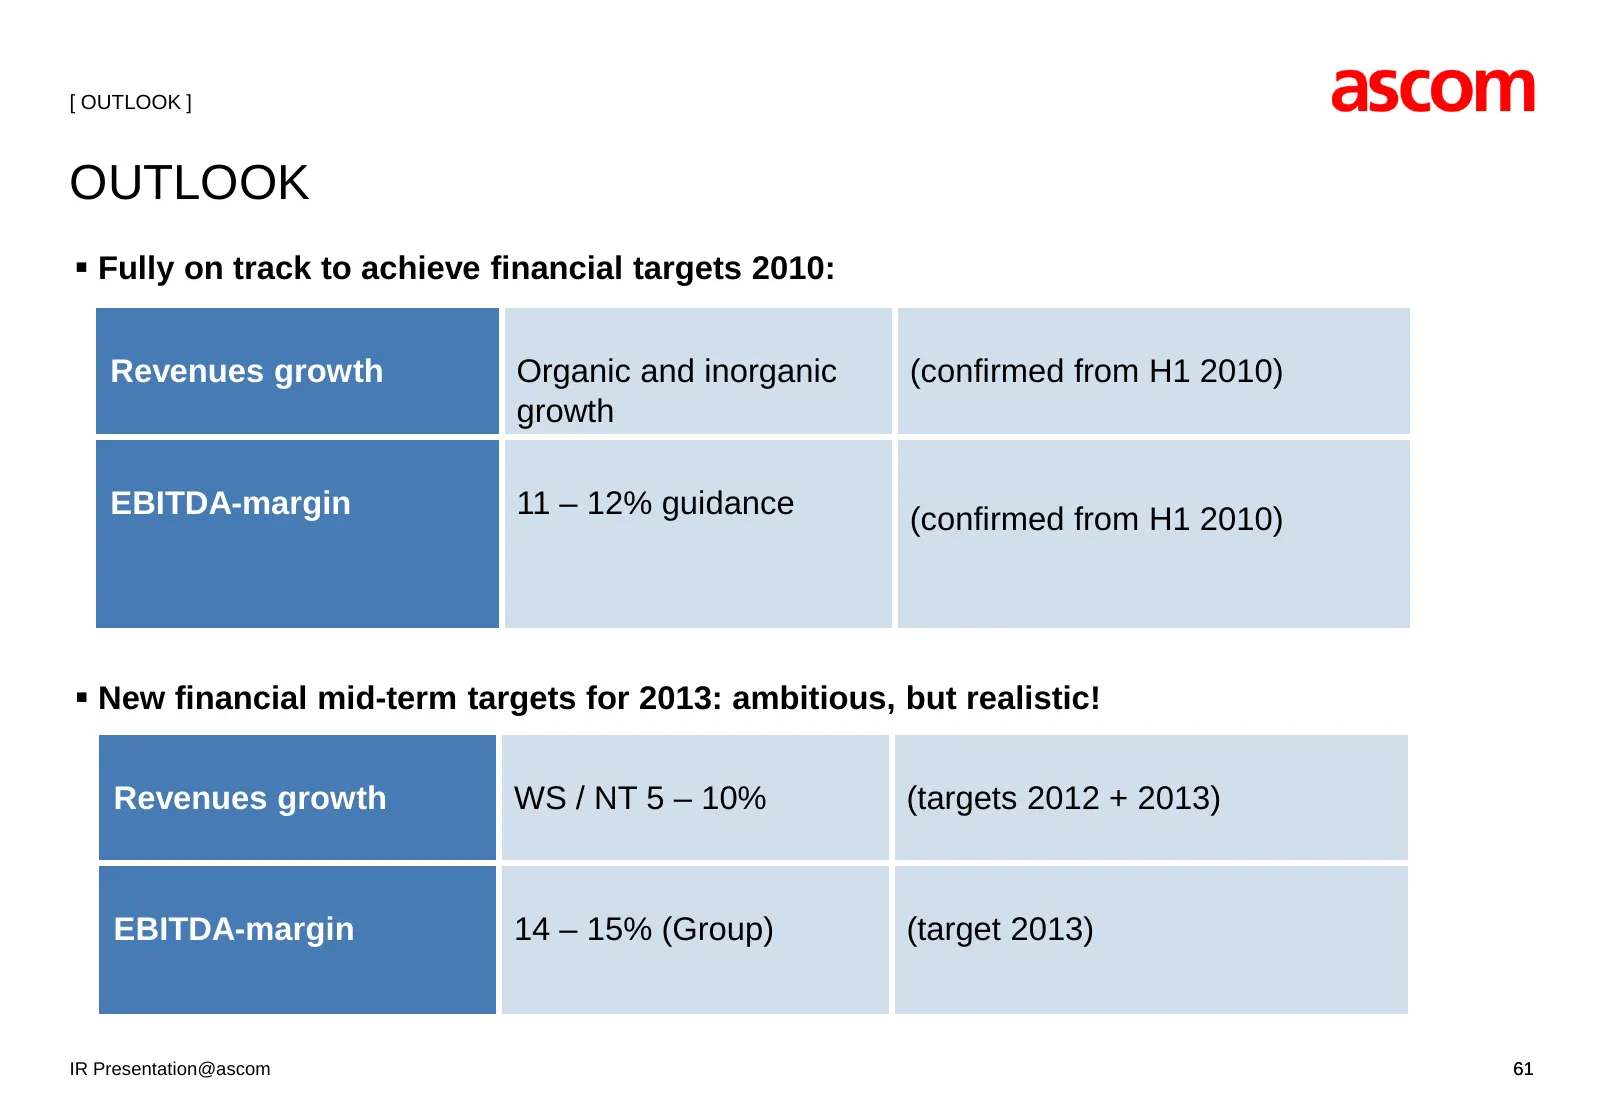
Slide 56: Outlook
[ OUTLOOK ] OUTLOOK Fully on track to achieve financial targets 2010: Revenues growth Organic and inorganic (confirmed from H1 2010) growth EBITDA-margin 11 – 12% guidance (confirmed from H1 2010) New financial mid-term targets for 2013: ambitious, but realistic! Revenues growth WS / NT 5 – 10%
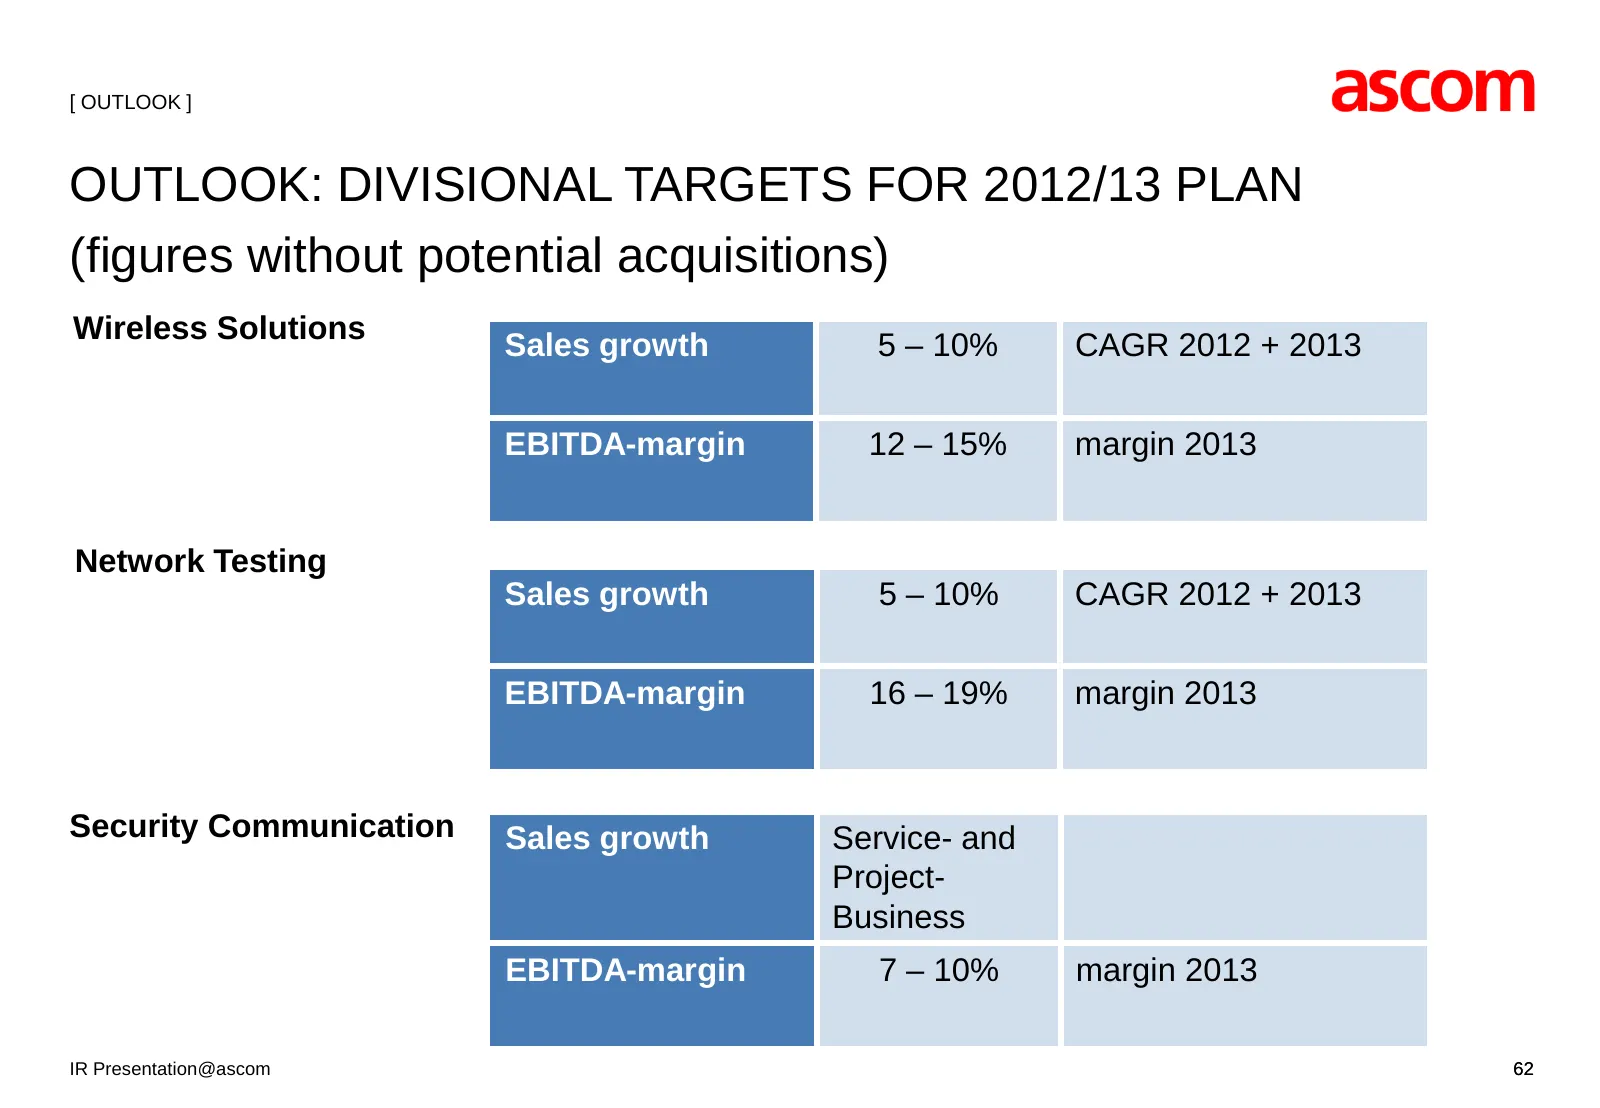
Slide 57: Outlook: Divisional Targets for 2012/13 Plan
[ OUTLOOK ] OUTLOOK: DIVISIONAL TARGETS FOR 2012/13 PLAN (figures without potential acquisitions) Wireless Solutions Sales growth 5 – 10% CAGR 2012 + 2013 EBITDA-margin 12 – 15% margin 2013 Network Testing Sales growth 5 – 10% CAGR 2012 + 2013 EBITDA-margin 16 – 19% margin 2013 Security Communicatio
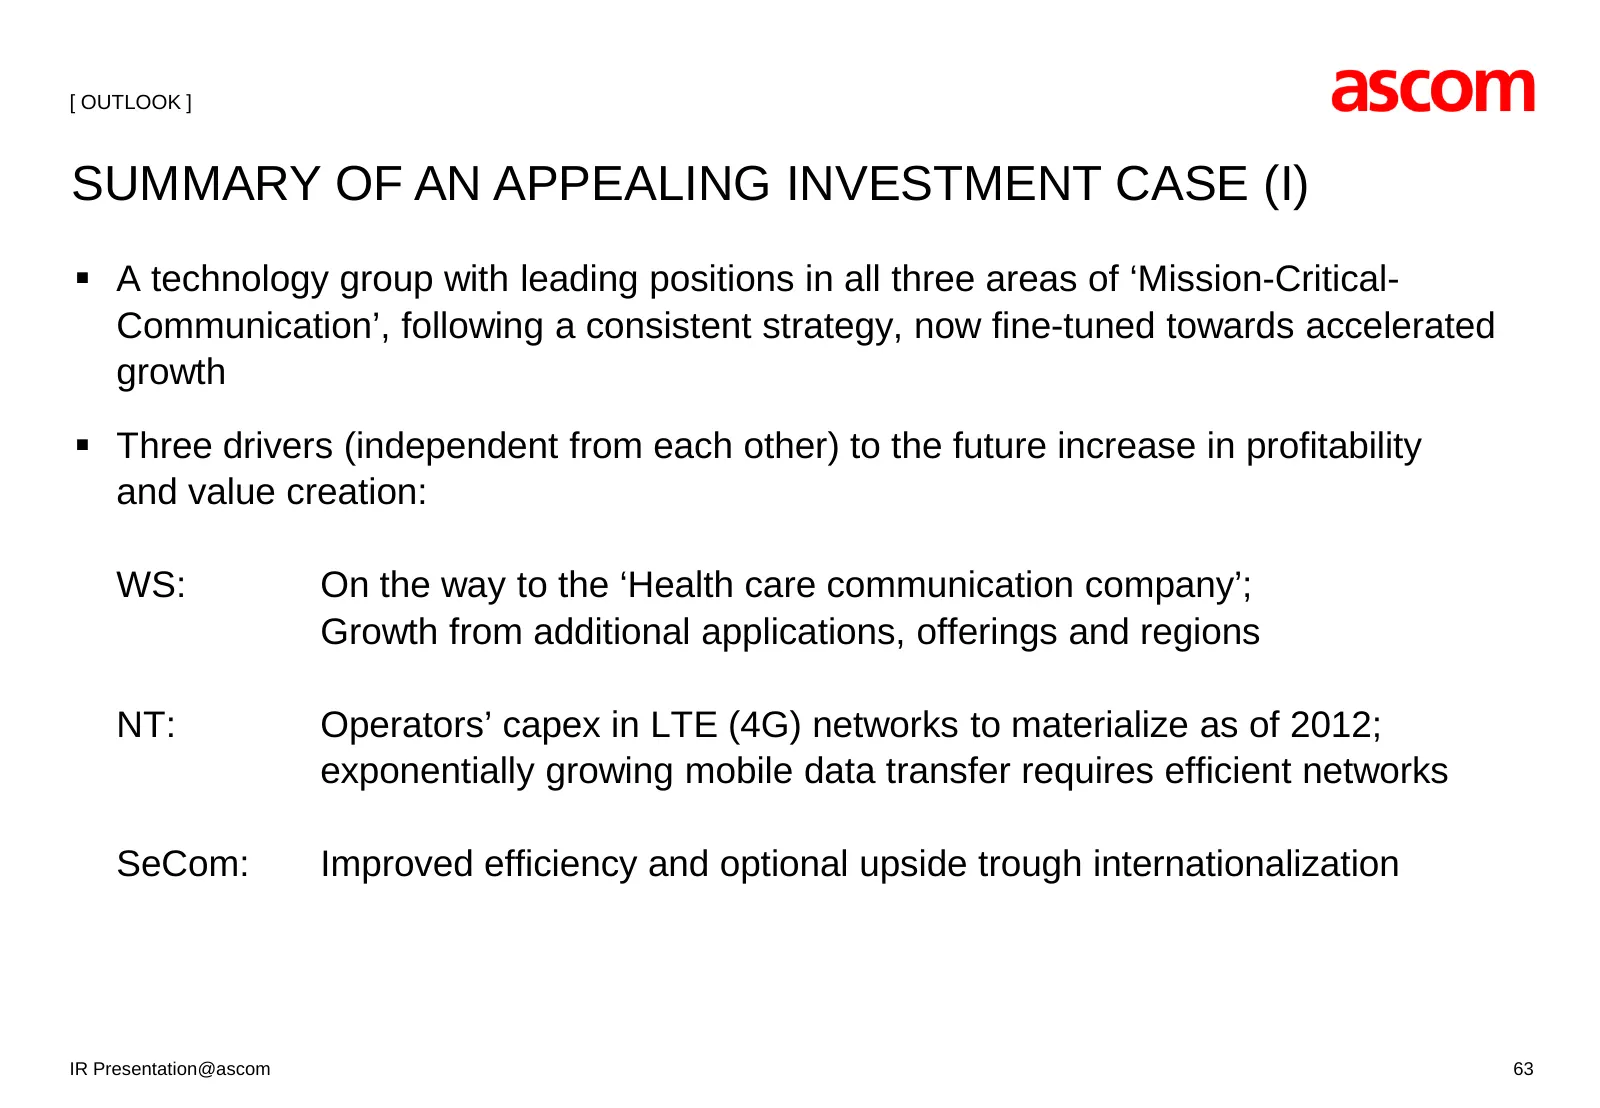
Slide 58: Summary of an Appealing Investment Case (I)
[ OUTLOOK ] SUMMARY OF AN APPEALING INVESTMENT CASE (I) A technology group with leading positions in all three areas of ‘Mission-Critical- Communication’, following a consistent strategy, now fine-tuned towards accelerated growth Three drivers (independent from each other) to the future increase
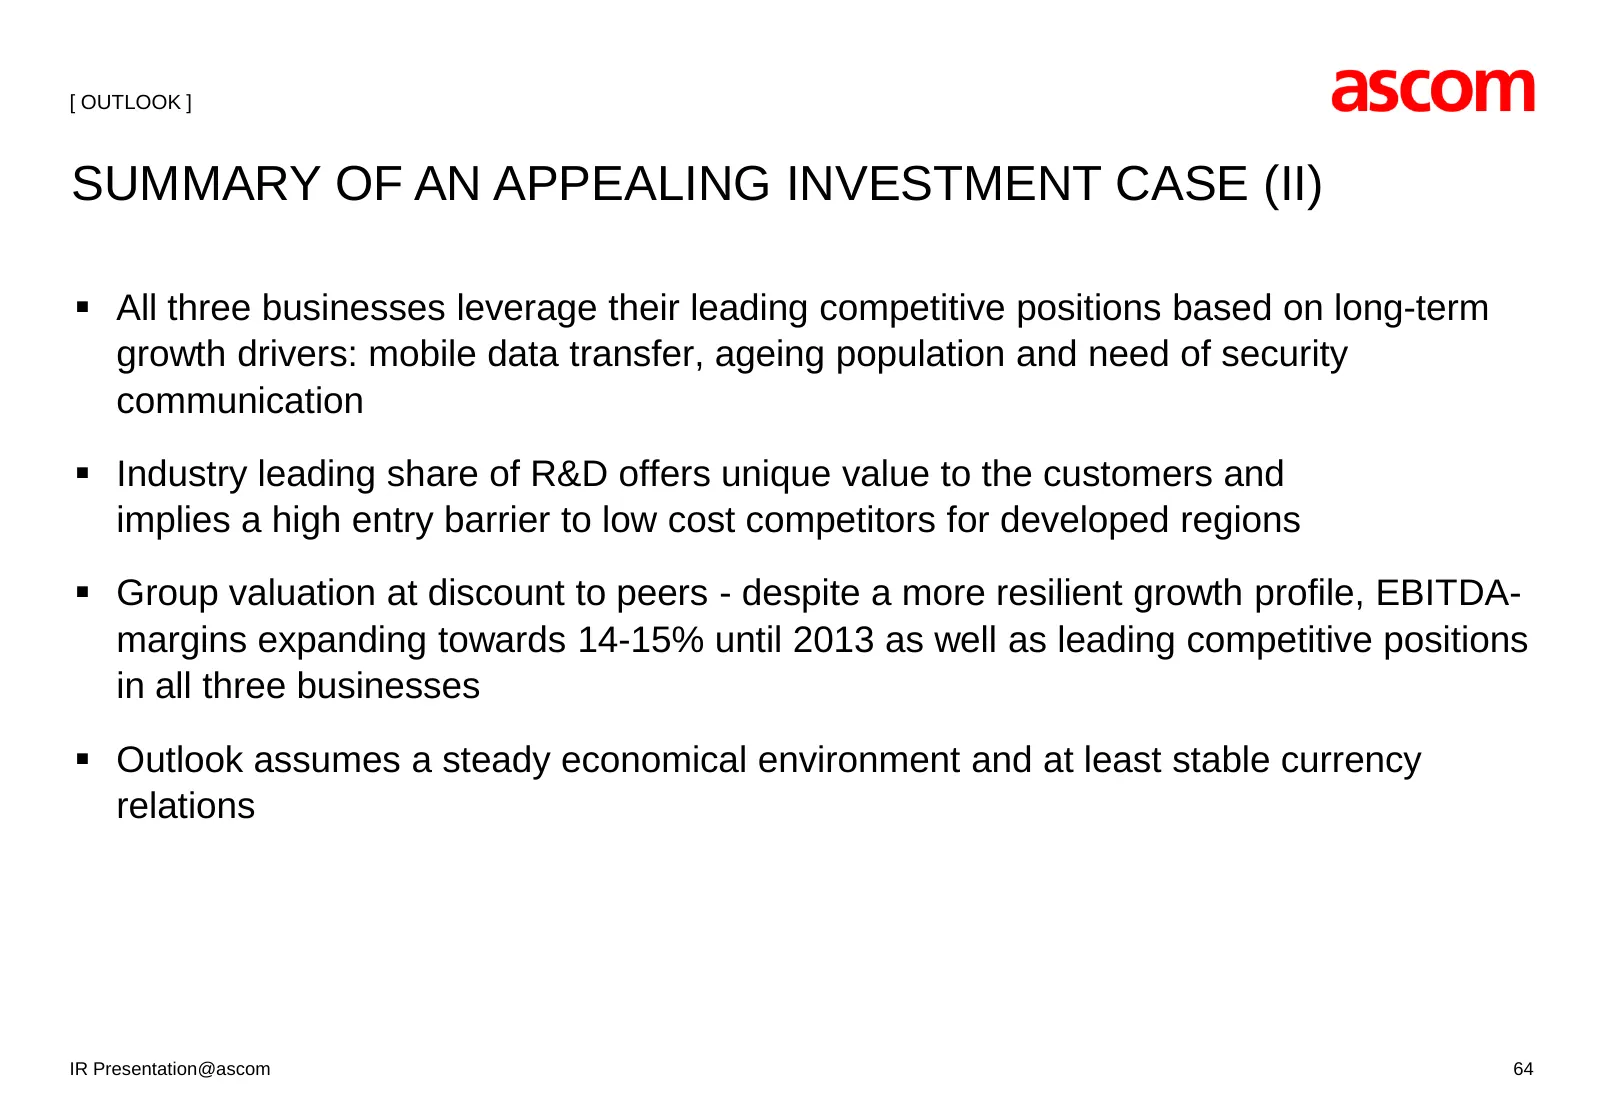
Slide 59: Summary of an Appealing Investment Case (II)
[ OUTLOOK ] SUMMARY OF AN APPEALING INVESTMENT CASE (II) All three businesses leverage their leading competitive positions based on long-term growth drivers: mobile data transfer, ageing population and need of security communication Industry leading share of R&D offers unique value to the custom
Slide 60: Contact
[ ] CONTACT Ascom Holding AG Investor Relations Stettbachstrasse 6 Phone: +41 44 823 1352 8600 Dübendorf Fax: +41 31 999 1010 Switzerland investor@ascom.com IR Presentation@ascom 65
Slide 61: Legal Disclaimer
LEGAL DISCLAIMER This document contains specific forward-looking statements, e.g. statements including terms like “believe”, “expect” or similar expressions. Such forward-looking statements are subject to known and unknown risks, uncertainties and other factors which may result in a substantial dive
Slide 62: Thank You!
THANK YOU! IR Presentation@ascom 67
Source: Internet Archive copy of ascom.com