Argo Group International Holdings Ltd
Argo Group International — Investor Presentation (September 2019)
19 slides from Argo Group International's investor presentation, Sep 4, 2019
Slide 1: Argo Group Investor Presentation September 2019
Argo Group Investor Presentation September 2019 Exhibit 99.1
Slide 2: Forward-looking statements
This presentation may include forward-looking statements, both with respect to Argo Group and its industry, that reflect our current views with respect to future events and financial performance. These statements are made pursuant to the safe harbor provisions of the Private Securities Litigation Re
Slide 3: Distinctive Specialty Insurance Platform
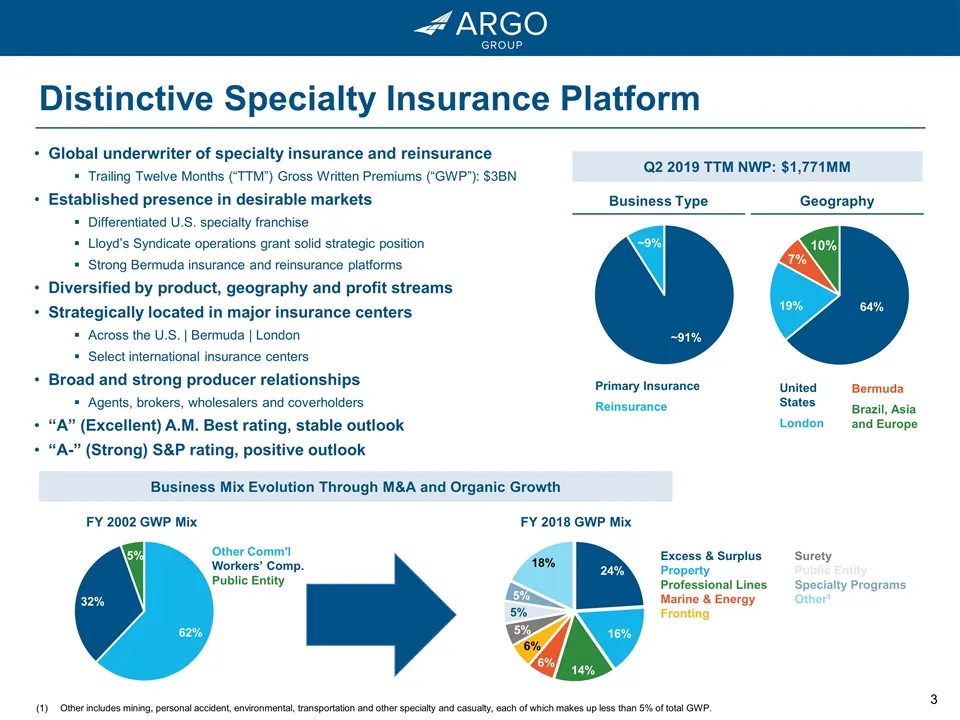
Business Mix Evolution Through M&A and Organic Growth Global underwriter of specialty insurance and reinsurance Trailing Twelve Months (“TTM”) Gross Written Premiums (“GWP”): $3BN Established presence in desirable markets Differentiated U.S. specialty franchise Lloyd’s Syndicate operations grant sol
Slide 4: Argo's Fundamental Operating Strategy
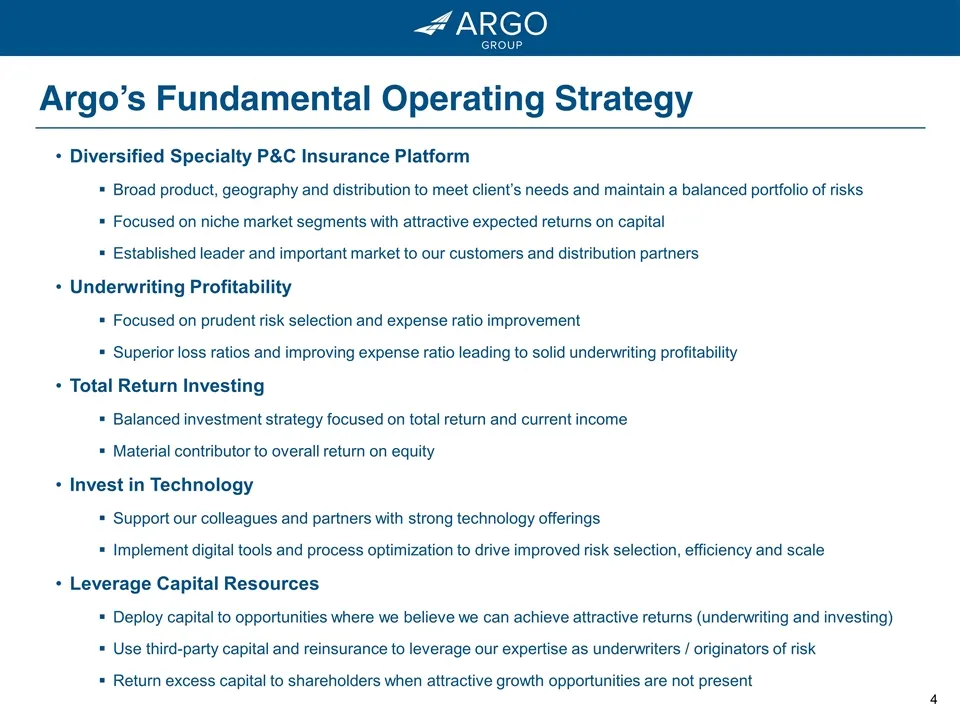
Argo’s Fundamental Operating Strategy Diversified Specialty P&C Insurance Platform Broad product, geography and distribution to meet client’s needs and maintain a balanced portfolio of risks Focused on niche market segments with attractive expected returns on capital Established leader and important
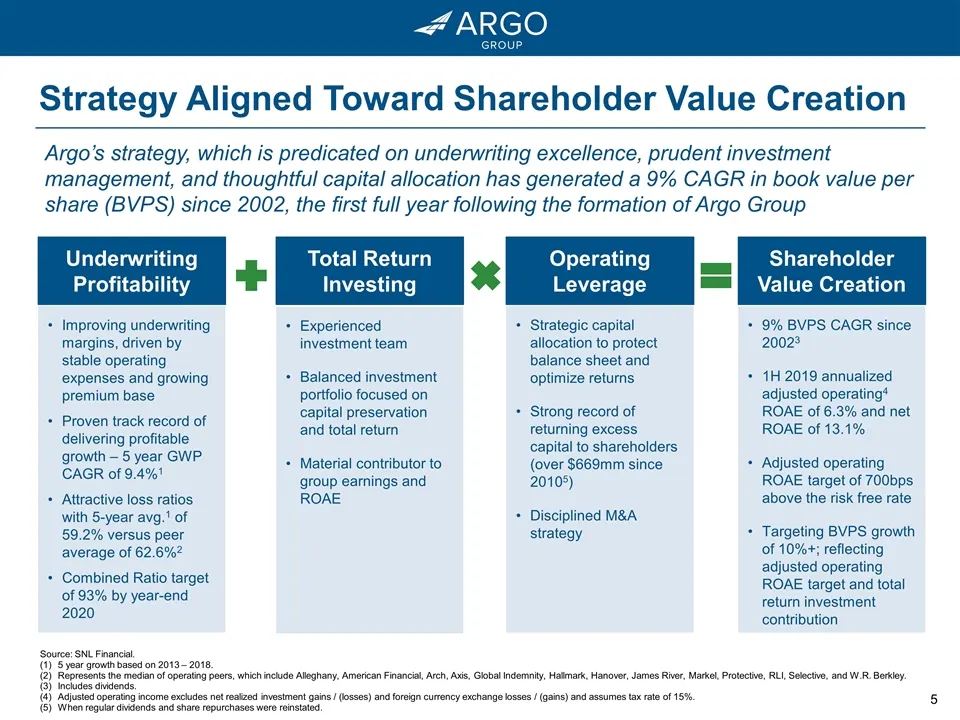
Slide 5: Strategy Aligned Toward Shareholder Value Creation
Strategy Aligned Toward Shareholder Value Creation Shareholder Value Creation 9% BVPS CAGR since 20023 1H 2019 annualized adjusted operating4 ROAE of 6.3% and net ROAE of 13.1% Adjusted operating ROAE target of 700bps above the risk free rate Targeting BVPS growth of 10%+; reflecting adjusted operat
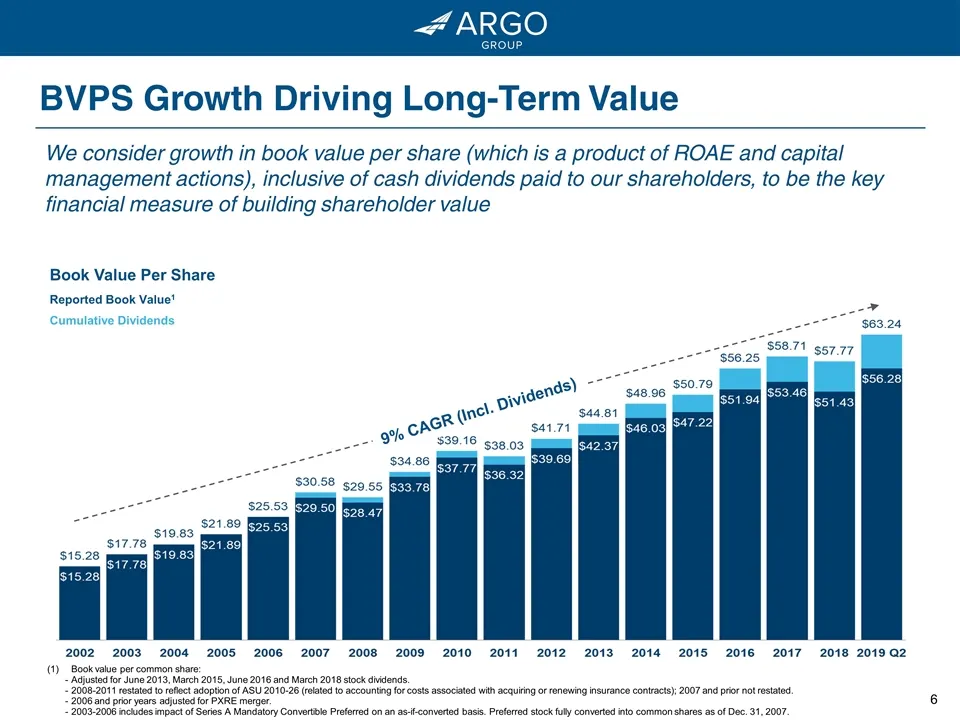
Slide 6: BVPS Growth Driving Long-Term Value
9% CAGR (Incl. Dividends) Book Value Per Share Reported Book Value1 Cumulative Dividends Book value per common share: Adjusted for June 2013, March 2015, June 2016 and March 2018 stock dividends. 2008-2011 restated to reflect adoption of ASU 2010-26 (related to accounting for costs associated with a
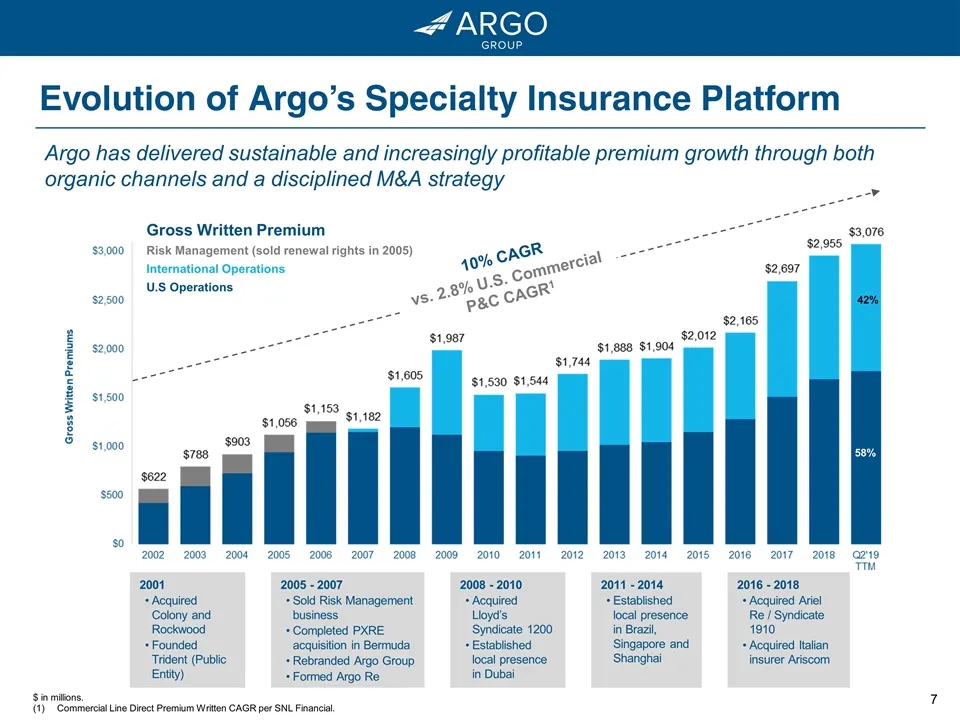
Slide 7: Evolution of Argo's Specialty Insurance Platform
$ in millions. Commercial Line Direct Premium Written CAGR per SNL Financial. 10% CAGR vs. 2.8% U.S. Commercial P&C CAGR1 Evolution of Argo’s Specialty Insurance Platform Argo has delivered sustainable and increasingly profitable premium growth through both organic channels and a disciplined M&A str
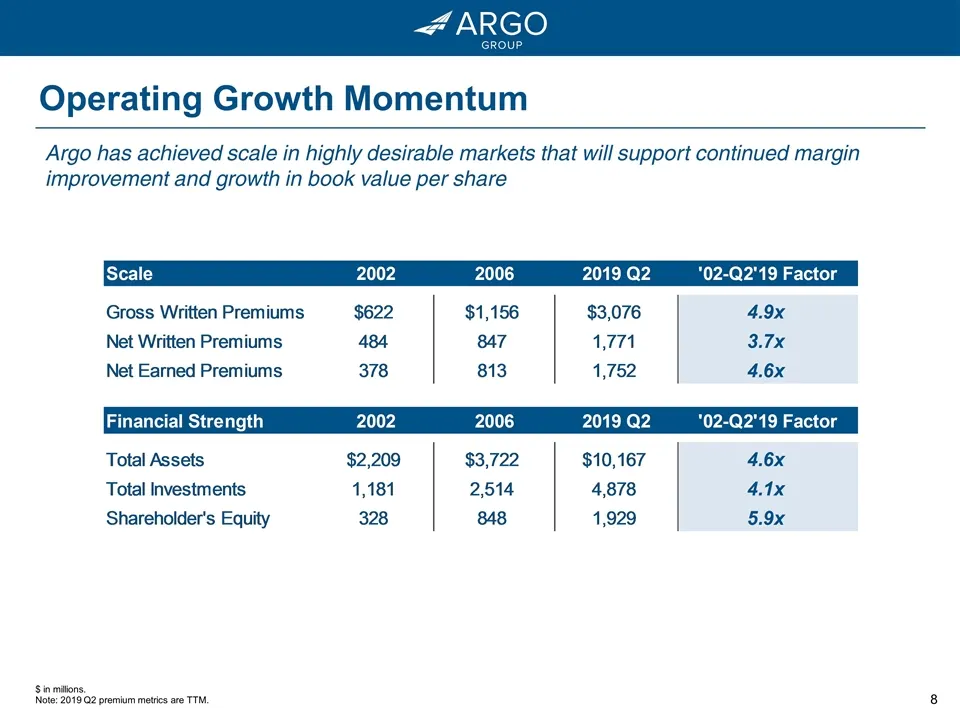
Slide 8: Operating Growth Momentum
Operating Growth Momentum Argo has achieved scale in highly desirable markets that will support continued margin improvement and growth in book value per share $ in millions. Note: 2019 Q2 premium metrics are TTM.
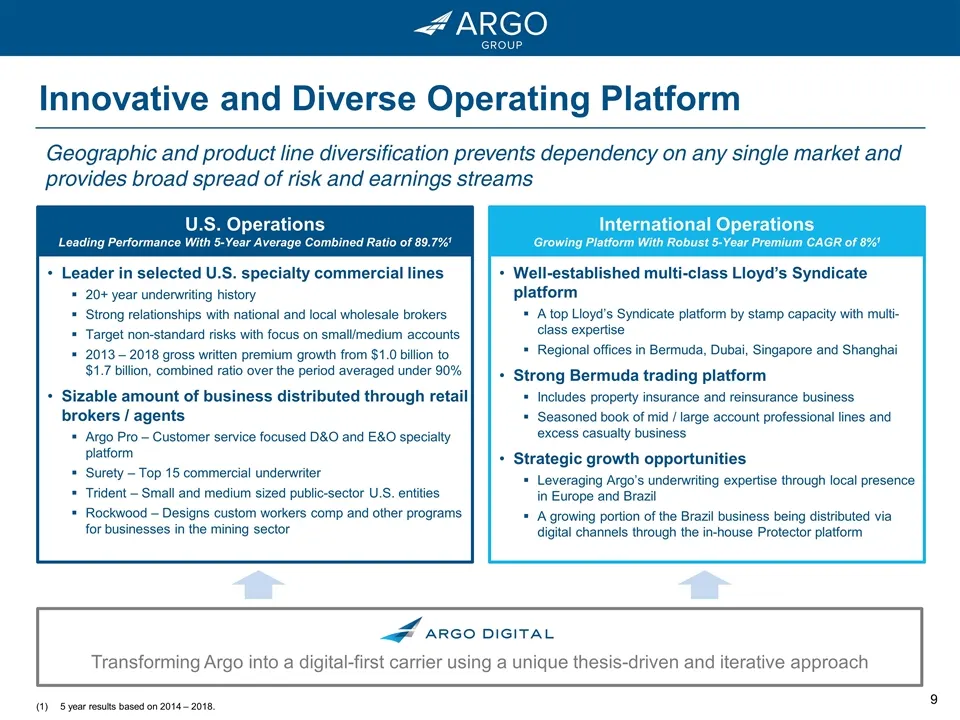
Slide 9: Innovative and Diverse Operating Platform
Innovative and Diverse Operating Platform Well-established multi-class Lloyd’s Syndicate platform A top Lloyd’s Syndicate platform by stamp capacity with multi-class expertise Regional offices in Bermuda, Dubai, Singapore and Shanghai Strong Bermuda trading platform Includes property insurance and r
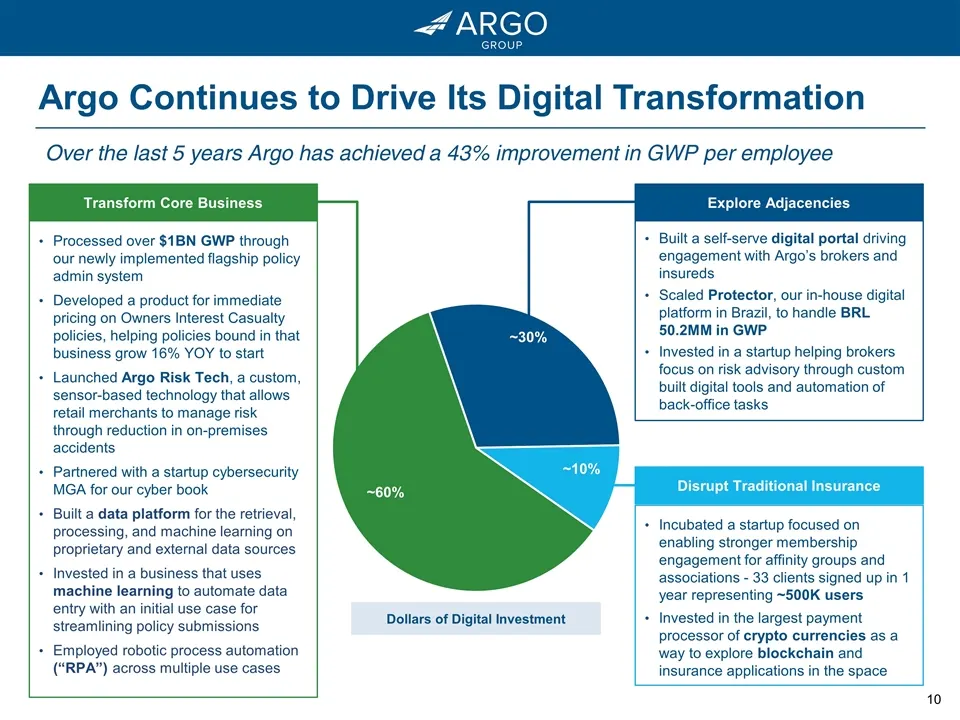
Slide 10: Argo Continues to Drive Its Digital Transformation
Argo Continues to Drive Its Digital Transformation Processed over $1BN GWP through our newly implemented flagship policy admin system Developed a product for immediate pricing on Owners Interest Casualty policies, helping policies bound in that business grow 16% YOY to start Launched Argo Risk Tech,
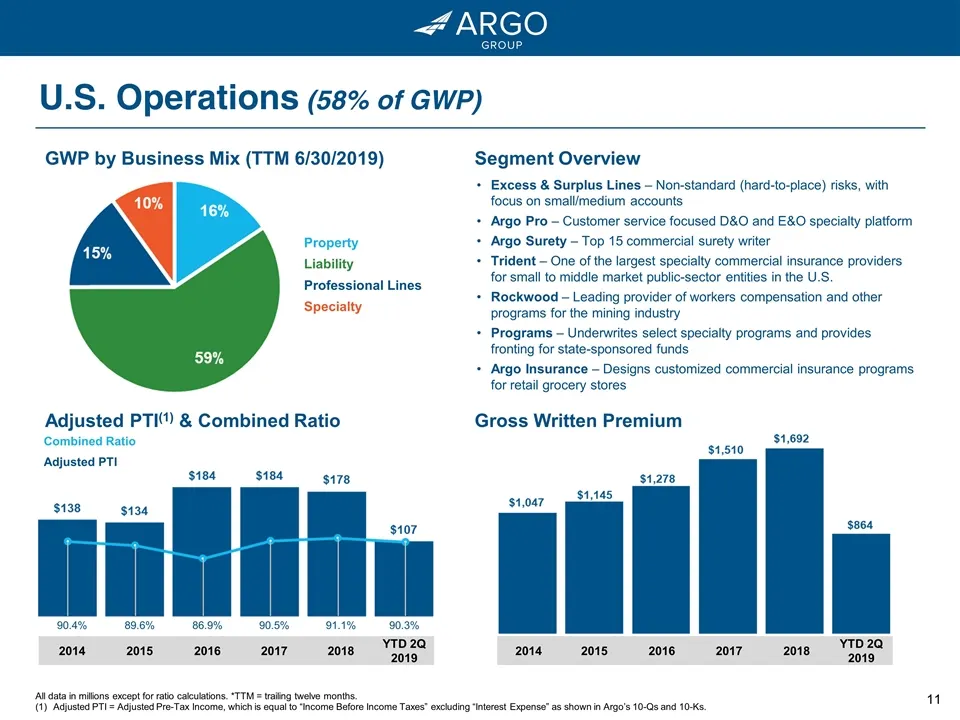
Slide 11: U.S. Operations (58% of GWP)
U.S. Operations (58% of GWP) All data in millions except for ratio calculations. *TTM = trailing twelve months. Adjusted PTI = Adjusted Pre-Tax Income, which is equal to “Income Before Income Taxes” excluding “Interest Expense” as shown in Argo’s 10-Qs and 10-Ks. GWP by Business Mix (TTM 6/30/2019)
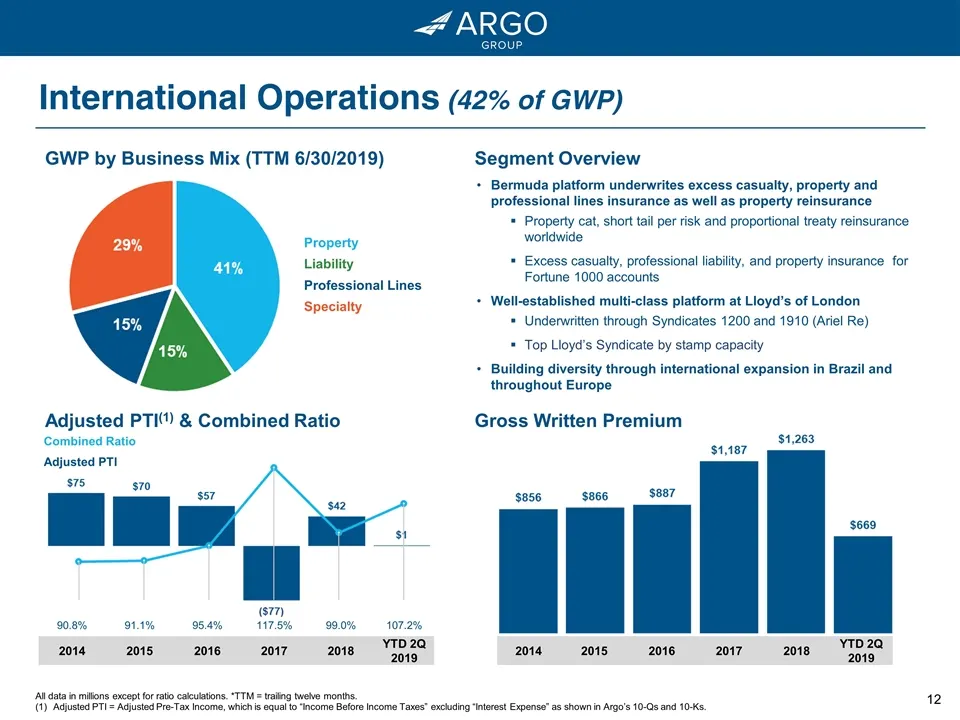
Slide 12: International Operations (42% of GWP)
International Operations (42% of GWP) GWP by Business Mix (TTM 6/30/2019) Segment Overview Adjusted PTI(1) & Combined Ratio Gross Written Premium Bermuda platform underwrites excess casualty, property and professional lines insurance as well as property reinsurance Property cat, short tail per risk
Slide 13: Historical Portfolio Rationalization
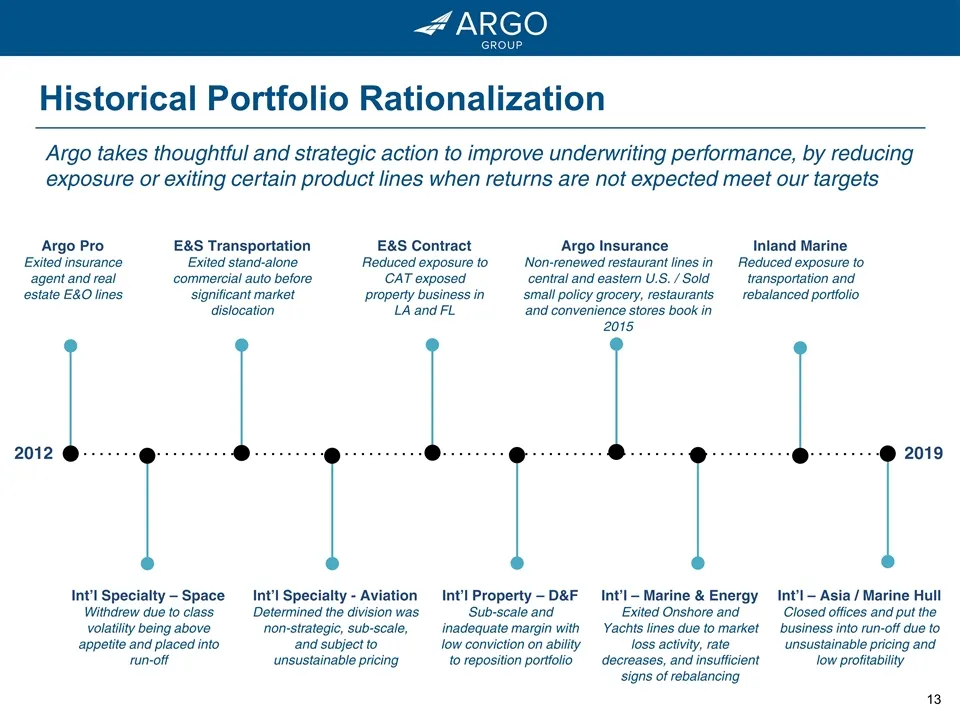
Historical Portfolio Rationalization Argo takes thoughtful and strategic action to improve underwriting performance, by reducing exposure or exiting certain product lines when returns are not expected meet our targets Argo Pro Exited insurance agent and real estate E&O lines E&S Transportation Exite
Slide 14: Recent Operating Results
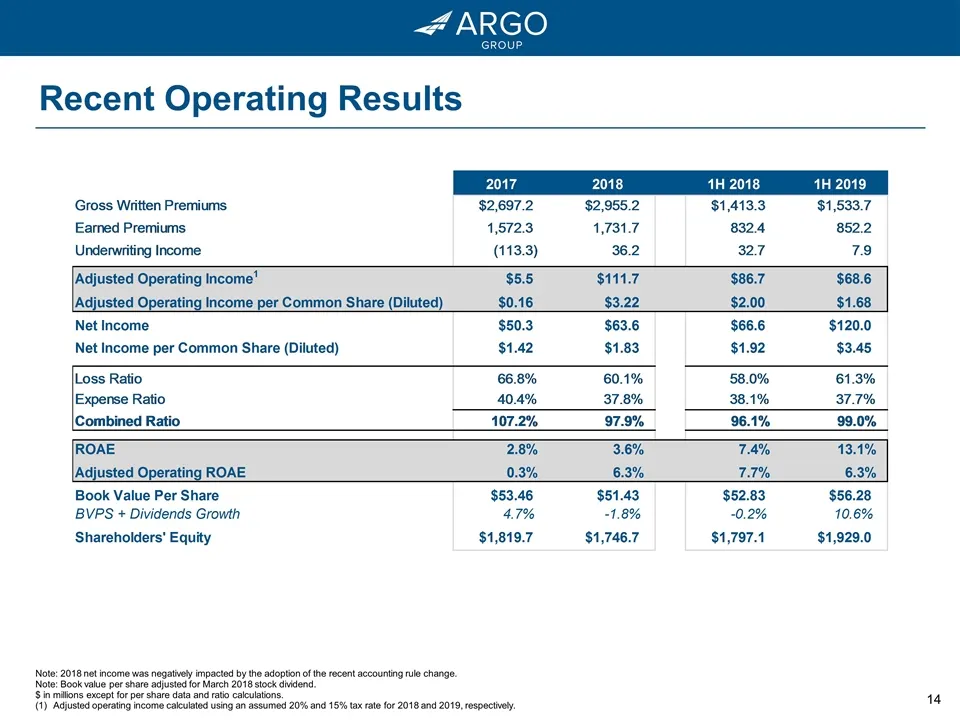
Recent Operating Results Note: 2018 net income was negatively impacted by the adoption of the recent accounting rule change. Note: Book value per share adjusted for March 2018 stock dividend. $ in millions except for per share data and ratio calculations. Adjusted operating income calculated using a
Slide 15: Consistent loss ratio outperformance versus peers
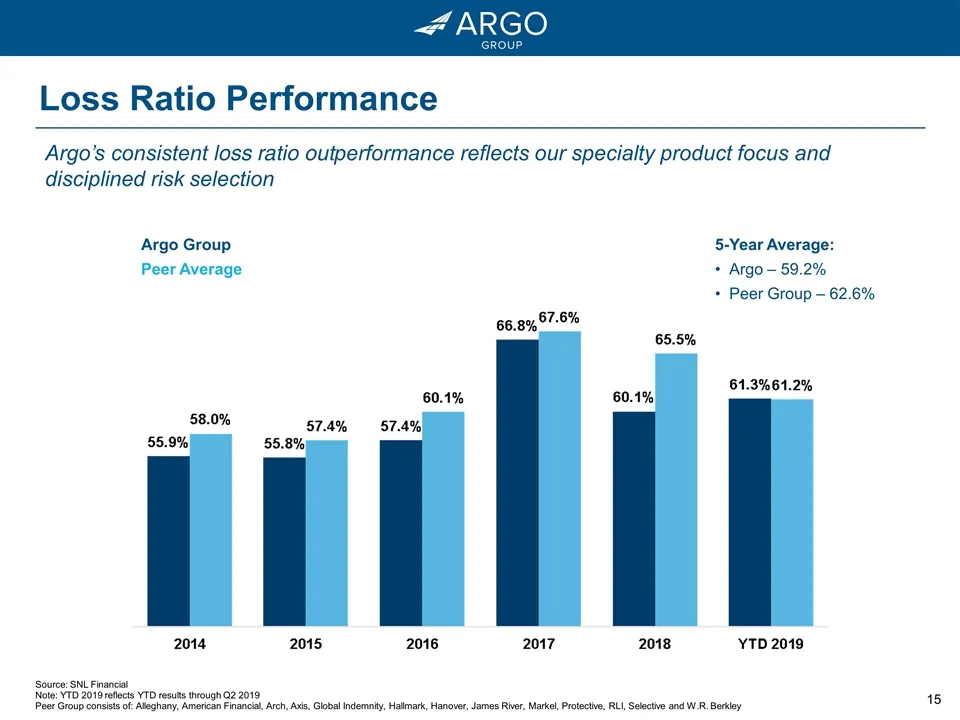
Argo’s consistent loss ratio outperformance reflects our specialty product focus and disciplined risk selection Argo Group Peer Average Source: SNL Financial Note: YTD 2019 reflects YTD results through Q2 2019 Peer Group consists of: Alleghany, American Financial, Arch, Axis, Global Indemnity, Hallm
Slide 16: Argo 2.0 Process and Technology Program
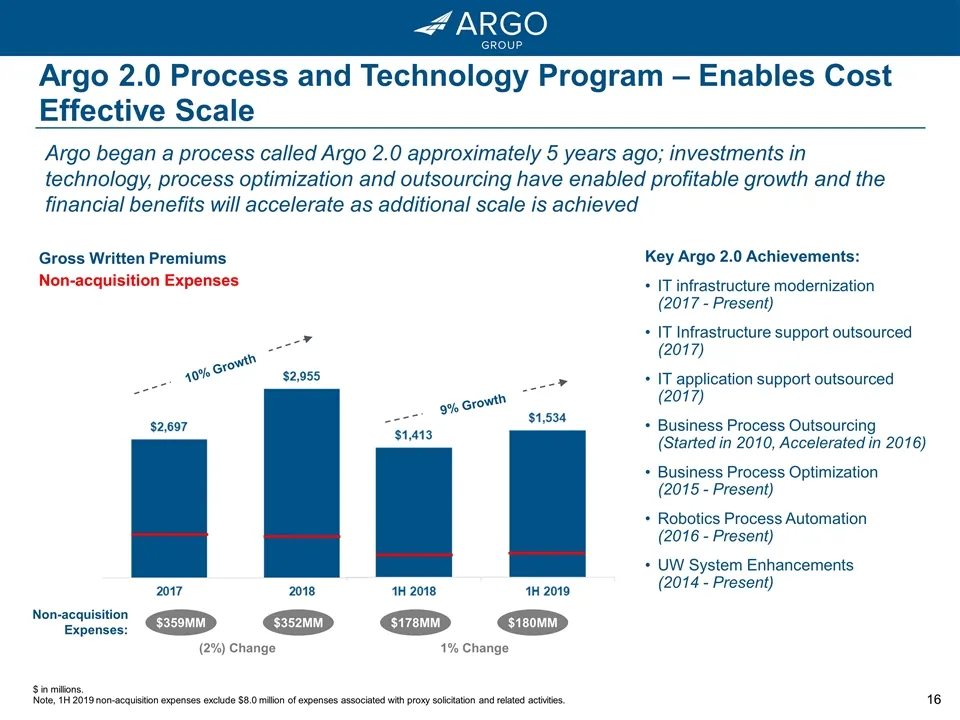
Argo began a process called Argo 2.0 approximately 5 years ago; investments in technology, process optimization and outsourcing have enabled profitable growth and the financial benefits will accelerate as additional scale is achieved Key Argo 2.0 Achievements: IT infrastructure modernization (2017 -
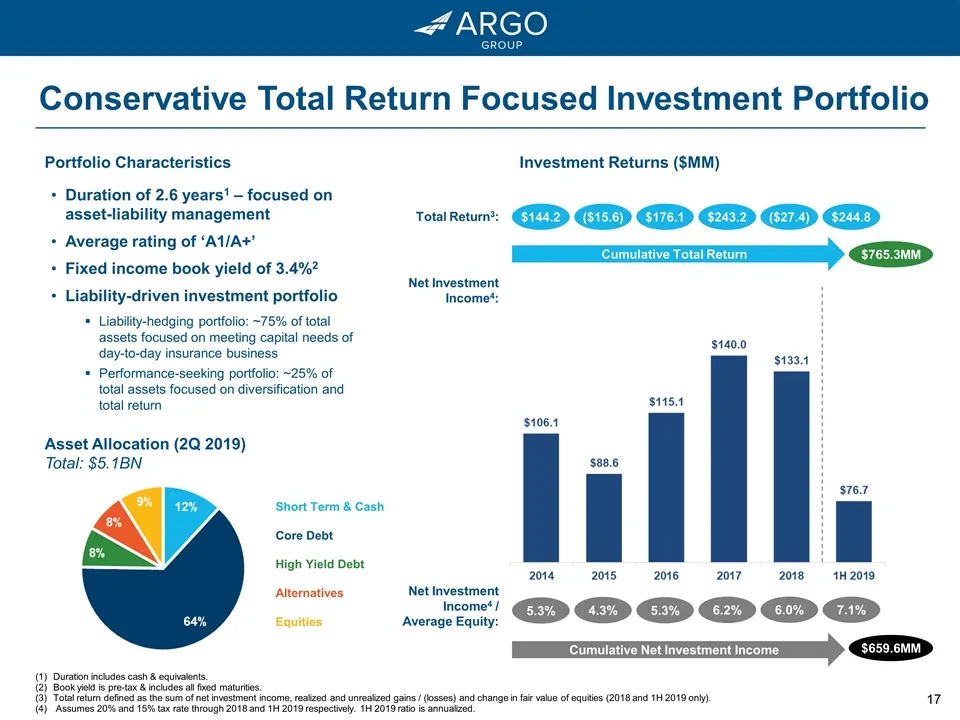
Slide 17: Investment Portfolio Characteristics and Returns
Duration includes cash & equivalents. Book yield is pre-tax & includes all fixed maturities. Total return defined as the sum of net investment income, realized and unrealized gains / (losses) and change in fair value of equities (2018 and 1H 2019 only). Assumes 20% and 15% tax rate through 2018 and
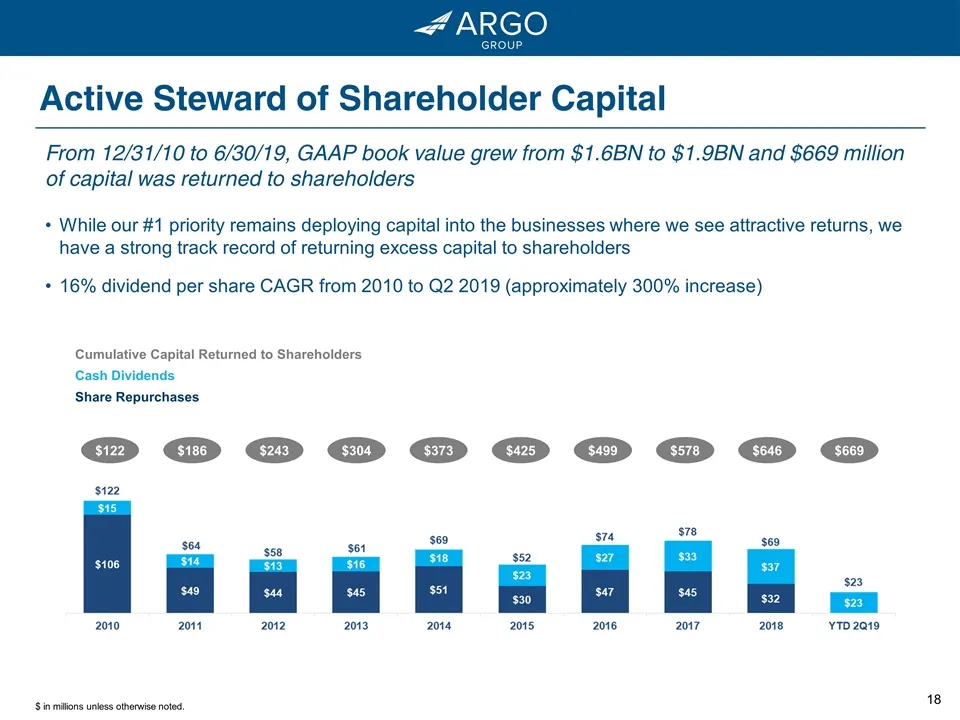
Slide 18: Active Steward of Shareholder Capital
Active Steward of Shareholder Capital $ in millions unless otherwise noted. From 12/31/10 to 6/30/19, GAAP book value grew from $1.6BN to $1.9BN and $669 million of capital was returned to shareholders While our #1 priority remains deploying capital into the businesses where we see attractive return
Slide 19: Well Positioned to Create Value in 2019 and Beyond
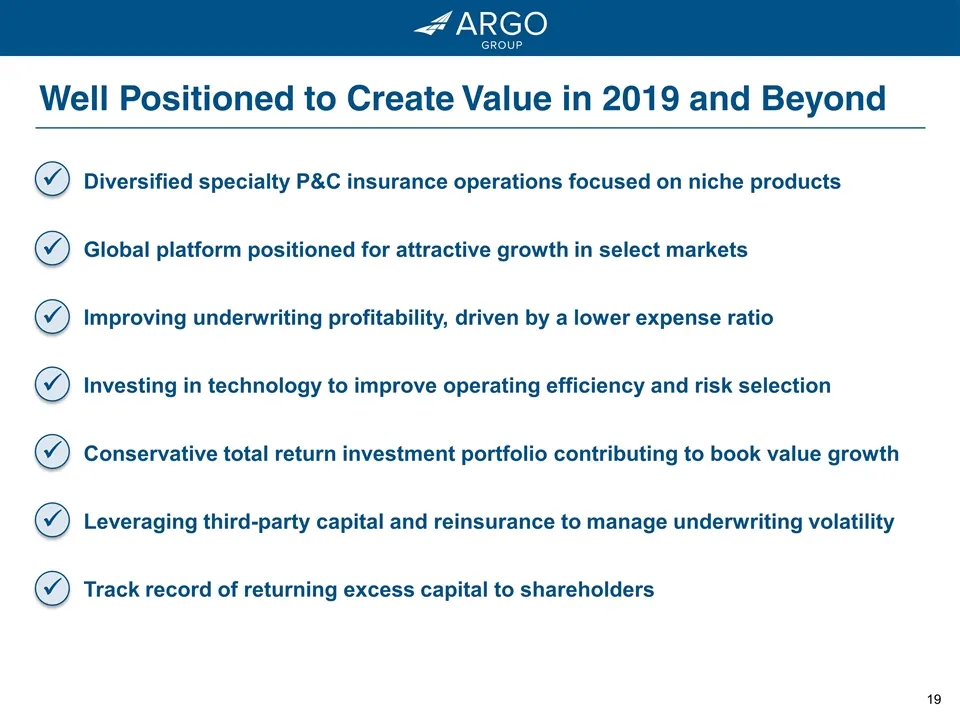
Well Positioned to Create Value in 2019 and Beyond Diversified specialty P&C insurance operations focused on niche products Global platform positioned for attractive growth in select markets Improving underwriting profitability, driven by a lower expense ratio Investing in technology to improve oper
Source: SEC EDGAR · 8-K filed Sep 4, 2019
More decks from Argo Group International Holdings Ltd
 Proxy Contest (November 2022)39 slides · Nov 18, 2022
 Corporate Update (September 2022)23 slides · Sep 8, 2022
 Investor Presentation (February 2022)24 slides · Feb 23, 2022
 Q3 2021 Earnings Presentation7 slides · Nov 3, 2021
 Investor Day (March 2021)59 slides · Mar 12, 2021
 Investor Presentation (November 2020)17 slides · Nov 10, 2020