Symrise AG · XETR:SY1
Symrise — Investor Presentation (January 2015)
24 slides from Symrise's investor presentation, January 2015
Slide 1: Symrise Company Presentation
SYMRISE COMPANY PRESENTATION Bernd Hirsch (CFO) January 2015 PAGE 1
Slide 2: Table of Contents
SYMRISE TABLE OF CONTENTS INTRODUCTION STRATEGY FINANCIALS OUTLOOK PAGE 2
Slide 3: Successful since 1874
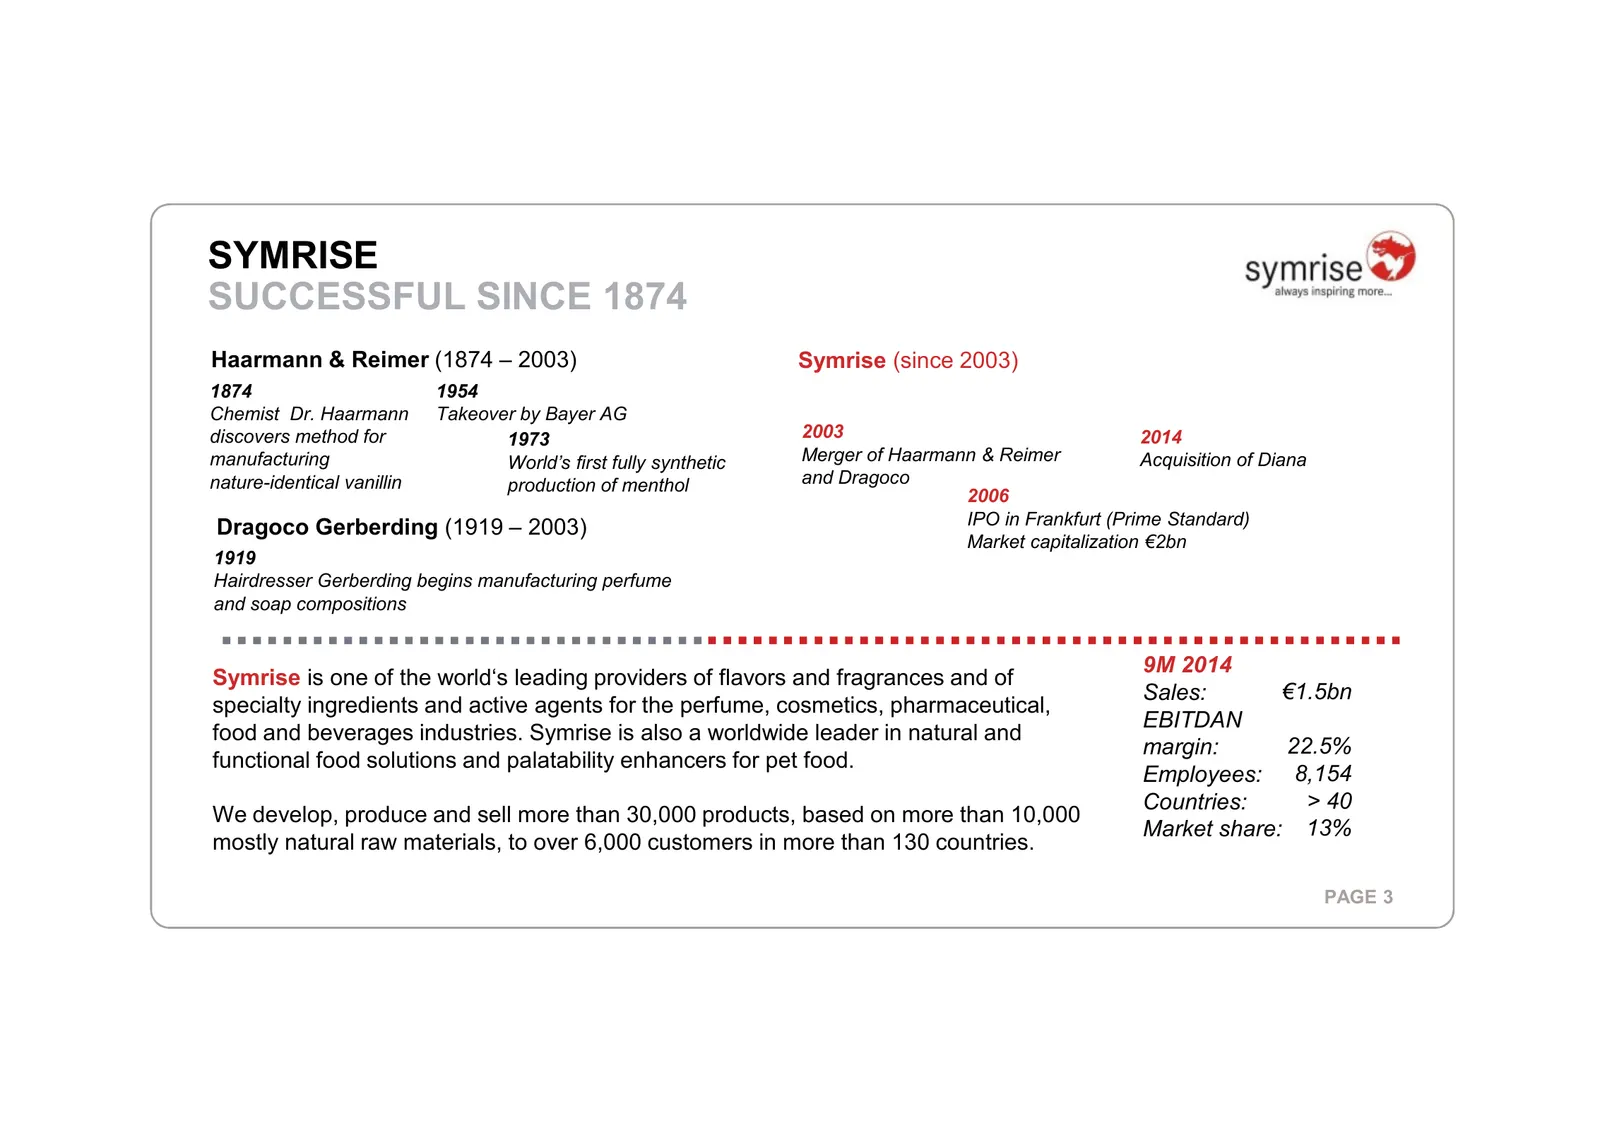
SYMRISE SUCCESSFUL SINCE 1874 Haarmann & Reimer (1874 – 2003) Symrise (since 2003) 1874 1954 Chemist Dr. Haarmann Takeover by Bayer AG discovers method for 1973 2003 2014 manufacturing World’s first fully synthetic Merger of Haarmann & Reimer Acquisition of Diana nature-identical vanillin production
Slide 4: Our Global Reach
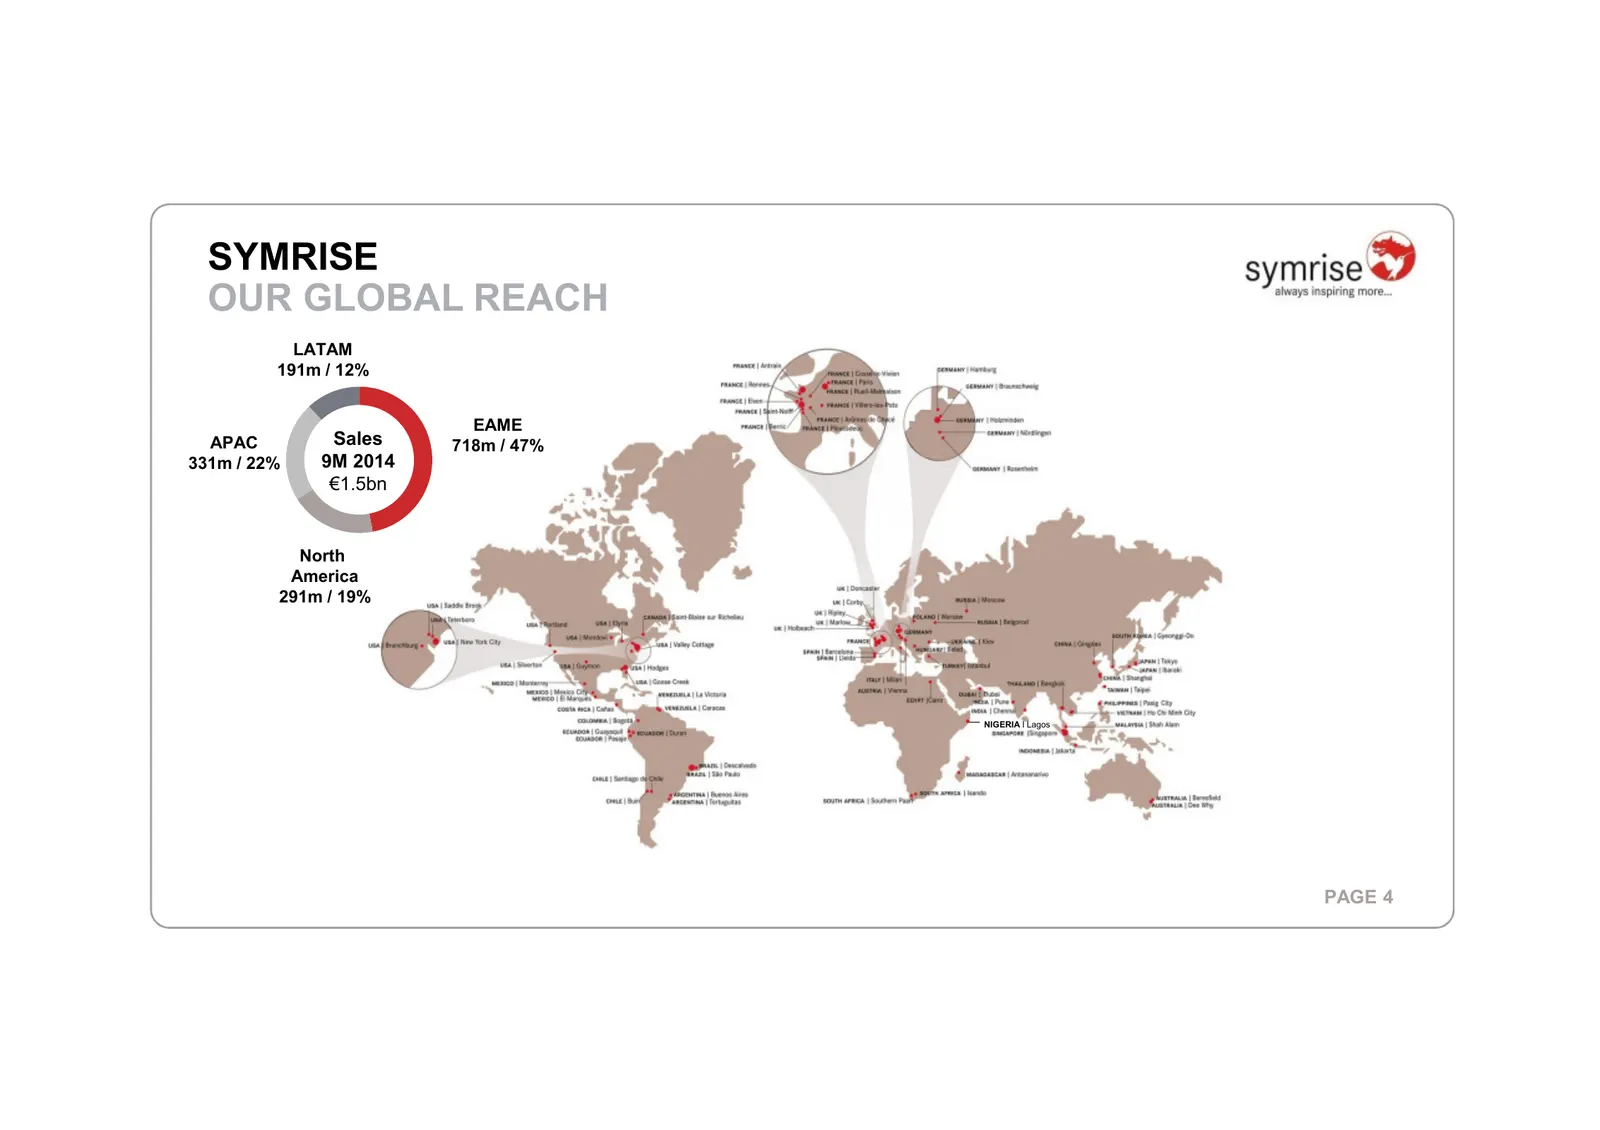
SYMRISE OUR GLOBAL REACH LATAM 191m / 12% EAME APAC Sales 718m / 47% 331m / 22% 9M 2014 €1.5bn North America 291m / 19% NIGERIA I Lagos PAGE 4
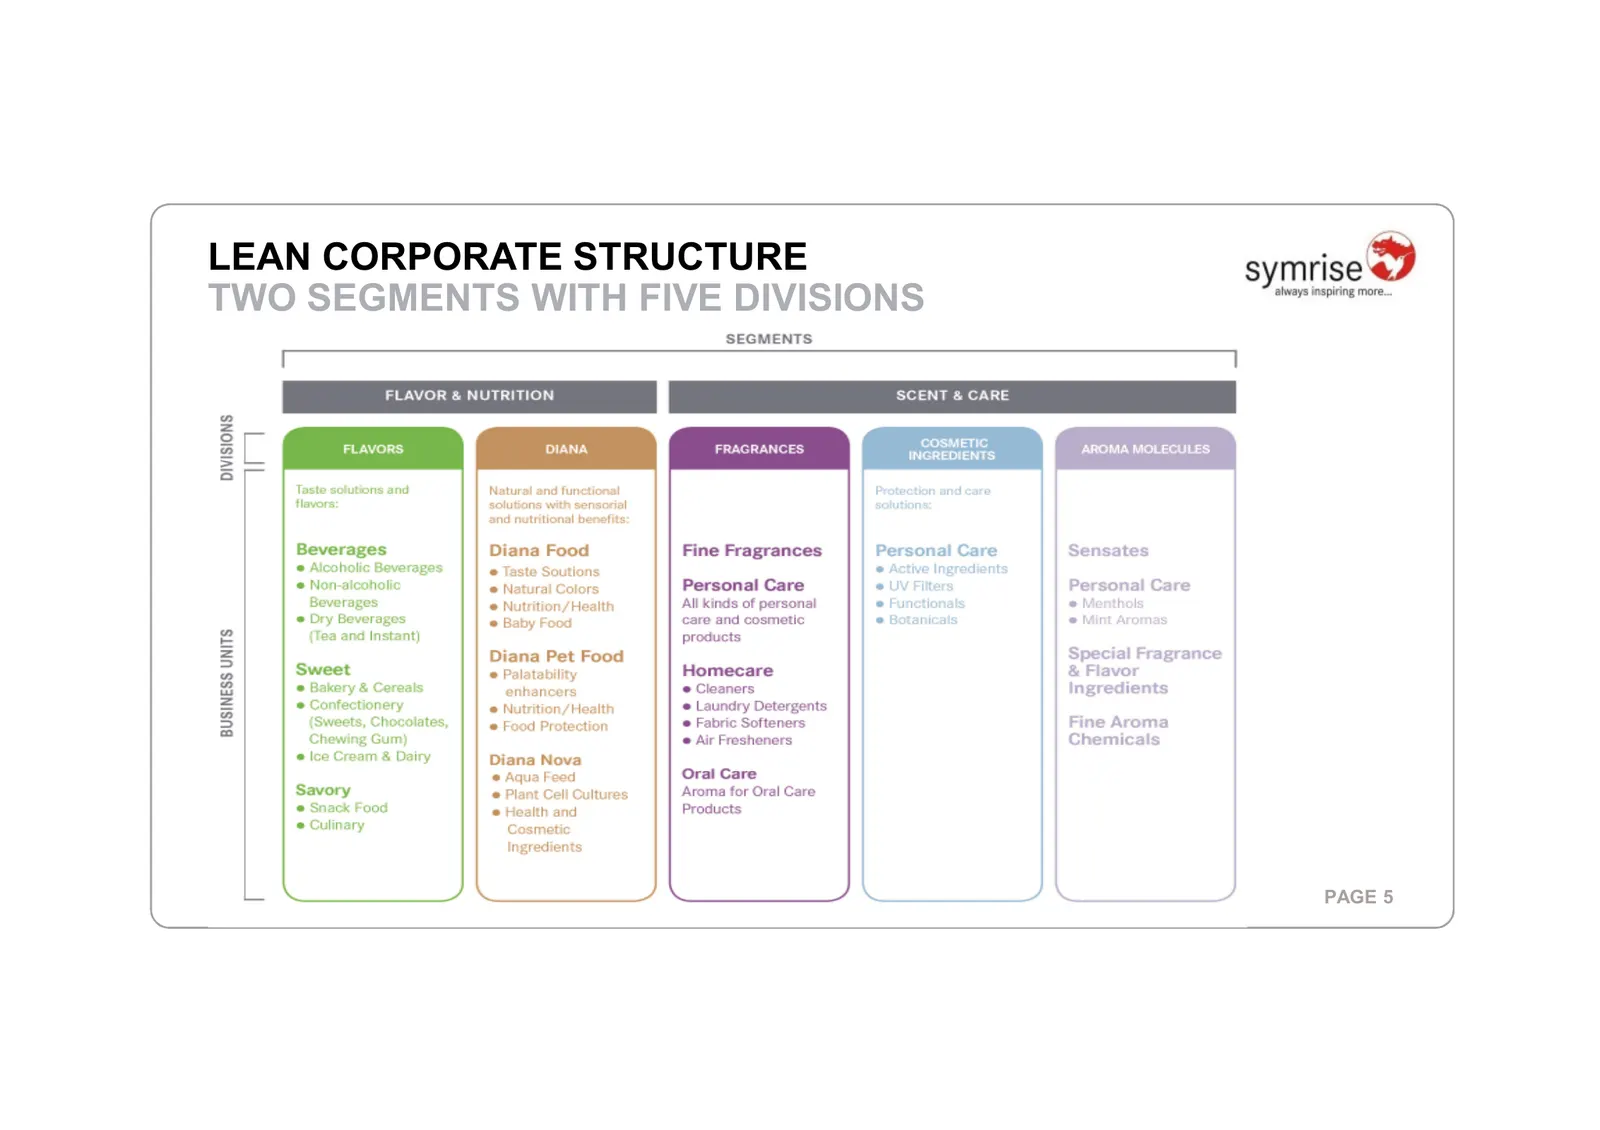
Slide 5: Lean Corporate Structure: Two Segments with Five Divisions
LEAN CORPORATE STRUCTURE TWO SEGMENTS WITH FIVE DIVISIONS PAGE 5
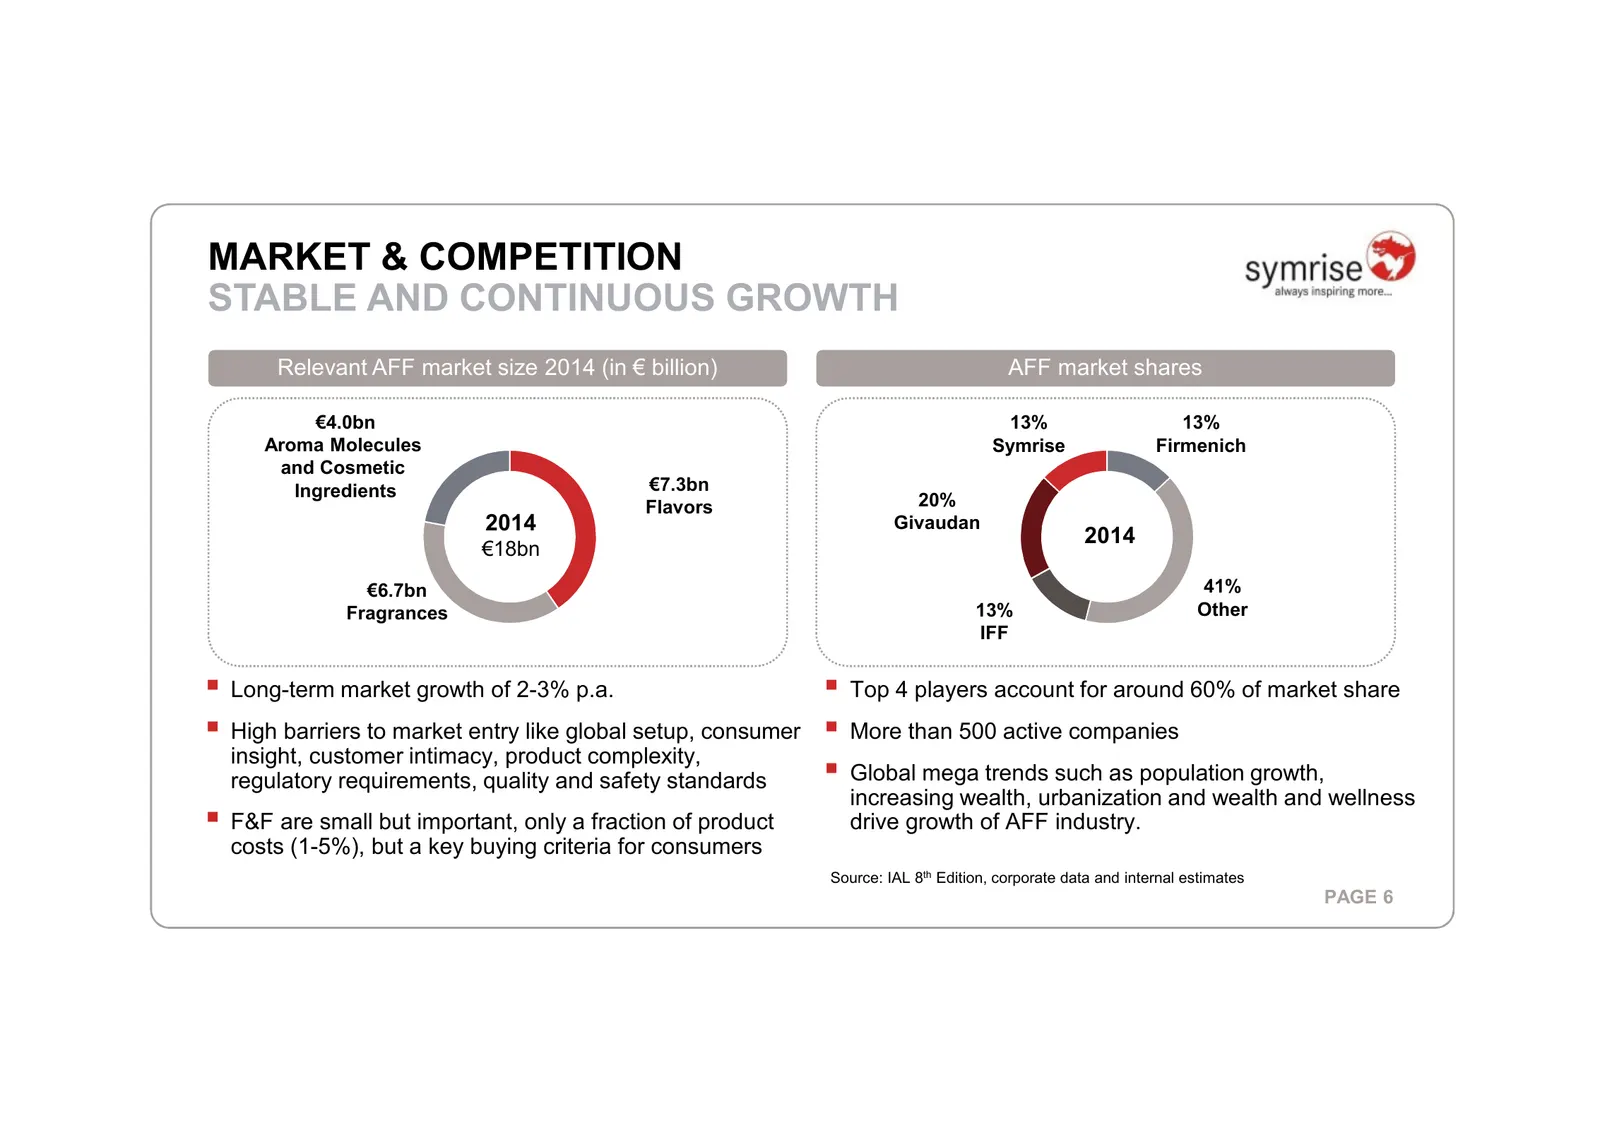
Slide 6: Market & Competition: Stable and Continuous Growth
MARKET & COMPETITION STABLE AND CONTINUOUS GROWTH Relevant AFF market size 2014 (in € billion) AFF market shares €4.0bn 13% 13% Aroma Molecules Symrise Firmenich and Cosmetic Ingredients €7.3bn Flavors 20% 2014 Givaudan 2014 €18bn €6.7bn 41% Fragrances 13% Other IFF Long-term market growth of 2-3% p
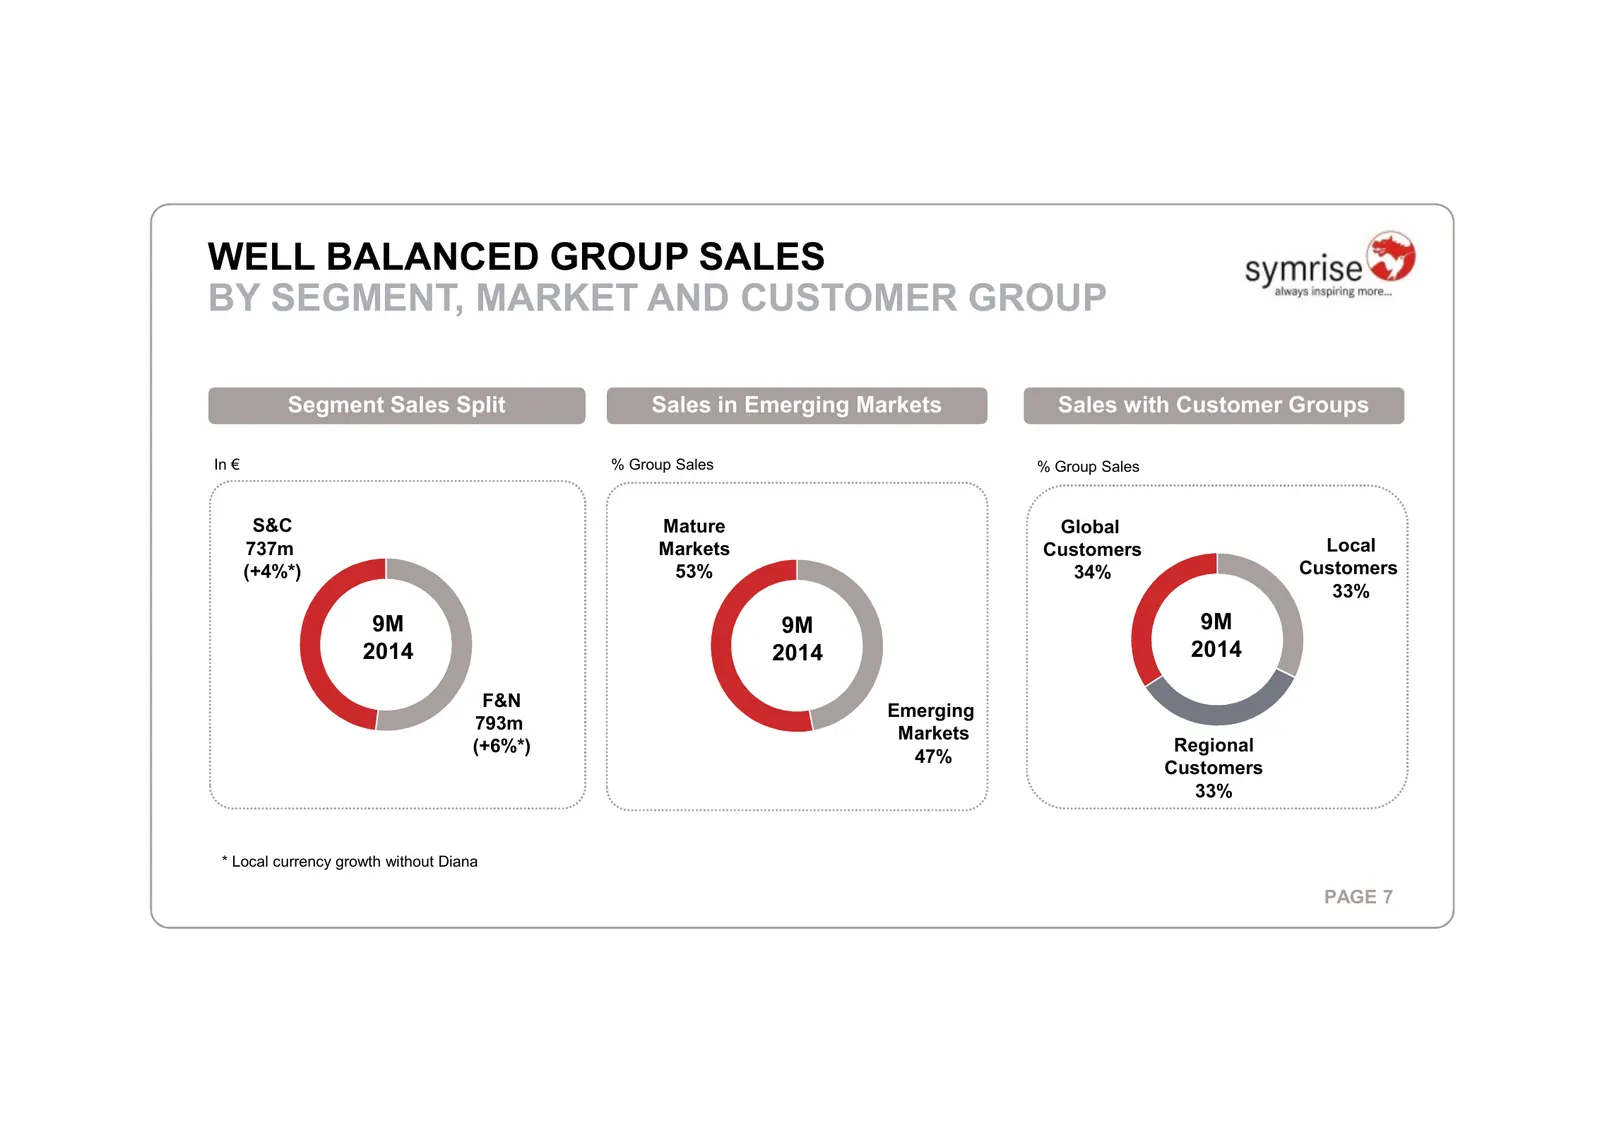
Slide 7: Well Balanced Group Sales by Segment, Market and Customer Group
WELL BALANCED GROUP SALES BY SEGMENT, MARKET AND CUSTOMER GROUP Segment Sales Split Sales in Emerging Markets Sales with Customer Groups In € % Group Sales % Group Sales S&C Mature Global 737m Markets Customers Local (+4%*) 53% 34% Customers 33% 9M 9M 9M 2014 2014 2014 F&N Emerging 793m Markets (+6%
Slide 8: Table of Contents
SYMRISE TABLE OF CONTENTS INTRODUCTION STRATEGY FINANCIALS OUTLOOK PAGE 8
Slide 9: Three-Pillar Strategy to Ensure Sustainable, Profitable Growth
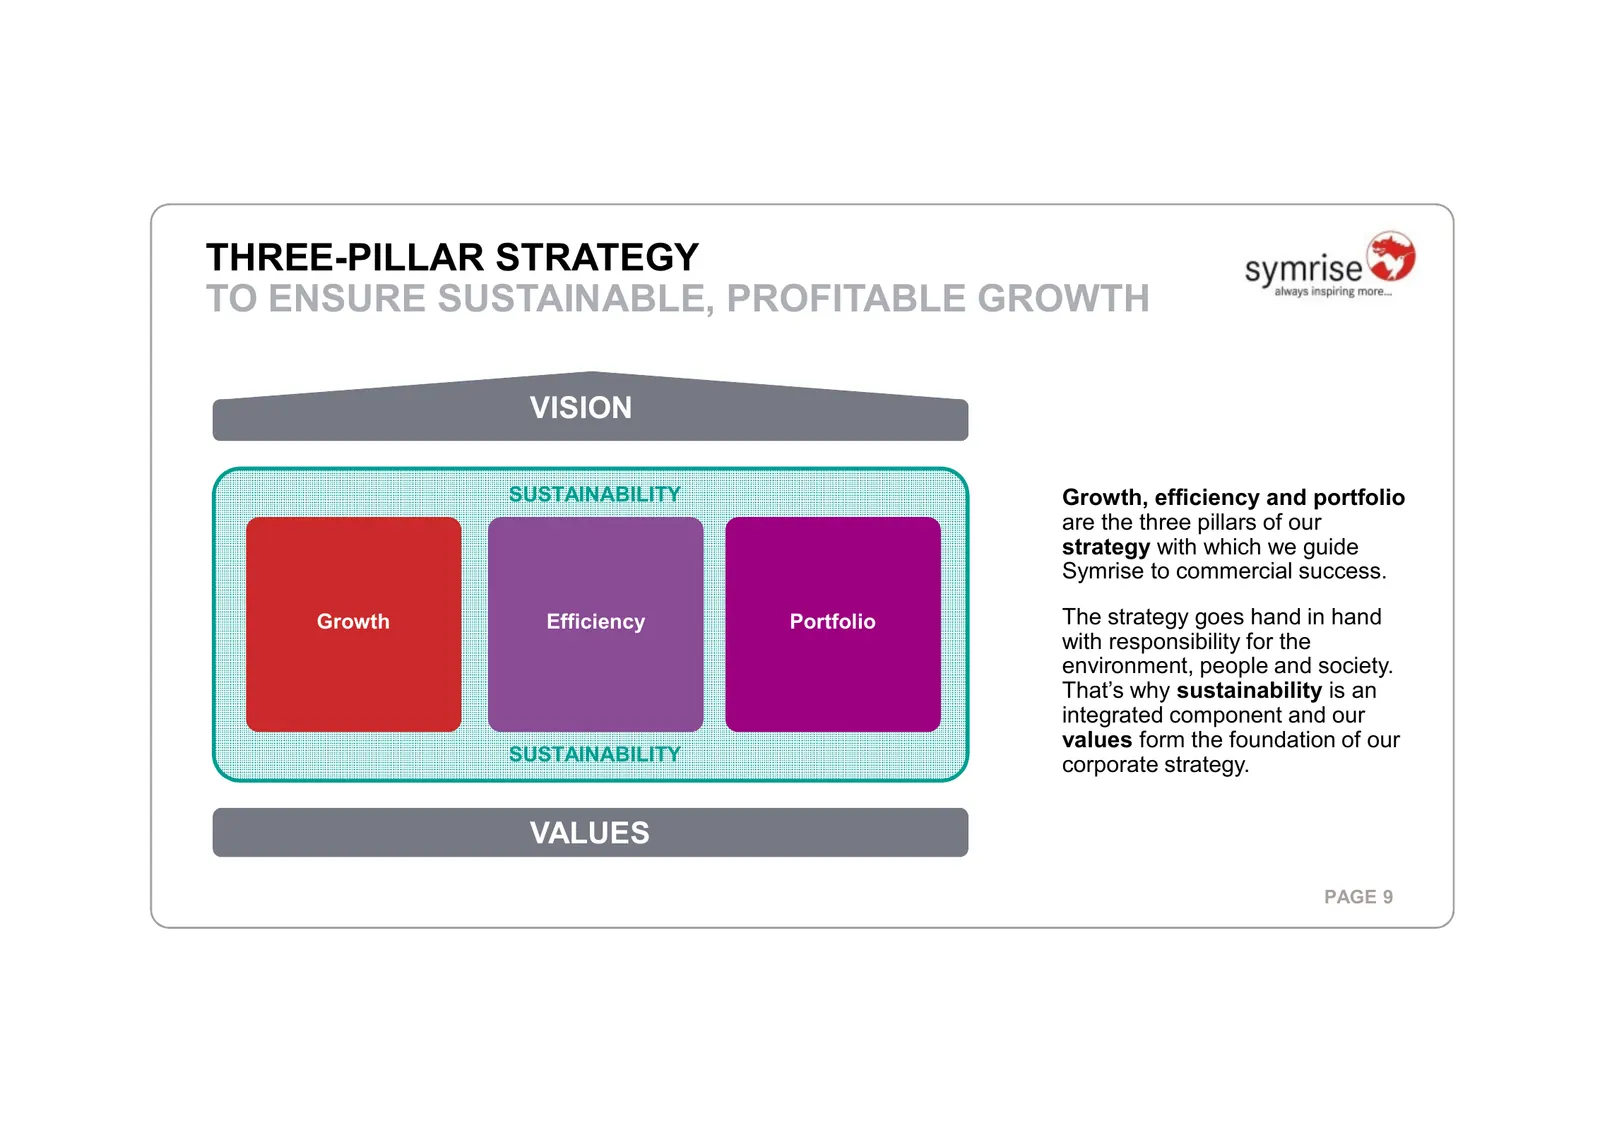
THREE-PILLAR STRATEGY TO ENSURE SUSTAINABLE, PROFITABLE GROWTH VISION SUSTAINABILITY Growth, efficiency and portfolio are the three pillars of our strategy with which we guide Symrise to commercial success. Growth Efficiency Portfolio The strategy goes hand in hand with responsibility for the enviro
Slide 10: Growth - Capacity Expansion: Organic Growth Initiatives
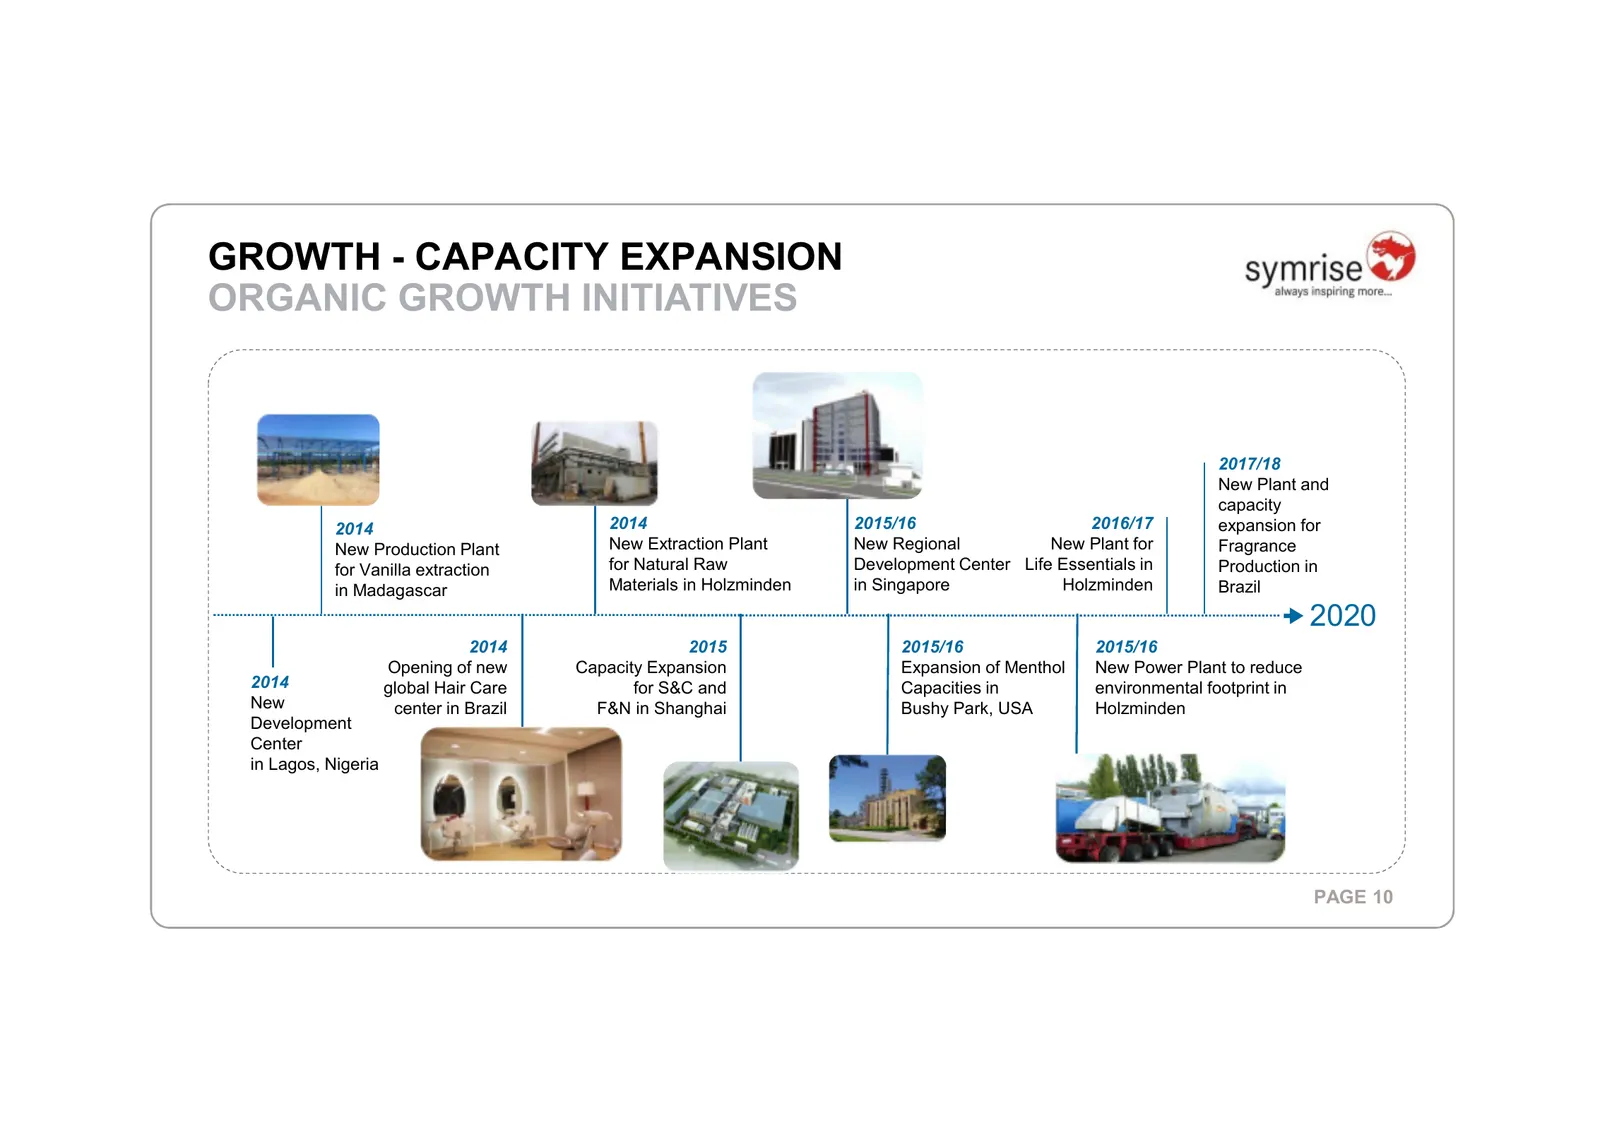
GROWTH - CAPACITY EXPANSION ORGANIC GROWTH INITIATIVES 2017/18 New Plant and capacity 2014 2014 2015/16 2016/17 expansion for New Production Plant New Extraction Plant New Regional New Plant for Fragrance for Vanilla extraction for Natural Raw Development Center Life Essentials in Production in in M
Slide 11: Growth – Regional Expansion: Selected Initiatives in Africa
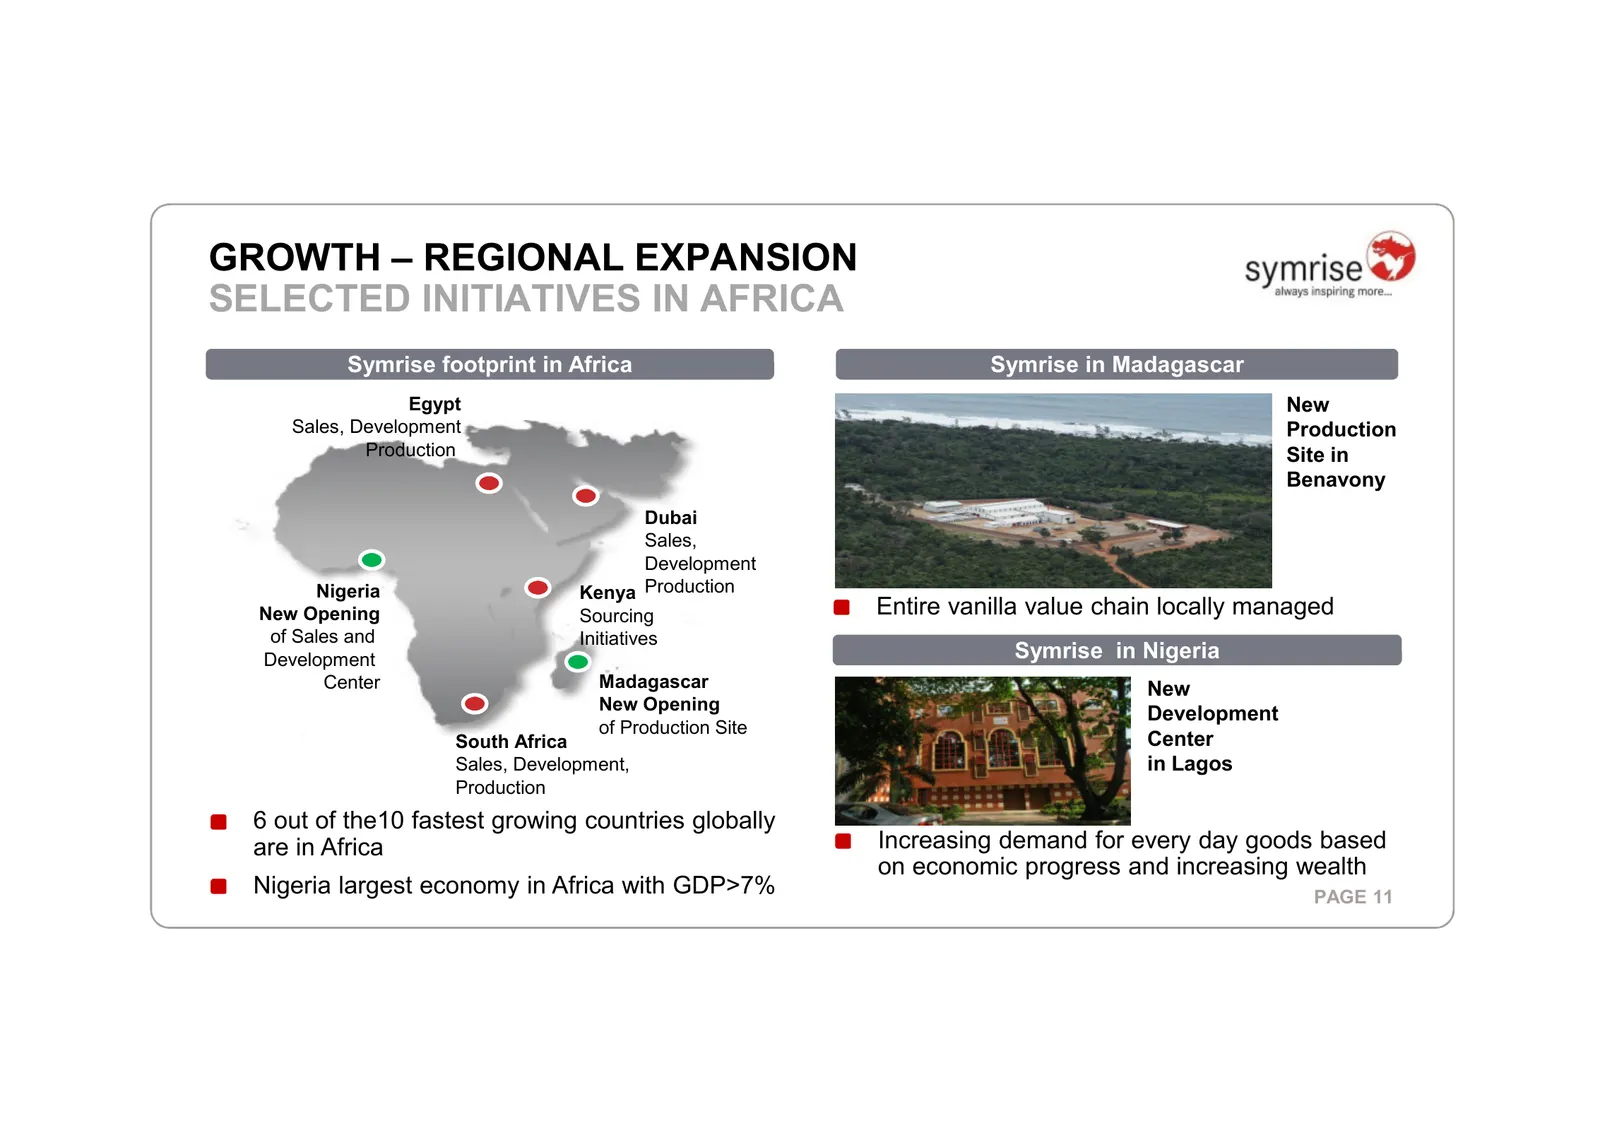
GROWTH – REGIONAL EXPANSION SELECTED INITIATIVES IN AFRICA Symrise footprint in Africa Symrise in Madagascar Egypt New Sales, Development Production Production Site in Benavony Dubai Sales, Development Nigeria Kenya Production New Opening Sourcing Entire vanilla value chain locally managed of Sales
Slide 12: Efficiency: Backward Integration
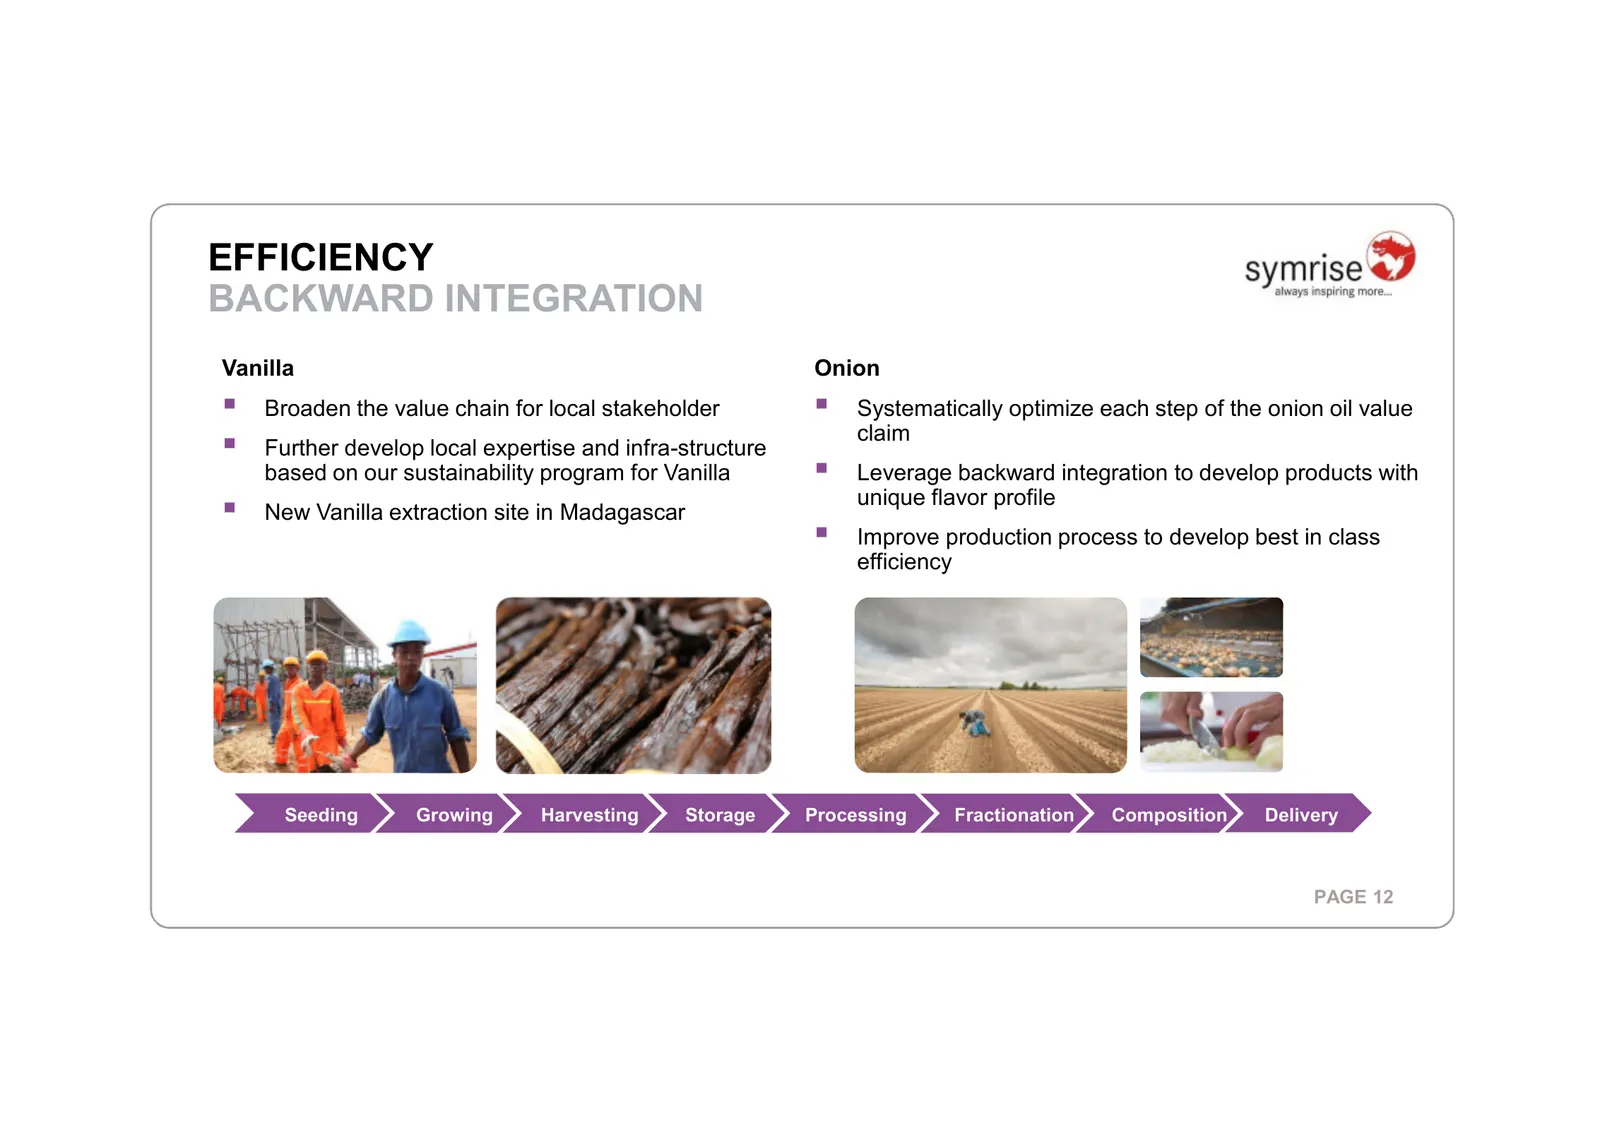
EFFICIENCY BACKWARD INTEGRATION Vanilla Onion Broaden the value chain for local stakeholder Systematically optimize each step of the onion oil value claim Further develop local expertise and infra-structure based on our sustainability program for Vanilla Leverage backward integration to develop prod
Slide 13: Portfolio: Capitalizing on Major Trends
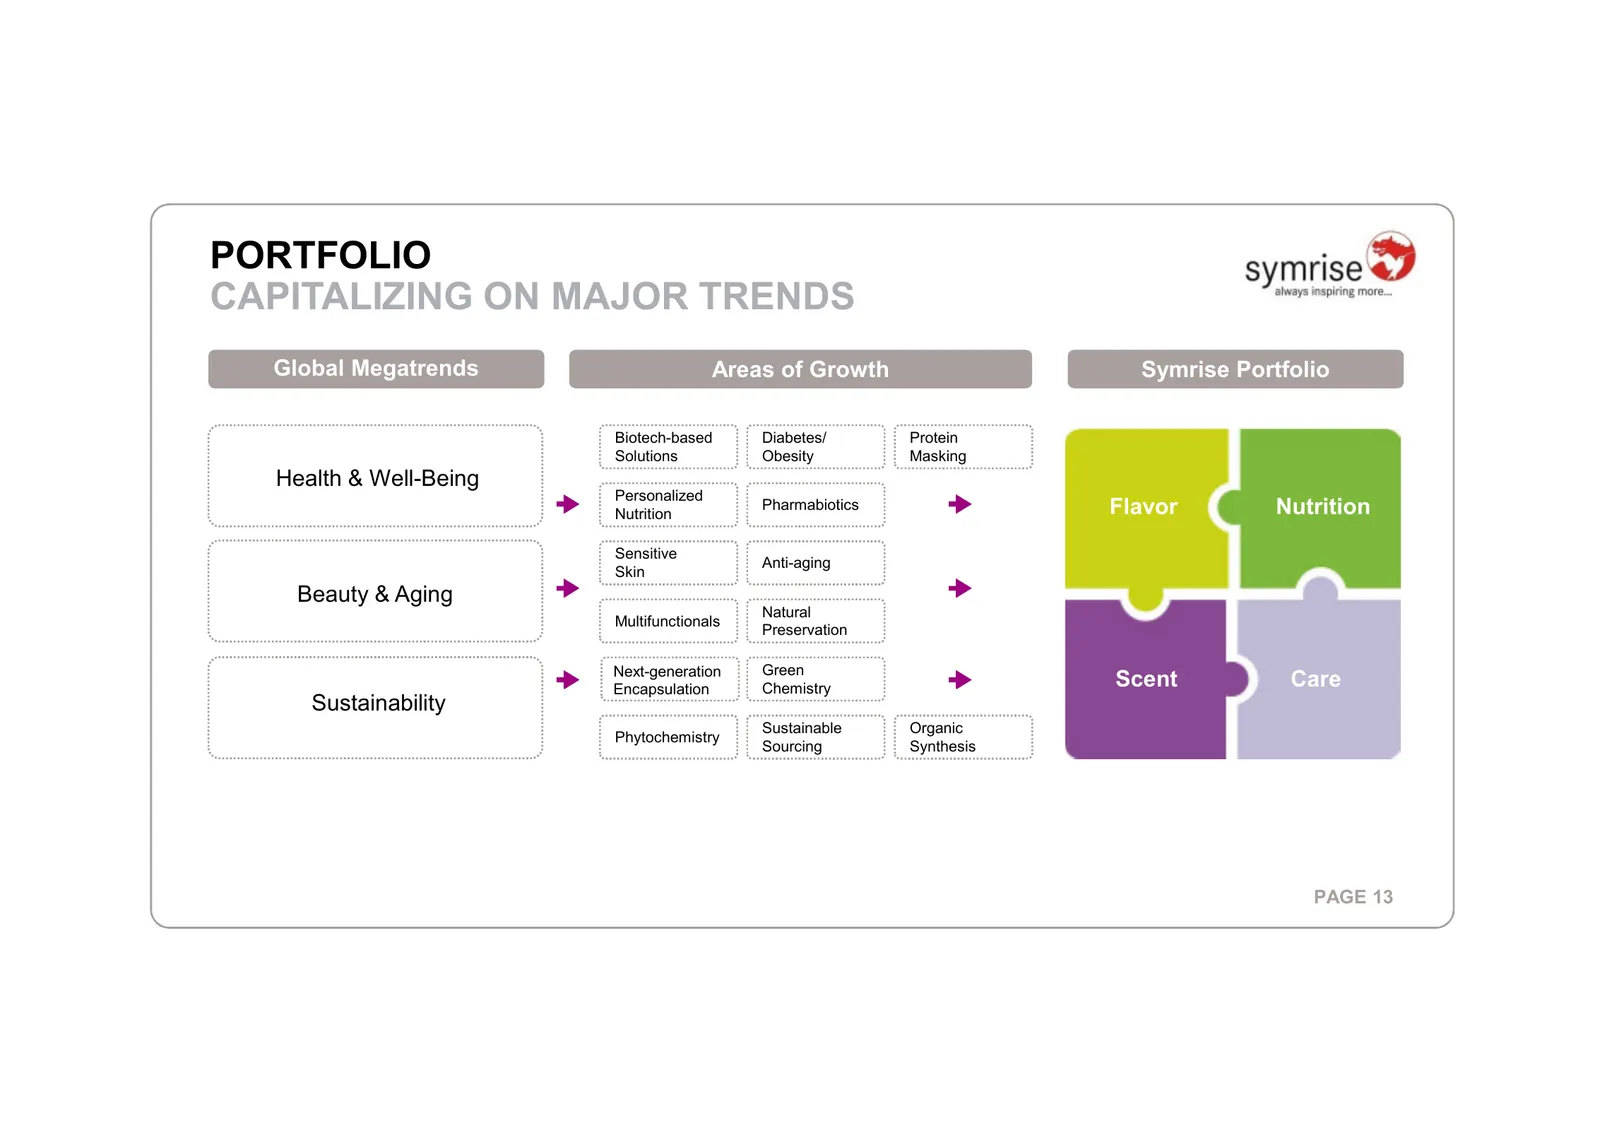
PORTFOLIO CAPITALIZING ON MAJOR TRENDS Global Megatrends Areas of Growth Symrise Portfolio Biotech-based Diabetes/ Protein Solutions Obesity Masking Health & Well-Being Personalized Nutrition Pharmabiotics Flavor Nutrition Sensitive Anti-aging Skin Beauty & Aging Natural Multifunctionals Preservatio
Slide 14: Diana Acquisition – Triple Fit
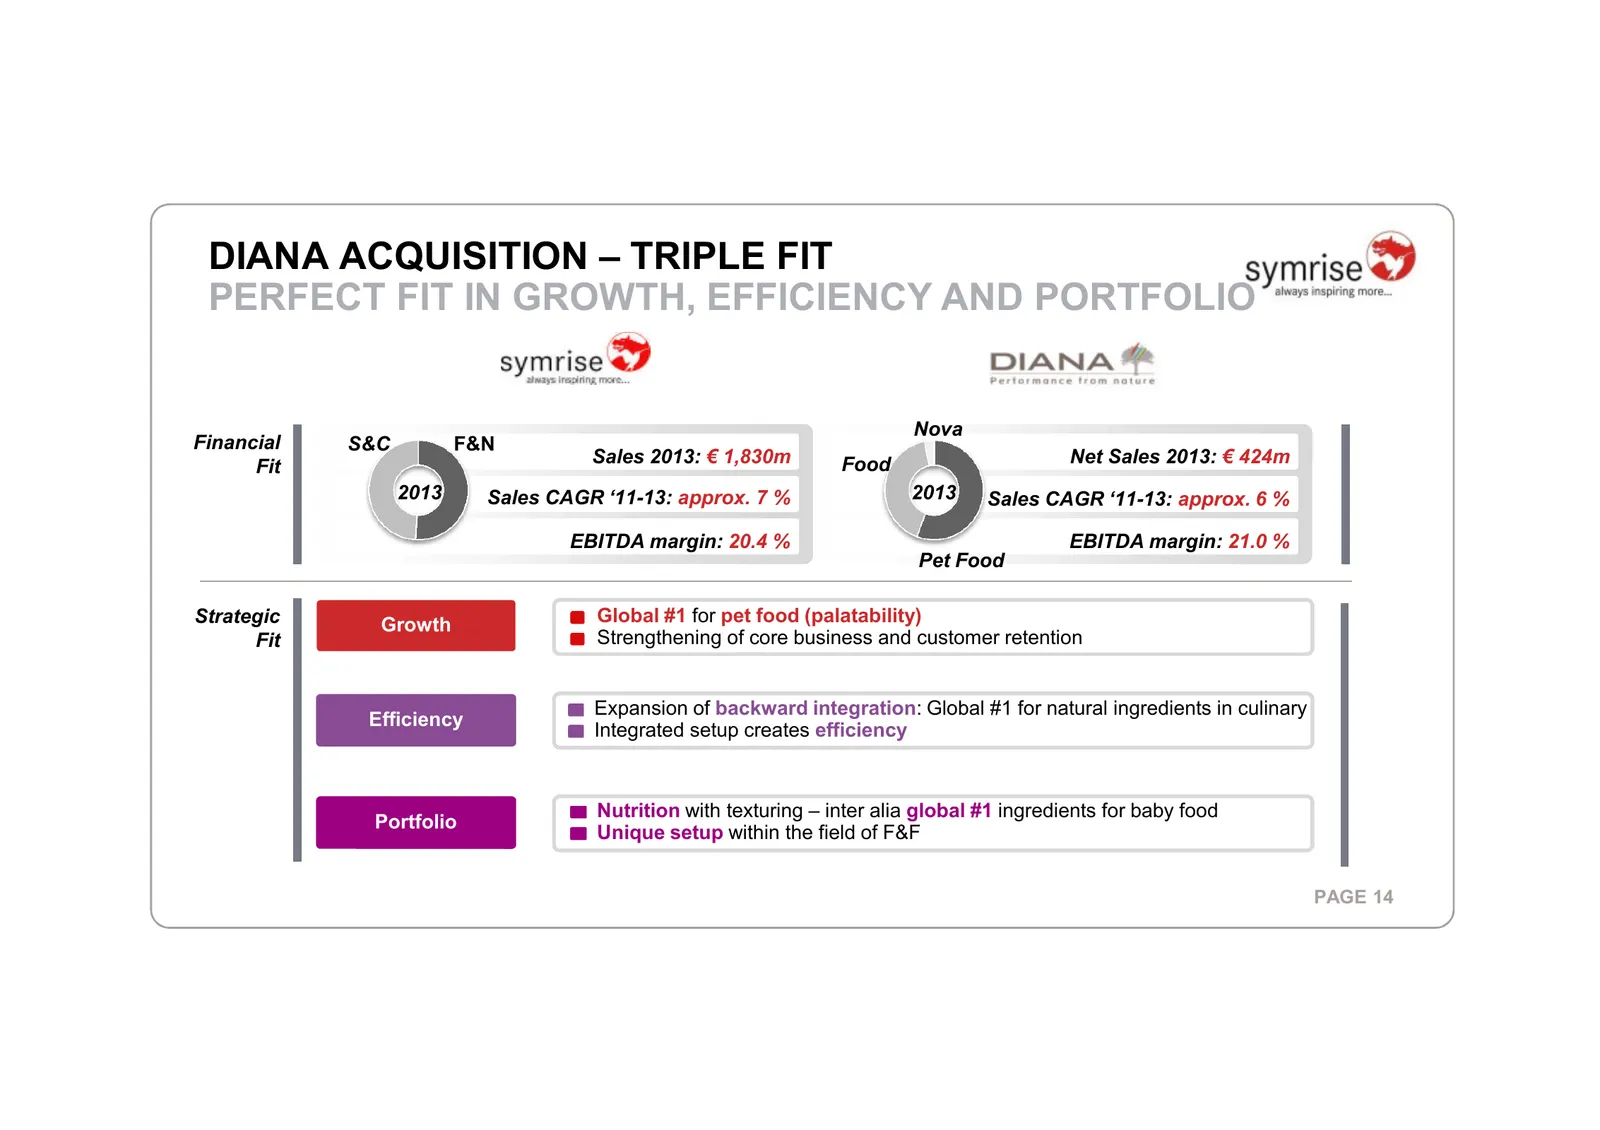
DIANA ACQUISITION – TRIPLE FIT PERFECT FIT IN GROWTH, EFFICIENCY AND PORTFOLIO Nova Financial S&C F&N Fit Sales 2013: € 1,830m Food Net Sales 2013: € 424m 2013 Sales CAGR ‘11-13: approx. 7 % 2013 Sales CAGR ‘11-13: approx. 6 % EBITDA margin: 20.4 % EBITDA margin: 21.0 % Pet Food Strategic Growth Glo
Slide 15: Major Trends: Pet Parenting Drives Pet Food Market
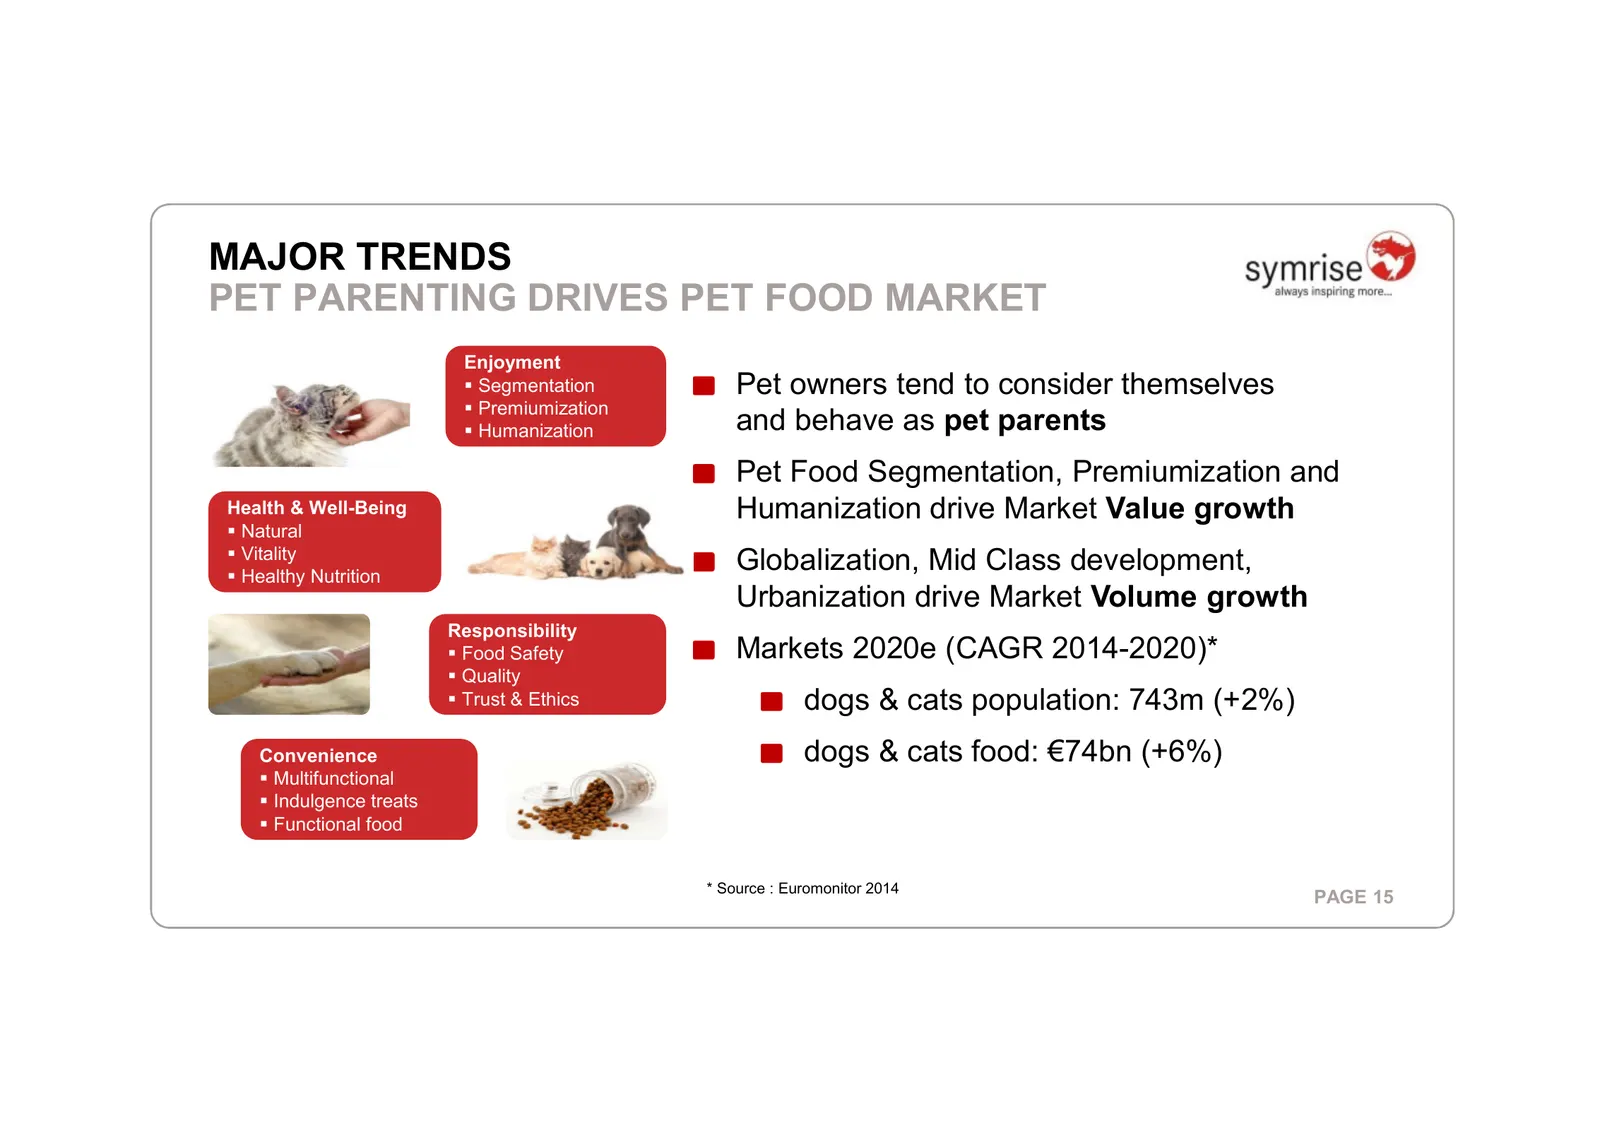
MAJOR TRENDS PET PARENTING DRIVES PET FOOD MARKET Enjoyment Segmentation Pet owners tend to consider themselves Premiumization Humanization and behave as pet parents Pet Food Segmentation, Premiumization and Health & Well-Being Humanization drive Market Value growth Natural Vitality Healthy Nutritio
Slide 16: Integrating Diana: Defined Focus Areas with Clear Objectives
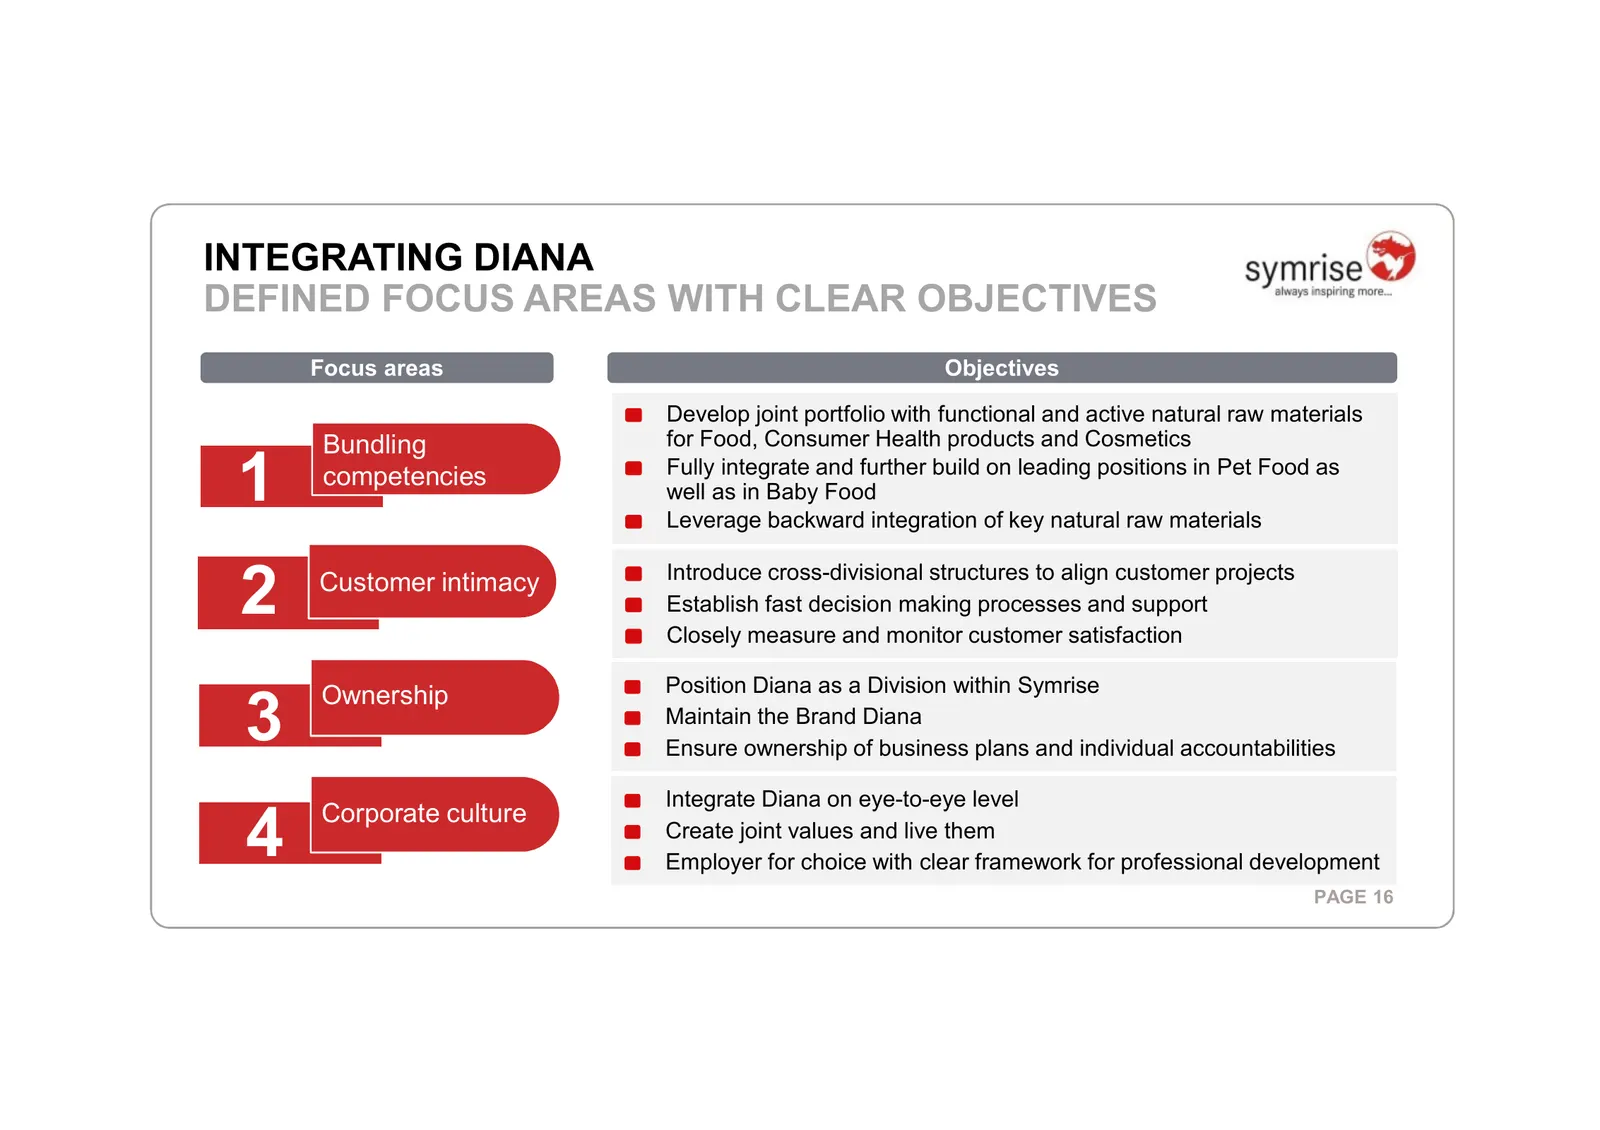
INTEGRATING DIANA DEFINED FOCUS AREAS WITH CLEAR OBJECTIVES Focus areas Objectives Develop joint portfolio with functional and active natural raw materials Bundling for Food, Consumer Health products and Cosmetics 1 competencies Fully integrate and further build on leading positions in Pet Food as w
Slide 17: Table of Contents
SYMRISE TABLE OF CONTENTS INTRODUCTION STRATEGY FINANCIALS OUTLOOK PAGE 17
Slide 18: Highlights 9M 2014: Symrise Continued Profitable Growth
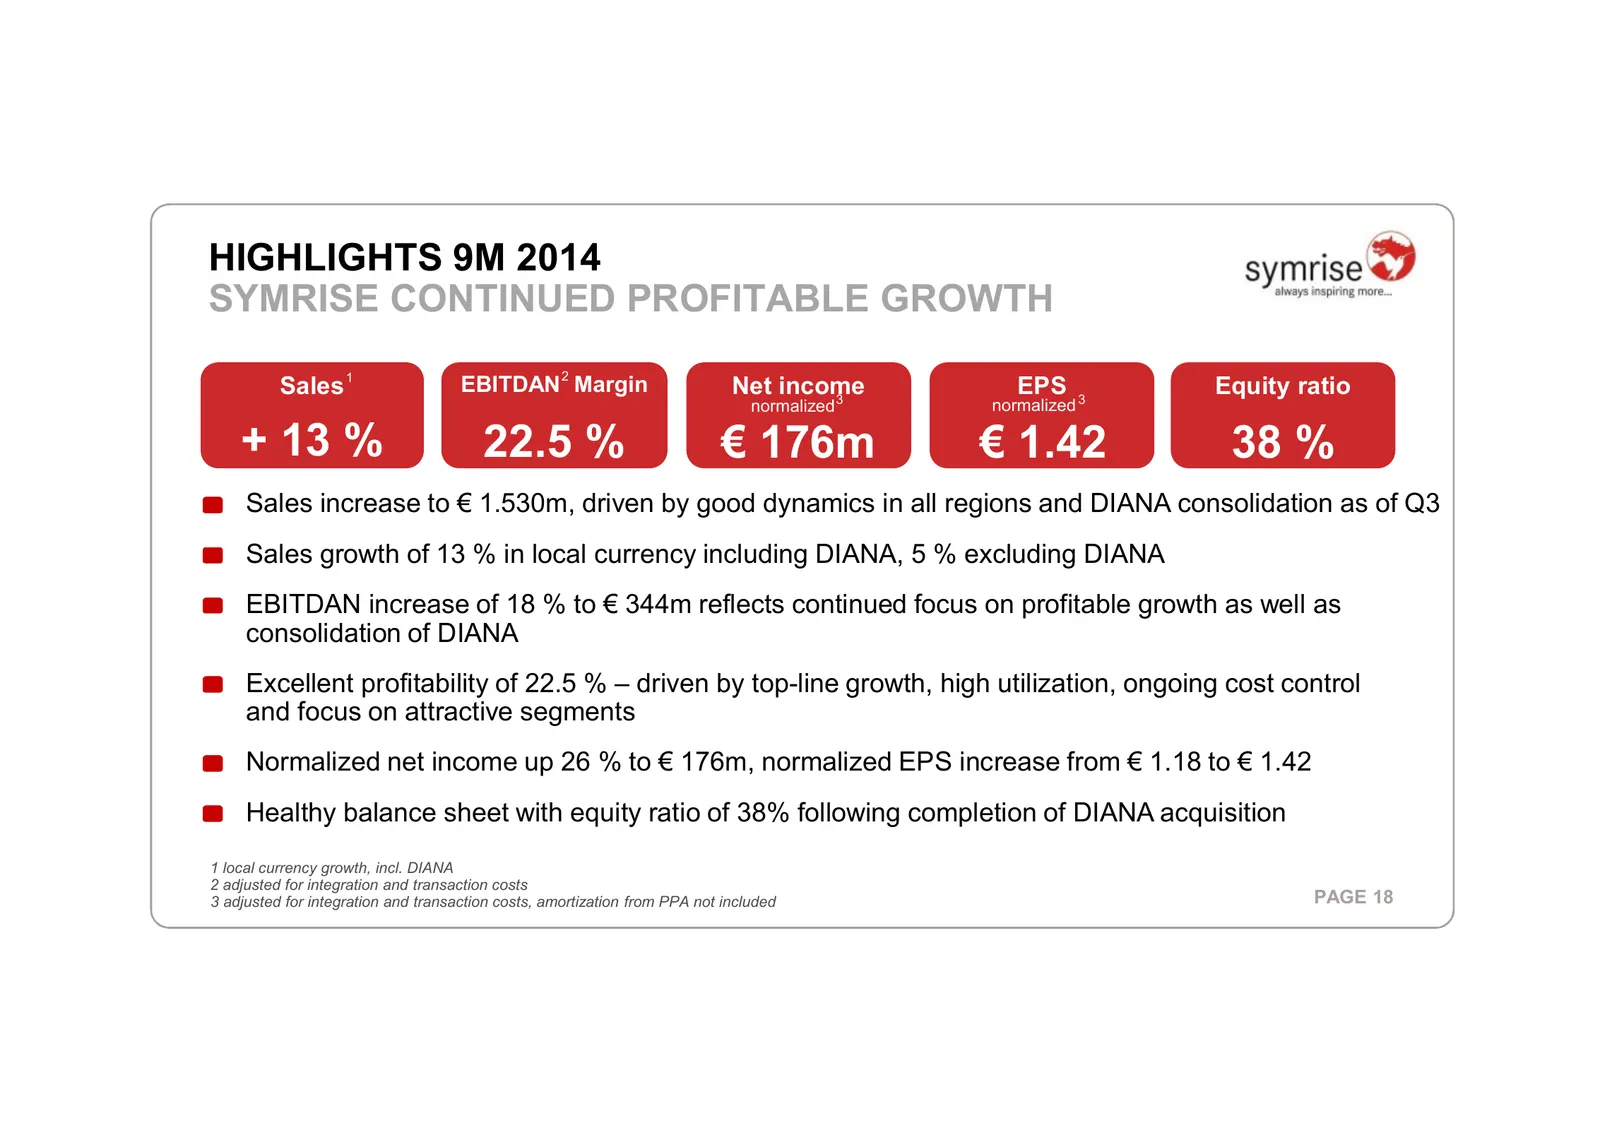
HIGHLIGHTS 9M 2014 SYMRISE CONTINUED PROFITABLE GROWTH Sales 1 EBITDAN 2 Margin Net income EPS Equity ratio 3 normalized 3 normalized + 13 % 22.5 % € 176m € 1.42 38 % Sales increase to € 1.530m, driven by good dynamics in all regions and DIANA consolidation as of Q3 Sales growth of 13 % in local cur
Slide 19: Sales 9M 2014
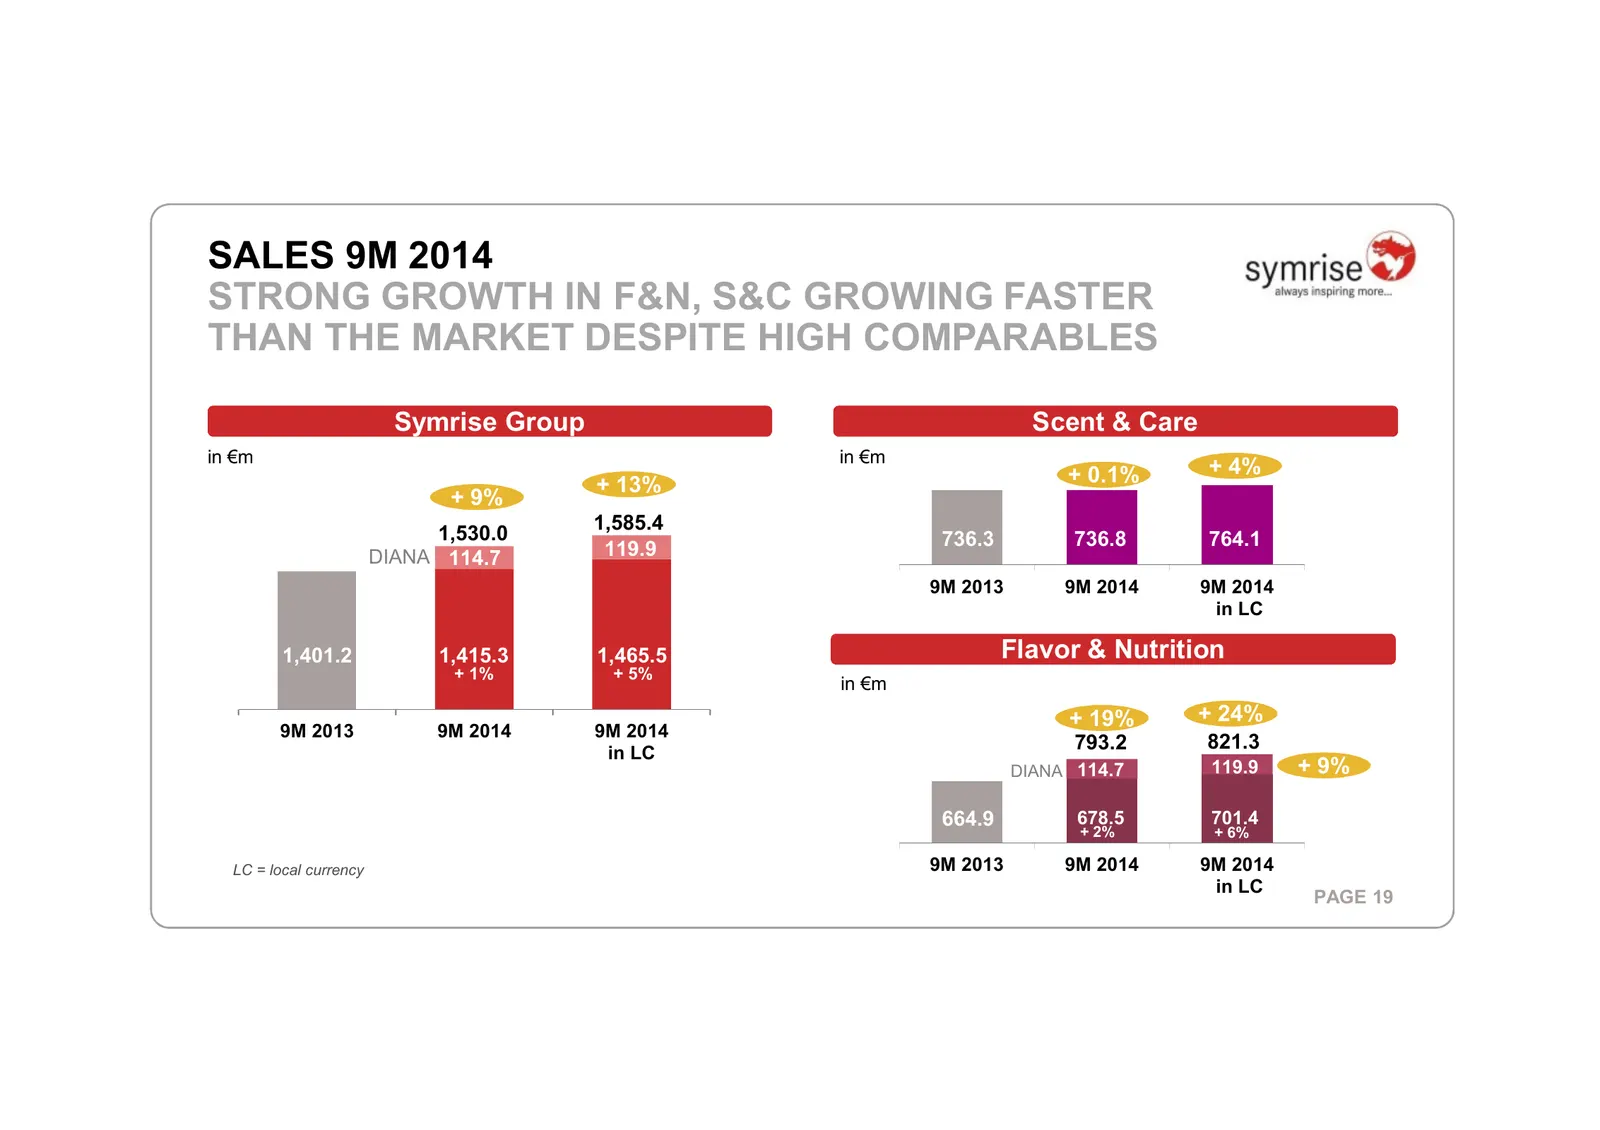
SALES 9M 2014 STRONG GROWTH IN F&N, S&C GROWING FASTER THAN THE MARKET DESPITE HIGH COMPARABLES Symrise Group Scent & Care in €m in €m + 0.1% + 4% + 13% + 9% 1,585.4 1,530.0 736.3 736.8 764.1 DIANA 114.7 119.9 9M 2013 9M 2014 9M 2014 in LC 1,401.2 1,415.3 1,465.5 Flavor & Nutrition + 1% + 5% in €m +
Slide 20: EBITDA 9M 2014: Excellent Profitability
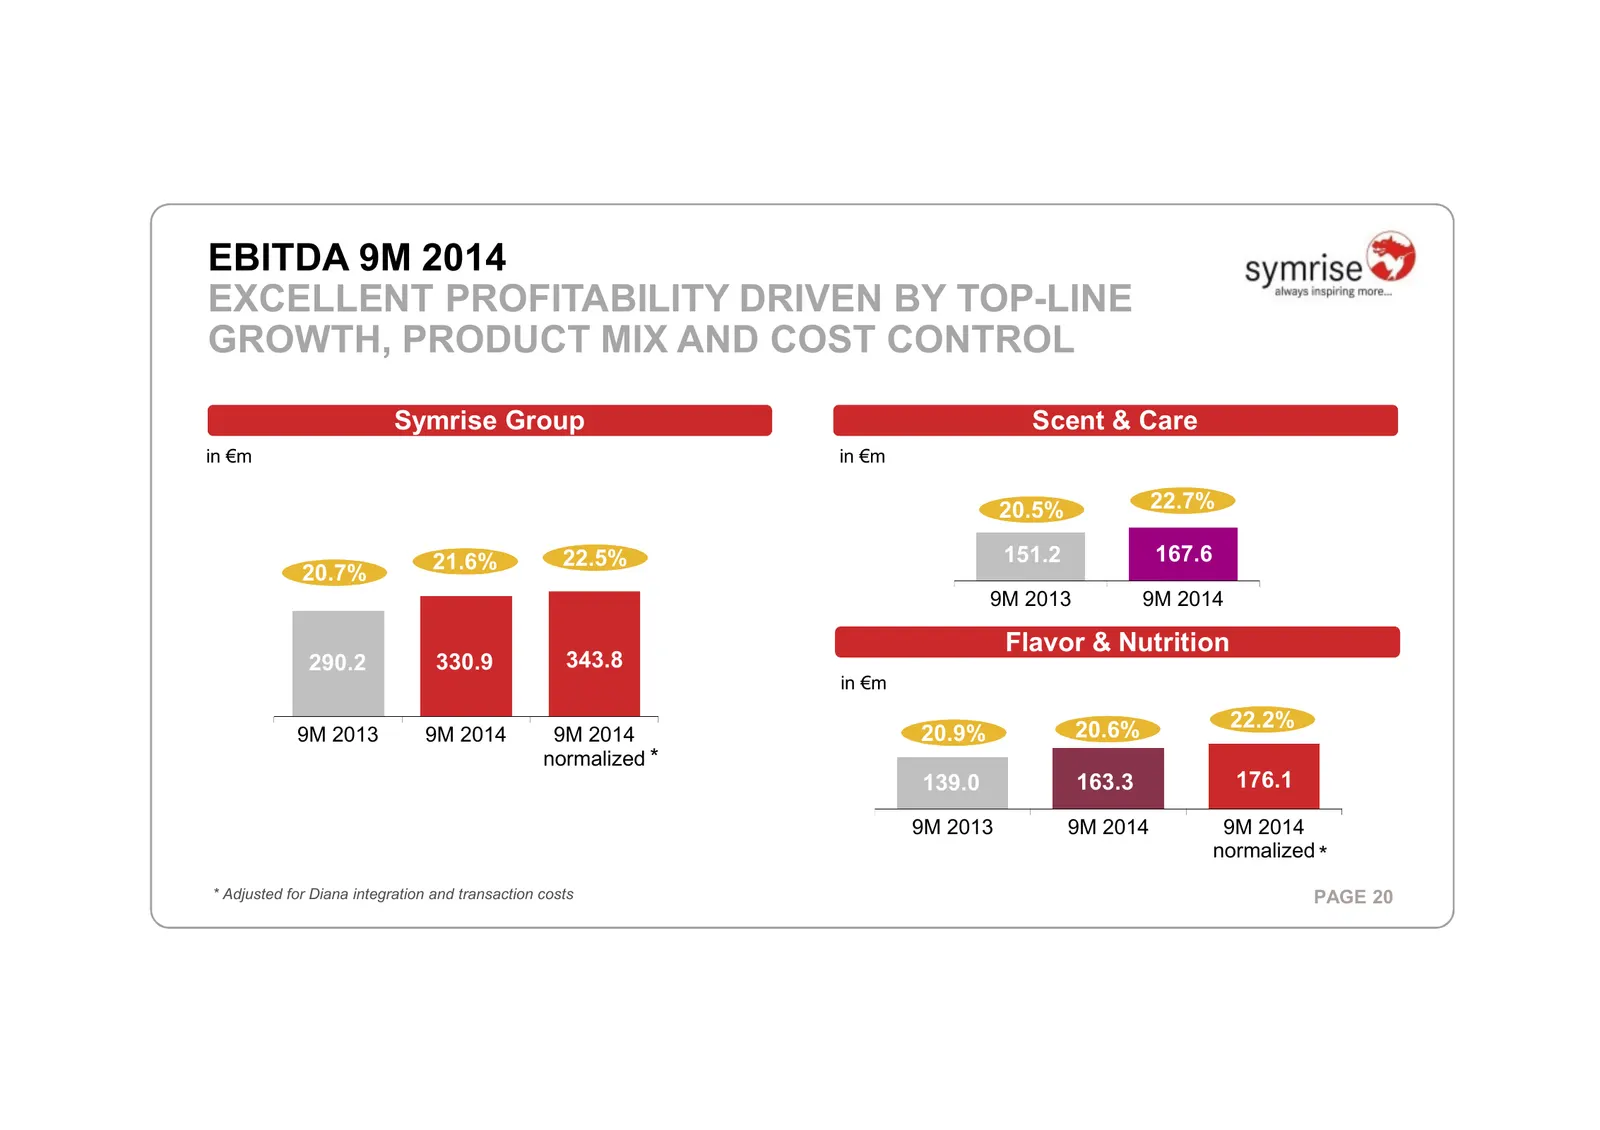
EBITDA 9M 2014 EXCELLENT PROFITABILITY DRIVEN BY TOP-LINE GROWTH, PRODUCT MIX AND COST CONTROL Symrise Group Scent & Care in €m in €m 20.5% 22.7% 21.6% 22.5% 151.2 167.6 20.7% 9M 2013 9M 2014 Flavor & Nutrition 290.2 330.9 343.8 in €m 20.6% 22.2% 9M 2013 9M 2014 9M 2014 20.9% normalized * 139.0 163.
Slide 21: Strong Balance Sheet Maintained with Equity Ratio of 38%
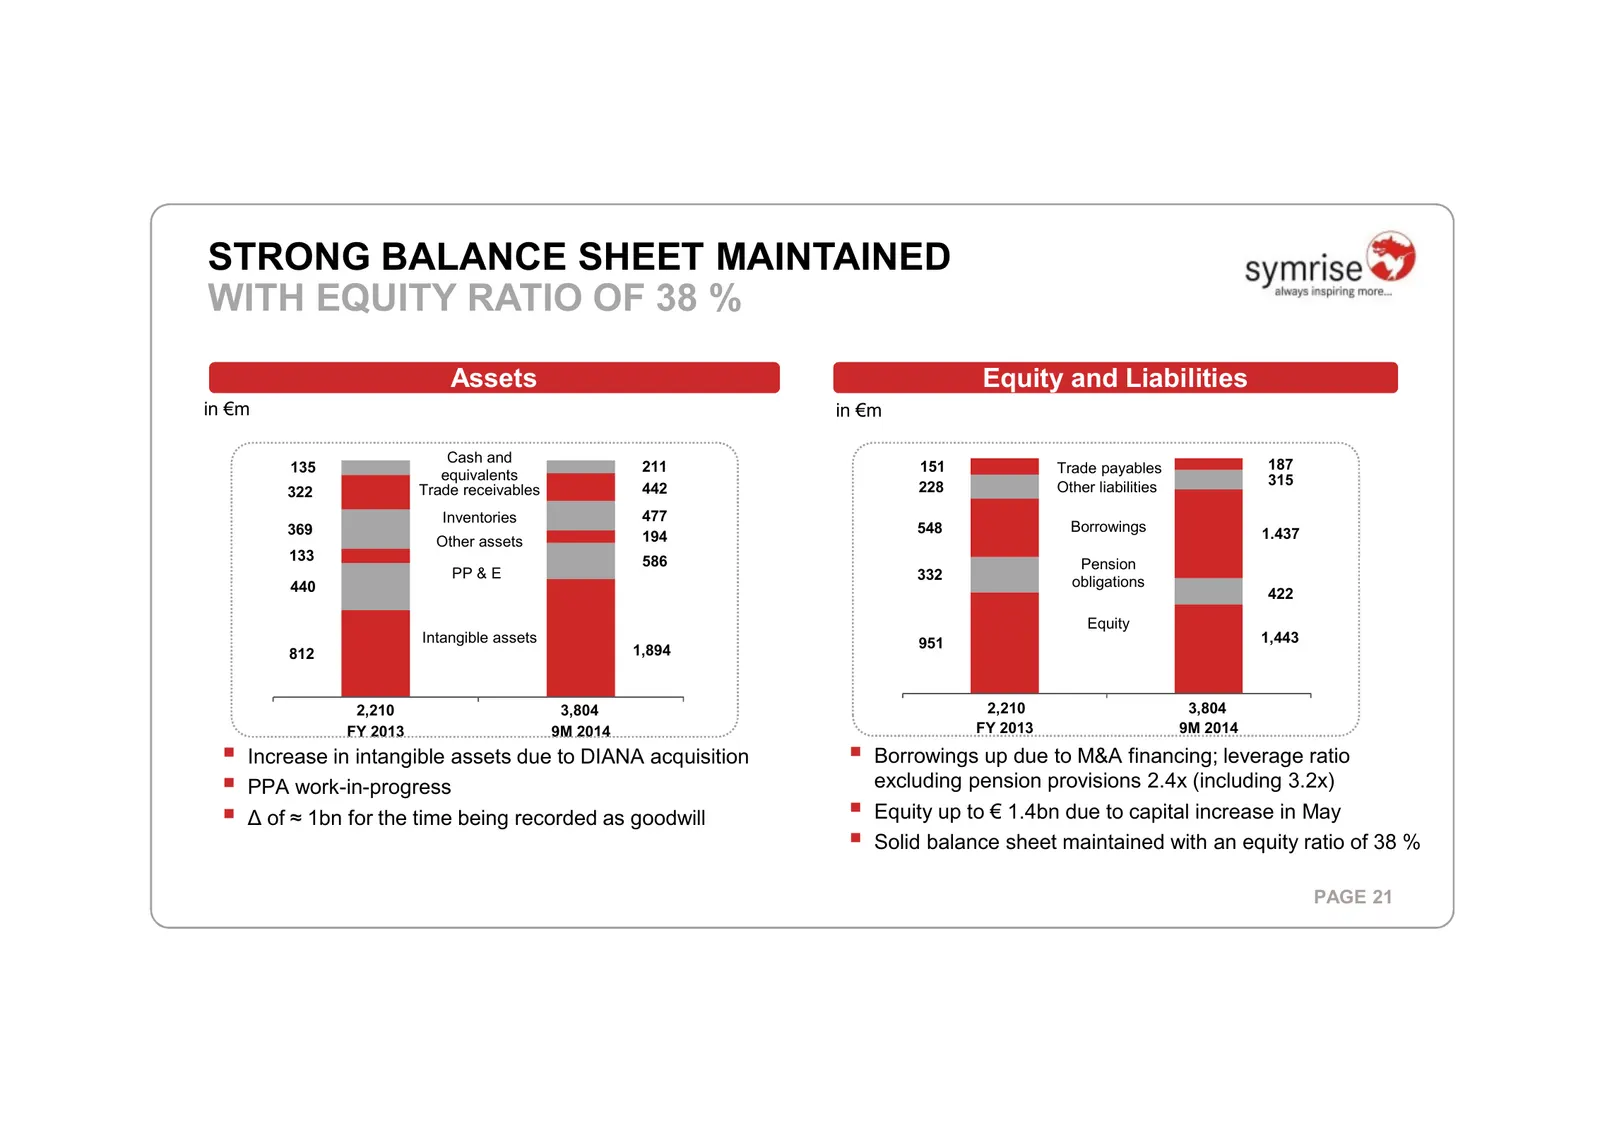
STRONG BALANCE SHEET MAINTAINED WITH EQUITY RATIO OF 38 % Assets Equity and Liabilities in €m in €m Cash and 187 135 211 151 Trade payables equivalents 315 322 Trade receivables 442 228 Other liabilities Inventories 477 369 548 Borrowings 1.437 Other assets 194 133 586 Pension PP & E 332 440 obligat
Slide 22: Table of Contents
SYMRISE TABLE OF CONTENTS INTRODUCTION STRATEGY FINANCIALS OUTLOOK PAGE 22
Slide 23: Outlook: Short Term and Long Term
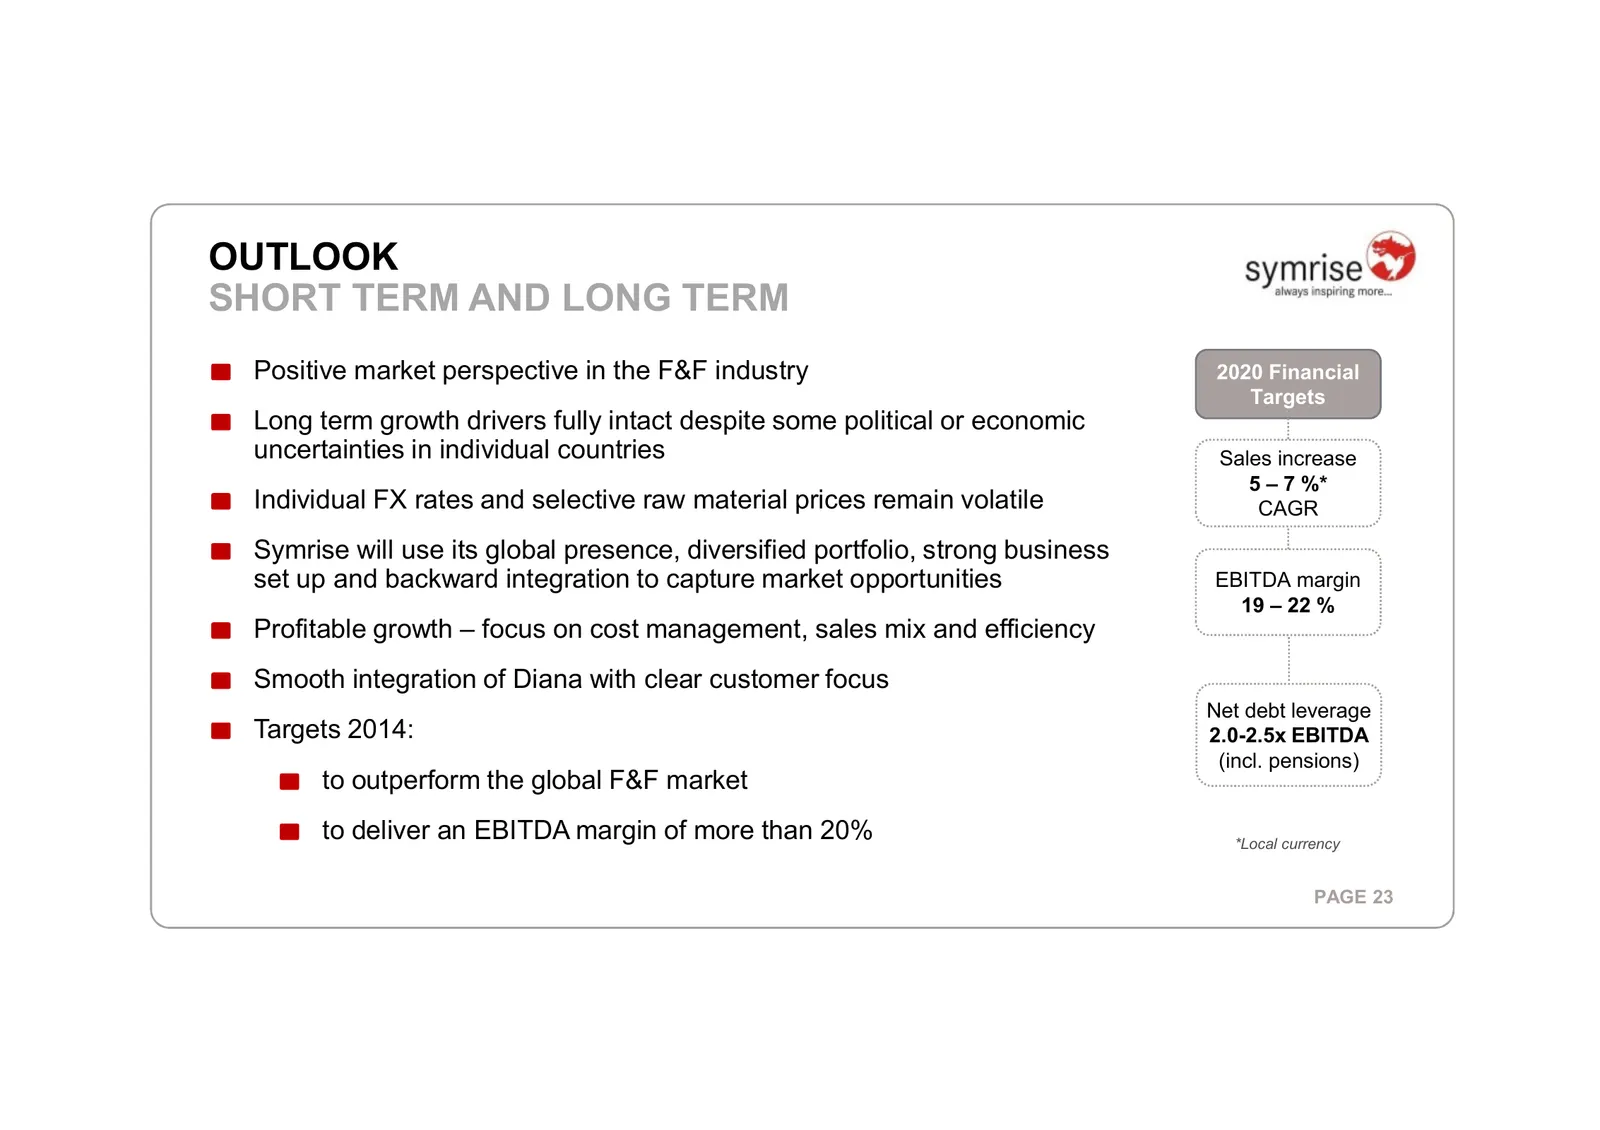
OUTLOOK SHORT TERM AND LONG TERM Positive market perspective in the F&F industry 2020 Financial Targets Long term growth drivers fully intact despite some political or economic uncertainties in individual countries Sales increase 5 – 7 %* Individual FX rates and selective raw material prices remain
Slide 24: Symrise Investor Relations
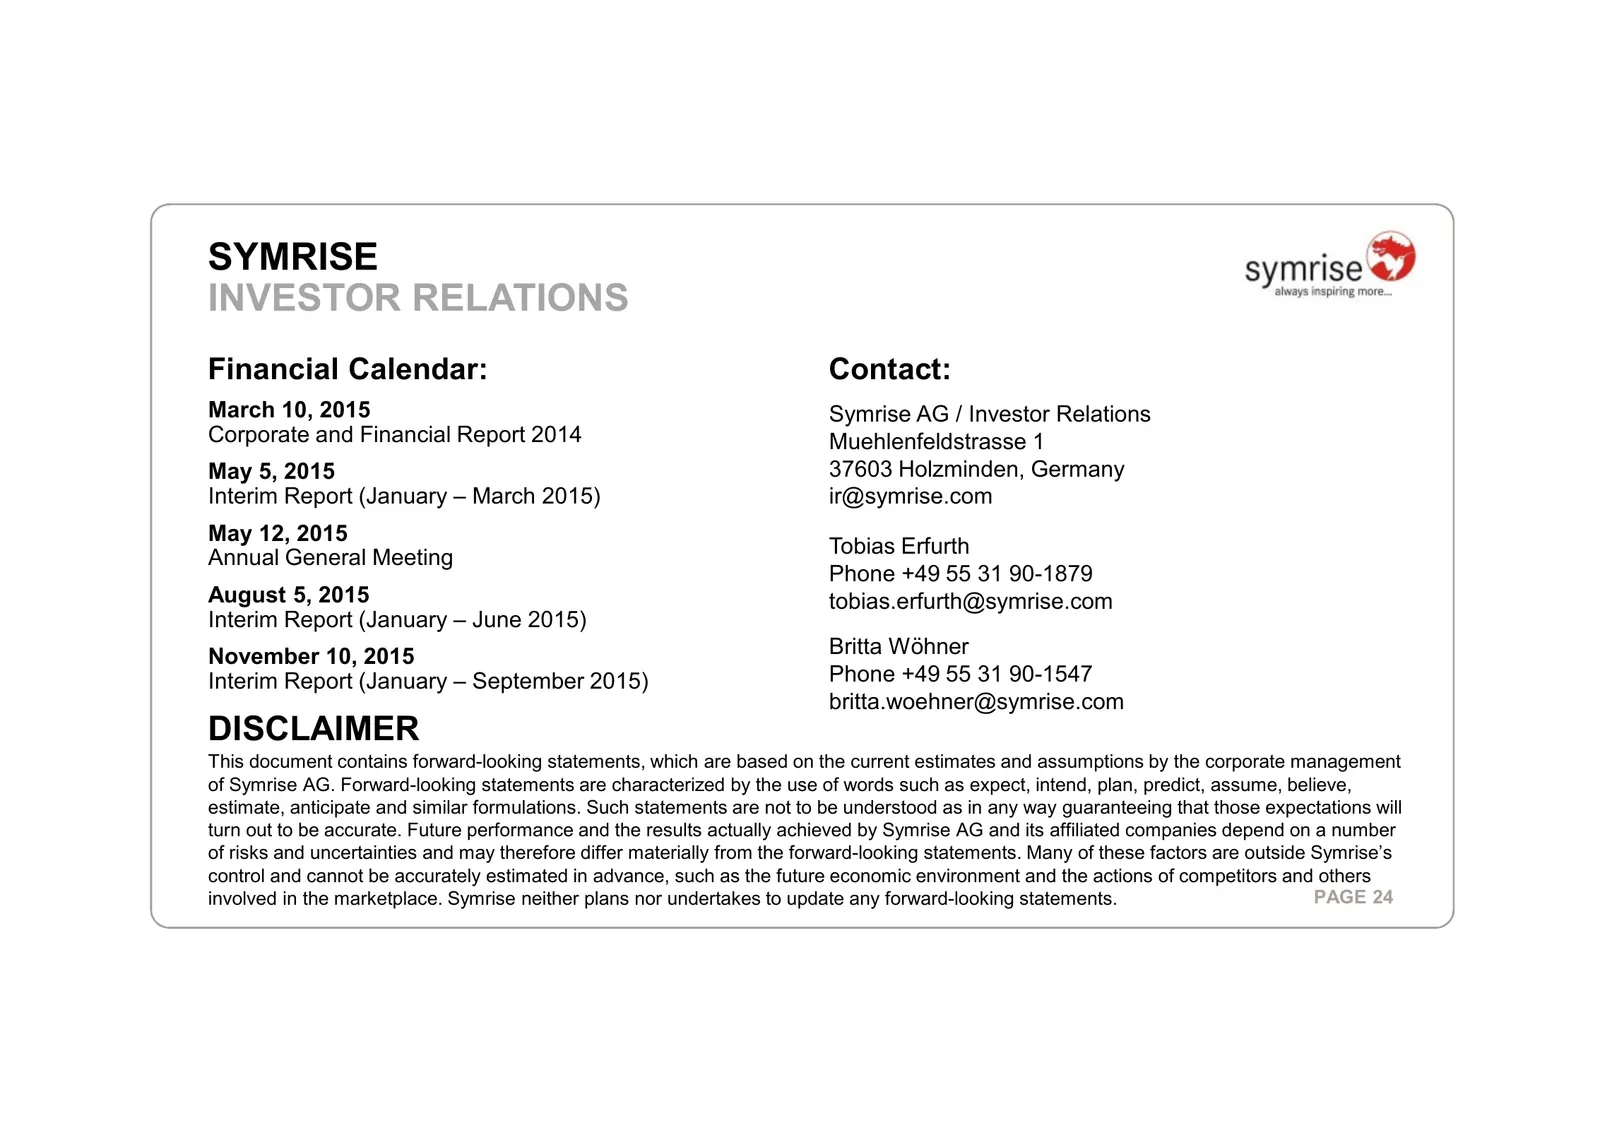
SYMRISE INVESTOR RELATIONS Financial Calendar: Contact: March 10, 2015 Symrise AG / Investor Relations Corporate and Financial Report 2014 Muehlenfeldstrasse 1 May 5, 2015 37603 Holzminden, Germany Interim Report (January – March 2015) ir@symrise.com May 12, 2015 Tobias Erfurth Annual General Meetin
Source: Internet Archive copy of symrise.com
More decks from Symrise AG
 Q3 2026 Earnings Presentation22 slides · Oct 28, 2026
 Investor Presentation (October 2026)39 slides · October 2026
 H1 2026 Earnings Presentation25 slides · Jul 30, 2026
 Q2 2026 Earnings Presentation29 slides · Jul 30, 2026
 Shareholder Meeting (May 2026)19 slides · May 6, 2026
 Q1 2026 Earnings Presentation19 slides · Apr 29, 2026