Holly Energy Partners LP — Investor Presentation (January 2018)
17 slides from Holly Energy Partners LP's investor presentation, Jan 9, 2018
Slide 1: Investor Presentation January 2018
INVESTOR PRESENTATION JANUARY 2018 Dark Blue: 24,49,116 Title Blue: 23,55,94 Orange: 230,175,10 9 Grey: 127,127,12 7 Light Blue: 114,164,18 3 Brown: 148,126,10 3 Blue Grey: 53,66,82 Light Blue: 91,152,197 Green: 101,164,49
Slide 2: Safe Harbor Disclosure Statement
Holly Energy Partners (NYSE: HEP) 2 Safe Harbor Disclosure Statement Statements made during the course of this presentation that are not historical facts are “forward-looking statements” within the meaning of the U.S. Private Securities Litigation Reform Act of 1995. Forward-looking statements are i
Slide 3: Holly Energy Partners
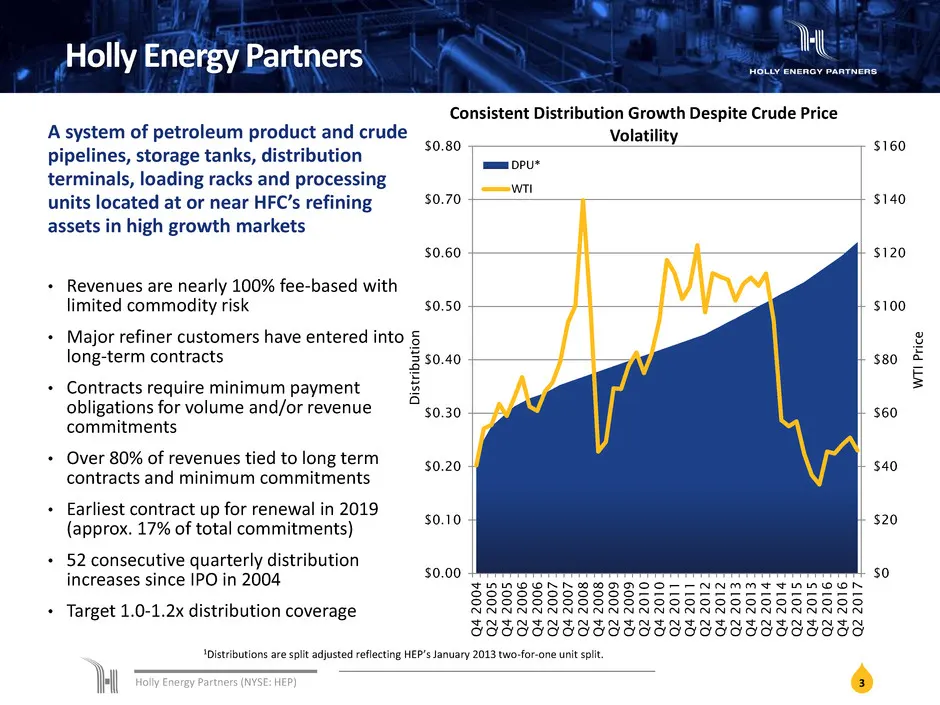
Holly Energy Partners (NYSE: HEP) 3 Holly Energy Partners A system of petroleum product and crude pipelines, storage tanks, distribution terminals, loading racks and processing units located at or near HFC’s refining assets in high growth markets • Revenues are nearly 100% fee-based with limited com
Slide 4: HollyFrontier and Holly Energy Partners Footprint
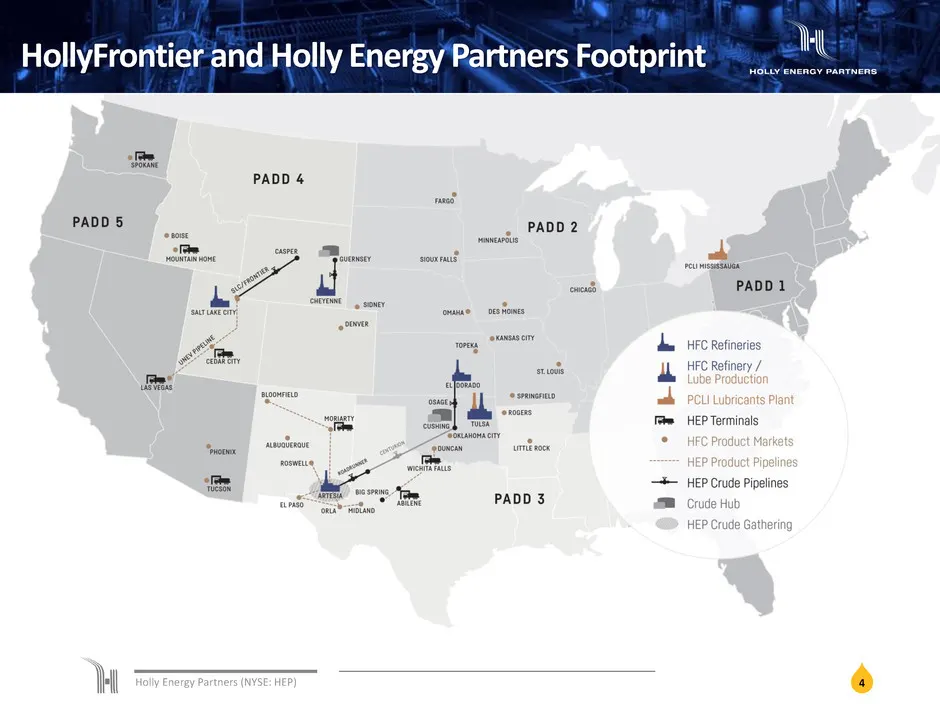
Holly Energy Partners (NYSE: HEP) 4 HollyFrontier and Holly Energy Partners Footprint
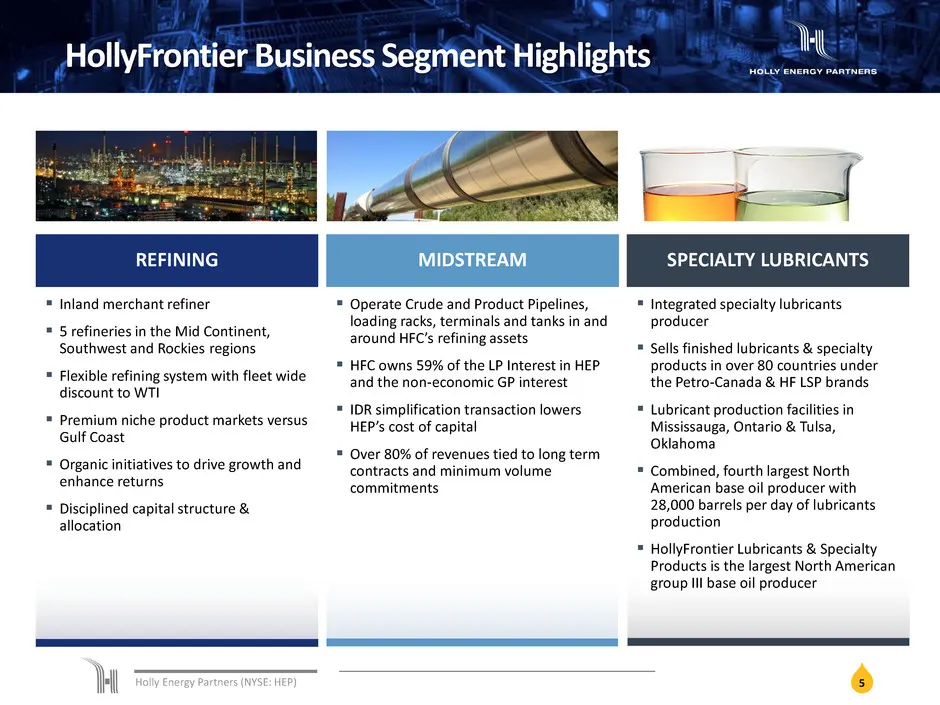
Slide 5: HollyFrontier Business Segment Highlights
Holly Energy Partners (NYSE: HEP) 5 HollyFrontier Business Segment Highlights REFINING MIDSTREAM SPECIALTY LUBRICANTS Inland merchant refiner 5 refineries in the Mid Continent, Southwest and Rockies regions Flexible refining system with fleet wide discount to WTI Premium niche product market
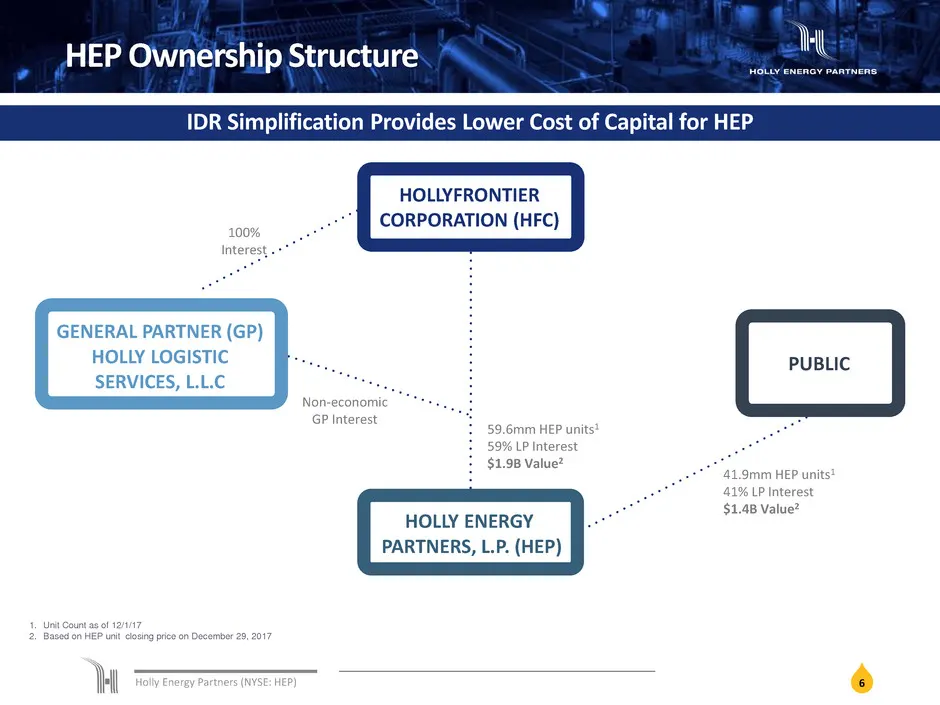
Slide 6: HEP Ownership Structure
Holly Energy Partners (NYSE: HEP) 1. Unit Count as of 12/1/17 2. Based on HEP unit closing price on December 29, 2017 100% Interest 41.9mm HEP units1 41% LP Interest $1.4B Value2 59.6mm HEP units1 59% LP Interest $1.9B Value2 HOLLYFRONTIER CORPORATION (HFC) GENERAL PARTNER (GP) HOLLY LOGISTIC SERVIC
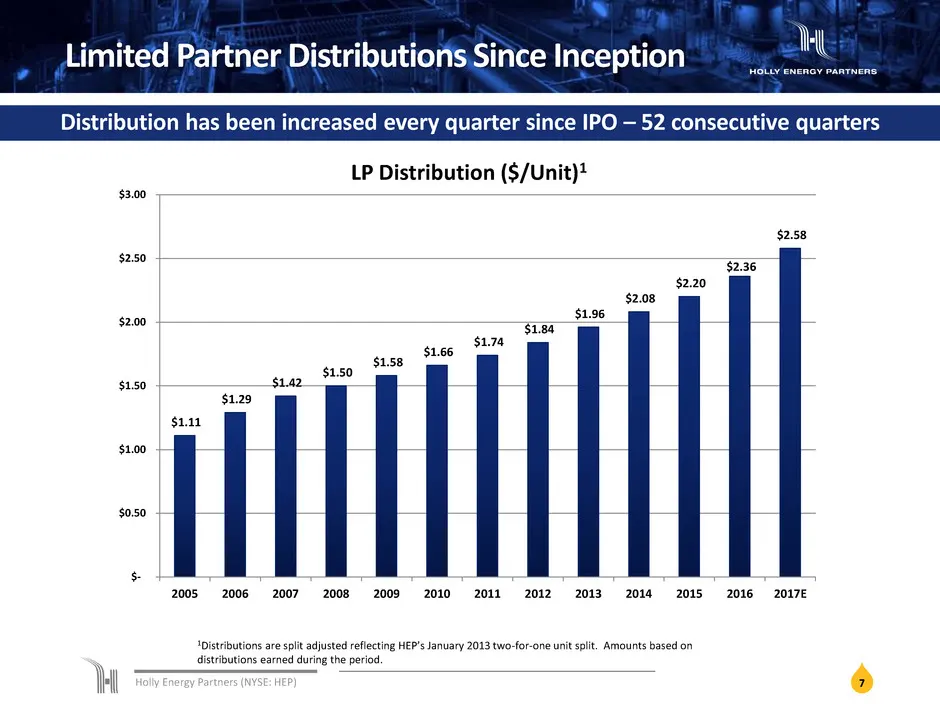
Slide 7: Limited Partner Distributions Since Inception
Holly Energy Partners (NYSE: HEP) 7 Limited Partner Distributions Since Inception Distribution has been increased every quarter since IPO – 52 consecutive quarters $1.11 $1.29 $1.42 $1.50 $1.58 $1.66 $1.74 $1.84 $1.96 $2.08 $2.20 $2.36 $2.58 $- $0.50 $1.00 $1.50 $2.00 $2.50 $3.00 2005 2006 2007 2008
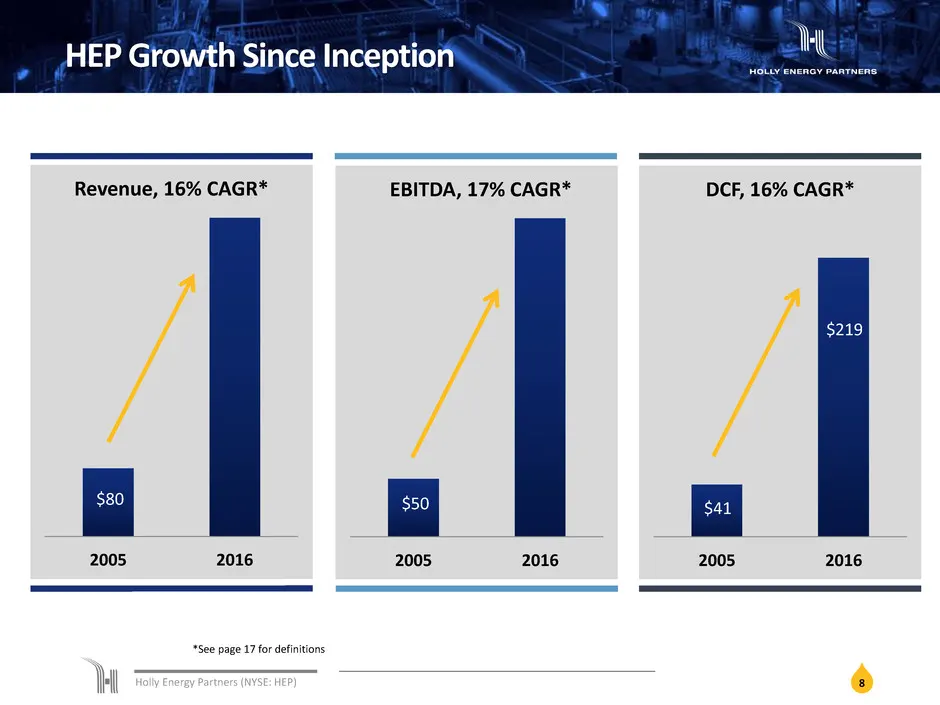
Slide 8: HEP Growth Since Inception
Holly Energy Partners (NYSE: HEP) 8 HEP Growth Since Inception $80 2005 2016 Revenue, 16% CAGR* $50 2005 2016 EBITDA, 17% CAGR* $41 $219 2005 2016 DCF, 16% CAGR* *See page 17 for definitions
Slide 9: HEP Historical Growth
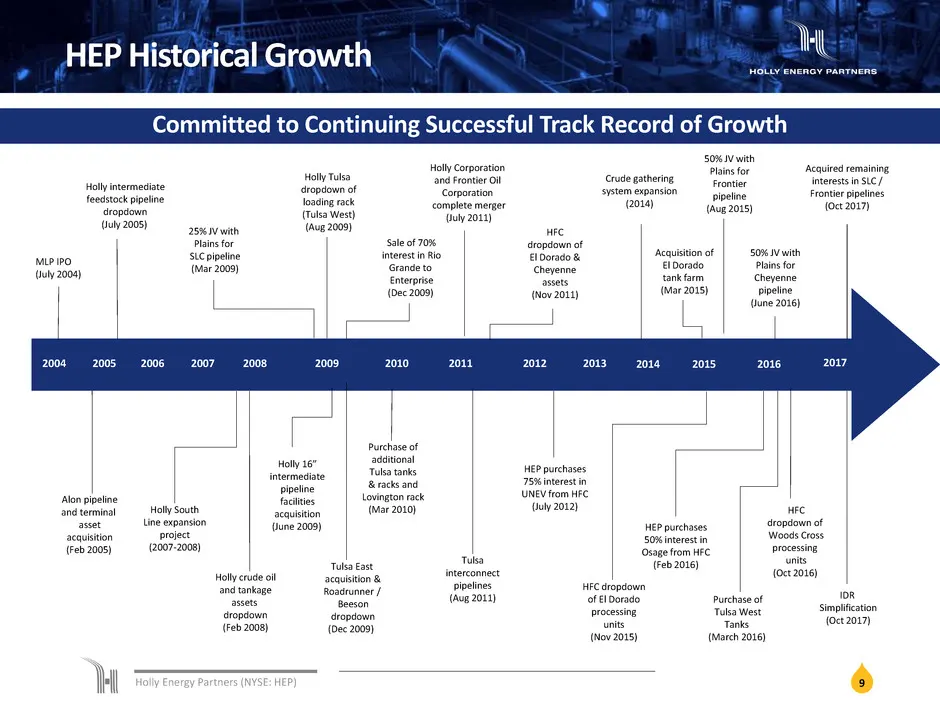
Holly Energy Partners (NYSE: HEP) 9 HEP Historical Growth 2004 2005 2006 2007 2008 2009 MLP IPO (July 2004) Holly intermediate feedstock pipeline dropdown (July 2005) 25% JV with Plains for SLC pipeline (Mar 2009) Holly Tulsa dropdown of loading rack (Tulsa West) (Aug 2009) Holly crude oil and tanka
Slide 10: HEP Avenues for Growth
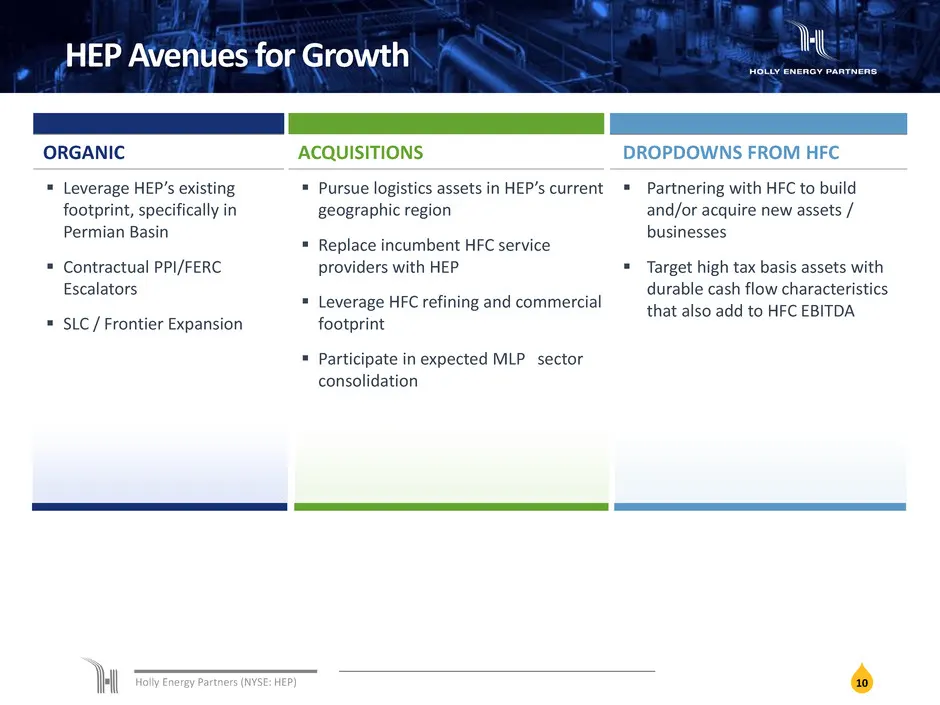
Holly Energy Partners (NYSE: HEP) 10 HEP Avenues for Growth ORGANIC ACQUISITIONS DROPDOWNS FROM HFC Leverage HEP’s existing footprint, specifically in Permian Basin Contractual PPI/FERC Escalators SLC / Frontier Expansion Pursue logistics assets in HEP’s current geographic region Replace i
Slide 11: Organic Growth
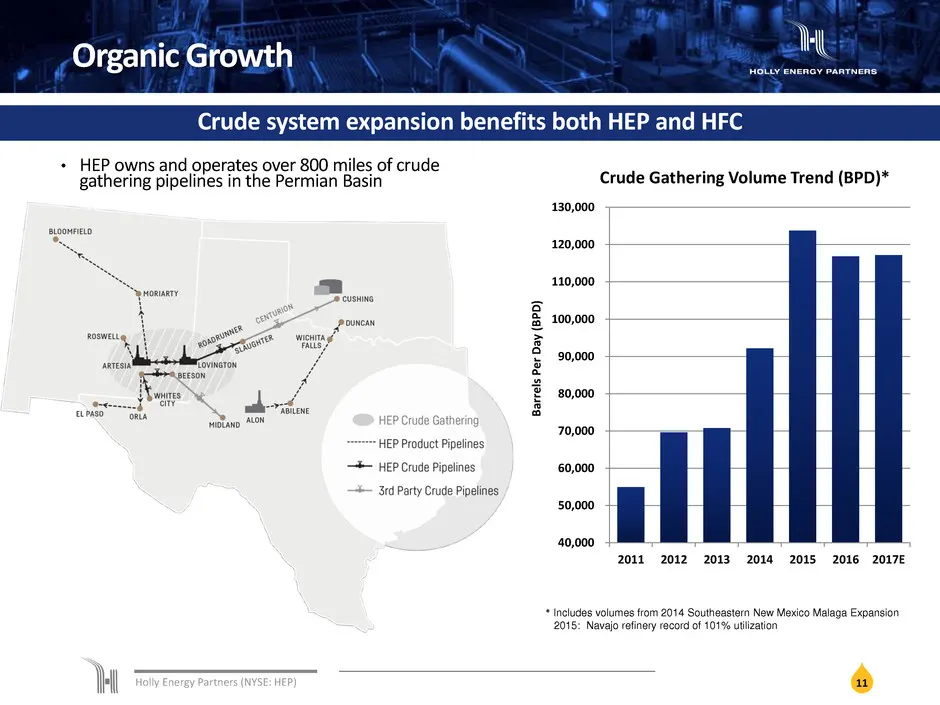
Holly Energy Partners (NYSE: HEP) 11 Organic Growth * Includes volumes from 2014 Southeastern New Mexico Malaga Expansion 2015: Navajo refinery record of 101% utilization Crude system expansion benefits both HEP and HFC • HEP owns and operates over 800 miles of crude gathering pipelines in the Permi
Slide 12: Acquisition of Interests in Frontier and SLC Pipelines
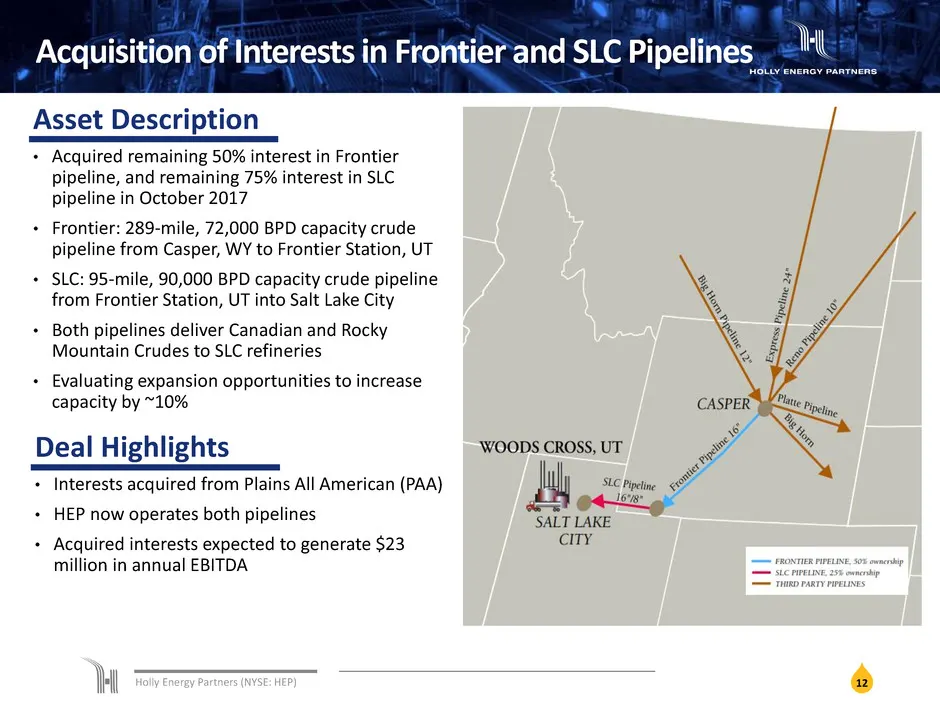
Holly Energy Partners (NYSE: HEP) 12 Asset Description • Acquired remaining 50% interest in Frontier pipeline, and remaining 75% interest in SLC pipeline in October 2017 • Frontier: 289-mile, 72,000 BPD capacity crude pipeline from Casper, WY to Frontier Station, UT • SLC: 95-mile, 90,000 BPD capaci
Slide 13: Dropdowns From HFC
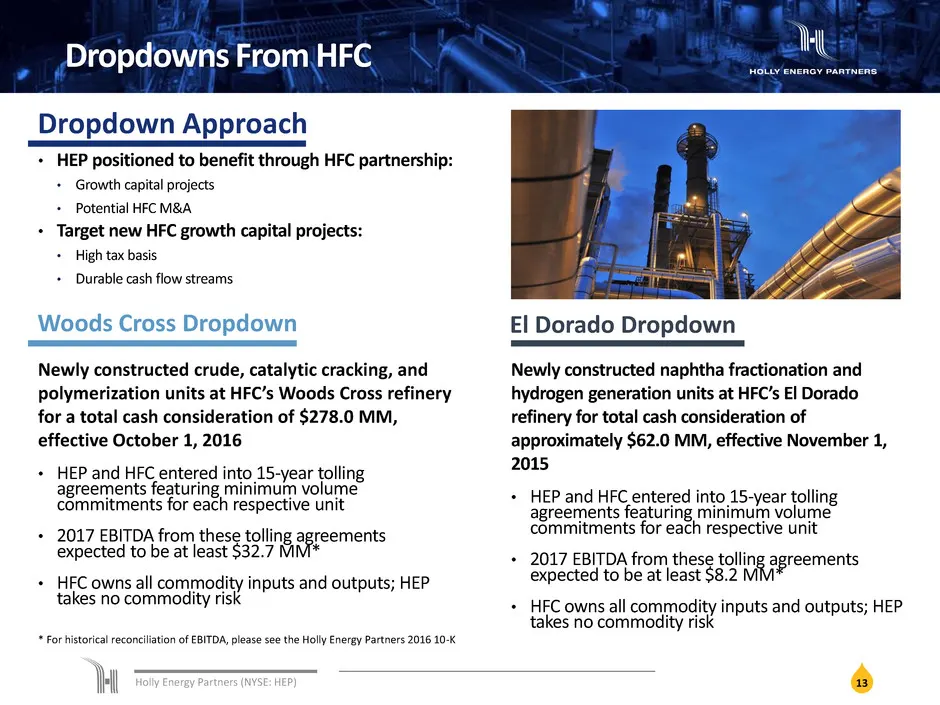
Holly Energy Partners (NYSE: HEP) 13 Dropdowns From HFC Newly constructed crude, catalytic cracking, and polymerization units at HFC’s Woods Cross refinery for a total cash consideration of $278.0 MM, effective October 1, 2016 • HEP and HFC entered into 15-year tolling agreements featuring minimum v
Slide 14: HEP Capital Budget
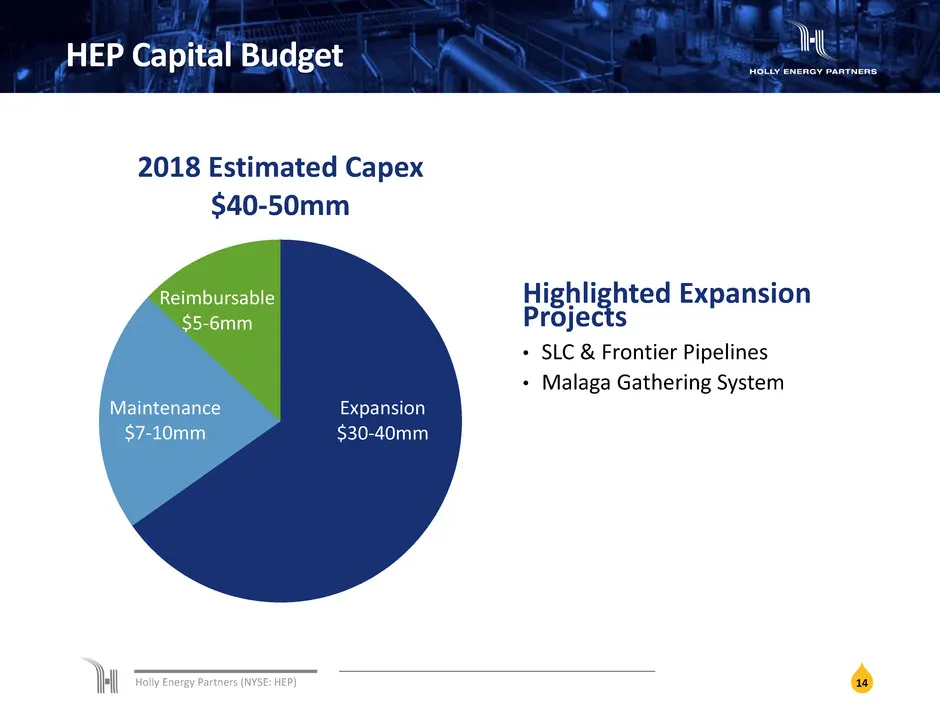
Holly Energy Partners (NYSE: HEP) HEP Capital Budget 2018 Estimated Capex $40-50mm Reimbursable $5-6mm Maintenance $7-10mm Expansion $30-40mm Highlighted Expansion Projects • SLC & Frontier Pipelines • Malaga Gathering System 14
Slide 15: HEP Financial Strength
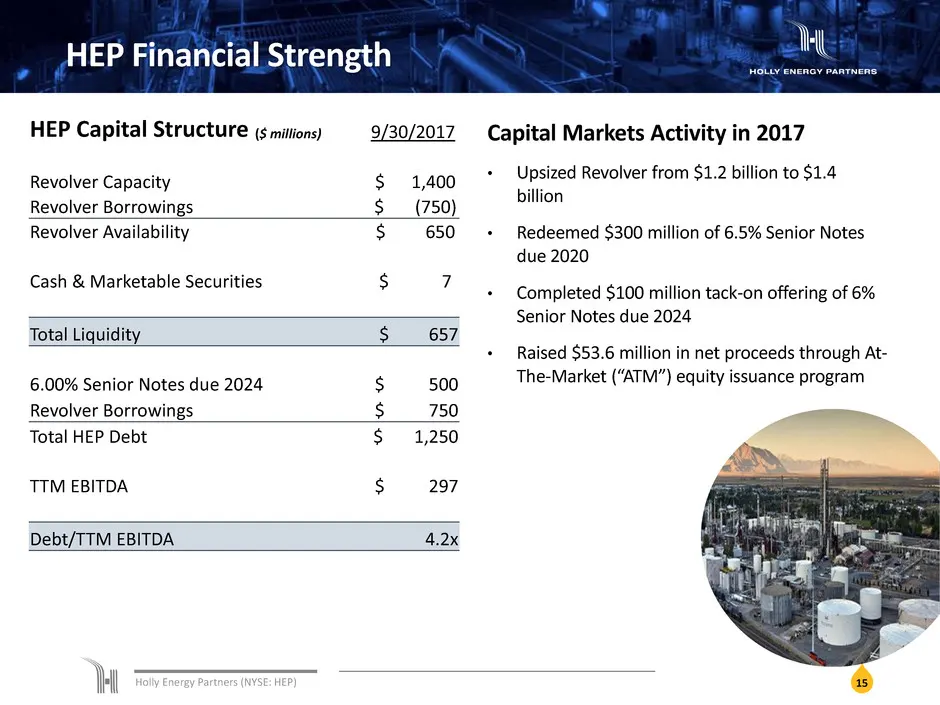
Holly Energy Partners (NYSE: HEP) HEP Financial Strength Reimbursable $15-20mm Maintenance $10-15mm Expansion $40-50mm Capital Markets Activity in 2017 • Upsized Revolver from $1.2 billion to $1.4 billion • Redeemed $300 million of 6.5% Senior Notes due 2020 • Completed $100 million tack-on offering
Slide 16: Appendix - HEP Assets
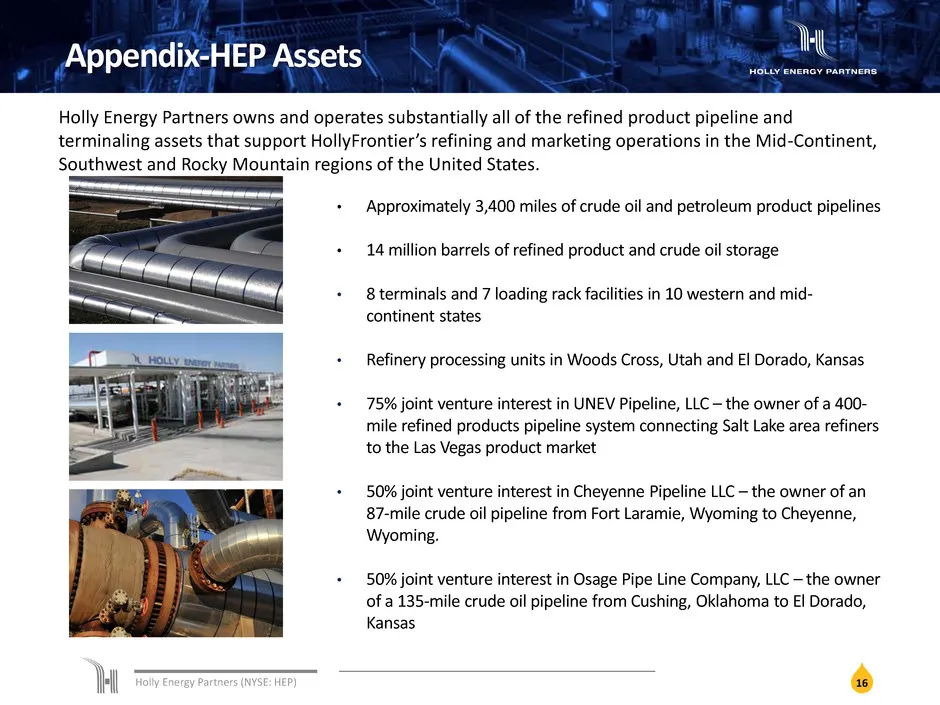
Holly Energy Partners (NYSE: HEP) 16 Appendix-HEP Assets Holly Energy Partners owns and operates substantially all of the refined product pipeline and terminaling assets that support HollyFrontier’s refining and marketing operations in the Mid-Continent, Southwest and Rocky Mountain regions of the U
Slide 17: Definitions
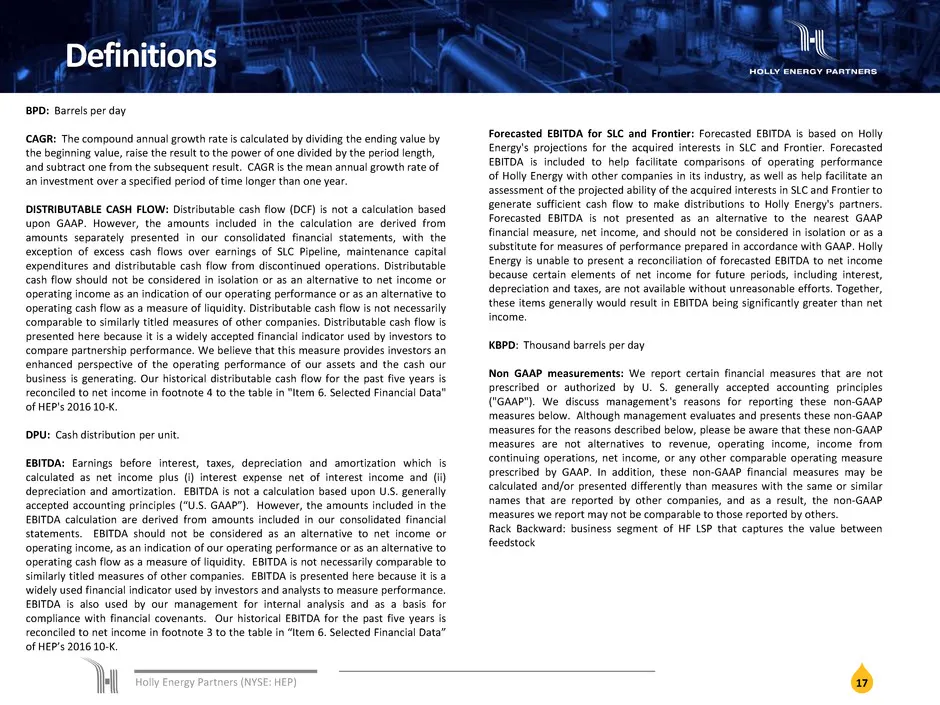
Holly Energy Partners (NYSE: HEP) 17 Definitions BPD: Barrels per day CAGR: The compound annual growth rate is calculated by dividing the ending value by the beginning value, raise the result to the power of one divided by the period length, and subtract one from the subsequent result. CAGR is the m
Source: SEC EDGAR · 8-K filed Jan 9, 2018
More decks from Holly Energy Partners LP
 Investor Presentation (March 2023)20 slides · Mar 2, 2023
 Investor Presentation (August 2022)24 slides · Aug 16, 2022
 Investor Presentation (May 2022)23 slides · May 17, 2022
 Investor Presentation (March 2022)12 slides · Mar 22, 2022
 Investor Presentation (March 2022)18 slides · Mar 1, 2022
 Investor Presentation (December 2021)18 slides · Dec 9, 2021