Allakos — Investor Day (February 2022)
81 slides from Allakos's investor day presentation, Feb 15, 2022

Slide 1: Corporate Update February 15, 2022
Corporate Update February 15, 2022 Exhibit 99.1
Slide 2: Disclaimer
Disclaimer This presentation contains forward-looking statements. All statements other than statements of historical fact contained in this presentation, including statements regarding the financial position of Allakos Inc. (“Allakos,” the “Company,” “we” or “our”); the generation of future value; b
Slide 3: Allakos Investor Day Agenda
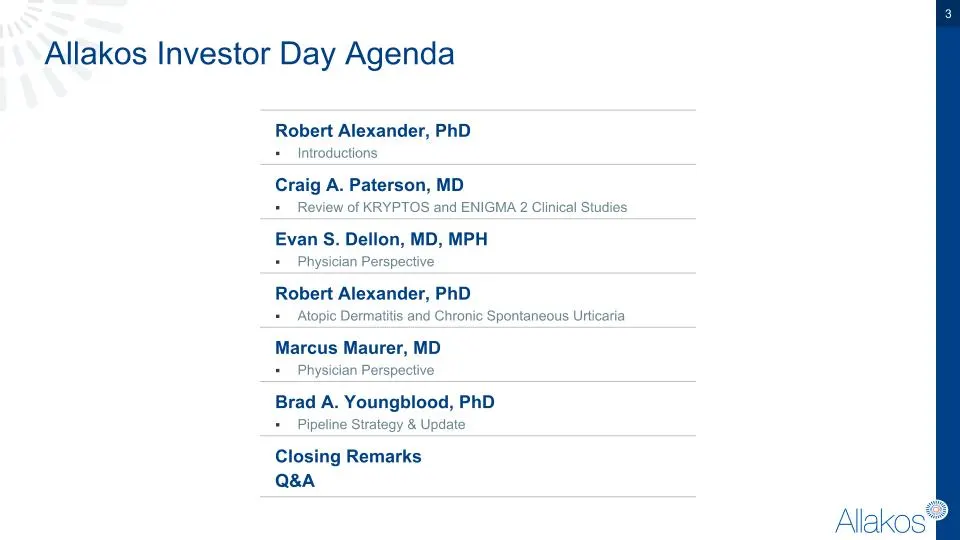
Robert Alexander, PhD Introductions Craig A. Paterson, MD Review of KRYPTOS and ENIGMA 2 Clinical Studies Evan S. Dellon, MD, MPH Physician Perspective Robert Alexander, PhD Atopic Dermatitis and Chronic Spontaneous Urticaria Marcus Maurer, MD Physician Perspective Brad A. Youngblood, PhD Pipeline S
Slide 4: Review of KRYPTOS (EoE) and ENIGMA2 (EG/EoD) Clinical Studies
Review of KRYPTOS (EoE) and ENIGMA2 (EG/EoD) Clinical Studies Craig A. Paterson, MD CMO – Allakos Inc.
Slide 5: KRYPTOS Phase 2/3 EoE Study Design
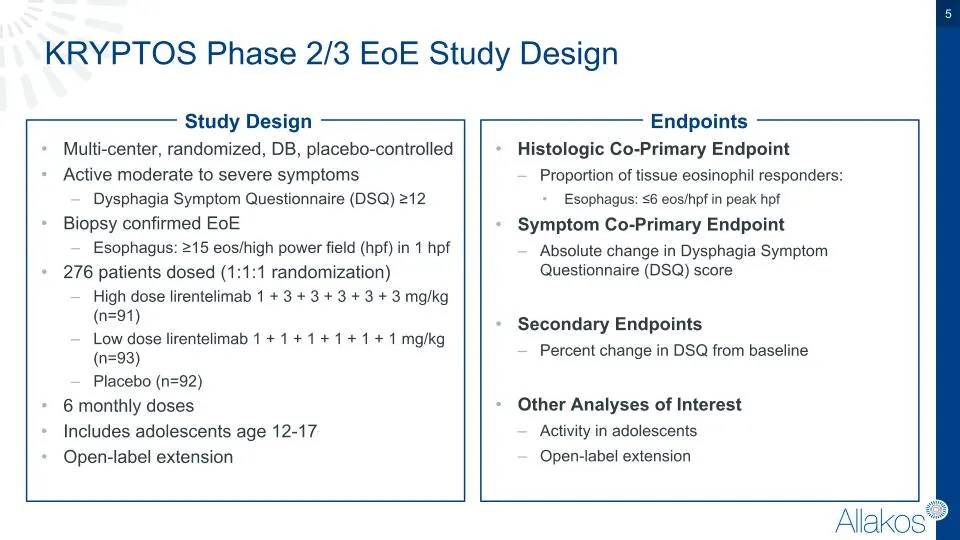
KRYPTOS Phase 2/3 EoE Study Design Multi-center, randomized, DB, placebo-controlled Active moderate to severe symptoms Dysphagia Symptom Questionnaire (DSQ) ≥12 Biopsy confirmed EoE Esophagus: ≥15 eos/high power field (hpf) in 1 hpf 276 patients dosed (1:1:1 randomization) High dose lirentelimab 1 +
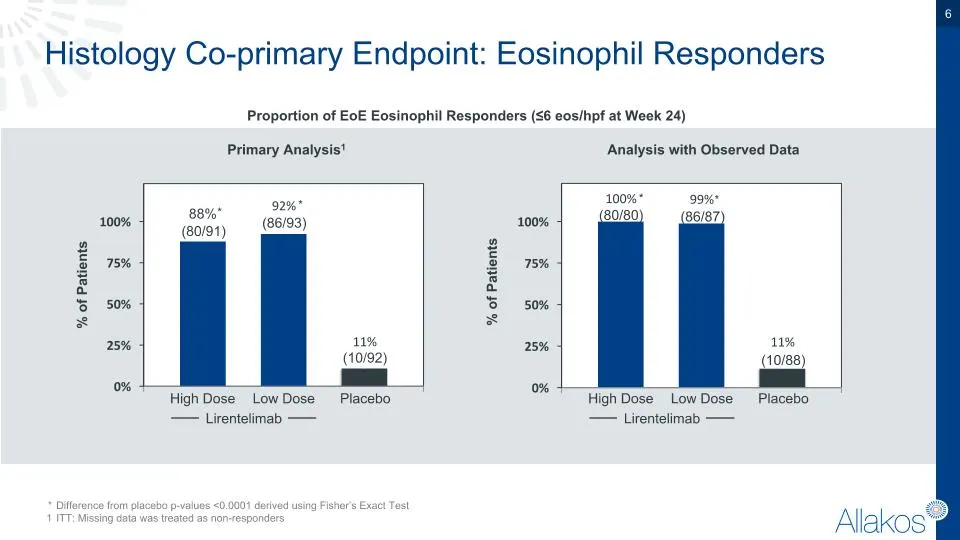
Slide 6: Histology Co-primary Endpoint: Eosinophil Responders
Histology Co-primary Endpoint: Eosinophil Responders * Difference from placebo p-values <0.0001 derived using Fisher’s Exact Test 1 ITT: Missing data was treated as non-responders High Dose * (80/91) (86/93) Low Dose Lirentelimab * Placebo (10/92) * (80/80) (86/87) * (10/88) Proportion of EoE Eosino
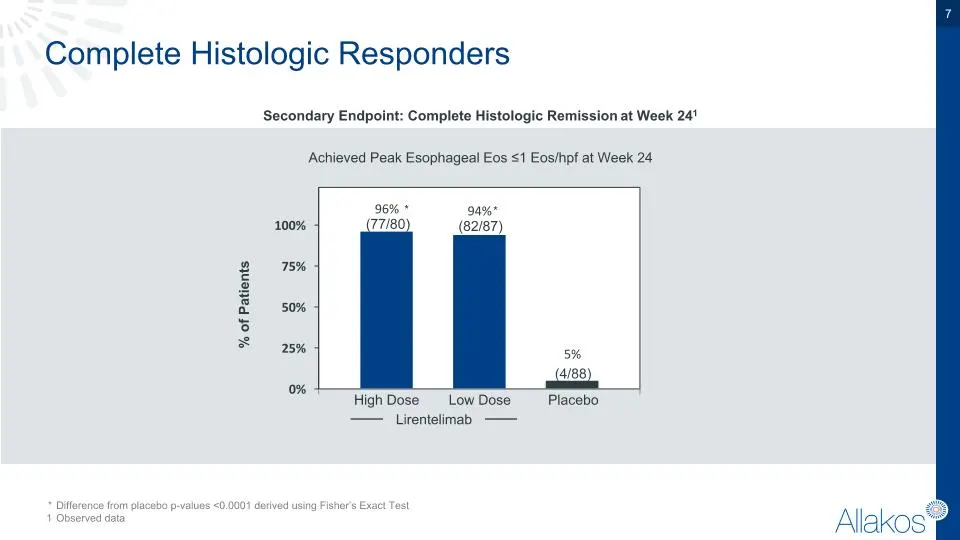
Slide 7: Complete Histologic Responders
Complete Histologic Responders * Difference from placebo p-values <0.0001 derived using Fisher’s Exact Test 1 Observed data Secondary Endpoint: Complete Histologic Remission at Week 241 * (77/80) (82/87) * (4/88) High Dose Low Dose Placebo Lirentelimab % of Patients Achieved Peak Esophageal Eos ≤1 E
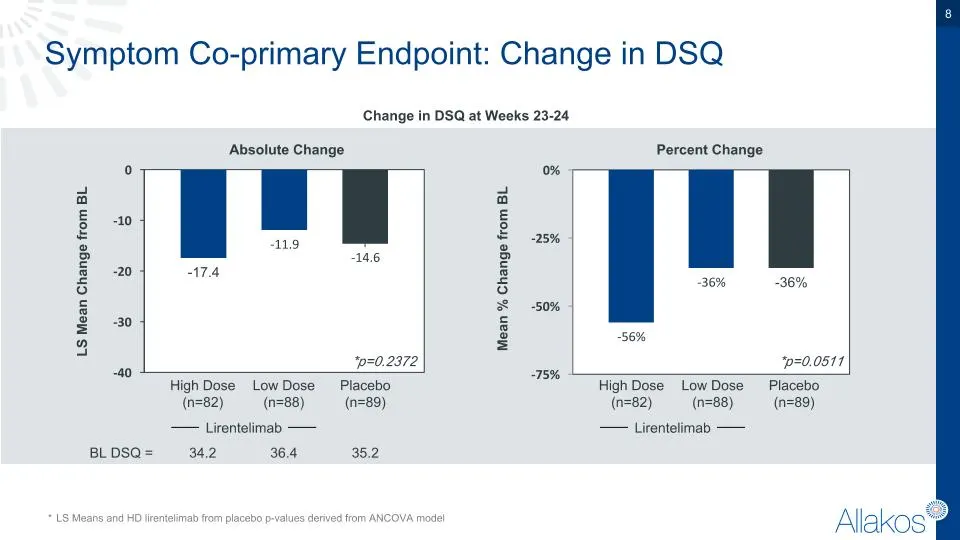
Slide 8: Symptom Co-primary Endpoint: Change in DSQ
Symptom Co-primary Endpoint: Change in DSQ * LS Means and HD lirentelimab from placebo p-values derived from ANCOVA model Absolute Change LS Mean Change from BL 35.2 34.2 36.4 BL DSQ = Change in DSQ at Weeks 23-24 Percent Change Mean % Change from BL High Dose (n=82) Low Dose (n=88) Placebo (n=89) H
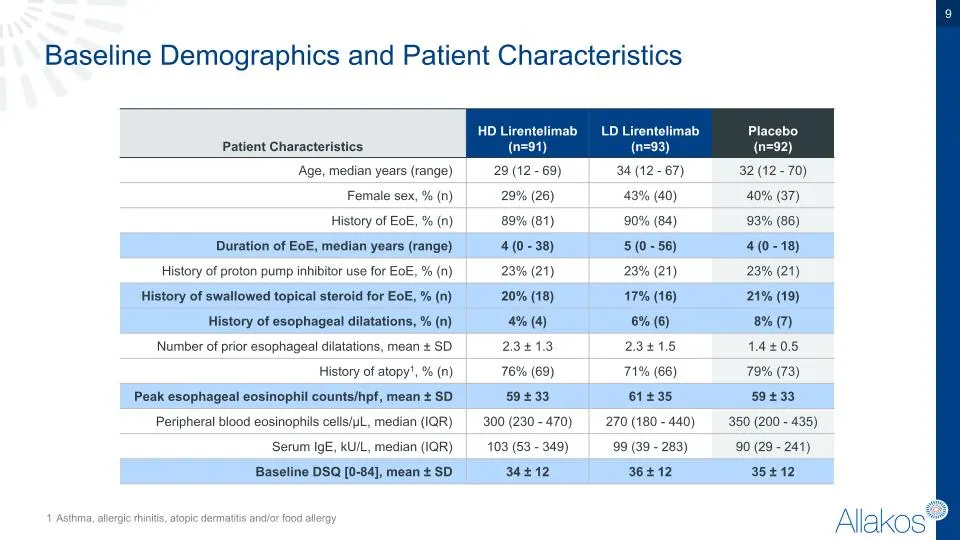
Slide 9: Baseline Demographics and Patient Characteristics
Baseline Demographics and Patient Characteristics 1 Asthma, allergic rhinitis, atopic dermatitis and/or food allergy Patient Characteristics HD Lirentelimab (n=91) LD Lirentelimab (n=93) Placebo (n=92) Age, median years (range) 29 (12 - 69) 34 (12 - 67) 32 (12 - 70) Female sex, % (n) 29% (26) 43% (4
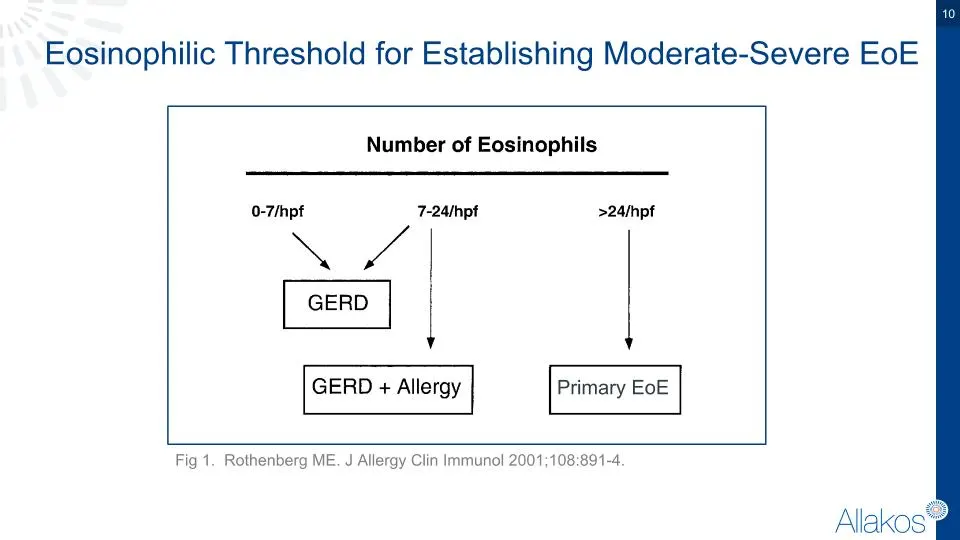
Slide 10: Eosinophilic Threshold for Establishing Moderate-Severe EoE
Eosinophilic Threshold for Establishing Moderate-Severe EoE Fig 1. Rothenberg ME. J Allergy Clin Immunol 2001;108:891-4. Primary EoE
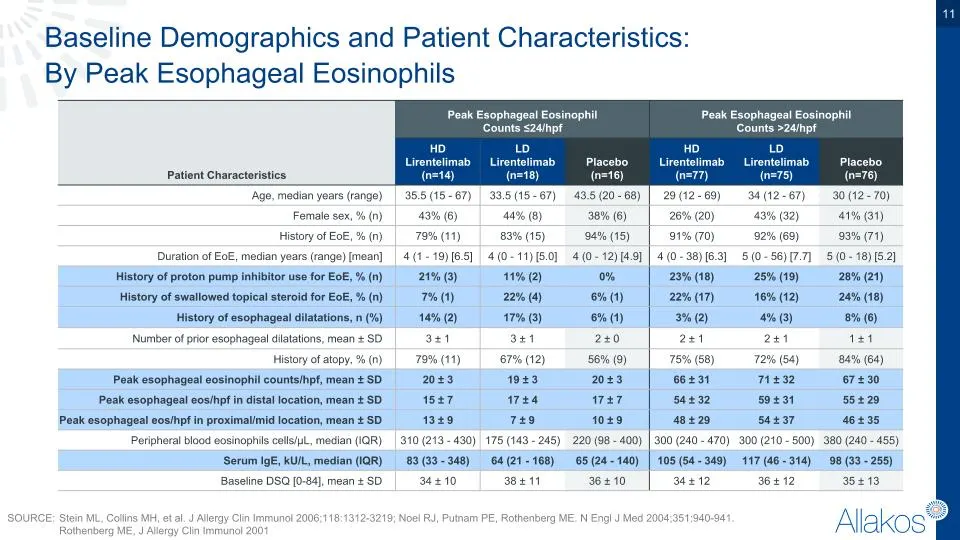
Slide 11: Baseline Demographics: By Peak Esophageal Eosinophils
Baseline Demographics and Patient Characteristics: By Peak Esophageal Eosinophils SOURCE: Stein ML, Collins MH, et al. J Allergy Clin Immunol 2006;118:1312-3219; Noel RJ, Putnam PE, Rothenberg ME. N Engl J Med 2004;351:940-941. Rothenberg ME, J Allergy Clin Immunol 2001 Patient Characteristics Peak
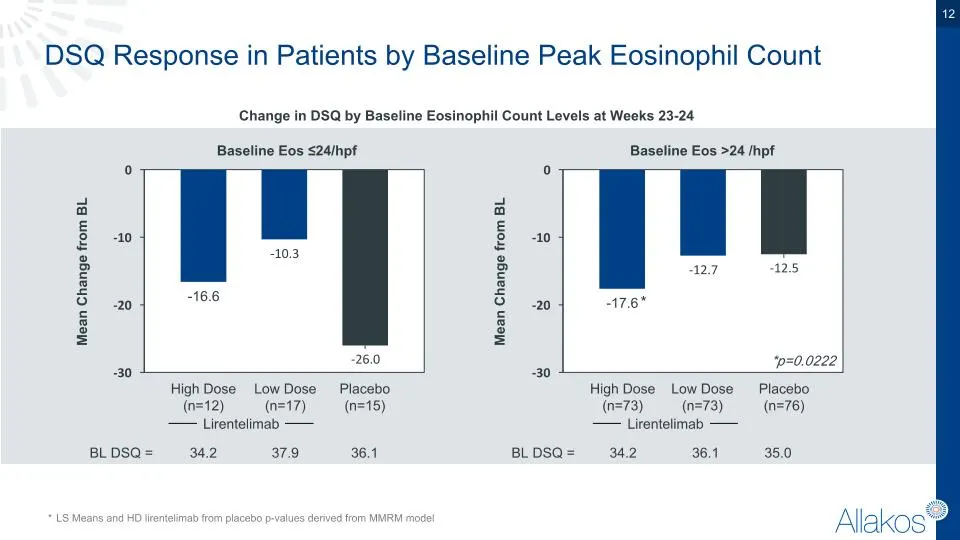
Slide 12: DSQ Response by Baseline Peak Eosinophil Count
DSQ Response in Patients by Baseline Peak Eosinophil Count Baseline Eos ≤24/hpf Mean Change from BL Lirentelimab 36.1 34.2 37.9 BL DSQ = * LS Means and HD lirentelimab from placebo p-values derived from MMRM model Baseline Eos >24 /hpf Lirentelimab 35.0 34.2 36.1 BL DSQ = * Change in DSQ by Baseline
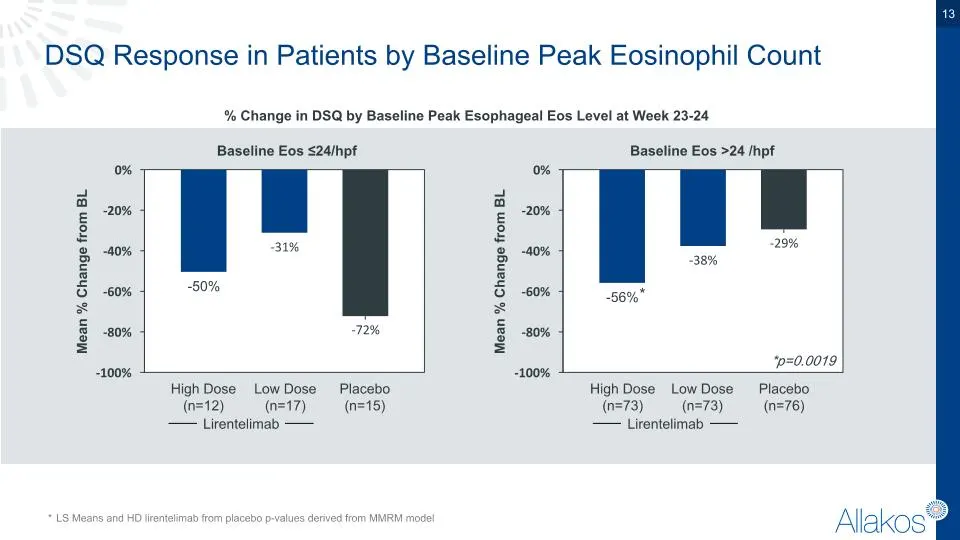
Slide 13: DSQ Response by Baseline Peak Eosinophil Count (Percent Change)
DSQ Response in Patients by Baseline Peak Eosinophil Count Baseline Eos >24 /hpf Baseline Eos ≤24/hpf Lirentelimab Lirentelimab * LS Means and HD lirentelimab from placebo p-values derived from MMRM model * Mean % Change from BL % Change in DSQ by Baseline Peak Esophageal Eos Level at Week 23-24 Pla
Slide 14: Study Results in Adolescents
Study Results in Adolescents Age 12 - 17 years
Slide 15: Baseline Demographics: Adolescents
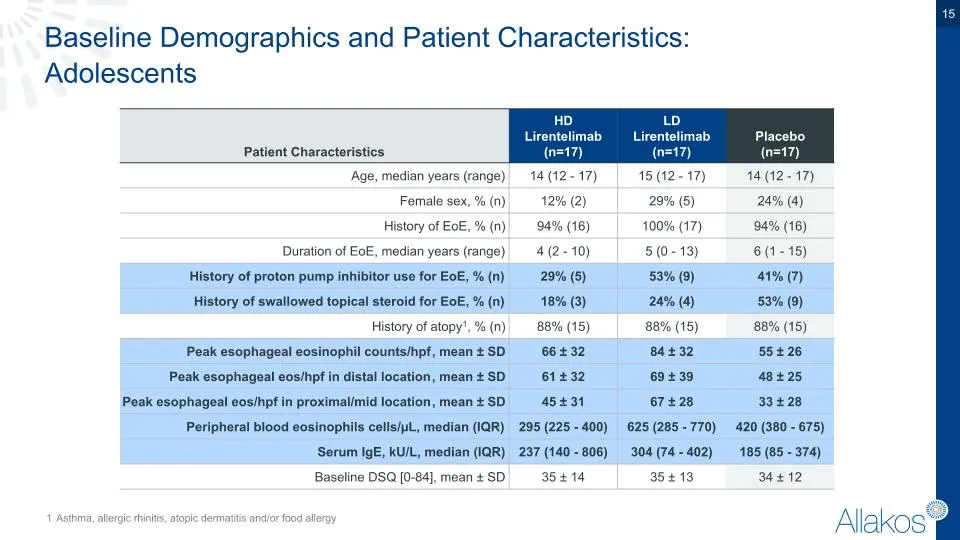
Baseline Demographics and Patient Characteristics: Adolescents 1 Asthma, allergic rhinitis, atopic dermatitis and/or food allergy Patient Characteristics HD Lirentelimab (n=17) LD Lirentelimab (n=17) Placebo (n=17) Age, median years (range) 14 (12 - 17) 15 (12 - 17) 14 (12 - 17) Female sex, % (n) 12
Slide 16: Histologic Response in Adolescents
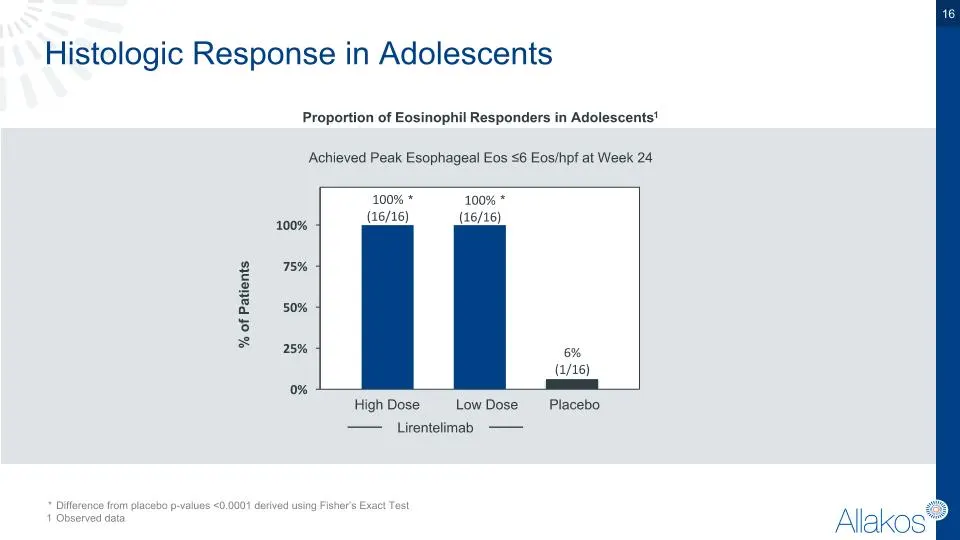
Histologic Response in Adolescents * Difference from placebo p-values <0.0001 derived using Fisher’s Exact Test 1 Observed data * * Lirentelimab Placebo High Dose Low Dose Proportion of Eosinophil Responders in Adolescents1 Achieved Peak Esophageal Eos ≤6 Eos/hpf at Week 24 % of Patients
Slide 17: DSQ Response in Adolescents
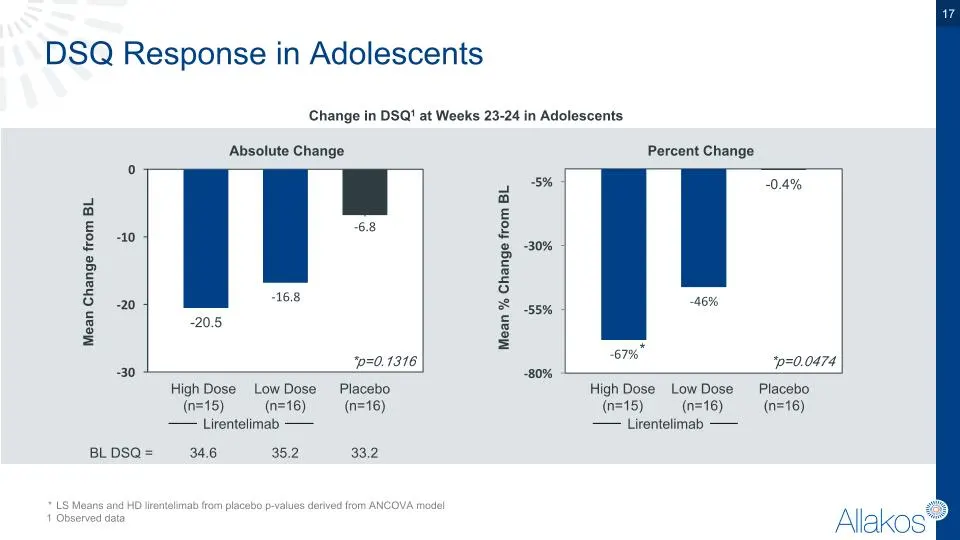
DSQ Response in Adolescents * LS Means and HD lirentelimab from placebo p-values derived from ANCOVA model 1 Observed data Mean % Change from BL Mean Change from BL Percent Change Absolute Change Change in DSQ1 at Weeks 23-24 in Adolescents *p=0.1316 *p=0.0474 Lirentelimab 33.2 34.6 35.2 BL DSQ = Pl

Slide 18: Safety Summary
Safety Summary
Slide 19: KRYPTOS Safety Summary
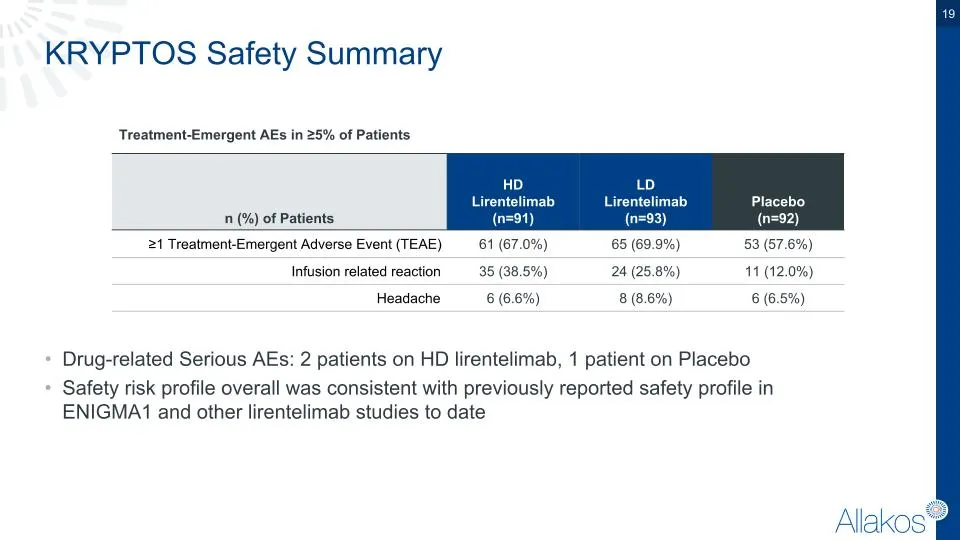
KRYPTOS Safety Summary n (%) of Patients HD Lirentelimab (n=91) LD Lirentelimab (n=93) Placebo (n=92) ≥1 Treatment-Emergent Adverse Event (TEAE) 61 (67.0%) 65 (69.9%) 53 (57.6%) Infusion related reaction 35 (38.5%) 24 (25.8%) 11 (12.0%) Headache 6 (6.6%) 8 (8.6%) 6 (6.5%) Drug-related Serious AEs: 2
Slide 20: Open-Label Extension
20 Open-Label Extension
Slide 21: Durability of Effect in Open-Label Extension
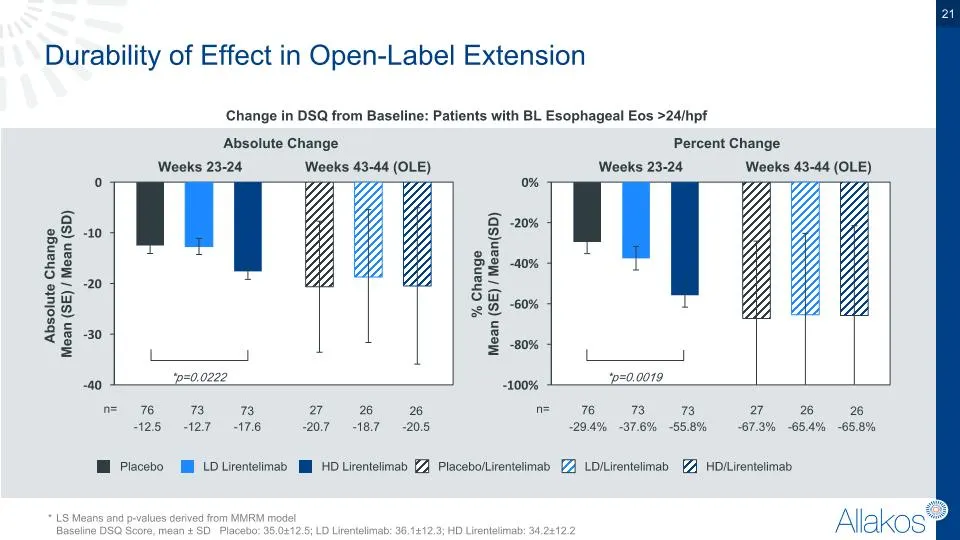
Durability of Effect in Open-Label Extension * LS Means and p-values derived from MMRM model Baseline DSQ Score, mean ± SD Placebo: 35.0±12.5; LD Lirentelimab: 36.1±12.3; HD Lirentelimab: 34.2±12.2 Absolute Change Absolute Change Mean (SE) / Mean (SD) Change in DSQ from Baseline: Patients with BL Es
Slide 22: Summary & Conclusions
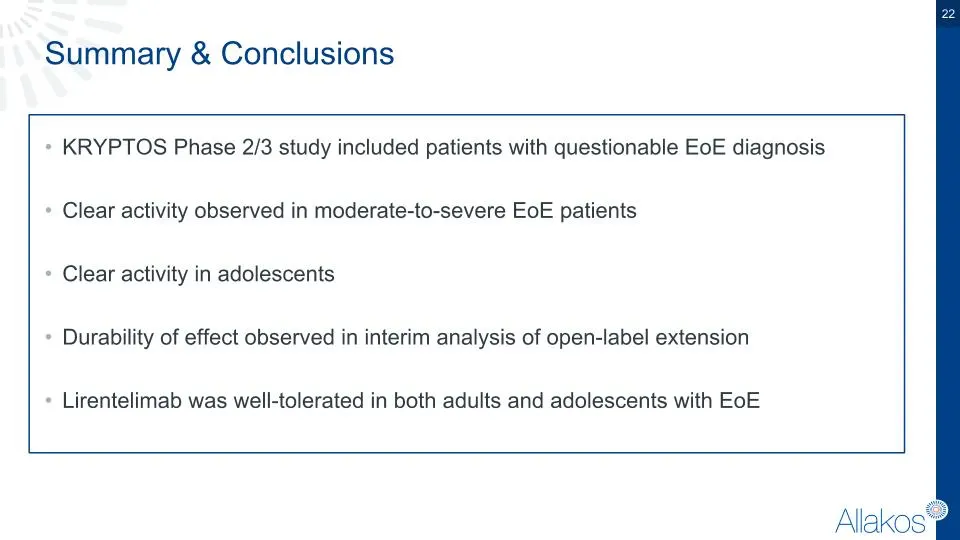
Summary & Conclusions KRYPTOS Phase 2/3 study included patients with questionable EoE diagnosis Clear activity observed in moderate-to-severe EoE patients Clear activity in adolescents Durability of effect observed in interim analysis of open-label extension Lirentelimab was well-tolerated in both a
Slide 23: Review of ENIGMA2 Phase 3 EG/EoD Study
Review of ENIGMA2 Phase 3 EG/EoD Study
Slide 24: ENIGMA2 Phase 3 EG/EoD Study Design
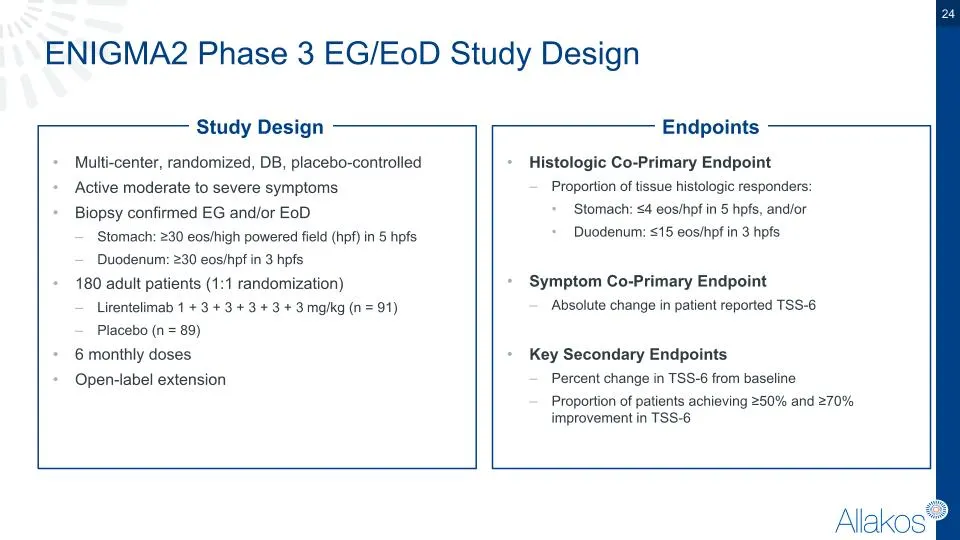
ENIGMA2 Phase 3 EG/EoD Study Design Multi-center, randomized, DB, placebo-controlled Active moderate to severe symptoms Biopsy confirmed EG and/or EoD Stomach: ≥30 eos/high powered field (hpf) in 5 hpfs Duodenum: ≥30 eos/hpf in 3 hpfs 180 adult patients (1:1 randomization) Lirentelimab 1 + 3 + 3 + 3
Slide 25: Histology Co-Primary Endpoint: Eosinophil Responders
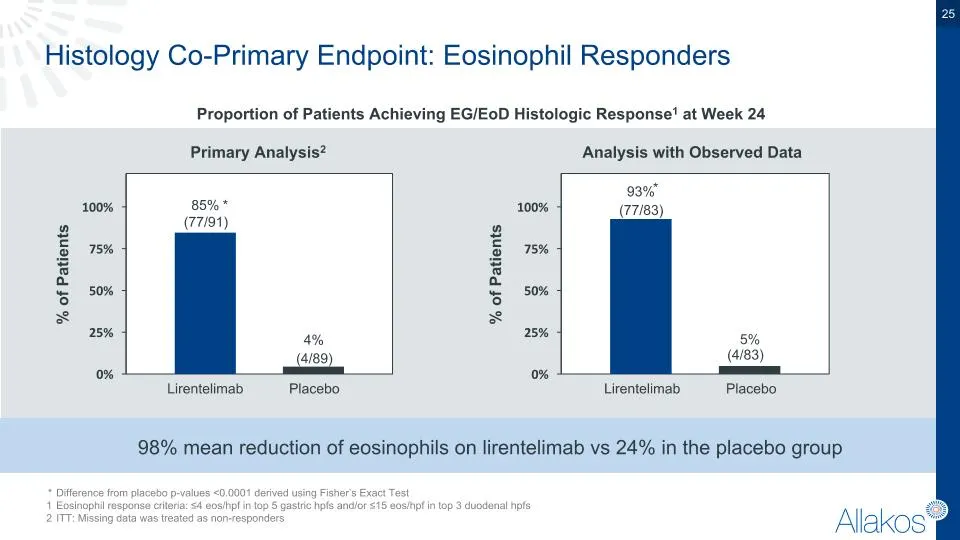
Histology Co-Primary Endpoint: Eosinophil Responders * Difference from placebo p-values <0.0001 derived using Fisher’s Exact Test 1 Eosinophil response criteria: ≤4 eos/hpf in top 5 gastric hpfs and/or ≤15 eos/hpf in top 3 duodenal hpfs 2 ITT: Missing data was treated as non-responders 98% mean redu
Slide 26: Symptom Co-Primary Endpoint: TSS6
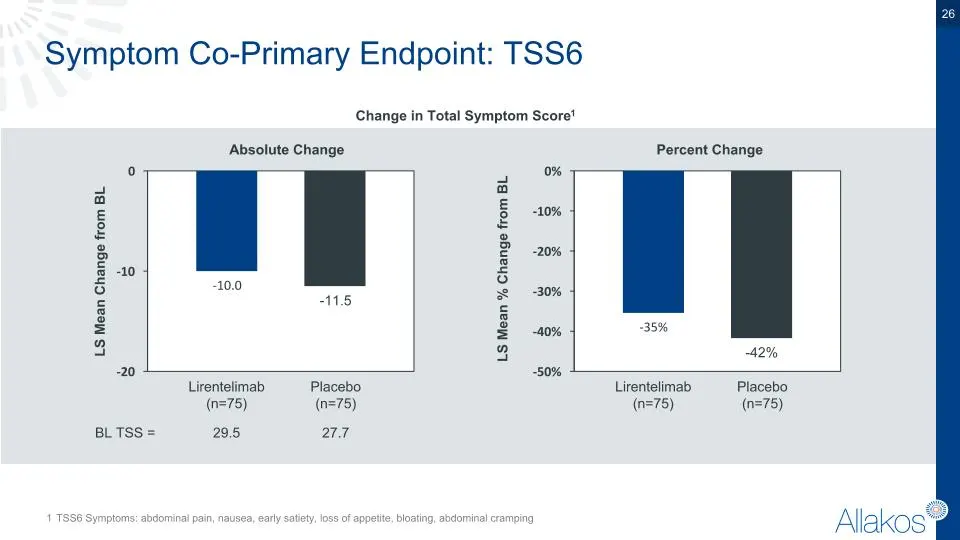
Symptom Co-Primary Endpoint: TSS6 1 TSS6 Symptoms: abdominal pain, nausea, early satiety, loss of appetite, bloating, abdominal cramping Absolute Change LS Mean Change from BL Change in Total Symptom Score1 Percent Change Lirentelimab (n=75) Placebo (n=75) 27.7 29.5 BL TSS = Lirentelimab (n=75) Plac
Slide 27: Responder Analysis Suggests Clinical Activity
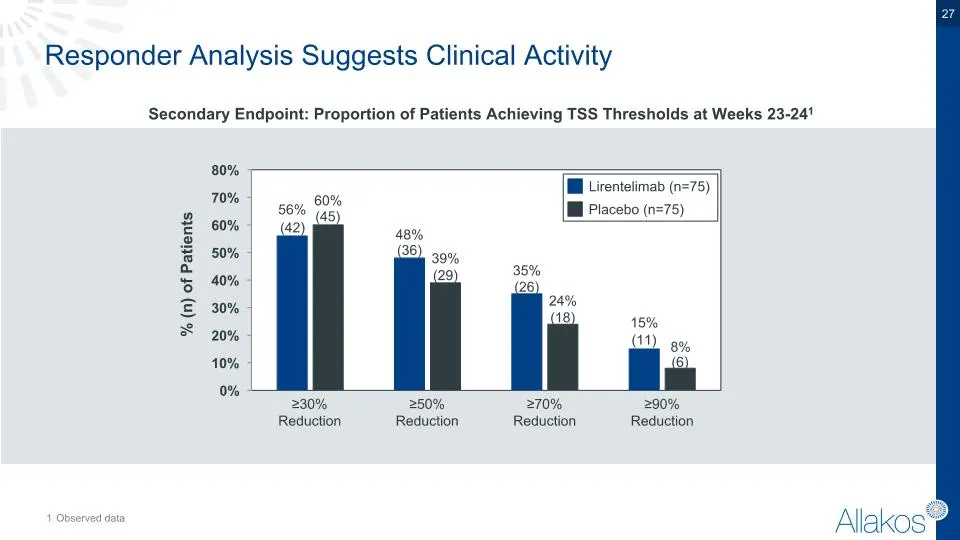
Responder Analysis Suggests Clinical Activity Secondary Endpoint: Proportion of Patients Achieving TSS Thresholds at Weeks 23-241 Lirentelimab (n=75) Placebo (n=75) ≥30% Reduction % (n) of Patients ≥50% Reduction ≥70% Reduction ≥90% Reduction (42) (45) (36) (29) (26) (18) (11) (6) 1 Observed data
Slide 28: Baseline Demographics: ENIGMA1 and ENIGMA2
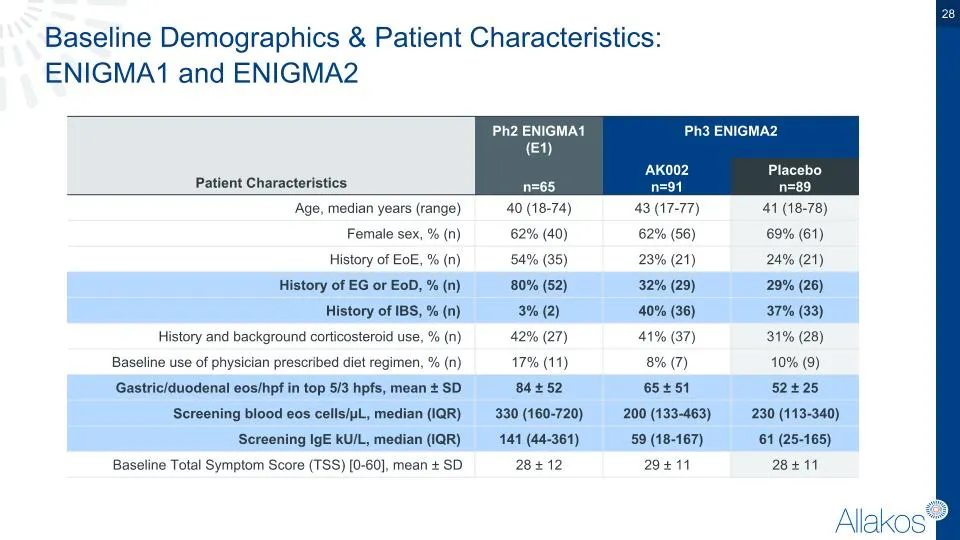
Baseline Demographics & Patient Characteristics: ENIGMA1 and ENIGMA2 Patient Characteristics Ph2 ENIGMA1 (E1) Ph3 ENIGMA2 Patient Characteristics n=65 AK002 n=91 Placebo n=89 Age, median years (range) 40 (18-74) 43 (17-77) 41 (18-78) Female sex, % (n) 62% (40) 62% (56) 69% (61) History of EoE, % (n)
Slide 29: Baseline Demographics: Site Comparison
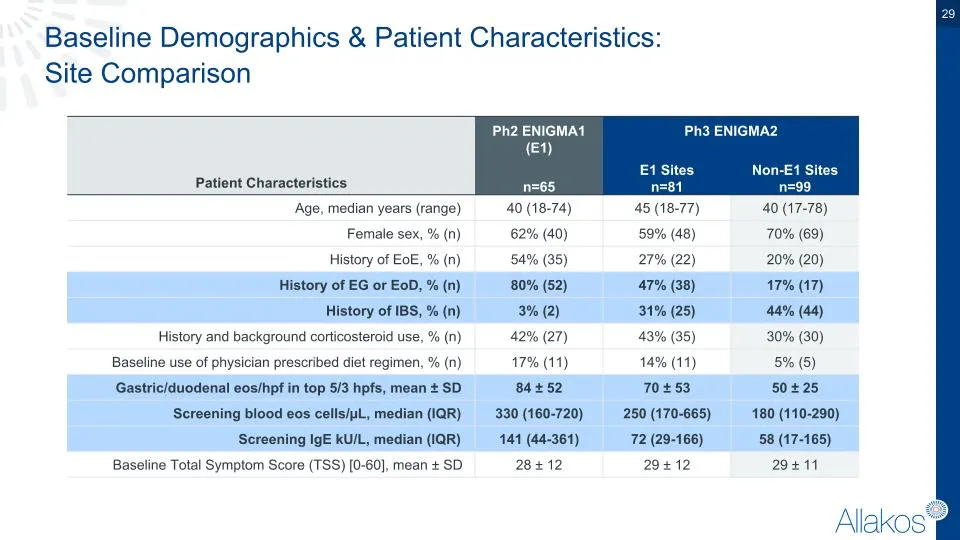
Baseline Demographics & Patient Characteristics: Site Comparison Patient Characteristics Ph2 ENIGMA1 (E1) Ph3 ENIGMA2 Patient Characteristics n=65 E1 Sites n=81 Non-E1 Sites n=99 Age, median years (range) 40 (18-74) 45 (18-77) 40 (17-78) Female sex, % (n) 62% (40) 59% (48) 70% (69) History of EoE, %
Slide 30: Consistent Effects Observed in ENIGMA1 Site Patients
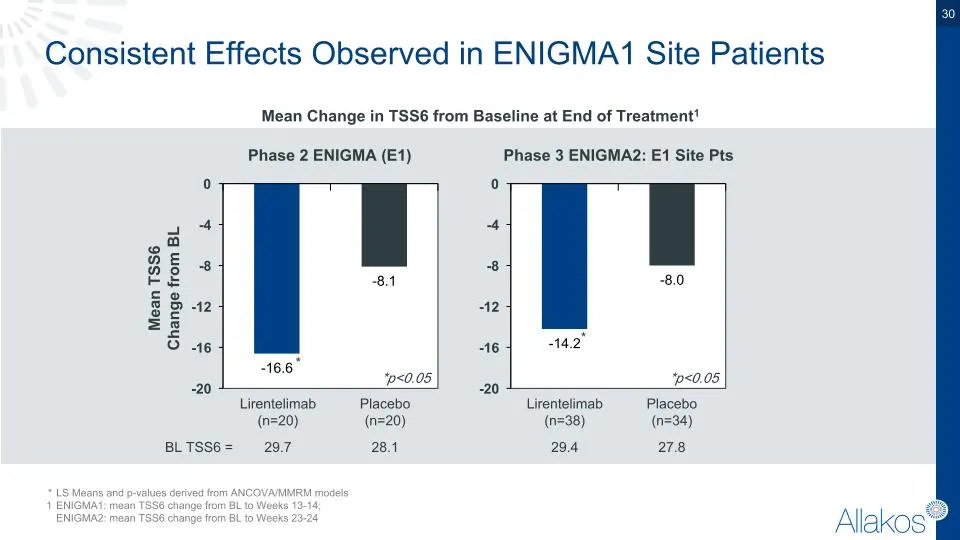
Consistent Effects Observed in ENIGMA1 Site Patients Mean Change in TSS6 from Baseline at End of Treatment1 * LS Means and p-values derived from ANCOVA/MMRM models 1 ENIGMA1: mean TSS6 change from BL to Weeks 13-14; ENIGMA2: mean TSS6 change from BL to Weeks 23-24 Mean TSS6 Change from BL Placebo (n
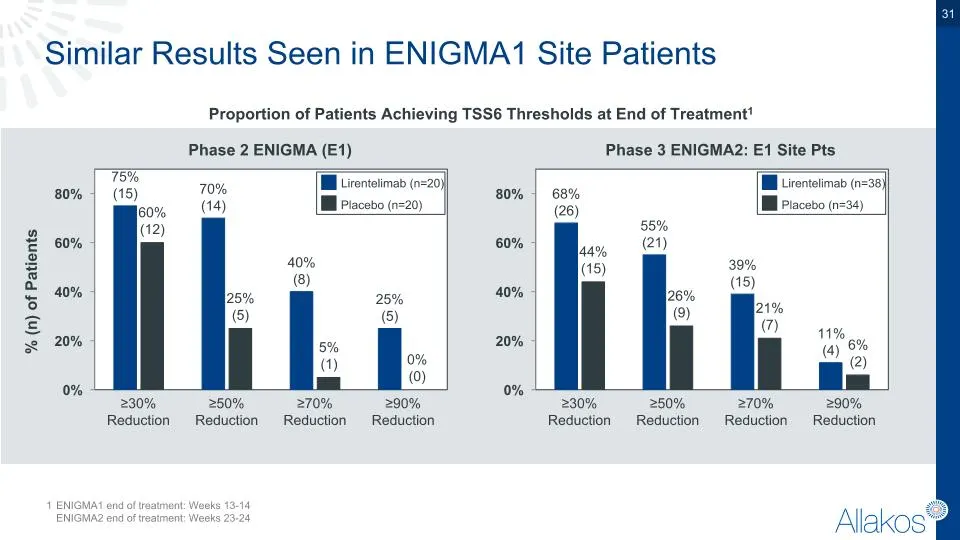
Slide 31: Similar Results Seen in ENIGMA1 Site Patients
≥30% Reduction % (n) of Patients ≥50% Reduction ≥70% Reduction ≥90% Reduction Lirentelimab (n=20) Placebo (n=20) ≥30% Reduction ≥50% Reduction ≥70% Reduction ≥90% Reduction Lirentelimab (n=38) Placebo (n=34) Similar Results Seen in ENIGMA1 Site Patients Proportion of Patients Achieving TSS6 Threshol
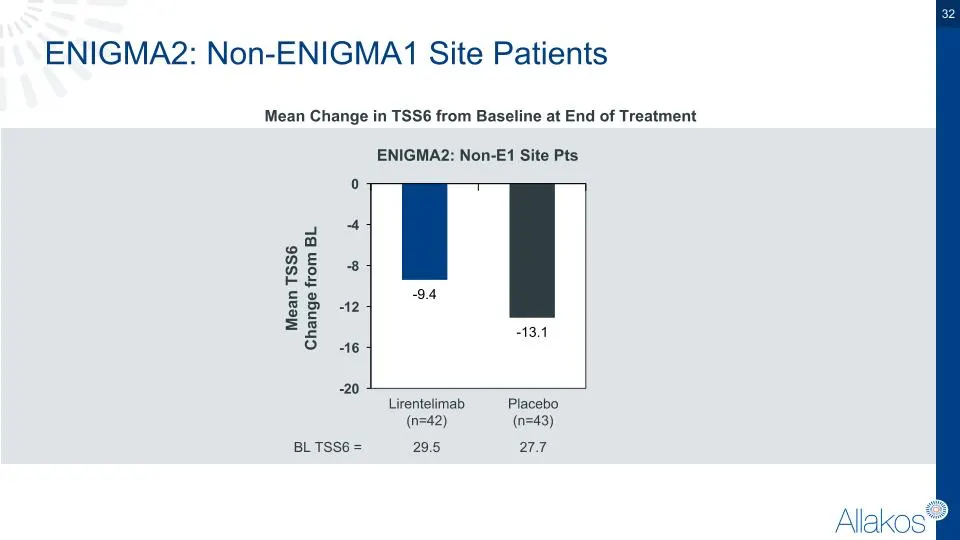
Slide 32: ENIGMA2: Non-ENIGMA1 Site Patients
ENIGMA2: Non-ENIGMA1 Site Patients Mean Change in TSS6 from Baseline at End of Treatment Placebo (n=43) Lirentelimab (n=42) ENIGMA2: Non-E1 Site Pts 29.5 27.7 BL TSS6 = Mean TSS6 Change from BL
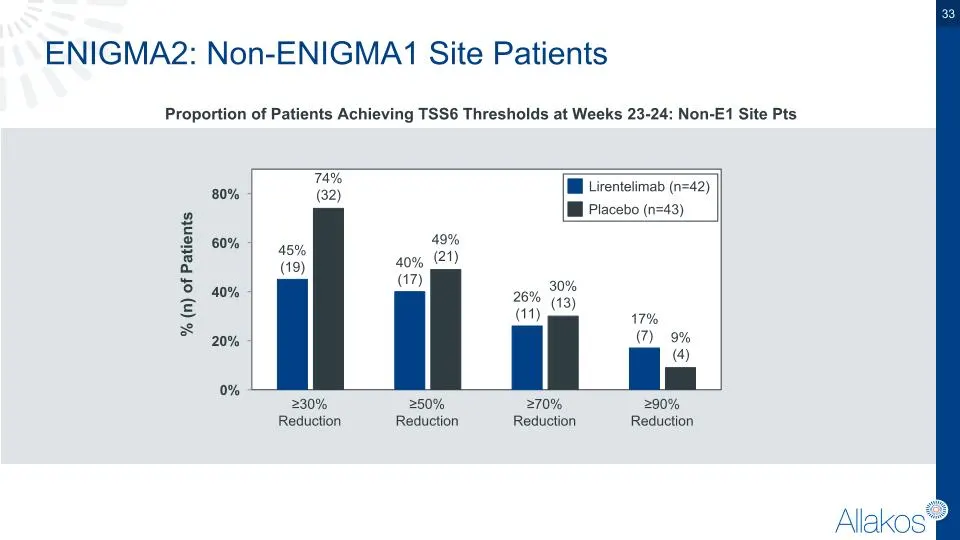
Slide 33: ENIGMA2: Non-ENIGMA1 Site Patients TSS6 Thresholds
ENIGMA2: Non-ENIGMA1 Site Patients Proportion of Patients Achieving TSS6 Thresholds at Weeks 23-24: Non-E1 Site Pts ≥30% Reduction % (n) of Patients ≥50% Reduction ≥70% Reduction ≥90% Reduction Lirentelimab (n=42) Placebo (n=43)

Slide 34: Safety Summary
34 Safety Summary
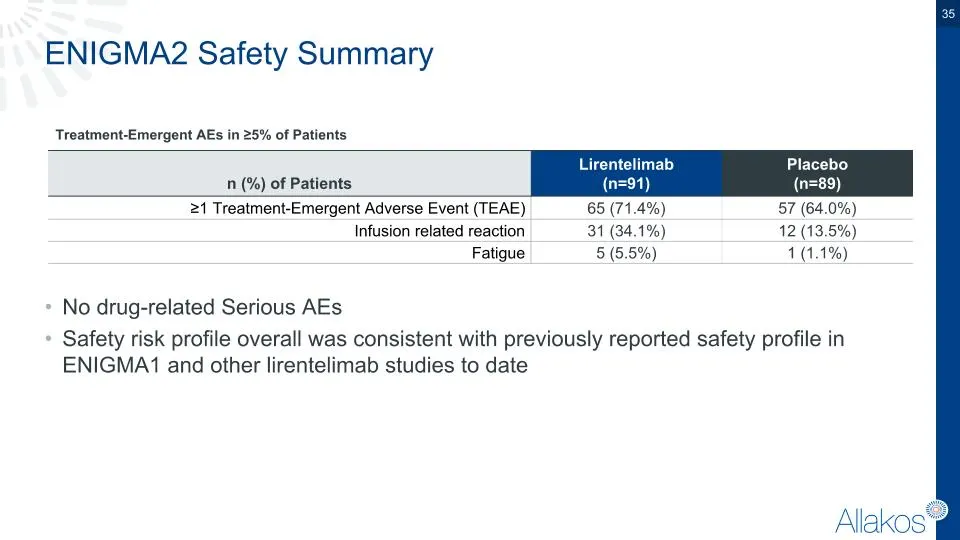
Slide 35: ENIGMA2 Safety Summary
ENIGMA2 Safety Summary No drug-related Serious AEs Safety risk profile overall was consistent with previously reported safety profile in ENIGMA1 and other lirentelimab studies to date n (%) of Patients Lirentelimab (n=91) Placebo (n=89) ≥1 Treatment-Emergent Adverse Event (TEAE) 65 (71.4%) 57 (64.0%
Slide 36: Open Label Extension
36 Open Label Extension
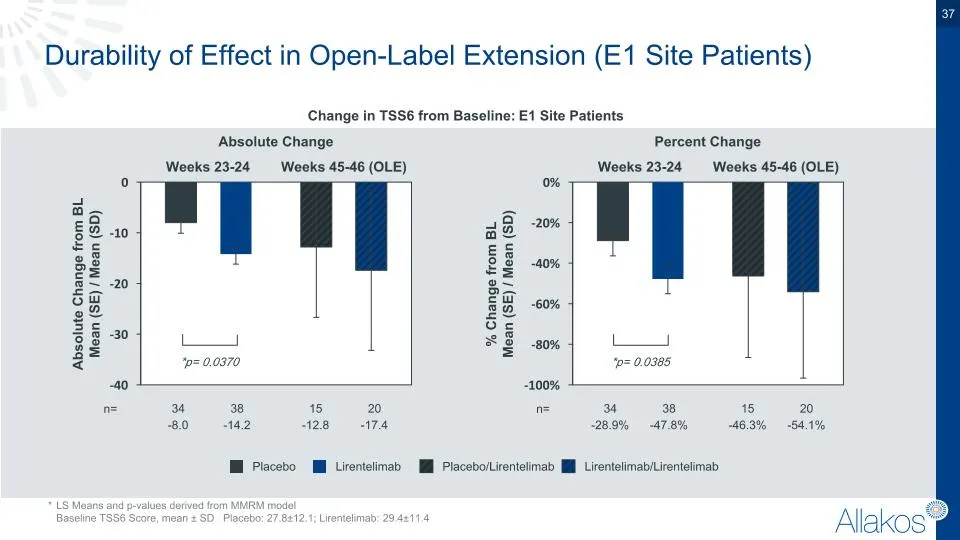
Slide 37: Durability of Effect in Open-Label Extension (E1 Site Patients)
Durability of Effect in Open-Label Extension (E1 Site Patients) * LS Means and p-values derived from MMRM model Baseline TSS6 Score, mean ± SD Placebo: 27.8±12.1; Lirentelimab: 29.4±11.4 Absolute Change Absolute Change from BL Mean (SE) / Mean (SD) Change in TSS6 from Baseline: E1 Site Patients 34 -
Slide 38: Summary of ENIGMA2
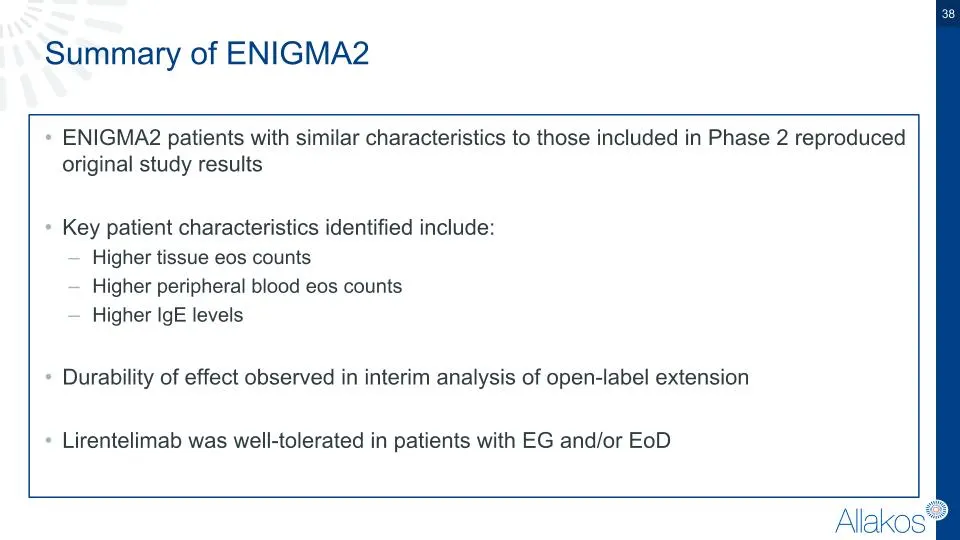
Summary of ENIGMA2 ENIGMA2 patients with similar characteristics to those included in Phase 2 reproduced original study results Key patient characteristics identified include: Higher tissue eos counts Higher peripheral blood eos counts Higher IgE levels Durability of effect observed in interim analy
Slide 39: Phase 3 EoD Study
Phase 3 EoD Study
Slide 40: EoD Phase 3 Study Design
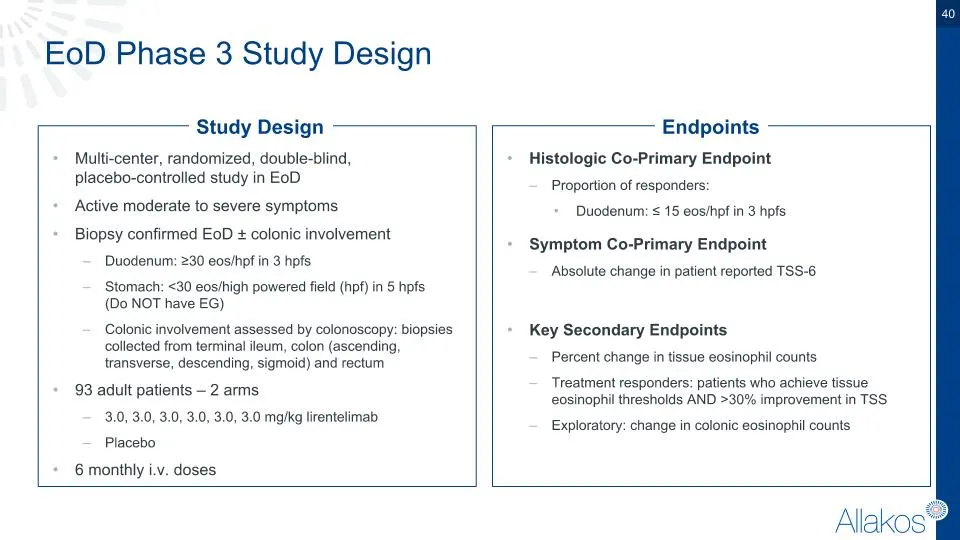
EoD Phase 3 Study Design Multi-center, randomized, double-blind, placebo-controlled study in EoD Active moderate to severe symptoms Biopsy confirmed EoD ± colonic involvement Duodenum: ≥30 eos/hpf in 3 hpfs Stomach: <30 eos/high powered field (hpf) in 5 hpfs (Do NOT have EG) Colonic involvement asse
Slide 41: Phase 3 EoD Study Update
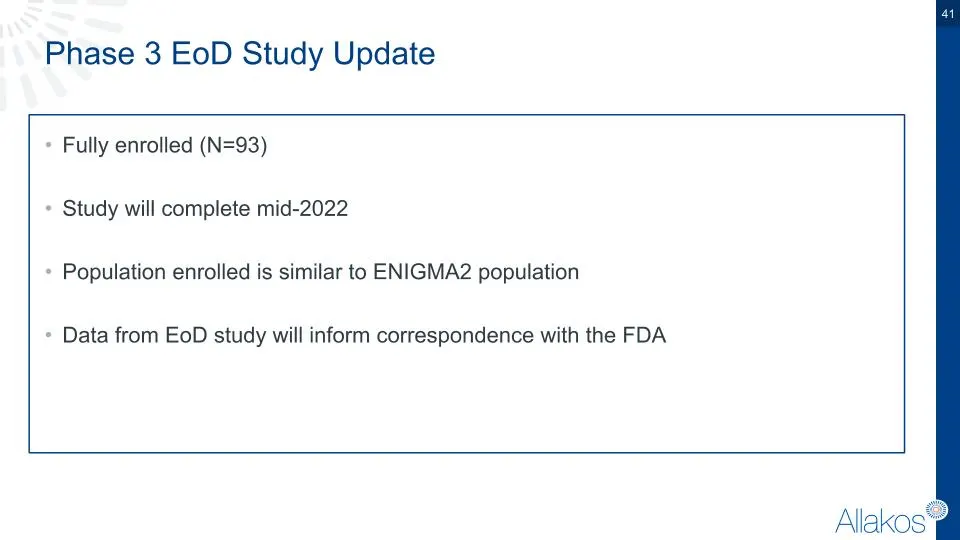
Phase 3 EoD Study Update Fully enrolled (N=93) Study will complete mid-2022 Population enrolled is similar to ENIGMA2 population Data from EoD study will inform correspondence with the FDA
Slide 42: Next Steps in EGIDs
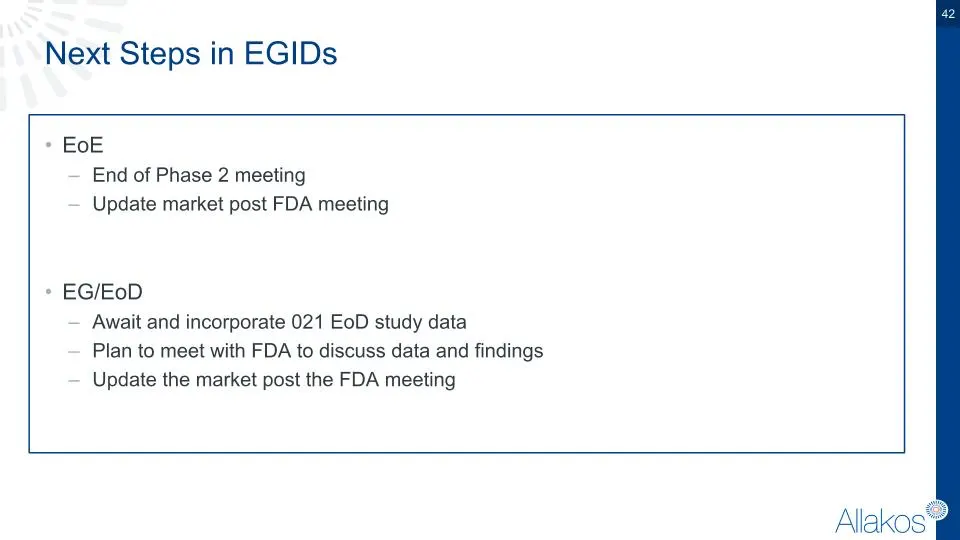
Next Steps in EGIDs EoE End of Phase 2 meeting Update market post FDA meeting EG/EoD Await and incorporate 021 EoD study data Plan to meet with FDA to discuss data and findings Update the market post the FDA meeting
Slide 43: Professor Evan S. Dellon, MD MPH
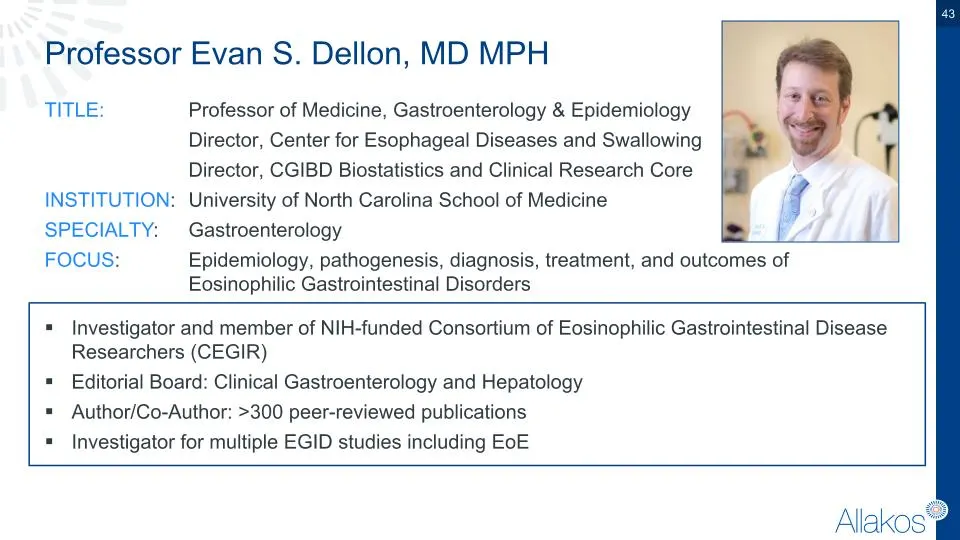
Professor Evan S. Dellon, MD MPH TITLE: Professor of Medicine, Gastroenterology & Epidemiology Director, Center for Esophageal Diseases and Swallowing Director, CGIBD Biostatistics and Clinical Research Core INSTITUTION: University of North Carolina School of Medicine SPECIALTY: Gastroenterology FOC
Slide 44: Lirentelimab for Inflammatory Skin Diseases
Lirentelimab for Inflammatory Skin Diseases Robert Alexander, PhD CEO
Slide 45: Strong Scientific Rationale for Targeting Mast Cells and Eosinophils
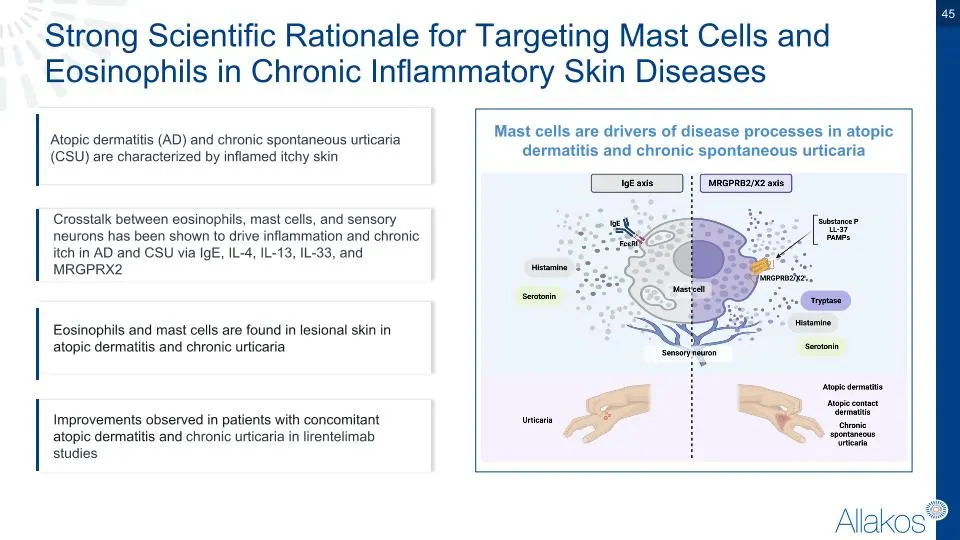
Strong Scientific Rationale for Targeting Mast Cells and Eosinophils in Chronic Inflammatory Skin Diseases Atopic dermatitis (AD) and chronic spontaneous urticaria (CSU) are characterized by inflamed itchy skin Improvements observed in patients with concomitant atopic dermatitis and chronic urticari
Slide 46: AK002 Mast Cell Inhibition
AK002 Mast Cell Inhibition
Slide 47: Lirentelimab Broadly Inhibits Mast Cell Activation
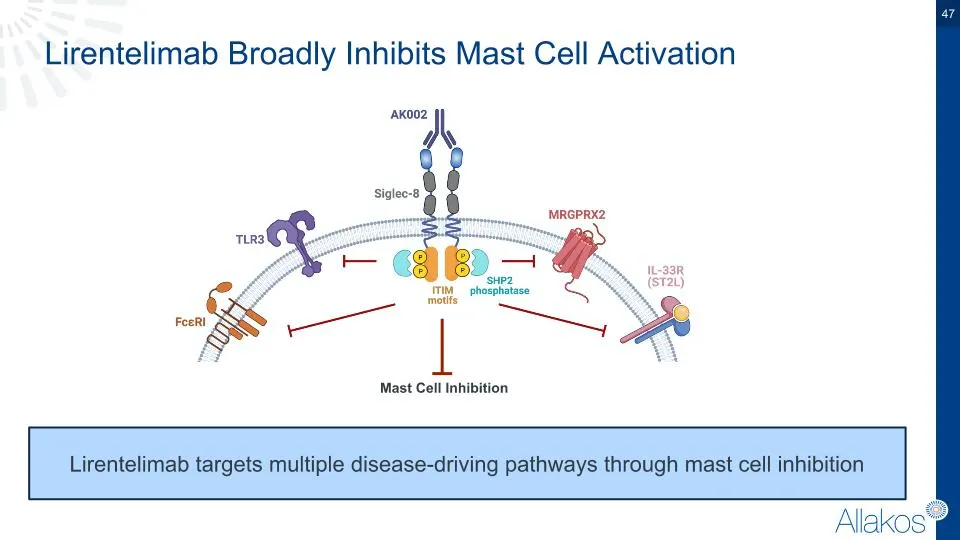
Lirentelimab Broadly Inhibits Mast Cell Activation Lirentelimab targets multiple disease-driving pathways through mast cell inhibition Mast Cell Inhibition
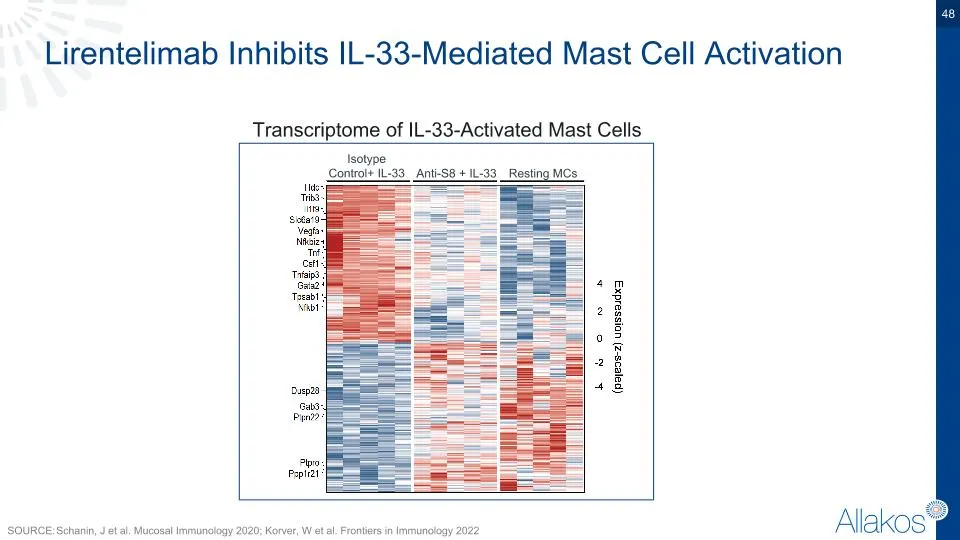
Slide 48: Lirentelimab Inhibits IL-33-Mediated Mast Cell Activation
Lirentelimab Inhibits IL-33-Mediated Mast Cell Activation Transcriptome of IL-33-Activated Mast Cells Resting MCs Isotype Control+ IL-33 Anti-S8 + IL-33 SOURCE: Schanin, J et al. Mucosal Immunology 2020; Korver, W et al. Frontiers in Immunology 2022
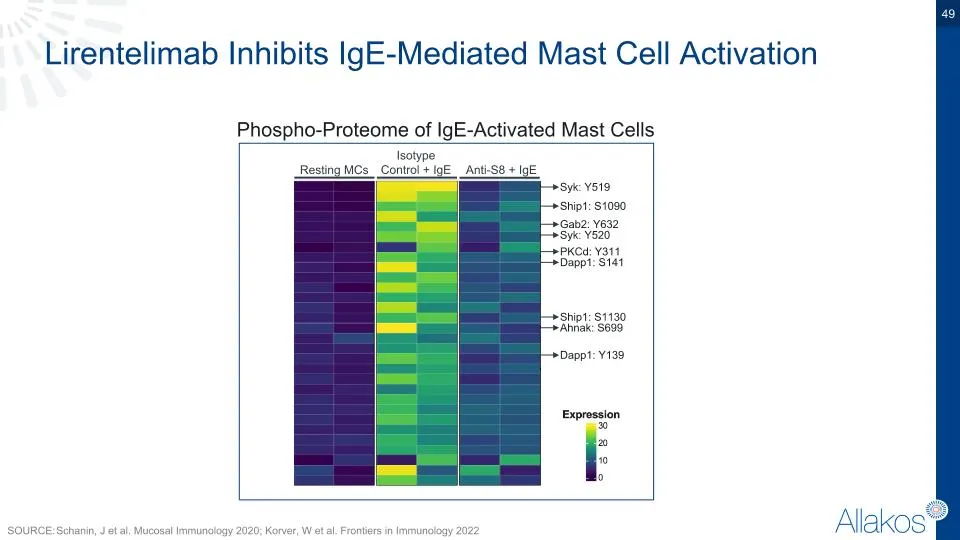
Slide 49: Lirentelimab Inhibits IgE-Mediated Mast Cell Activation
Lirentelimab Inhibits IgE-Mediated Mast Cell Activation Phospho-Proteome of IgE-Activated Mast Cells Resting MCs Isotype Control + IgE Anti-S8 + IgE Syk: Y519 Ship1: S1090 Gab2: Y632 Syk: Y520 PKCd: Y311 Dapp1: S141 Ship1: S1130 Ahnak: S699 Dapp1: Y139 SOURCE: Schanin, J et al. Mucosal Immunology 20
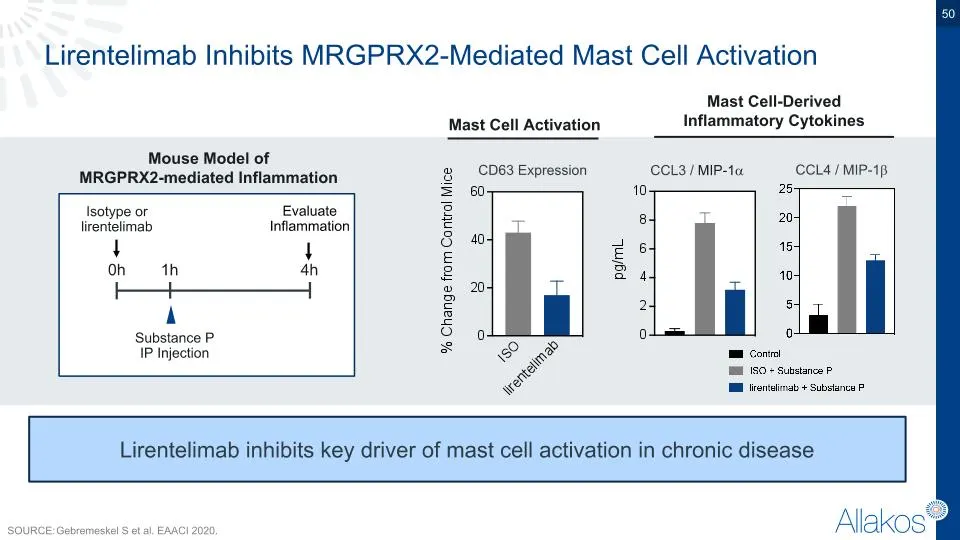
Slide 50: Lirentelimab Inhibits MRGPRX2-Mediated Mast Cell Activation
Lirentelimab Inhibits MRGPRX2-Mediated Mast Cell Activation Lirentelimab inhibits key driver of mast cell activation in chronic disease Mouse Model of MRGPRX2-mediated Inflammation Mast Cell-Derived Inflammatory Cytokines 0h Substance P IP Injection 4h 1h Isotype or lirentelimab Evaluate Inflammatio
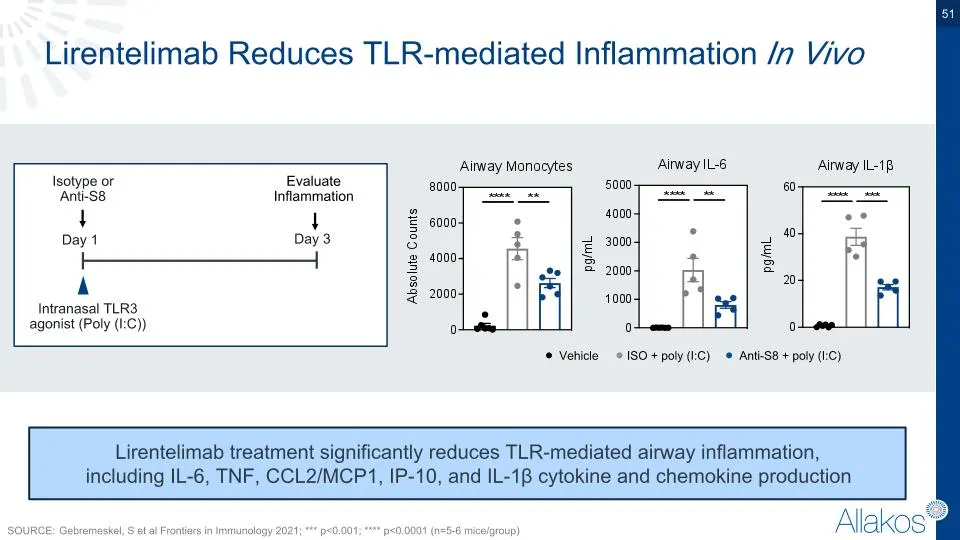
Slide 51: Lirentelimab Reduces TLR-mediated Inflammation In Vivo
Lirentelimab Reduces TLR-mediated Inflammation In Vivo Day 1 Intranasal TLR3 agonist (Poly (I:C)) Day 3 Isotype or Anti-S8 Evaluate Inflammation Vehicle ISO + poly (I:C) Anti-S8 + poly (I:C) Lirentelimab treatment significantly reduces TLR-mediated airway inflammation, including IL-6, TNF, CCL2/MCP1
Slide 52: Lirentelimab for Atopic Dermatitis
Lirentelimab for Atopic Dermatitis
Slide 53: AD Lesional Biopsies Show Evidence of MC and Eosinophil Activity
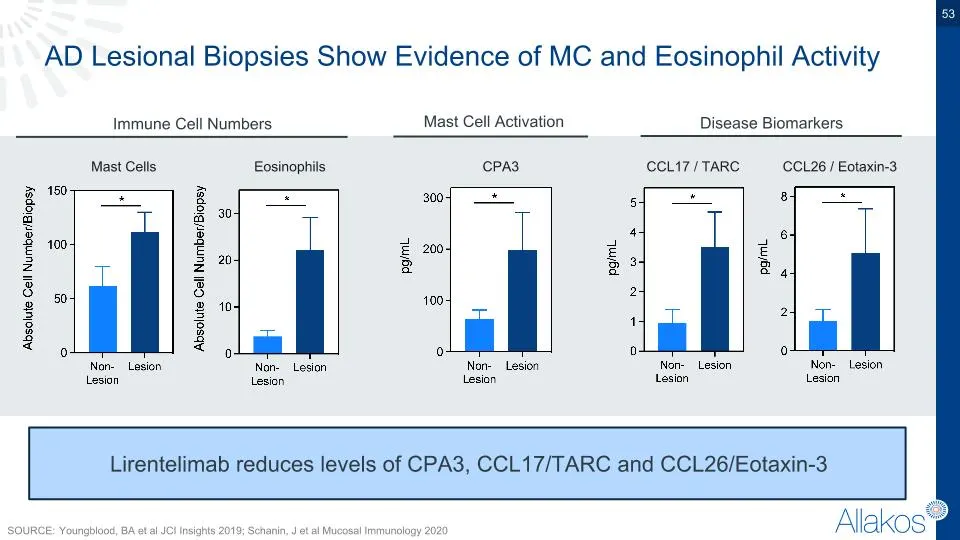
AD Lesional Biopsies Show Evidence of MC and Eosinophil Activity Immune Cell Numbers Disease Biomarkers Mast Cell Activation Lirentelimab reduces levels of CPA3, CCL17/TARC and CCL26/Eotaxin-3 CCL26 / Eotaxin-3 CCL17 / TARC CPA3 Eosinophils Mast Cells SOURCE: Youngblood, BA et al JCI Insights 2019;
Slide 54: Reduction in Clinically-Relevant Cytokines
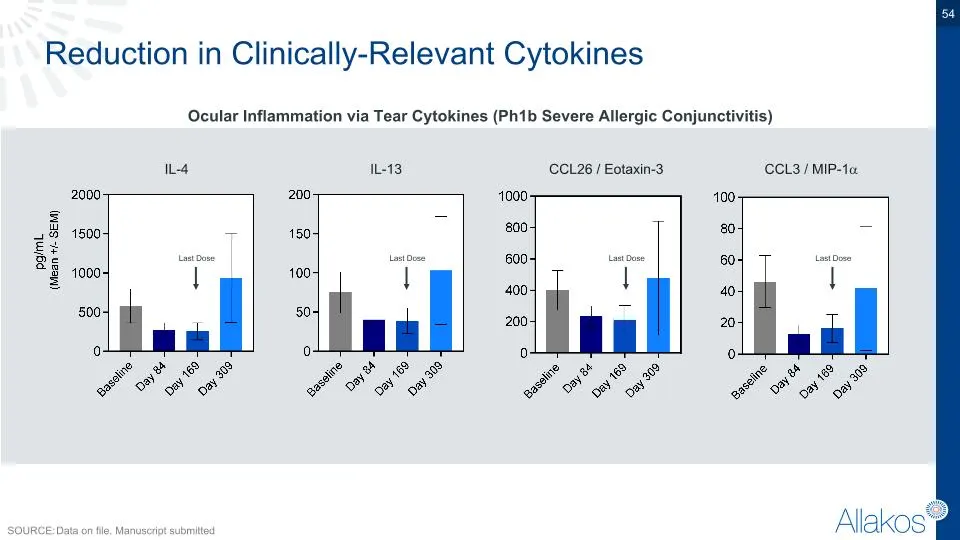
Reduction in Clinically-Relevant Cytokines SOURCE: Data on file. Manuscript submitted Ocular Inflammation via Tear Cytokines (Ph1b Severe Allergic Conjunctivitis) Last Dose Last Dose Last Dose Last Dose IL-4 IL-13 CCL26 / Eotaxin-3 CCL3 / MIP-1
Slide 55: Improvement in Concomitant Atopic Dermatitis
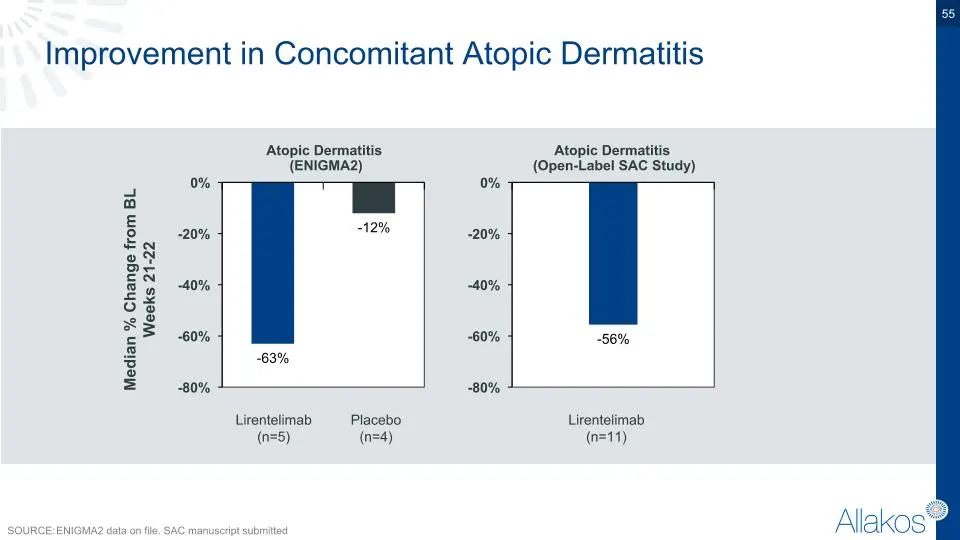
Improvement in Concomitant Atopic Dermatitis SOURCE: ENIGMA2 data on file. SAC manuscript submitted Median % Change from BL Weeks 21-22 Placebo (n=4) Lirentelimab (n=5) Atopic Dermatitis (Open-Label SAC Study) Lirentelimab (n=11) Atopic Dermatitis (ENIGMA2)
Slide 56: Phase 2 AD Study Design
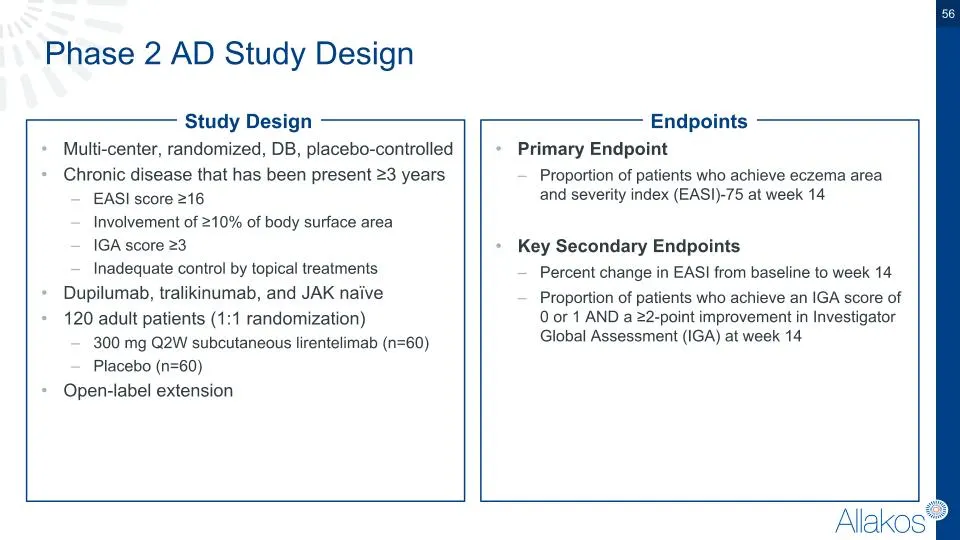
Phase 2 AD Study Design Multi-center, randomized, DB, placebo-controlled Chronic disease that has been present ≥3 years EASI score ≥16 Involvement of ≥10% of body surface area IGA score ≥3 Inadequate control by topical treatments Dupilumab, tralikinumab, and JAK naïve 120 adult patients (1:1 randomi
Slide 57: Chronic Spontaneous Urticaria
Chronic Spontaneous Urticaria
Slide 58: Phase 2a Chronic Urticaria Study
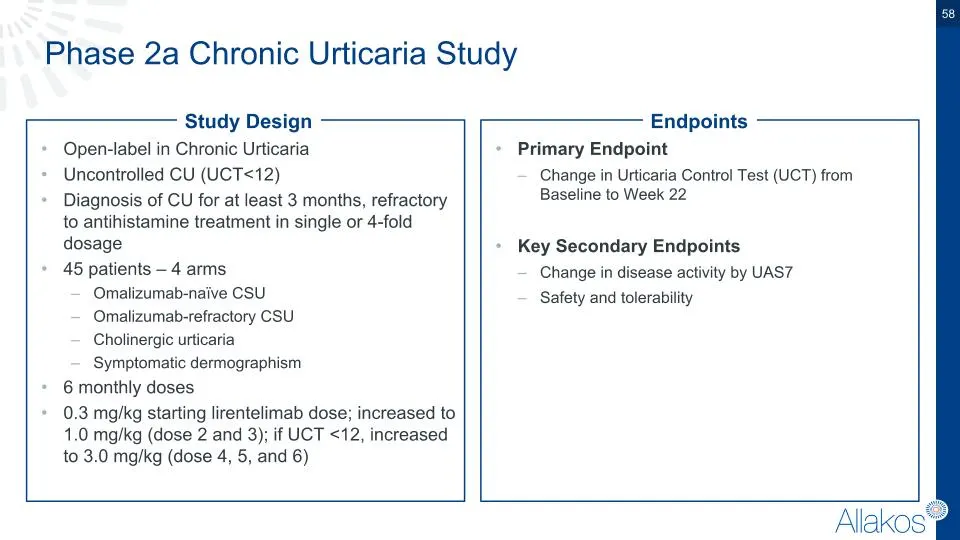
Phase 2a Chronic Urticaria Study Open-label in Chronic Urticaria Uncontrolled CU (UCT<12) Diagnosis of CU for at least 3 months, refractory to antihistamine treatment in single or 4-fold dosage 45 patients – 4 arms Omalizumab-naïve CSU Omalizumab-refractory CSU Cholinergic urticaria Symptomatic derm
Slide 59: Phase 2a Chronic Urticaria Study – Results in CSU
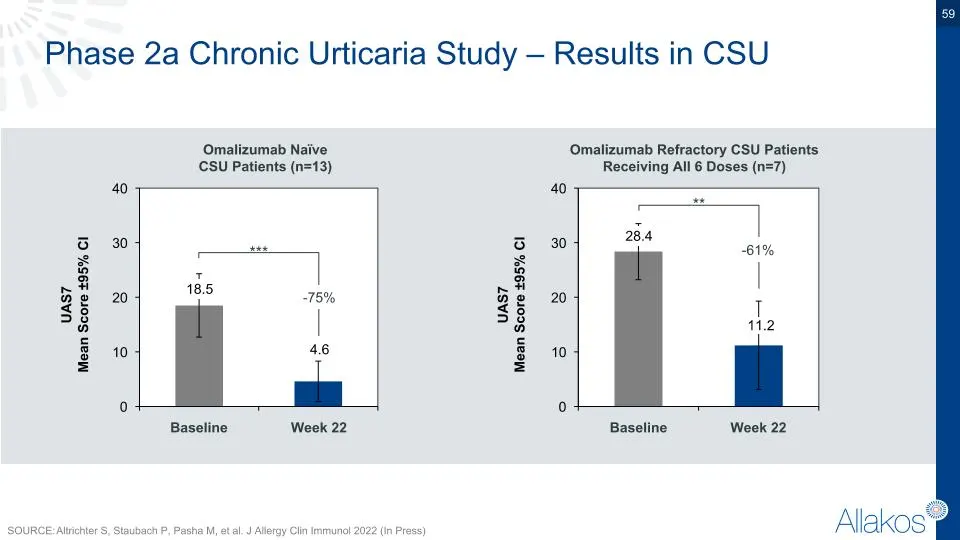
Phase 2a Chronic Urticaria Study – Results in CSU Omalizumab Naïve CSU Patients (n=13) Baseline Week 22 Omalizumab Refractory CSU Patients Receiving All 6 Doses (n=7) SOURCE: Altrichter S, Staubach P, Pasha M, et al. J Allergy Clin Immunol 2022 (In Press) UAS7 Mean Score ±95% CI Baseline Week 22 ***
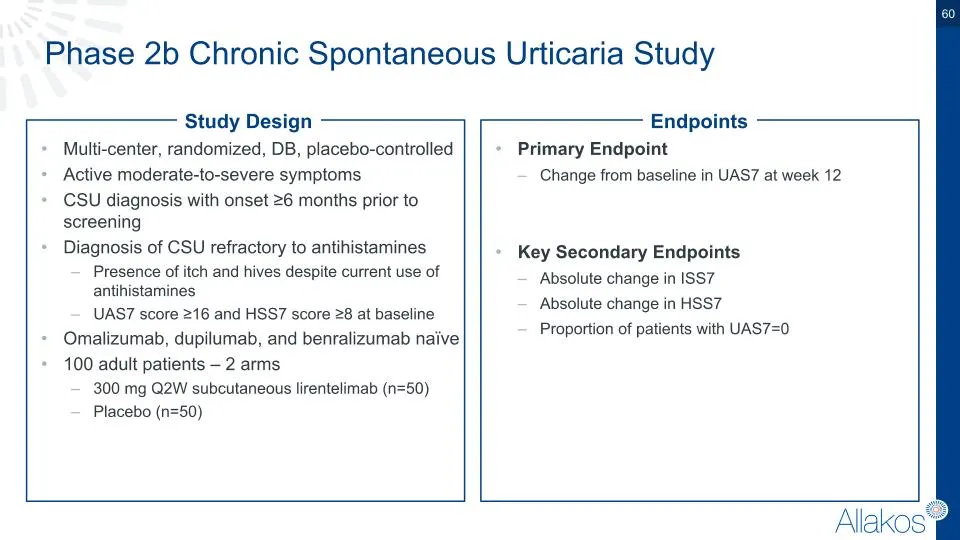
Slide 60: Phase 2b Chronic Spontaneous Urticaria Study
Phase 2b Chronic Spontaneous Urticaria Study Multi-center, randomized, DB, placebo-controlled Active moderate-to-severe symptoms CSU diagnosis with onset ≥6 months prior to screening Diagnosis of CSU refractory to antihistamines Presence of itch and hives despite current use of antihistamines UAS7 s
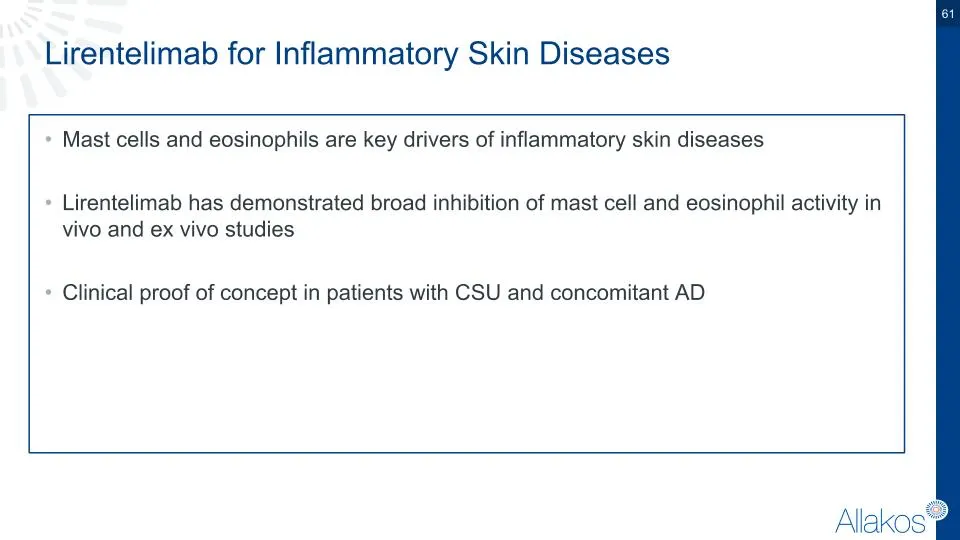
Slide 61: Lirentelimab for Inflammatory Skin Diseases
Lirentelimab for Inflammatory Skin Diseases Mast cells and eosinophils are key drivers of inflammatory skin diseases Lirentelimab has demonstrated broad inhibition of mast cell and eosinophil activity in vivo and ex vivo studies Clinical proof of concept in patients with CSU and concomitant AD
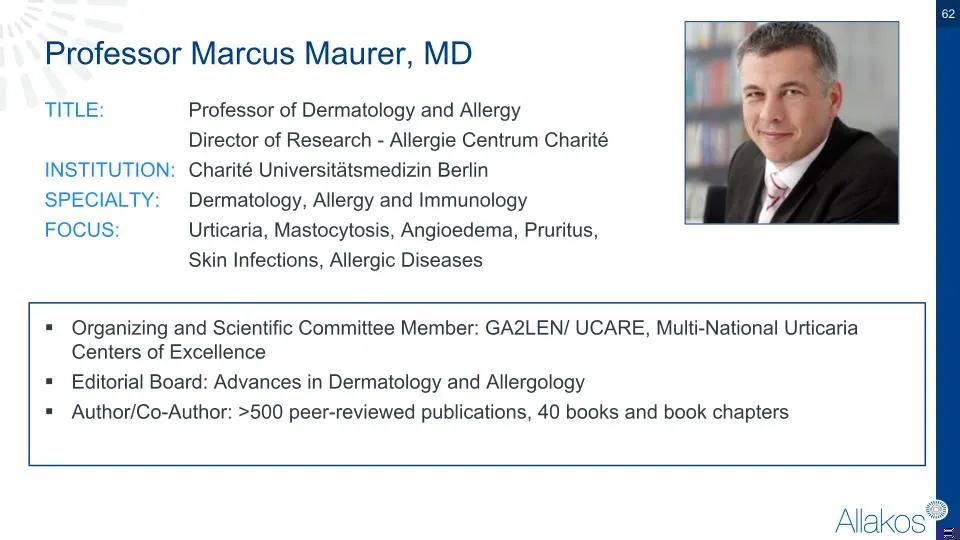
Slide 62: Professor Marcus Maurer, MD
Professor Marcus Maurer, MD TITLE: Professor of Dermatology and Allergy Director of Research - Allergie Centrum Charité INSTITUTION: Charité Universitätsmedizin Berlin SPECIALTY: Dermatology, Allergy and Immunology FOCUS: Urticaria, Mastocytosis, Angioedema, Pruritus, Skin Infections, Allergic Disea
Slide 63: Pipeline Strategy & Update
Pipeline Strategy & Update Bradford A. Youngblood, PhD Head of Research & Preclinical Development – Allakos Inc.
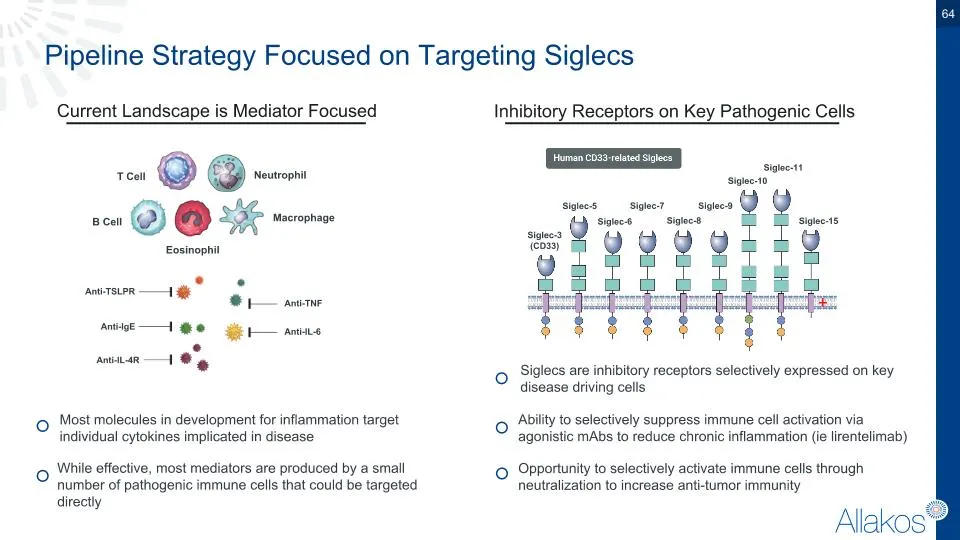
Slide 64: Pipeline Strategy Focused on Targeting Siglecs
Pipeline Strategy Focused on Targeting Siglecs Current Landscape is Mediator Focused Inhibitory Receptors on Key Pathogenic Cells Most molecules in development for inflammation target individual cytokines implicated in disease While effective, most mediators are produced by a small number of pathoge
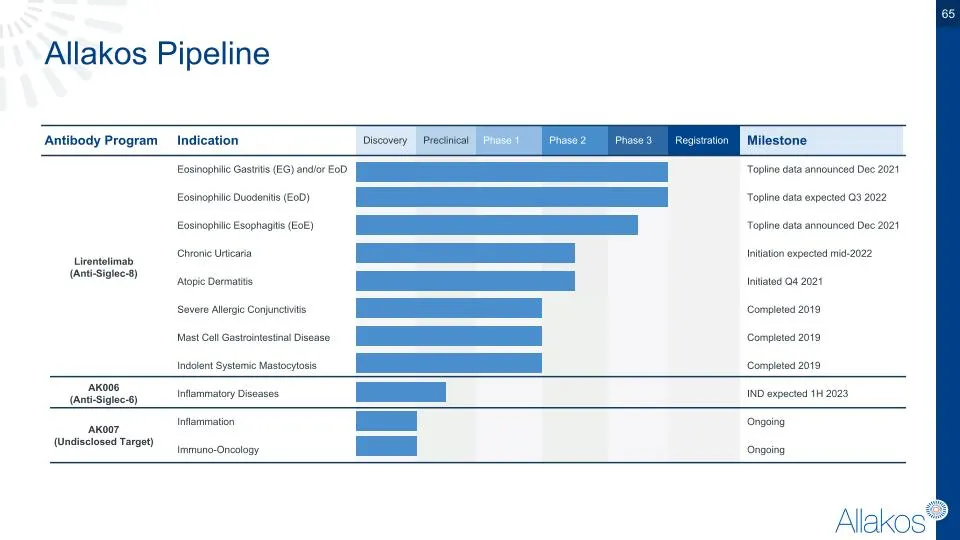
Slide 65: Allakos Pipeline
Antibody Program Indication Discovery Preclinical Phase 1 Phase 2 Phase 3 Registration Milestone Lirentelimab (Anti-Siglec-8) Eosinophilic Gastritis (EG) and/or EoD Topline data announced Dec 2021 Eosinophilic Duodenitis (EoD) Topline data expected Q3 2022 Eosinophilic Esophagitis (EoE) Topline data
Slide 66: AK006 Program
AK006 Program
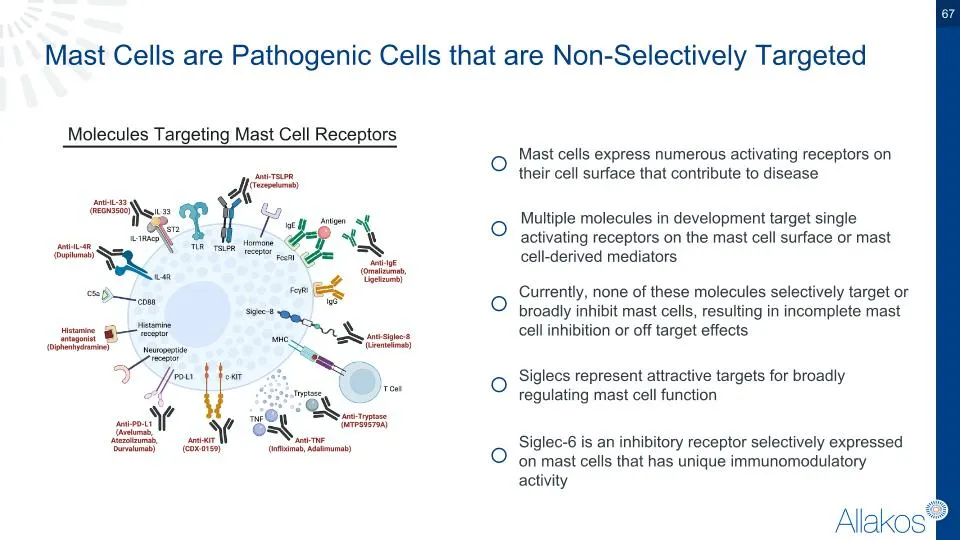
Slide 67: Mast Cells are Pathogenic Cells that are Non-Selectively Targeted
Mast Cells are Pathogenic Cells that are Non-Selectively Targeted Mast cells express numerous activating receptors on their cell surface that contribute to disease Siglec-6 is an inhibitory receptor selectively expressed on mast cells that has unique immunomodulatory activity Siglecs represent attra
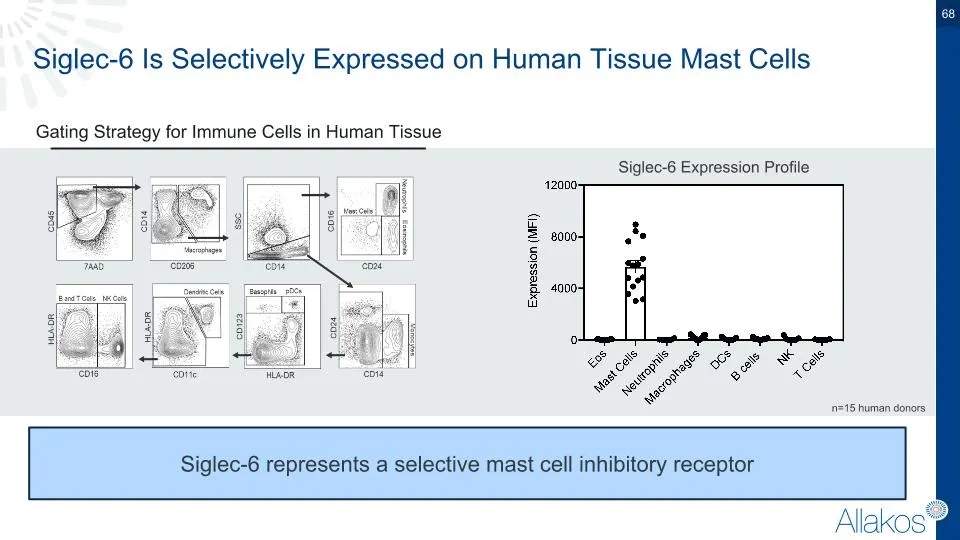
Slide 68: Siglec-6 Is Selectively Expressed on Human Tissue Mast Cells
Siglec-6 Is Selectively Expressed on Human Tissue Mast Cells Gating Strategy for Immune Cells in Human Tissue Siglec-6 Expression Profile Siglec-6 represents a selective mast cell inhibitory receptor n=15 human donors
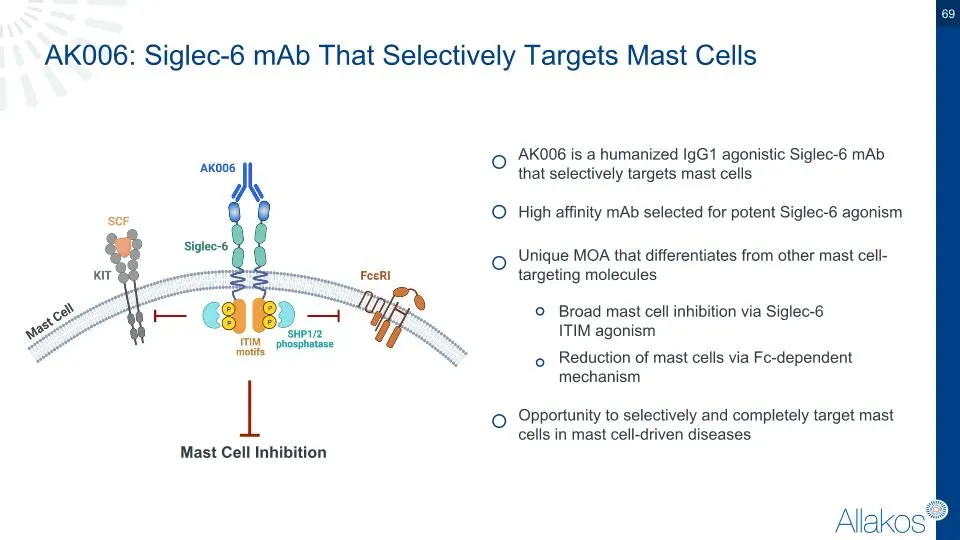
Slide 69: AK006: Siglec-6 mAb That Selectively Targets Mast Cells
AK006: Siglec-6 mAb That Selectively Targets Mast Cells AK006 is a humanized IgG1 agonistic Siglec-6 mAb that selectively targets mast cells High affinity mAb selected for potent Siglec-6 agonism Broad mast cell inhibition via Siglec-6 ITIM agonism Reduction of mast cells via Fc-dependent mechanism
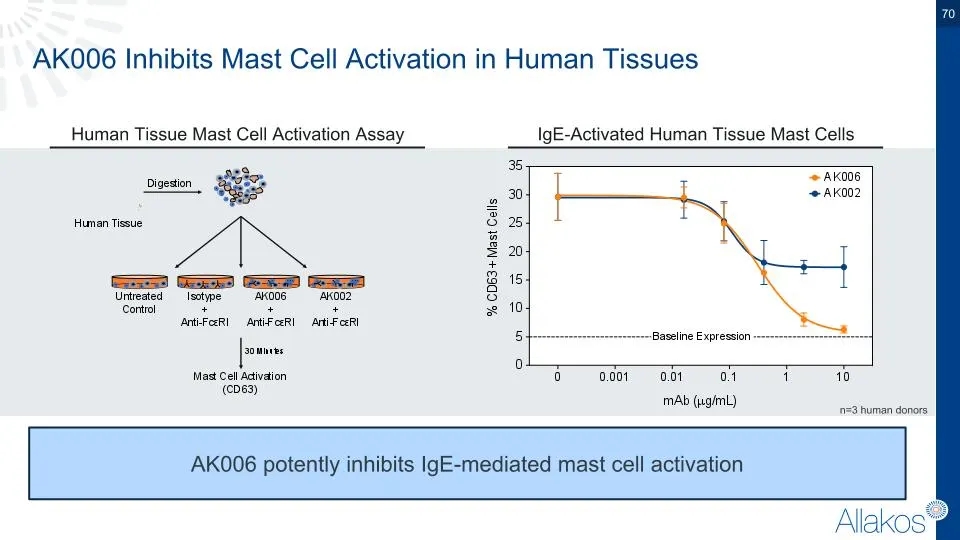
Slide 70: AK006 Inhibits Mast Cell Activation in Human Tissues
AK006 Inhibits Mast Cell Activation in Human Tissues IgE-Activated Human Tissue Mast Cells AK006 potently inhibits IgE-mediated mast cell activation Human Tissue Mast Cell Activation Assay n=3 human donors
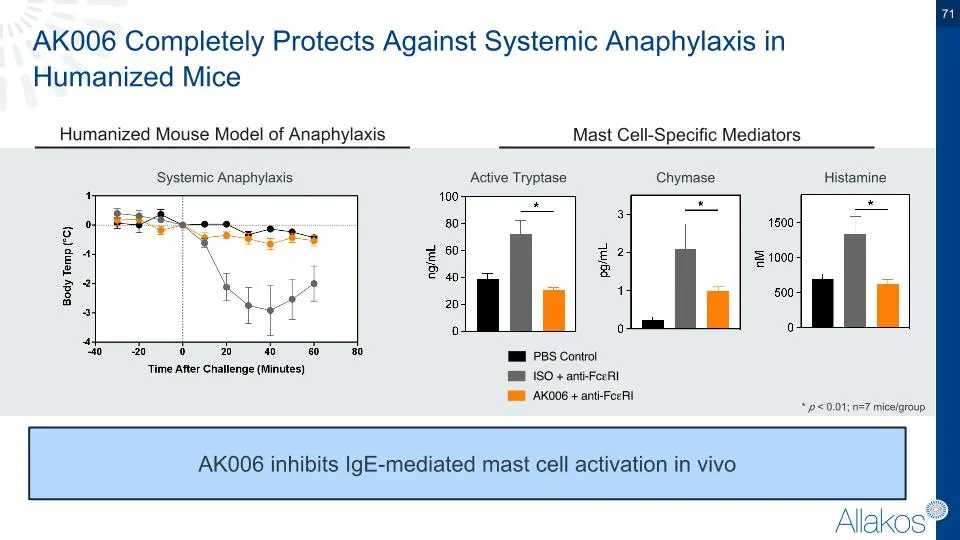
Slide 71: AK006 Completely Protects Against Systemic Anaphylaxis in Humanized Mice
AK006 Completely Protects Against Systemic Anaphylaxis in Humanized Mice Active Tryptase Mast Cell-Specific Mediators Histamine Systemic Anaphylaxis AK006 inhibits IgE-mediated mast cell activation in vivo Humanized Mouse Model of Anaphylaxis Chymase * p < 0.01; n=7 mice/group
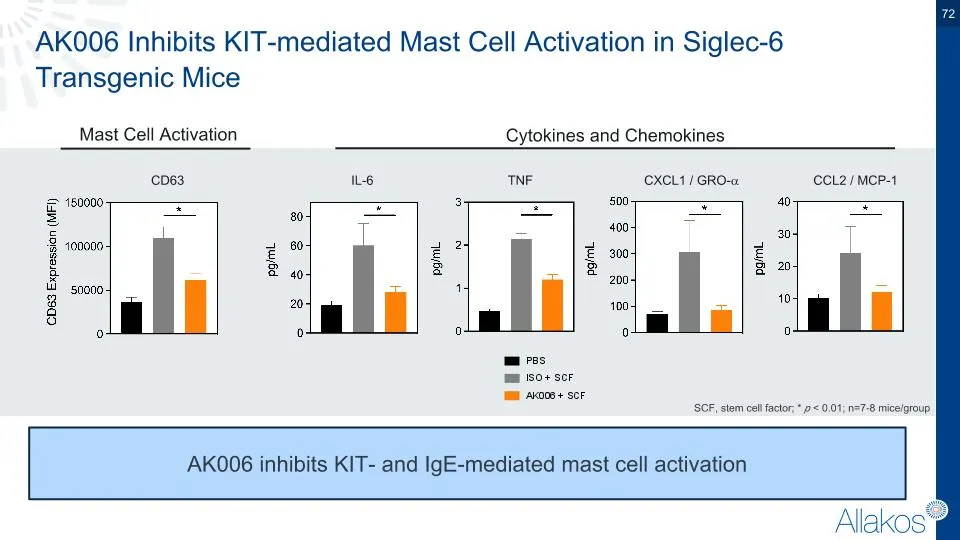
Slide 72: AK006 Inhibits KIT-mediated Mast Cell Activation
AK006 Inhibits KIT-mediated Mast Cell Activation in Siglec-6 Transgenic Mice Mast Cell Activation AK006 inhibits KIT- and IgE-mediated mast cell activation SCF, stem cell factor; * p < 0.01; n=7-8 mice/group Cytokines and Chemokines CD63 IL-6 TNF CXCL1 / GRO- CCL2 / MCP-1
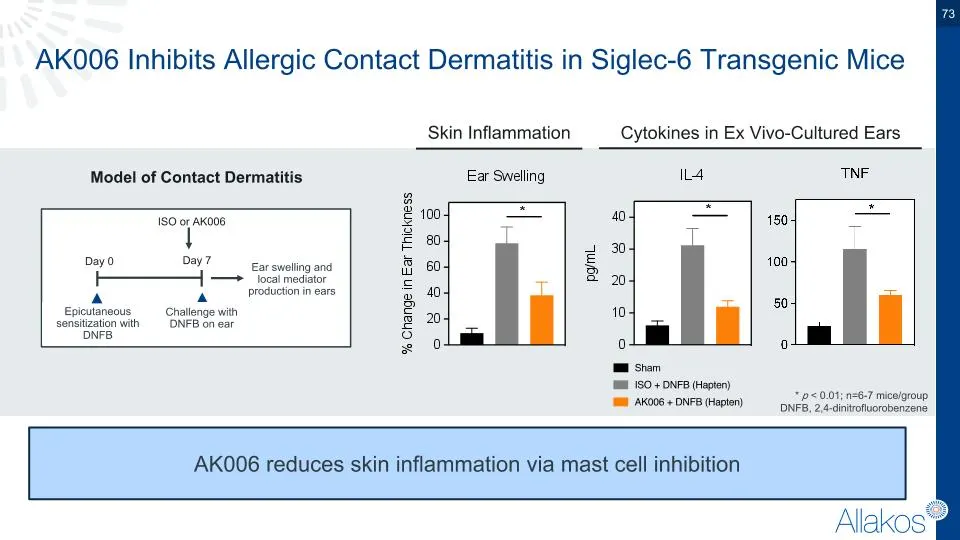
Slide 73: AK006 Inhibits Allergic Contact Dermatitis in Siglec-6 Transgenic Mice
AK006 Inhibits Allergic Contact Dermatitis in Siglec-6 Transgenic Mice Skin Inflammation AK006 reduces skin inflammation via mast cell inhibition * p < 0.01; n=6-7 mice/group DNFB, 2,4-dinitrofluorobenzene Cytokines in Ex Vivo-Cultured Ears Epicutaneous sensitization with DNFB Day 0 ISO or AK006 Day
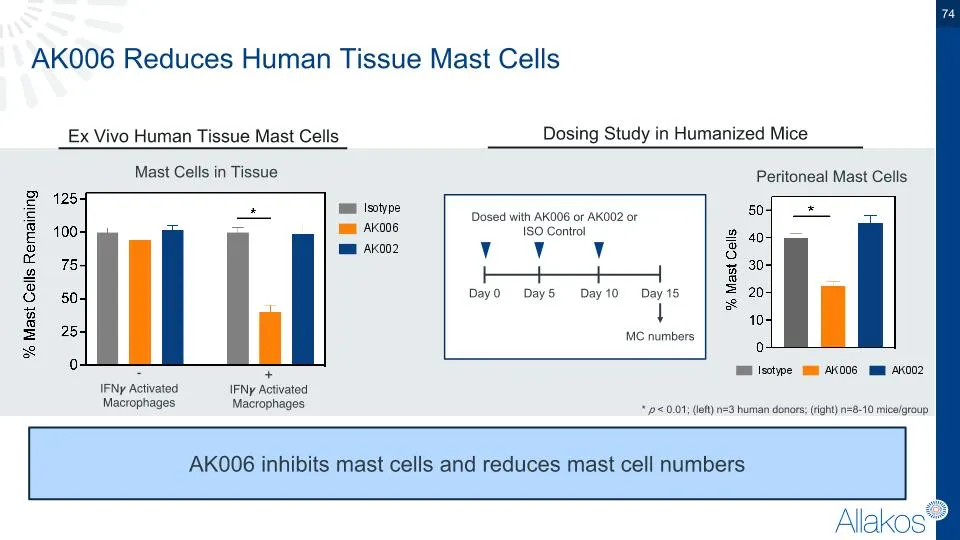
Slide 74: AK006 Reduces Human Tissue Mast Cells
AK006 Reduces Human Tissue Mast Cells Dosing Study in Humanized Mice AK006 inhibits mast cells and reduces mast cell numbers Ex Vivo Human Tissue Mast Cells Day 0 Day 15 Dosed with AK006 or AK002 or ISO Control MC numbers Day 5 Day 10 Peritoneal Mast Cells Mast Cells in Tissue * p < 0.01; (left) n=3
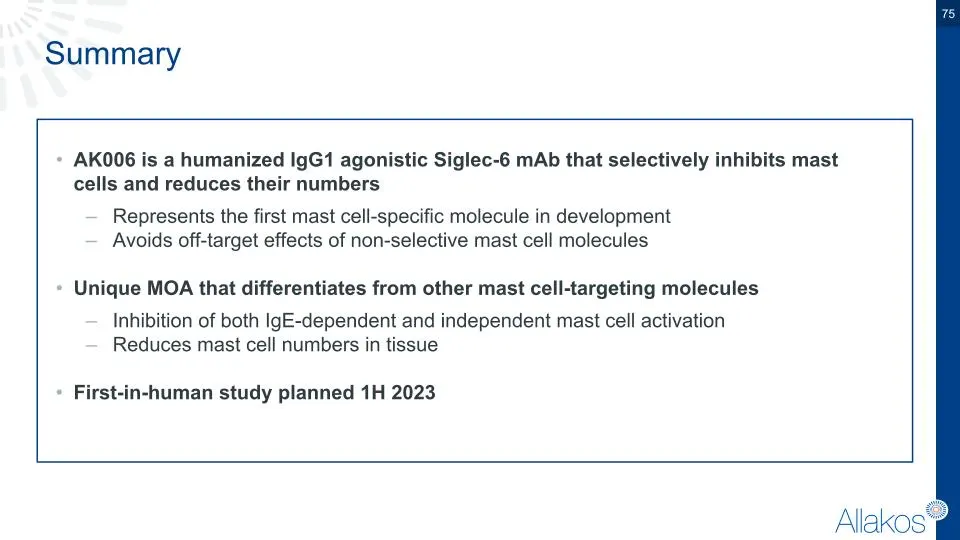
Slide 75: Summary
Summary AK006 is a humanized IgG1 agonistic Siglec-6 mAb that selectively inhibits mast cells and reduces their numbers Represents the first mast cell-specific molecule in development Avoids off-target effects of non-selective mast cell molecules Unique MOA that differentiates from other mast cell-t
Slide 76: Closing Remarks
Closing Remarks Baird Radford & Robert Alexander, PhD CFO and CEO – Allakos Inc.
Slide 77: Expected Cash Runway into Early Q1 2024
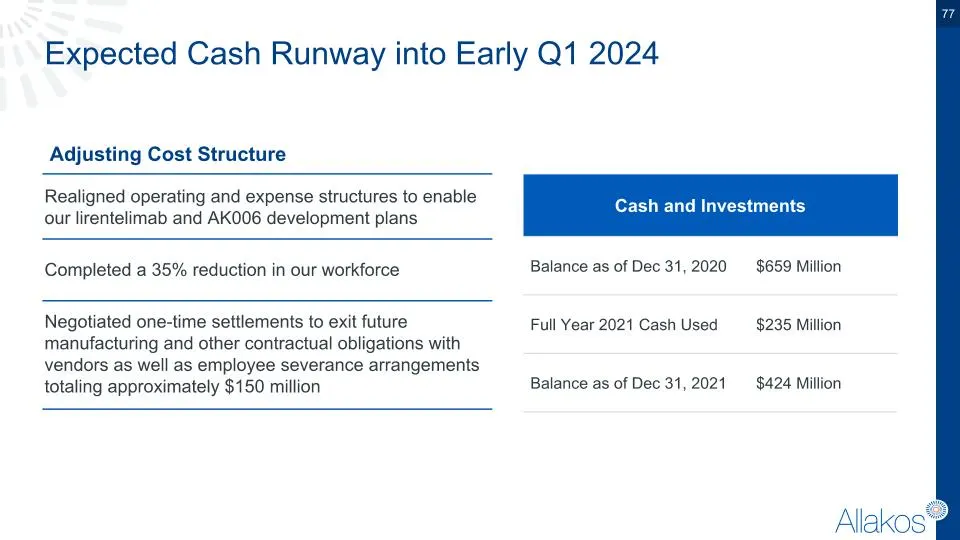
Expected Cash Runway into Early Q1 2024 Cash and Investments Balance as of Dec 31, 2020 $659 Million Full Year 2021 Cash Used $235 Million Balance as of Dec 31, 2021 $424 Million Realigned operating and expense structures to enable our lirentelimab and AK006 development plans Completed a 35% reducti
Slide 78: Development Timeline
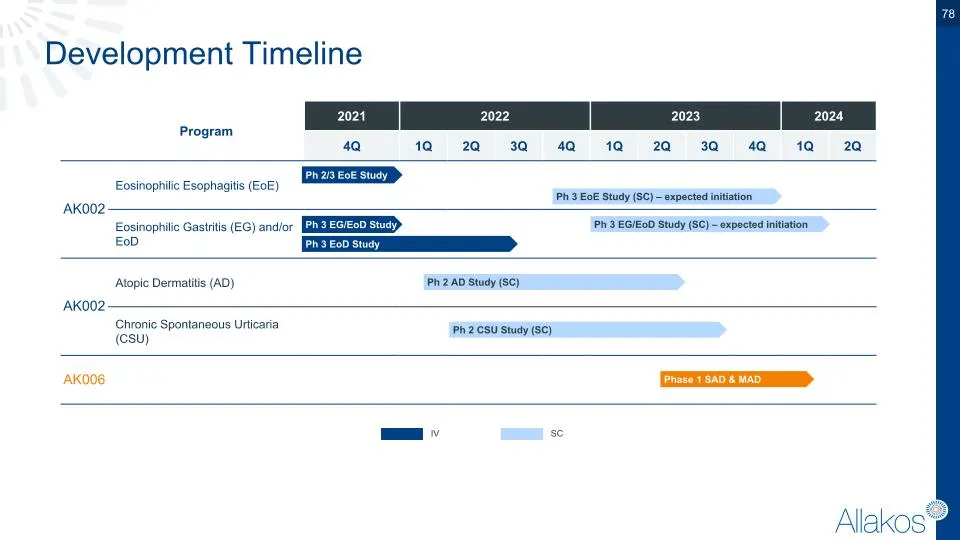
Development Timeline Program 2021 2022 2023 2024 4Q 1Q 2Q 3Q 4Q 1Q 2Q 3Q 4Q 1Q 2Q Eosinophilic Esophagitis (EoE) Eosinophilic Gastritis (EG) and/or EoD Atopic Dermatitis (AD) Chronic Spontaneous Urticaria (CSU) IV SC Ph 3 EG/EoD Study Ph 3 EoD Study Ph 3 EoE Study (SC) – expected initiation Ph 2/3 E

Slide 79: Q&A
Q&A

Slide 80: Thank You
Thank You
Slide 81: References
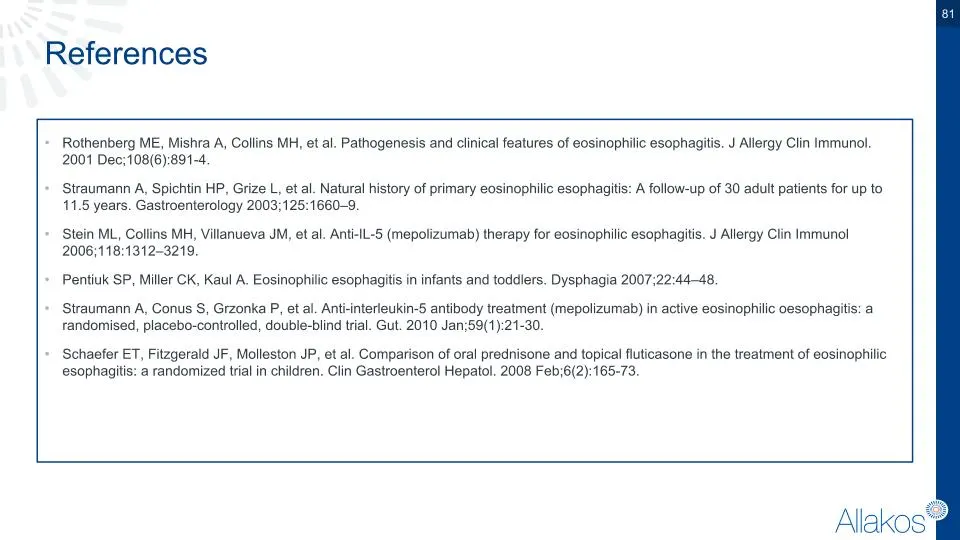
References Rothenberg ME, Mishra A, Collins MH, et al. Pathogenesis and clinical features of eosinophilic esophagitis. J Allergy Clin Immunol. 2001 Dec;108(6):891-4. Straumann A, Spichtin HP, Grize L, et al. Natural history of primary eosinophilic esophagitis: A follow-up of 30 adult patients for up
Source: SEC EDGAR · 8-K/A filed Feb 15, 2022
More decks from Allakos Inc
 Corporate Update (January 2025)13 slides · Jan 27, 2025
 Investor Presentation (October 2024)27 slides · Oct 10, 2024
 Investor Presentation (June 2024)30 slides · Jun 25, 2024
 Corporate Update (January 2024)35 slides · Jan 17, 2024
 Investor Presentation (September 2022)41 slides · Sep 19, 2022
 Investor Presentation (June 2022)53 slides · Jun 21, 2022