Trupanion, Inc. · NASDAQ:TRUP
Trupanion — Investor Presentation (April 2022)
20 slides from Trupanion's investor presentation, April 2022

Slide 1: Trupanion Investor Presentation
April 2022 Trupanion Investor Presentation

Slide 2: Forward-looking statements
This presentation contains forward-looking statements within the meaning of Section 27A of the Securities Act of 1933 and Section 21E of the Securities Exchange Act of 1934 relating to, among other things, expectations, plans, prospects and financial results for Trupanion, including, but not limited
Slide 3: Growth company
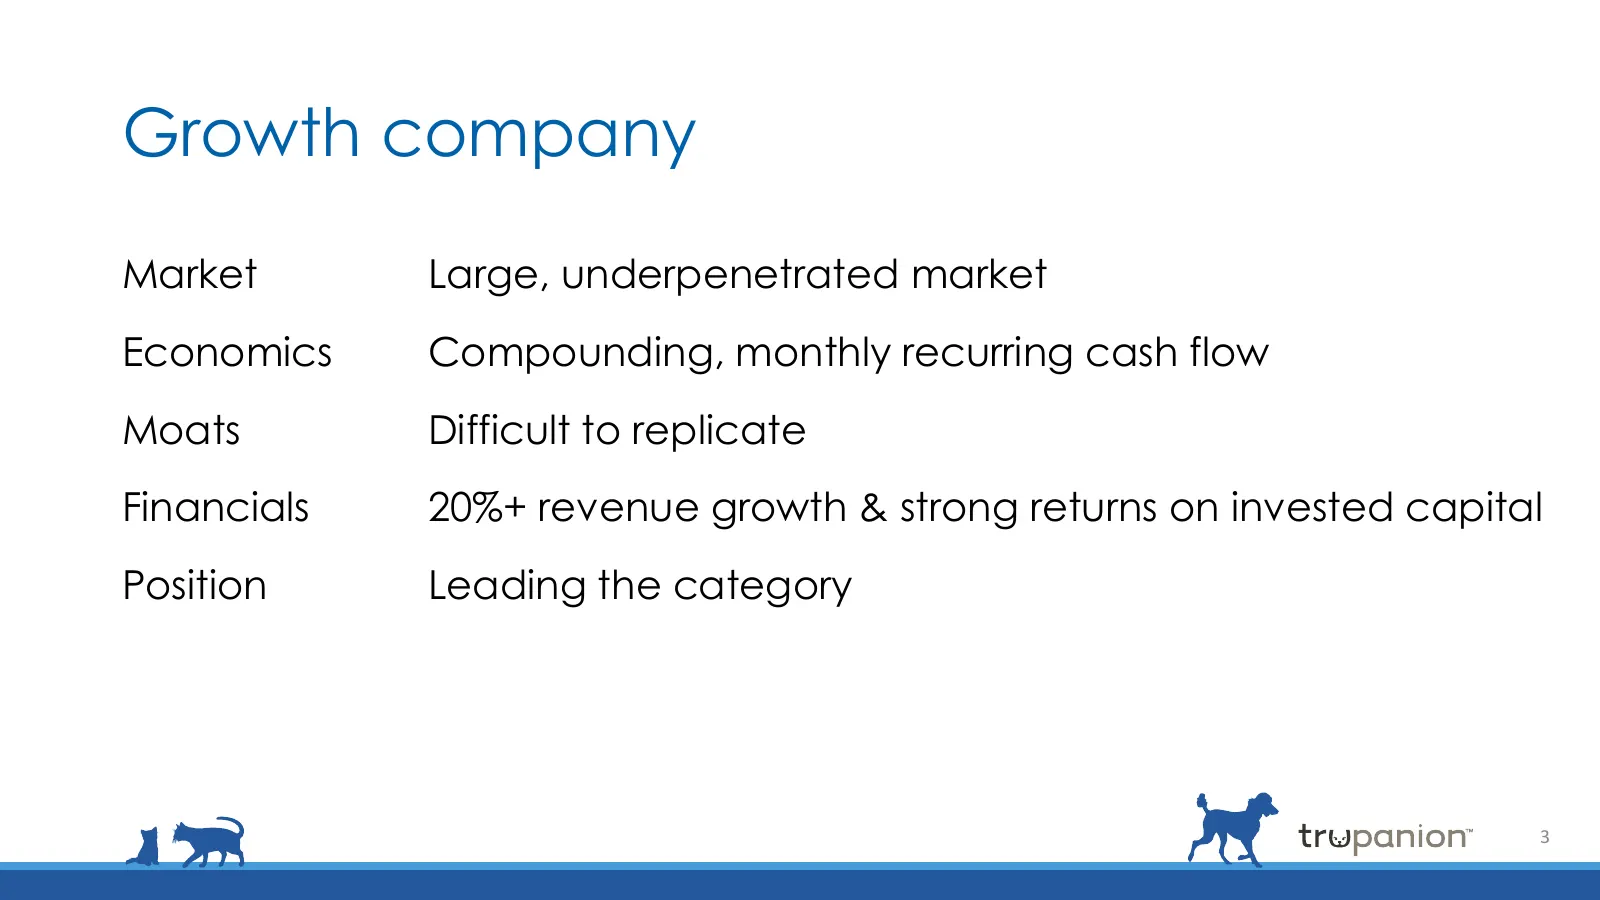
Growth company Market Large, underpenetrated market Economics Compounding, monthly recurring cash flow Moats Difficult to replicate Financials 20%+ revenue growth & strong returns on invested capital Position Leading the category 3

Slide 4: Who We Are
Who We Are Trupanion exists to help loving, responsible pet owners budget & care for their pets. 4
Slide 5: The Problem We Are Solving
The Problem We Are Solving It is very difficult for pet owners to budget for veterinary expenses if/when their pet becomes sick or injured. 5
Slide 6: Trupanion Eliminates Uncertainty Around Cost of Care
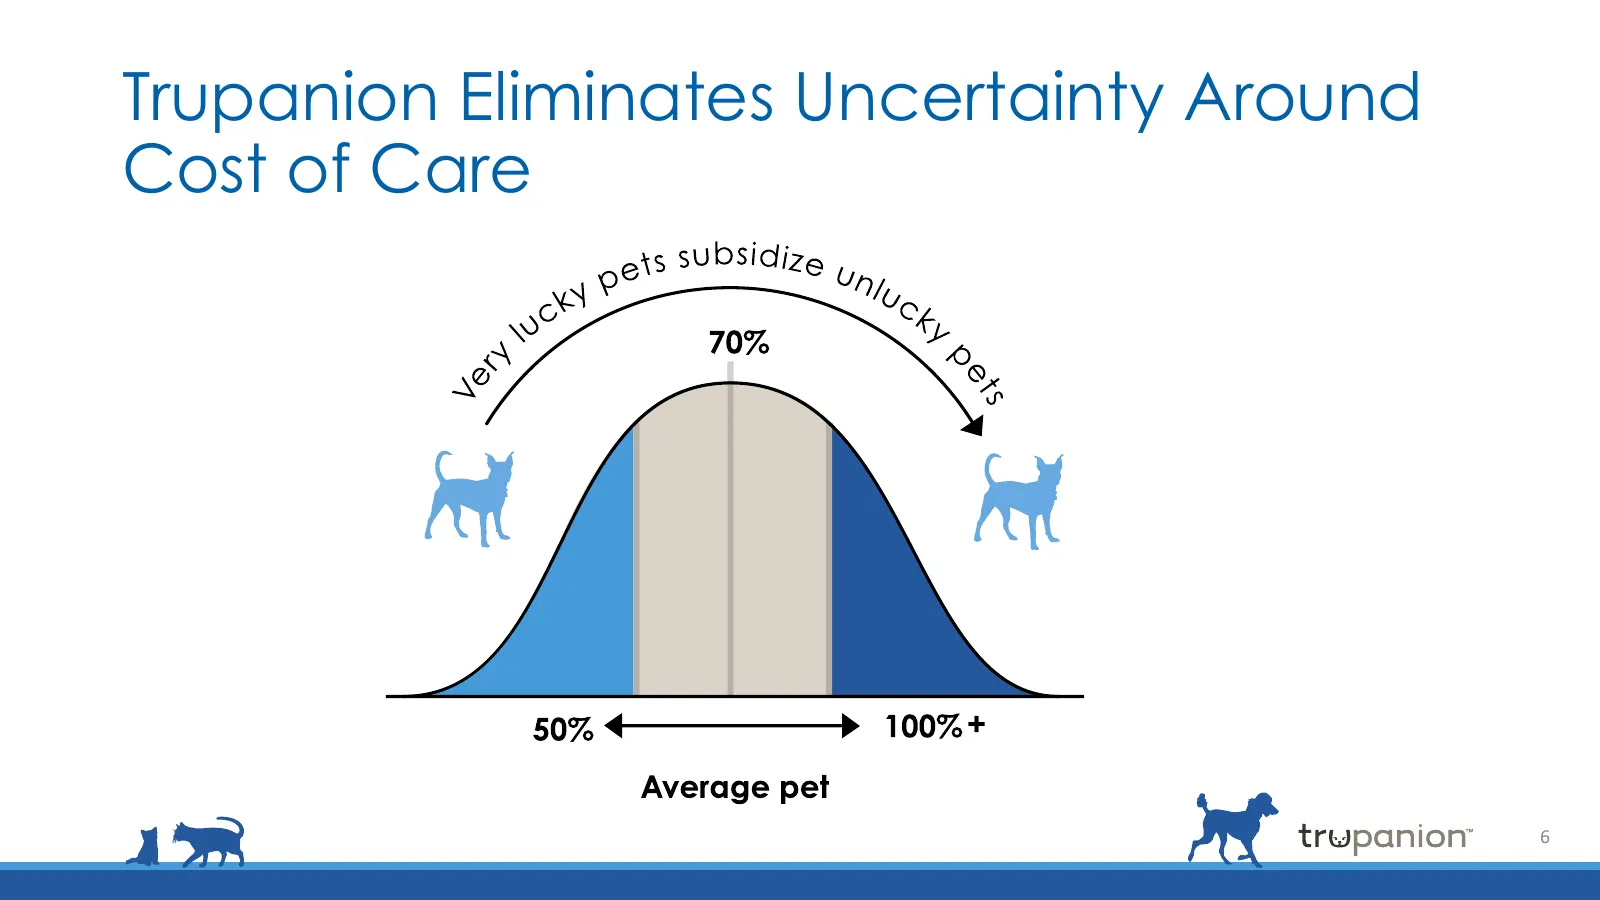
Trupanion Eliminates Uncertainty Around Cost of Care + 6
Slide 7: Why Trupanion
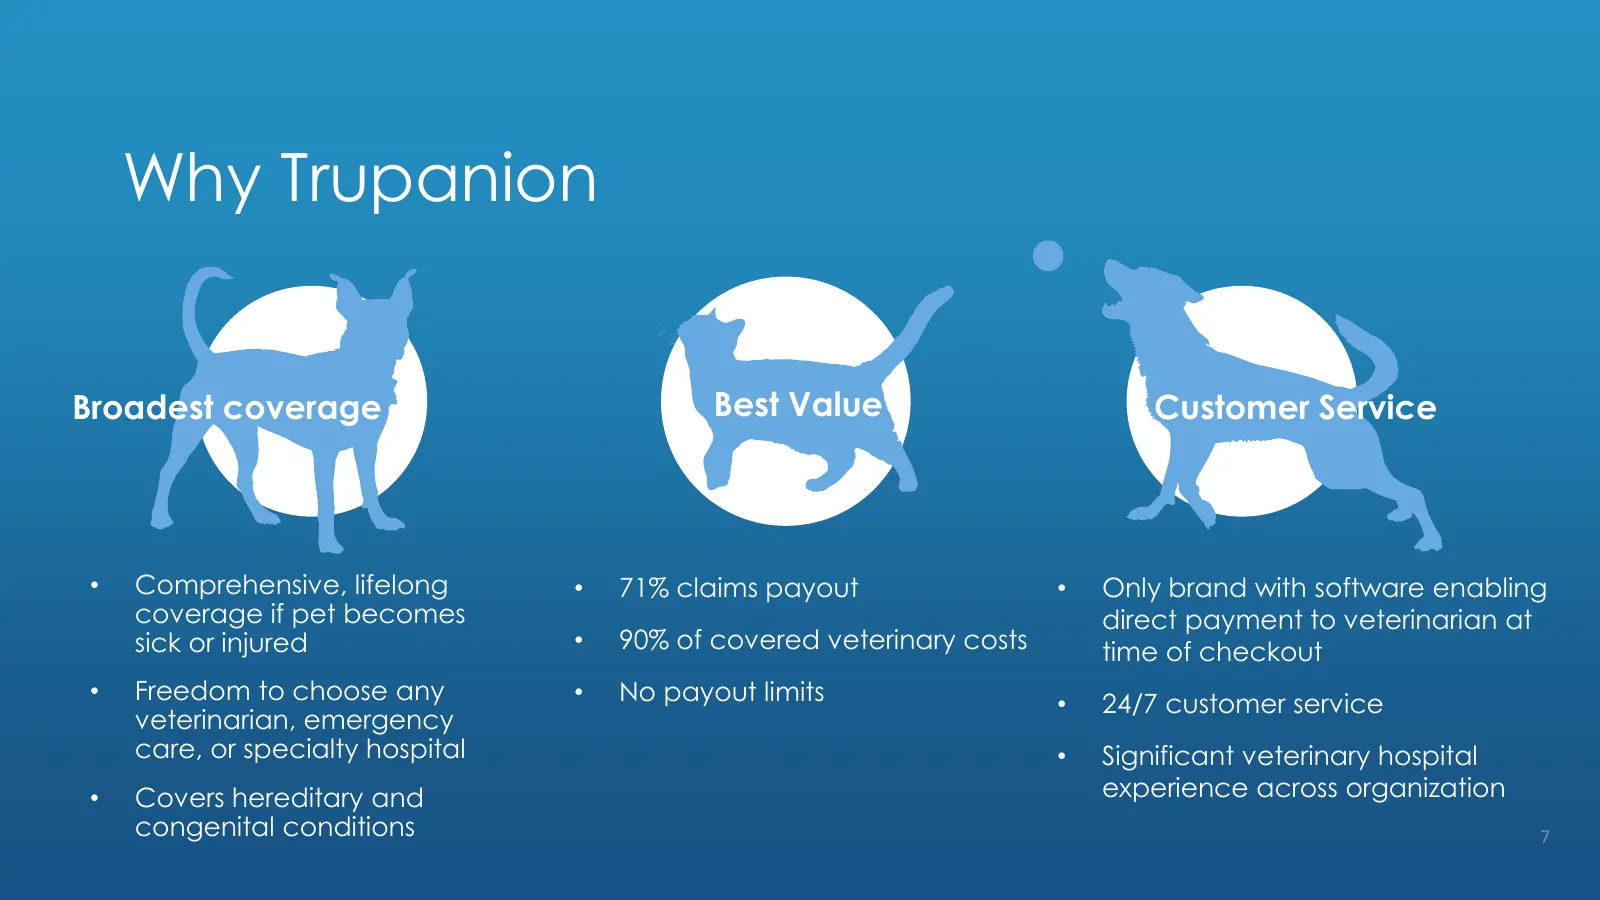
Why Trupanion Broadest coverage Best Value Customer Service • Comprehensive, lifelong • 71% claims payout • Only brand with software enabling coverage if pet becomes direct payment to veterinarian at sick or injured • 90% of covered veterinary costs time of checkout • Freedom to choose any • No payo
Slide 8: Large, Underpenetrated Market
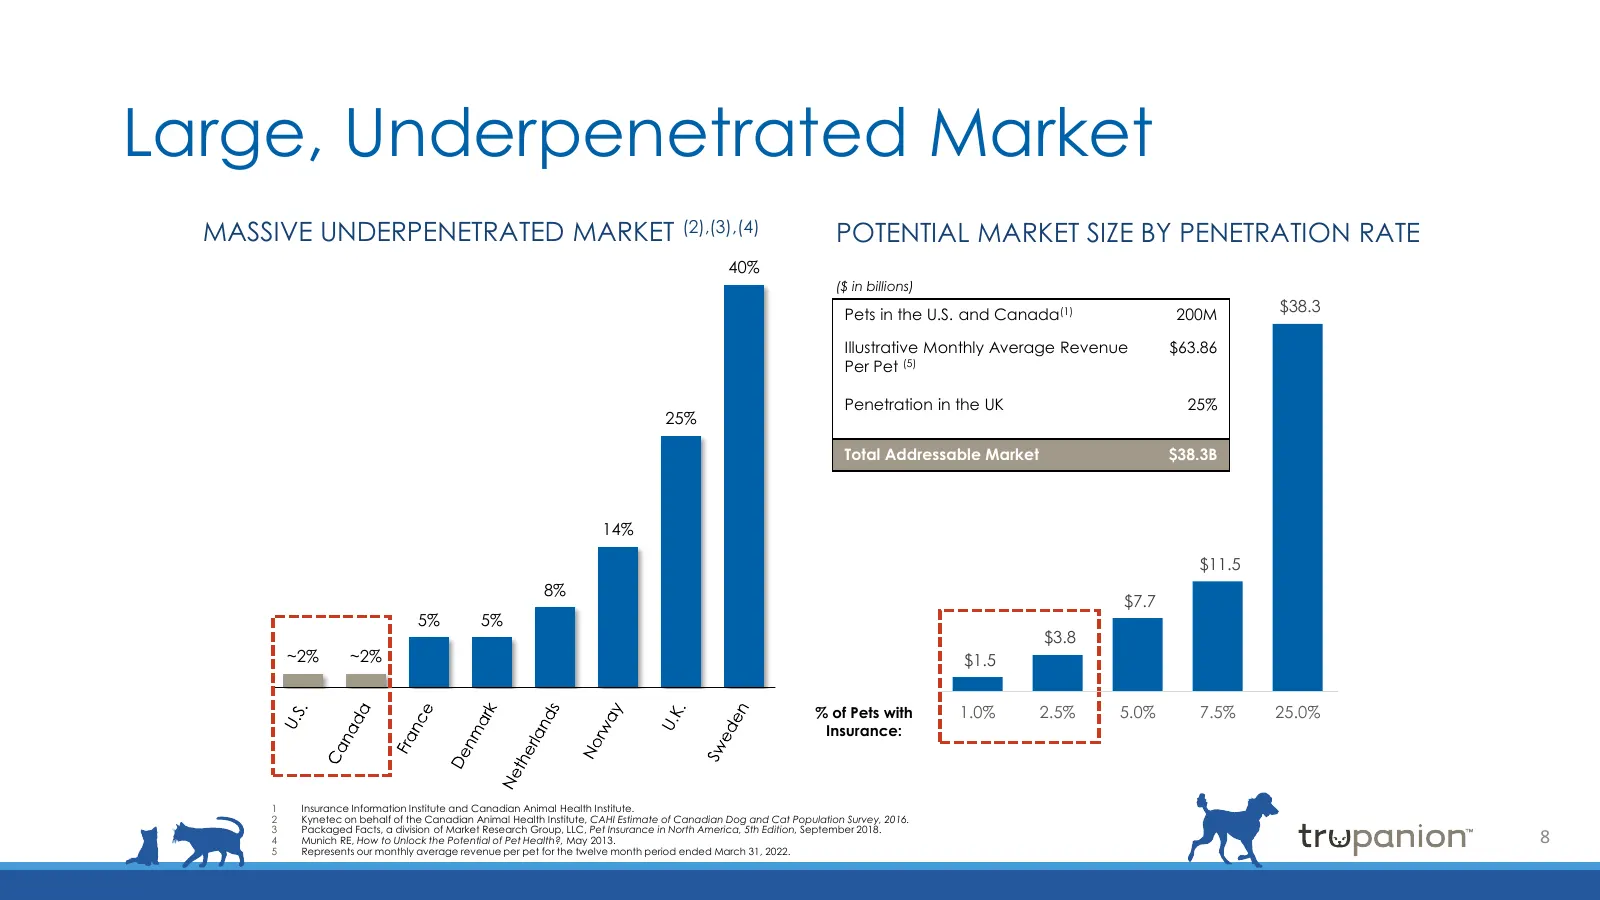
Large, Underpenetrated Market MASSIVE UNDERPENETRATED MARKET (2),(3),(4) POTENTIAL MARKET SIZE BY PENETRATION RATE 40% ($ in billions) Pets in the U.S. and Canada(1) 200M $38.3 Illustrative Monthly Average Revenue $63.86 Per Pet (5) Penetration in the UK 25% 25% Total Addressable Market $38.3B 14% $
Slide 9: Estimated Market Opportunity
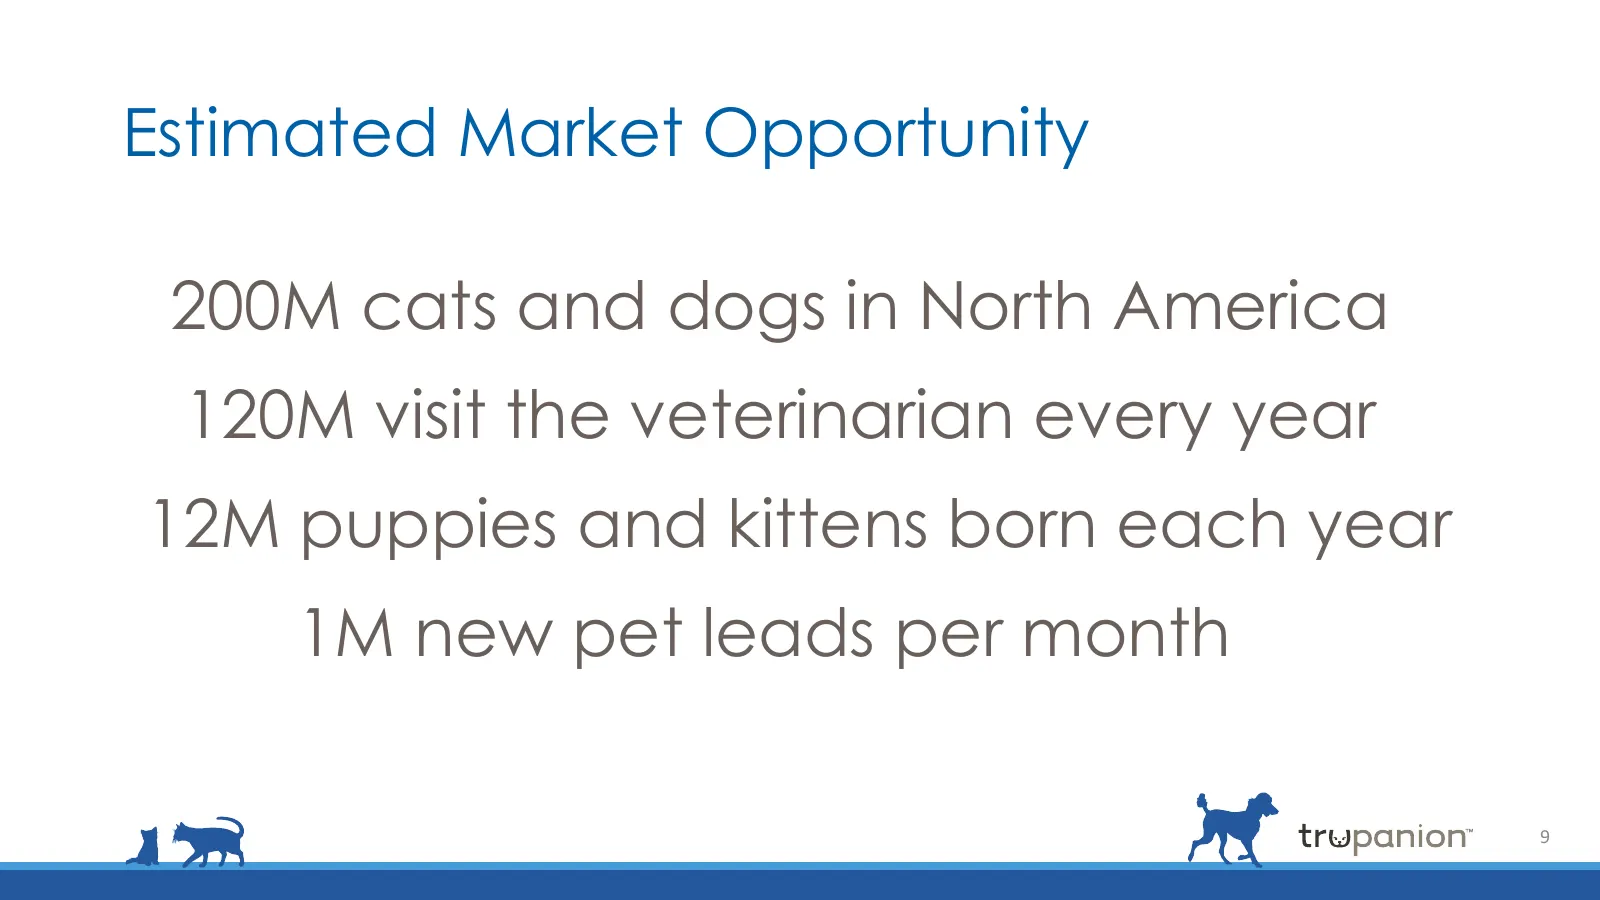
Estimated Market Opportunity 200M cats and dogs in North America 120M visit the veterinarian every year 12M puppies and kittens born each year 1M new pet leads per month 9
Slide 10: Estimated Market Opportunity
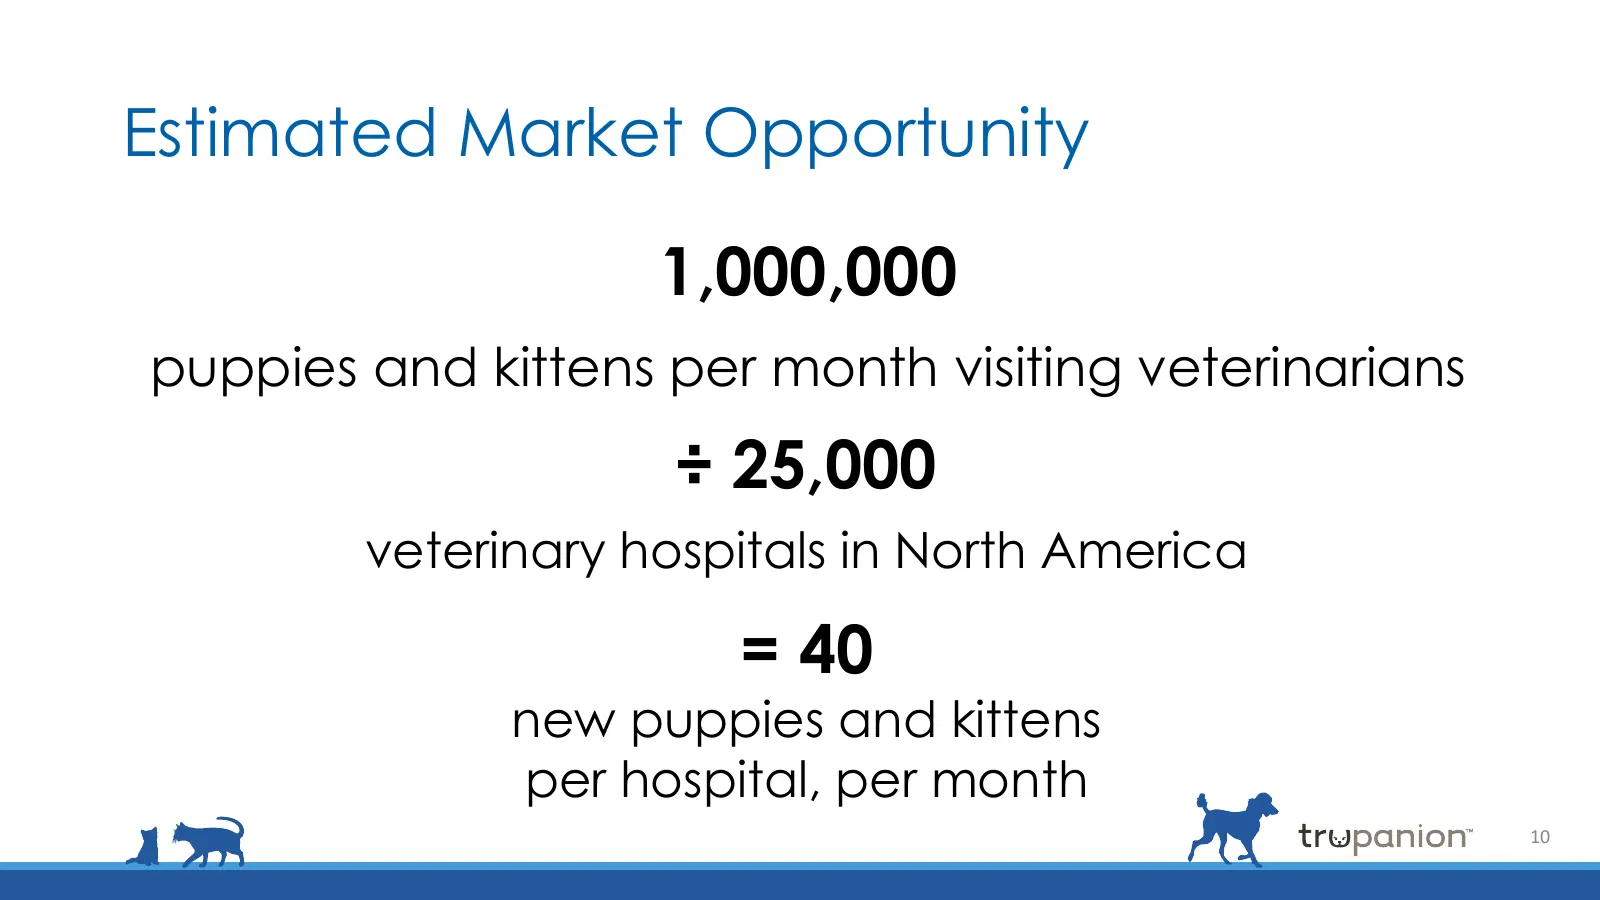
Estimated Market Opportunity 1,000,000 puppies and kittens per month visiting veterinarians ÷ 25,000 veterinary hospitals in North America = 40 new puppies and kittens per hospital, per month 10
Slide 11: Pet Medical Insurance is a growing $1B+ category!
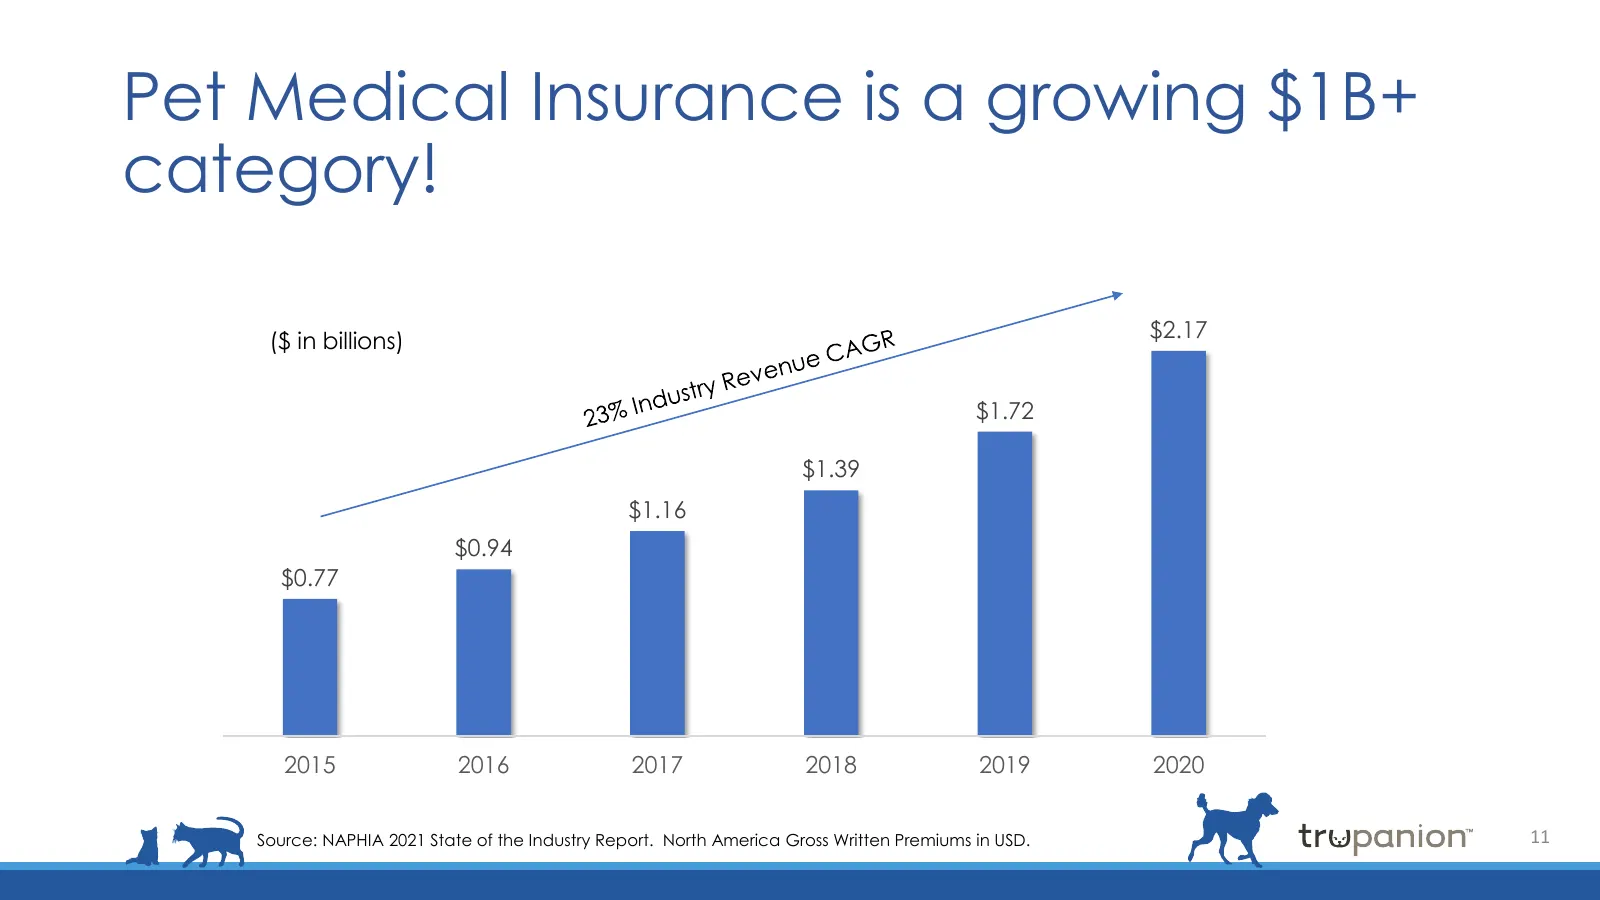
Pet Medical Insurance is a growing $1B+ category! ($ in billions) $2.17 $1.72 $1.39 $1.16 $0.94 $0.77 2015 2016 2017 2018 2019 2020 Source: NAPHIA 2021 State of the Industry Report. North America Gross Written Premiums in USD. 11
Slide 12: Trupanion is the growth leader
Trupanion is the growth leader • The industry added $450M in revenue in 2020, up from $330M in 2019 • Trupanion Inc. added 26% of the category’s growth • Total Revenue was $502M • 31% increase YoY 12
Slide 13: Defensible Moats
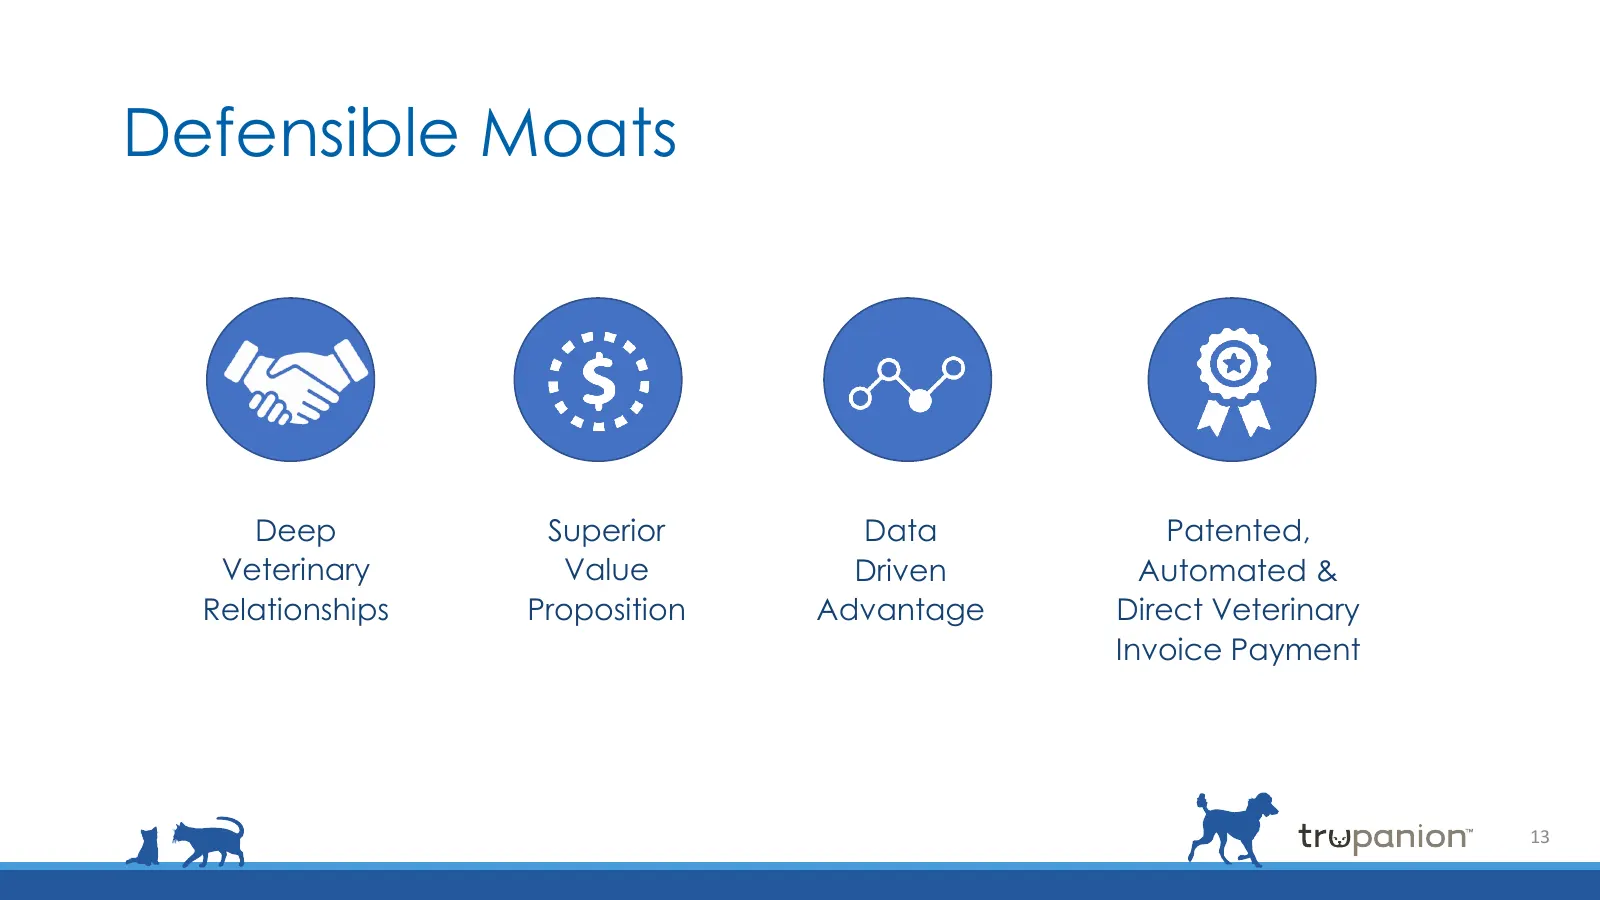
Defensible Moats Deep Superior Data Patented, Veterinary Value Driven Automated & Relationships Proposition Advantage Direct Veterinary Invoice Payment 13
Slide 14: Growth Levers
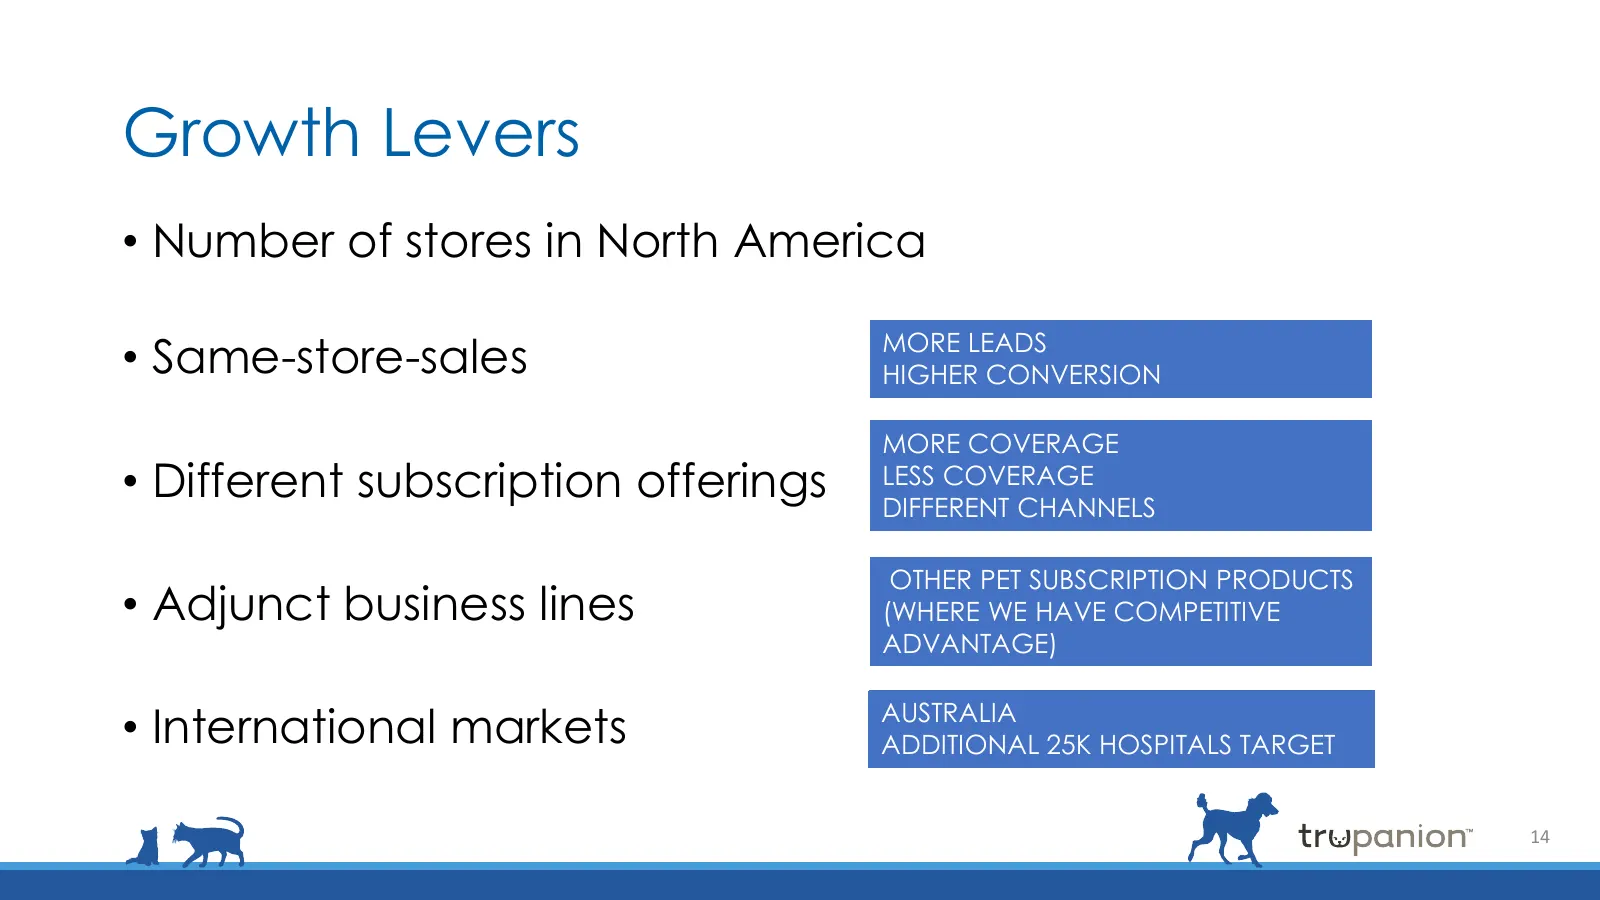
Growth Levers • Number of stores in North America MORE LEADS • Same-store-sales HIGHER CONVERSION MORE COVERAGE • Different subscription offerings LESS COVERAGE DIFFERENT CHANNELS OTHER PET SUBSCRIPTION PRODUCTS • Adjunct business lines (WHERE WE HAVE COMPETITIVE ADVANTAGE) • International markets A
Slide 15: Total Revenue Growth
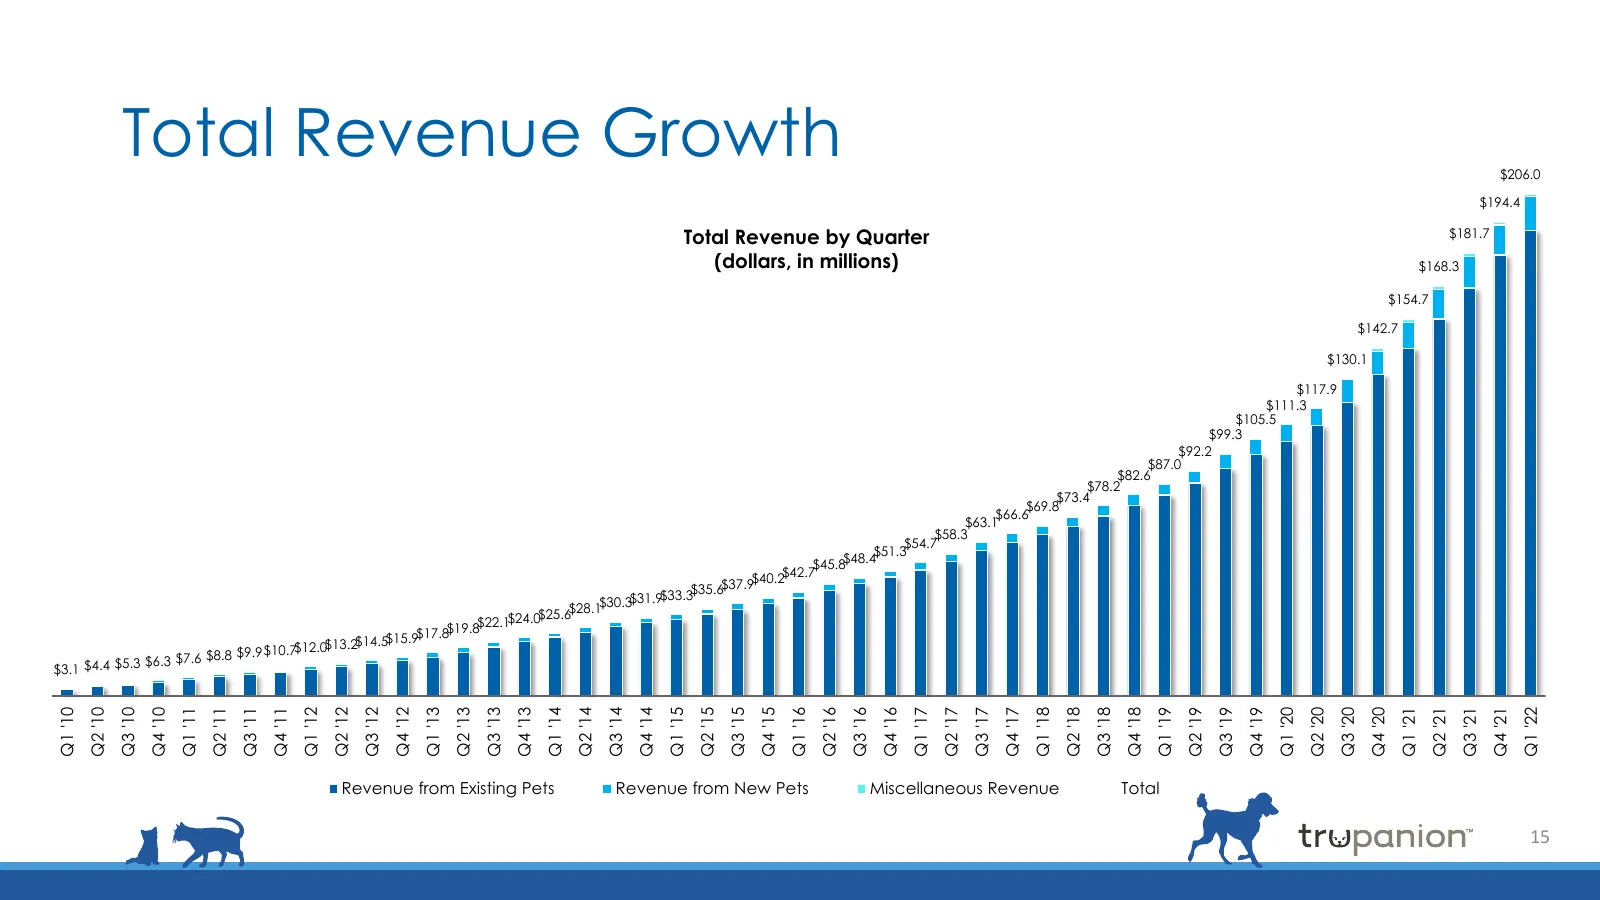
Total Revenue Growth $206.0 $194.4 Total Revenue by Quarter $181.7 (dollars, in millions) $168.3 $154.7 $142.7 $130.1 $117.9 $111.3 $105.5 $99.3 $92.2 $87.0 $82.6 $78.2 $73.4 $69.8 $66.6 $63.1 $58.3 $54.7 $51.3 $45.8$48.4 $40.2$42.7 $37.9 $33.3$35.6 $28.1$30.3$31.9 $24.0$25.6 $17.8$19.8$22.1 $15.9 $
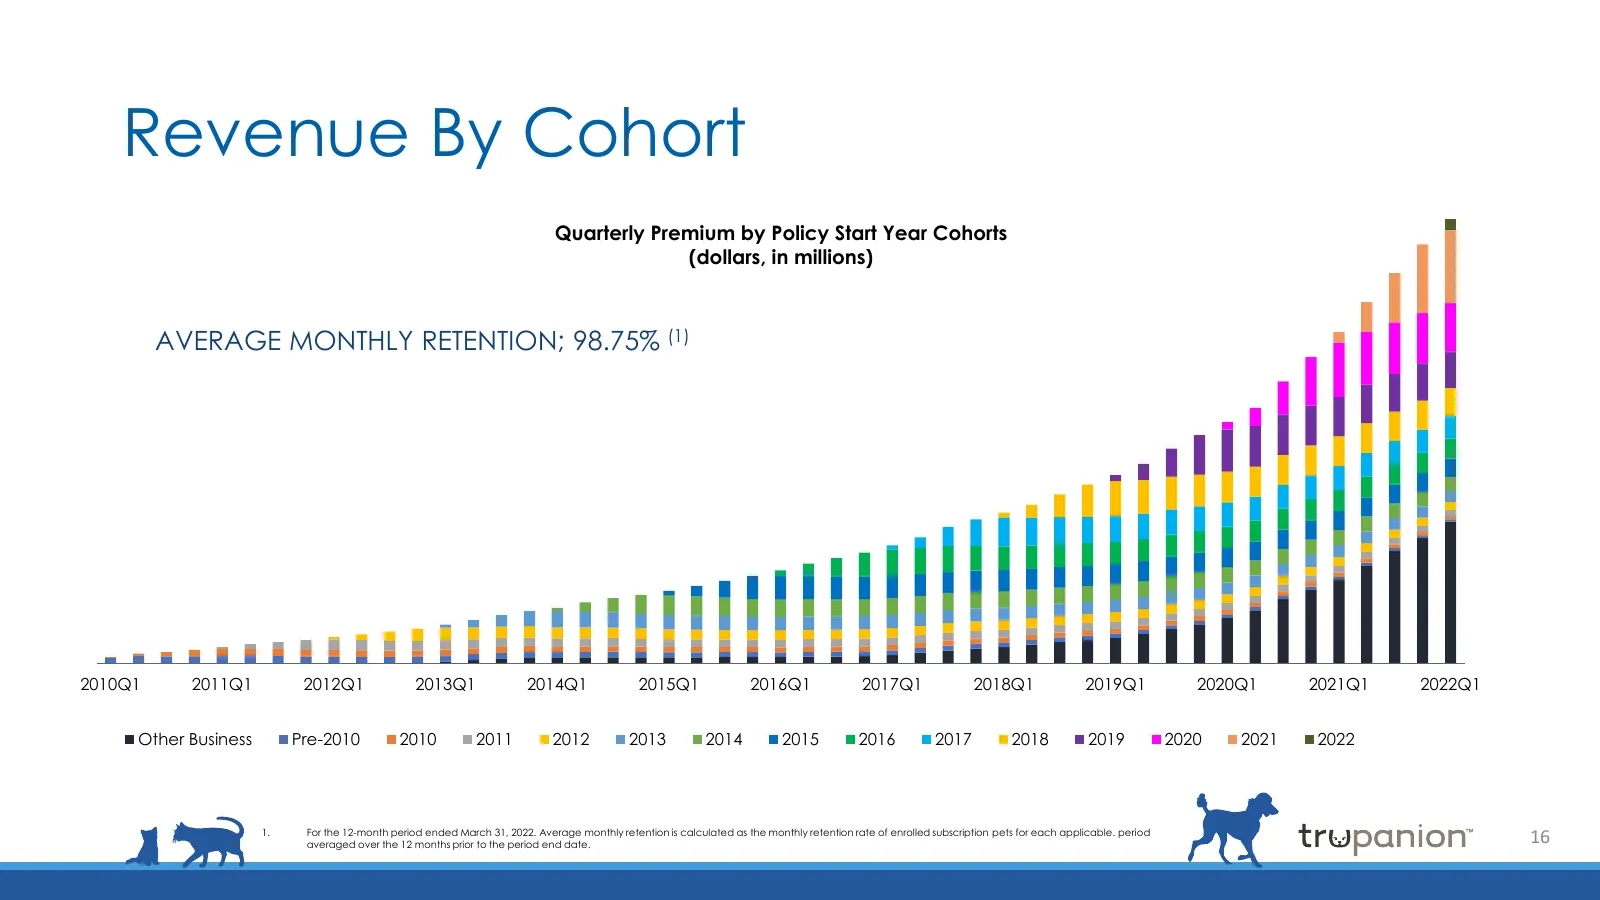
Slide 16: Revenue By Cohort
Revenue By Cohort Quarterly Premium by Policy Start Year Cohorts (dollars, in millions) AVERAGE MONTHLY RETENTION; 98.75% (1) 2010Q1 2011Q1 2012Q1 2013Q1 2014Q1 2015Q1 2016Q1 2017Q1 2018Q1 2019Q1 2020Q1 2021Q1 2022Q1 Other Business Pre-2010 2010 2011 2012 2013 2014 2015 2016 2017 2018 2019 2020 2021
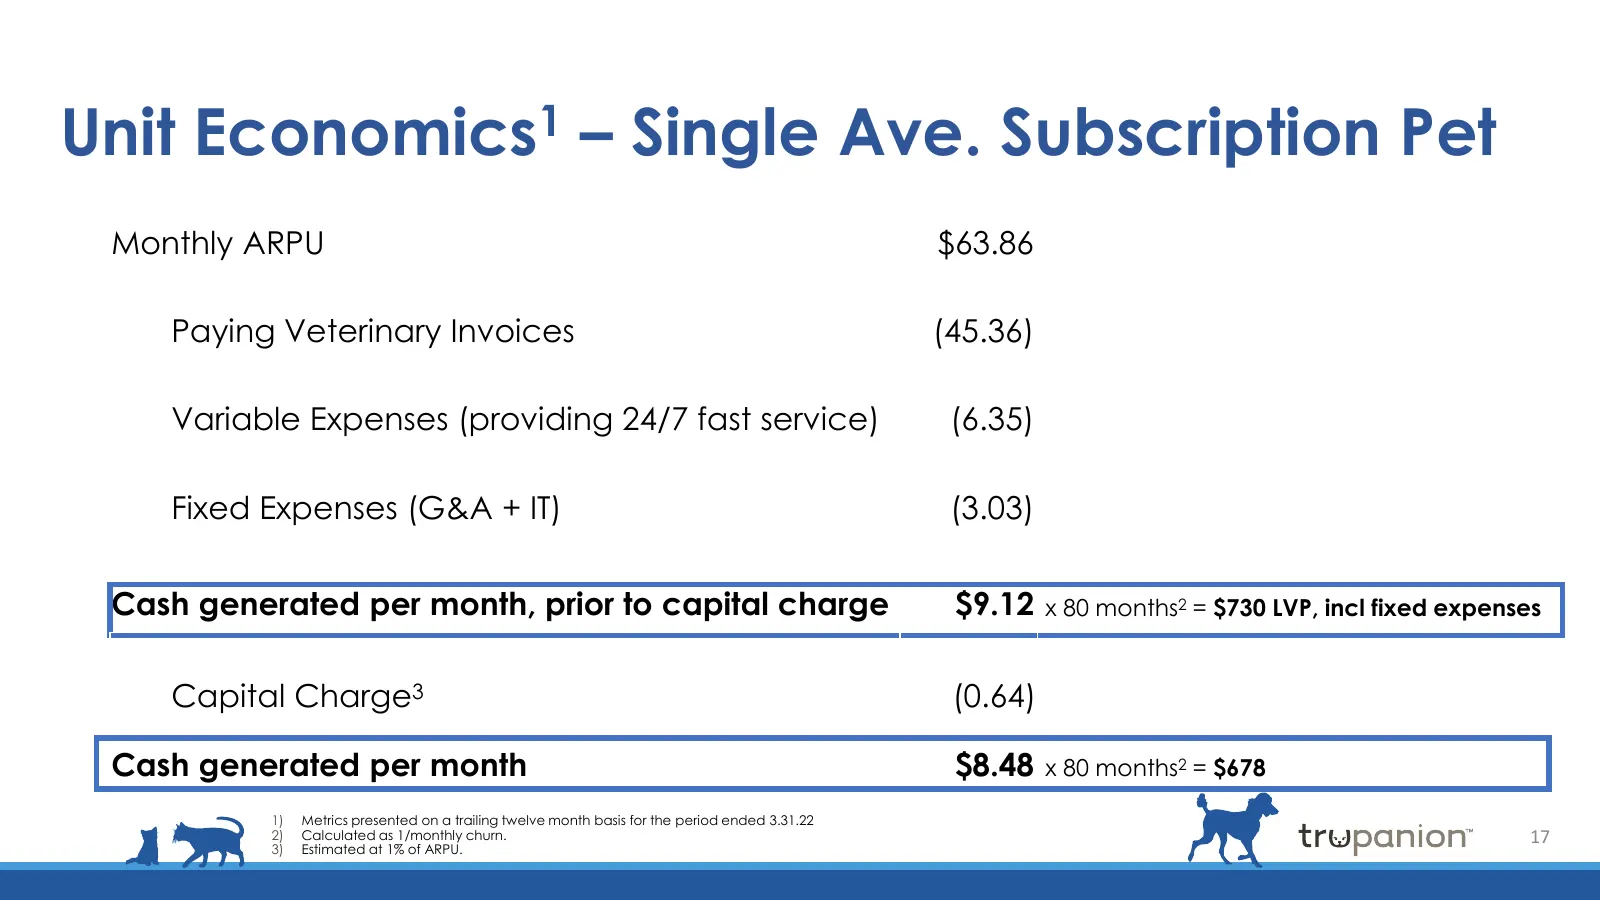
Slide 17: Unit Economics – Single Ave. Subscription Pet
Unit Economics1 – Single Ave. Subscription Pet Monthly ARPU $63.86 Paying Veterinary Invoices (45.36) Variable Expenses (providing 24/7 fast service) (6.35) Fixed Expenses (G&A + IT) (3.03) Cash generated per month, prior to capital charge $9.12 x 80 months2 = $730 LVP, incl fixed expenses Capital C
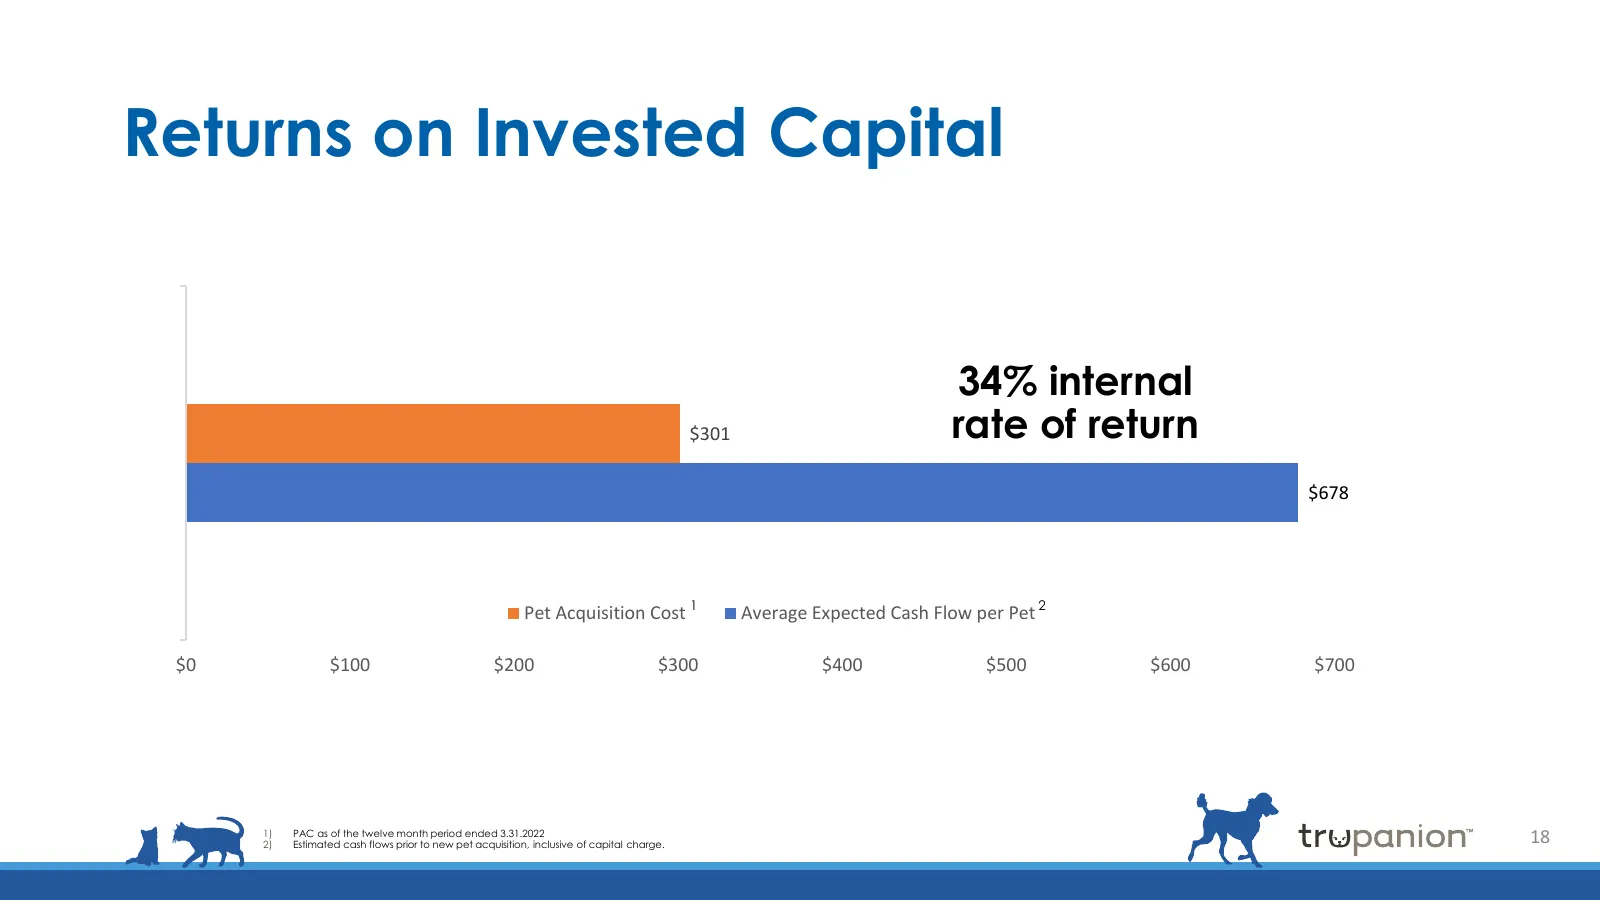
Slide 18: Returns on Invested Capital
Returns on Invested Capital Q 34% internal 1 ' $301 rate of return 2 2 $678 Pet Acquisition Cost 1 Average Expected Cash Flow per Pet 2 $0 $100 $200 $300 $400 $500 $600 $700 1) PAC as of the twelve month period ended 3.31.2022 2) Estimated cash flows prior to new pet acquisition, inclusive of capita
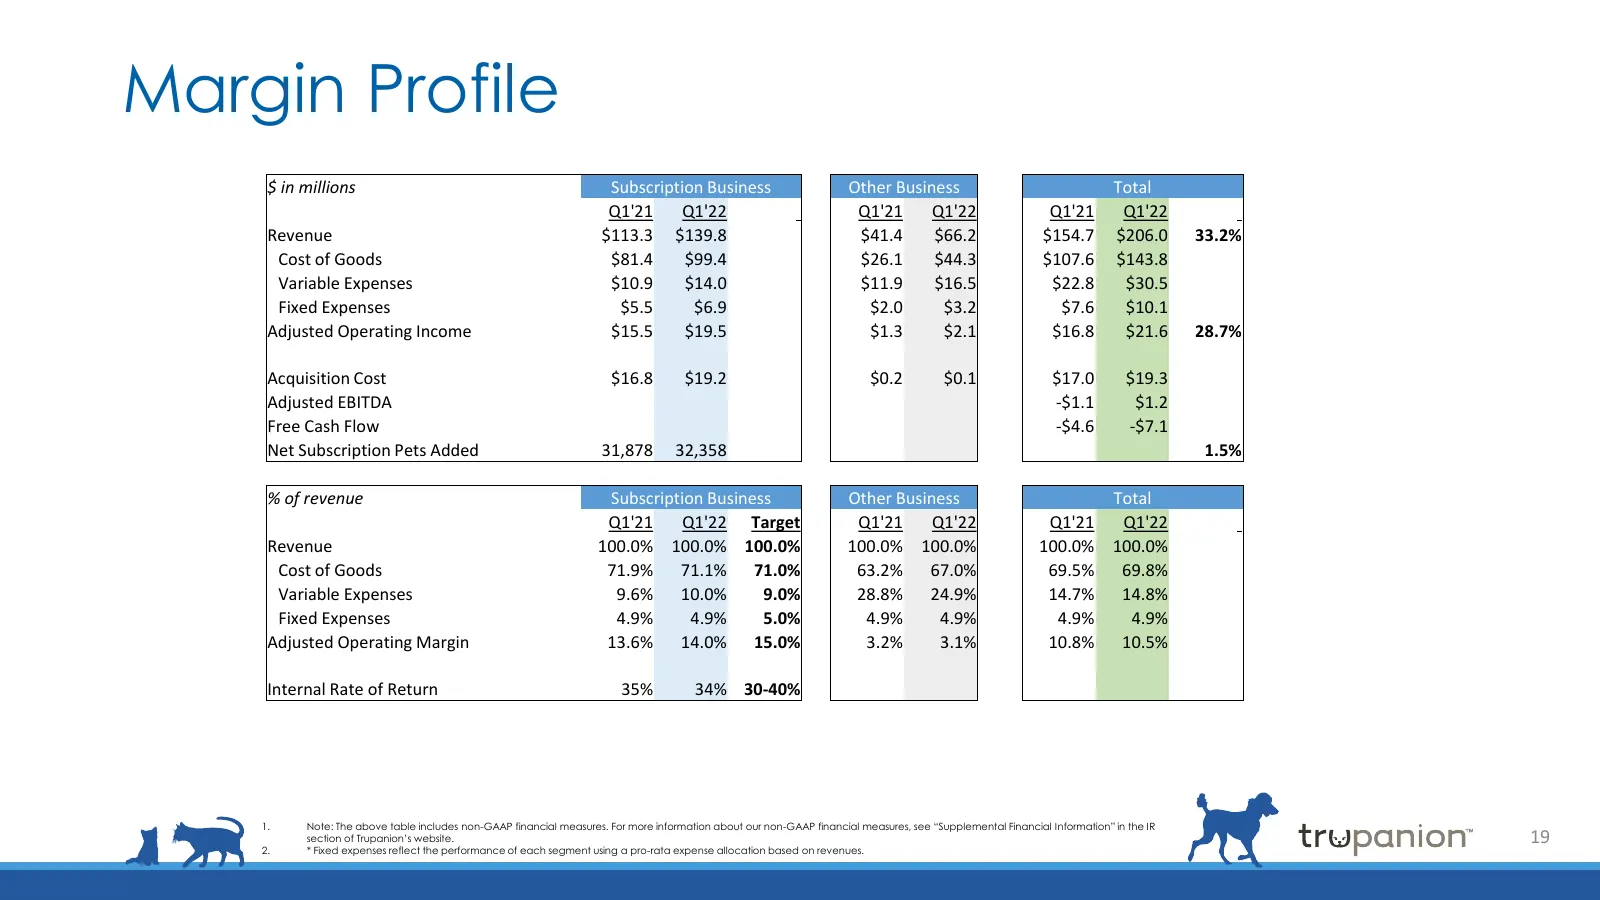
Slide 19: Margin Profile
Margin Profile $ in millions Subscription Business Other Business Total Q1'21 Q1'22 Q1'21 Q1'22 Q1'21 Q1'22 Revenue $113.3 $139.8 $41.4 $66.2 $154.7 $206.0 33.2% Cost of Goods $81.4 $99.4 $26.1 $44.3 $107.6 $143.8 Variable Expenses $10.9 $14.0 $11.9 $16.5 $22.8 $30.5 Fixed Expenses $5.5 $6.9 $2.0 $3

Slide 20: Questions?
Questions? Thank you.
Source: Internet Archive copy of s29.q4cdn.com
More decks from Trupanion, Inc.
 Investor Presentation (August 2026)28 slides · August 2026
 Q1 2026 Earnings Presentation18 slides · Apr 30, 2026
 Q4 2025 Earnings Presentation10 slides · Feb 12, 2026
 Q3 2025 Earnings Presentation10 slides · Nov 6, 2025
 Investor Day (September 2025)85 slides · Sep 17, 2025
 Q1 2025 Earnings Presentation9 slides · May 1, 2025