Florida East Coast Industries Inc
Florida East Coast Industries — Investor Presentation (February 2004)
41 slides from Florida East Coast Industries's investor presentation, Feb 12, 2004
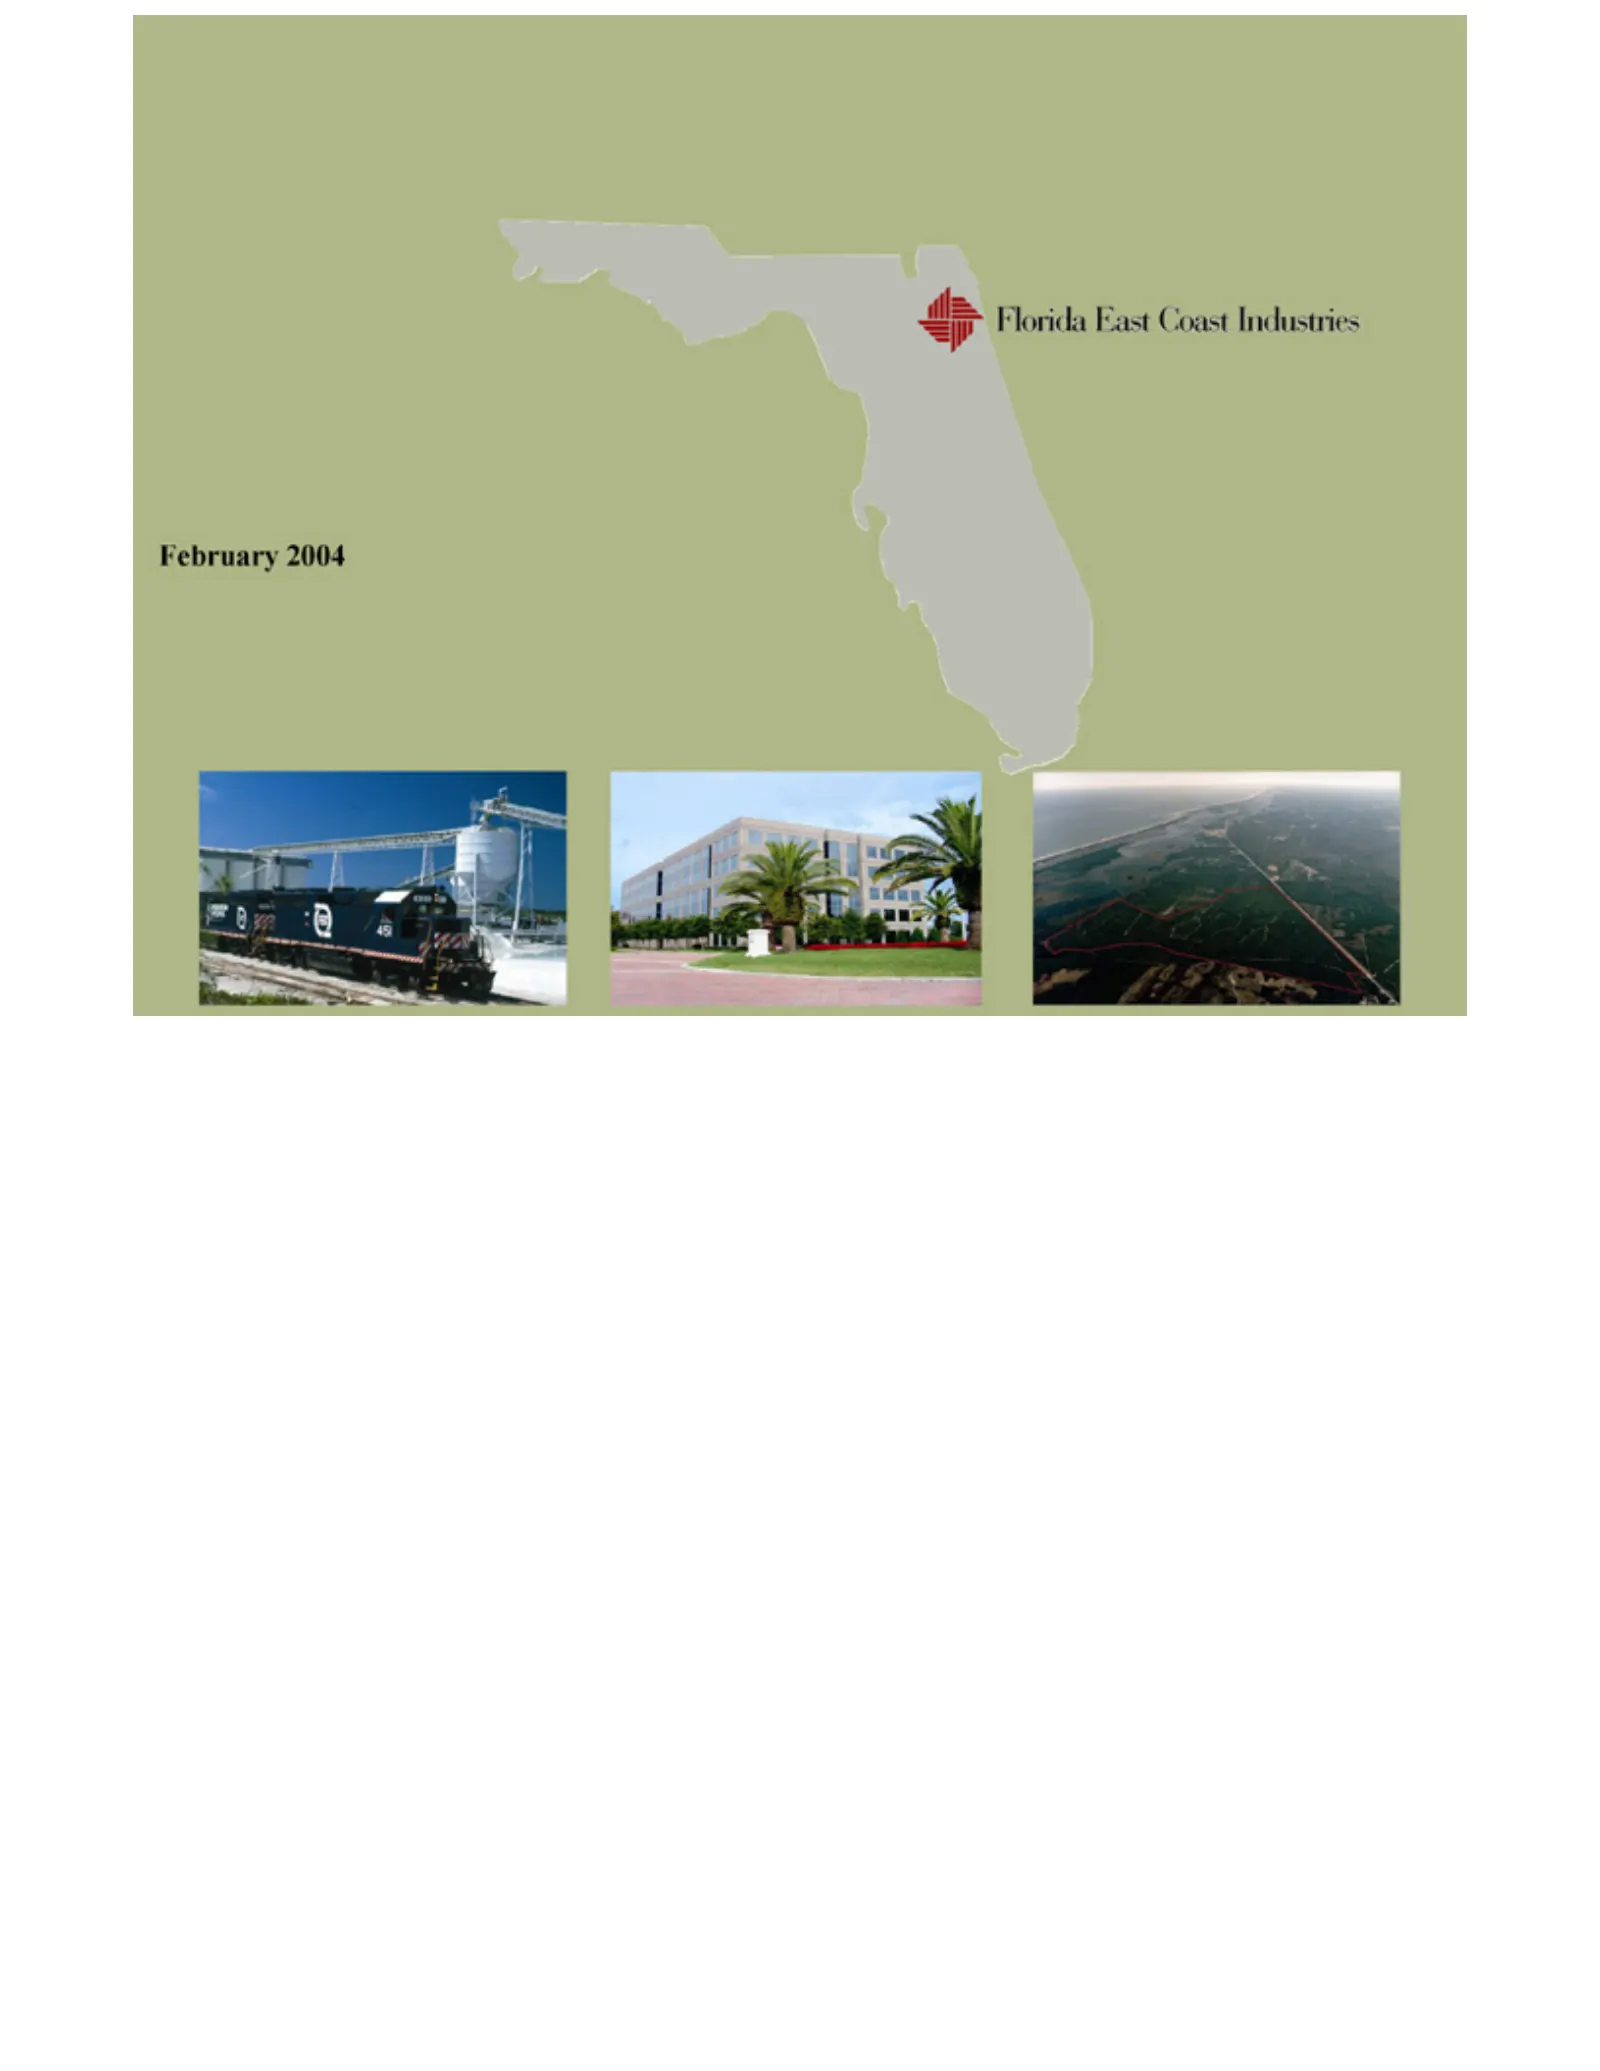
Slide 1: Florida East Coast Industries February 2004
Florida East February 2004Coast Industries
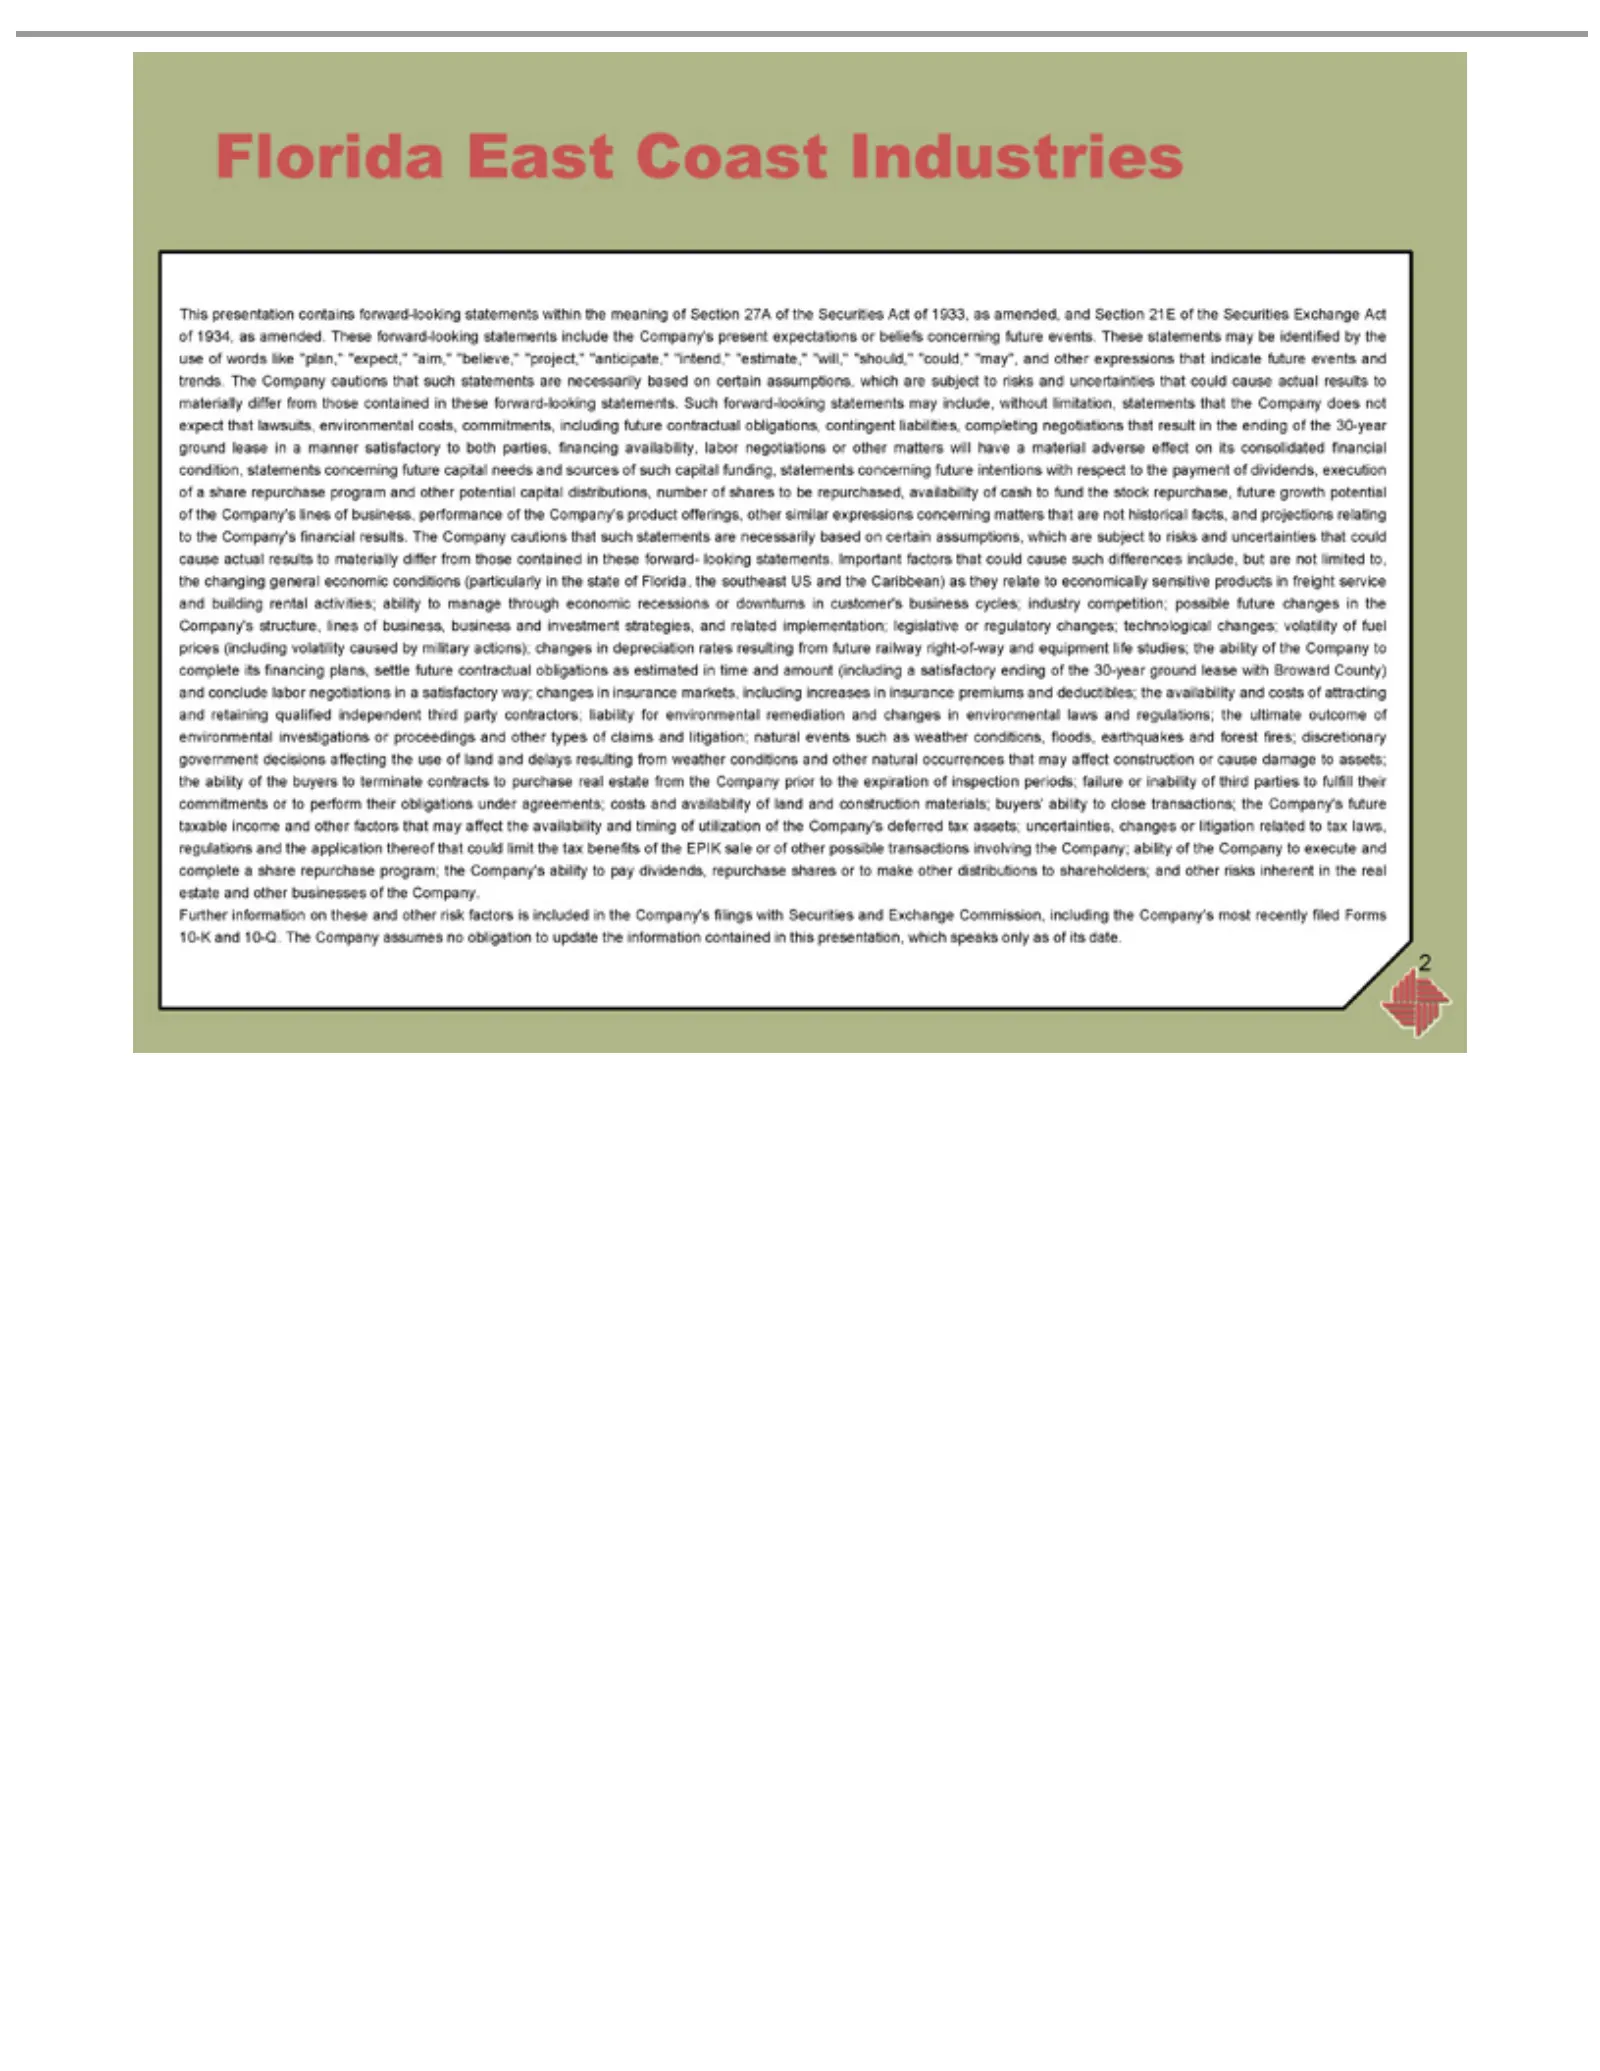
Slide 2: Forward-looking statements
Florida This amended. “expect,” such looking contractual negotiations concerning availability matters subject include, freight volatility settle satisfactory contractors; and as may inability Company’s regulations share the Further The 2 weather Company. litigation; Company affect presentation state
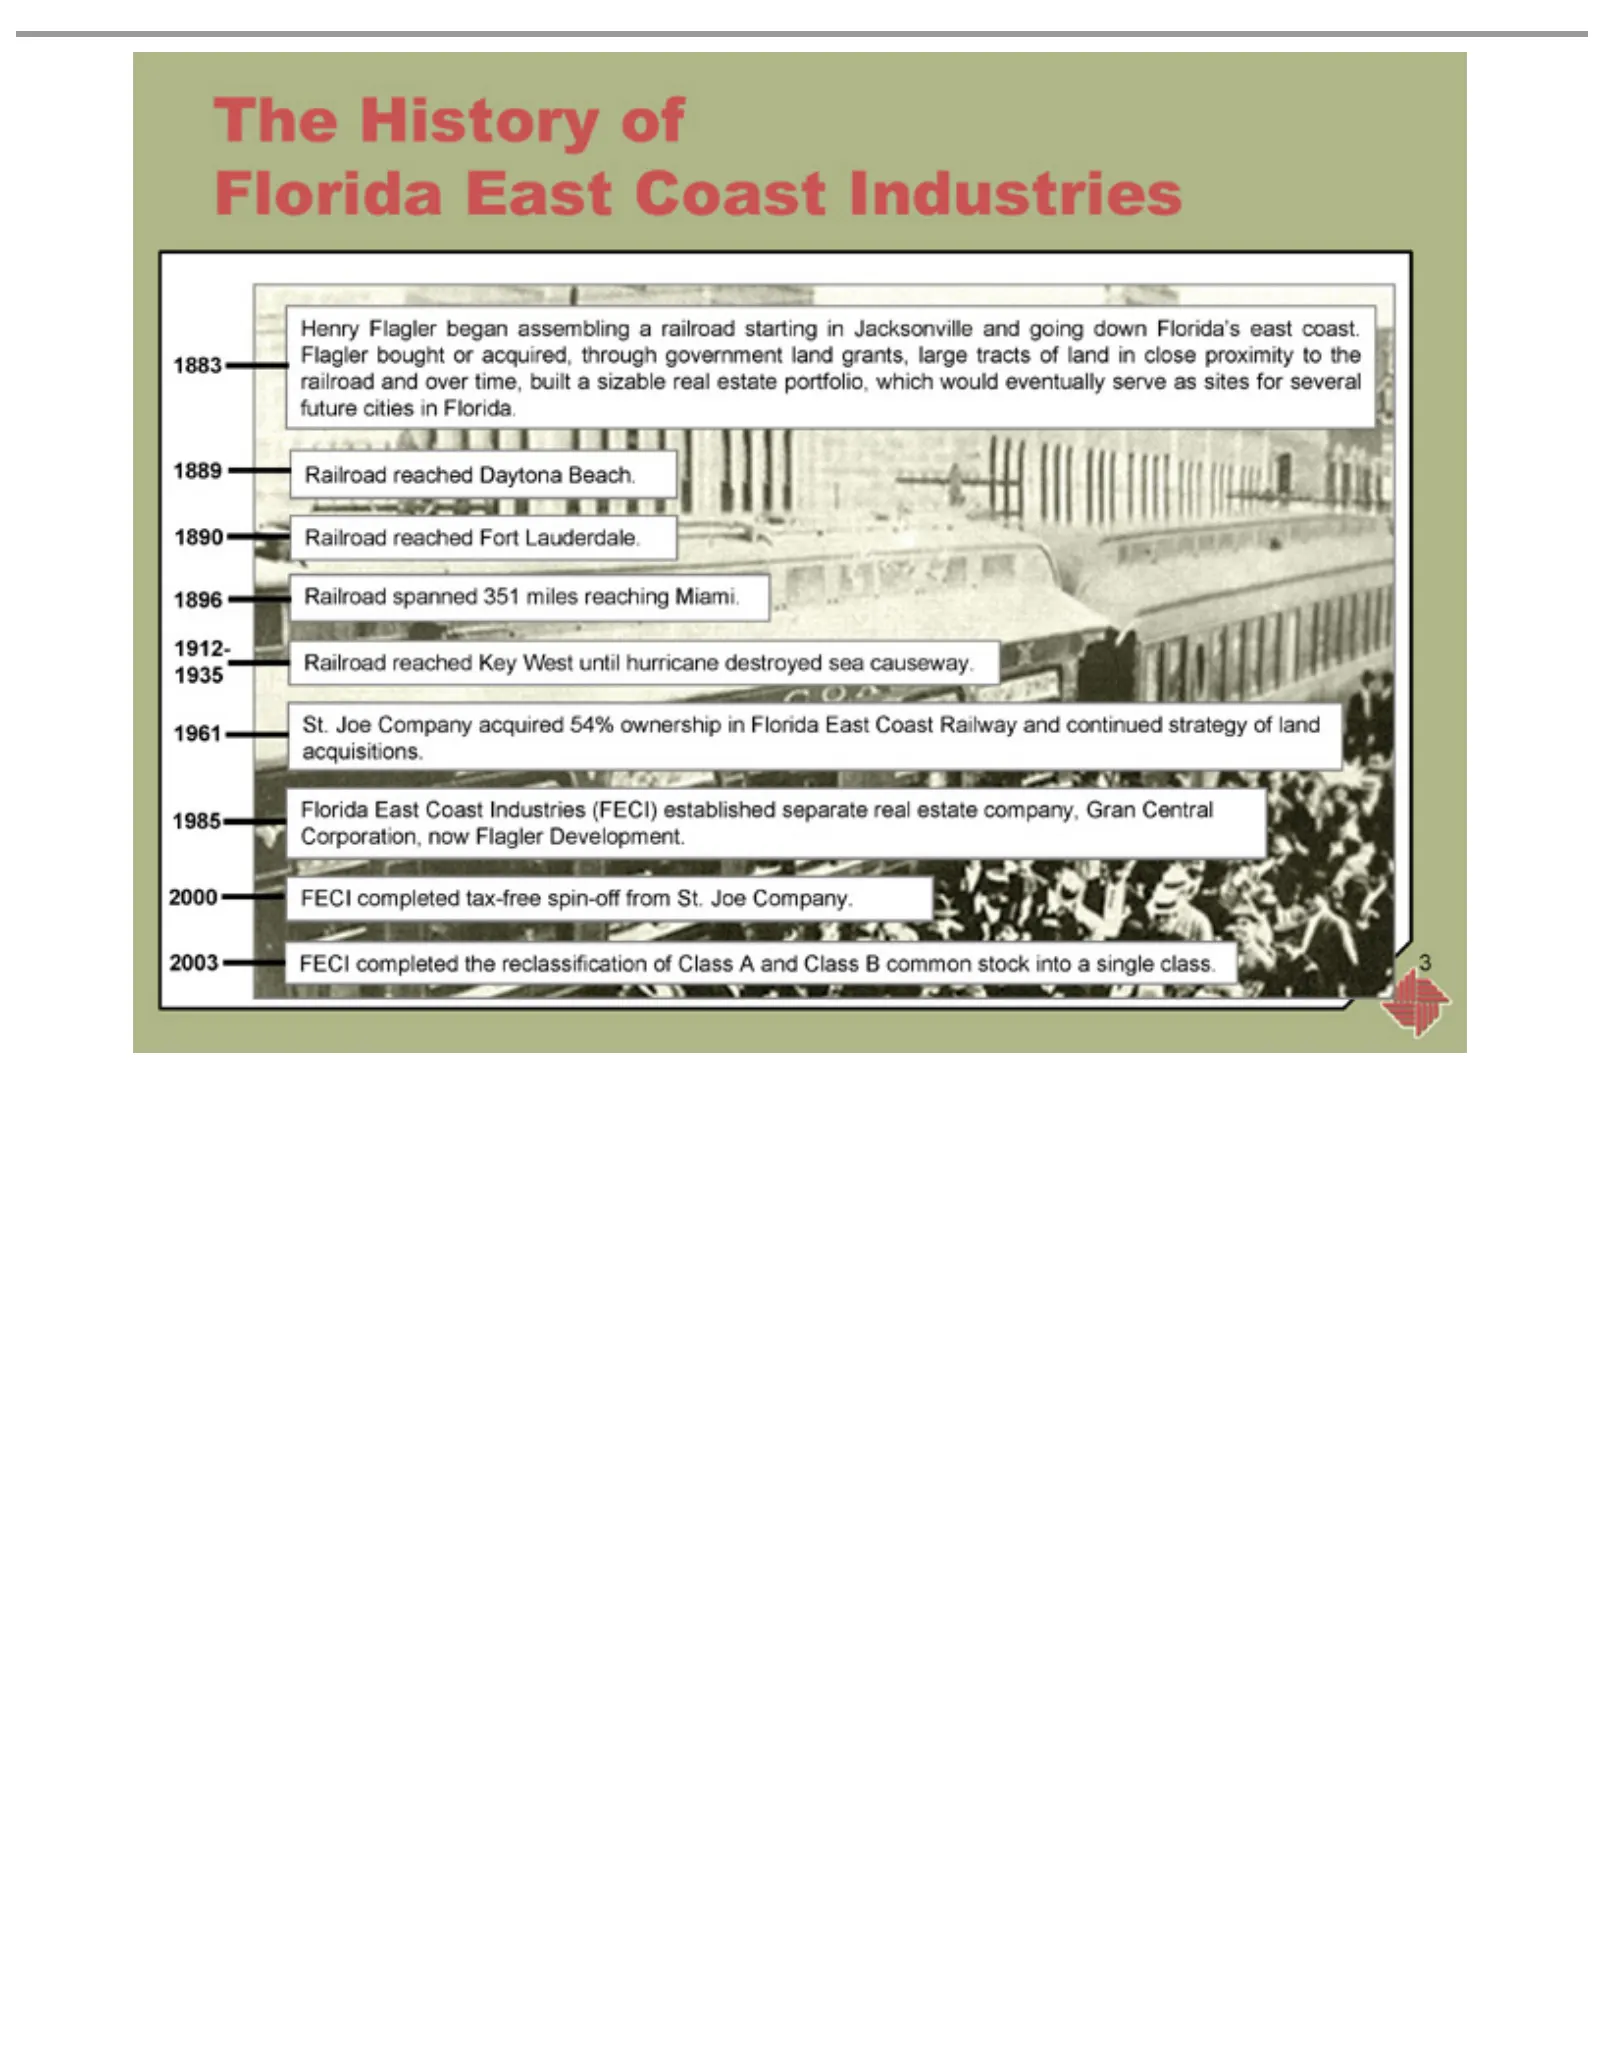
Slide 3: History
TheJoe Henry 1883 proximity 1889 1890 1896 Railroad 1912-1935 St. 1961 Florida 1985 2000 FECI 2003 3 History completed Flagler Company East spanned reached to of Coast the began railroad tax-free the Daytona Fort Key acquired 351 Industries reclassification assembling West Lauderdale. miles and spin
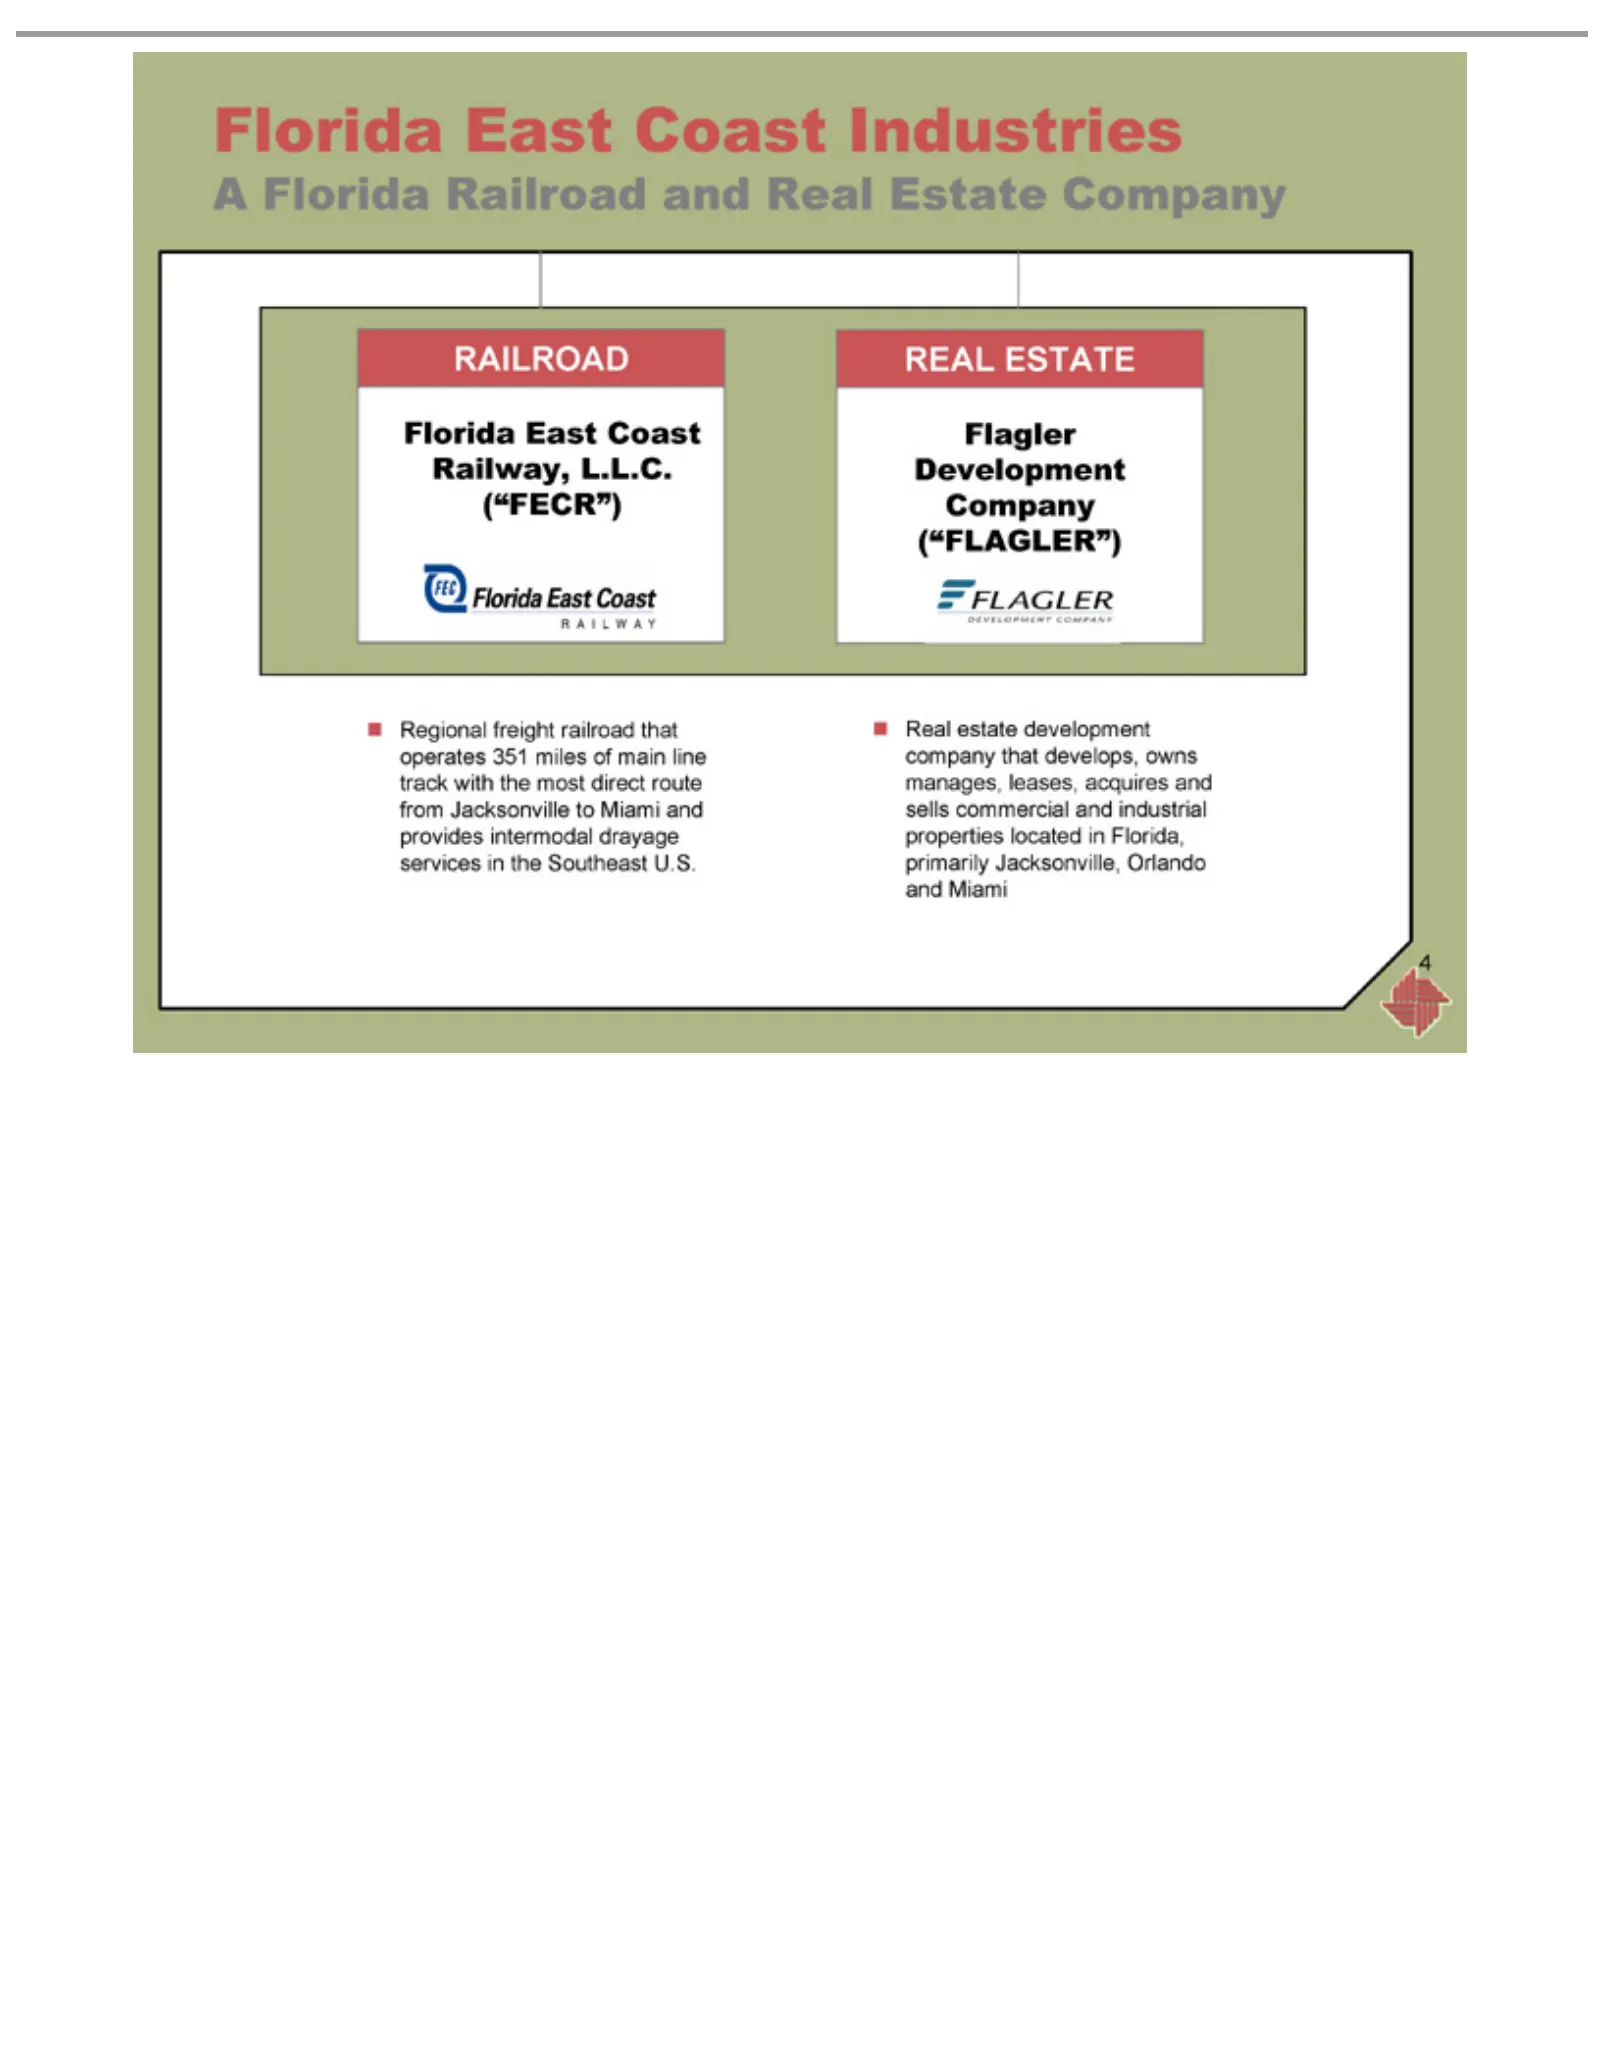
Slide 4: A Florida railroad and a Florida real estate company
A Florida Florida RAILROAD Regional (“FECR”) REAL Flagler Real 4 estate ESTATE Development East freight Railroad development Coast railroad Industries Railway, andCompany Real company thatL.L.C. Estate operates (“FLAGLER”) that Company 351 develops, miles of owns main manages, line track leases, wit
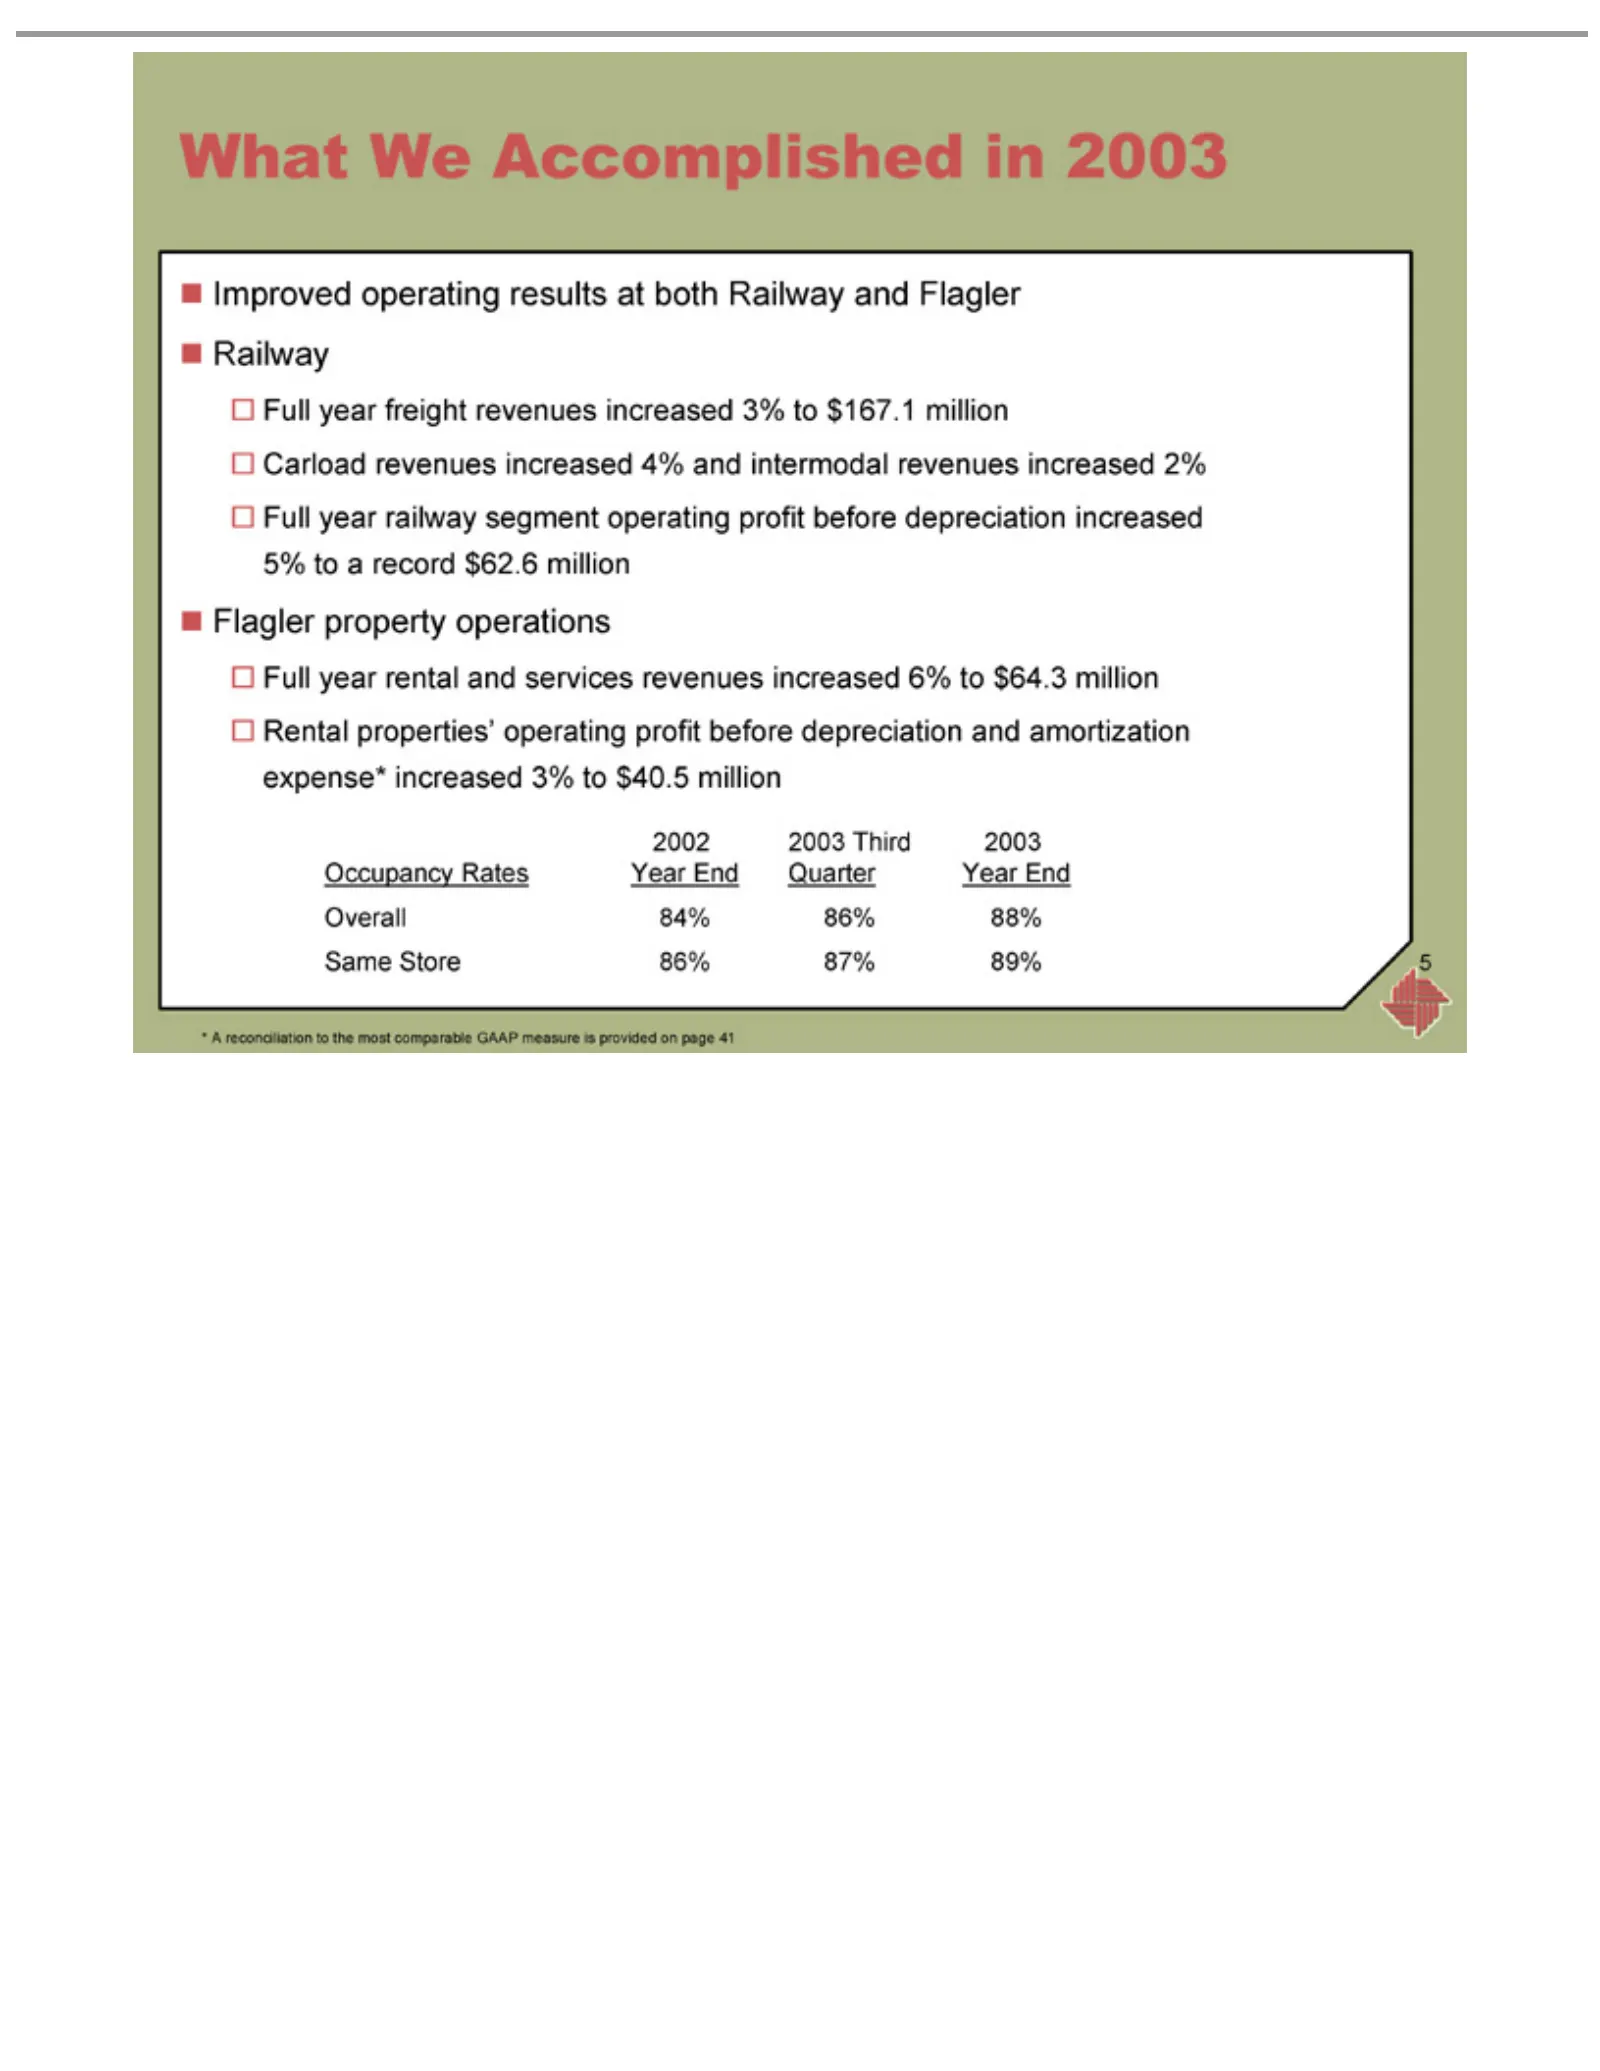
Slide 5: What we accomplished in 2003: railway and Flagler results
Whatyear Improved Railway Carload Flagler Full Rental 2002 Occupancy Overall Same 5 2003 We Store properties’ property 84% revenues freight railway rental Accomplished operating Third Rates 86% 86%and operations revenues 87% 2003 segment Year increased operating 88% services results 89% End inincrea
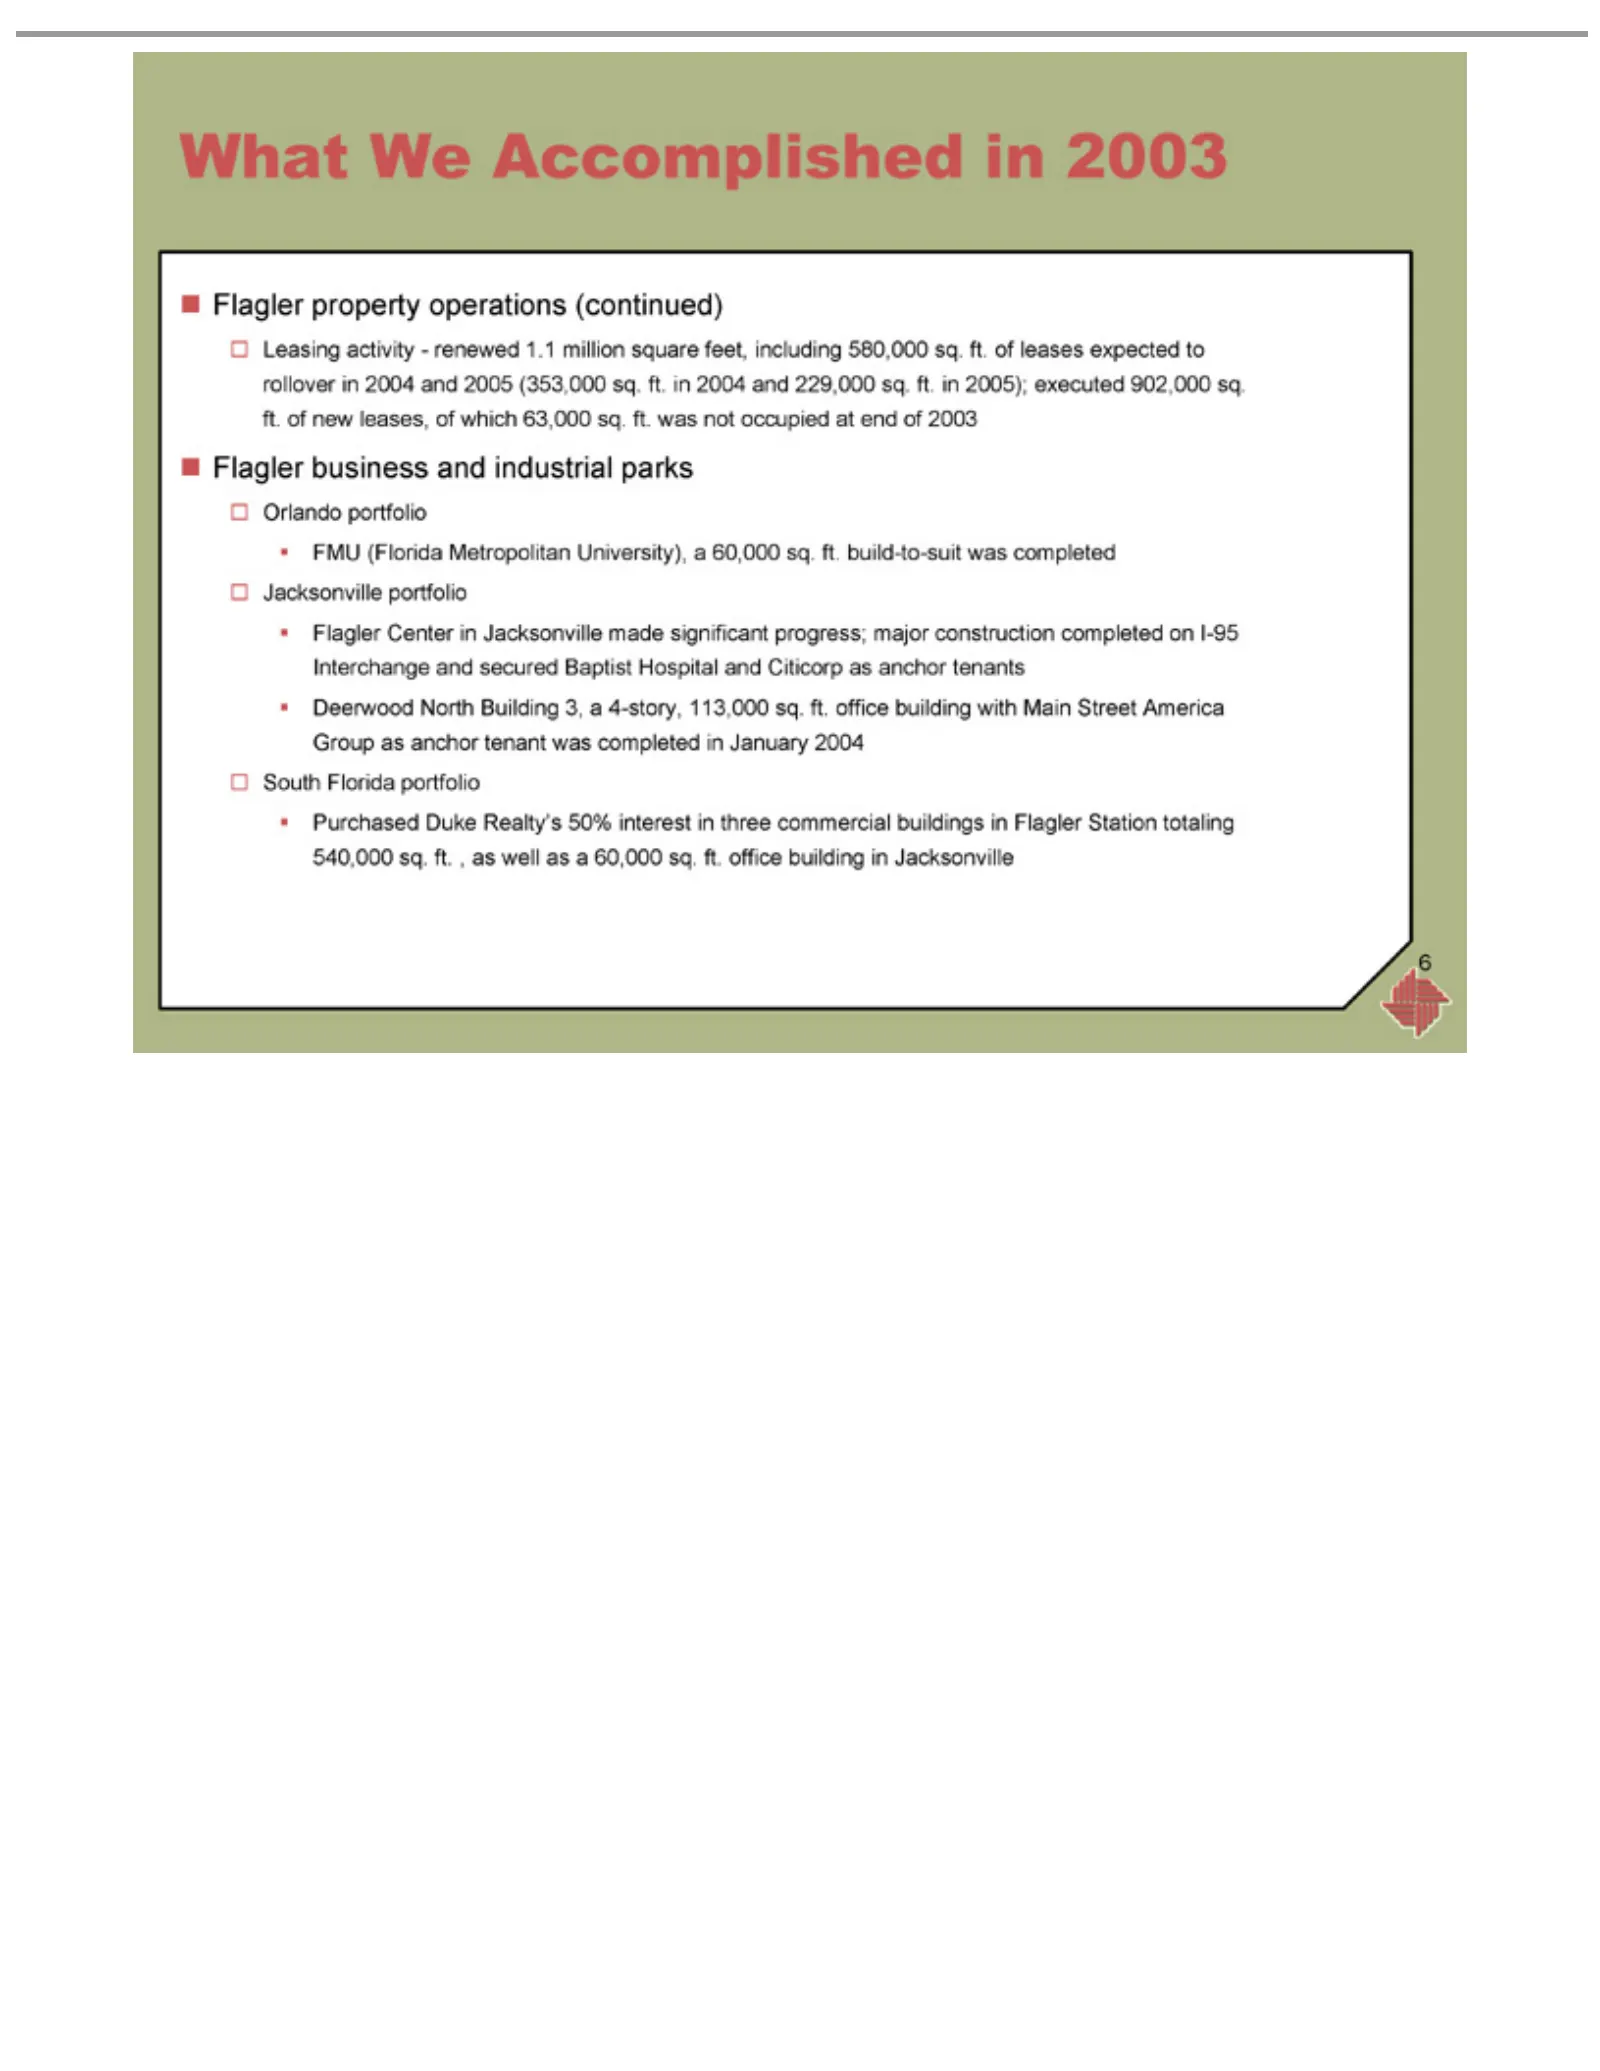
Slide 6: What we accomplished in 2003 (continued): Flagler leasing
What Leasing ft. Orlando FMU Jacksonville Flagler 4-story, South Purchased 6 of new We (Florida Florida property business Center 113,000 activity—renewed portfolio Accomplished leases, Duke portfolio portfolio Metropolitan inoperations and sq. Realty’s of Jacksonville which ft. industrial office in5
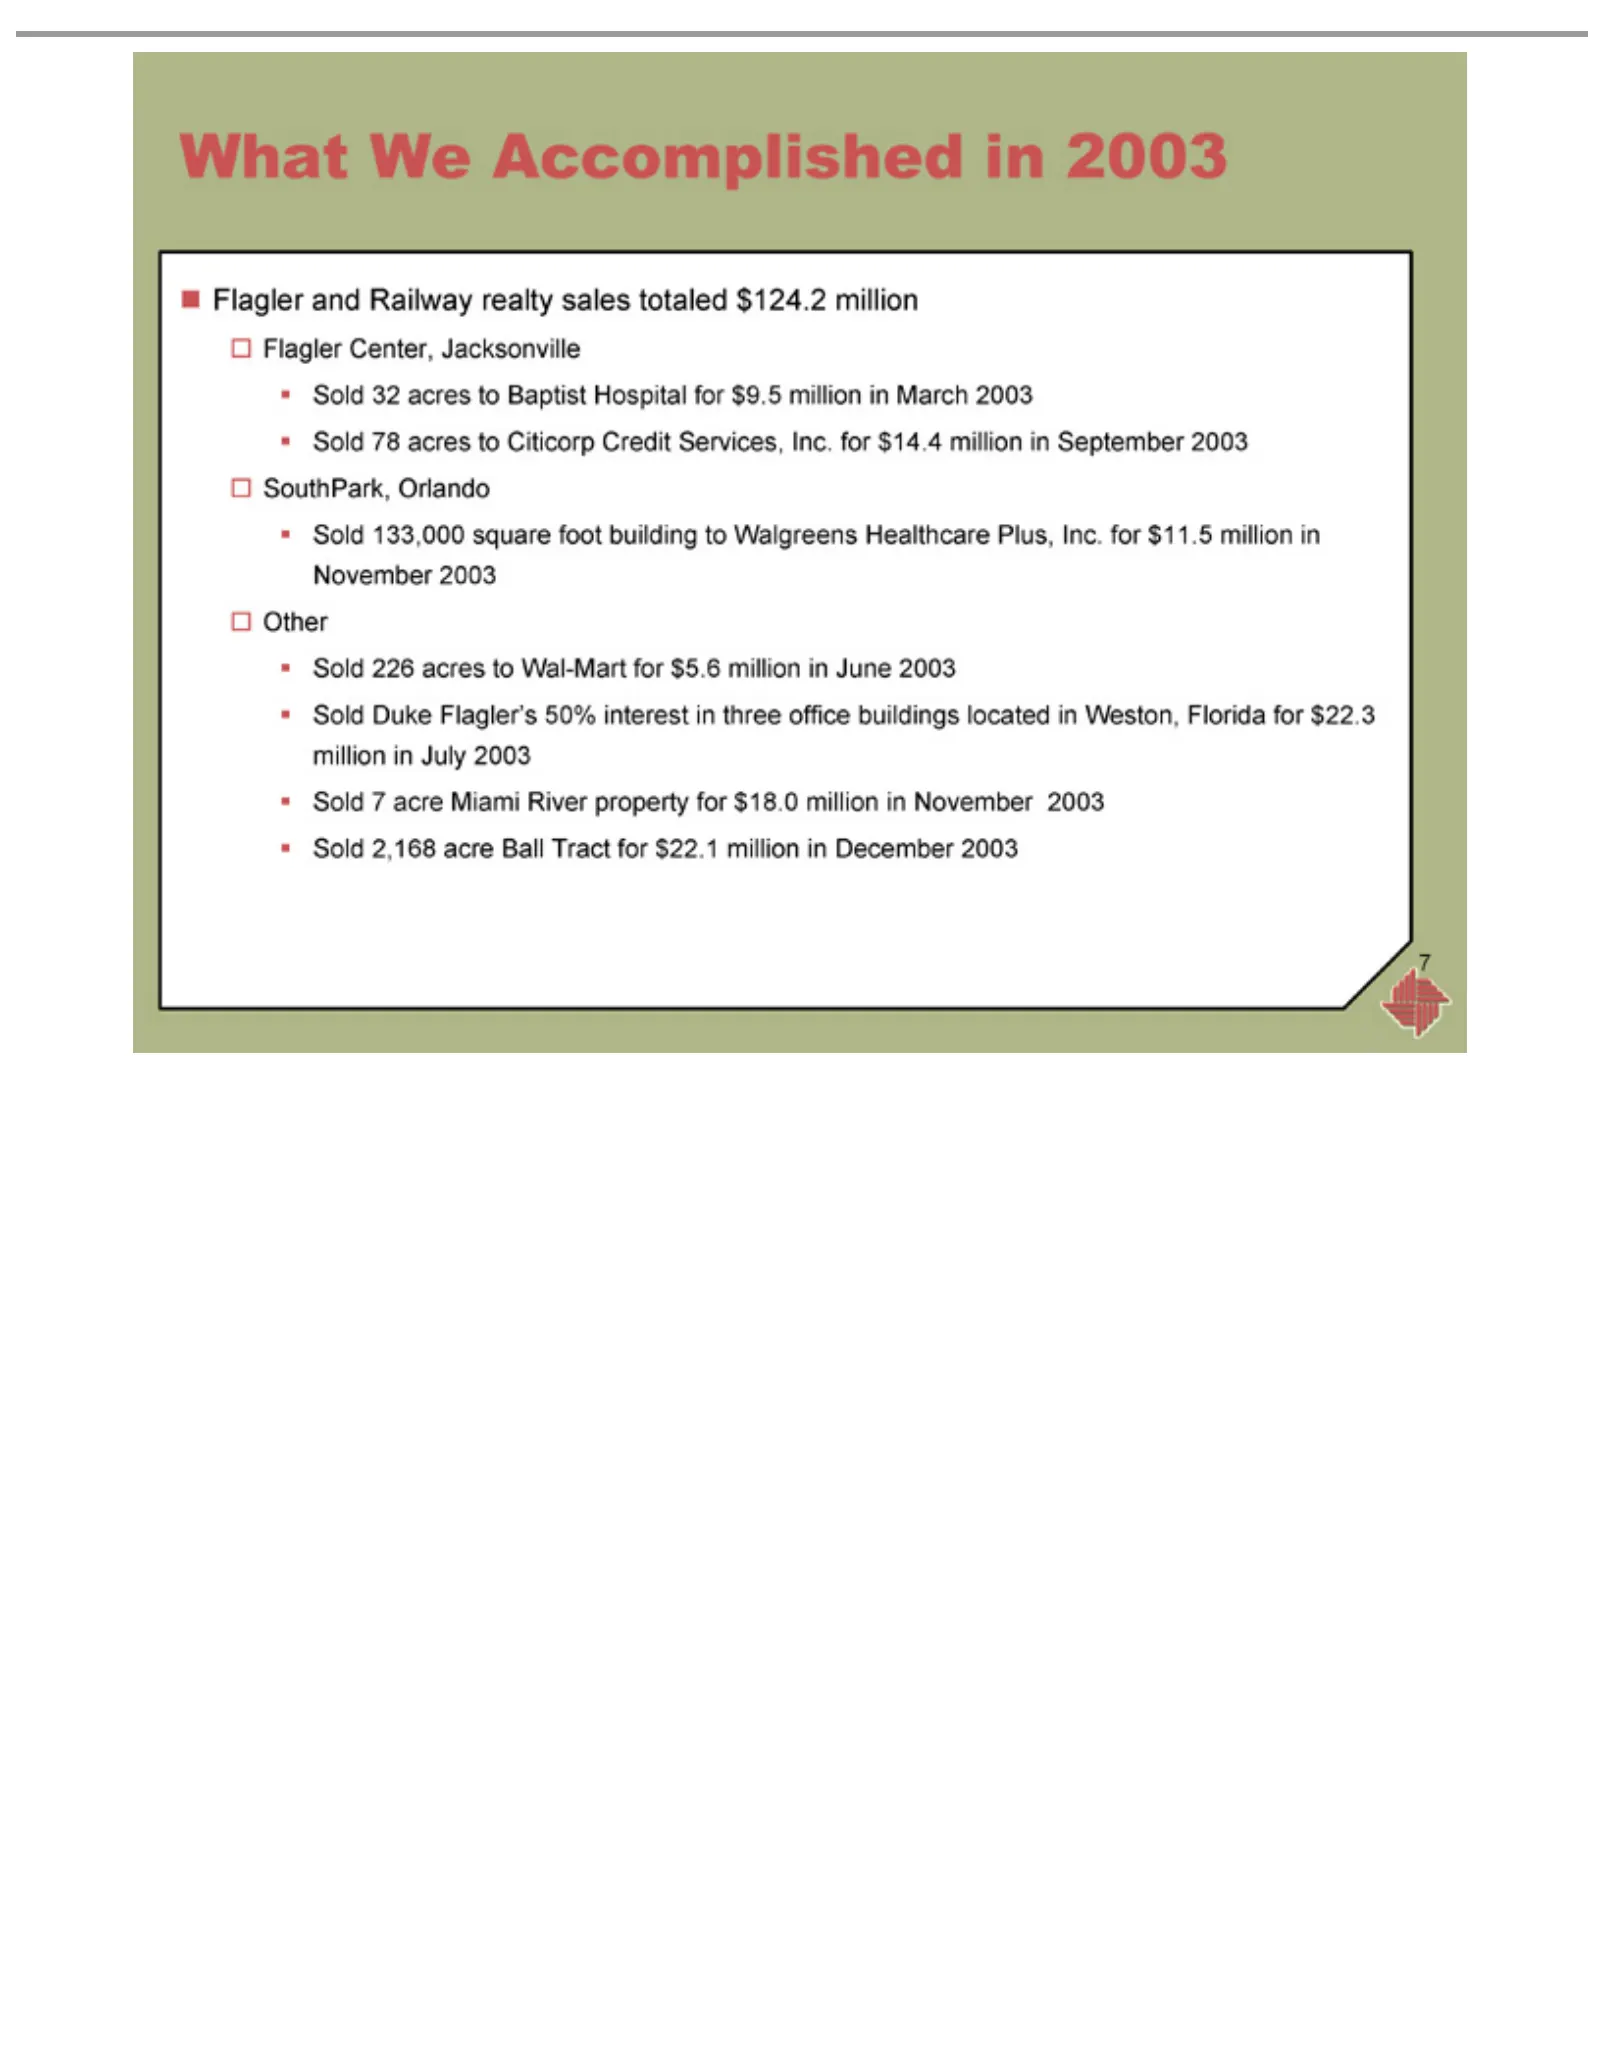
Slide 7: What we accomplished in 2003: realty sales
What2,168 Flagler SouthPark, Other Sold 7 32 78 133,000 226 7Duke Weacre and Center, acres acres Accomplished Flagler’s acre Orlando Miami Railway square toto Jacksonville Ball Baptist Citicorp Wal-Mart River 50% realty Tract footHospital in property Credit building interest for sales 2003 for$22.1
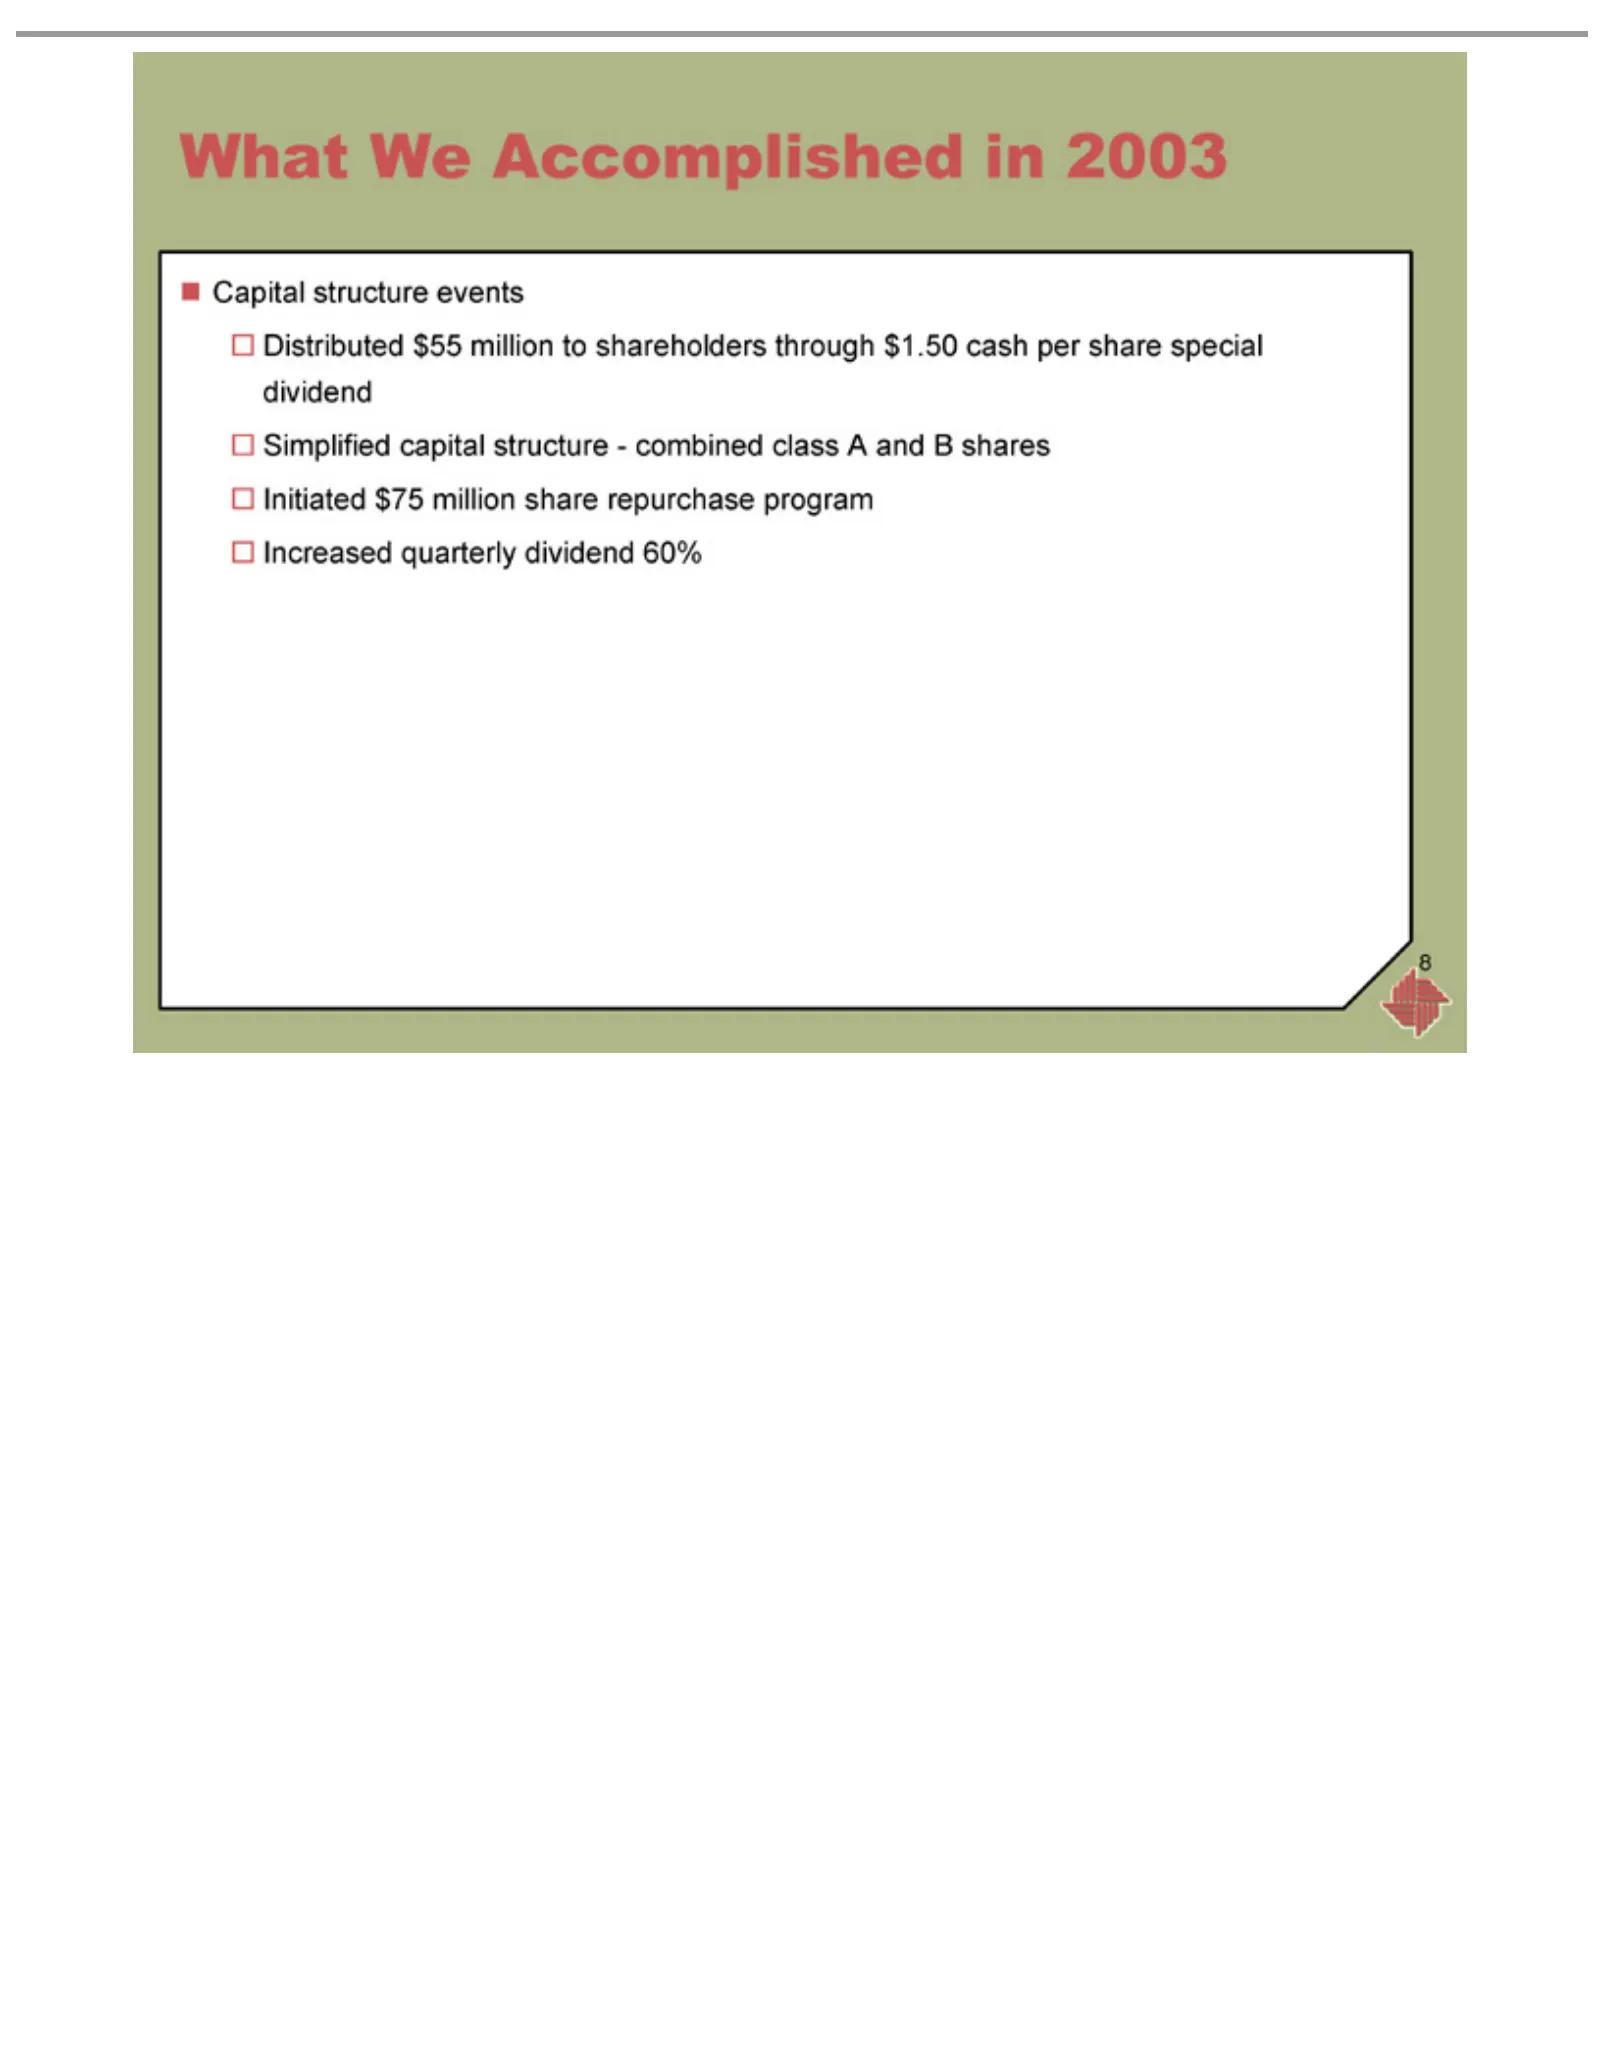
Slide 8: What we accomplished in 2003: capital structure and distributions
What We Capital Distributed Simplified Initiated Increased 8 structure $75 Accomplished quarterly capital $55 million million events structure—combined dividend share toinshareholders repurchase 2003 60% program through class A and $1.50 B shares cash per share special dividend
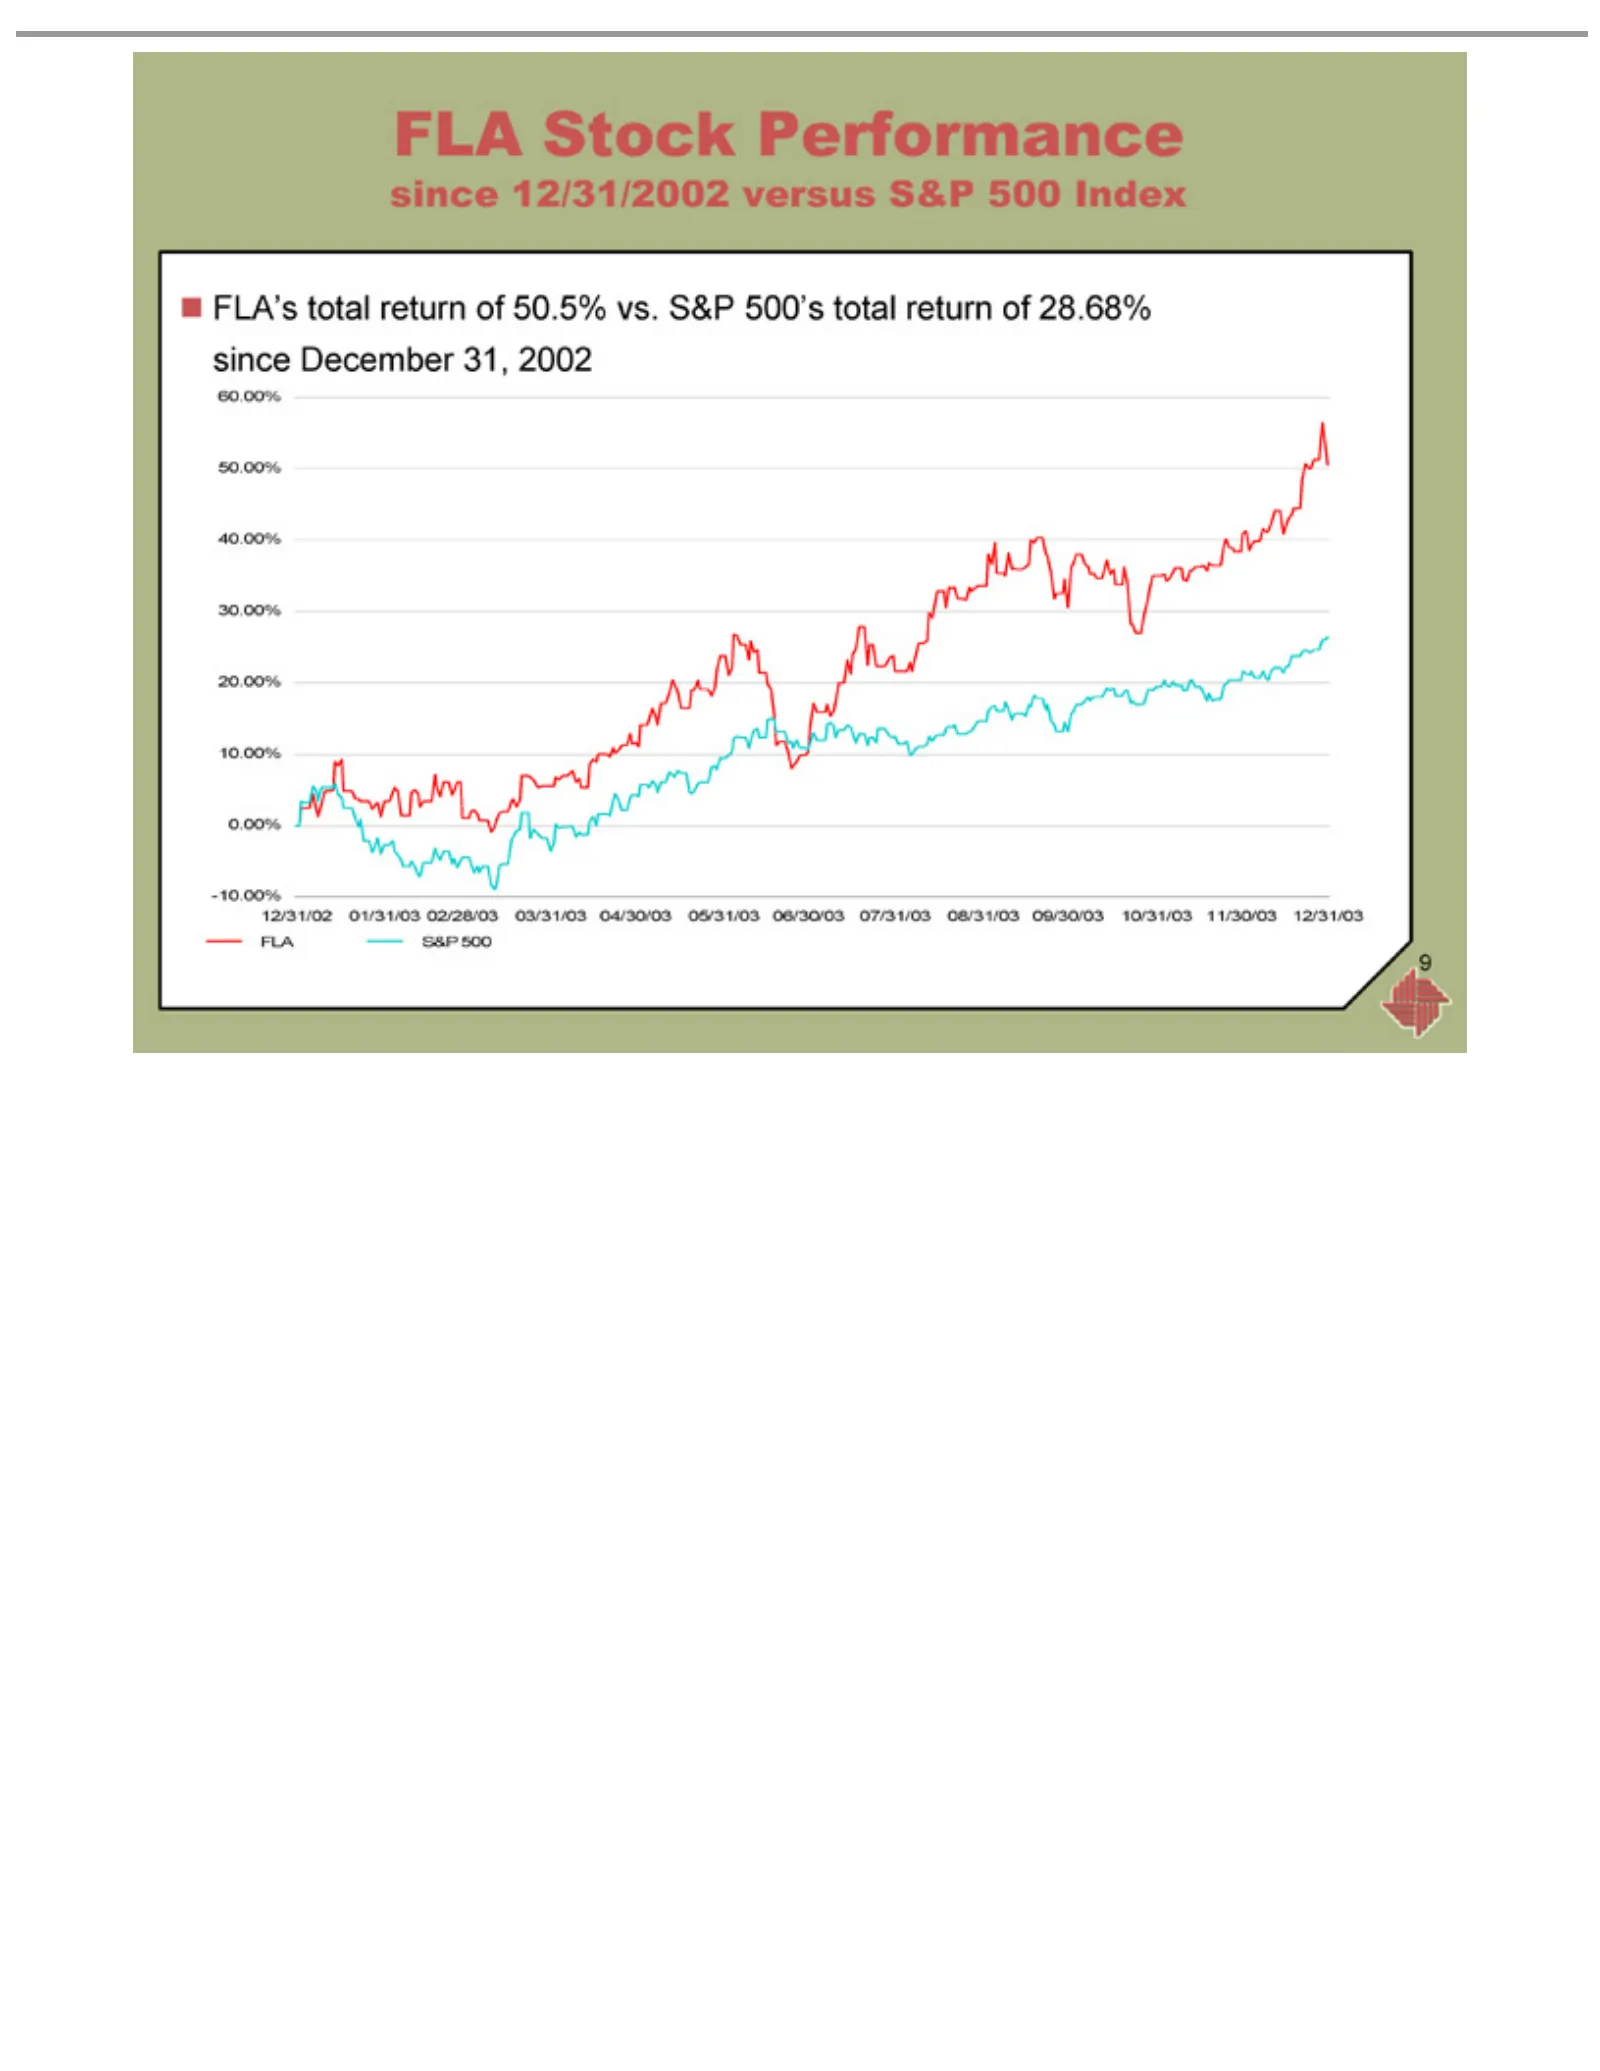
Slide 9: FLA stock performance versus S&P 500
FLA Stock since FLA’s 9 12/31/2002 total Performance returnversus of 50.5% S&P vs.500 S&PIndex 500’s total return of 28.68% since December 31, 2002
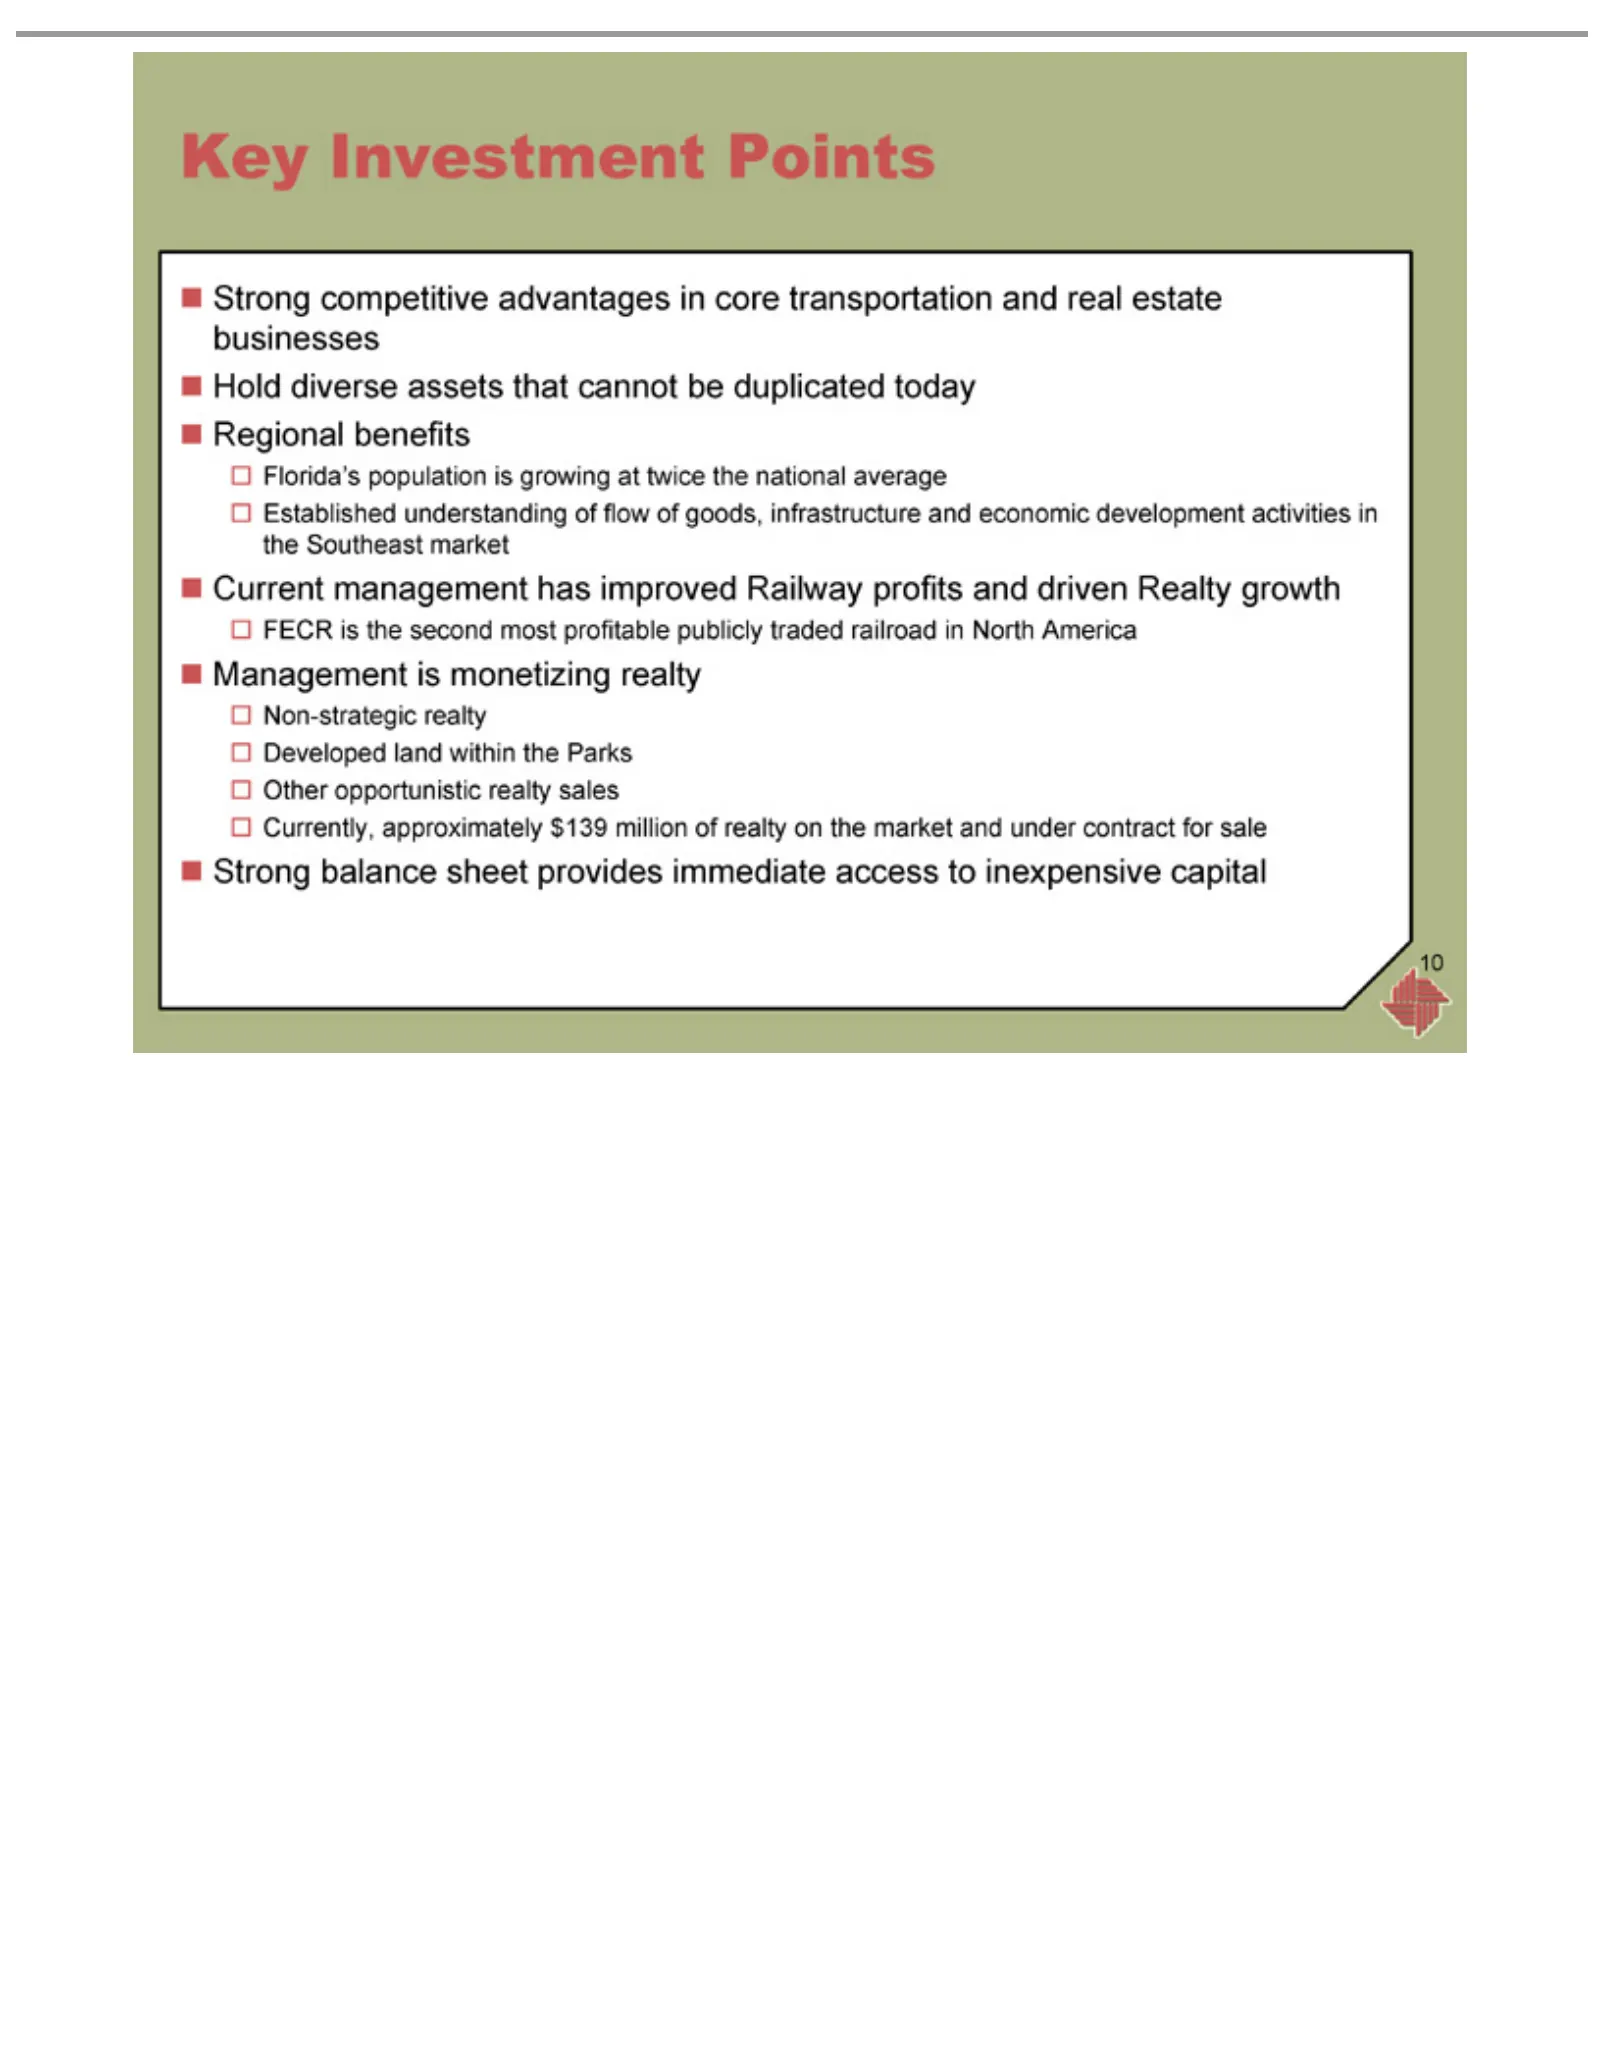
Slide 10: Key investment points
Key Investment Hold Regional Florida’s Established Current FECR Management Non-strategic Developed Other Currently, Strong 10 diverse opportunistic is competitive balance management the population benefits approximately land understanding second assets isrealty sheet monetizing within Points advanta
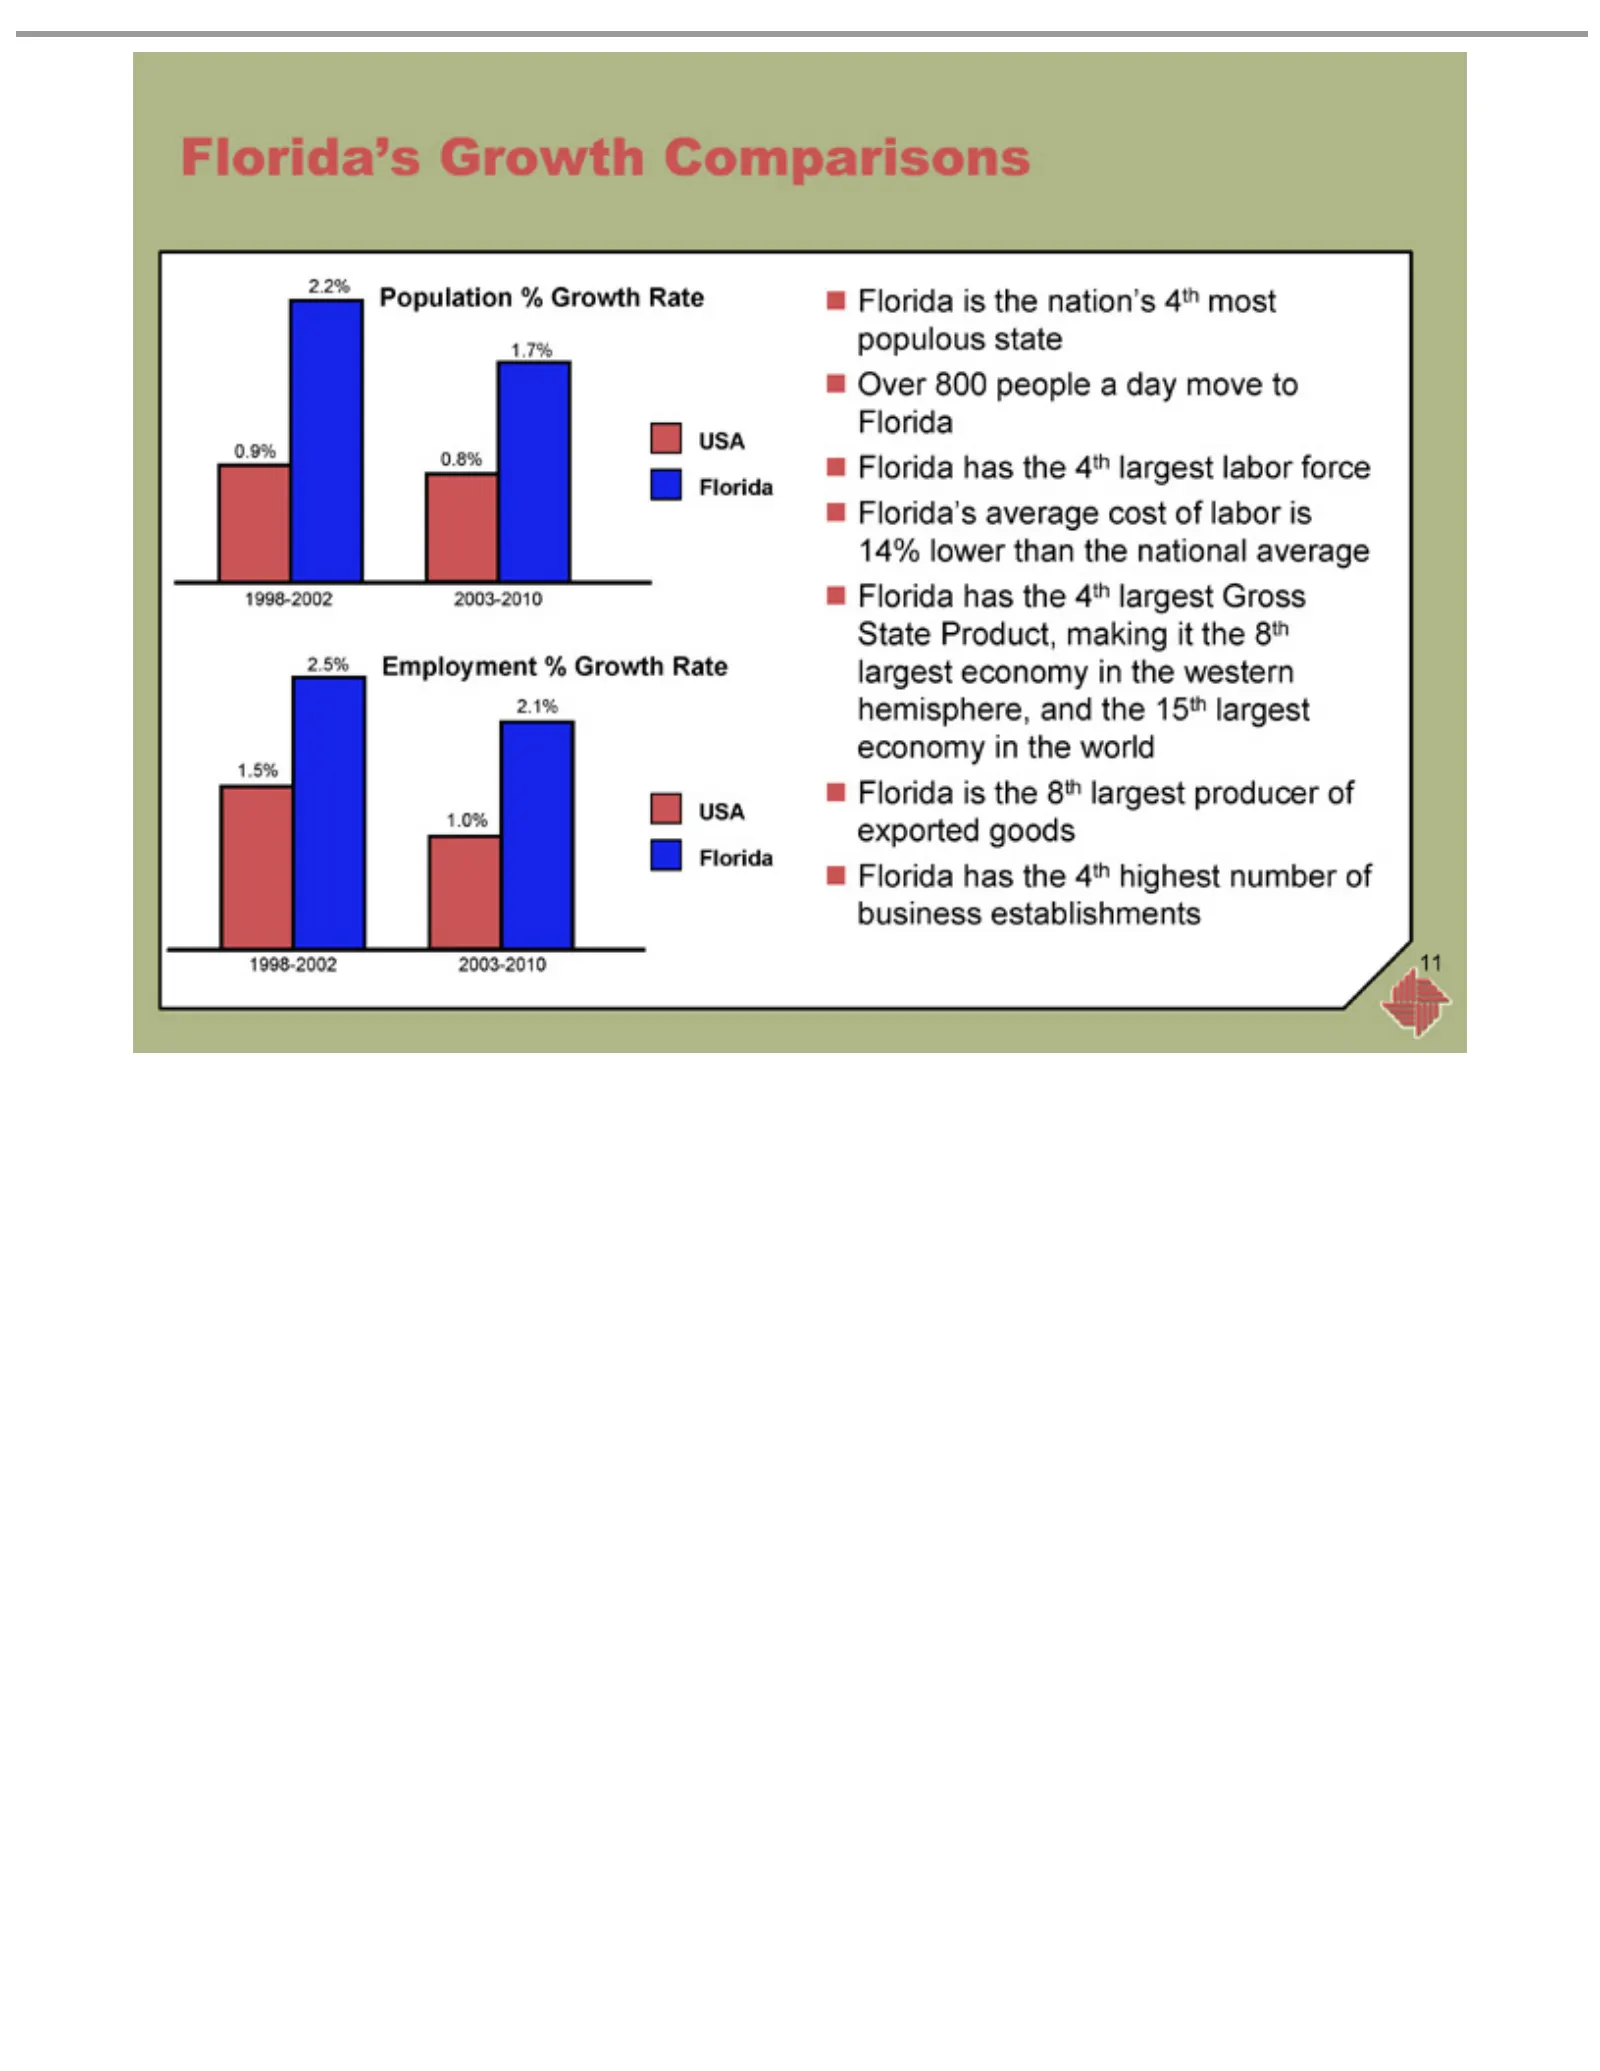
Slide 11: Florida population and employment growth
Population Employment 1.7% 0.8% 2.2% 0.9% 2003-2010 2.1% 1.0% 1998-2002 2.5% 1.5% Over Florida’s Florida 11 800 isaverage has Growth people the the8th nation’s 4th %alargest Comparisons cost %Growth day largest highest Growth 4th of move producer labor most labor Gross Rate number Rate toispopulous
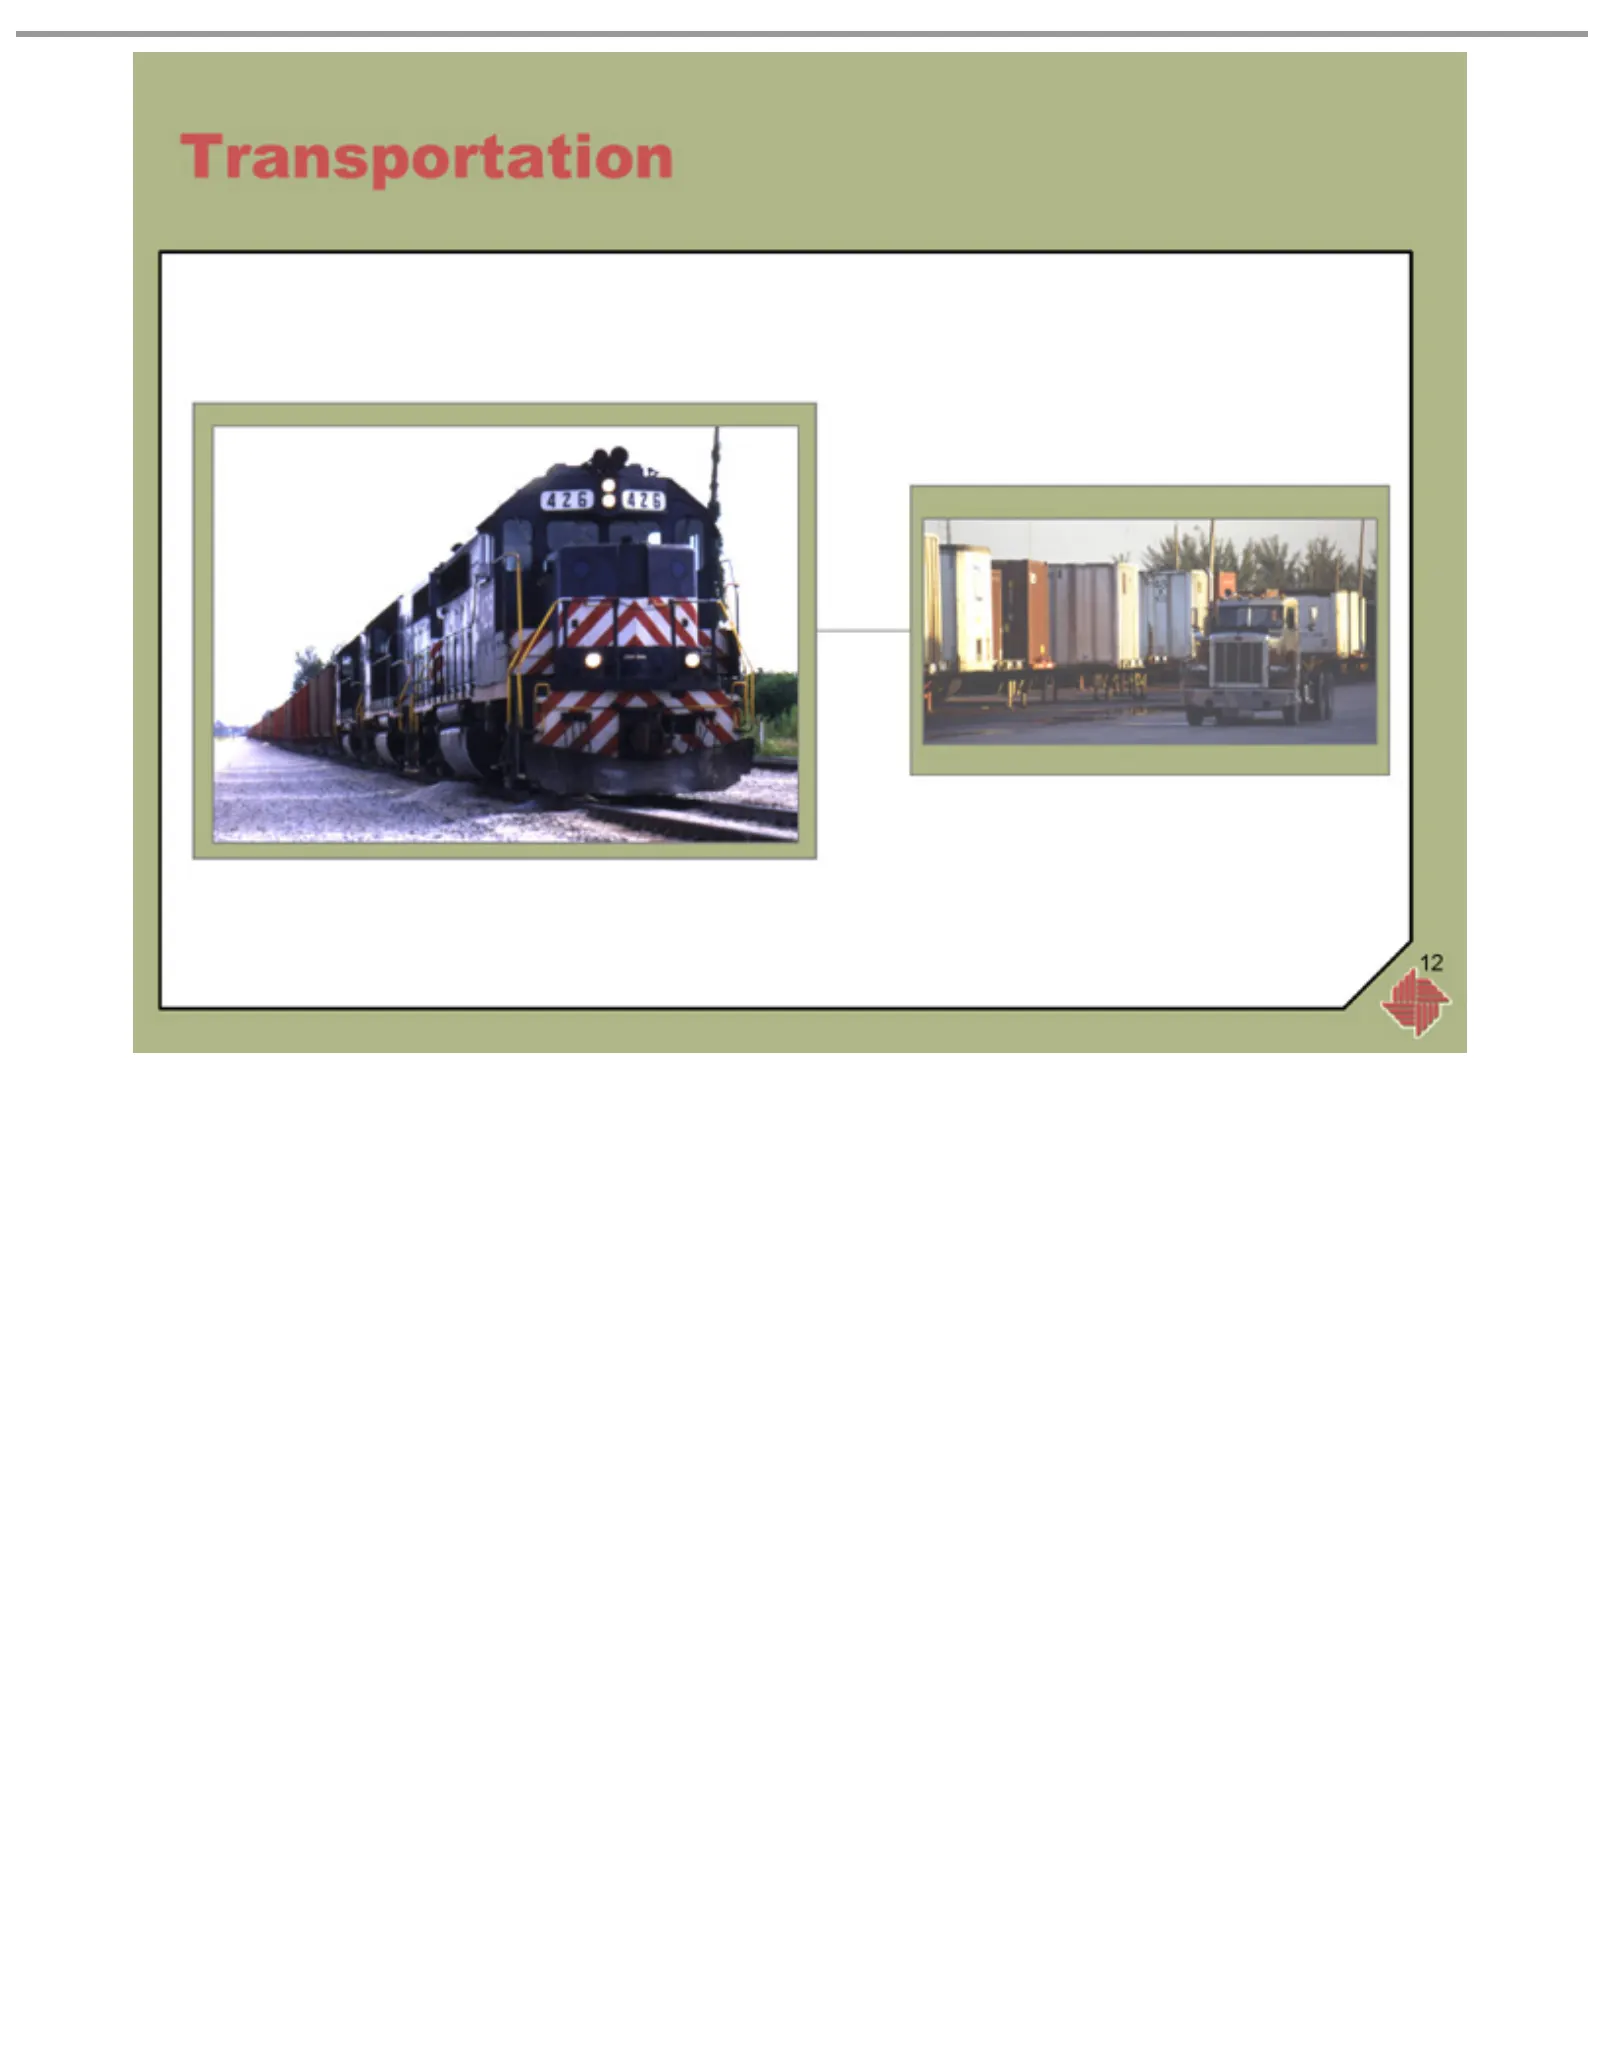
Slide 12: Transportation
12 Transportation
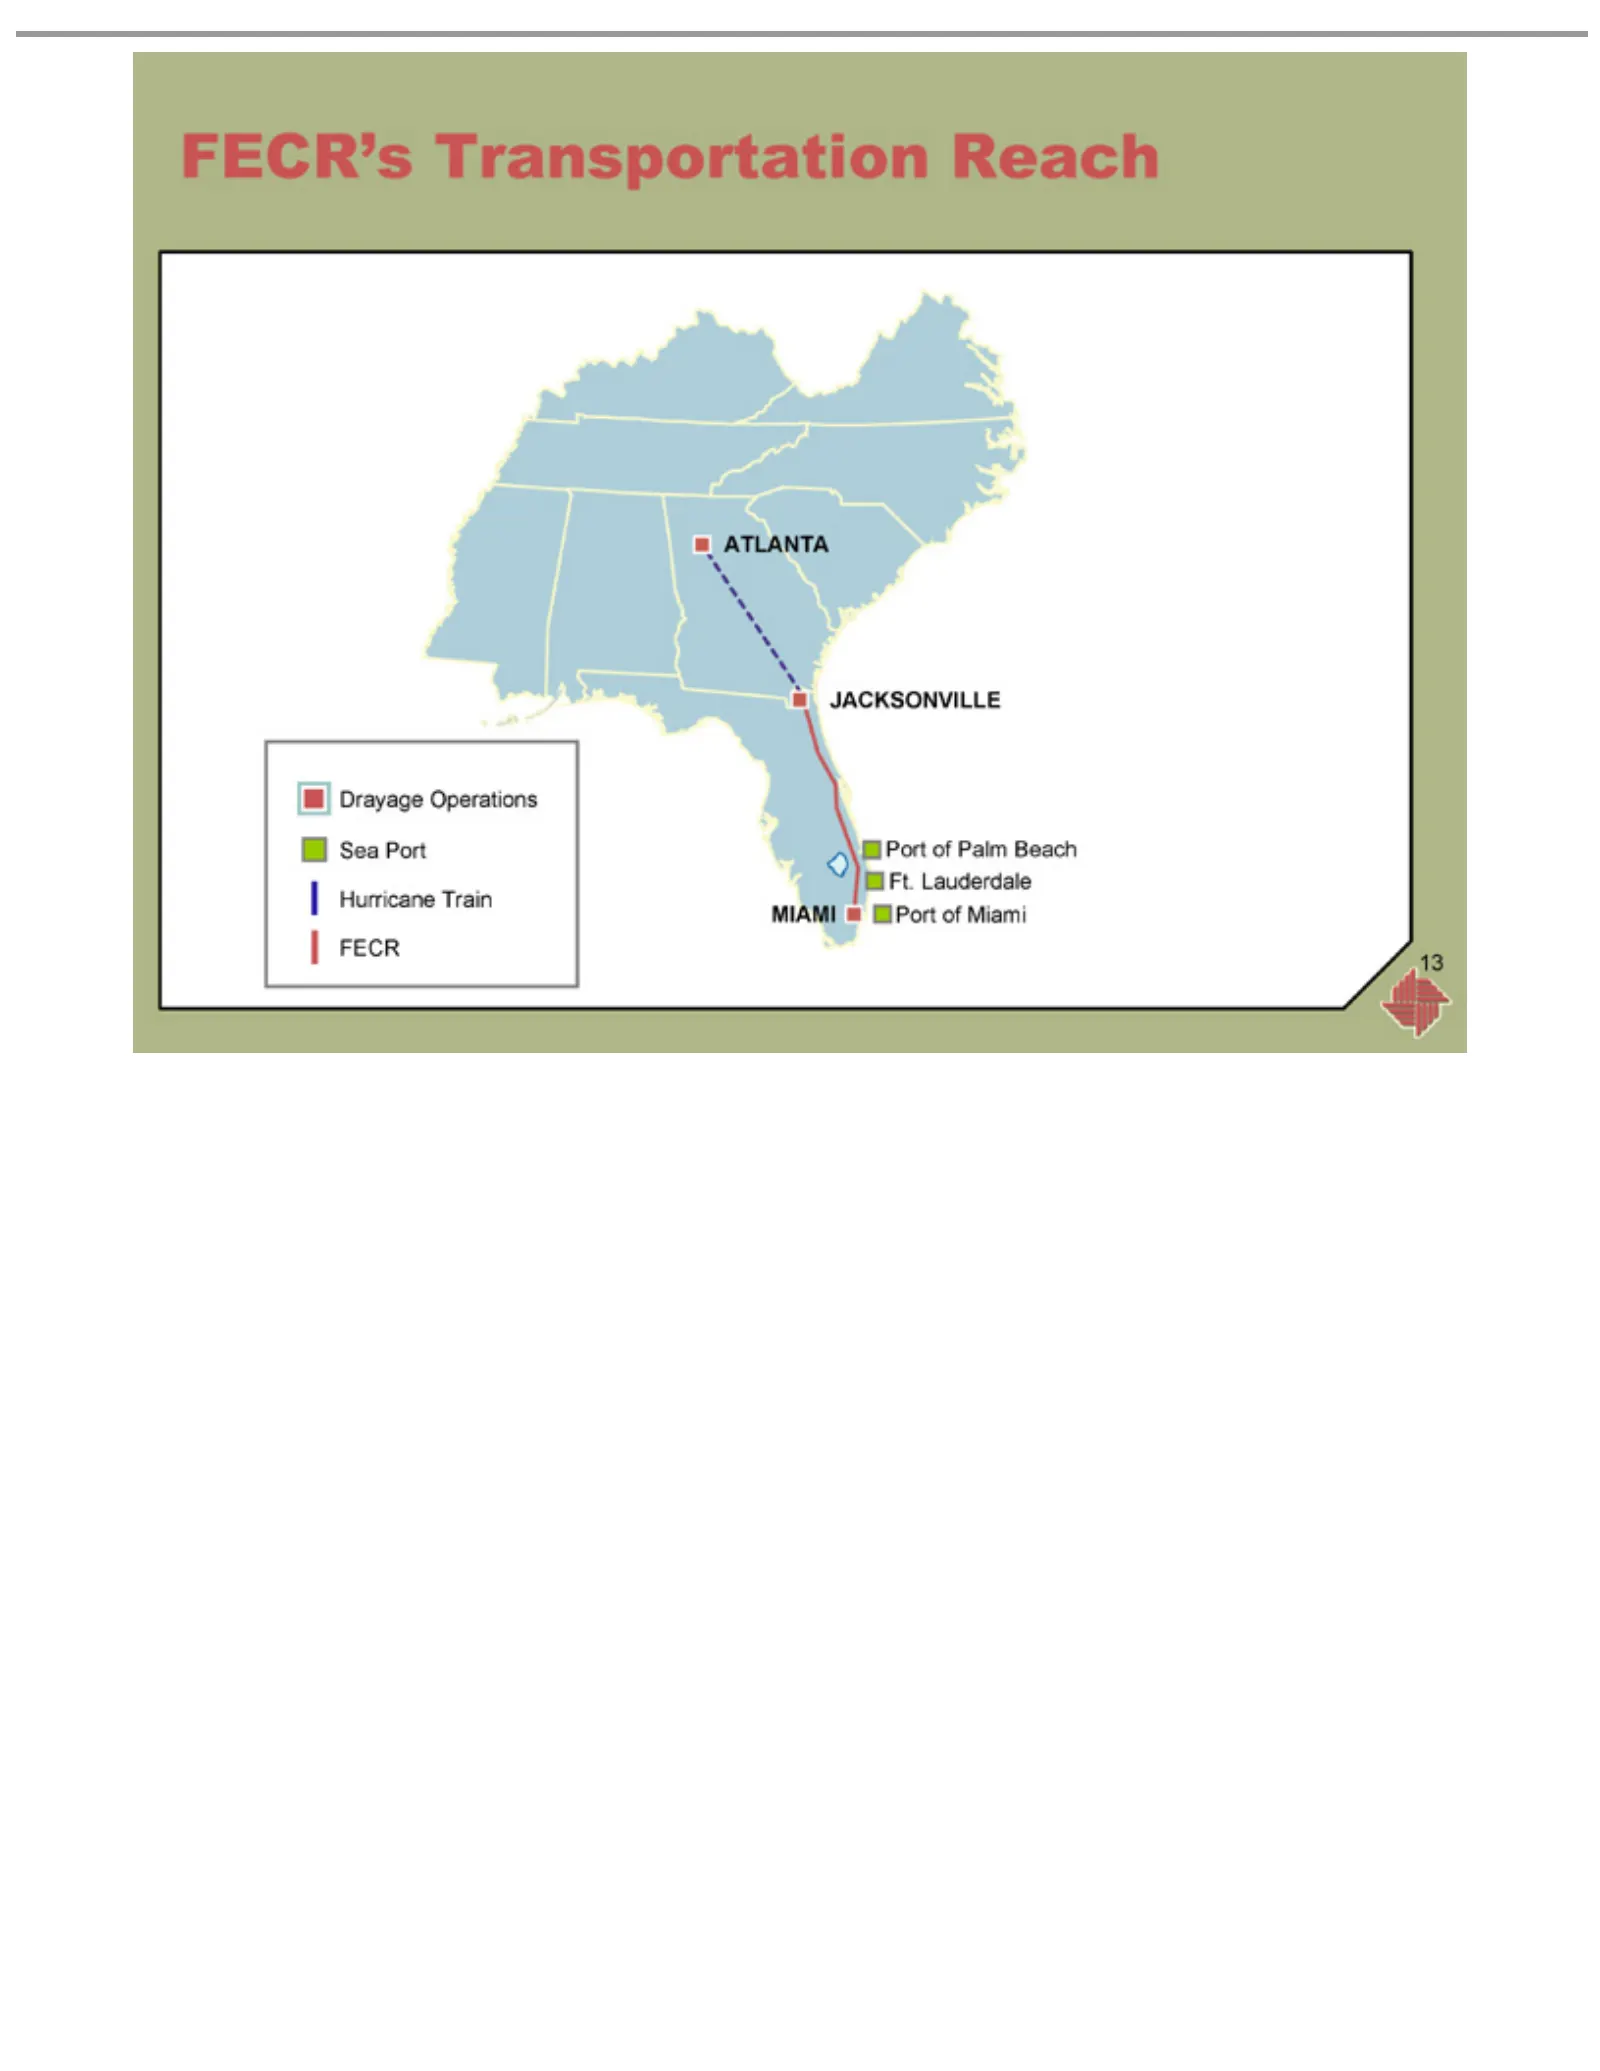
Slide 13: FECR's drayage operations
FECR’s Drayage JACKSONVILLE ATLANTA Ft. Port 13 Lauderdale of Miami Palm Transportation Operations Beach SeaReach Port Hurricane Train FECR
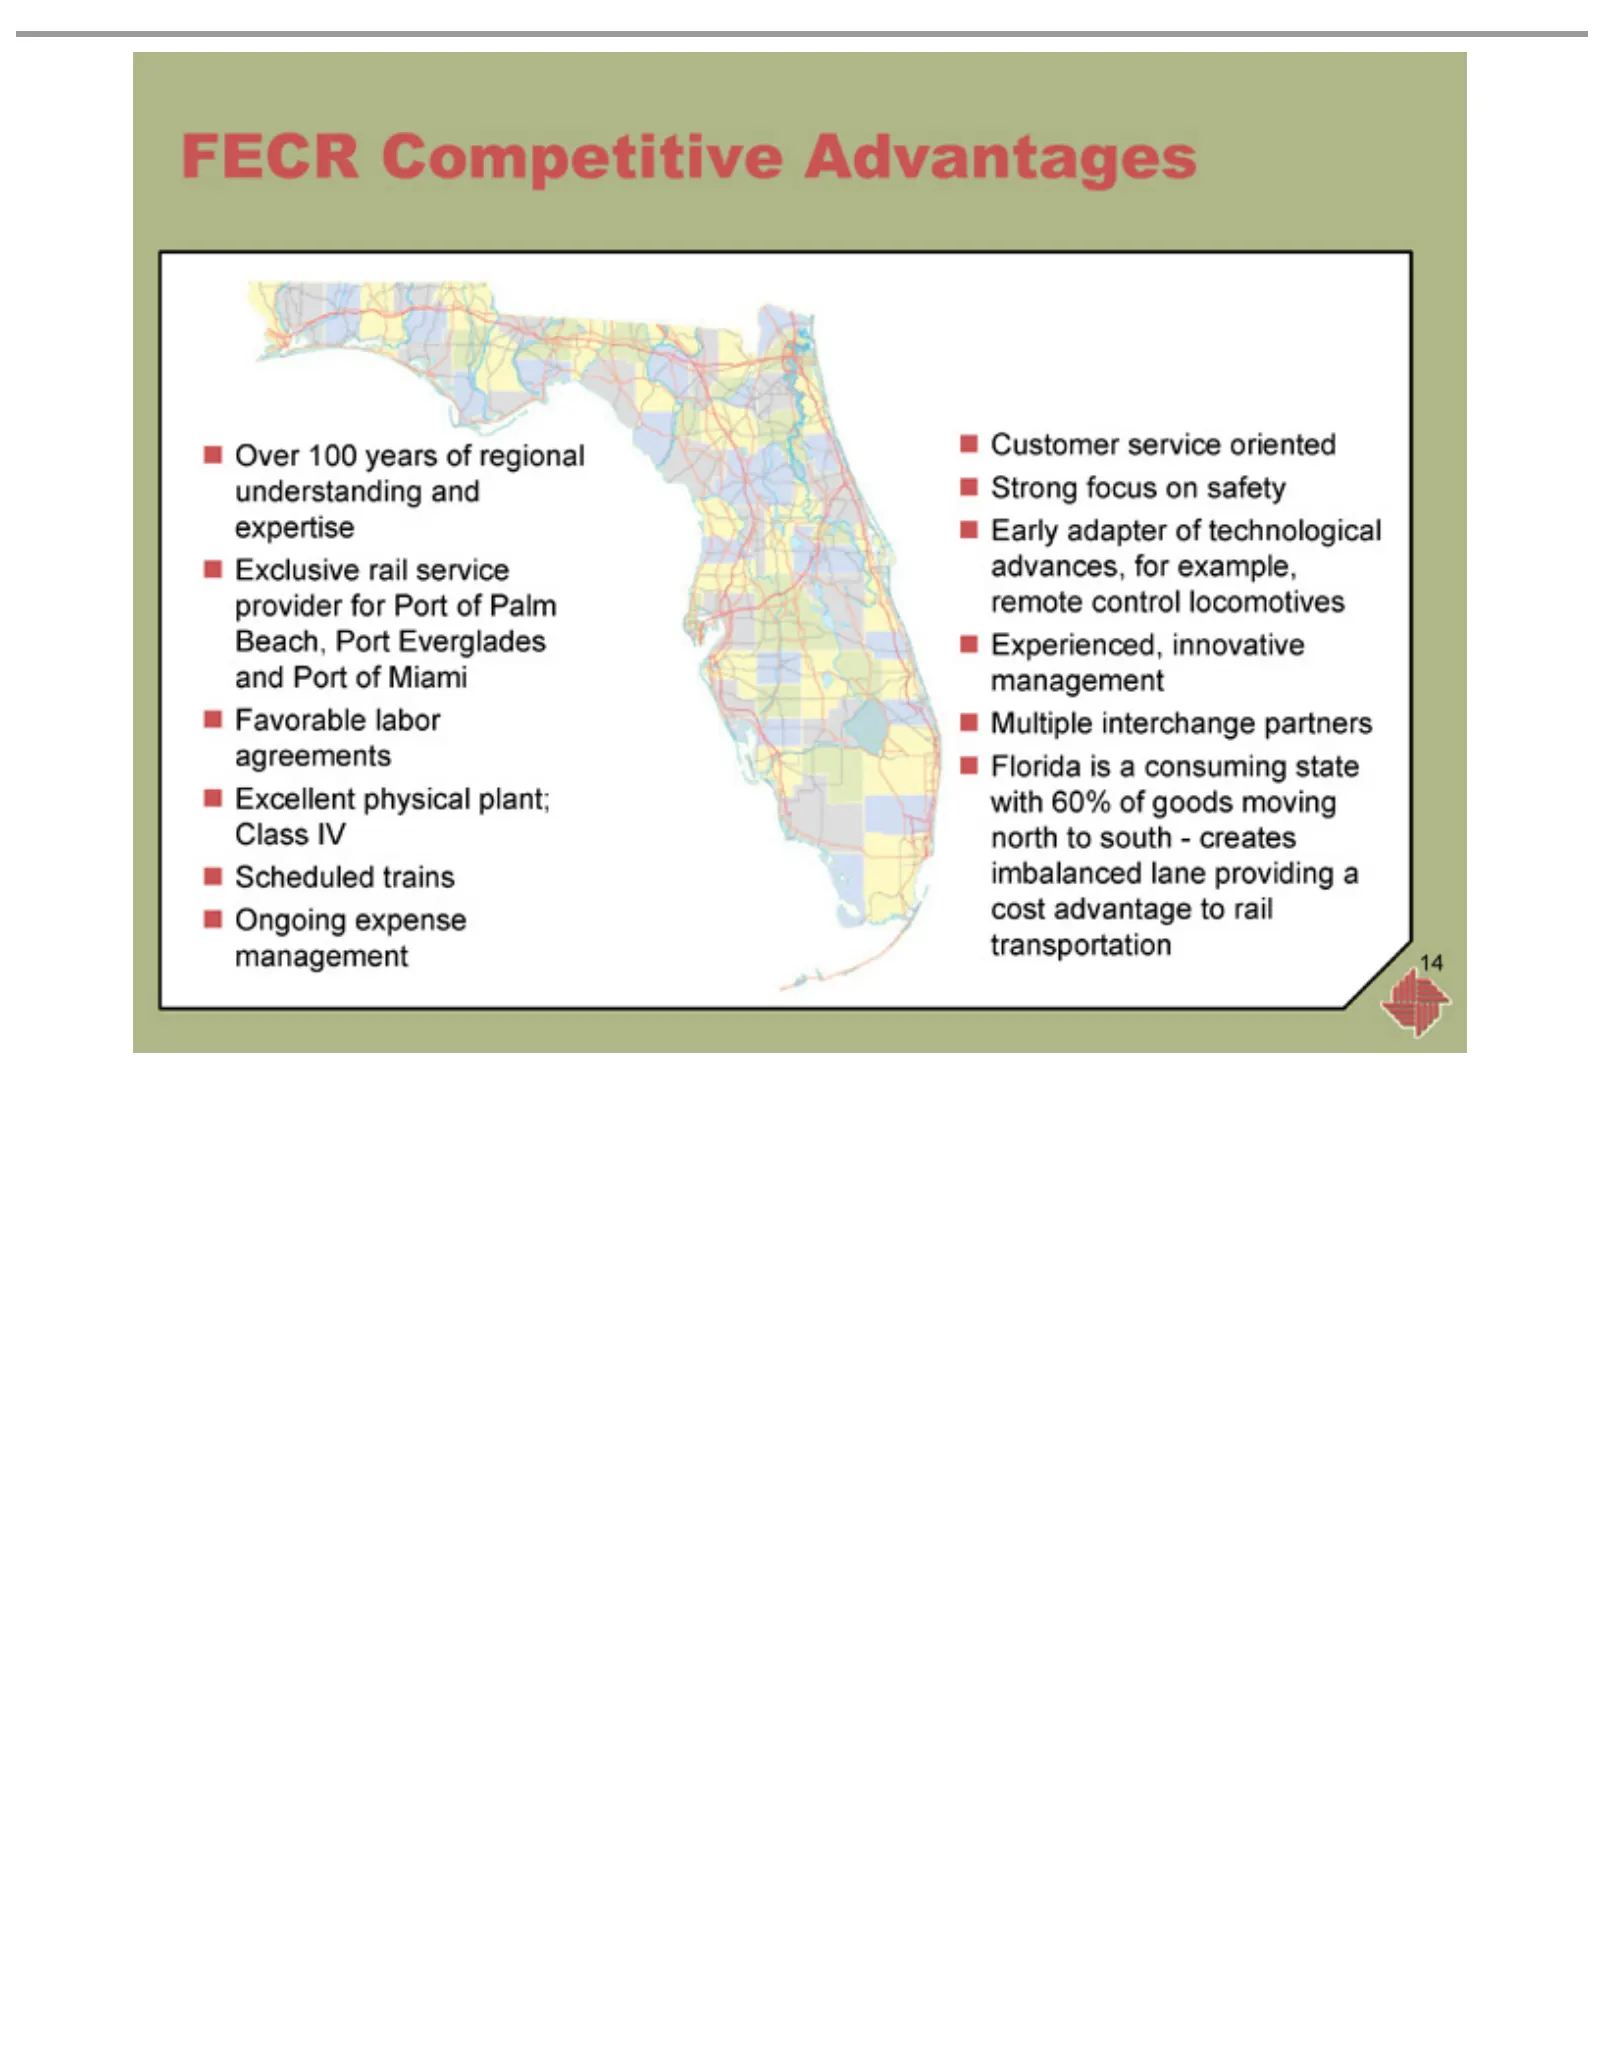
Slide 14: FECR competitive advantages
FECR100 Over Exclusive Favorable Excellent Scheduled Customer Strong Early Experienced, Multiple Florida 14 adapter Competitive focus isinterchange years physical aservice rail labor trains consuming on innovative of service of agreements safety technological Ongoing oriented regional plant; Advanta
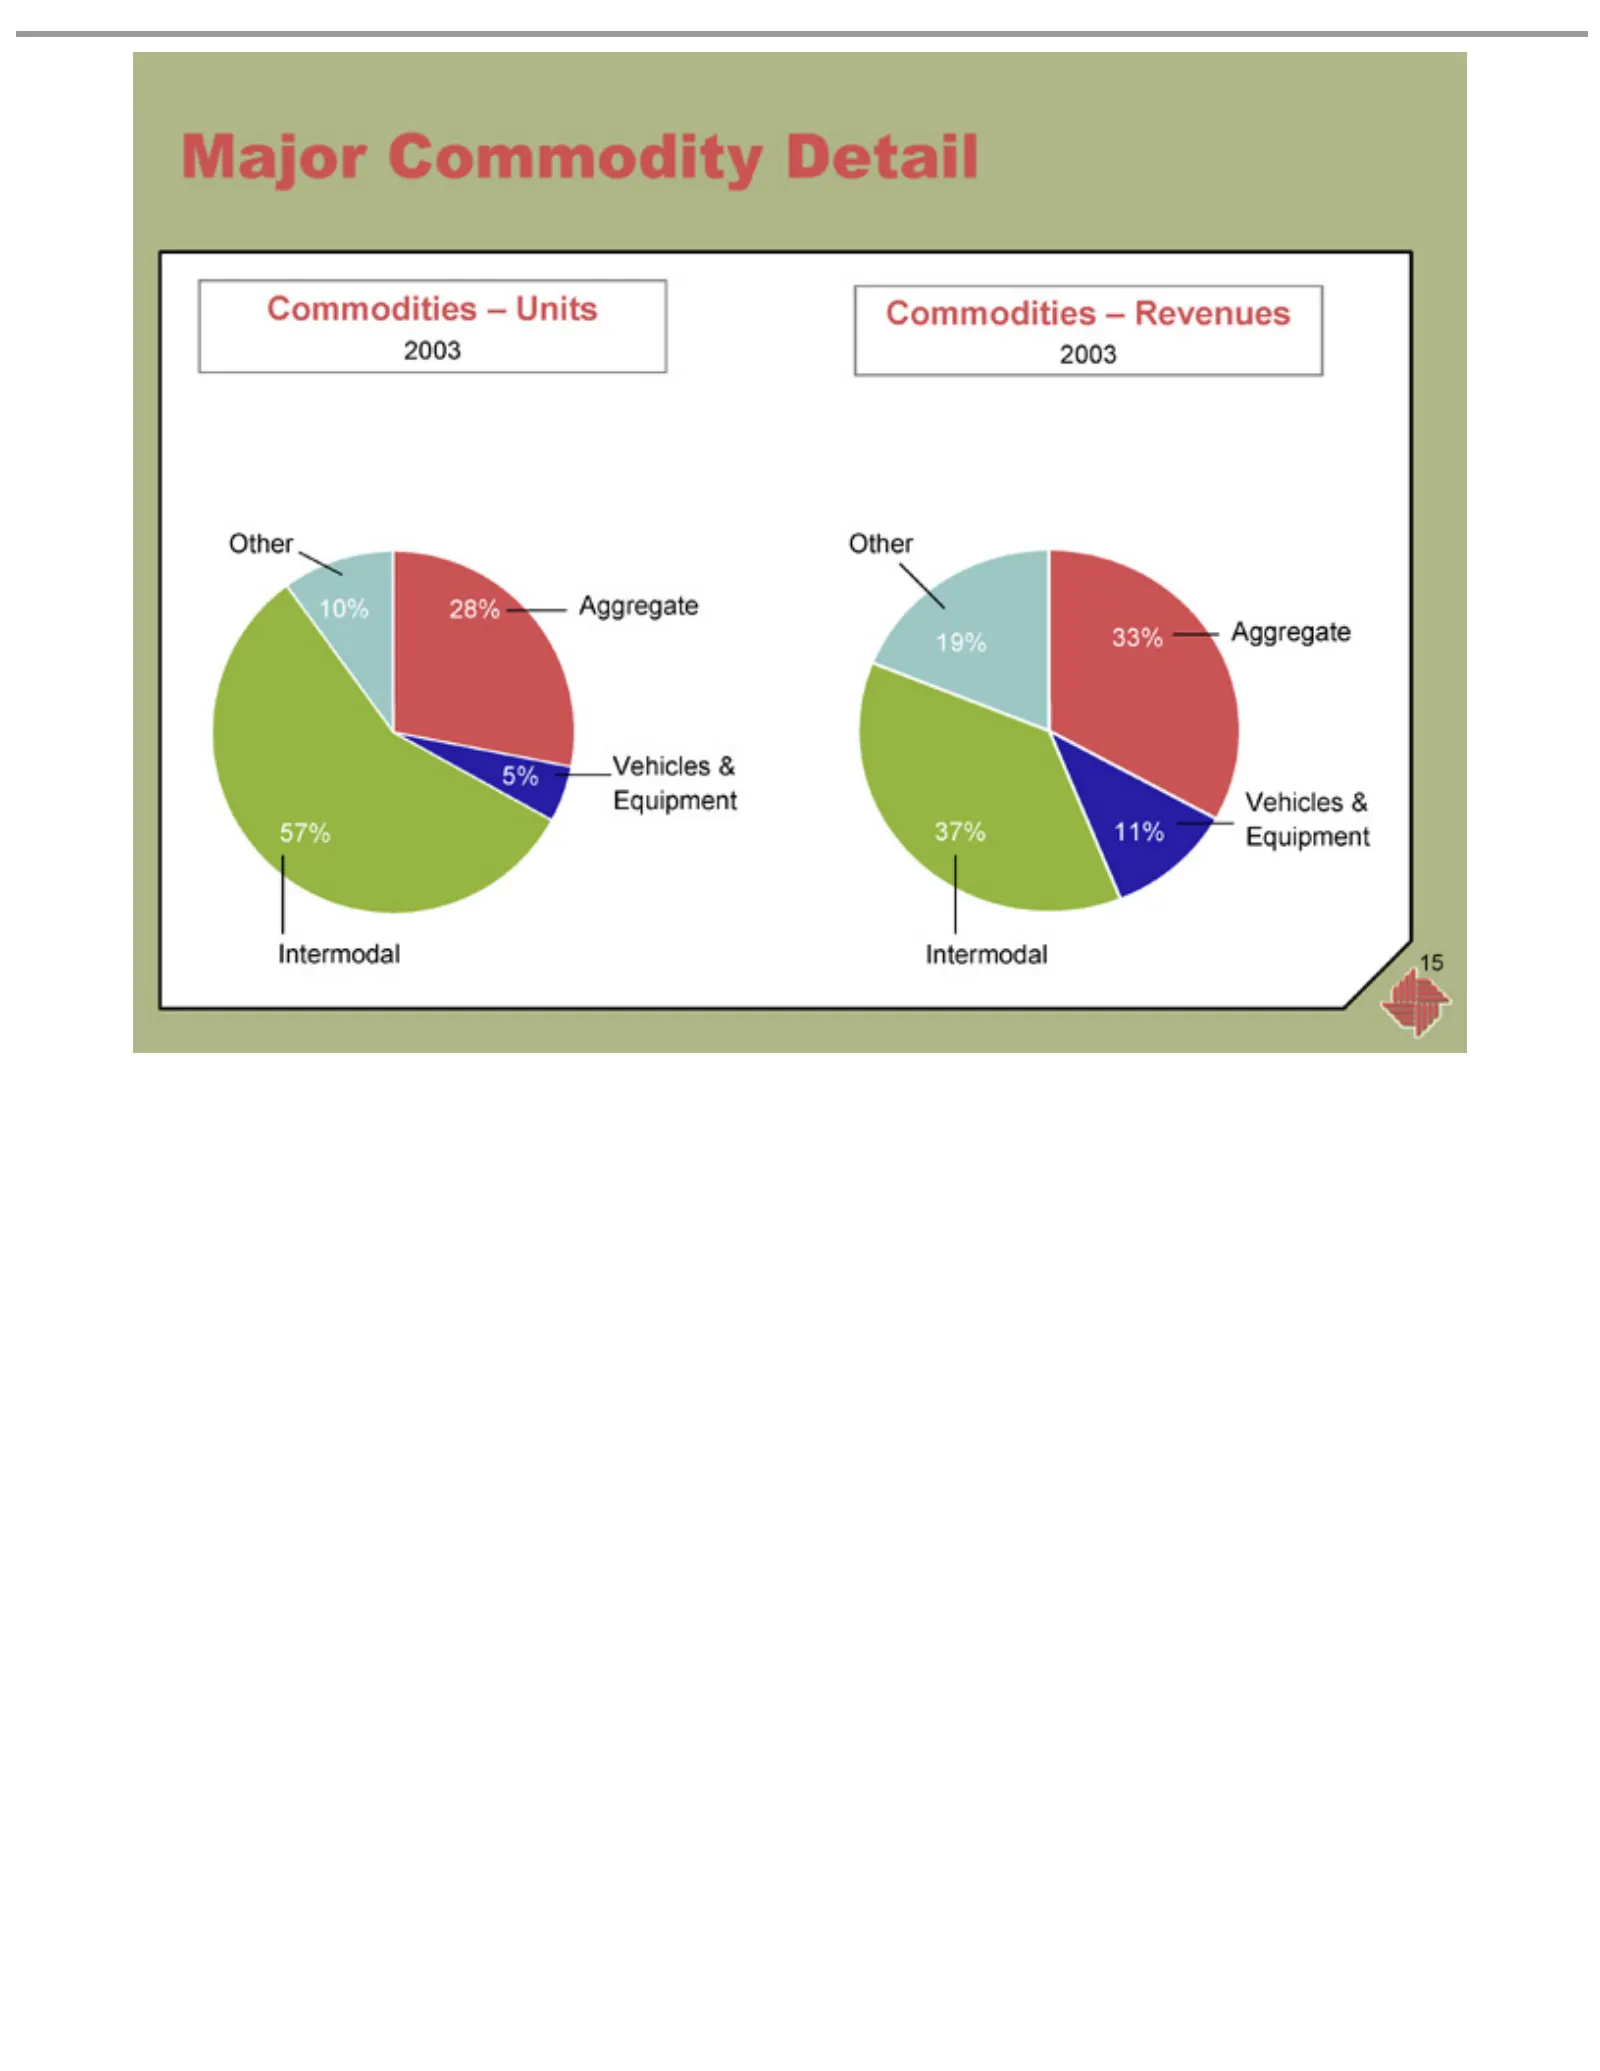
Slide 15: Major commodity revenues and units, 2003
Major Commodity 5% 57% 28% 10% Commodities Vehicles 37% Intermodal 33% Aggregate 19% Other 2003 15 11% & Equipment – Revenues Units Detail
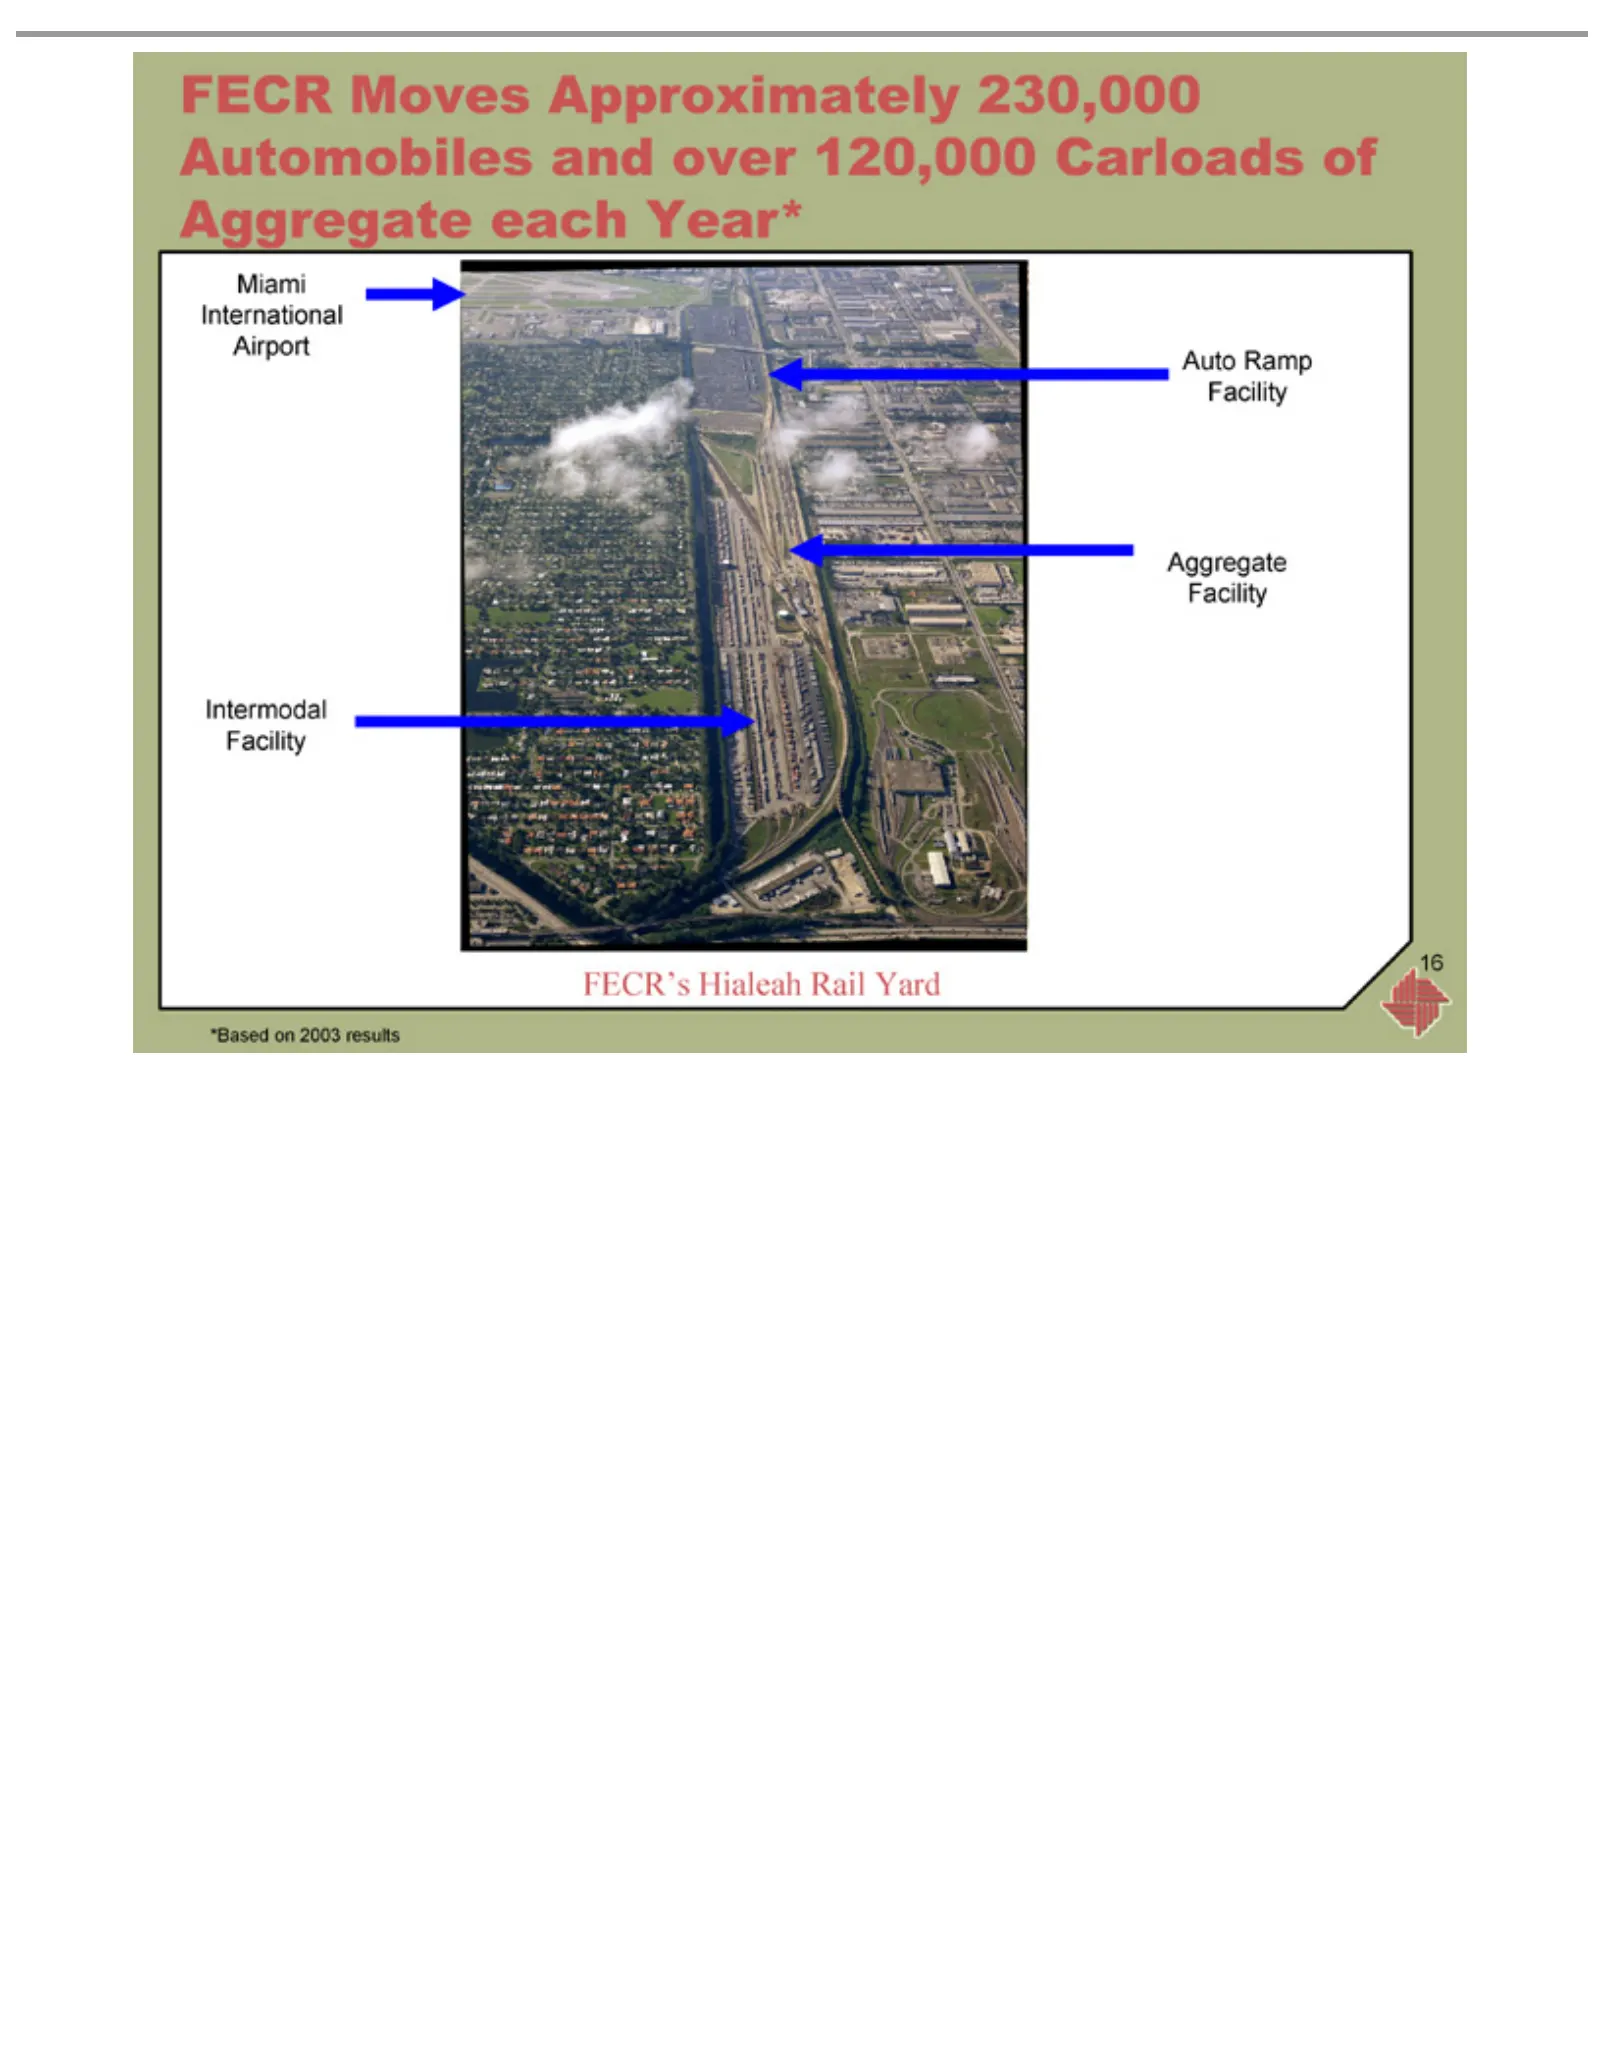
Slide 16: FECR ramp, intermodal and aggregate facilities
FECRRamp Miami Intermodal Auto Aggregate FECR’s *Based 16 Moves International on Hialeah Facility 2003 Facility Facility Approximately results RailAirport Yard 230,000 Automobiles and over 120,000 Carloads of Aggregate each Year*
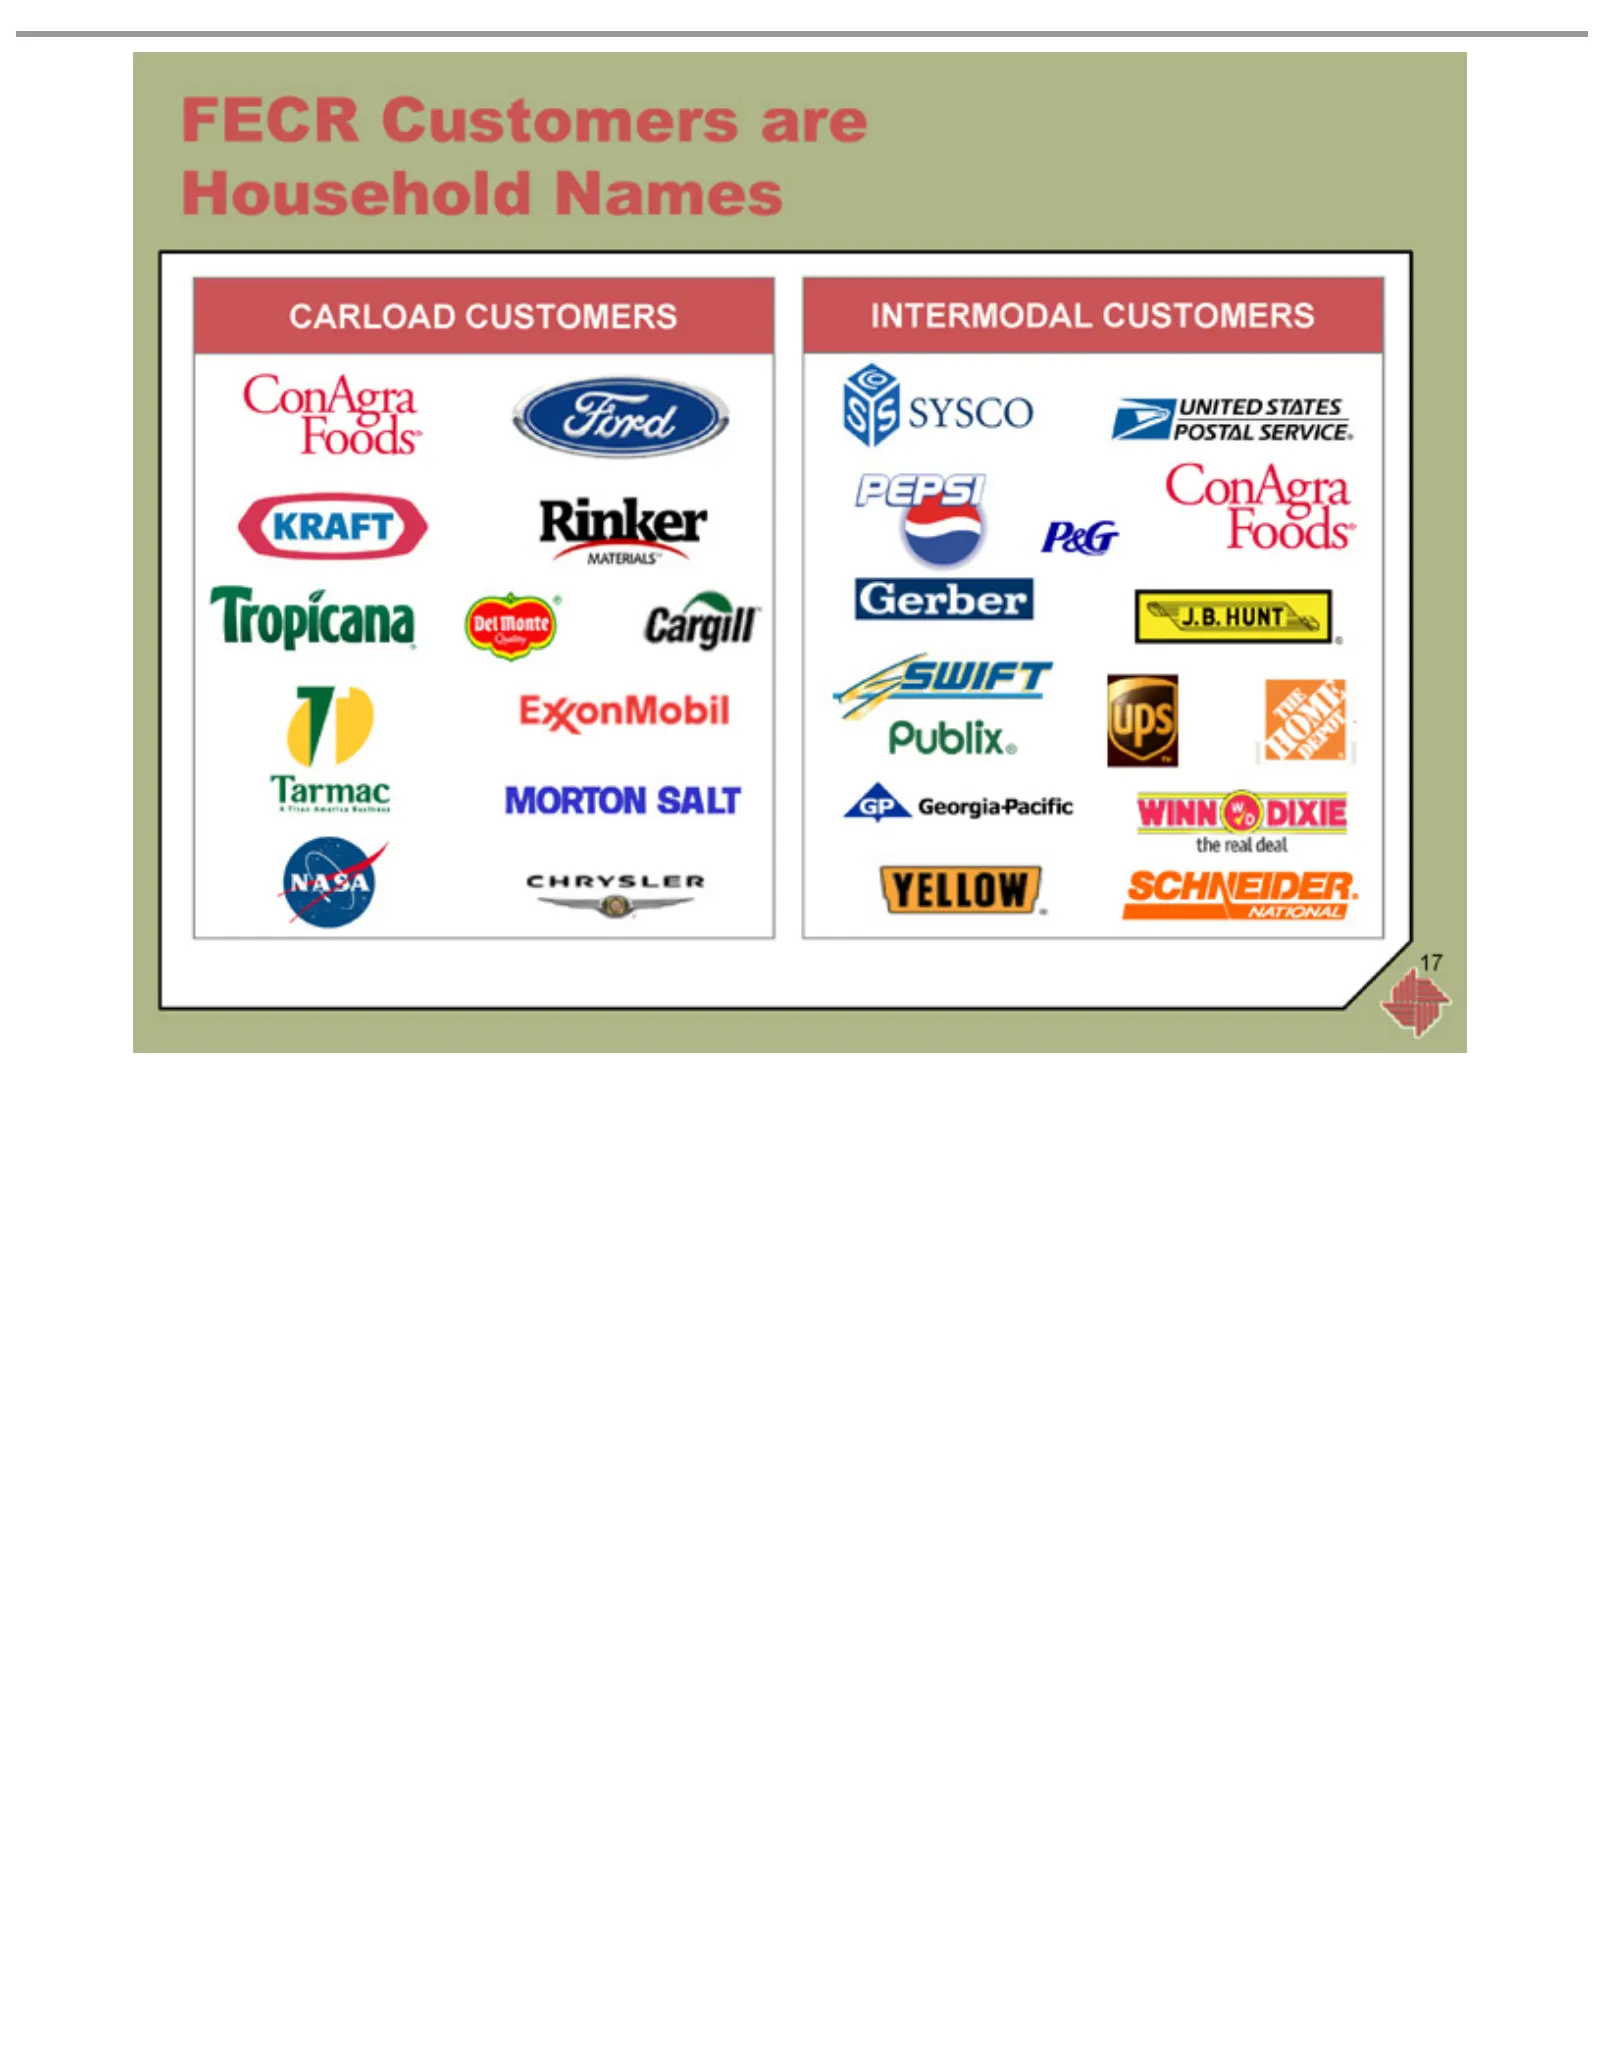
Slide 17: FECR customers
FECR Customers CARLOAD INTERMODAL 17 CUSTOMERS CUSTOMERS are Household Names
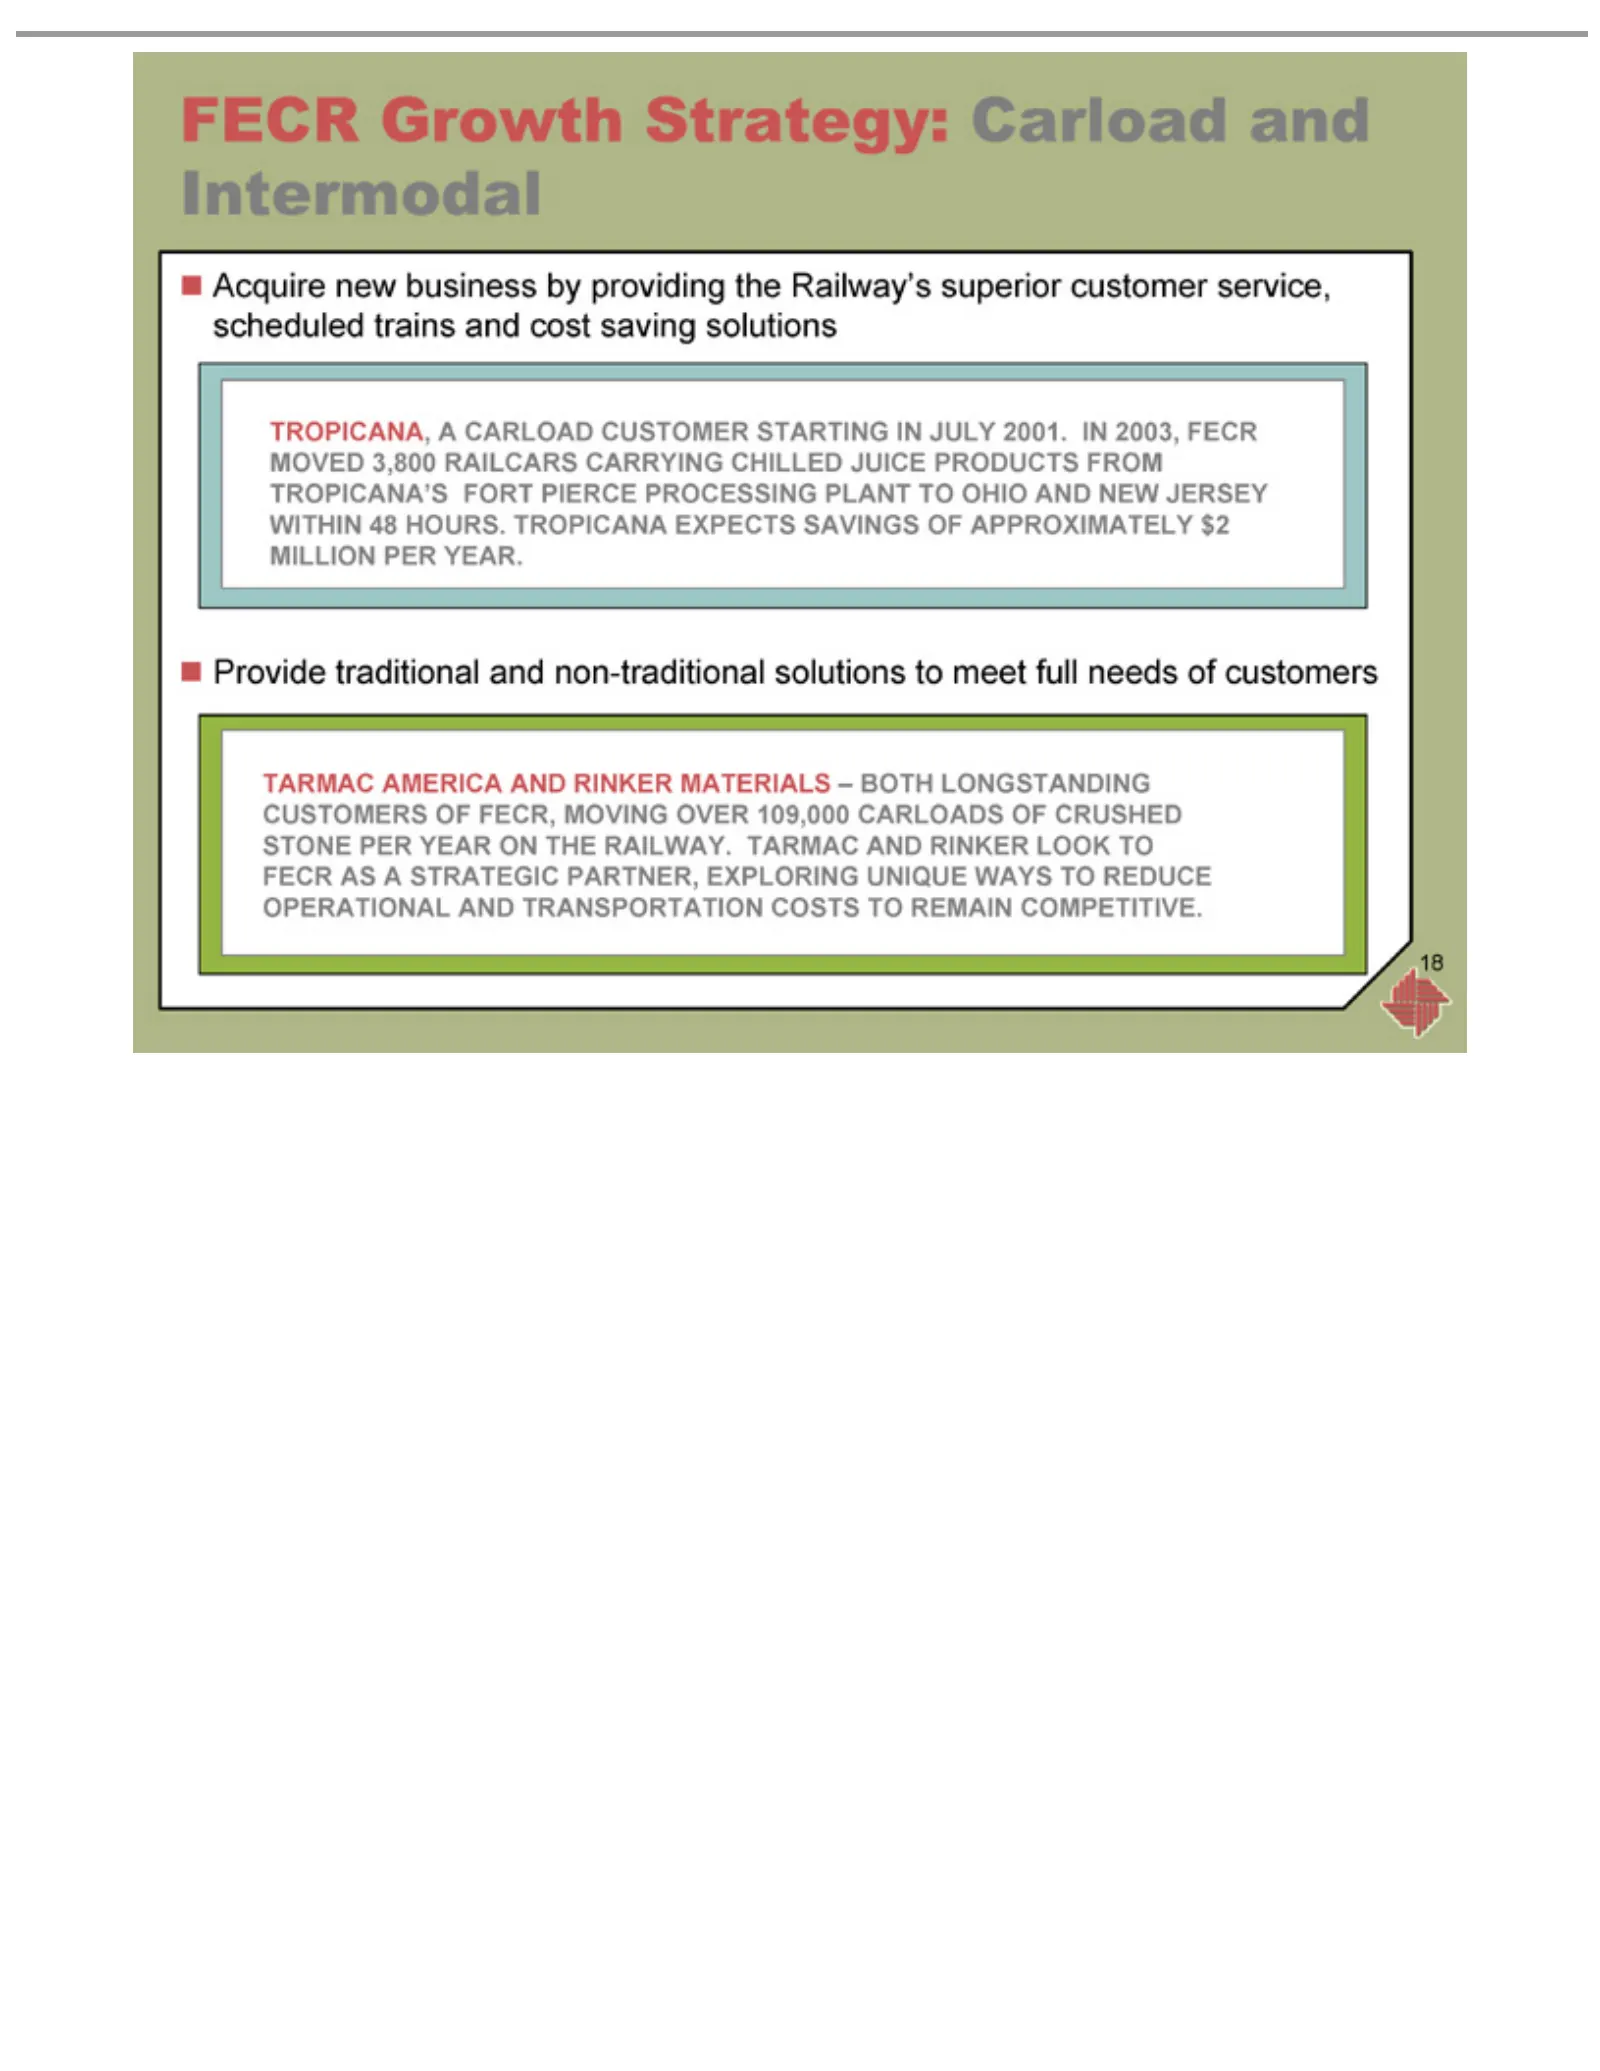
Slide 18: FECR growth strategy: carload
FECR Growth Acquire TROPICANA, PIERCE Provide TARMAC RAILWAY. REMAIN 18 traditional new PROCESSING COMPETITIVE. AMERICA TARMAC business Strategy: A CARLOAD andby AND non-traditional Carload PLANT providing RINKER CUSTOMER and TOthe Intermodal OHIO MATERIALS LOOK solutions Railway’s AND STARTING TOto
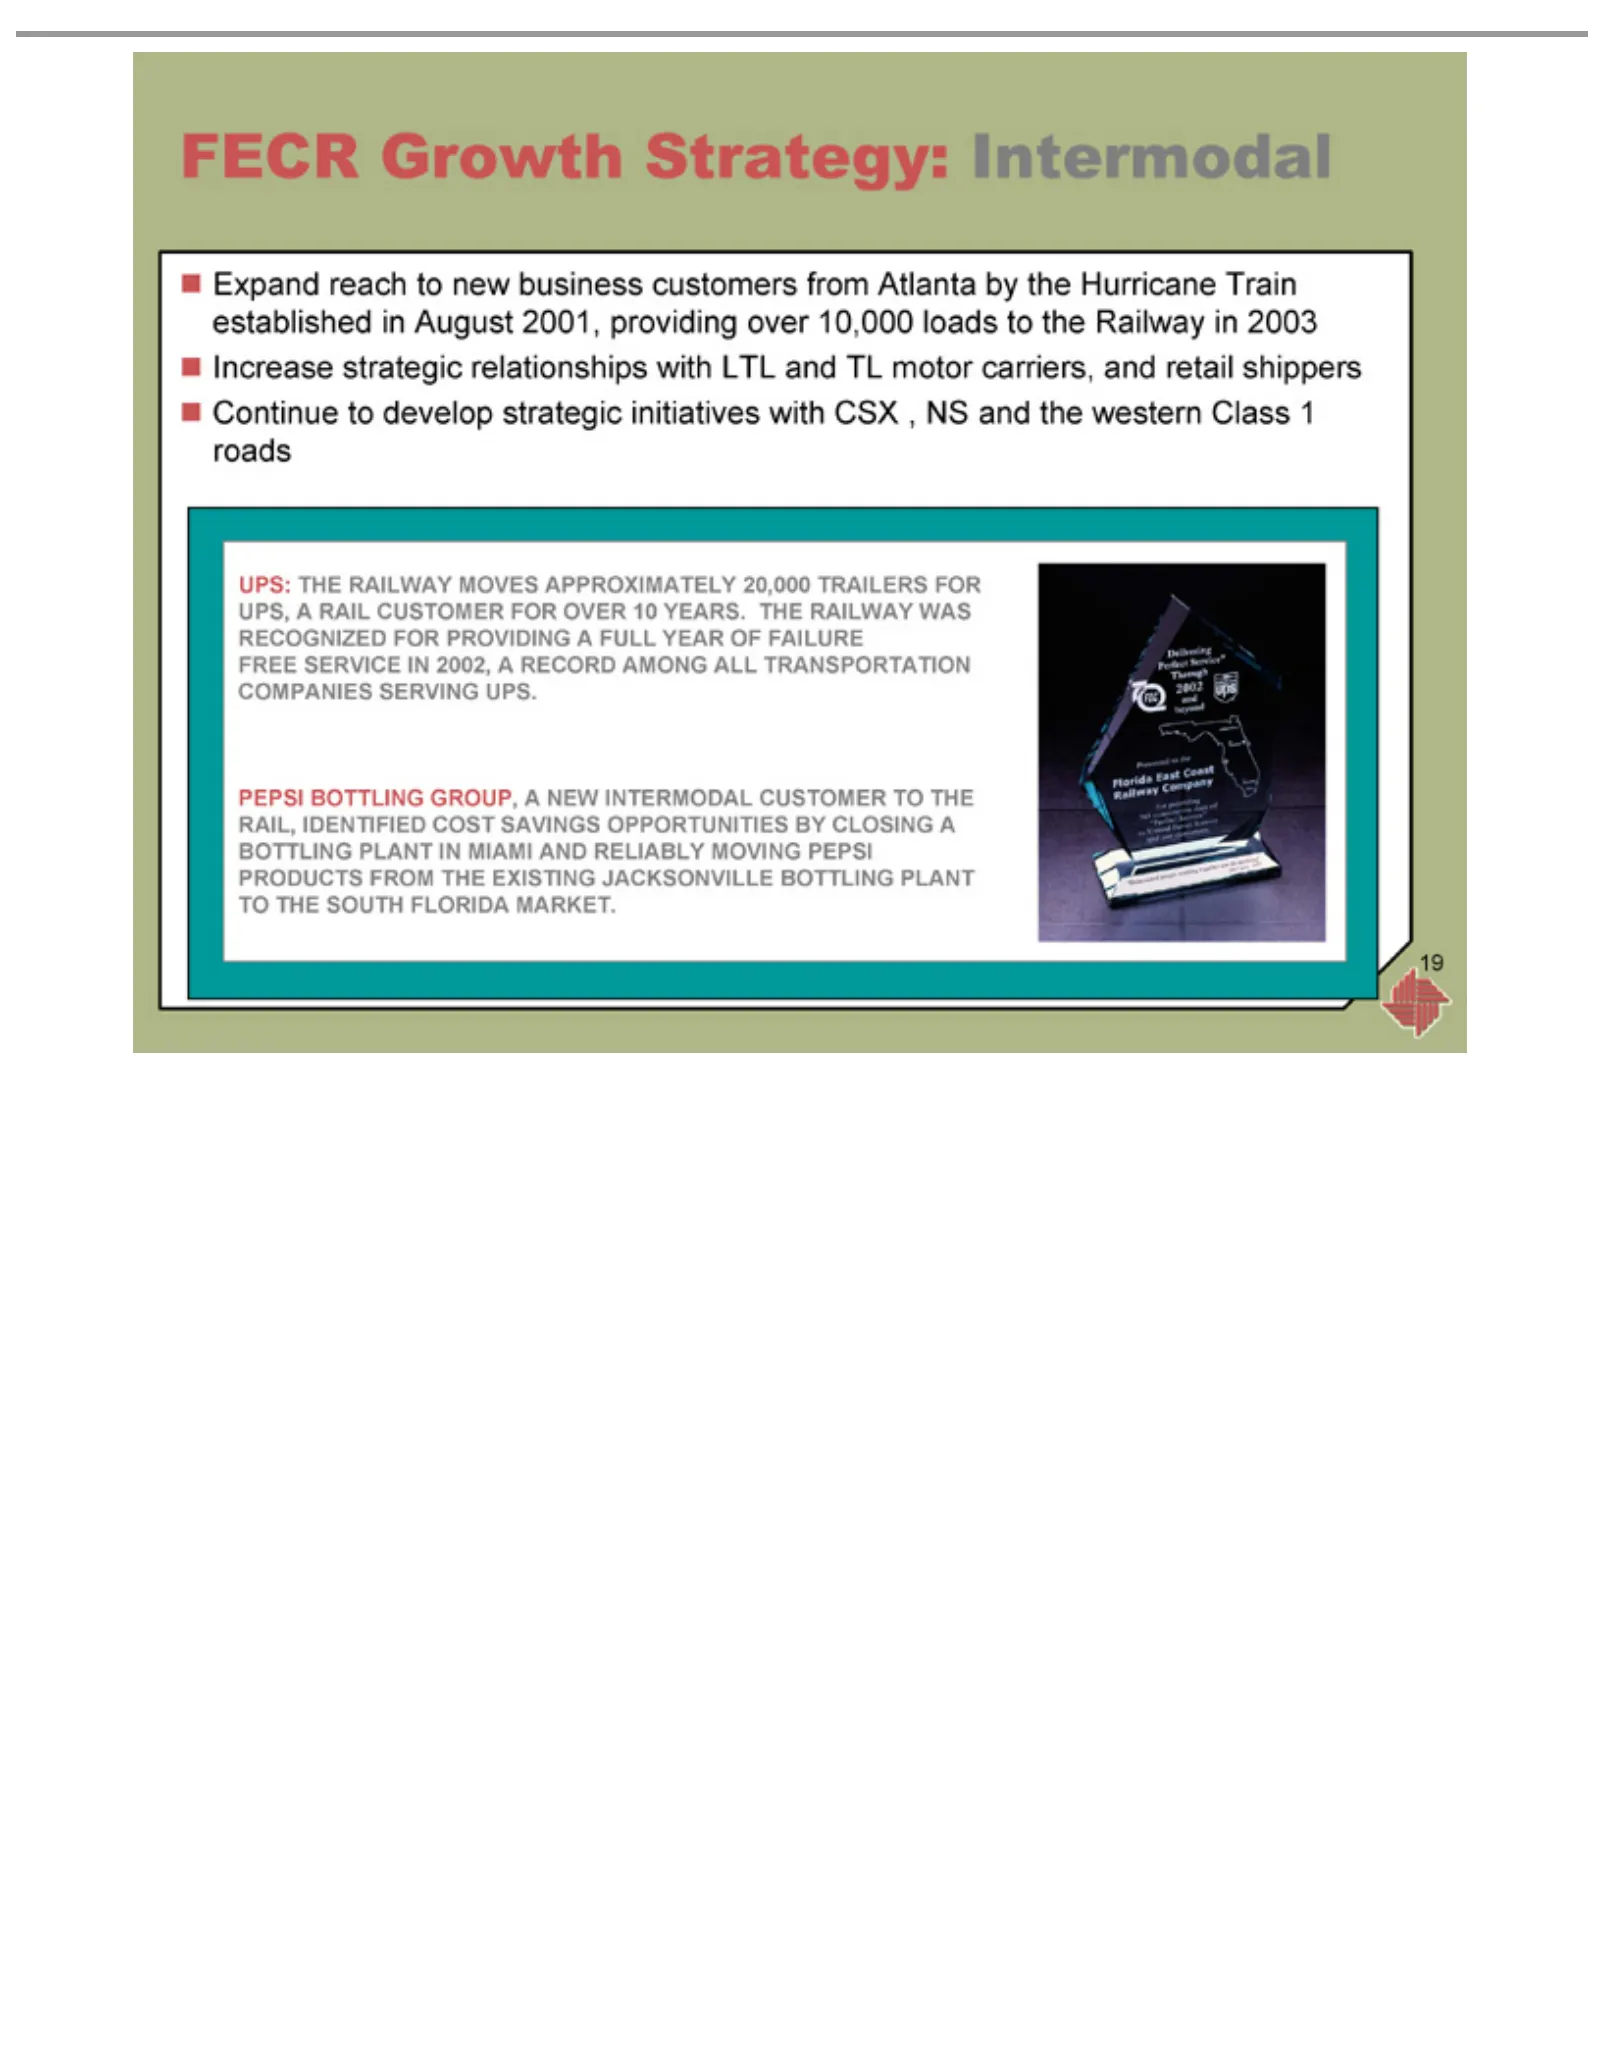
Slide 19: FECR growth strategy: intermodal
FECRTHE Expand Increase Continue UPS: FULL PEPSI RELIABLY 19 YEAR Growth BOTTLING reach strategic toRAILWAY develop MOVING OF toStrategy: new FAILURE relationships GROUP, strategic business MOVES PEPSI Intermodal FREE A initiatives PRODUCTS customers with NEW APPROXIMATELY SERVICE LTL INTERMODAL wit
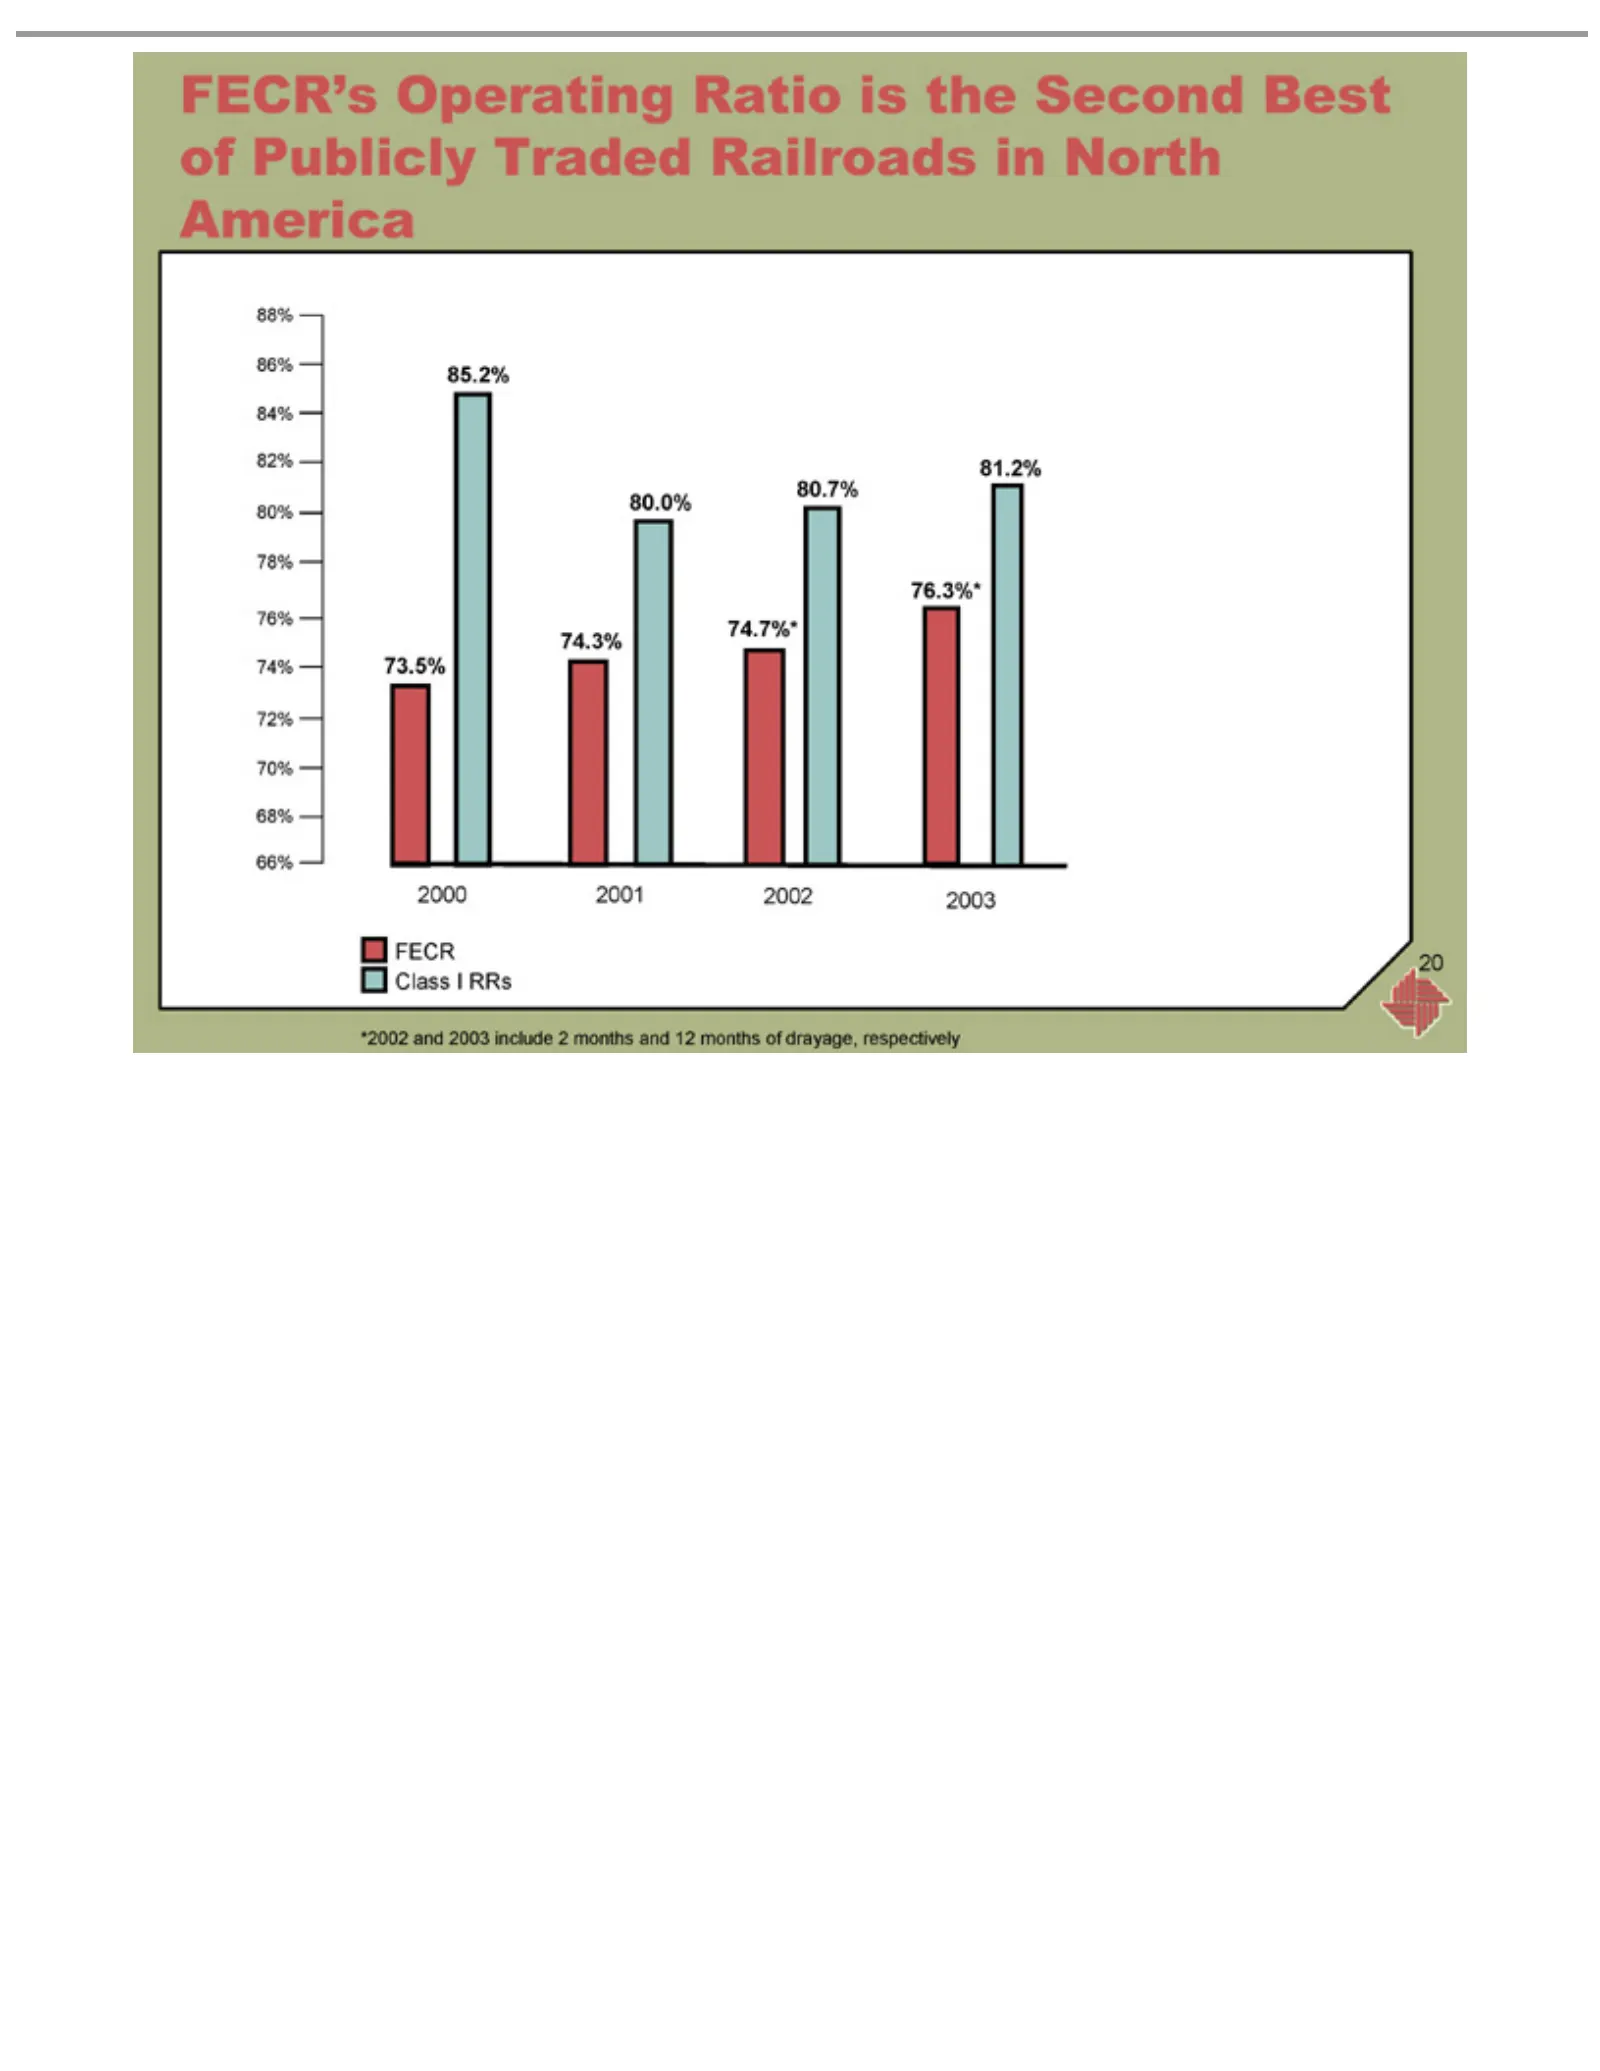
Slide 20: FECR's operating ratio
FECR’s Class FECR 2003 81.2% 76.3%* 2002 80.7% 74.7%* 2001 80.0% 74.3% 2000 85.2% 73.5% *2002 20 Iand RRs Operating 2003 include Ratio 2ismonths the Second and 12 Best months of Publicly of drayage, Tradedrespectively Railroads in North America
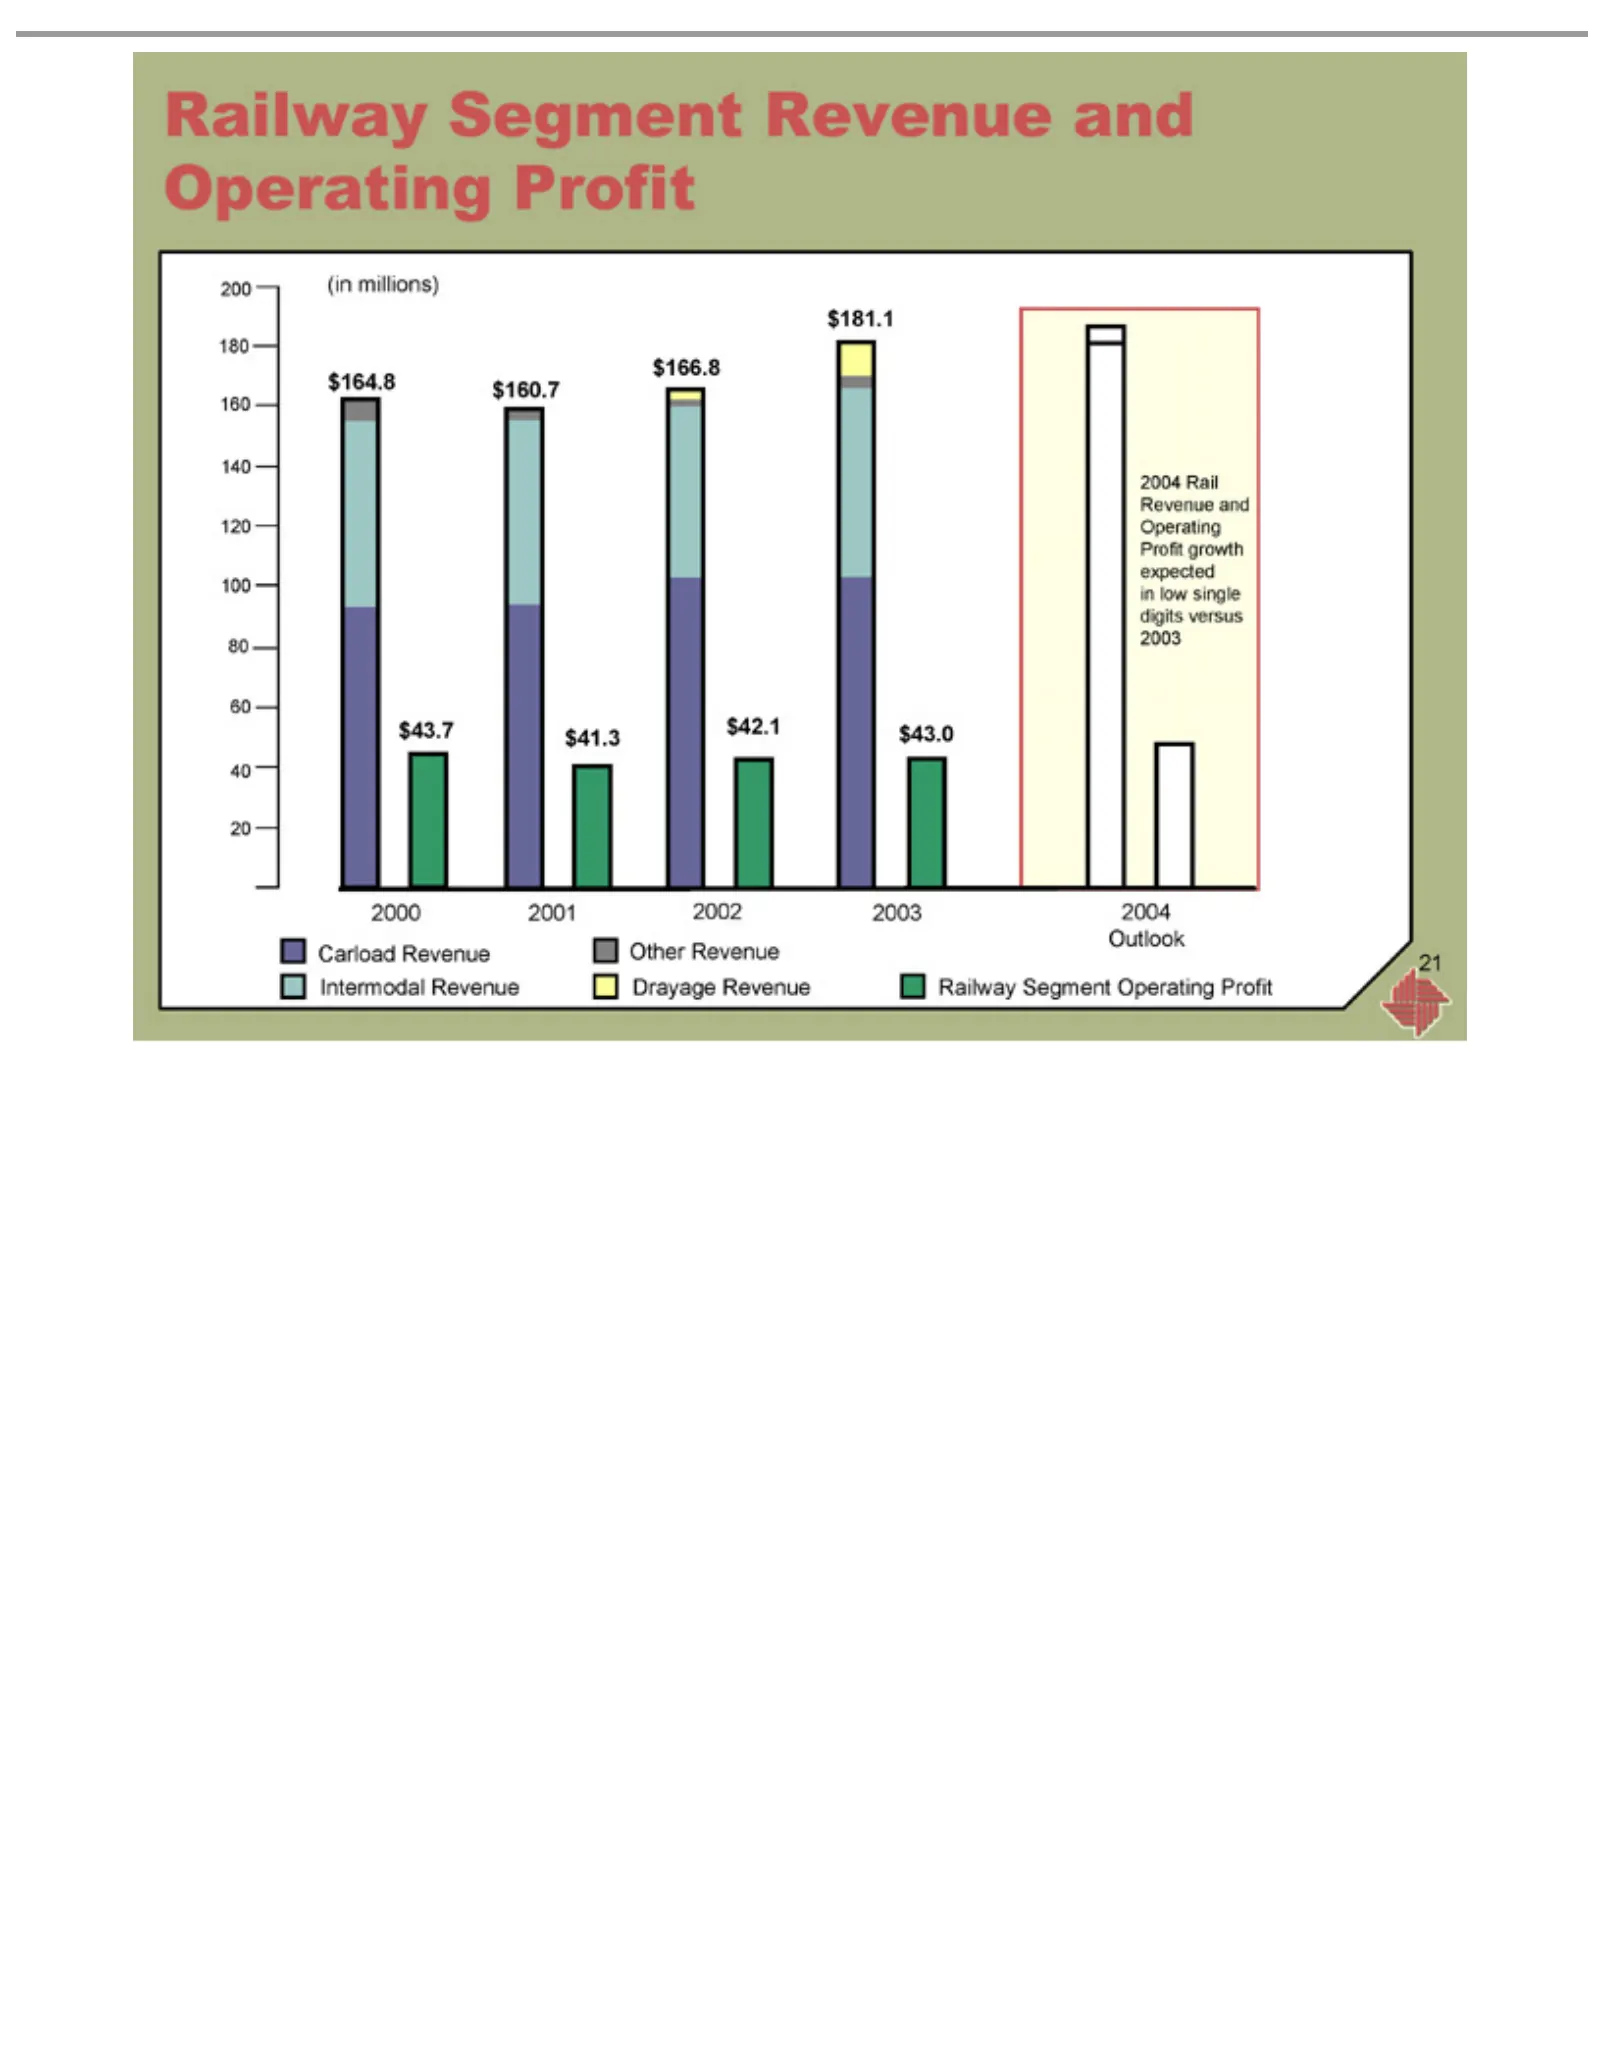
Slide 21: Railway revenue and 2004 outlook
(in millions) $164.8 $160.7 2000 $166.8 2001 $181.1 2002 Carload 2003 Other Railway 2004 21 Rail Outlook Revenue $43.7 $41.3 $42.1 $43.0 Revenue Segment Revenue Drayage Intermodal Revenue Operating and Operating Revenue and Profit Revenue Operating Profit growth Profit expected in low single digits
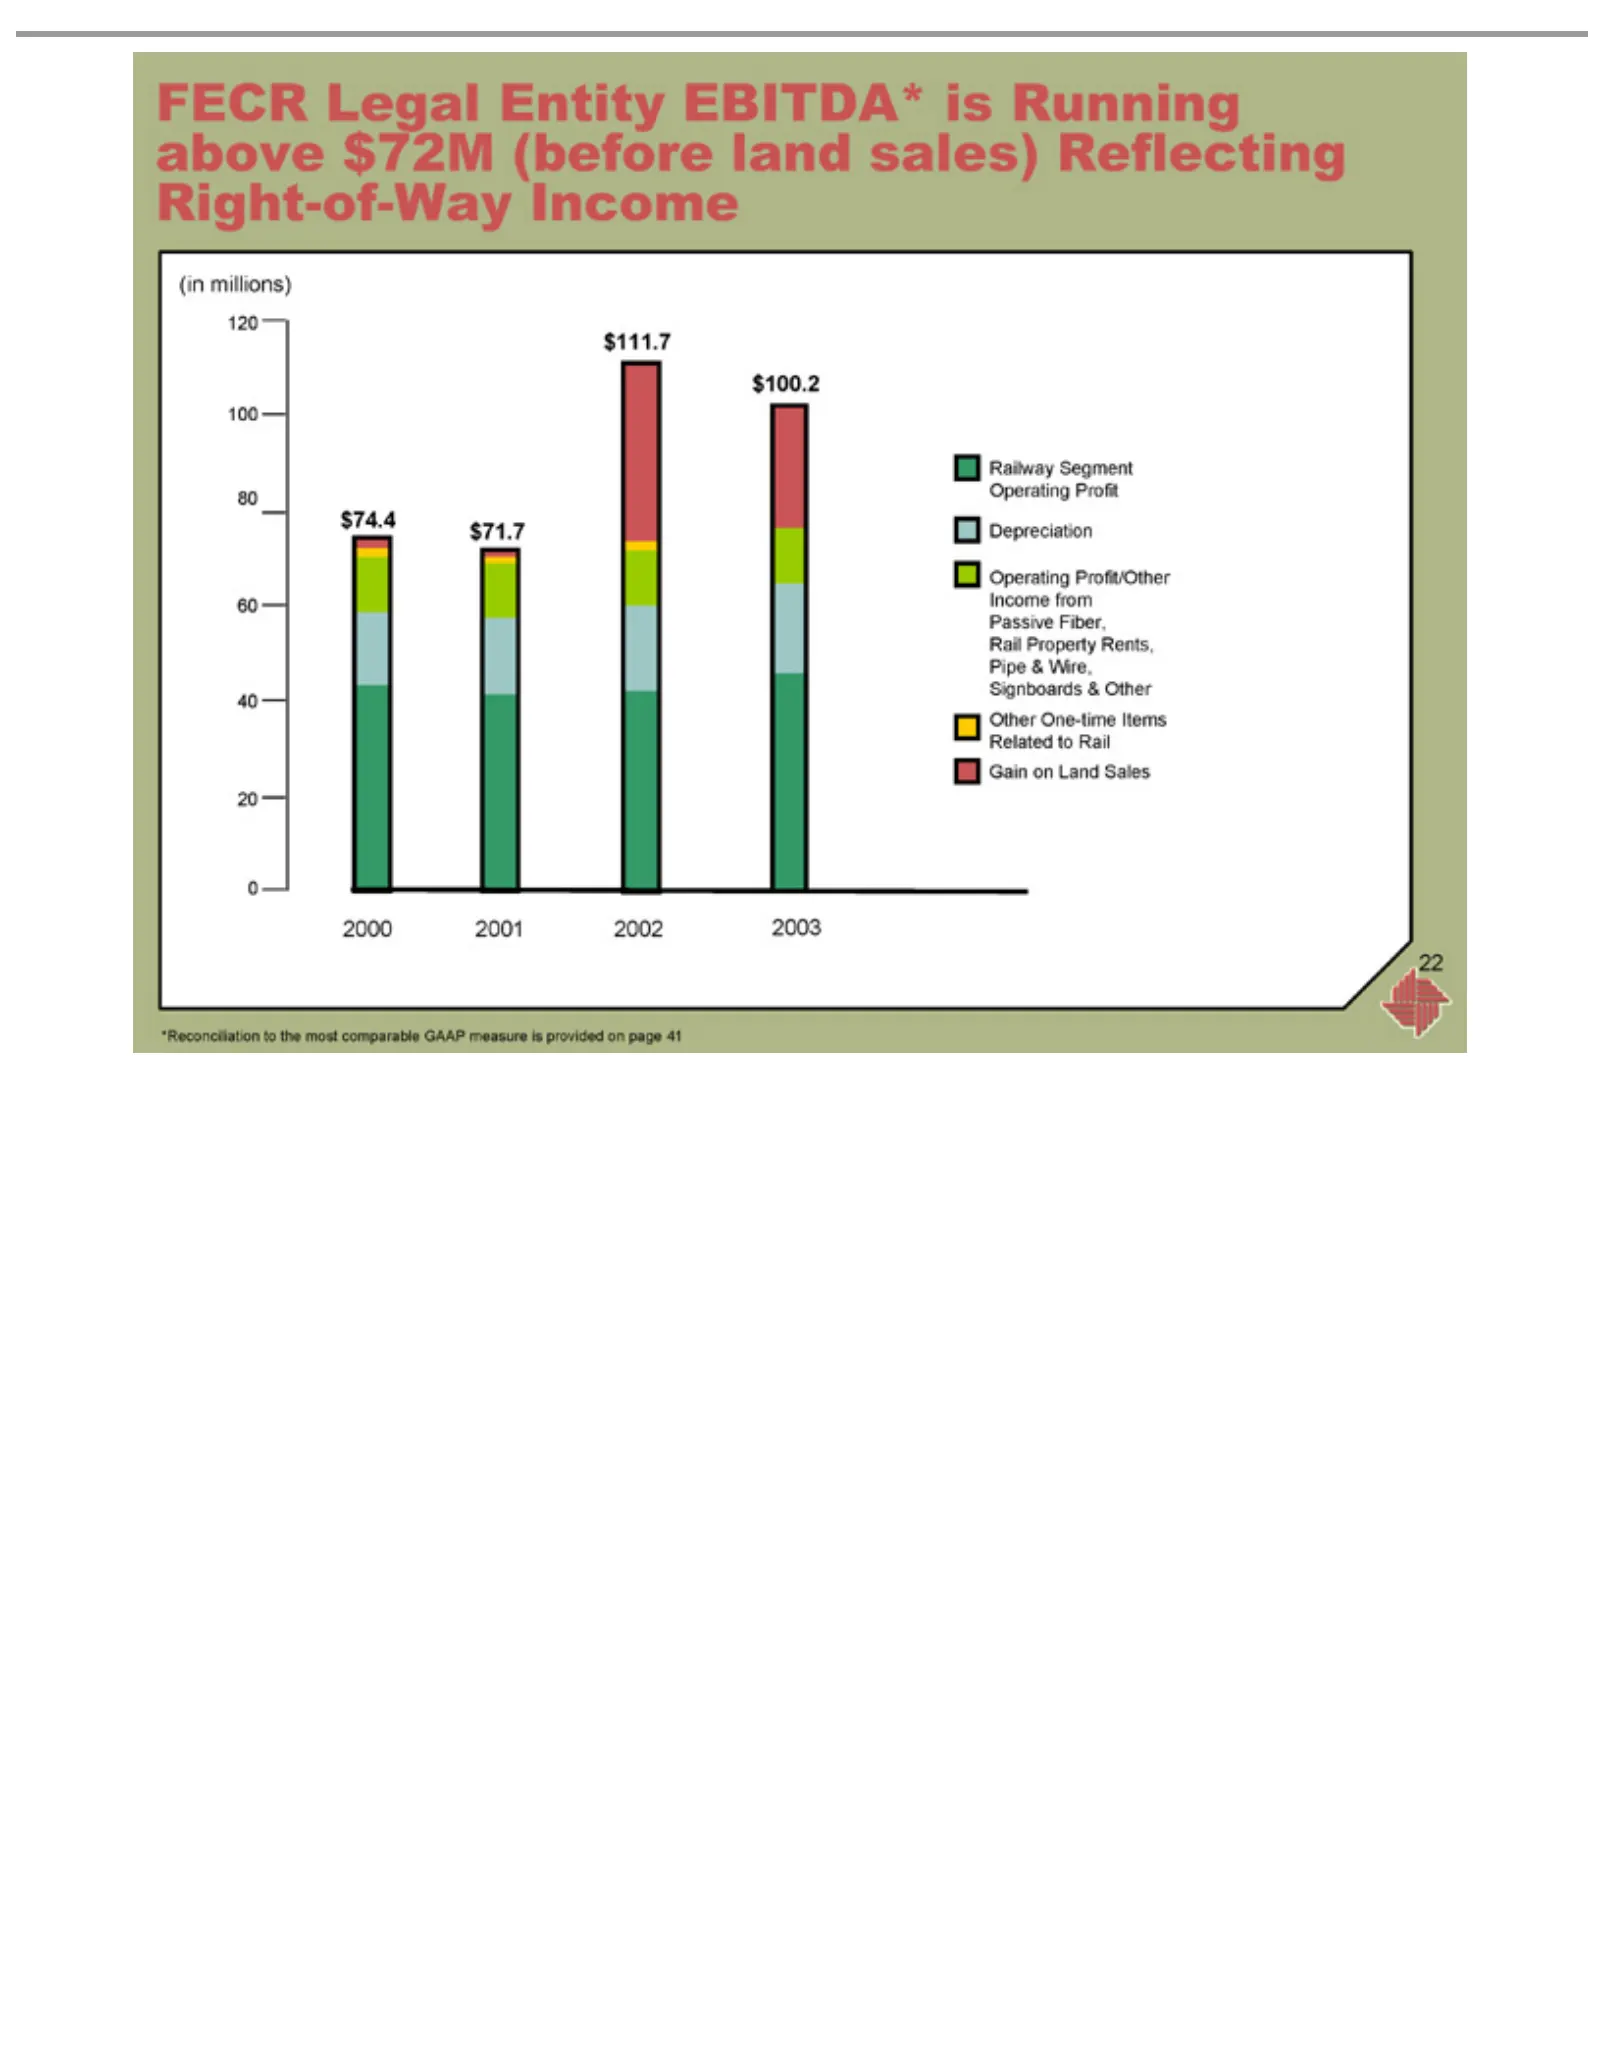
Slide 22: FECR operating profit and EBITDA
FECR (in Railway 2003 $100.2 2002 $111.7 2001 $71.7 2000 $74.4 Operating Depreciation Other Gain 22 millions) on One-time Legal Land Segment Profit/Other Entity Sales Items Operating EBITDA* Related Income Profit to isfrom Running RailPassive above Fiber, $72M Rail(before Property land Rents, sales)
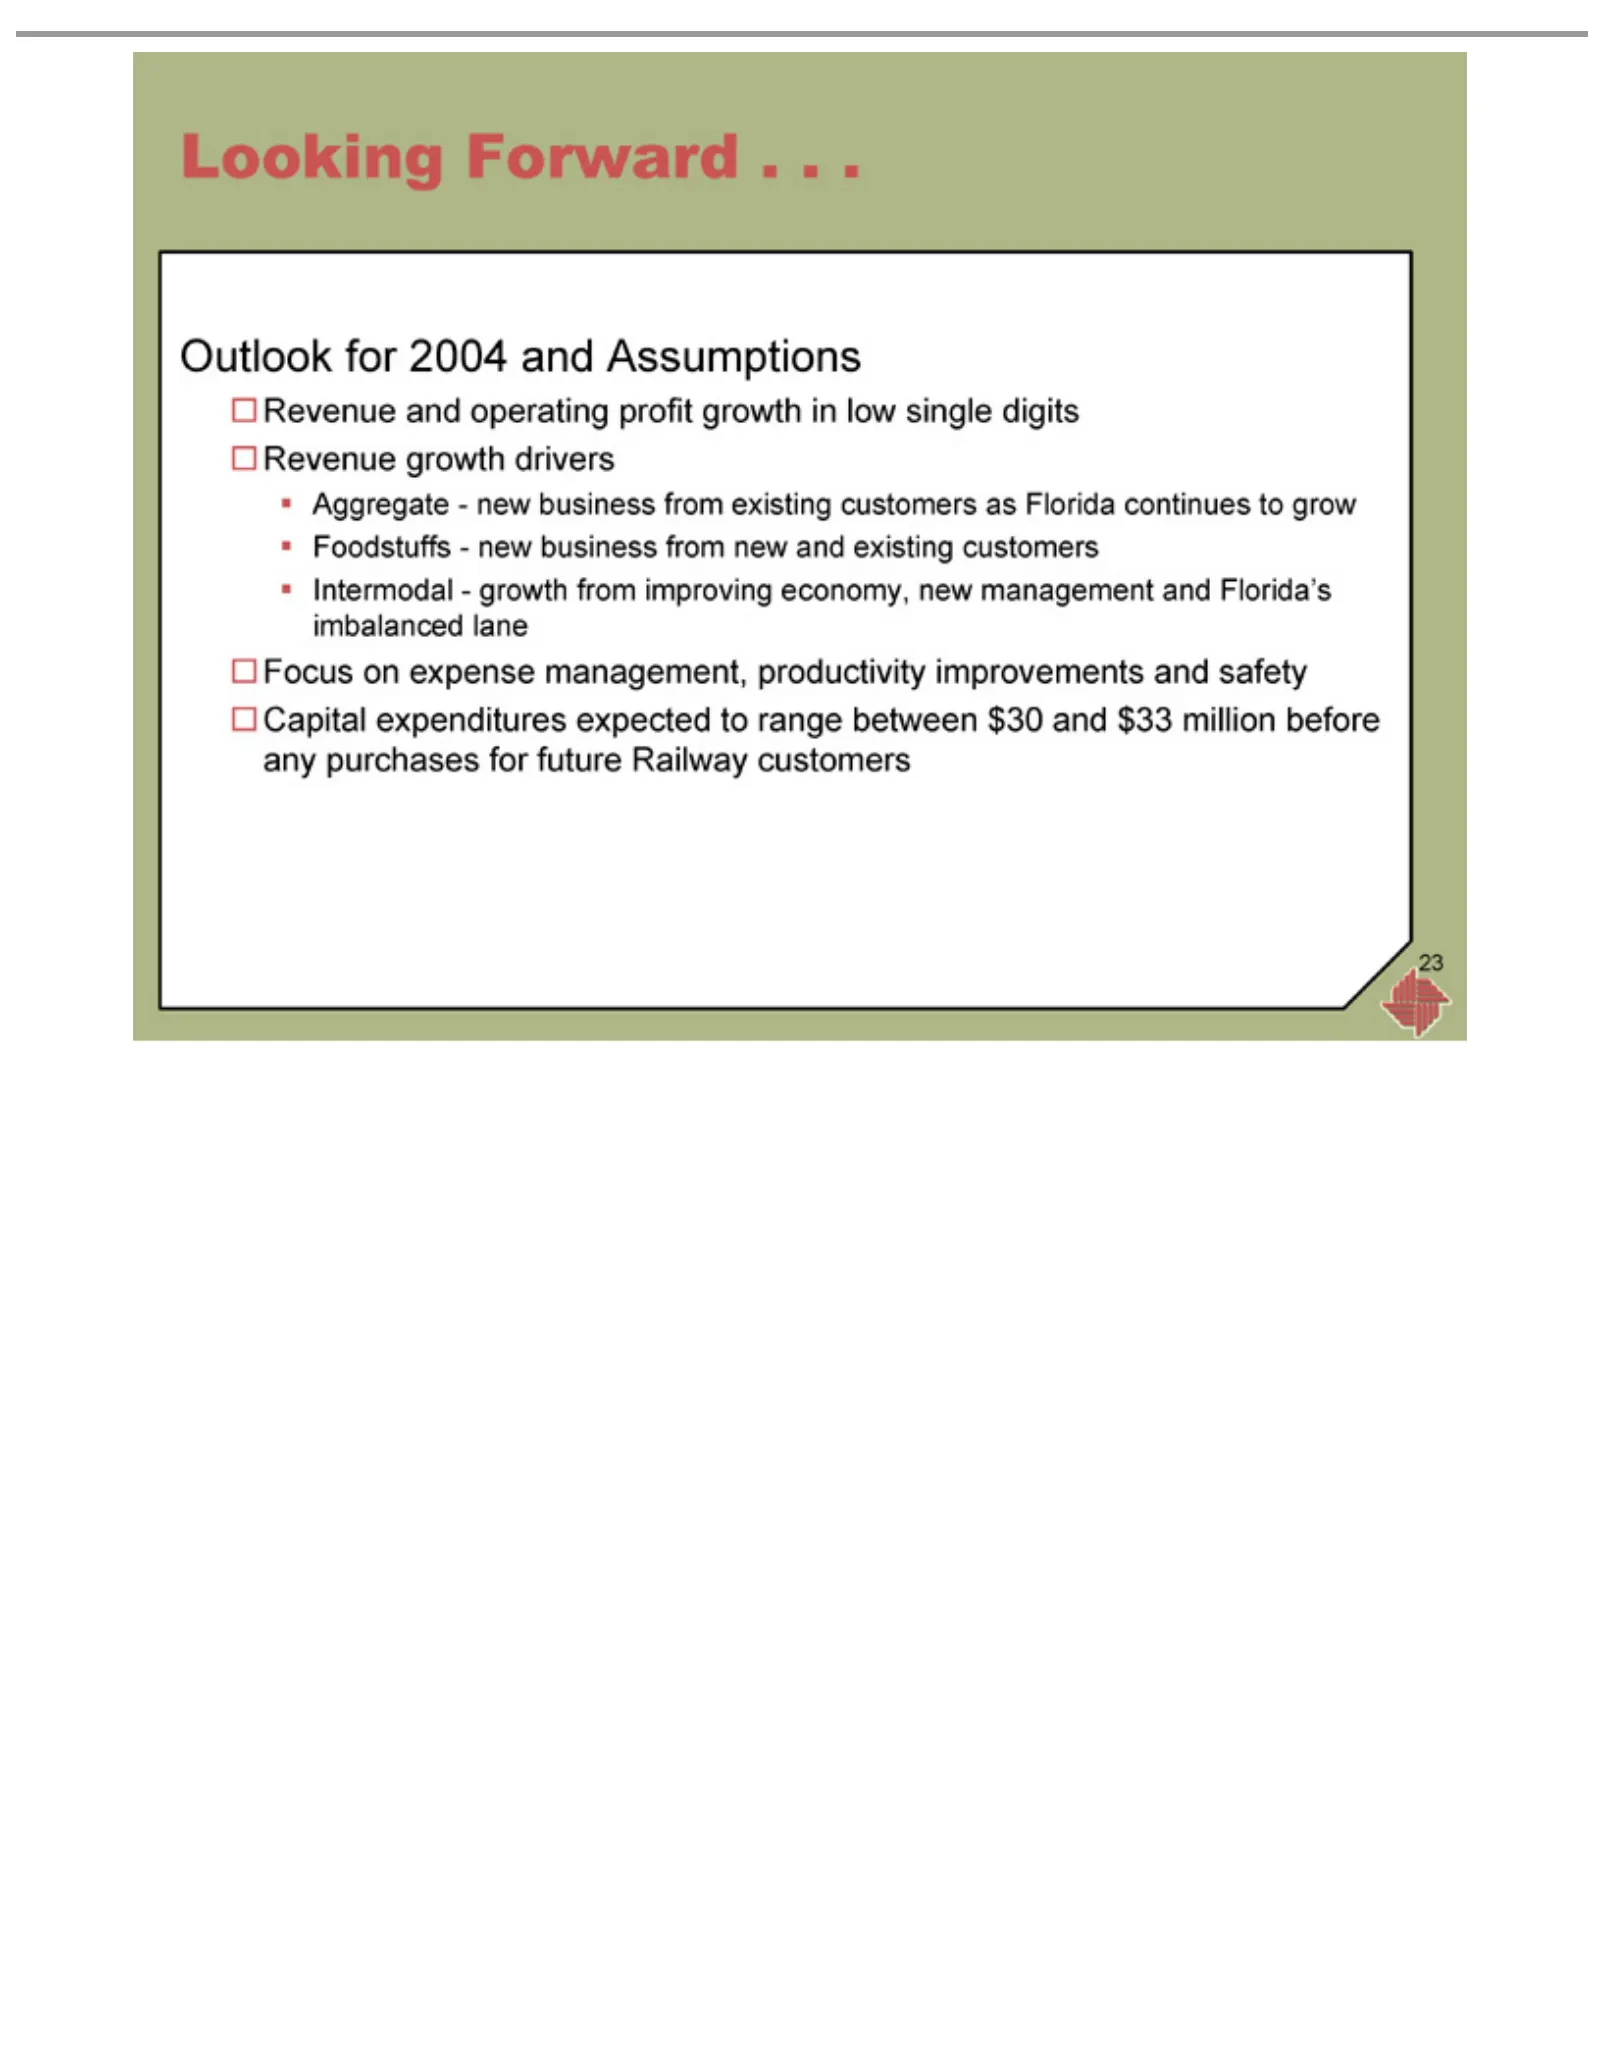
Slide 23: Looking forward: railway outlook 2004
Looking Outlook Revenue Aggregate—new Foodstuffs—new Intermodal—growth Focus Capital 23 onexpenditures for Forward and growth expense 2004 operating drivers business and .management, .. from expected . Assumptions profit improving fromgrowth toexisting productivity new range and in economy, between
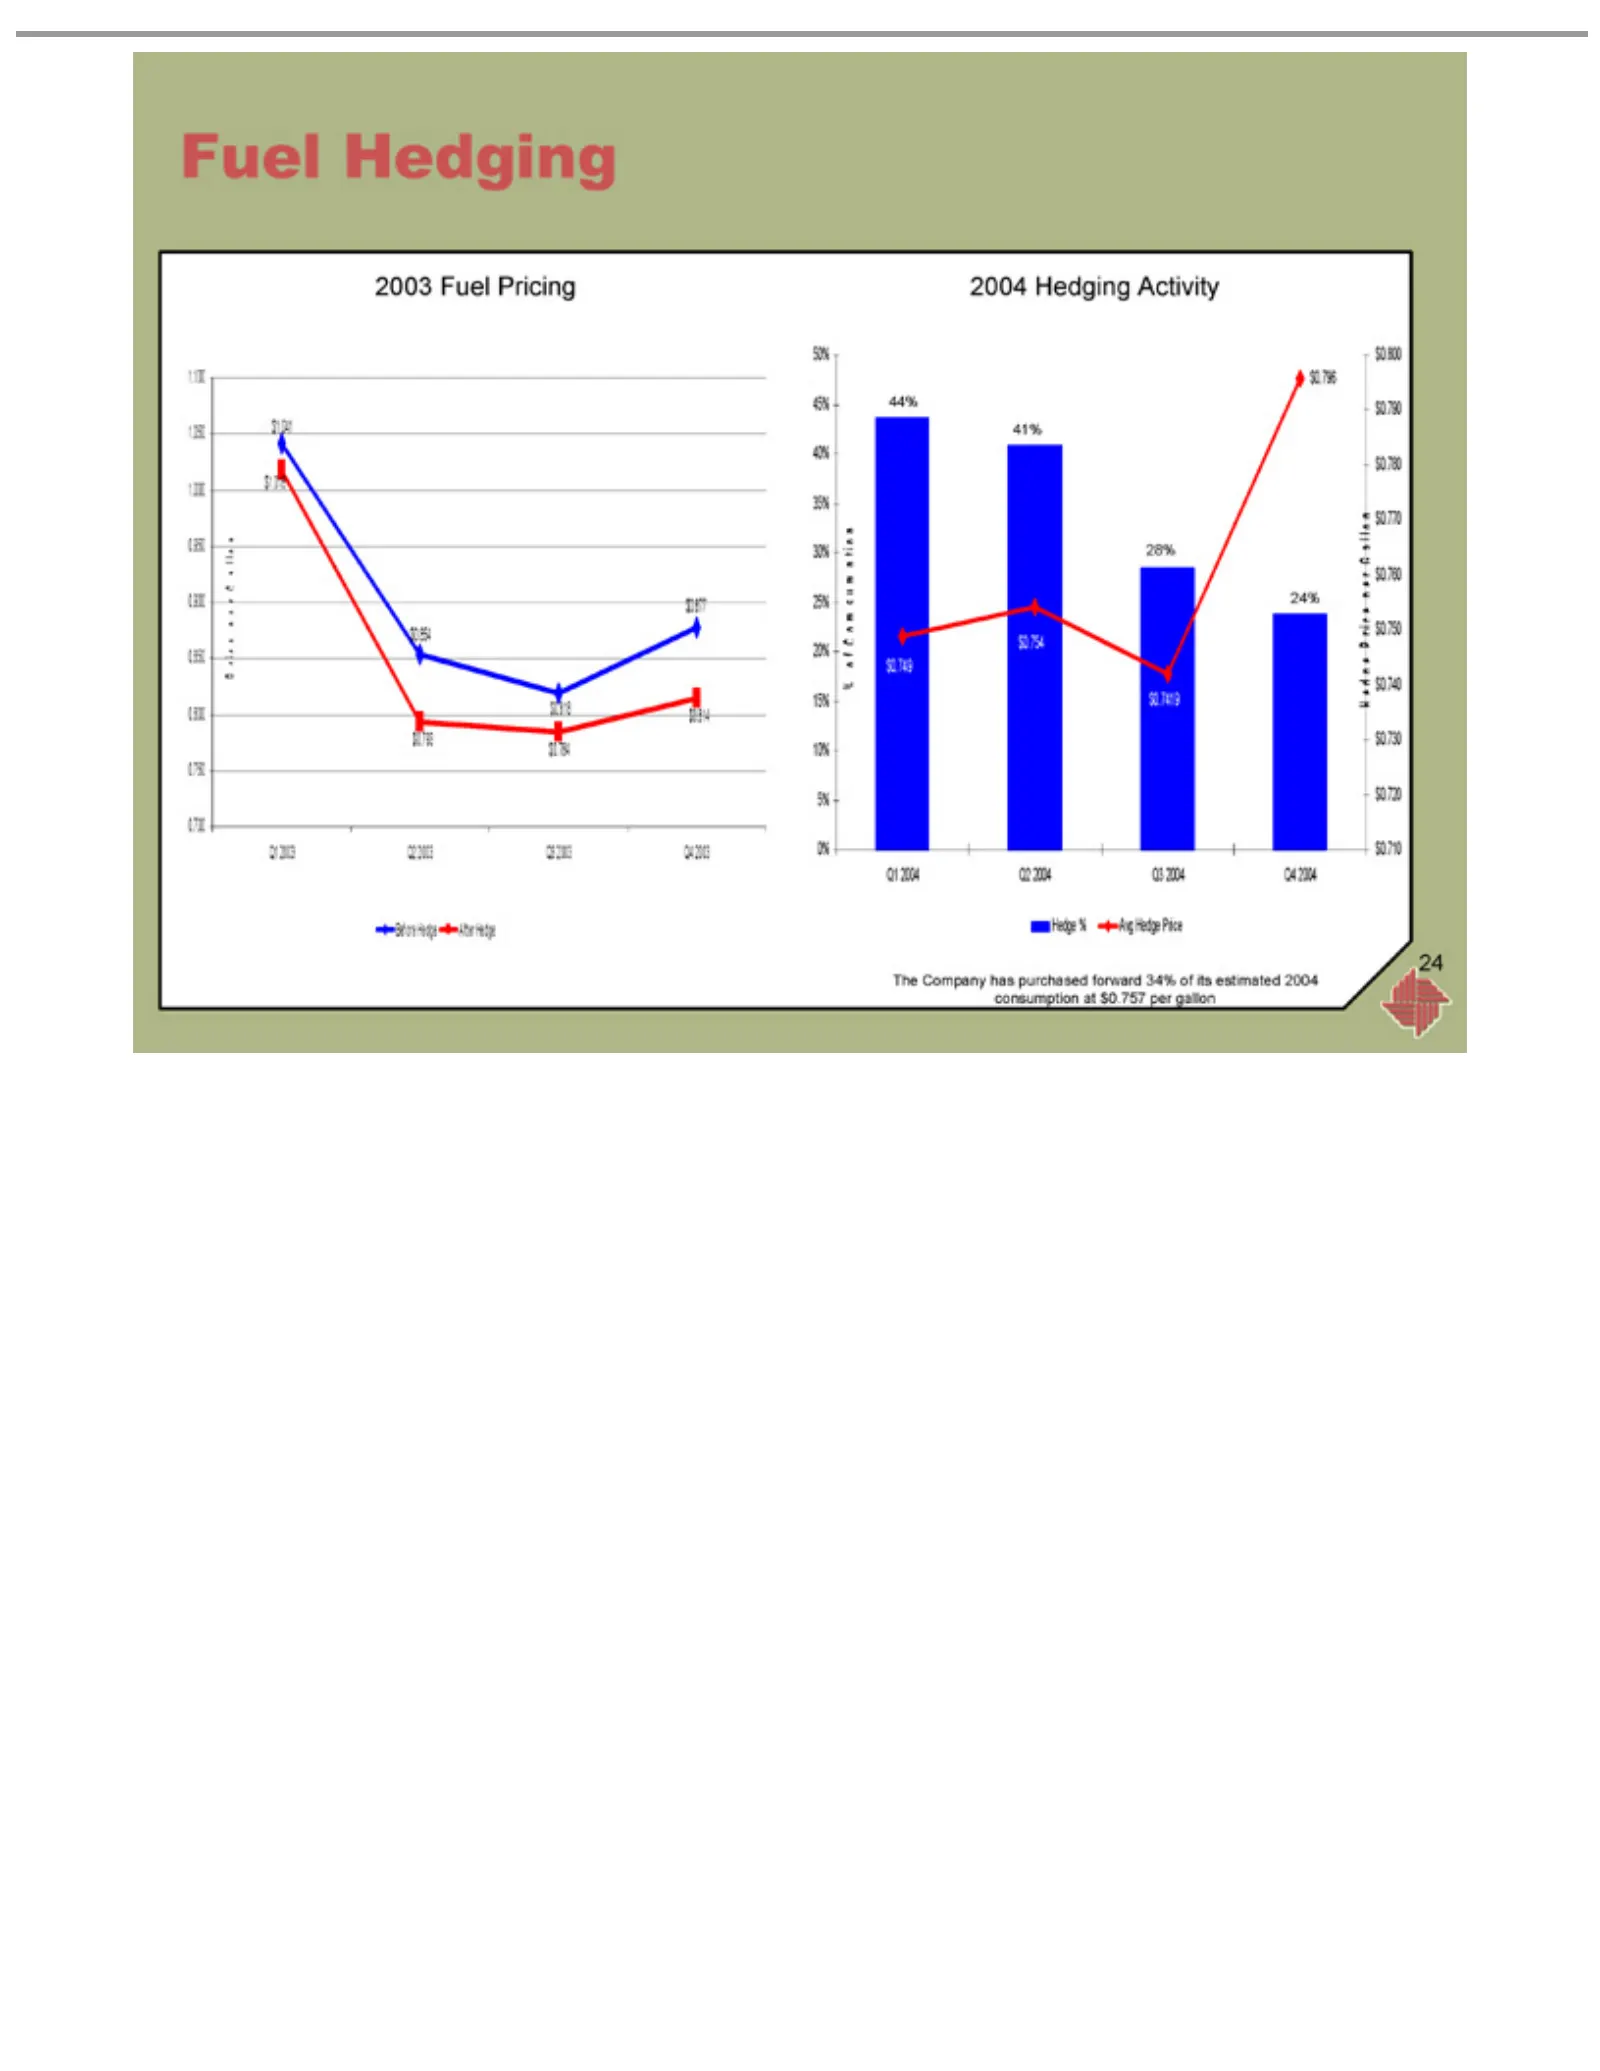
Slide 24: 2004 fuel hedge
2003Company Before 2004 Hedge The 24 Fuel Hedging Hedge Pricing % Avg After Activity has purchased Hedge HedgePrice forward 34% of its estimated 2004 consumption at $0.757 per gallon
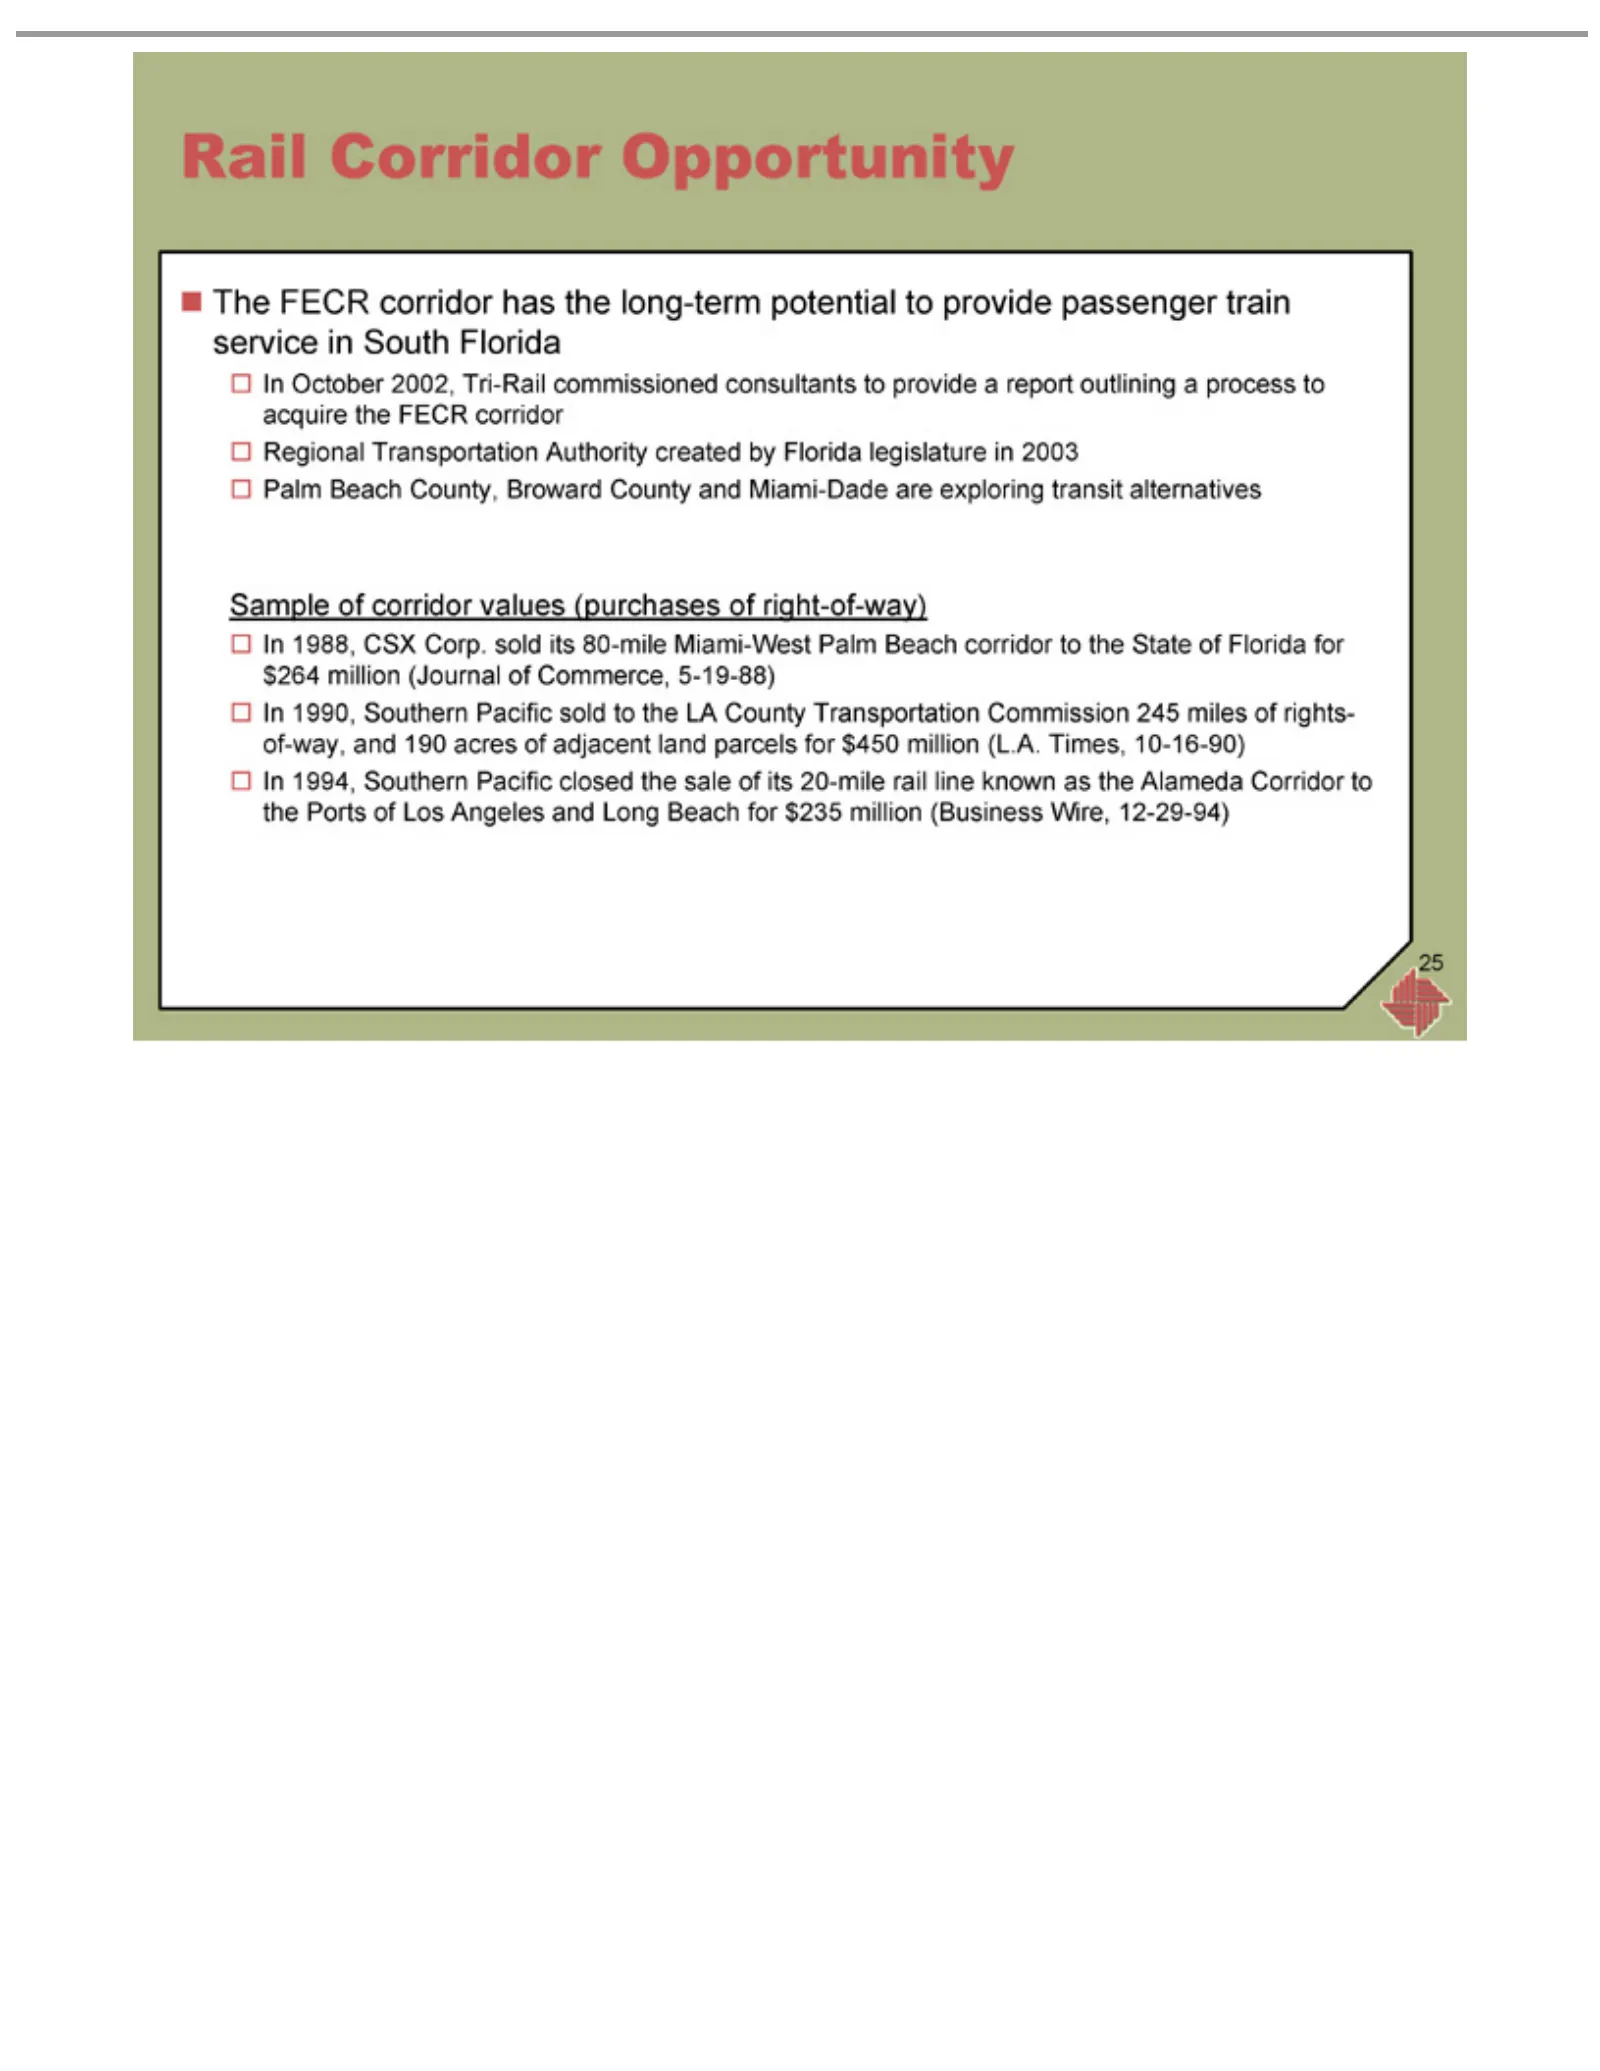
Slide 25: The regional rail corridor opportunity
Rail The Regional Palm Sample In 25 October 1988, 1990, 1994, FECR Corridor Beach ofSouthern CSX Transportation corridor 2002, corridor County, Opportunity Corp. Tri-Rail Pacific values has sold Broward the Authority its sold closed commissioned (purchases long-term 80-mile County to the the created
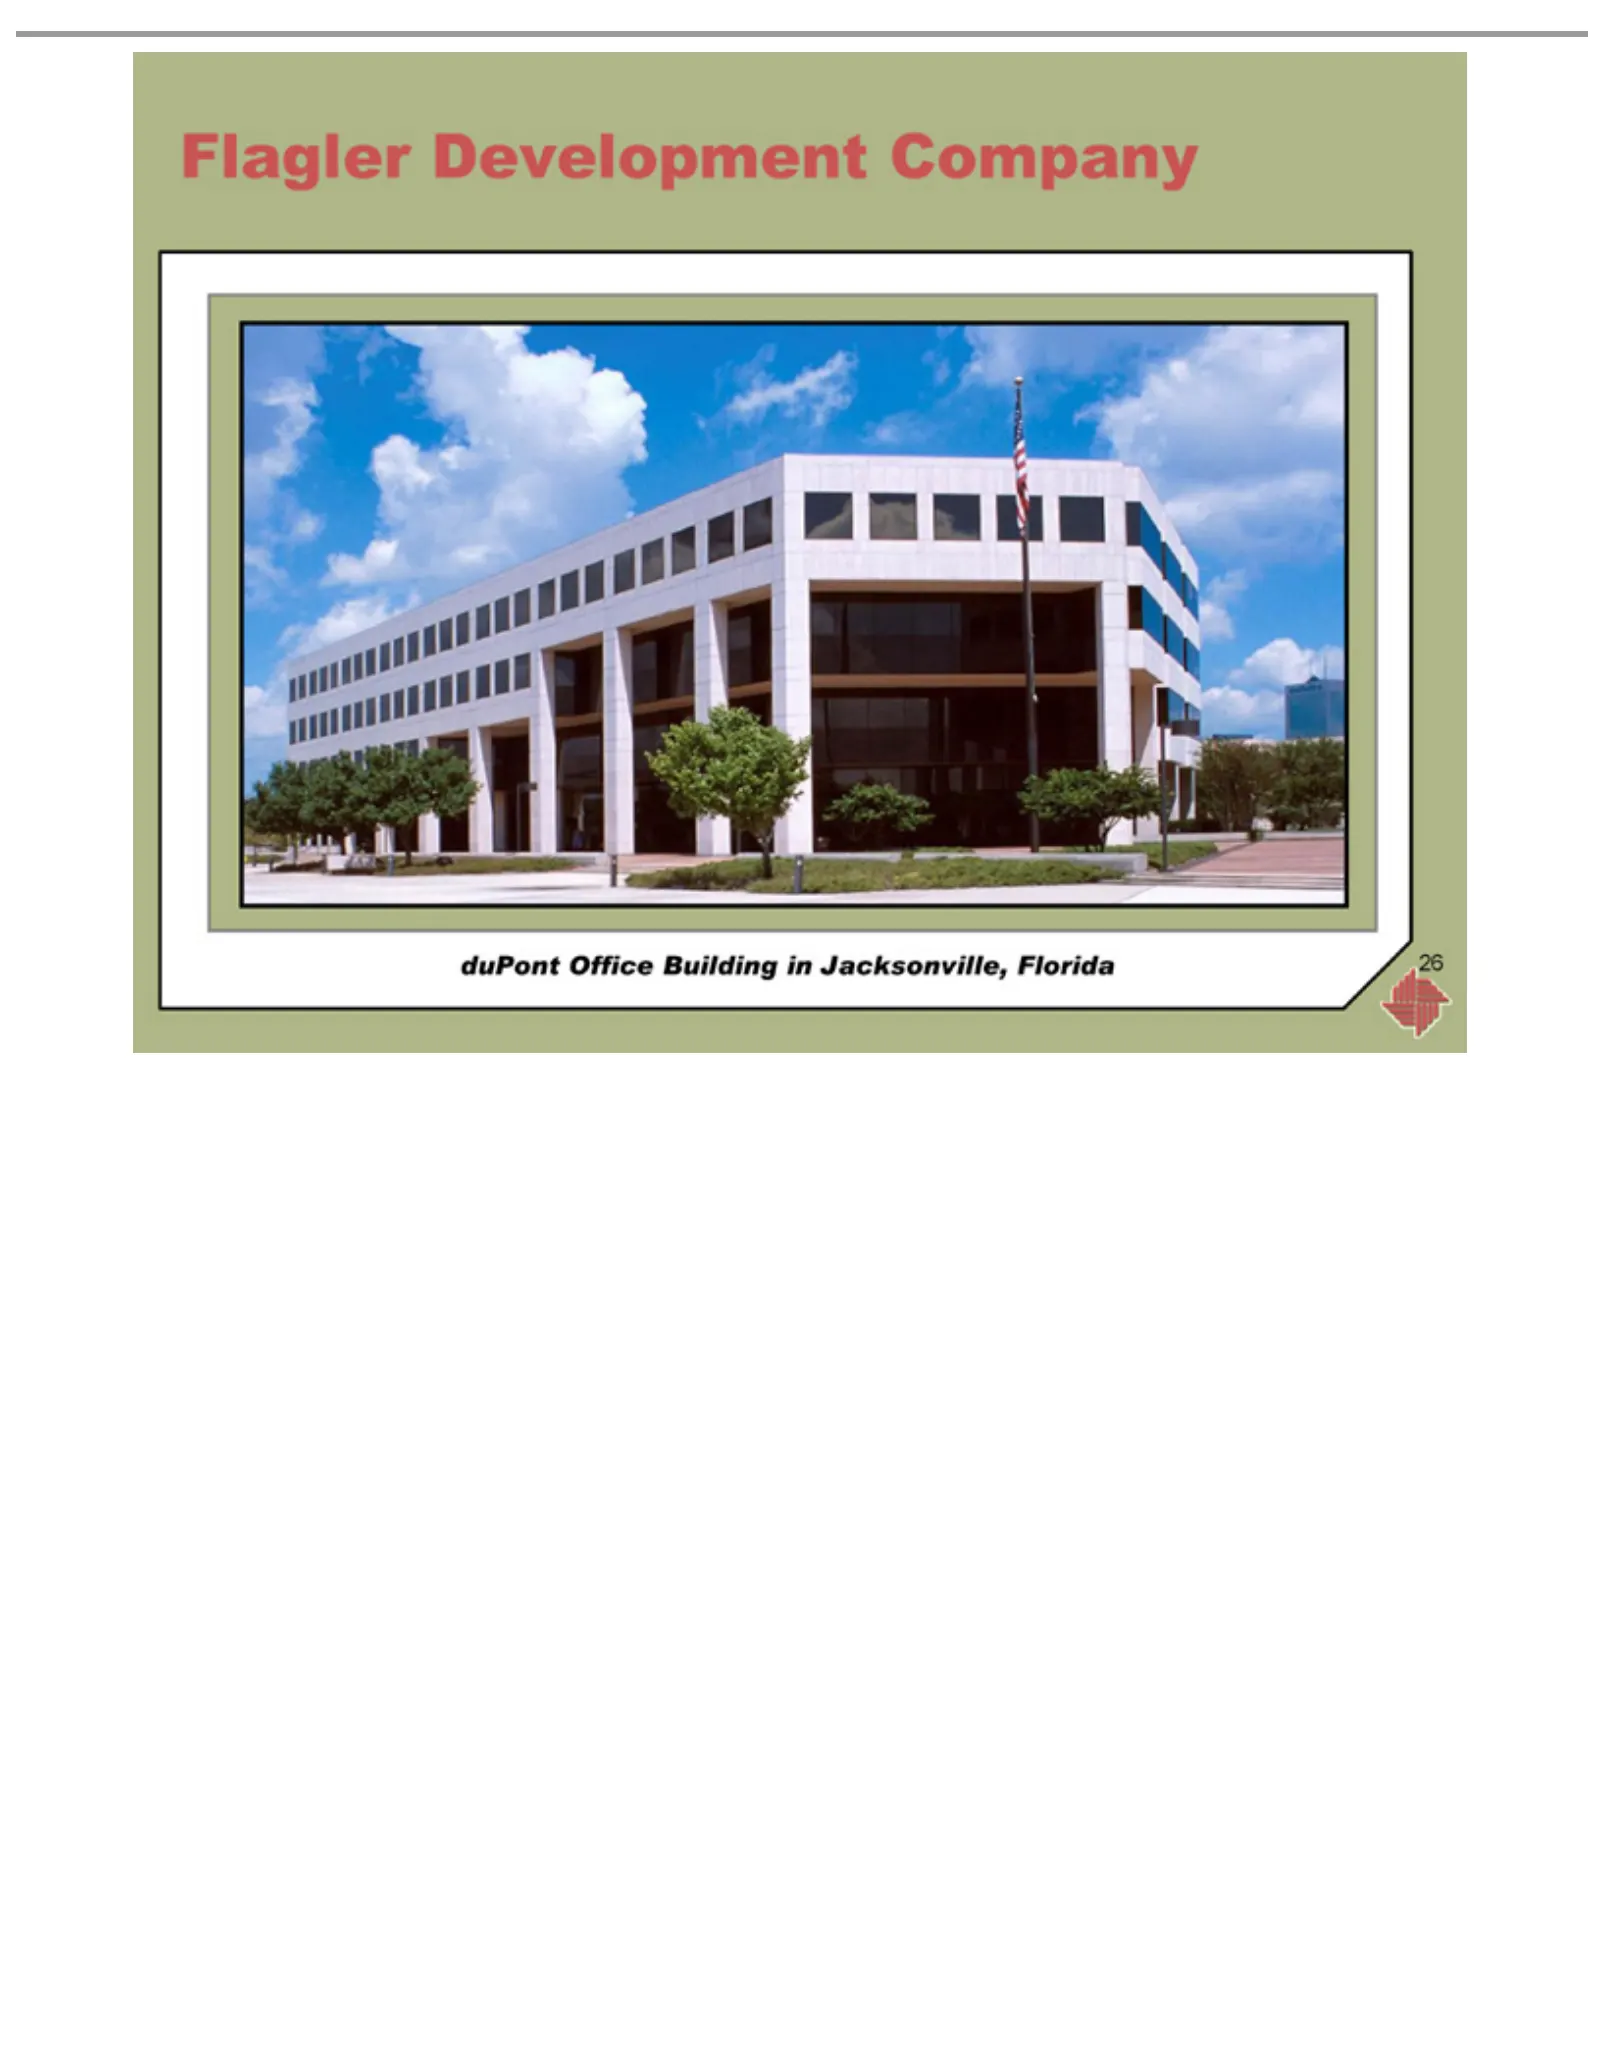
Slide 26: Flagler Development Company
Flagler Development duPont 26 Office Building Company in Jacksonville, Florida
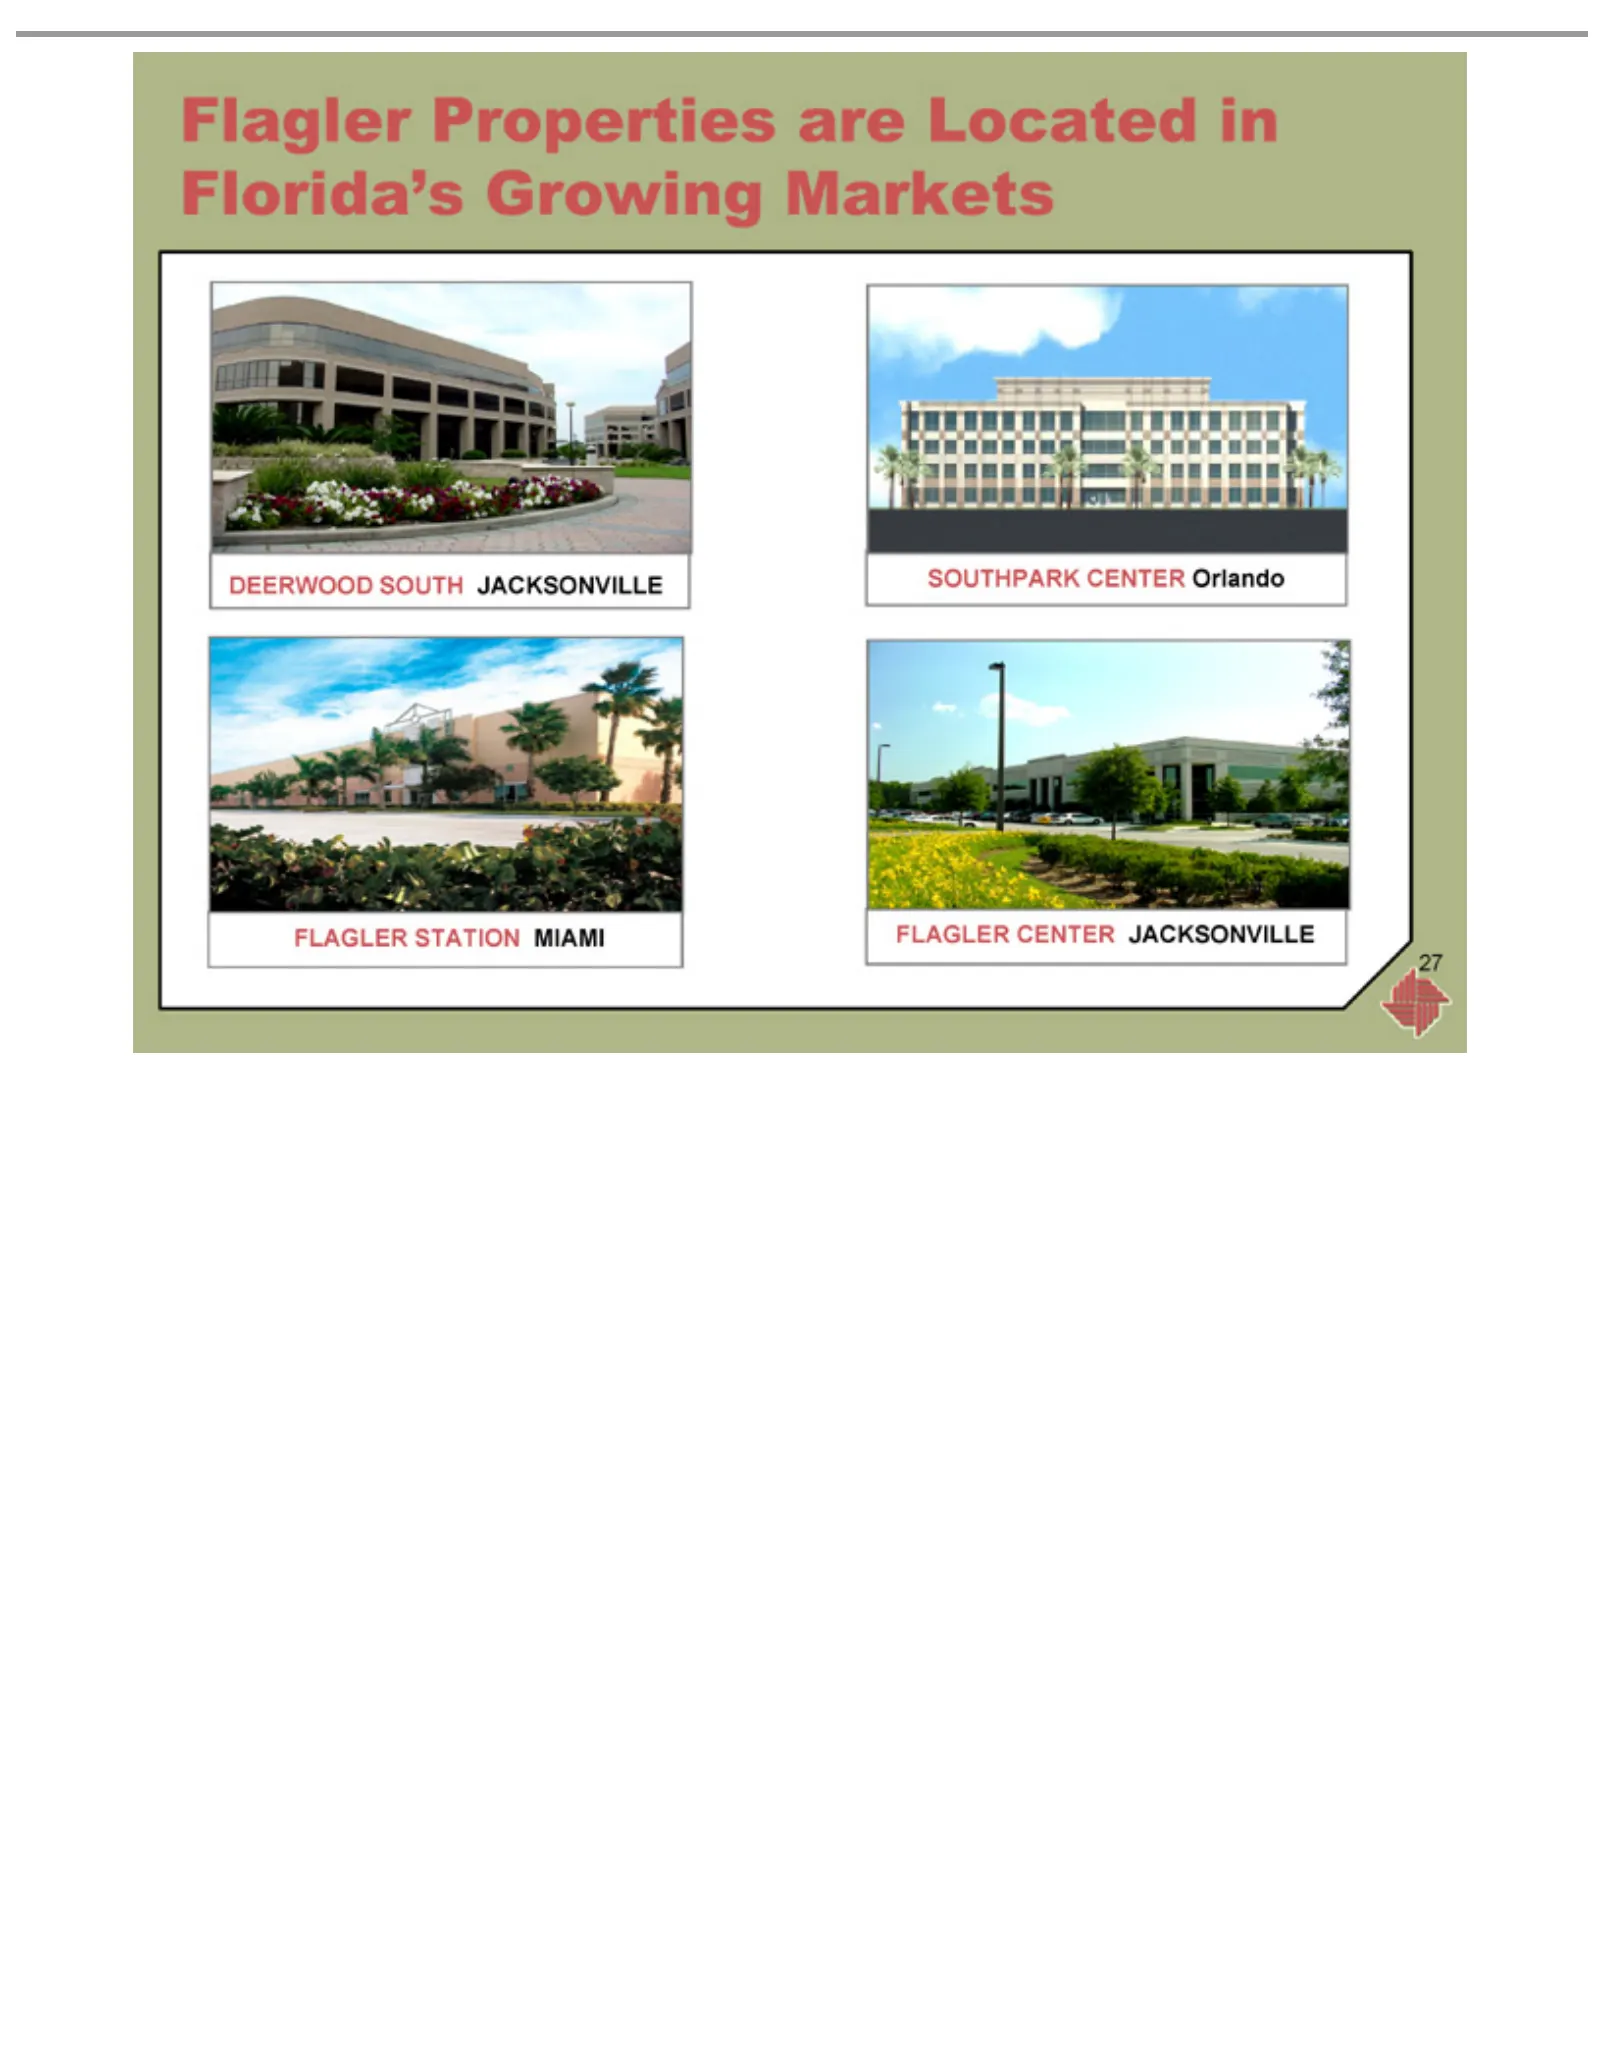
Slide 27: Flagler properties in Florida's growing markets
Flagler Properties DEERWOOD SOUTHPARK FLAGLER 27 STATION CENTER SOUTH CENTER are Located JACKSONVILLE MIAMI JACKSONVILLE Orlando in Florida’s Growing Markets
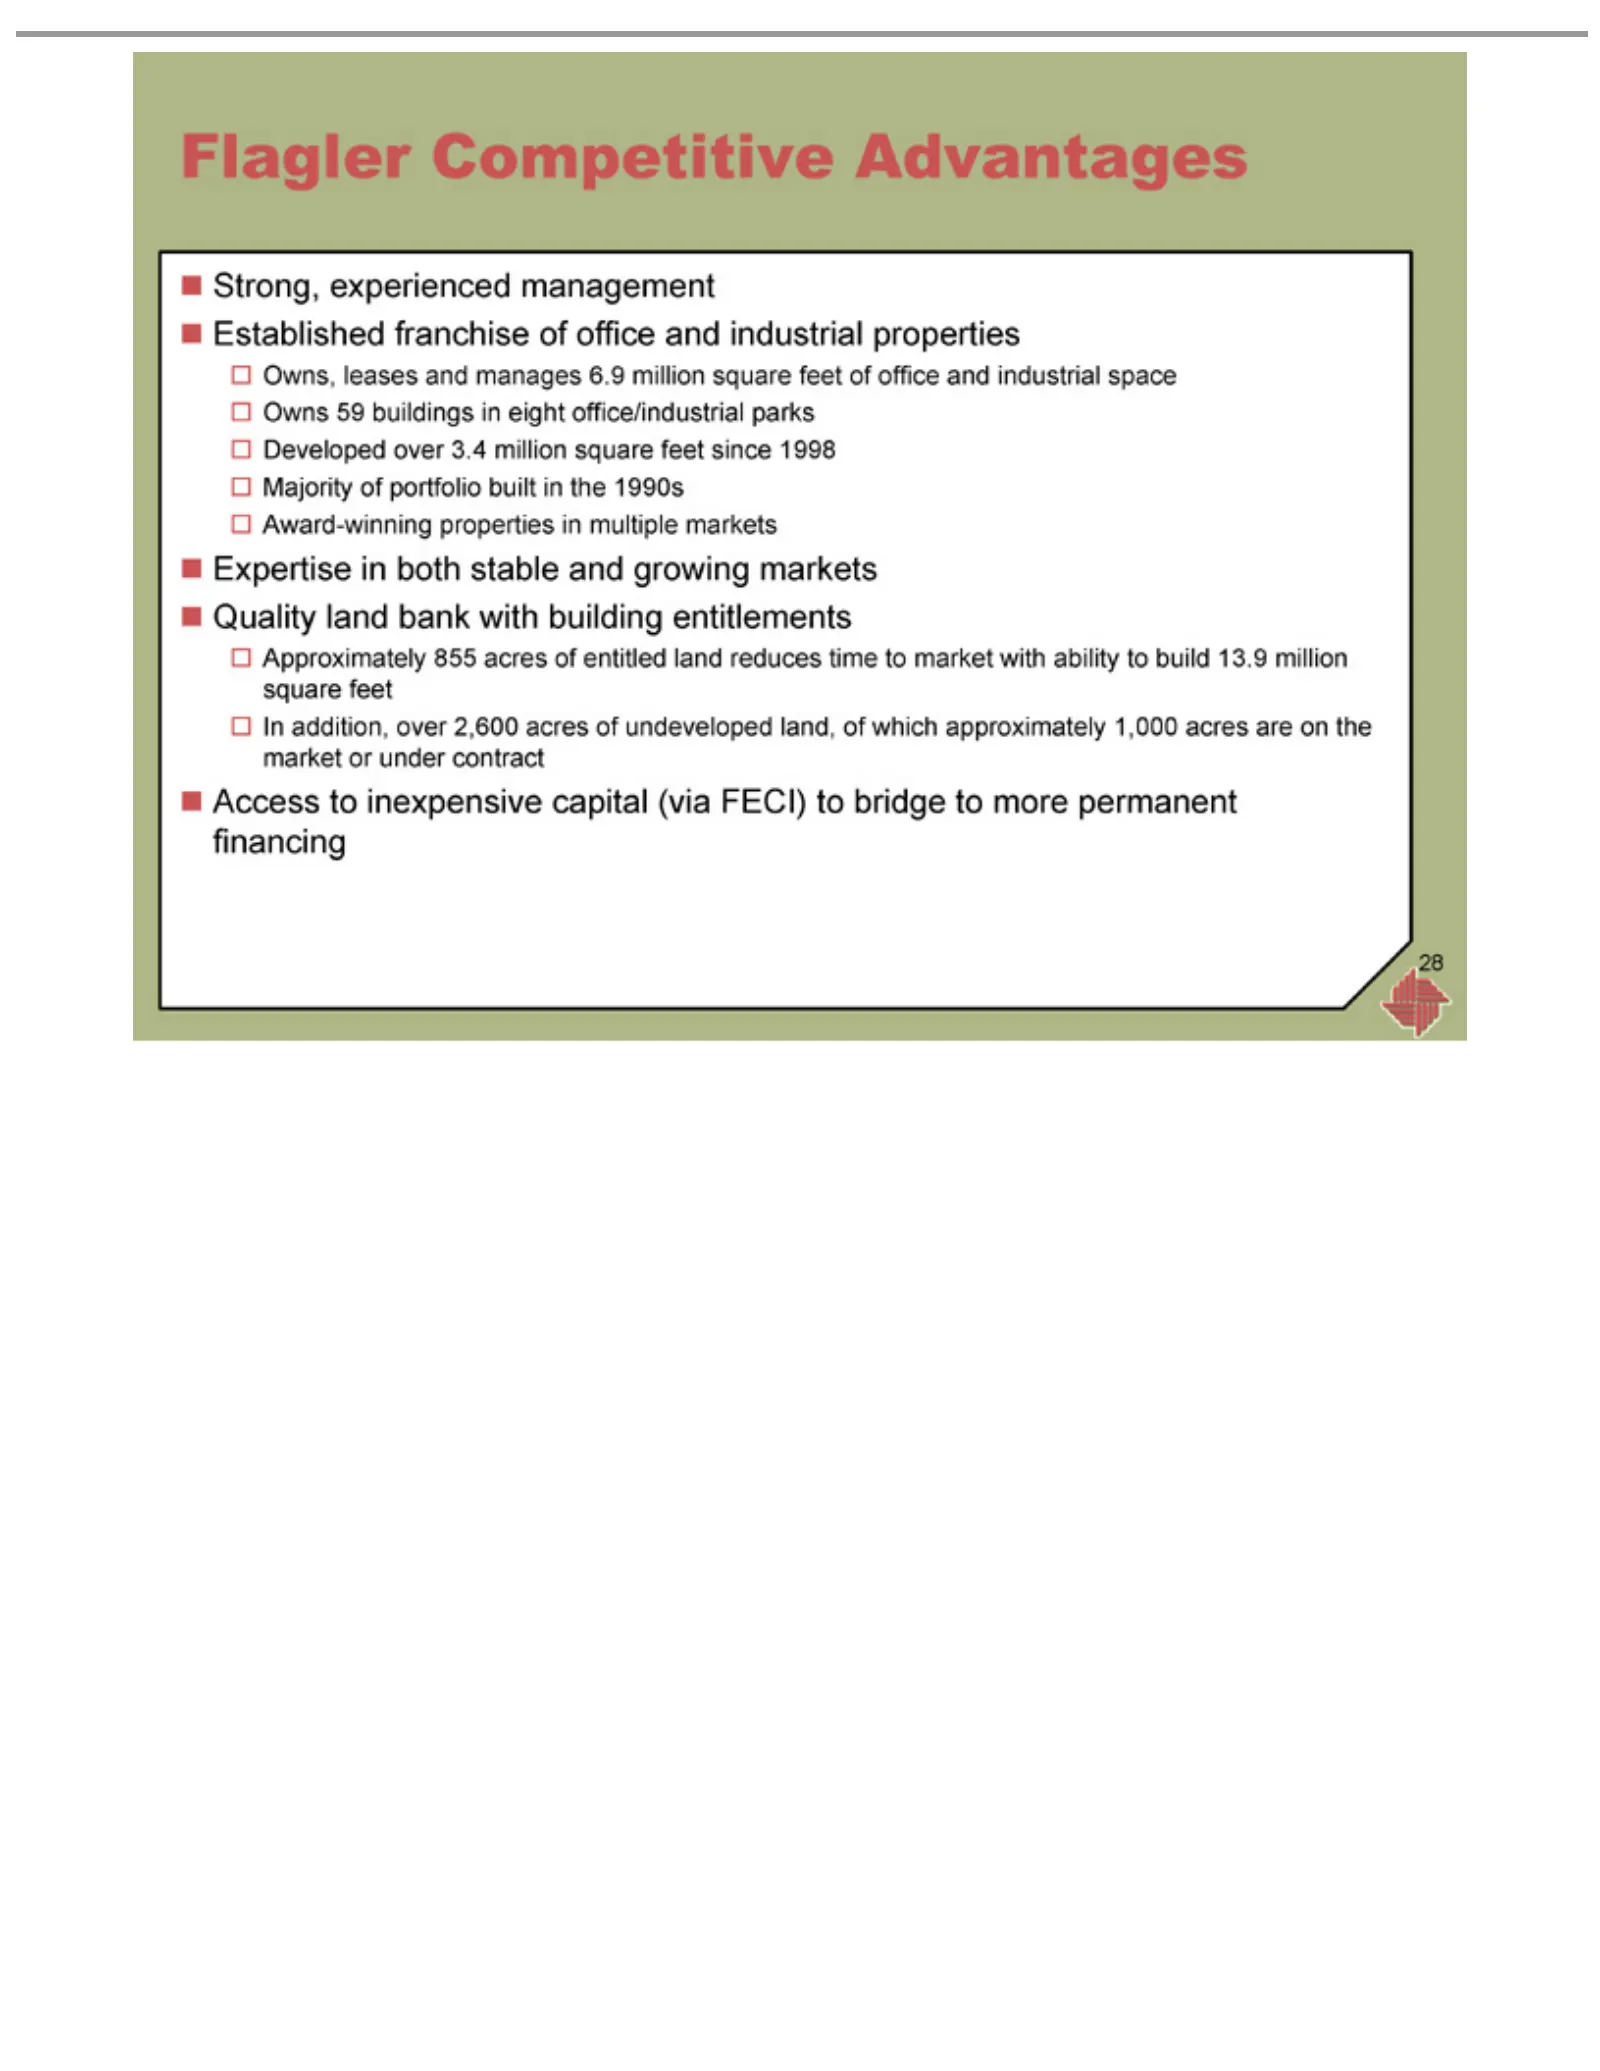
Slide 28: Flagler strong, established franchise
Flagler Strong, Established Owns, Owns Developed Majority Award-winning Expertise Quality Approximately In Access 28 addition, 59leases to Competitive experienced land of buildings in inexpensive over portfolio over franchise both bank and 855 properties 3.4 2,600 stable manages with in acres millio
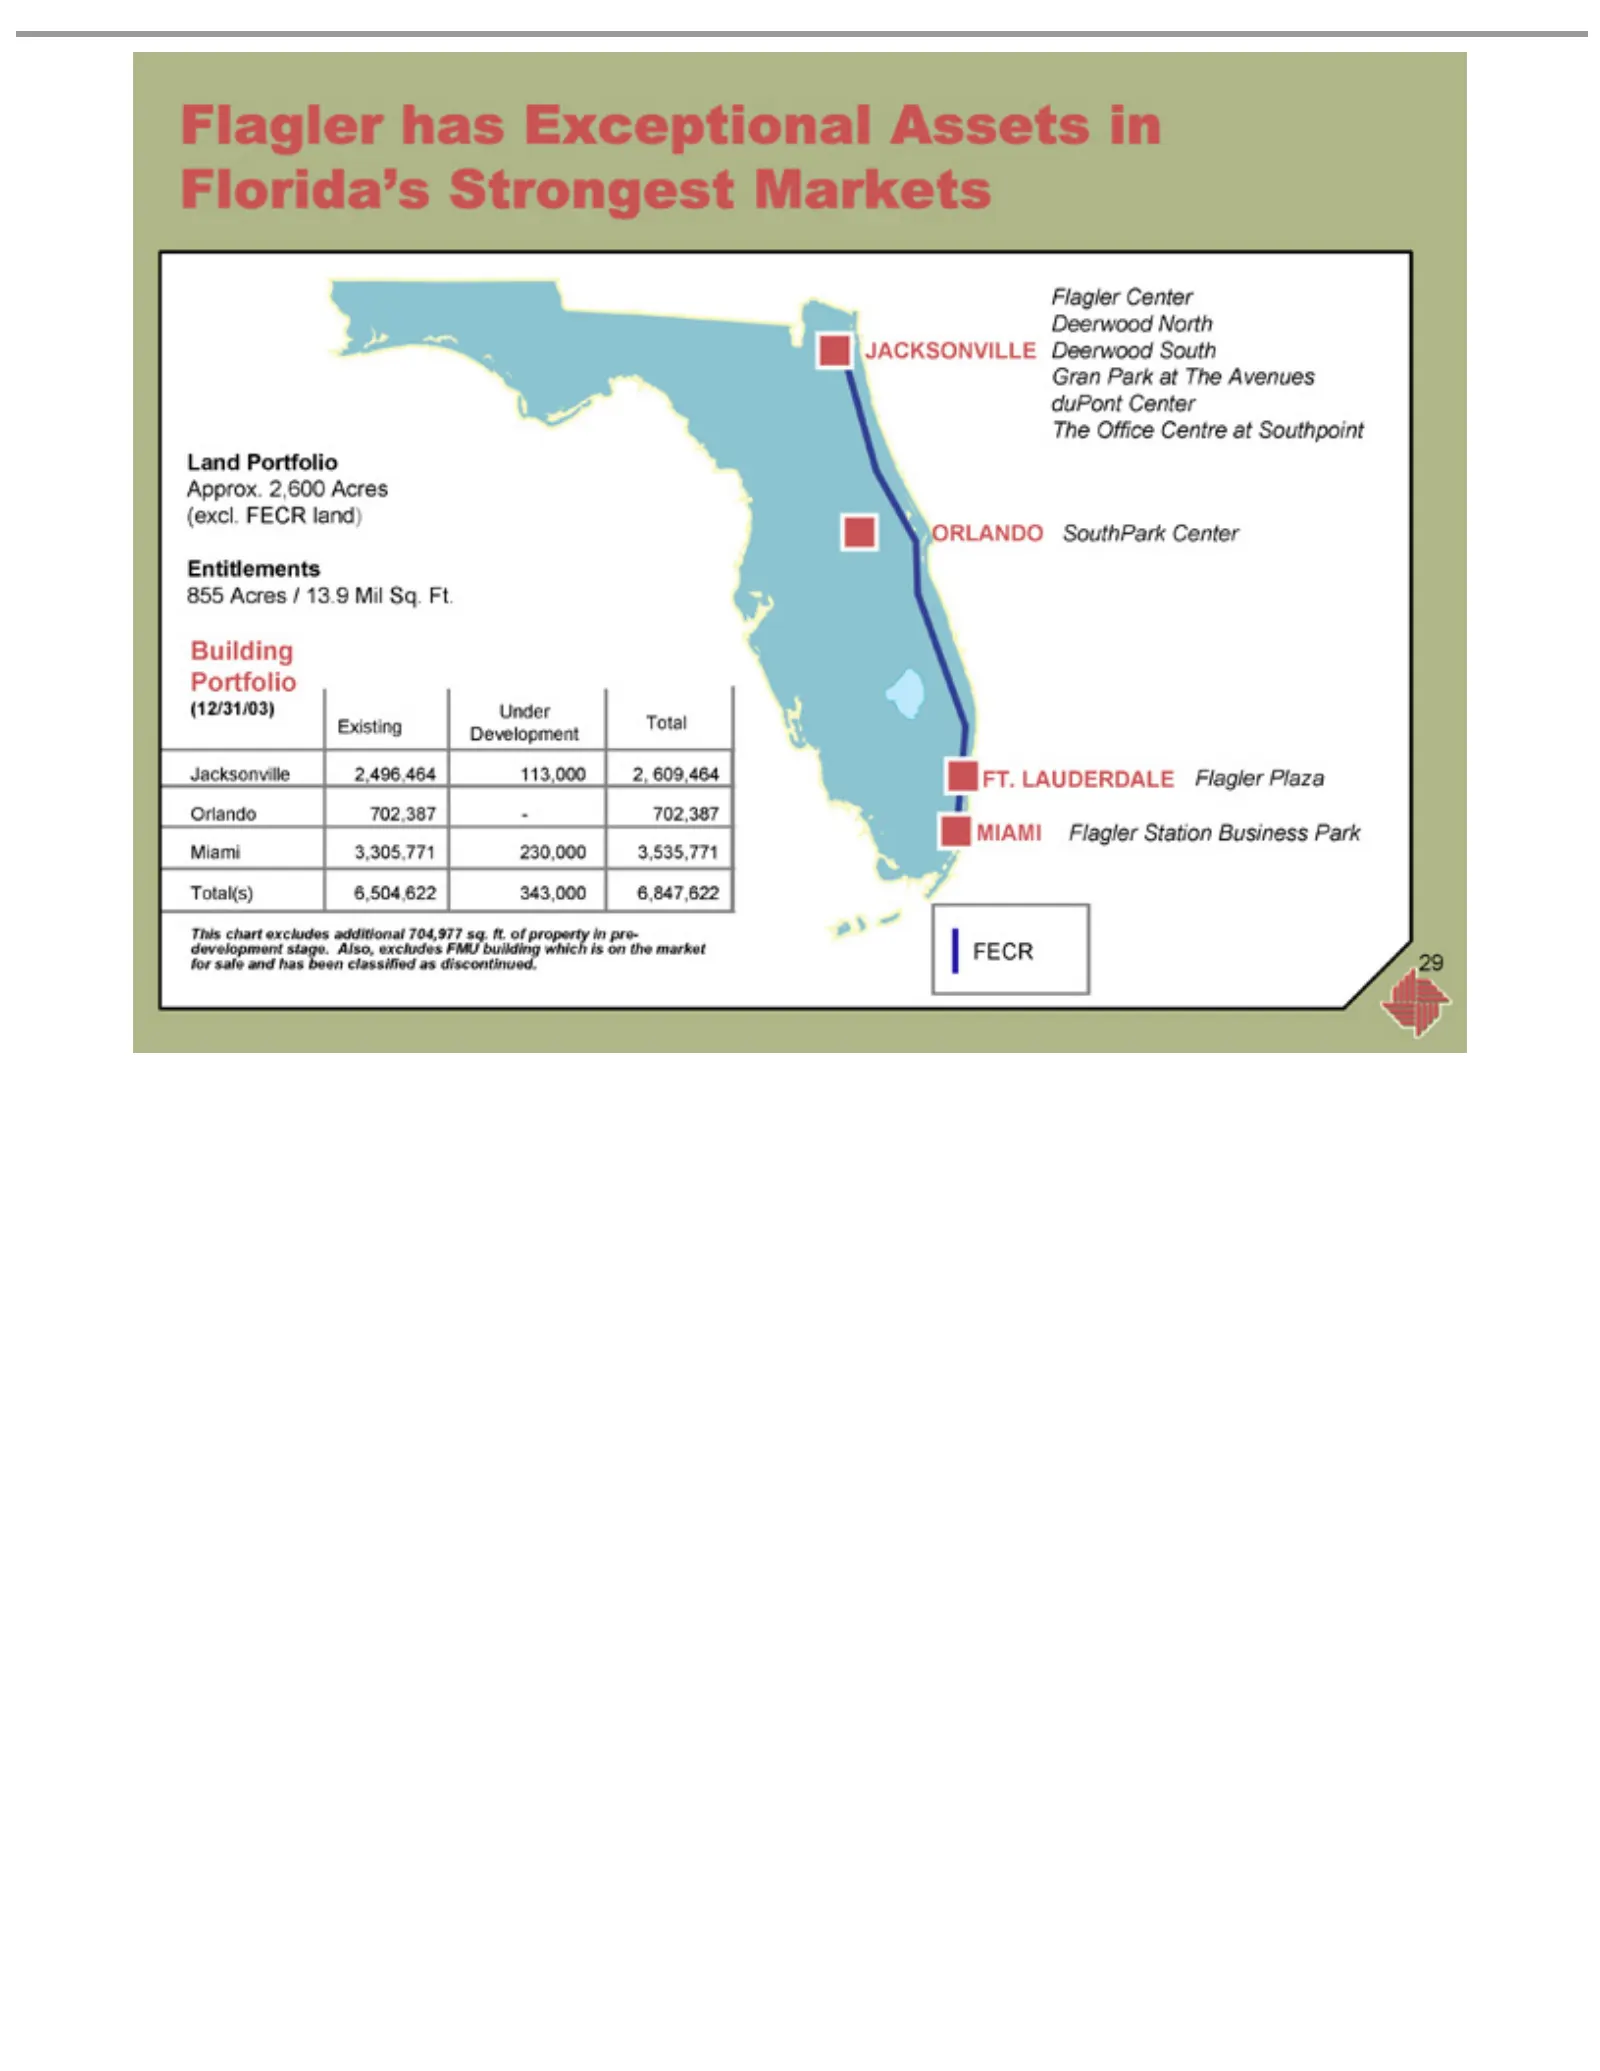
Slide 29: Flagler portfolio by market
JACKSONVILLE Deerwood Gran duPont The SouthPark ORLANDO FT. Flagler MIAMI Land Approx. 855 Entitlements Building Existing (12/31/03) Jacksonville Development Orlando Miami Total(s) This 29 LAUDERDALE Acres Office chart Park Portfolio 3,305,771 has Center Plaza Station 6,504,622 702,387 2,600 Under P
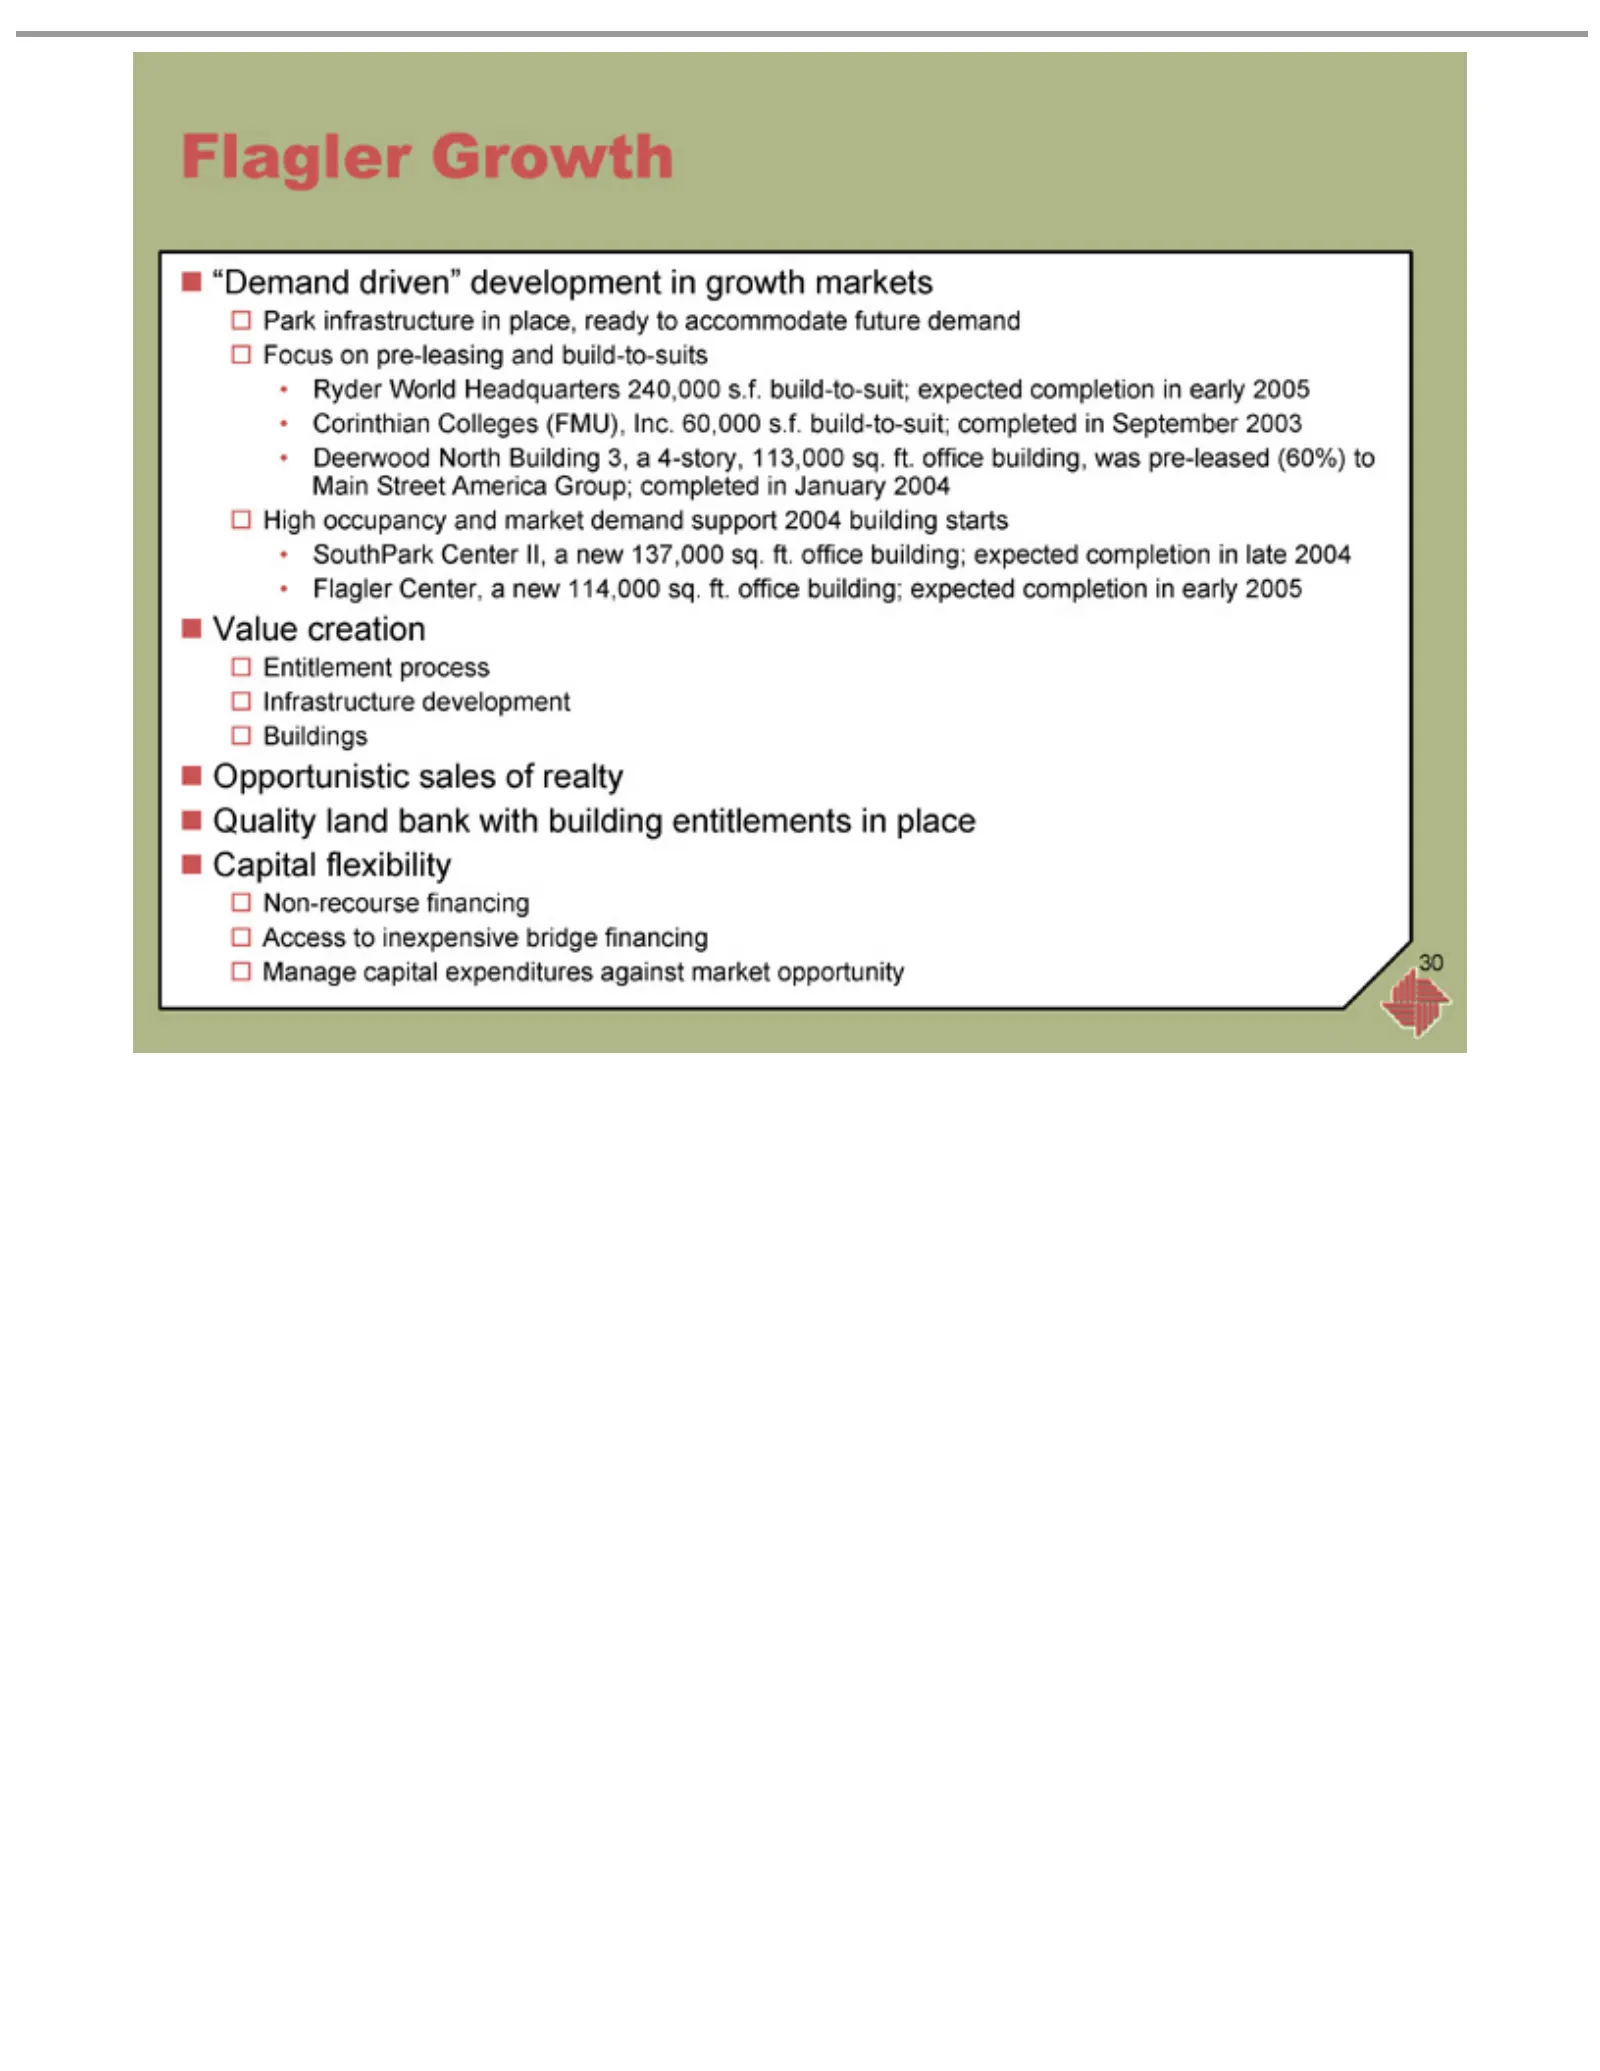
Slide 30: Flagler focus: demand-driven development
Flagler “Demand Park Focus •High Value Entitlement Infrastructure Opportunistic Buildings Quality Capital Non-recourse Access Manage 30Ryder Corinthian Deerwood SouthPark Flagler infrastructure occupancy creation on to Growth flexibility World land capital Center, pre-leasing driven” inexpensive pro
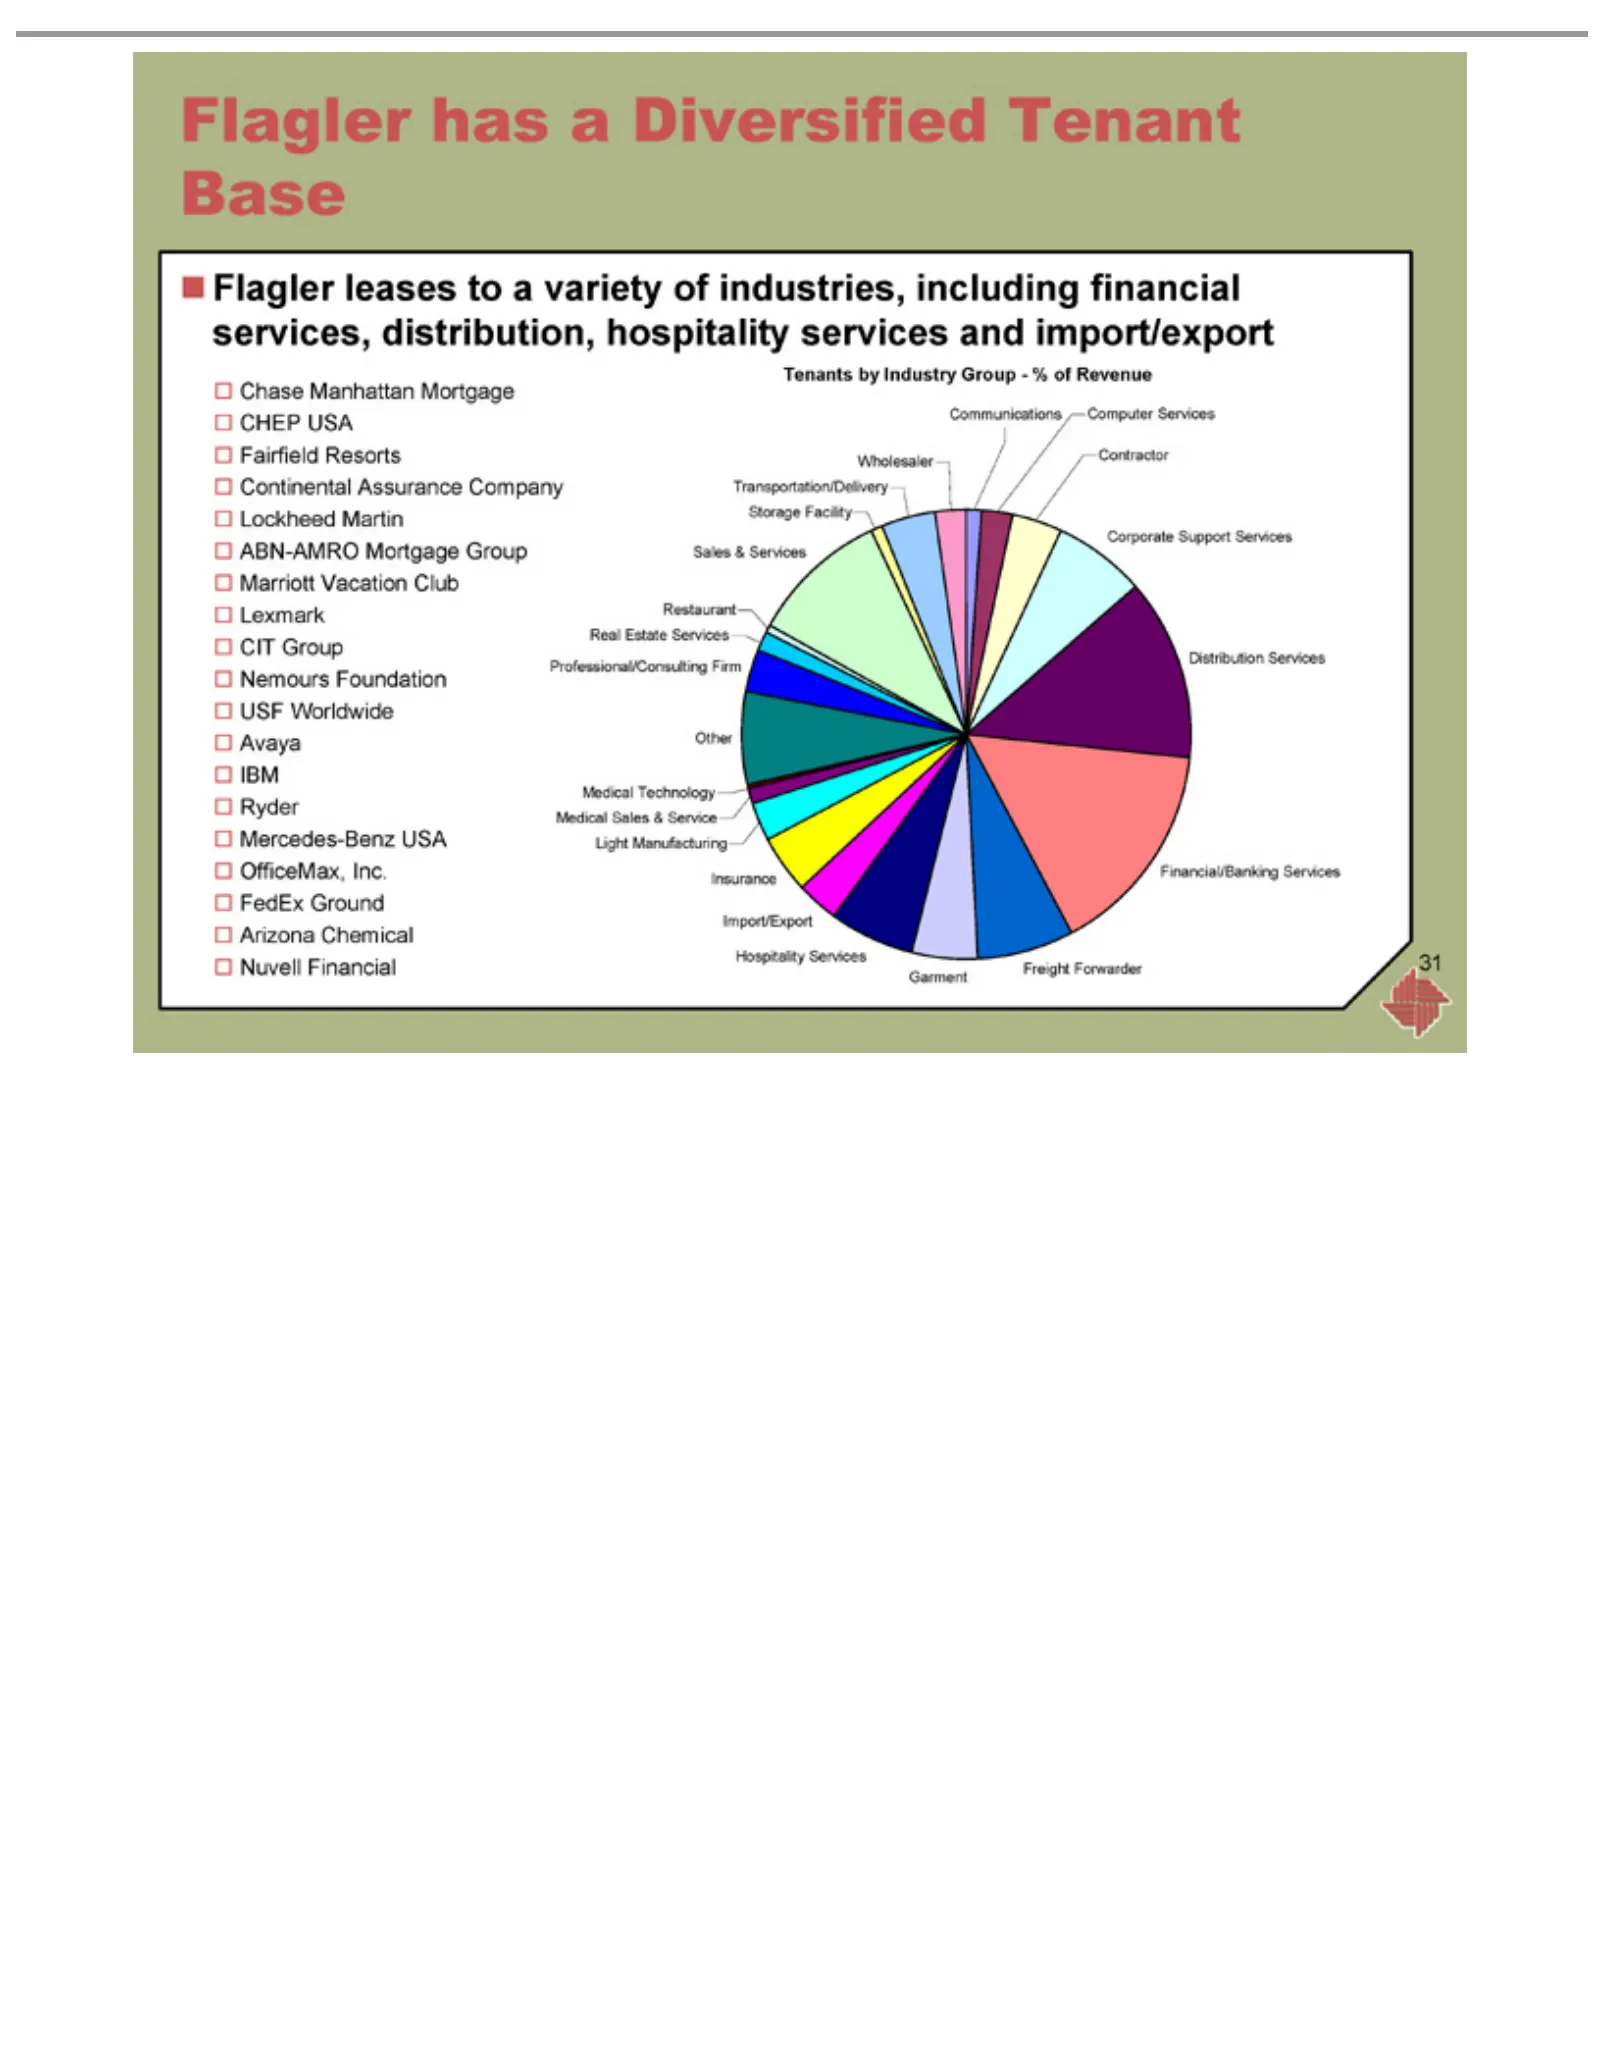
Slide 31: Flagler tenant base
Flagler Chase CHEP Fairfield Continental Lockheed ABN-AMRO Marriott CIT Lexmark Nemours USF Mercedes-Benz Ryder IBM Avaya OfficeMax, FedEx Arizona Nuvell Tenants Computer Communications Corporate Contractor Distribution Financial/Banking Freight Hospitality Garment Light Insurance Import/Export Medi
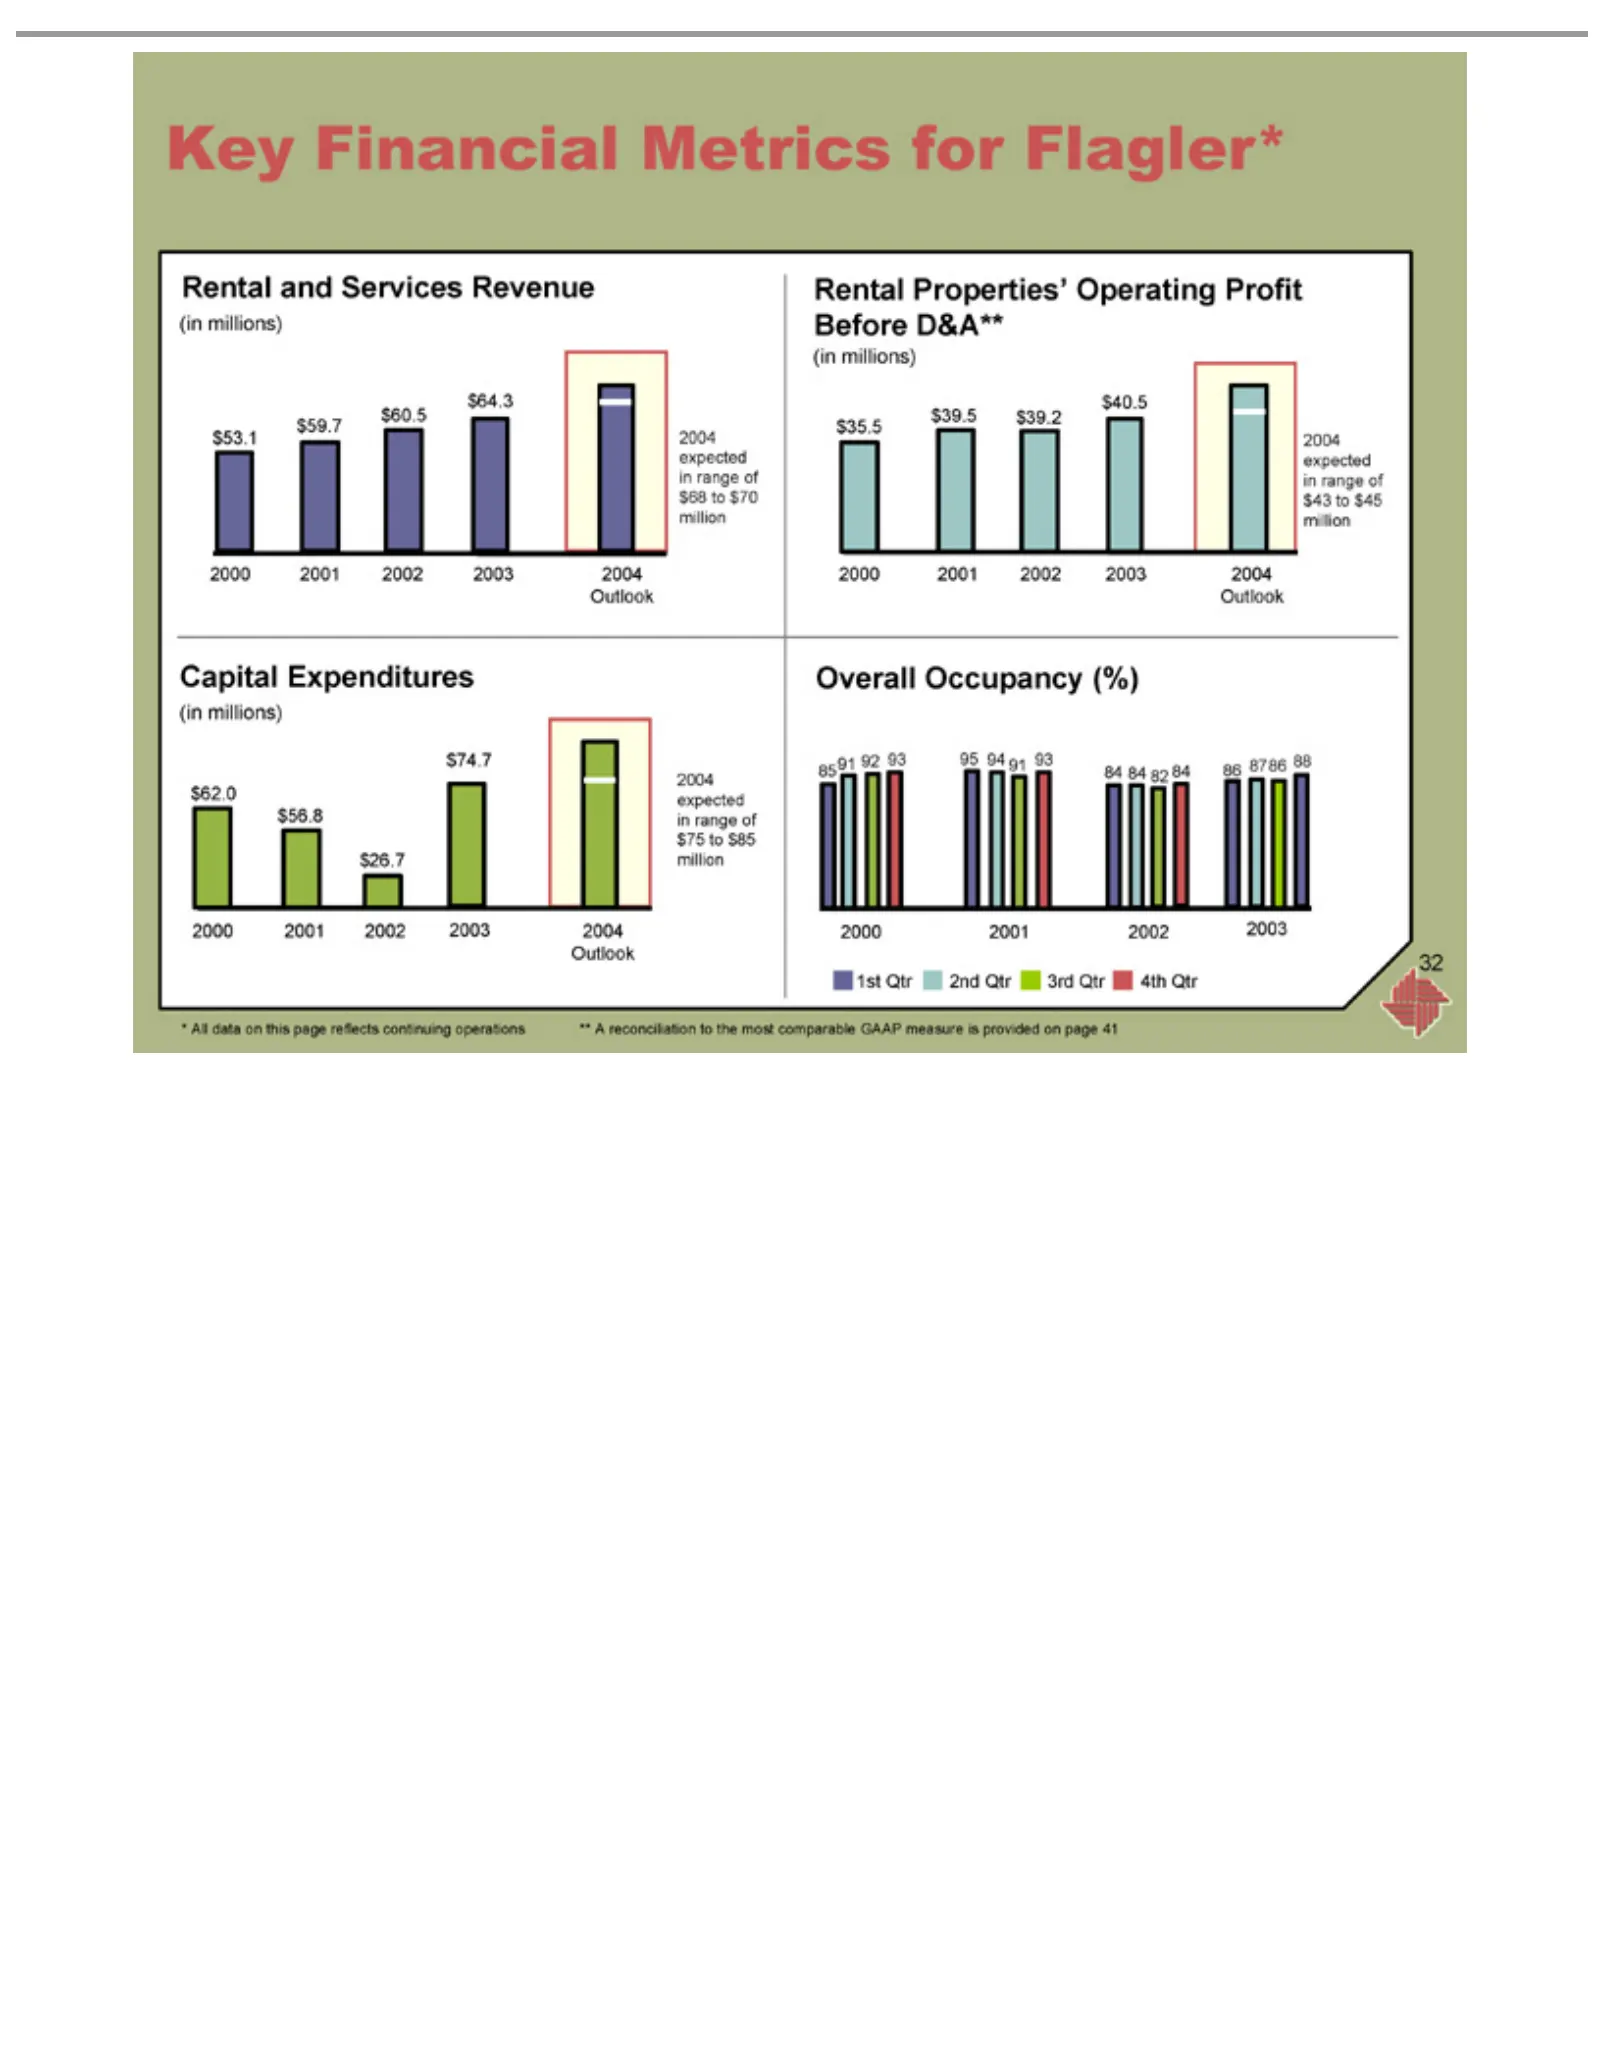
Slide 32: Key rental metrics and capital expenditures
Key Rental $40.5 $39.2 $39.5 $35.5 Capital (in $74.7 $26.7 $56.8 $62.0 2004 Overall 85 95 2000 84 2001 86 2002 * 2003 32All 91 94 84 8786 millions) Financial data $59.7 $60.5 $64.3 expected Outlook 92 91 82 and Properties’ Expenditures Occupancy 88 93 84 on Services $53.1 this Metrics in range page
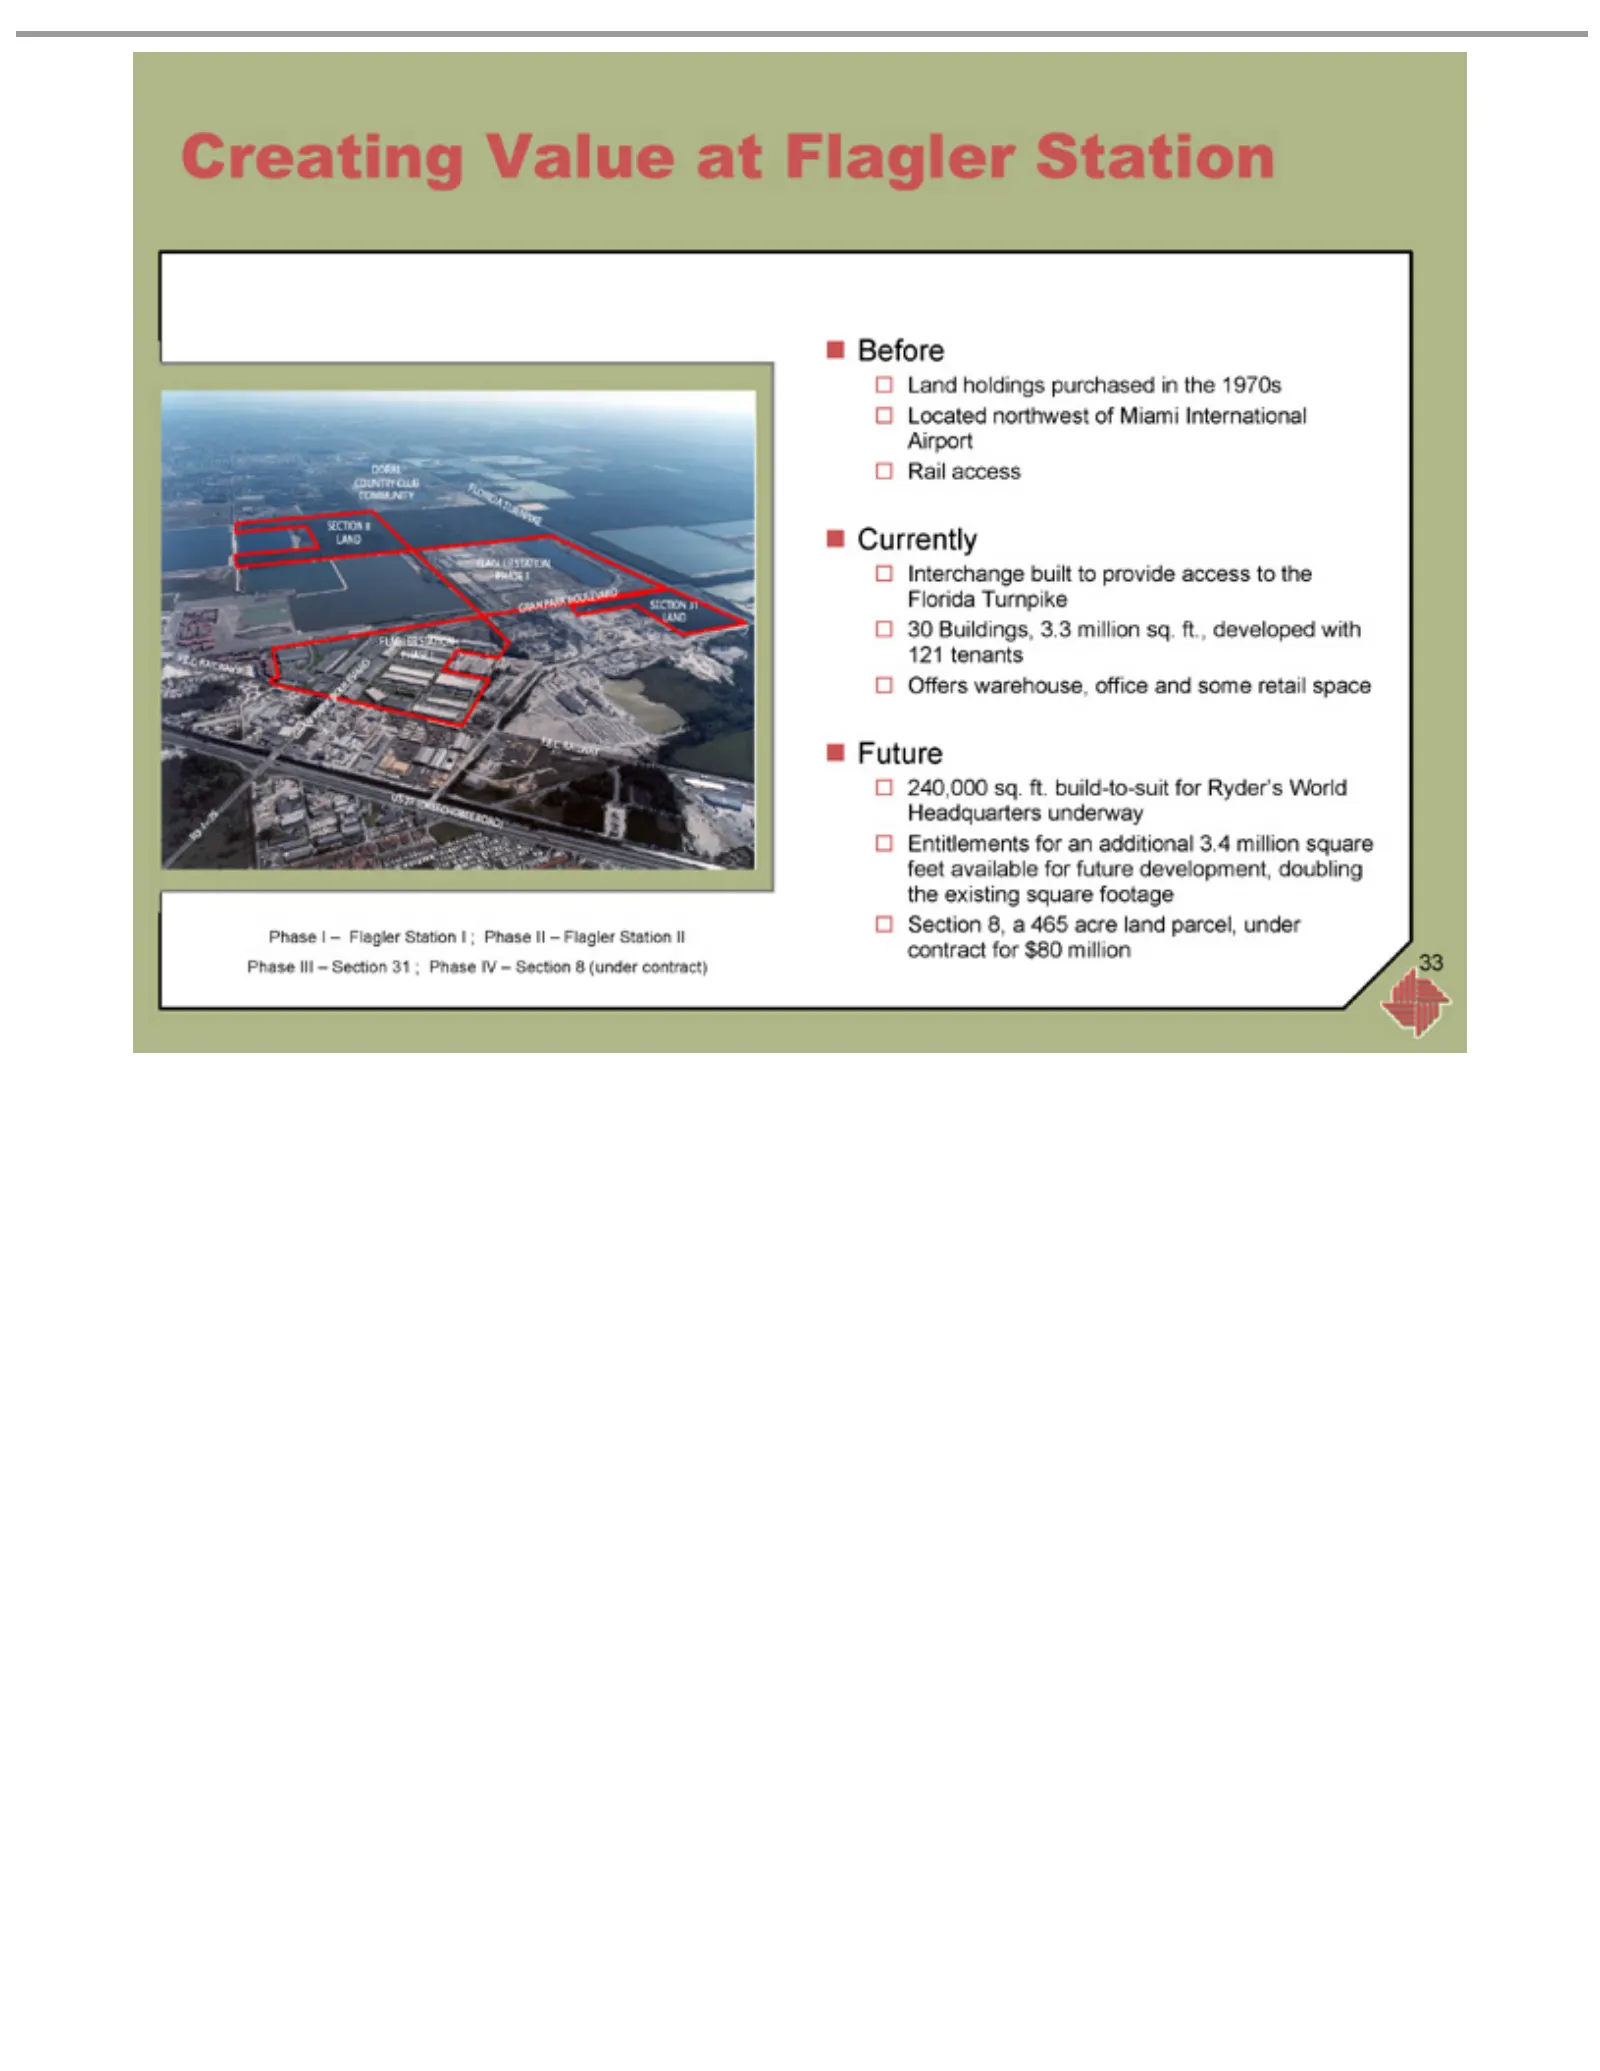
Slide 33: Creating value: Flagler Station
Creating Phase Land Before Located Rail Interchange Currently 30 Offers 240,000 Future Entitlements Section 33 Buildings, access holdings Iwarehouse, –8, northwest sq. Value Flagler a ft. 465 built for 3.3 purchased build-to-suit atacre an Station to million Flagler office of additional provide land
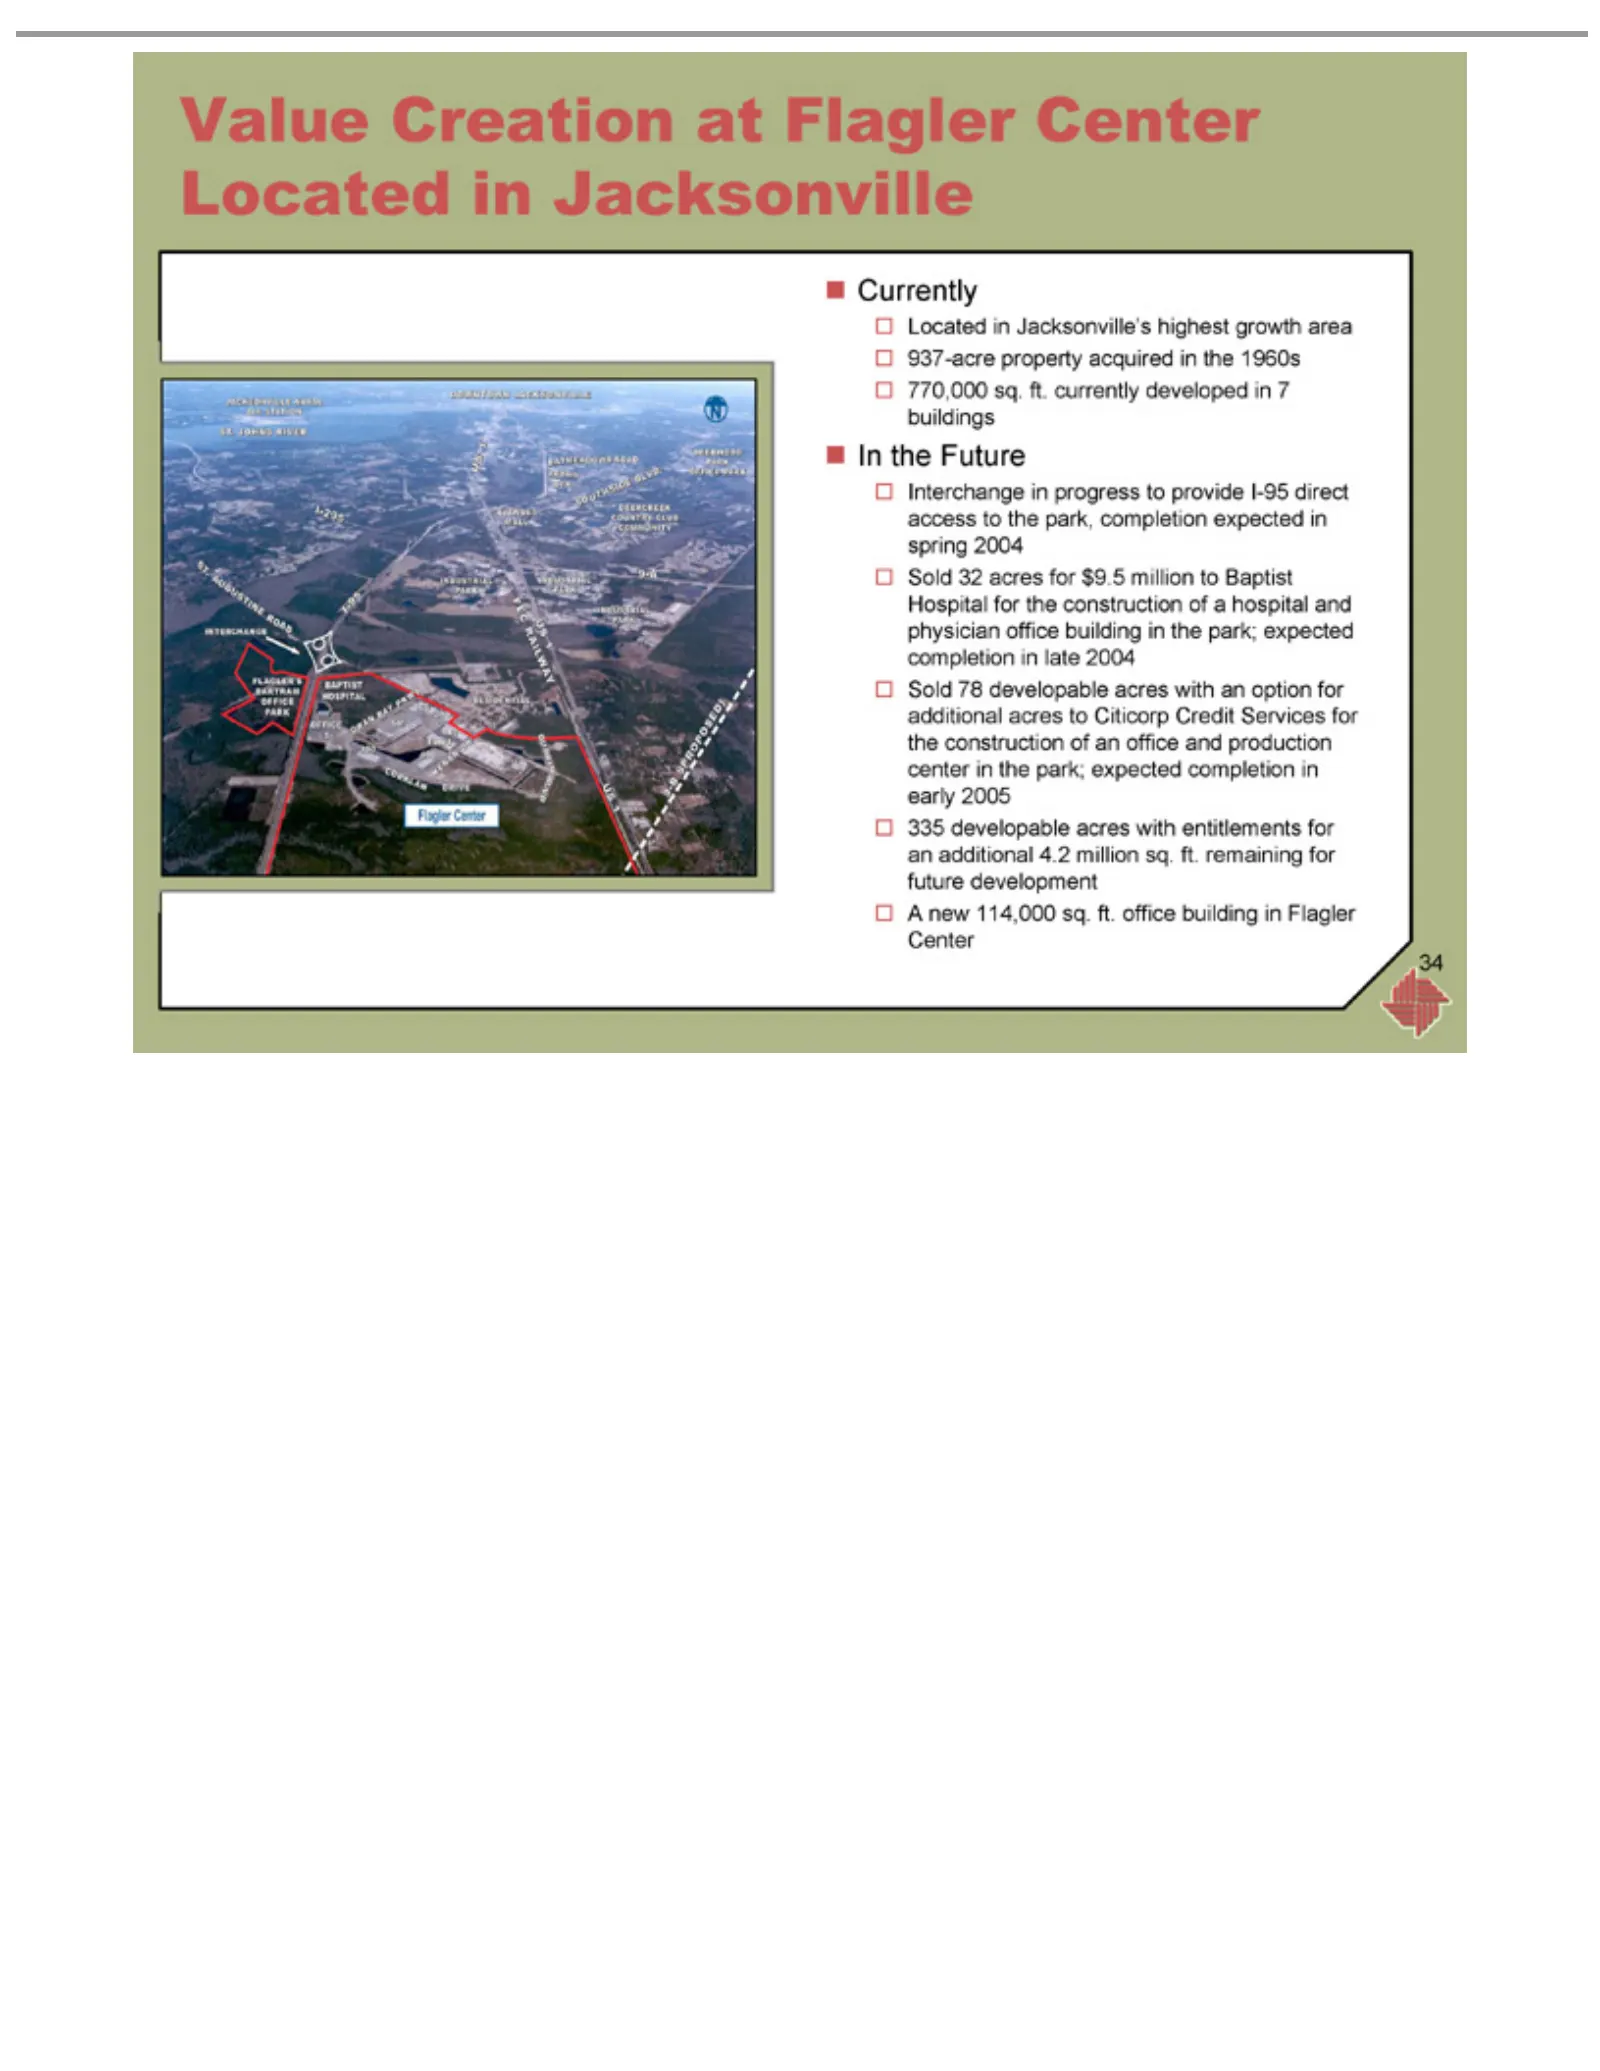
Slide 34: Creating value: Flagler Center
Value Located Currently 937-acre 770,000 In Interchange Sold 335 A 34 new the developable 32 78 Creation Future 114,000 acres developable in sq. property Jacksonville’s ft. infor progress currently at sq. acres $9.5 Flagler acquired ft.acres office million with to developed Center highest provide wi
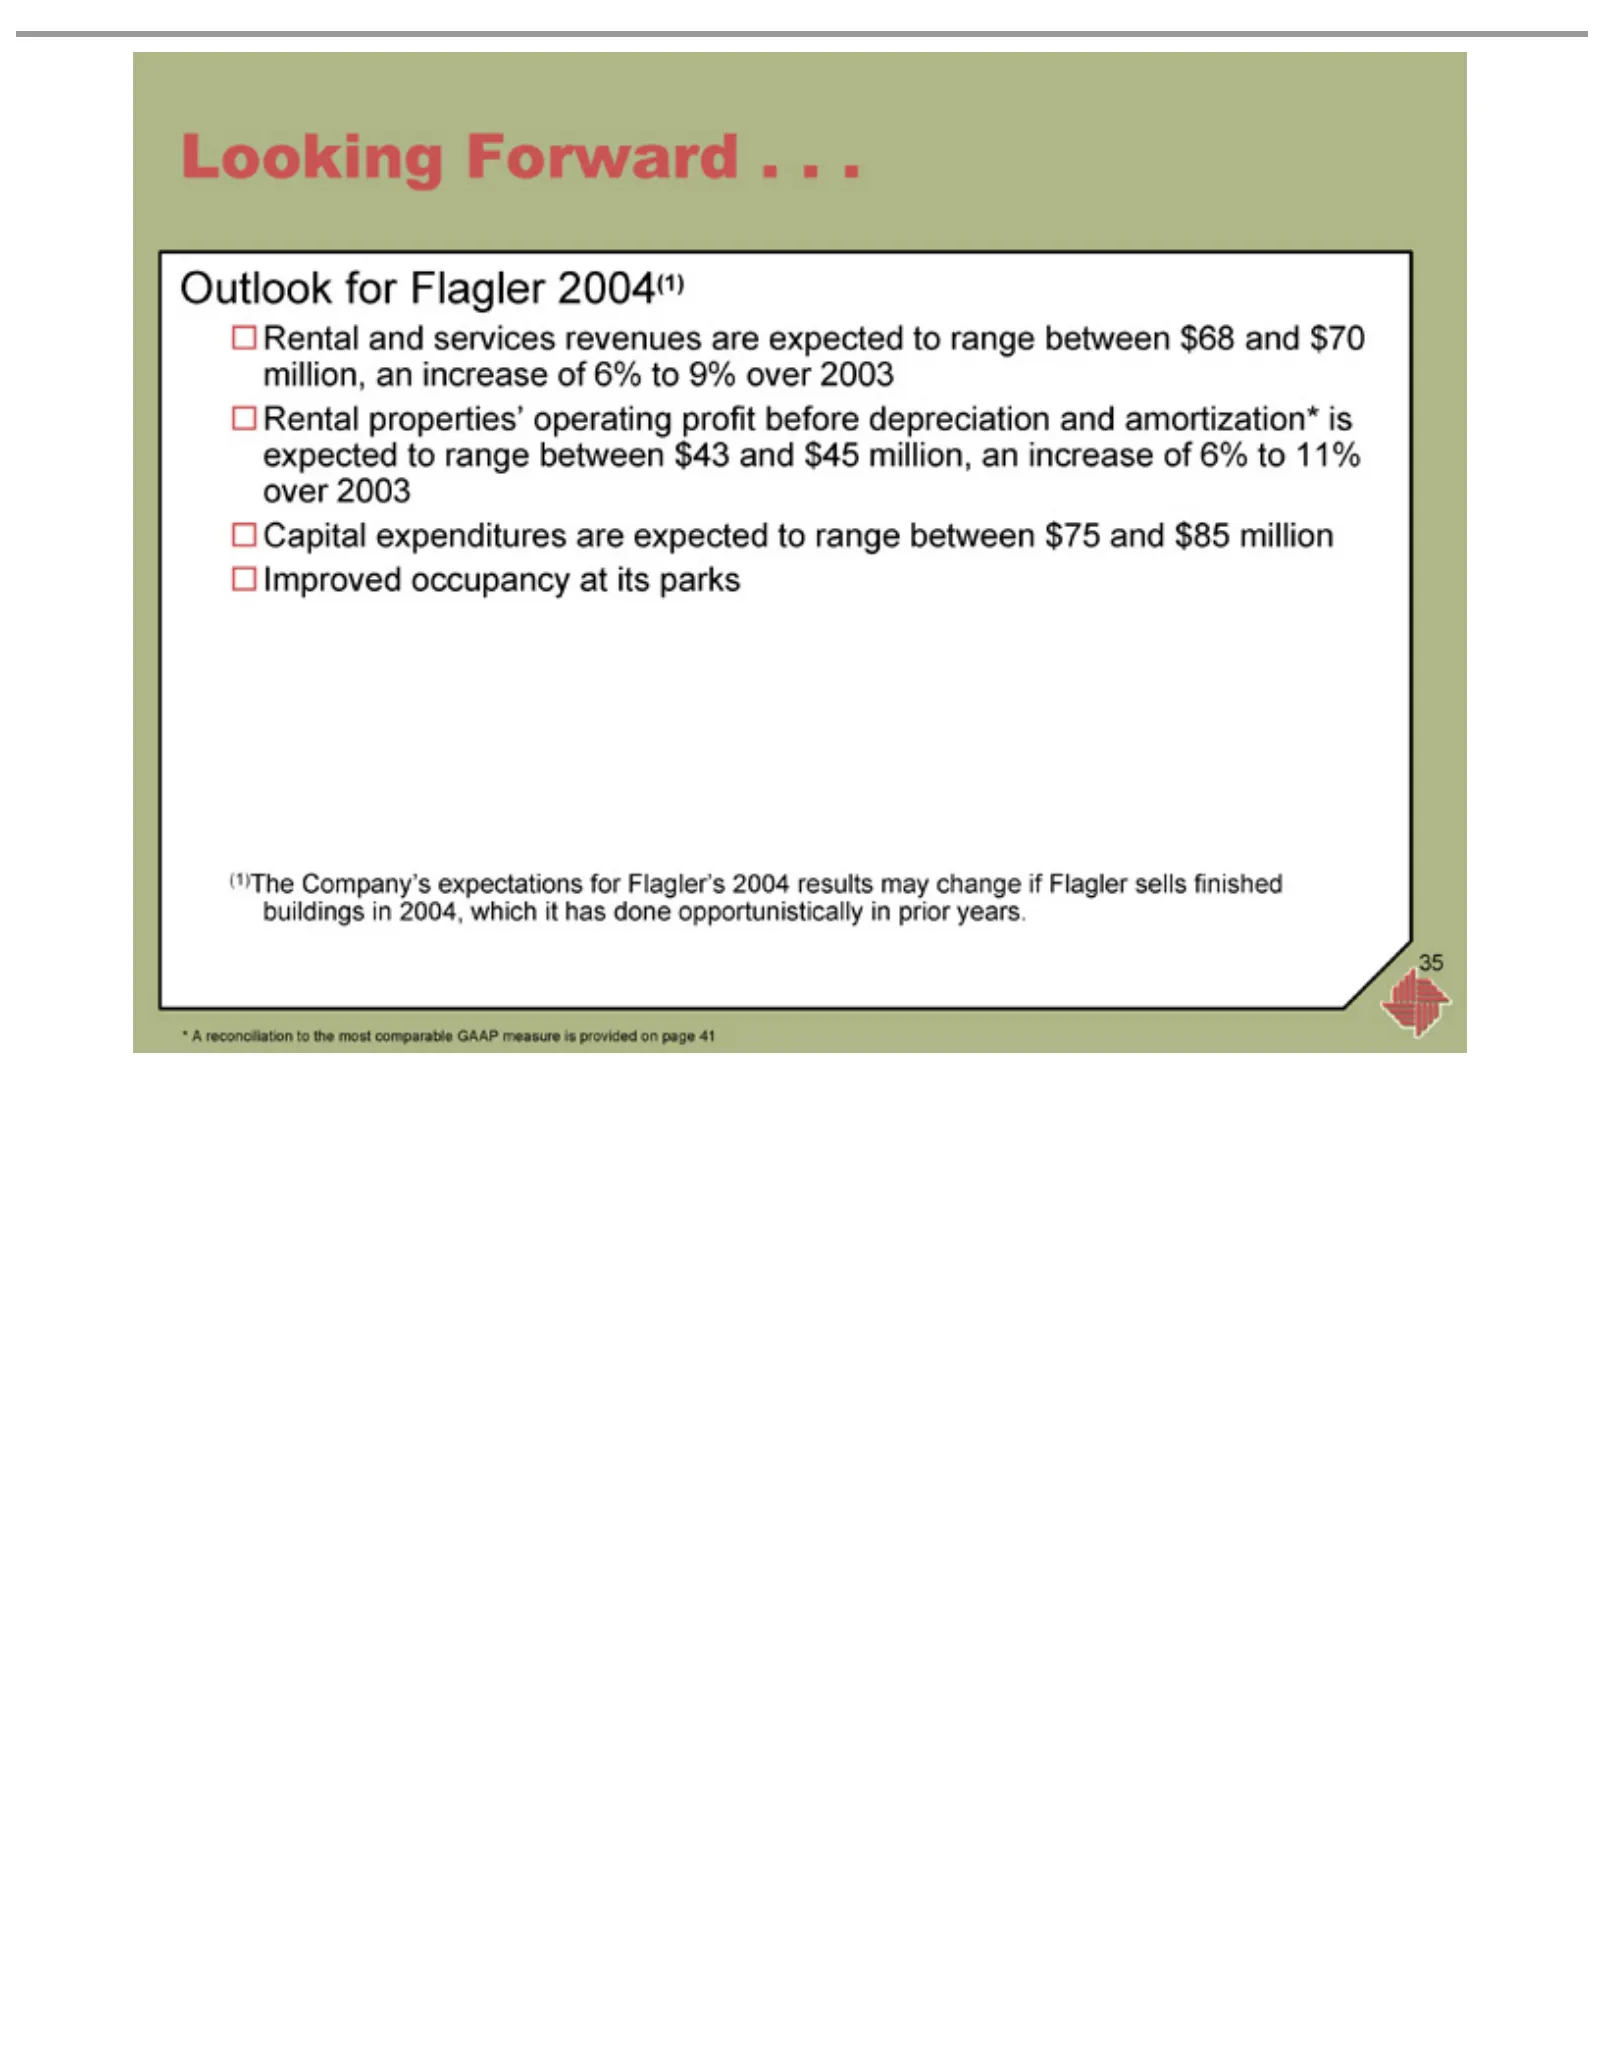
Slide 35: Looking forward: rental outlook 2004
Looking Outlook Rental Capital Improved (1)The * 35A reconciliation and properties’ Company’s expenditures for Forward occupancy services Flagler.to operating expectations ..revenues 2004(1) the are .at its most expected parks profit are comparable for expected to before Flagler’s rangedepreciation
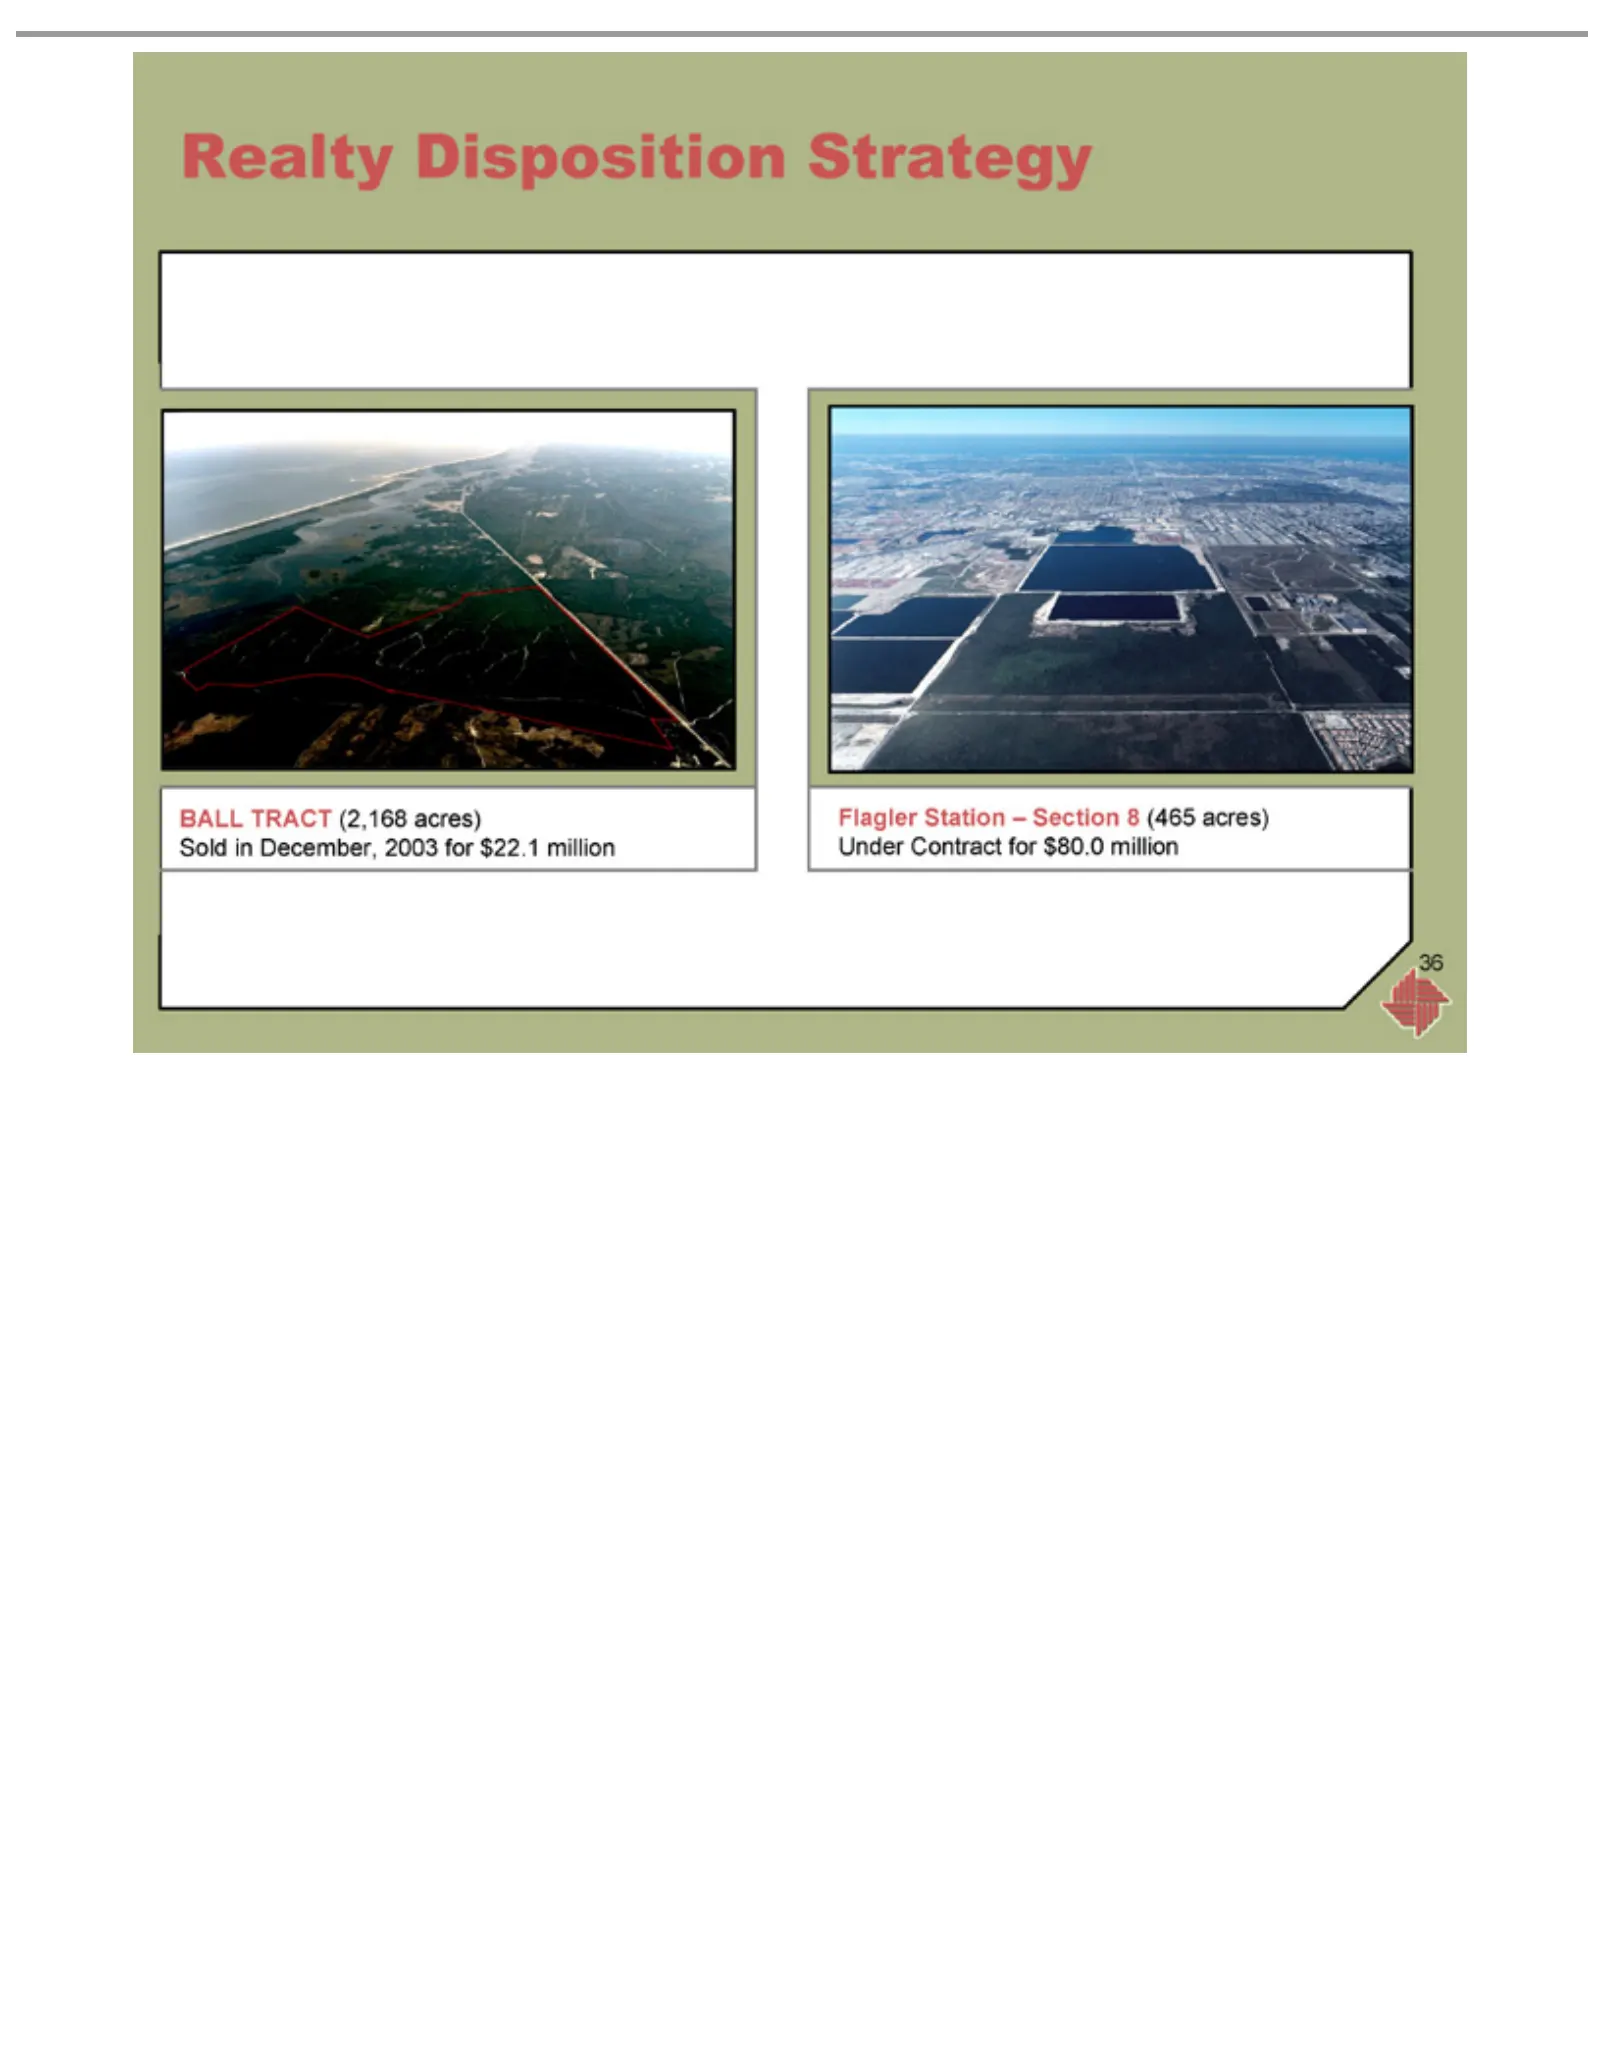
Slide 36: Realty disposition strategy: Ball Tract and Flagler Station
Realty BALL Sold Flagler Under 36 inContract TRACT Disposition Station December, –(2,168 for Section 2003 Strategy $80.0 acres) for 8million (465 $22.1acres) million
Slide 37: Realty sales and 2004 outlook
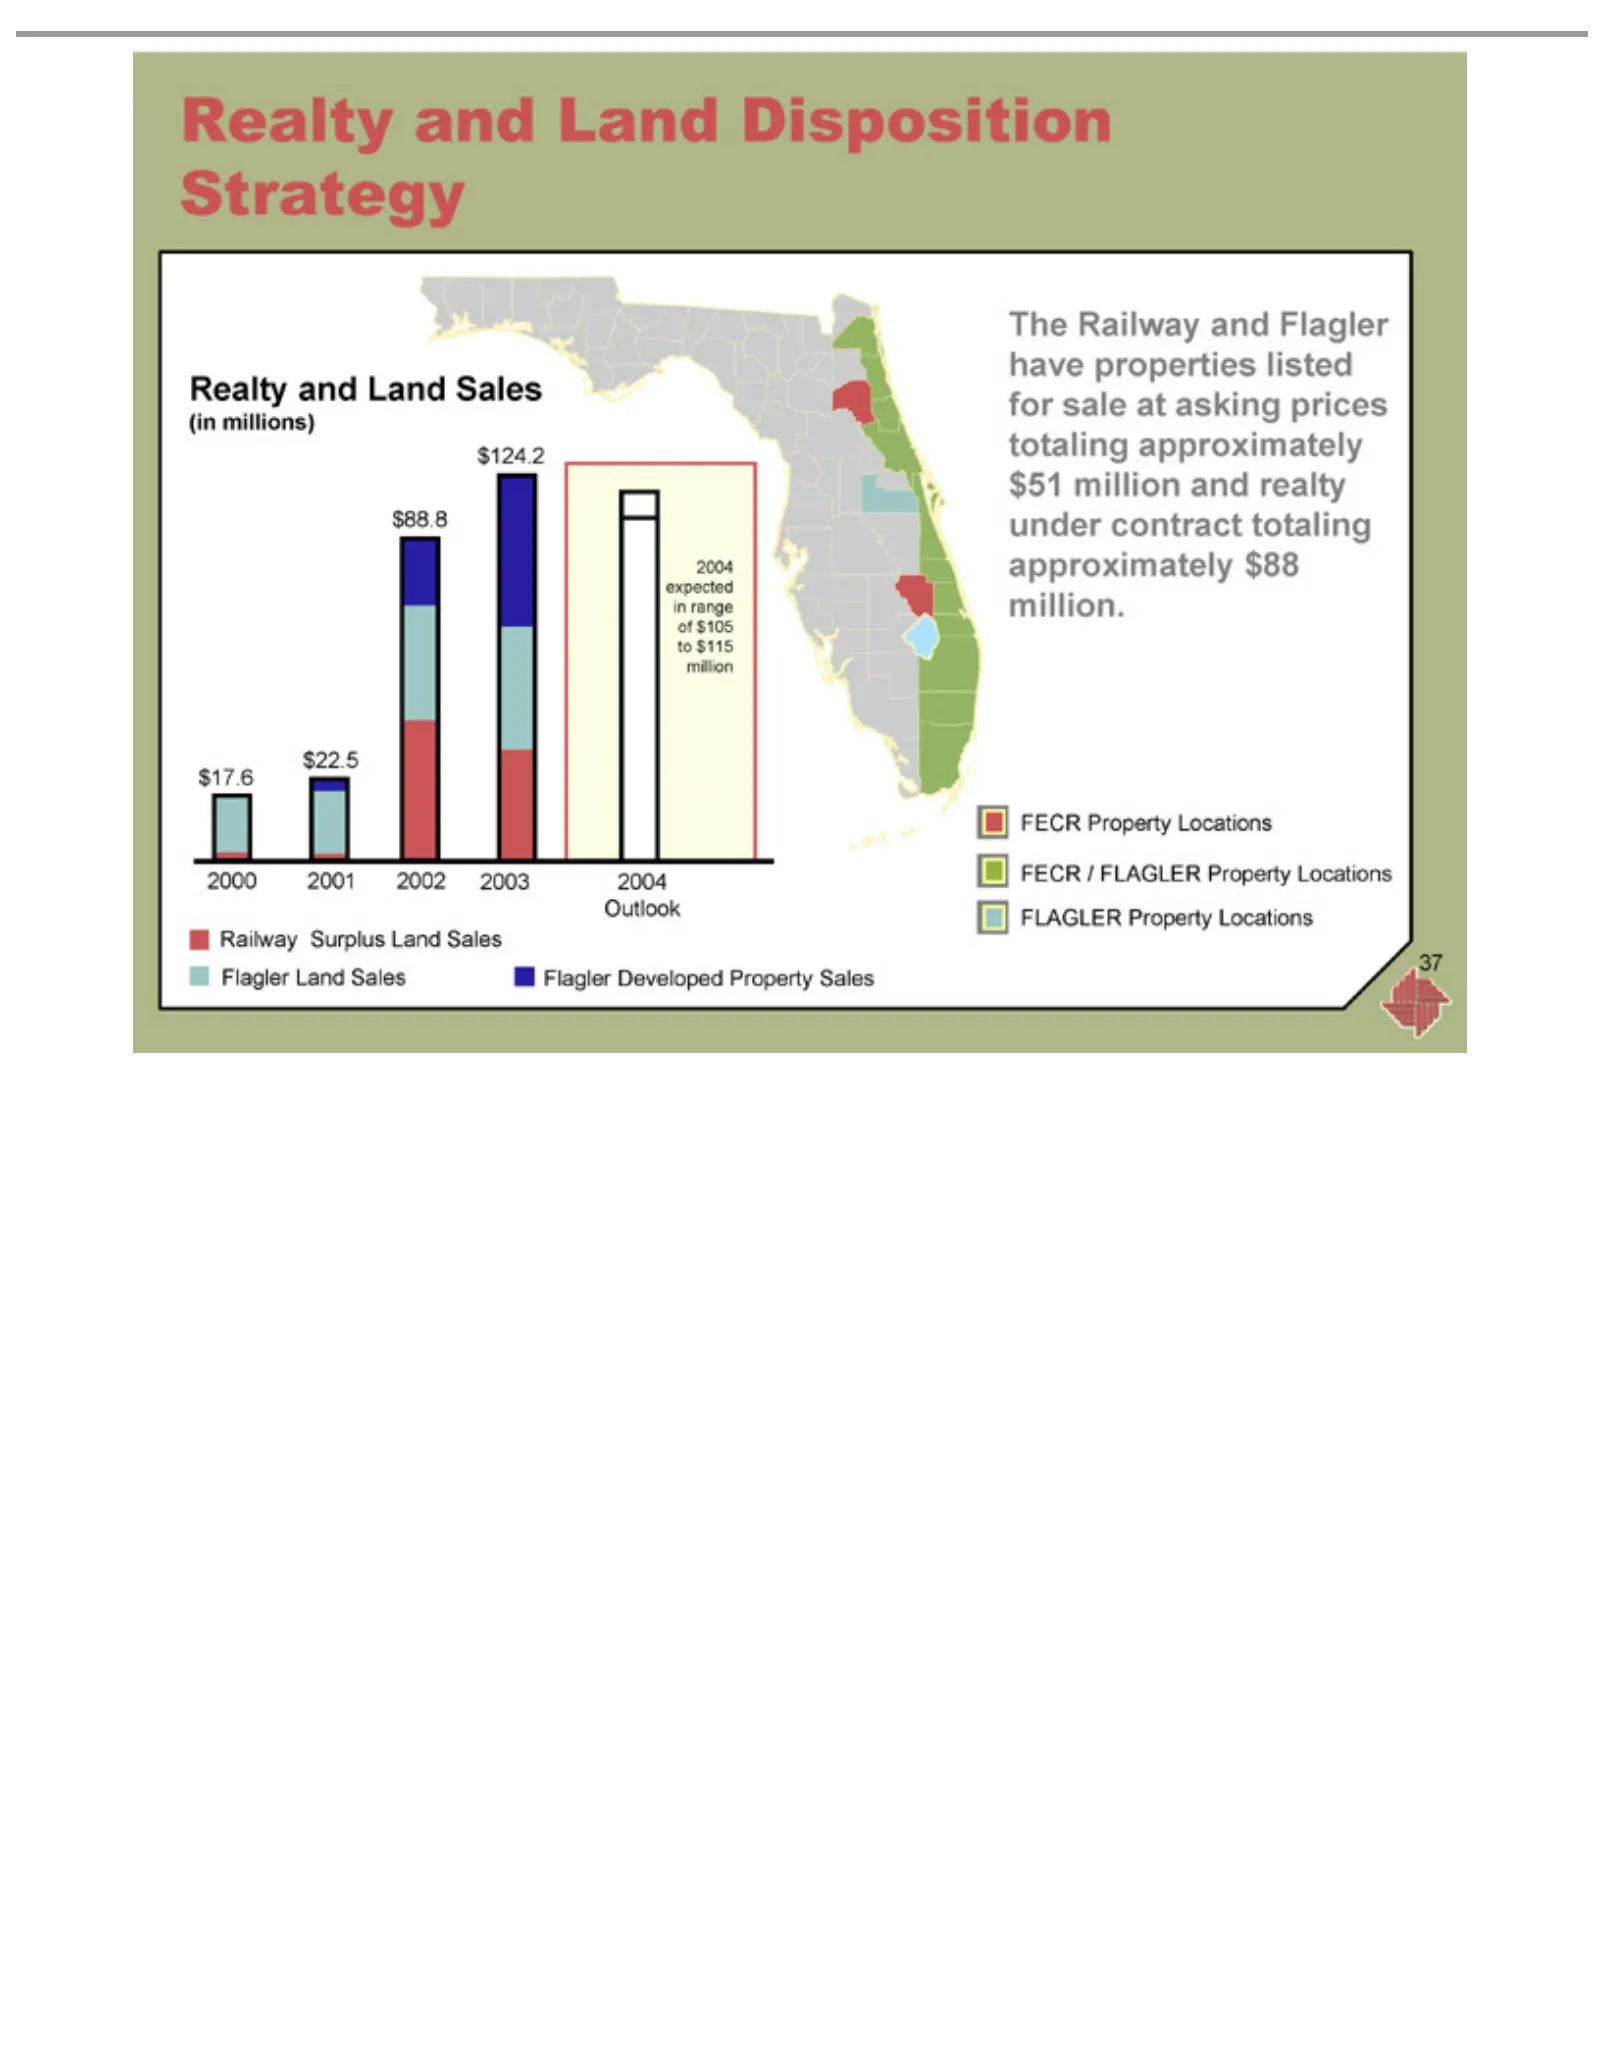
Realty (in 2003 $124.2 2002 $88.8 2001 $22.5 2000 $17.6 2004 Railway Flagler The FECR 37 millions) Railway expected Outlook /Property and Developed FLAGLER Surplus Land and inLocations Disposition Sales Land range Flagler Property Property Sales ofhave $105 Sales Flagler Strategy Locations propertie
Slide 38: Flagler capital expenditure outlook
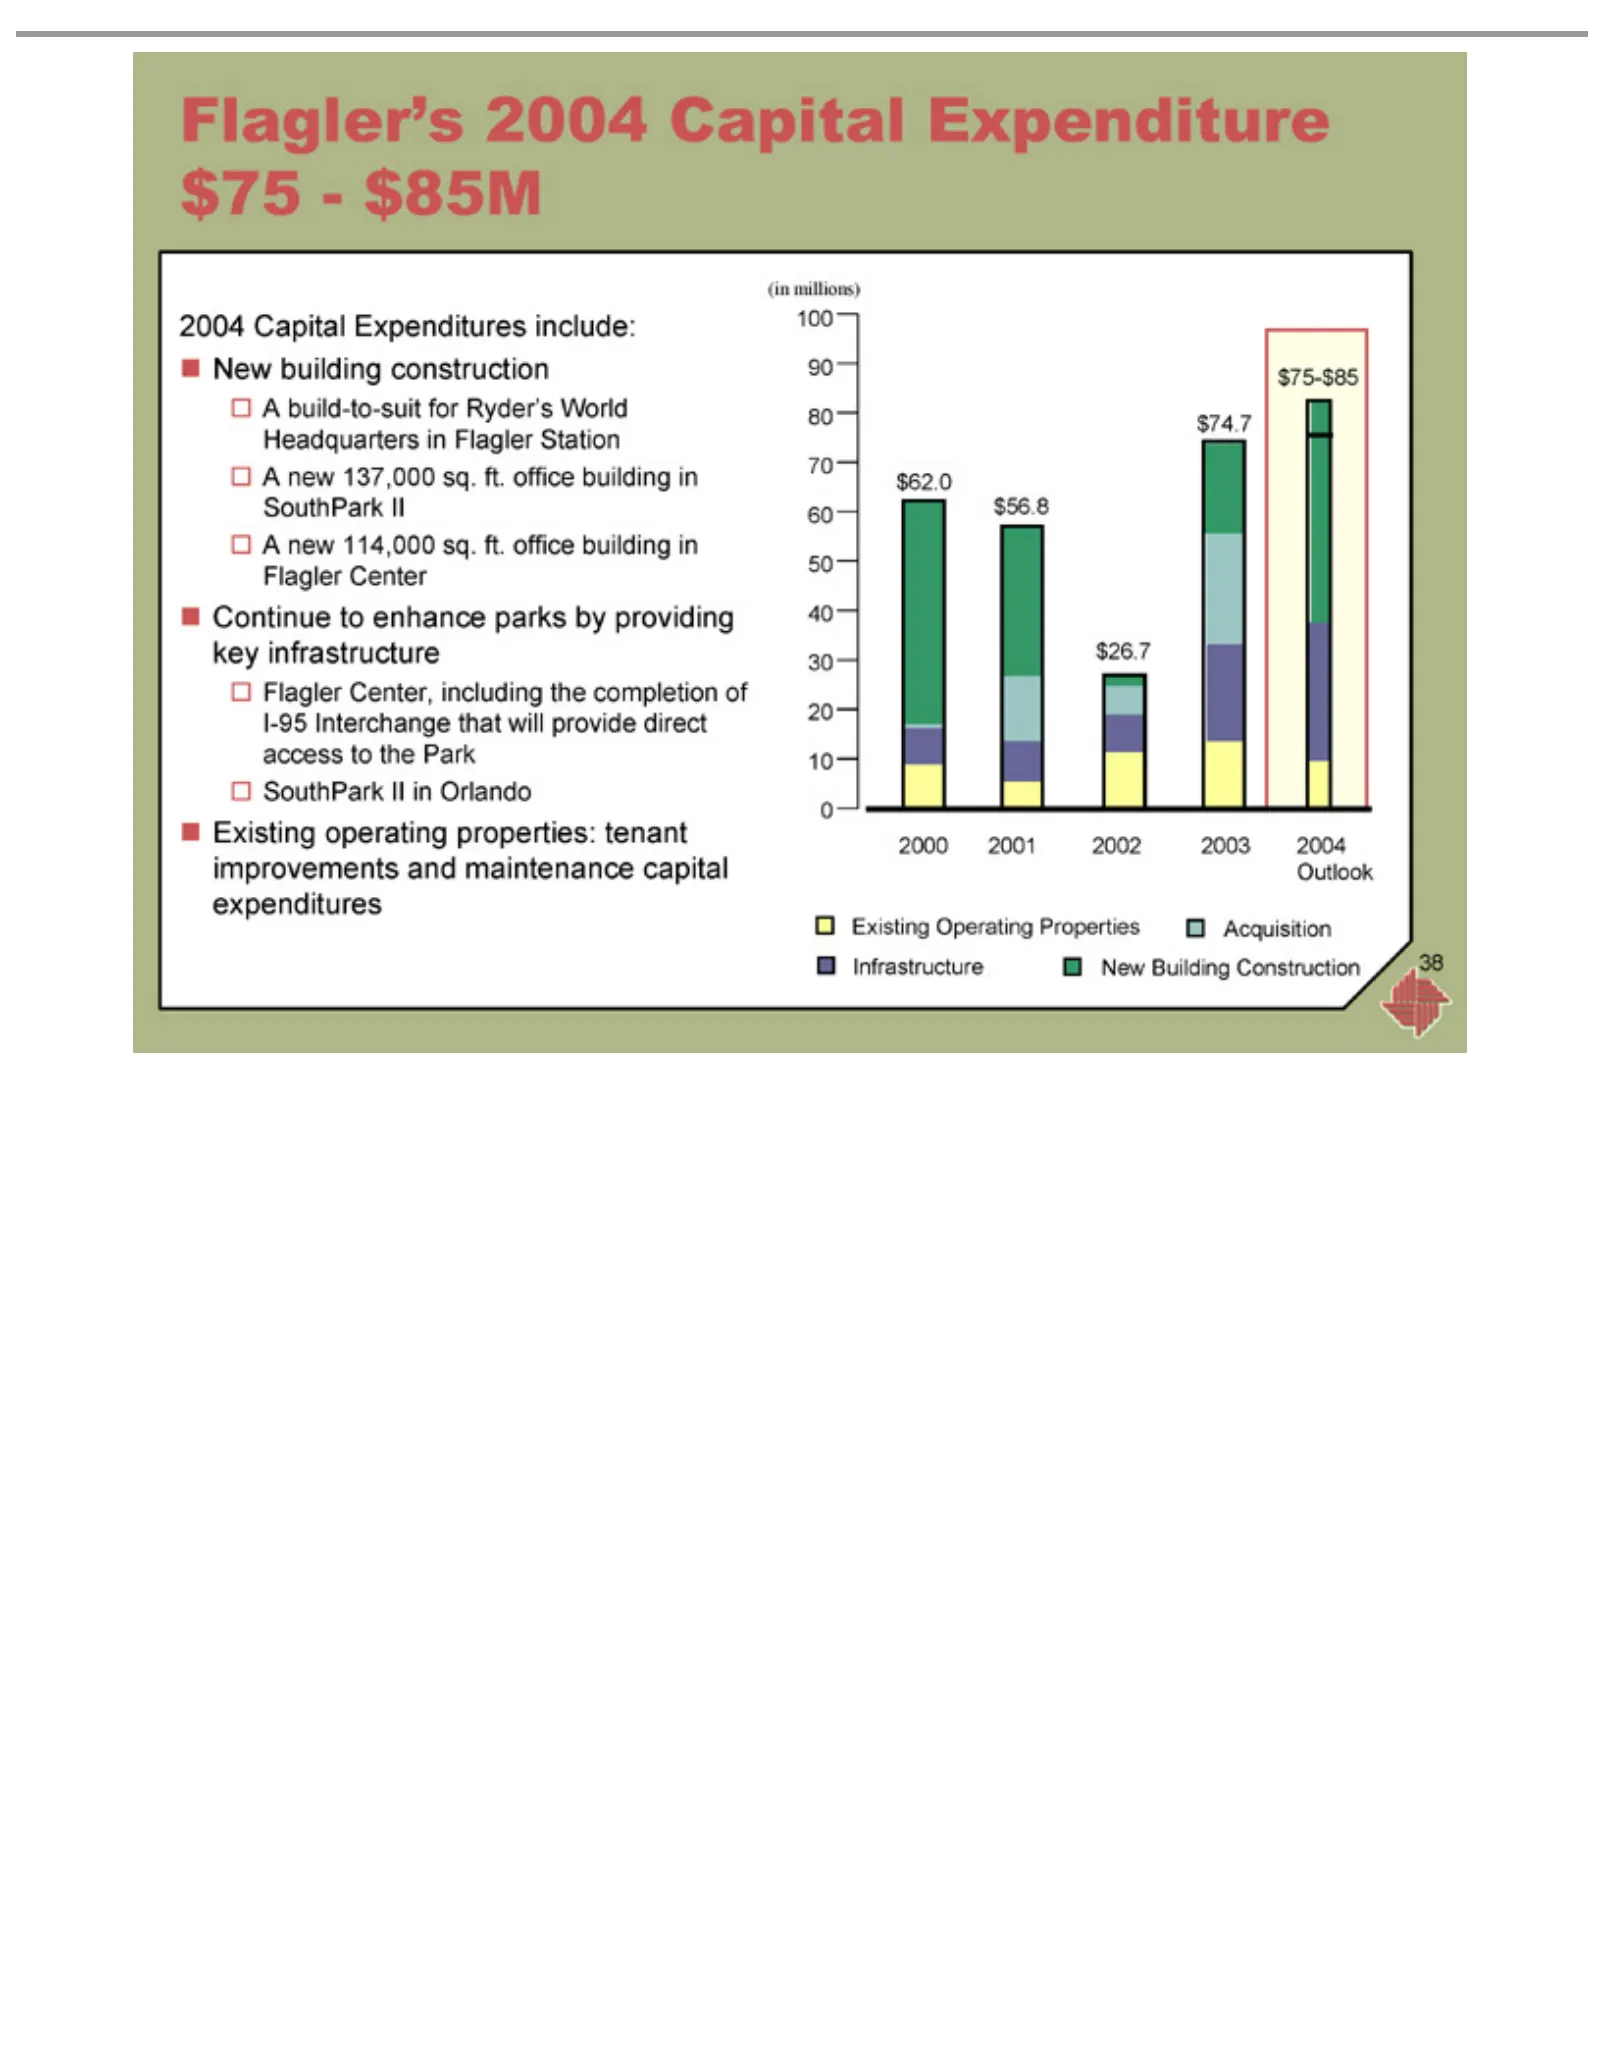
Flagler’s A Continue Flagler SouthPark 2004 $75-$85 2003 $74.7 2002 $26.7 2001 $56.8 2000 $62.0 Existing New Infrastructure Acquisition 38build-to-suit new building Building Capital Outlook 137,000 114,000 Center, operating Operating 2004 toIIenhance in Expenditures construction Construction Capital
Slide 39: Florida East Coast Industries has a strong balance sheet
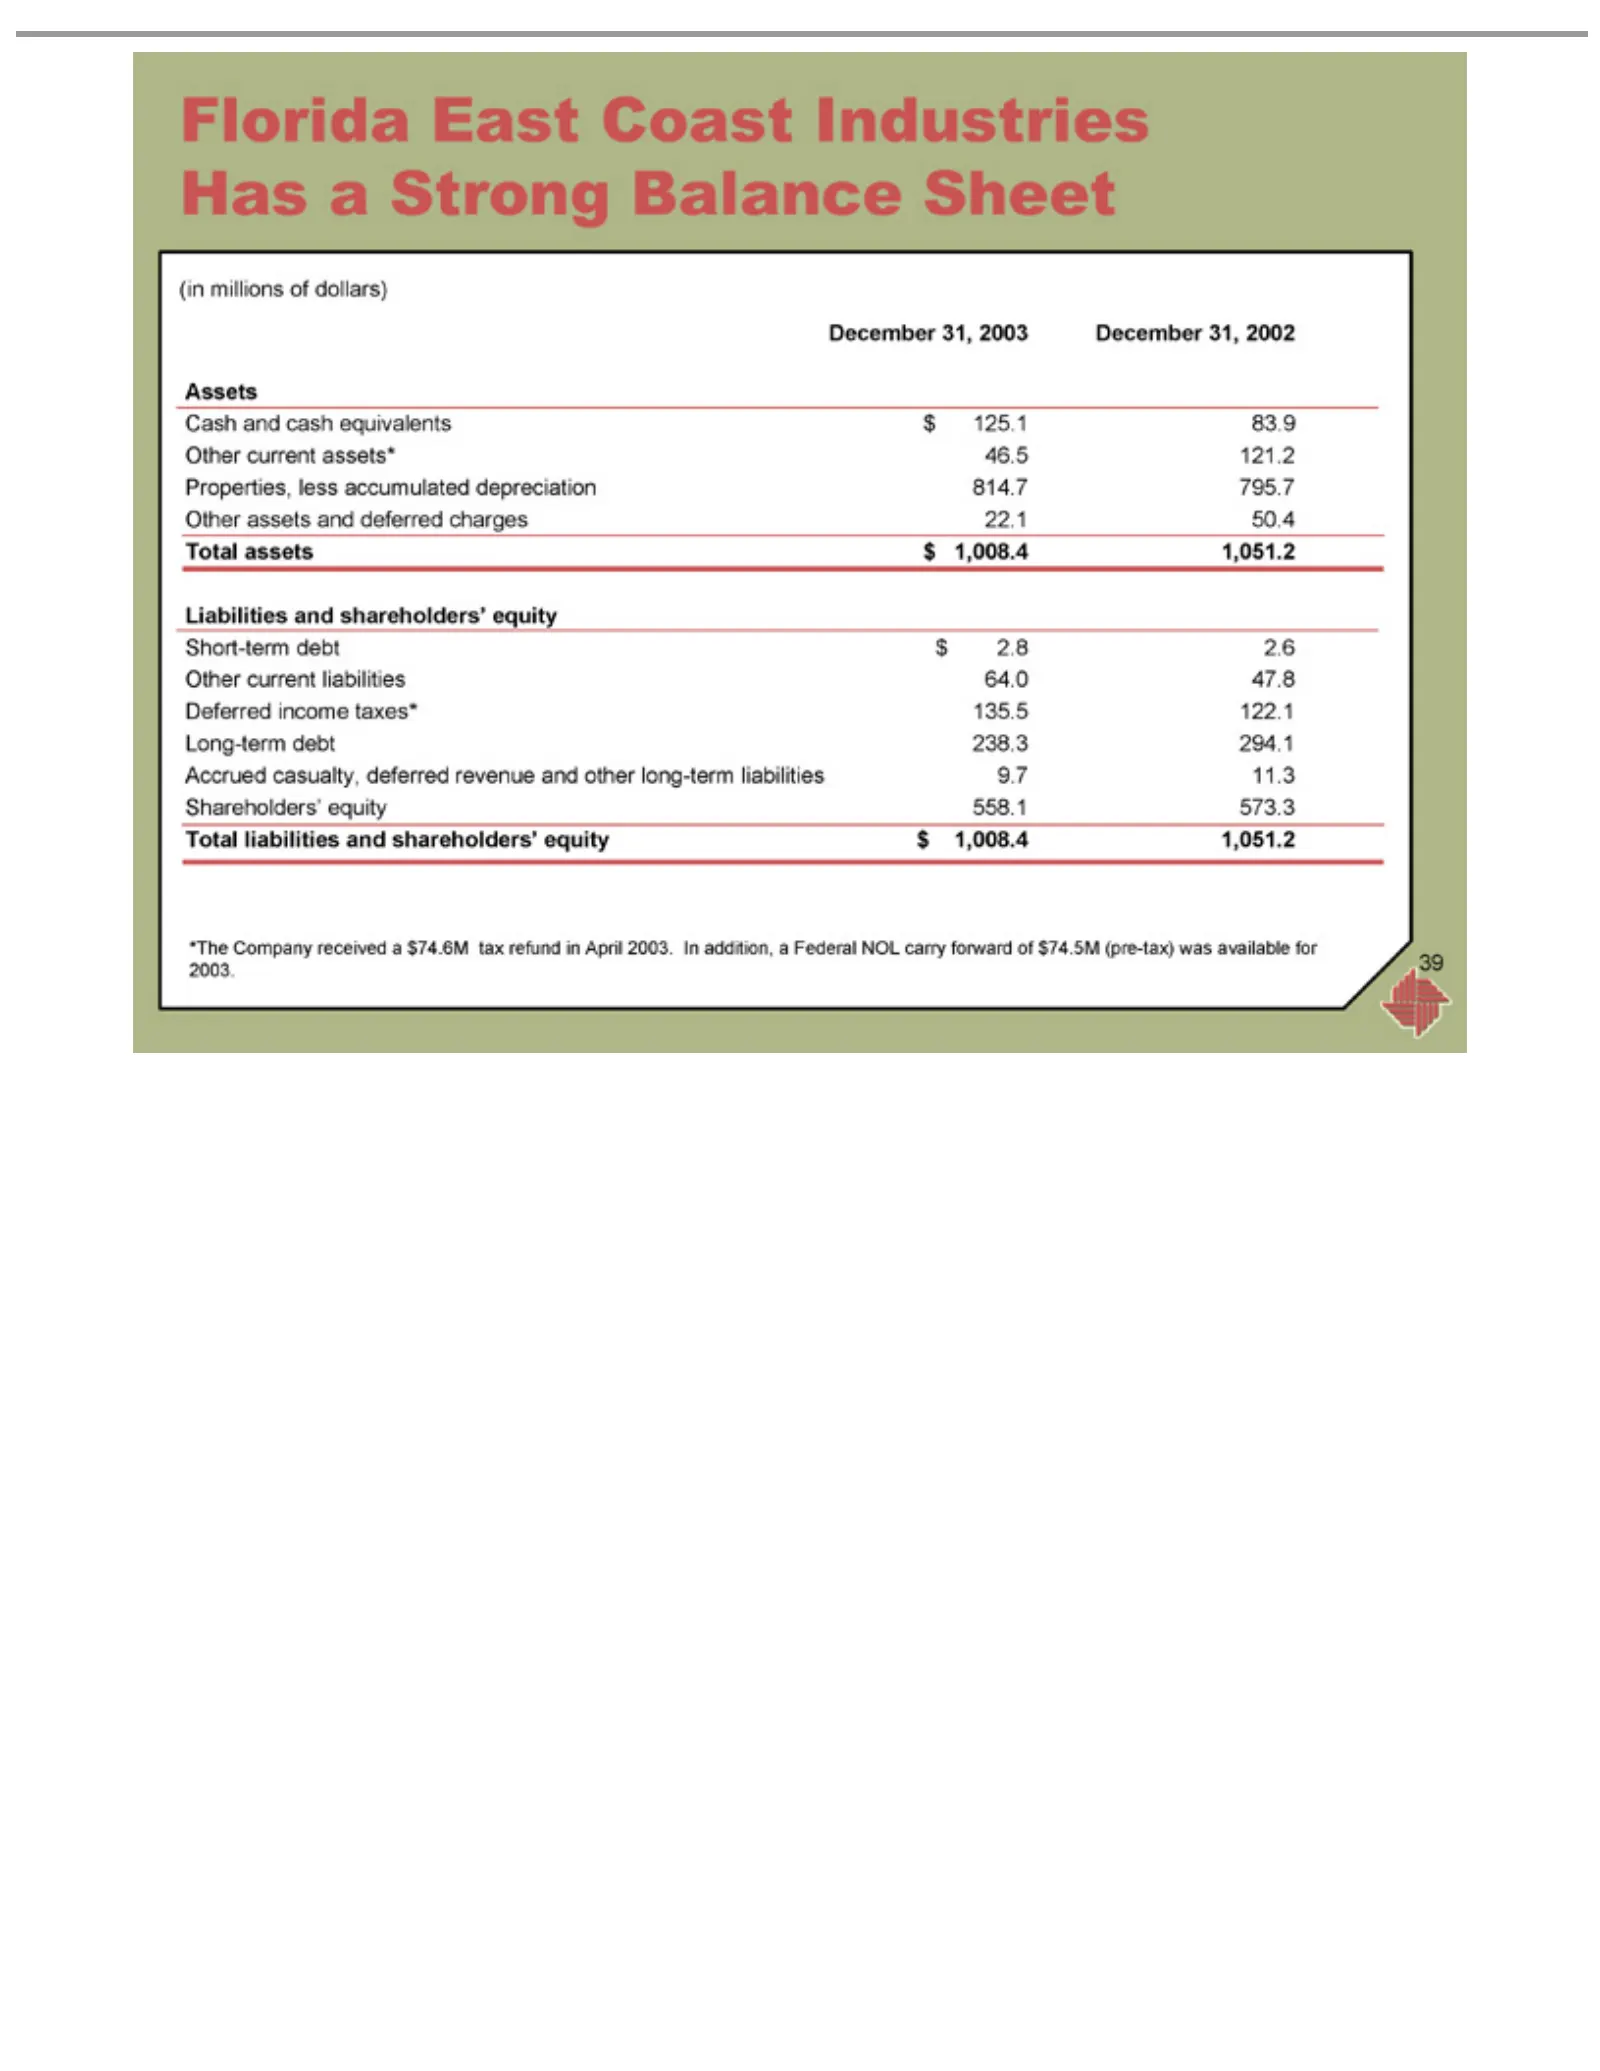
Florida (in December Cash Assets Properties, Liabilities Short-term Other Deferred Long-term Accrued Shareholders’ Total *The 39 millions and assets liabilities Company assets current East casualty, income cash and 31, debt less $of and Coast assets* liabilities 1,008.4 equity 2003 equivalents dolla
Slide 40: Unlocking value: success summary
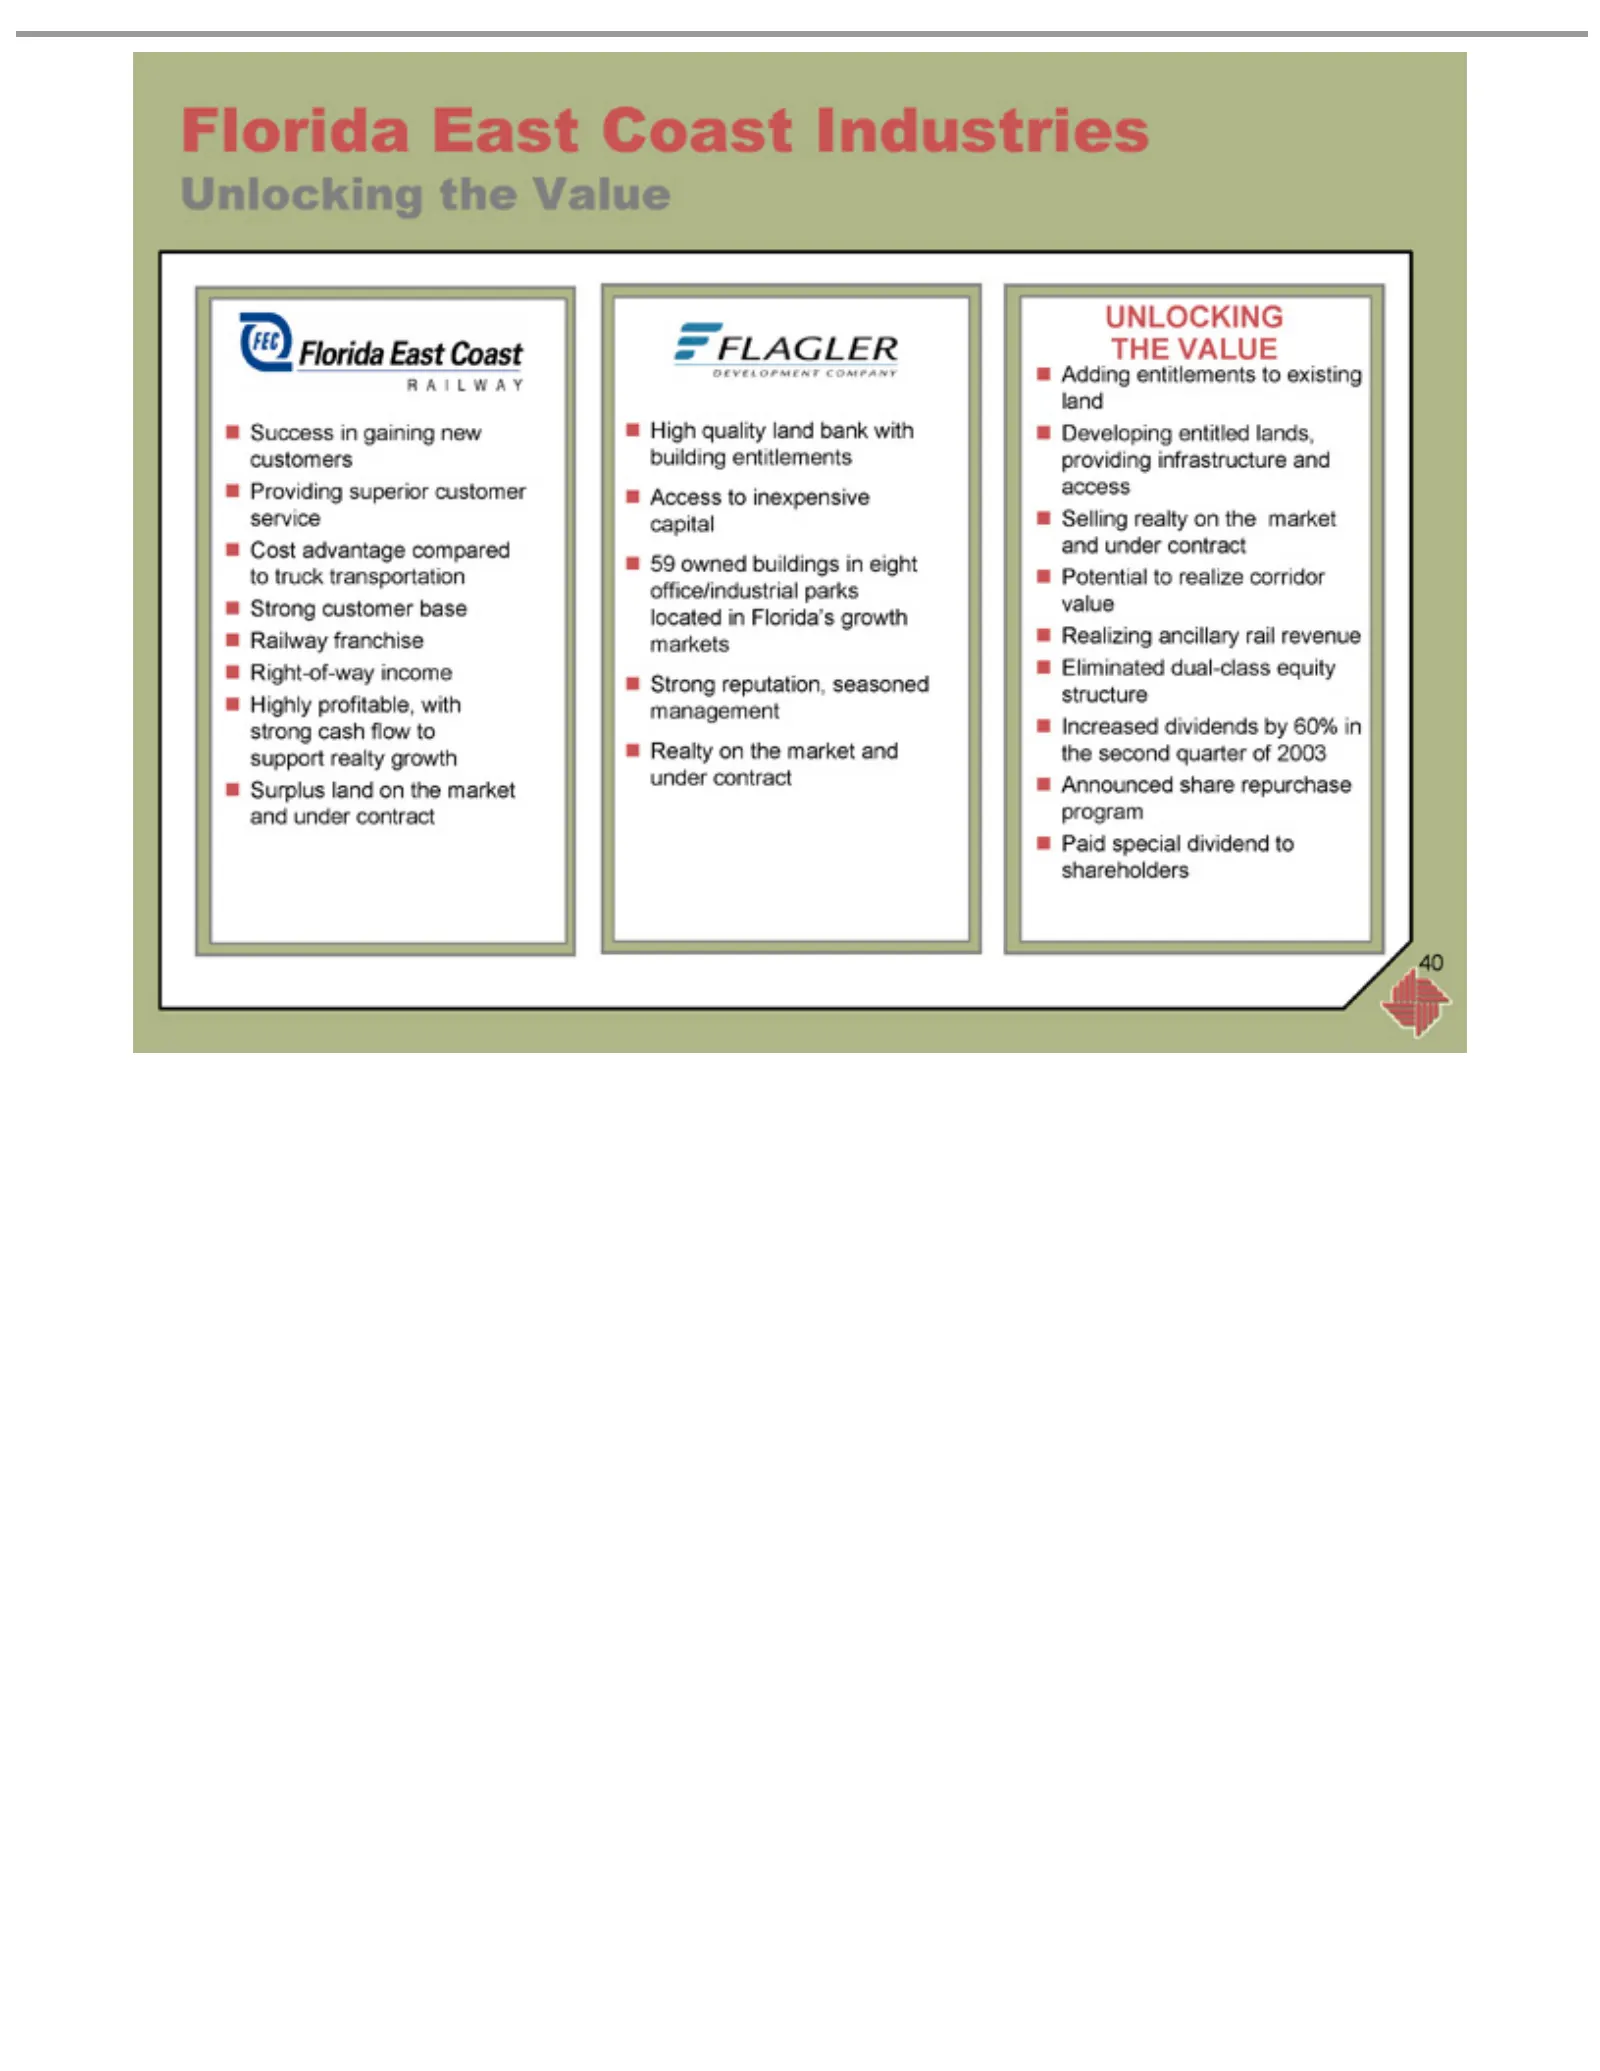
Florida Unlocking Success Providing Cost Railway Right-of-way Highly Surplus High Access 59 Strong Realty Adding Developing Selling Potential Realizing Eliminated Increased Announced Paid 40 owned special advantage quality on customer reputation, profitable, to realty East entitlements land in franc
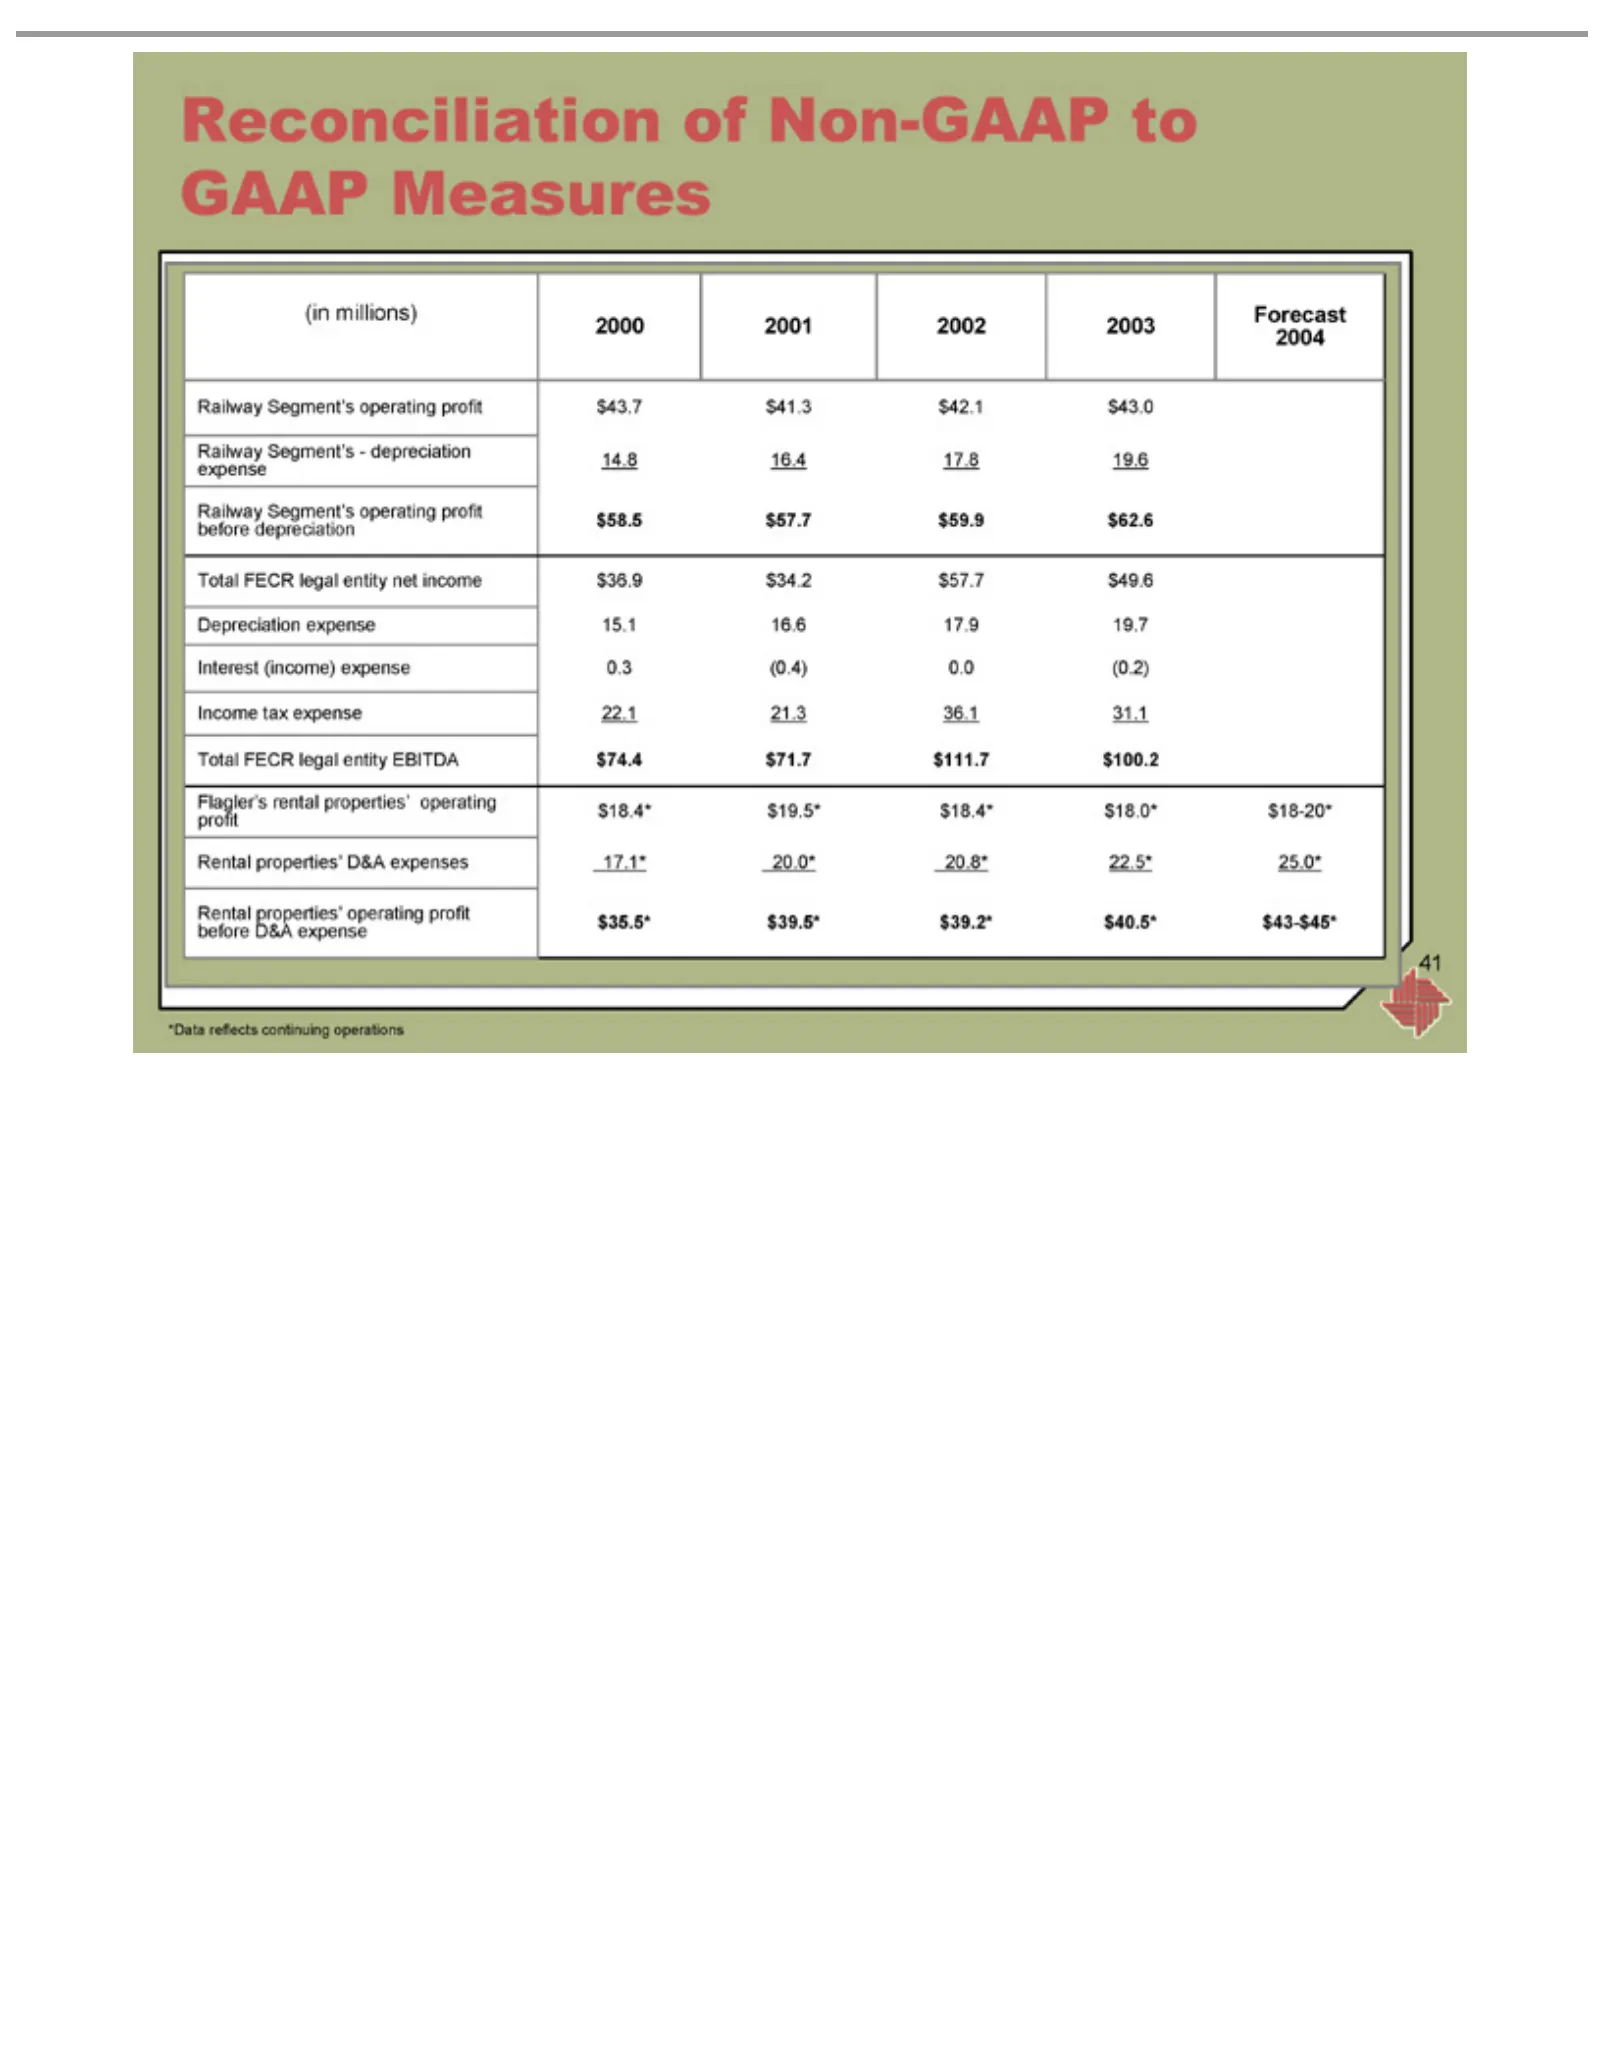
Slide 41: Reconciliation of non-GAAP measures
Reconciliation (in Railway expense Depreciation Interest Income Total Flaler’s profit Rental before *Data 41 millions) FECR reflects depreciation D&A properties’ (income) tax rental Segment’s expense legal expense expense properties’ continuing of expense Non-GAAP entity D&A operating -22.1 operatin
Source: SEC EDGAR · 8-K filed Feb 12, 2004
More decks from Florida East Coast Industries Inc
 Merger or Acquisition (May 2007)15 slides · May 31, 2007
 Q1 2007 Earnings Presentation26 slides · May 9, 2007
 Q4 2006 Earnings Presentation39 slides · Feb 15, 2007
 Q3 2006 Earnings Presentation36 slides · Nov 2, 2006
 Ryan Beck Investor Event (September 2006)80 slides · Sep 13, 2006
 Morgan Keegan 2006 Equity Conference30 slides · Sep 7, 2006