Ply Gem — Debt Investor Presentation (March 2007)
28 slides from Ply Gem's debt investor presentation, Mar 12, 2007
Slide 1: $768,500,000 Senior Secured Credit Facilities Lenders' Presentation
STRICTLY CONFIDENTIAL $768,500,000 Senior Secured Credit Facilities Lenders’ Presentation
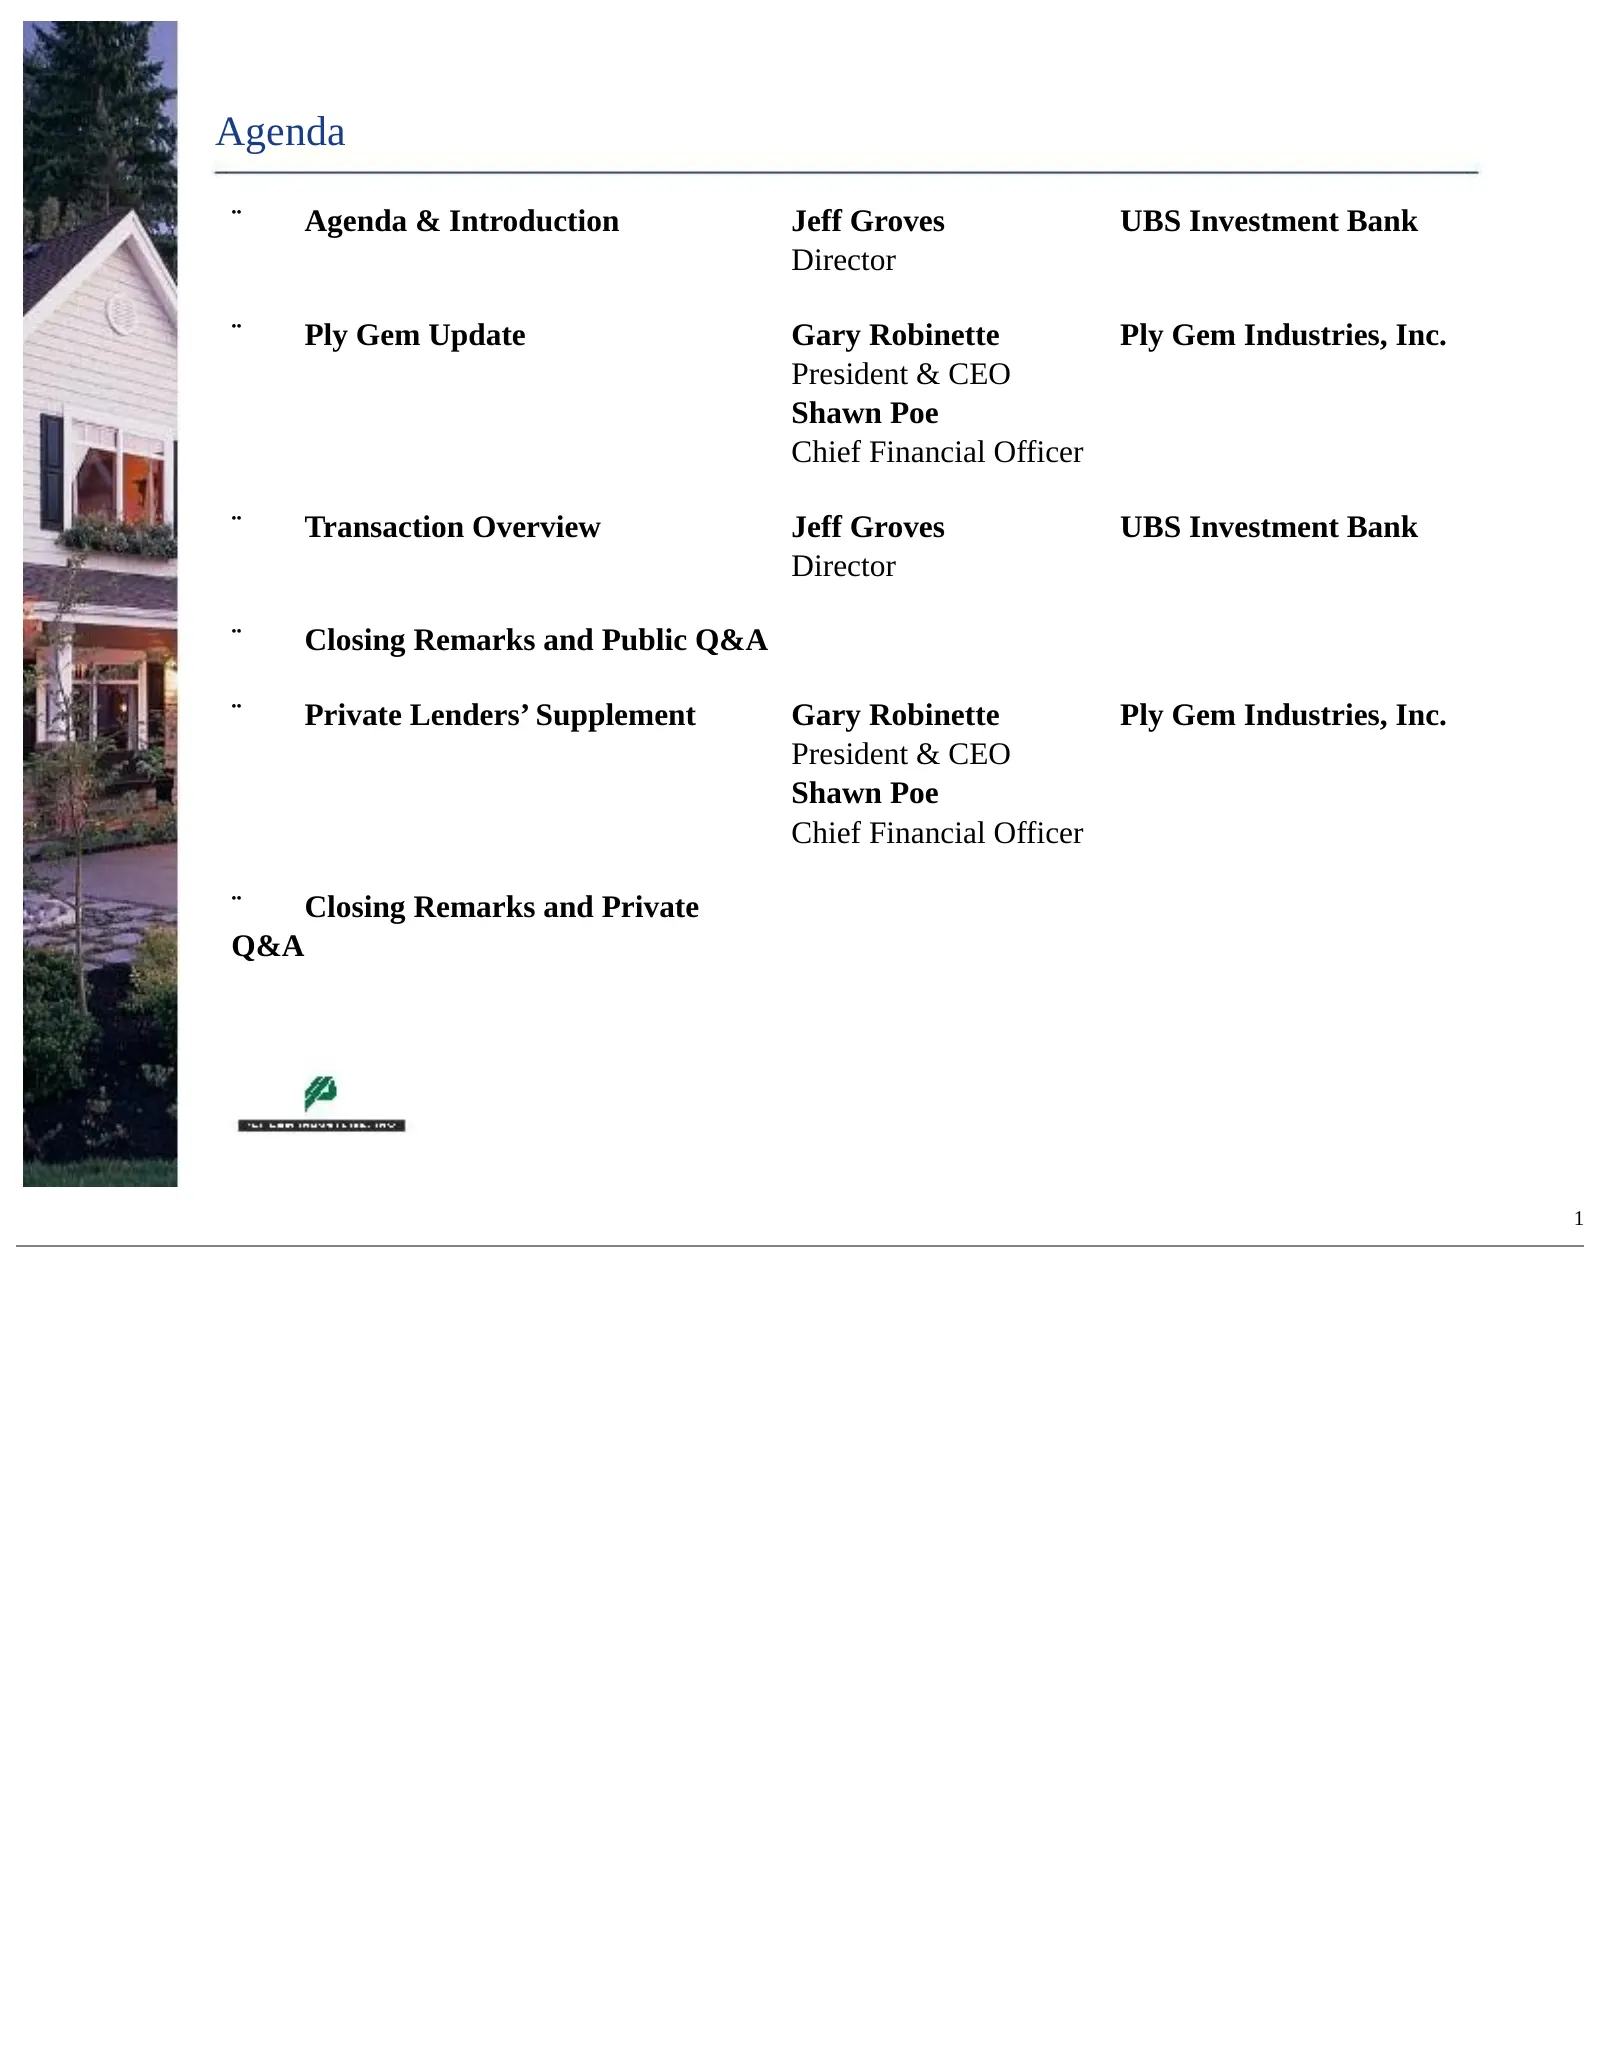
Slide 2: Agenda
Agenda ¨ Agenda & Introduction Jeff Groves UBS Investment Bank Director ¨ Ply Gem Update Gary Robinette Ply Gem Industries, Inc. President & CEO Shawn Poe Chief Financial Officer ¨ Transaction Overview Jeff Groves UBS Investment Bank Director ¨ Closing Remarks and Public Q&A ¨ Private Lenders’ Suppl
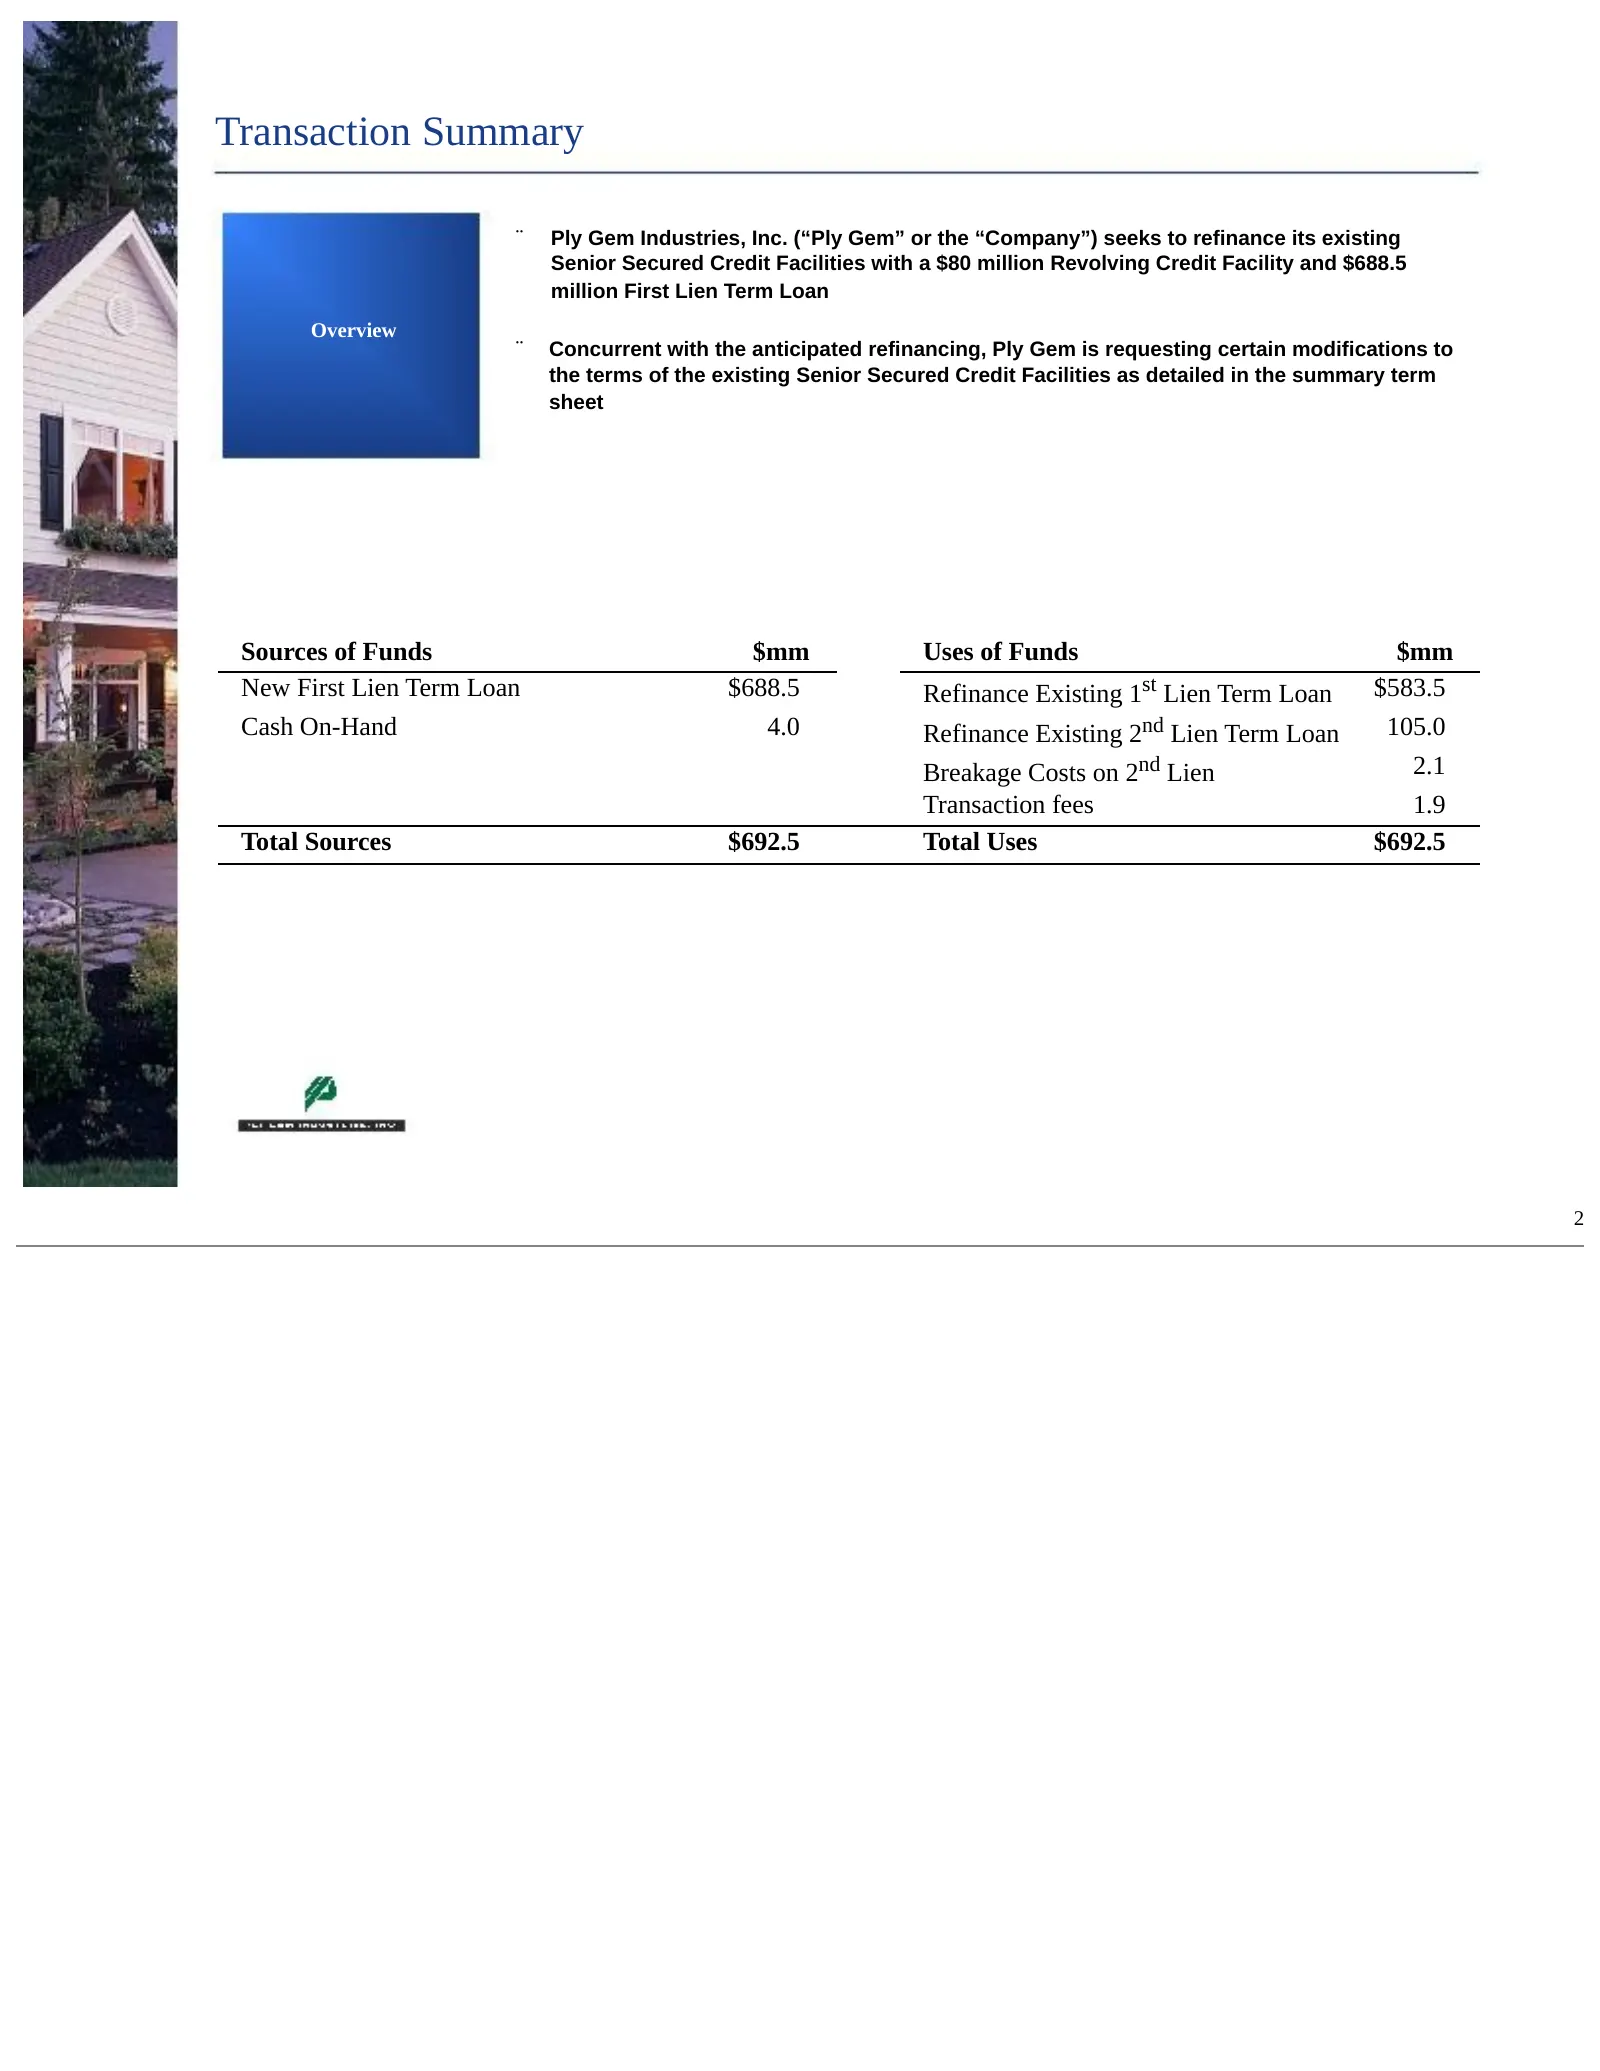
Slide 3: Transaction Summary
Transaction Summary ¨ Ply Gem Industries, Inc. (“Ply Gem” or the “Company”) seeks to refinance its existing Senior Secured Credit Facilities with a $80 million Revolving Credit Facility and $688.5 million First Lien Term Loan Overview ¨ Concurrent with the anticipated refinancing, Ply Gem is request
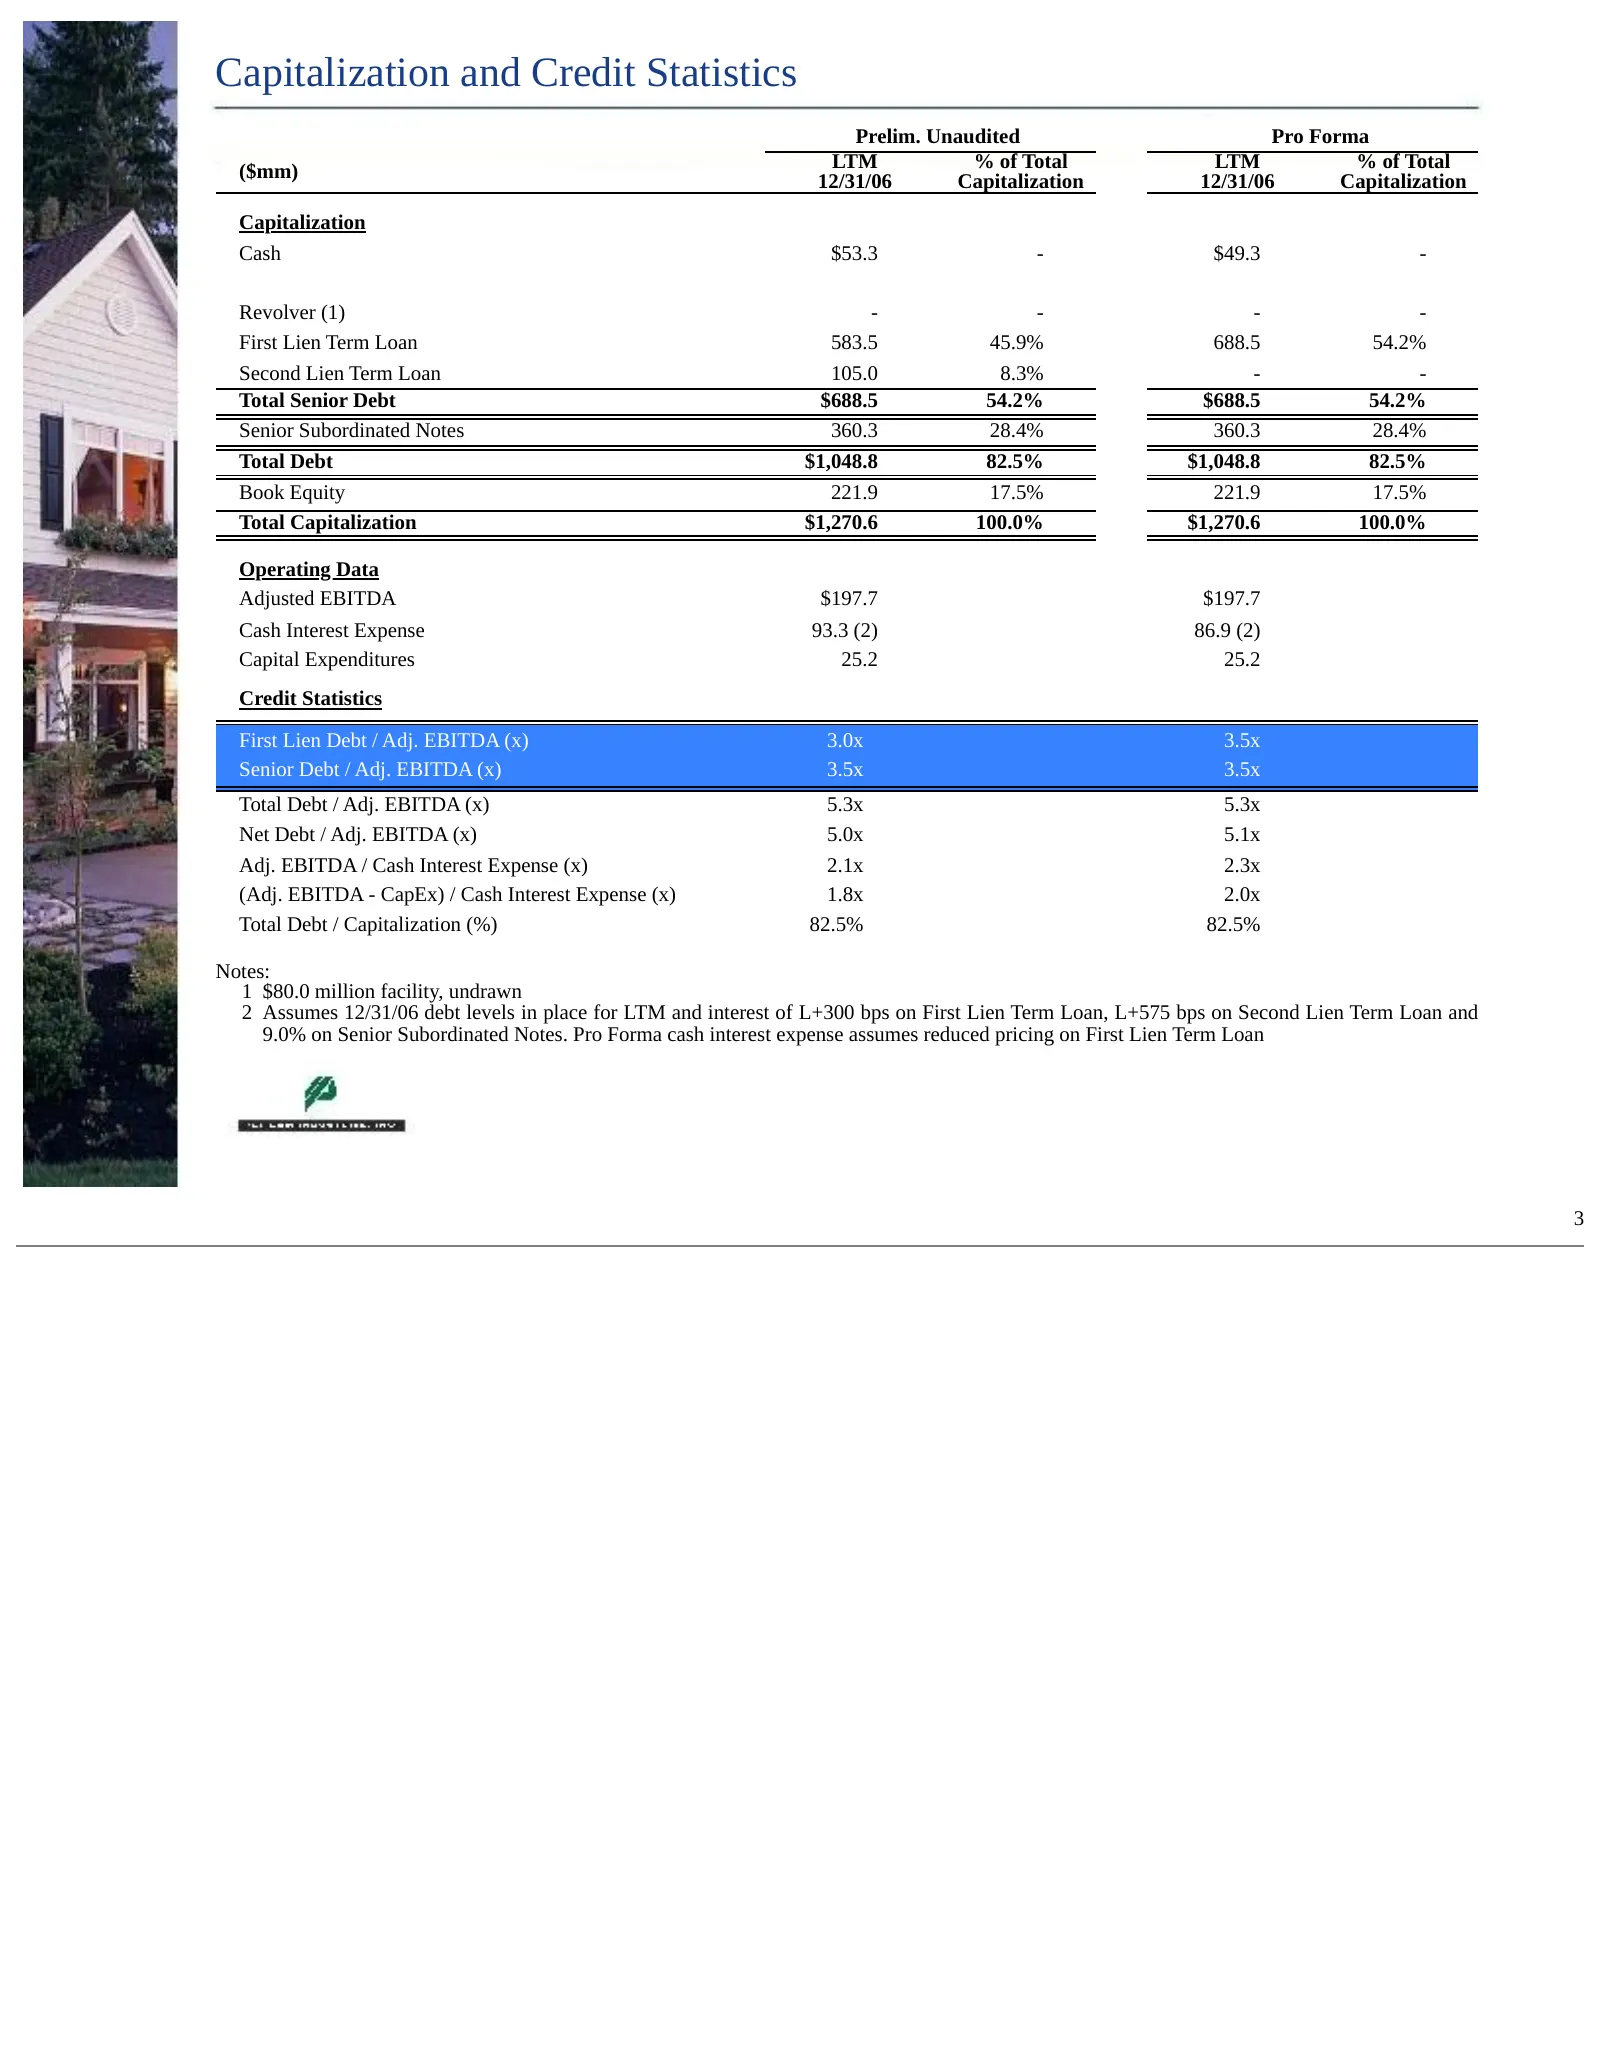
Slide 4: Capitalization and Credit Statistics
Capitalization and Credit Statistics Prelim. Unaudited Pro Forma ($mm) LTM % of Total LTM % of Total 12/31/06 Capitalization 12/31/06 Capitalization Capitalization Cash $53.3 - $49.3 - Revolver (1) - - - - First Lien Term Loan 583.5 45.9% 688.5 54.2% Second Lien Term Loan 105.0 8.3% - - Total Senior
Slide 5: Company Update
Company Update Gary Robinette, Ply Gem Industries, Inc. Shawn Poe, Ply Gem Industries, Inc. 4
Slide 6: Disclaimer
Disclaimer These slides contain (and the accompanying oral discussion will contain) “forward-looking statements” within the meaning of the Private Securities Litigation Reform Act of 1995. Such statements involve known and unknown risks, uncertainties and other factors that could cause the actual re
Slide 7: Ply Gem Overview: Recent Highlights - FY 2006 Update
Ply Gem Overview Recent Highlights - FY 2006 Update ¨ In 2006, Ply Gem Sales and EBITDA increased 1.8% and 15.6%, respectively over 2005 – In 1H 2006, Ply Gem experienced marginally higher sales driven by strong unit volume growth in siding, modest unit growth in US and Canadian new construction win
Slide 8: Ply Gem Overview: Recent Highlights - FY 2006 Update
Ply Gem Overview Recent Highlights - FY 2006 Update ¨ Pro Forma net sales in windows and doors decreased by approx. 1.7% in FY 2006 – Decline in new construction units in Ply Gem’s core markets during 2H 2006 was the primary Outperformed the driver of the decline in sales Market in – In addition, ra
Slide 9: AHE Integration Update
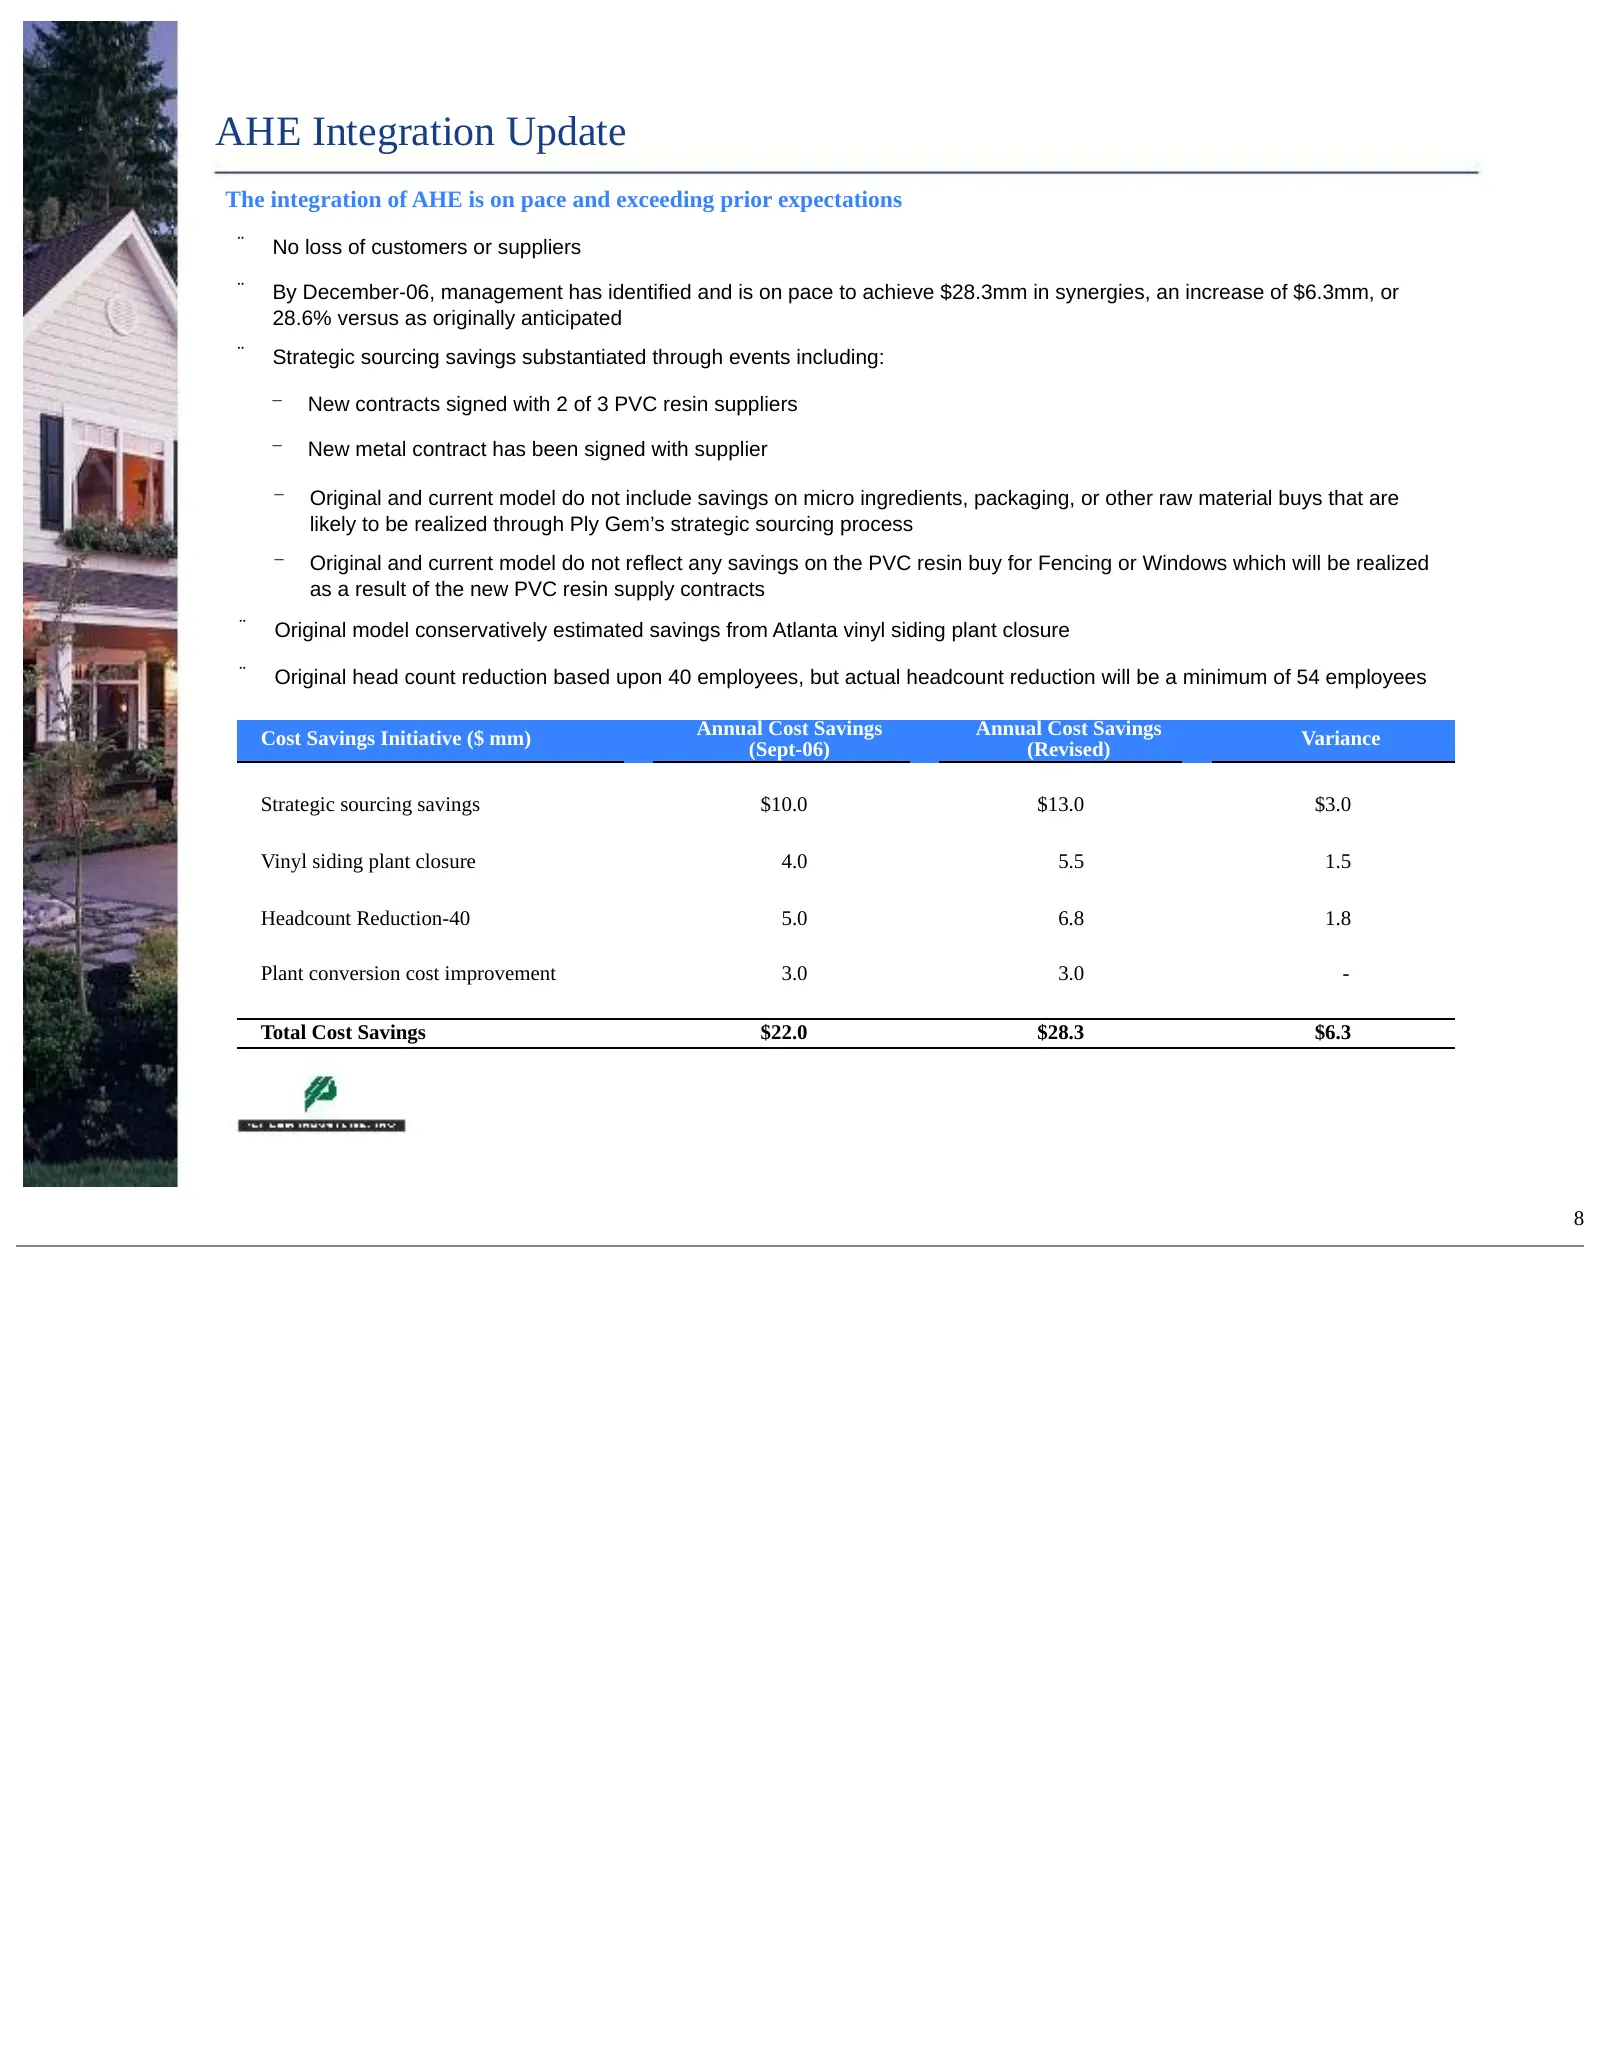
AHE Integration Update The integration of AHE is on pace and exceeding prior expectations ¨ No loss of customers or suppliers ¨ By December-06, management has identified and is on pace to achieve $28.3mm in synergies, an increase of $6.3mm, or 28.6% versus as originally anticipated ¨ Strategic sourc
Slide 10: Ply Gem Recent Financial Performance
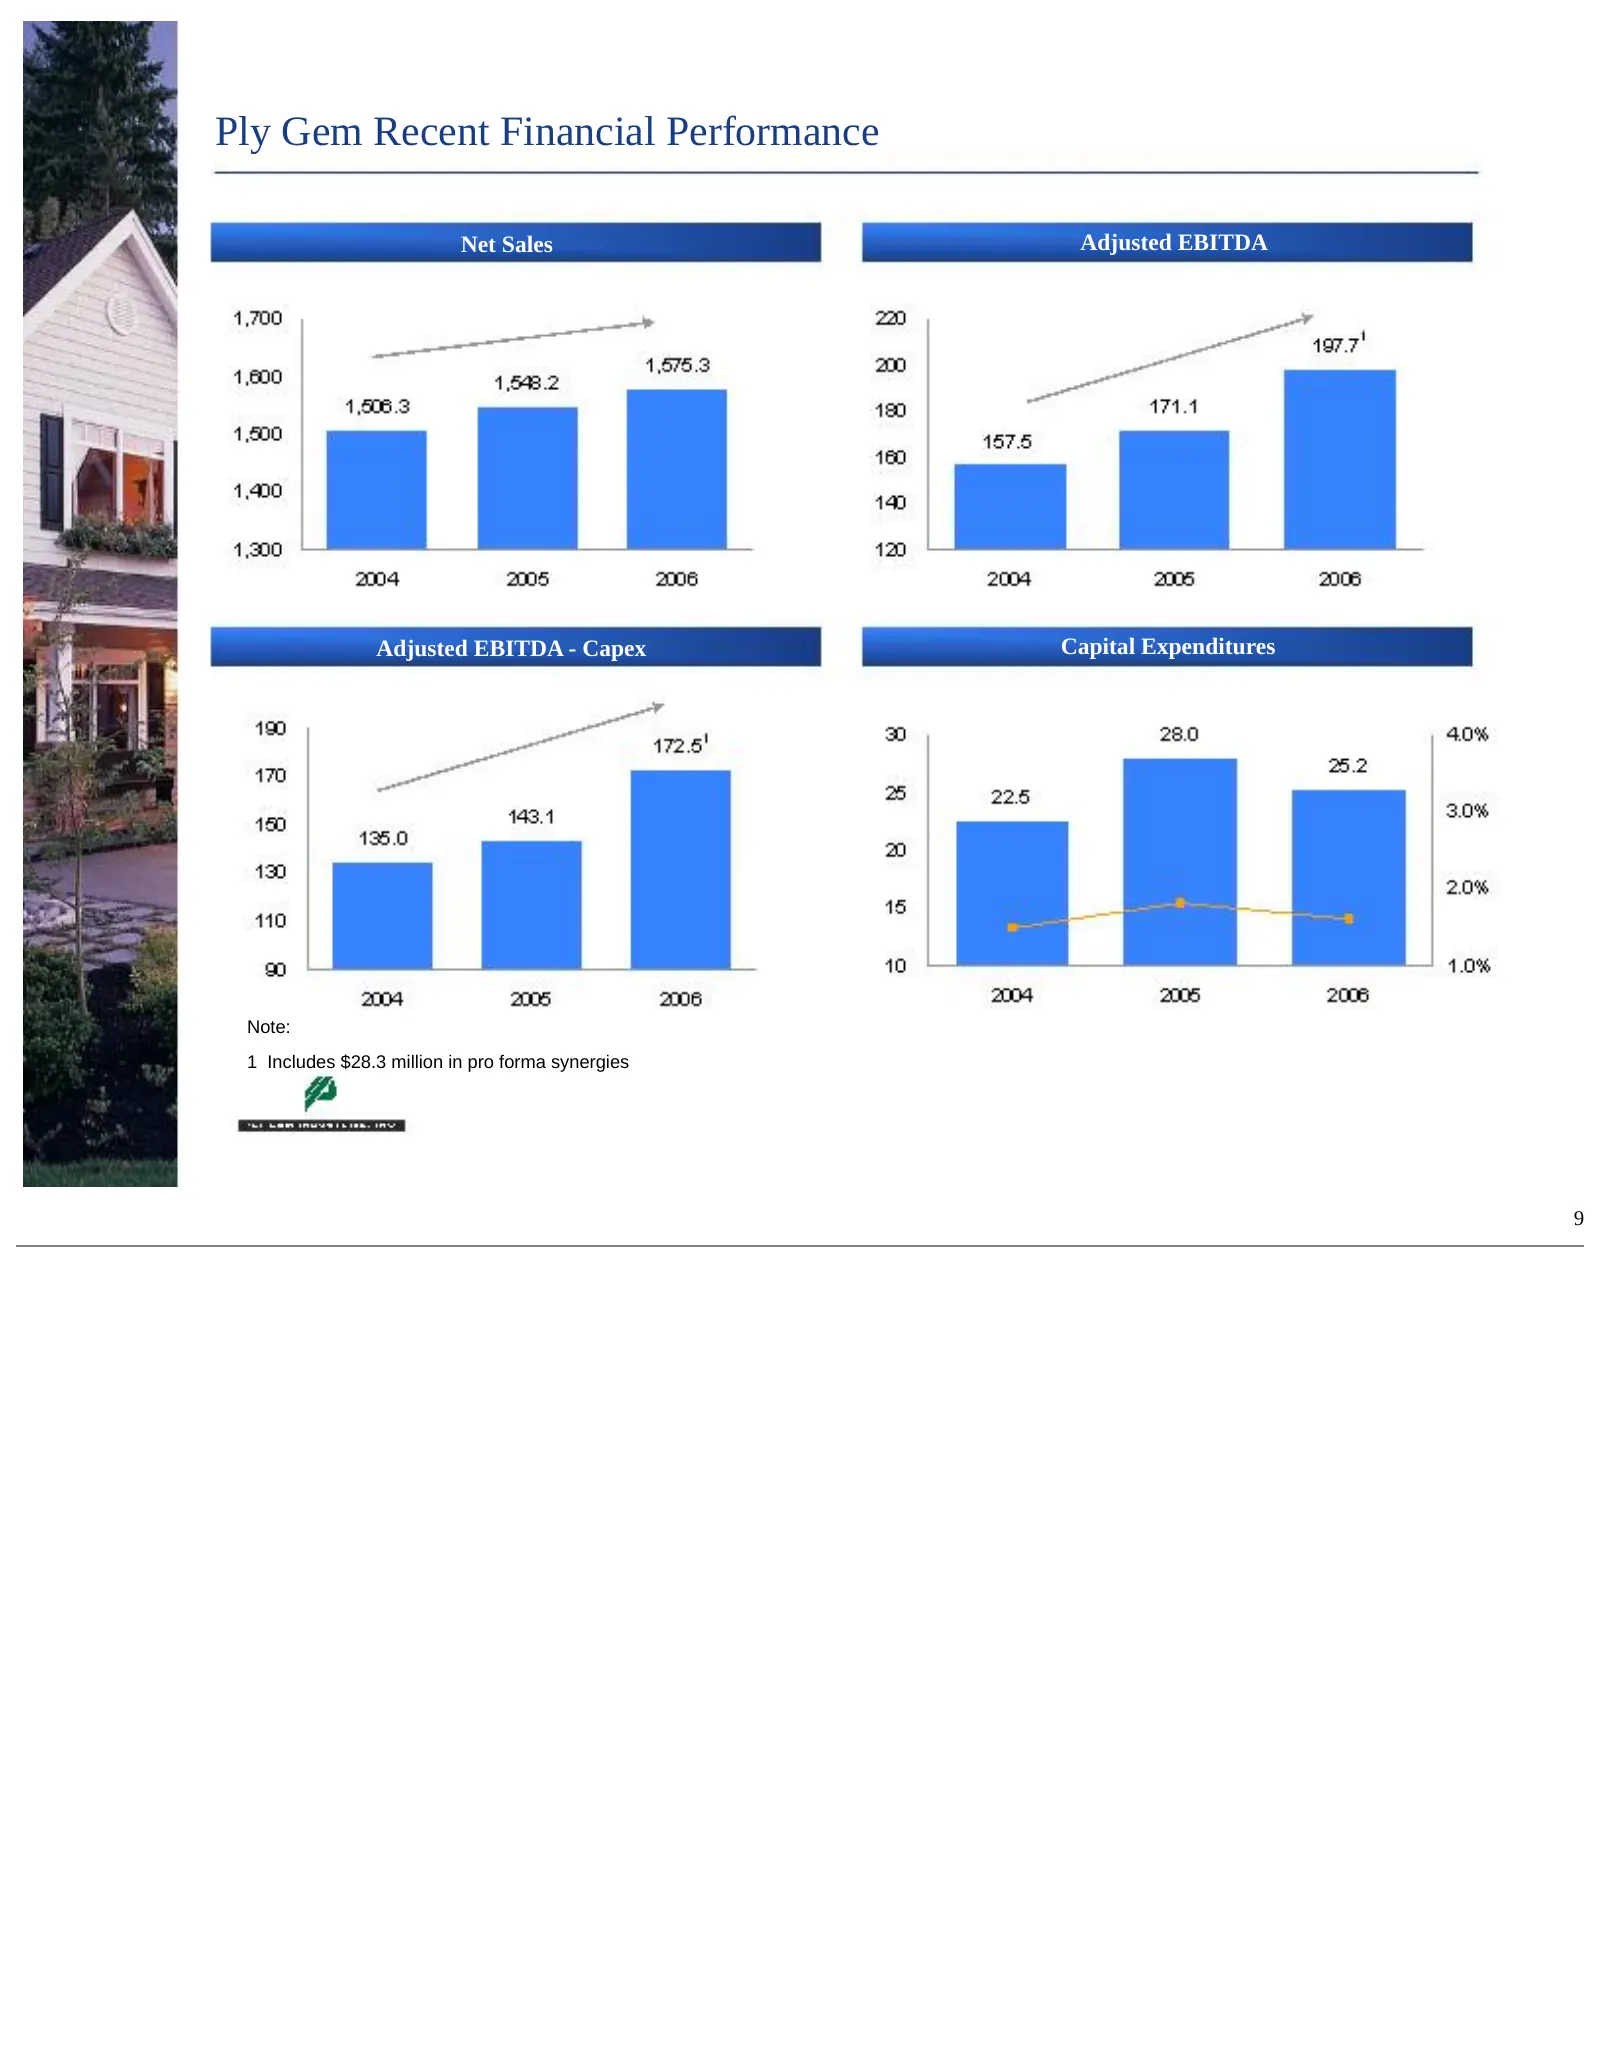
Ply Gem Recent Financial Performance Net Sales Adjusted EBITDA Adjusted EBITDA - Capex Capital Expenditures Note: 1 Includes $28.3 million in pro forma synergies 9
Slide 11: Ply Gem EBITDA Adjustments
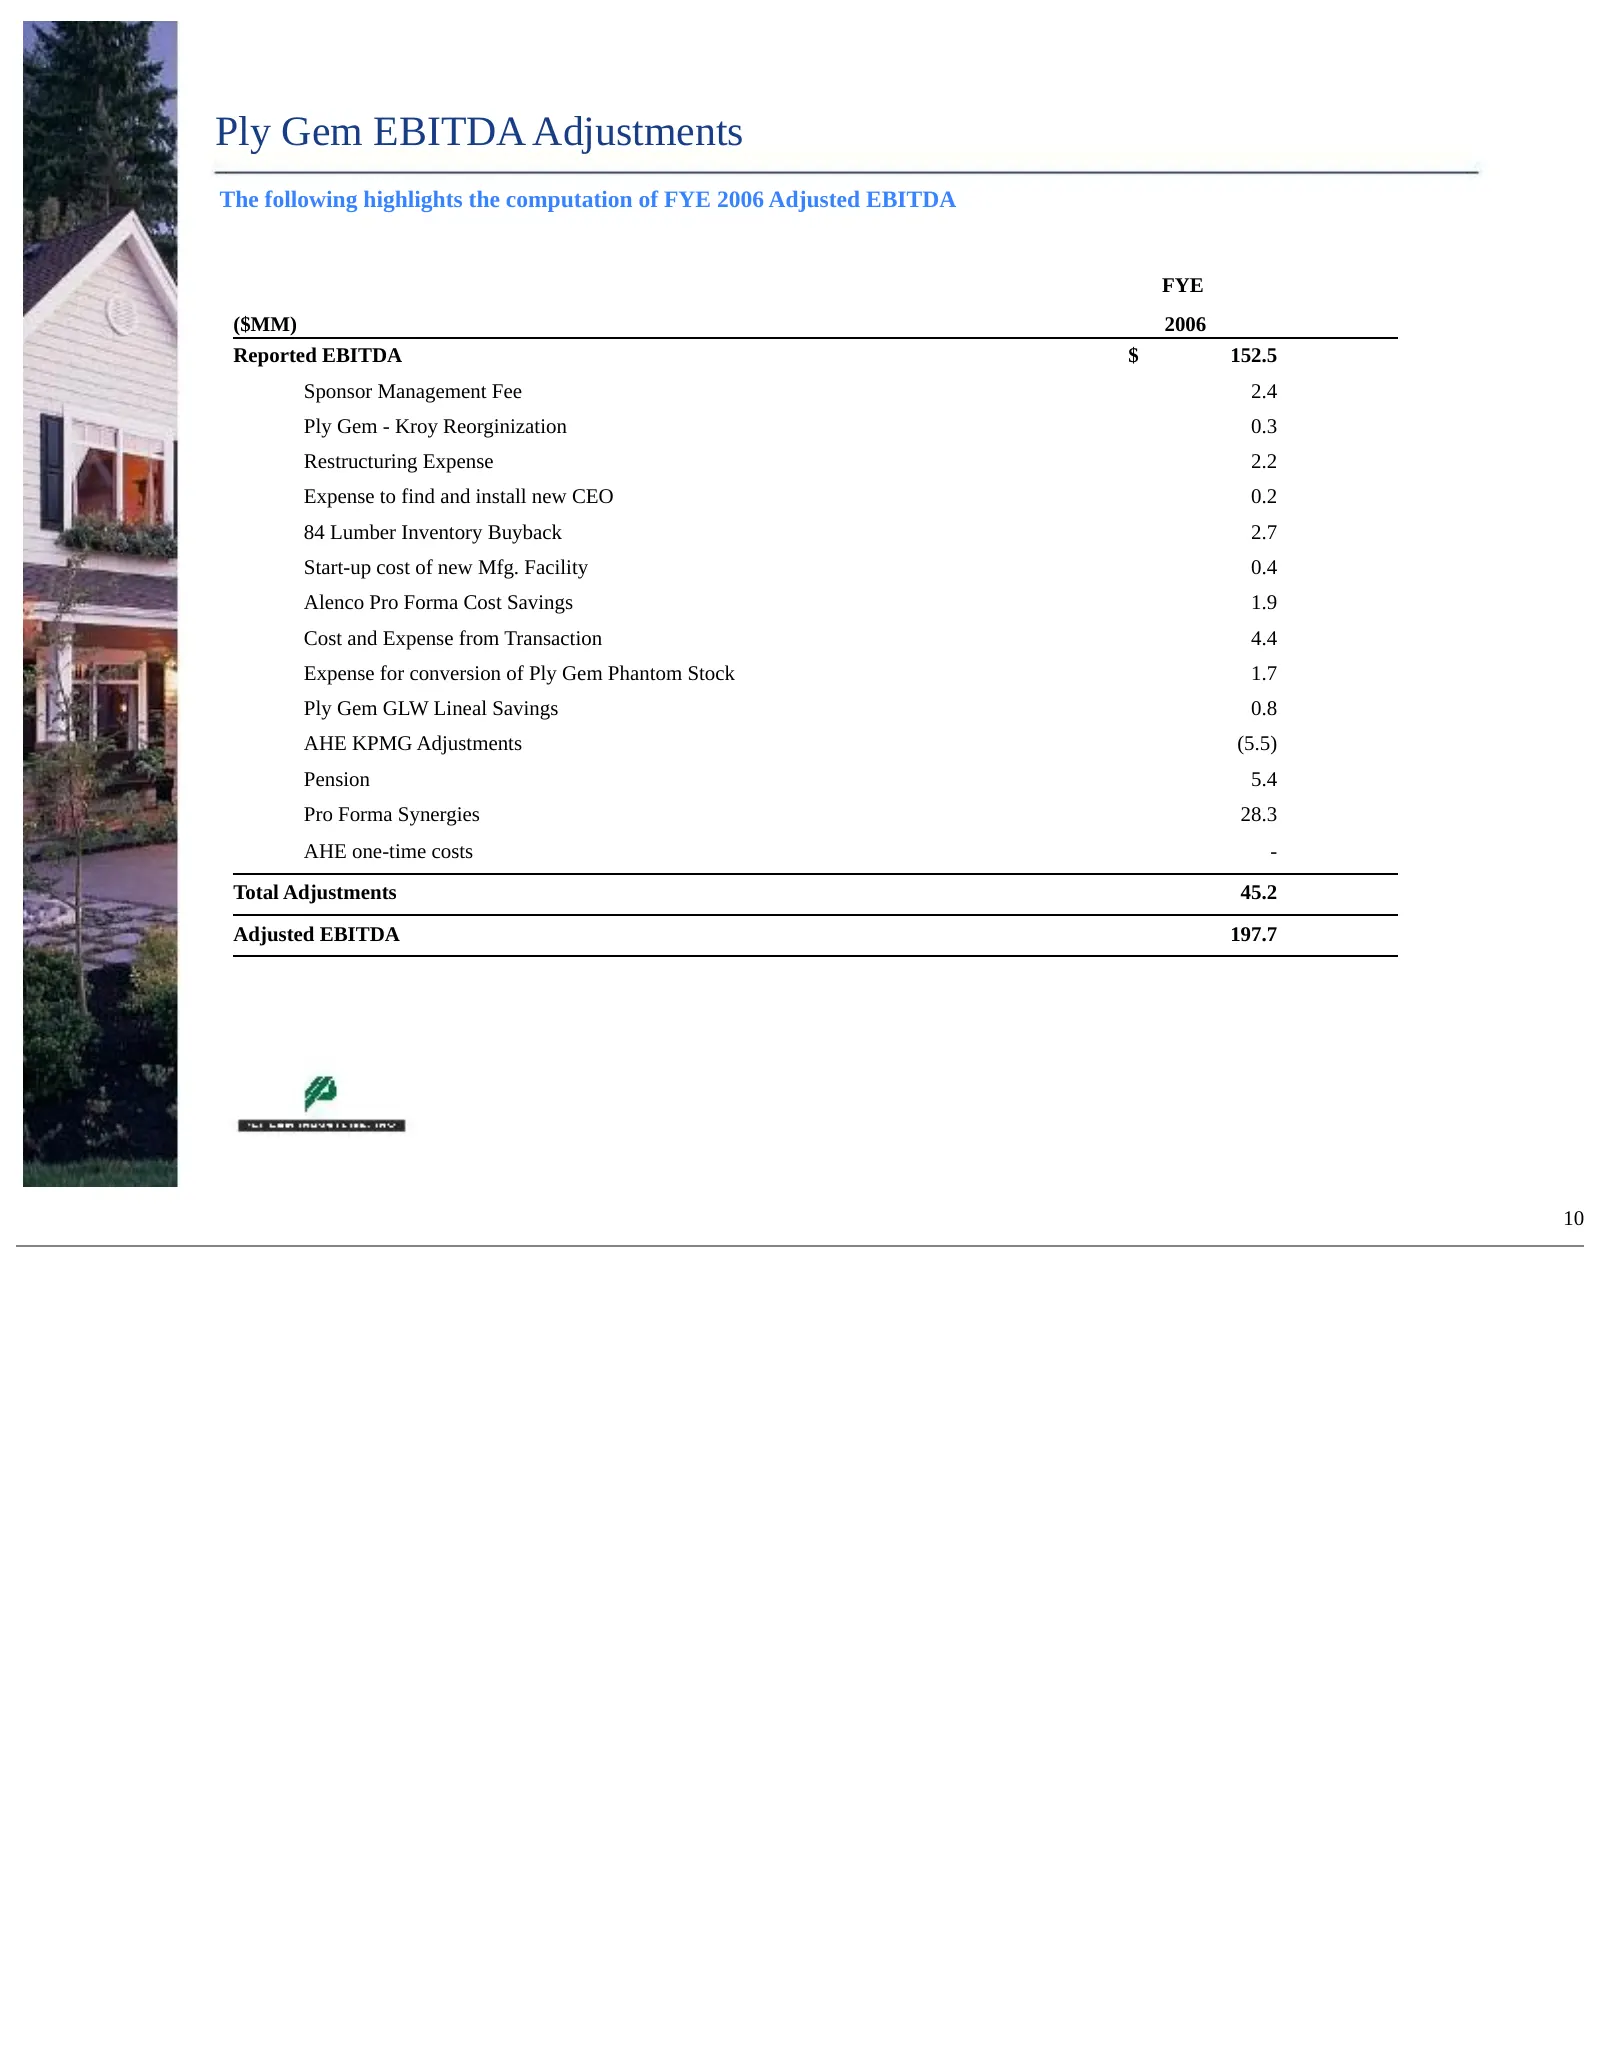
Ply Gem EBITDA Adjustments The following highlights the computation of FYE 2006 Adjusted EBITDA FYE ($MM) 2006 Reported EBITDA $ 152.5 Sponsor Management Fee 2.4 Ply Gem - Kroy Reorginization 0.3 Restructuring Expense 2.2 Expense to find and install new CEO 0.2 84 Lumber Inventory Buyback 2.7 Start-
Slide 12: Industry Fundamentals Remain Favorable
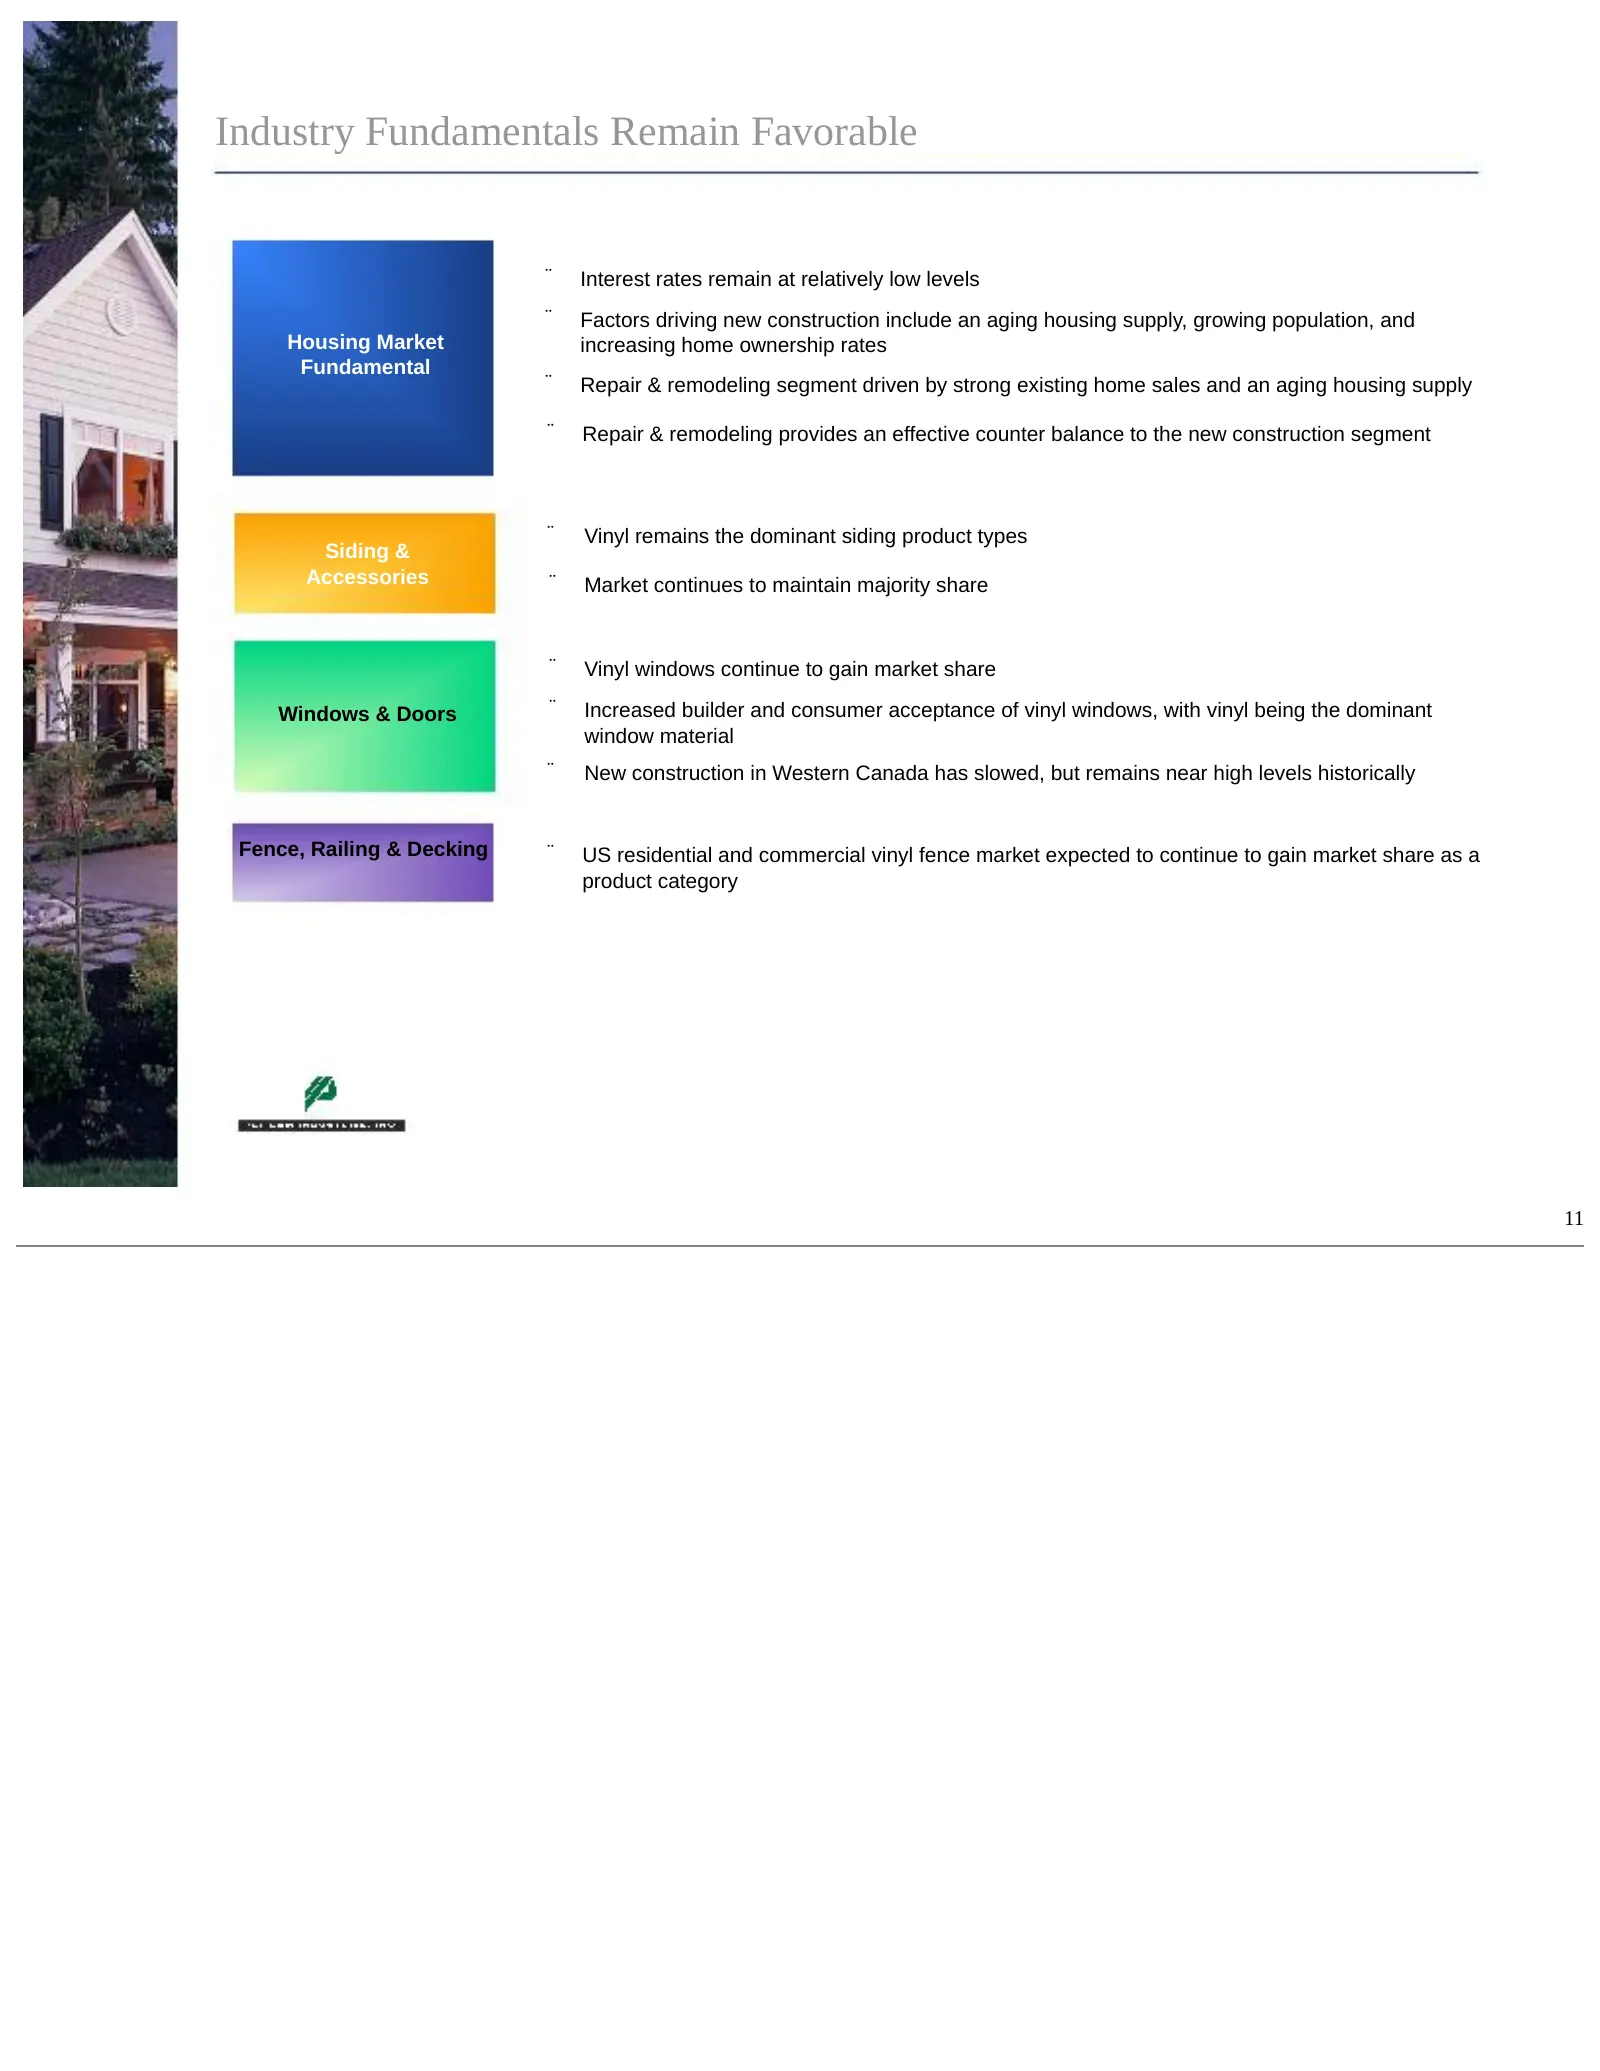
Industry Fundamentals Remain Favorable ¨ Interest rates remain at relatively low levels ¨ Factors driving new construction include an aging housing supply, growing population, and Housing Market increasing home ownership rates Fundamental ¨ Repair & remodeling segment driven by strong existing home
Slide 13: Housing Market Outlook
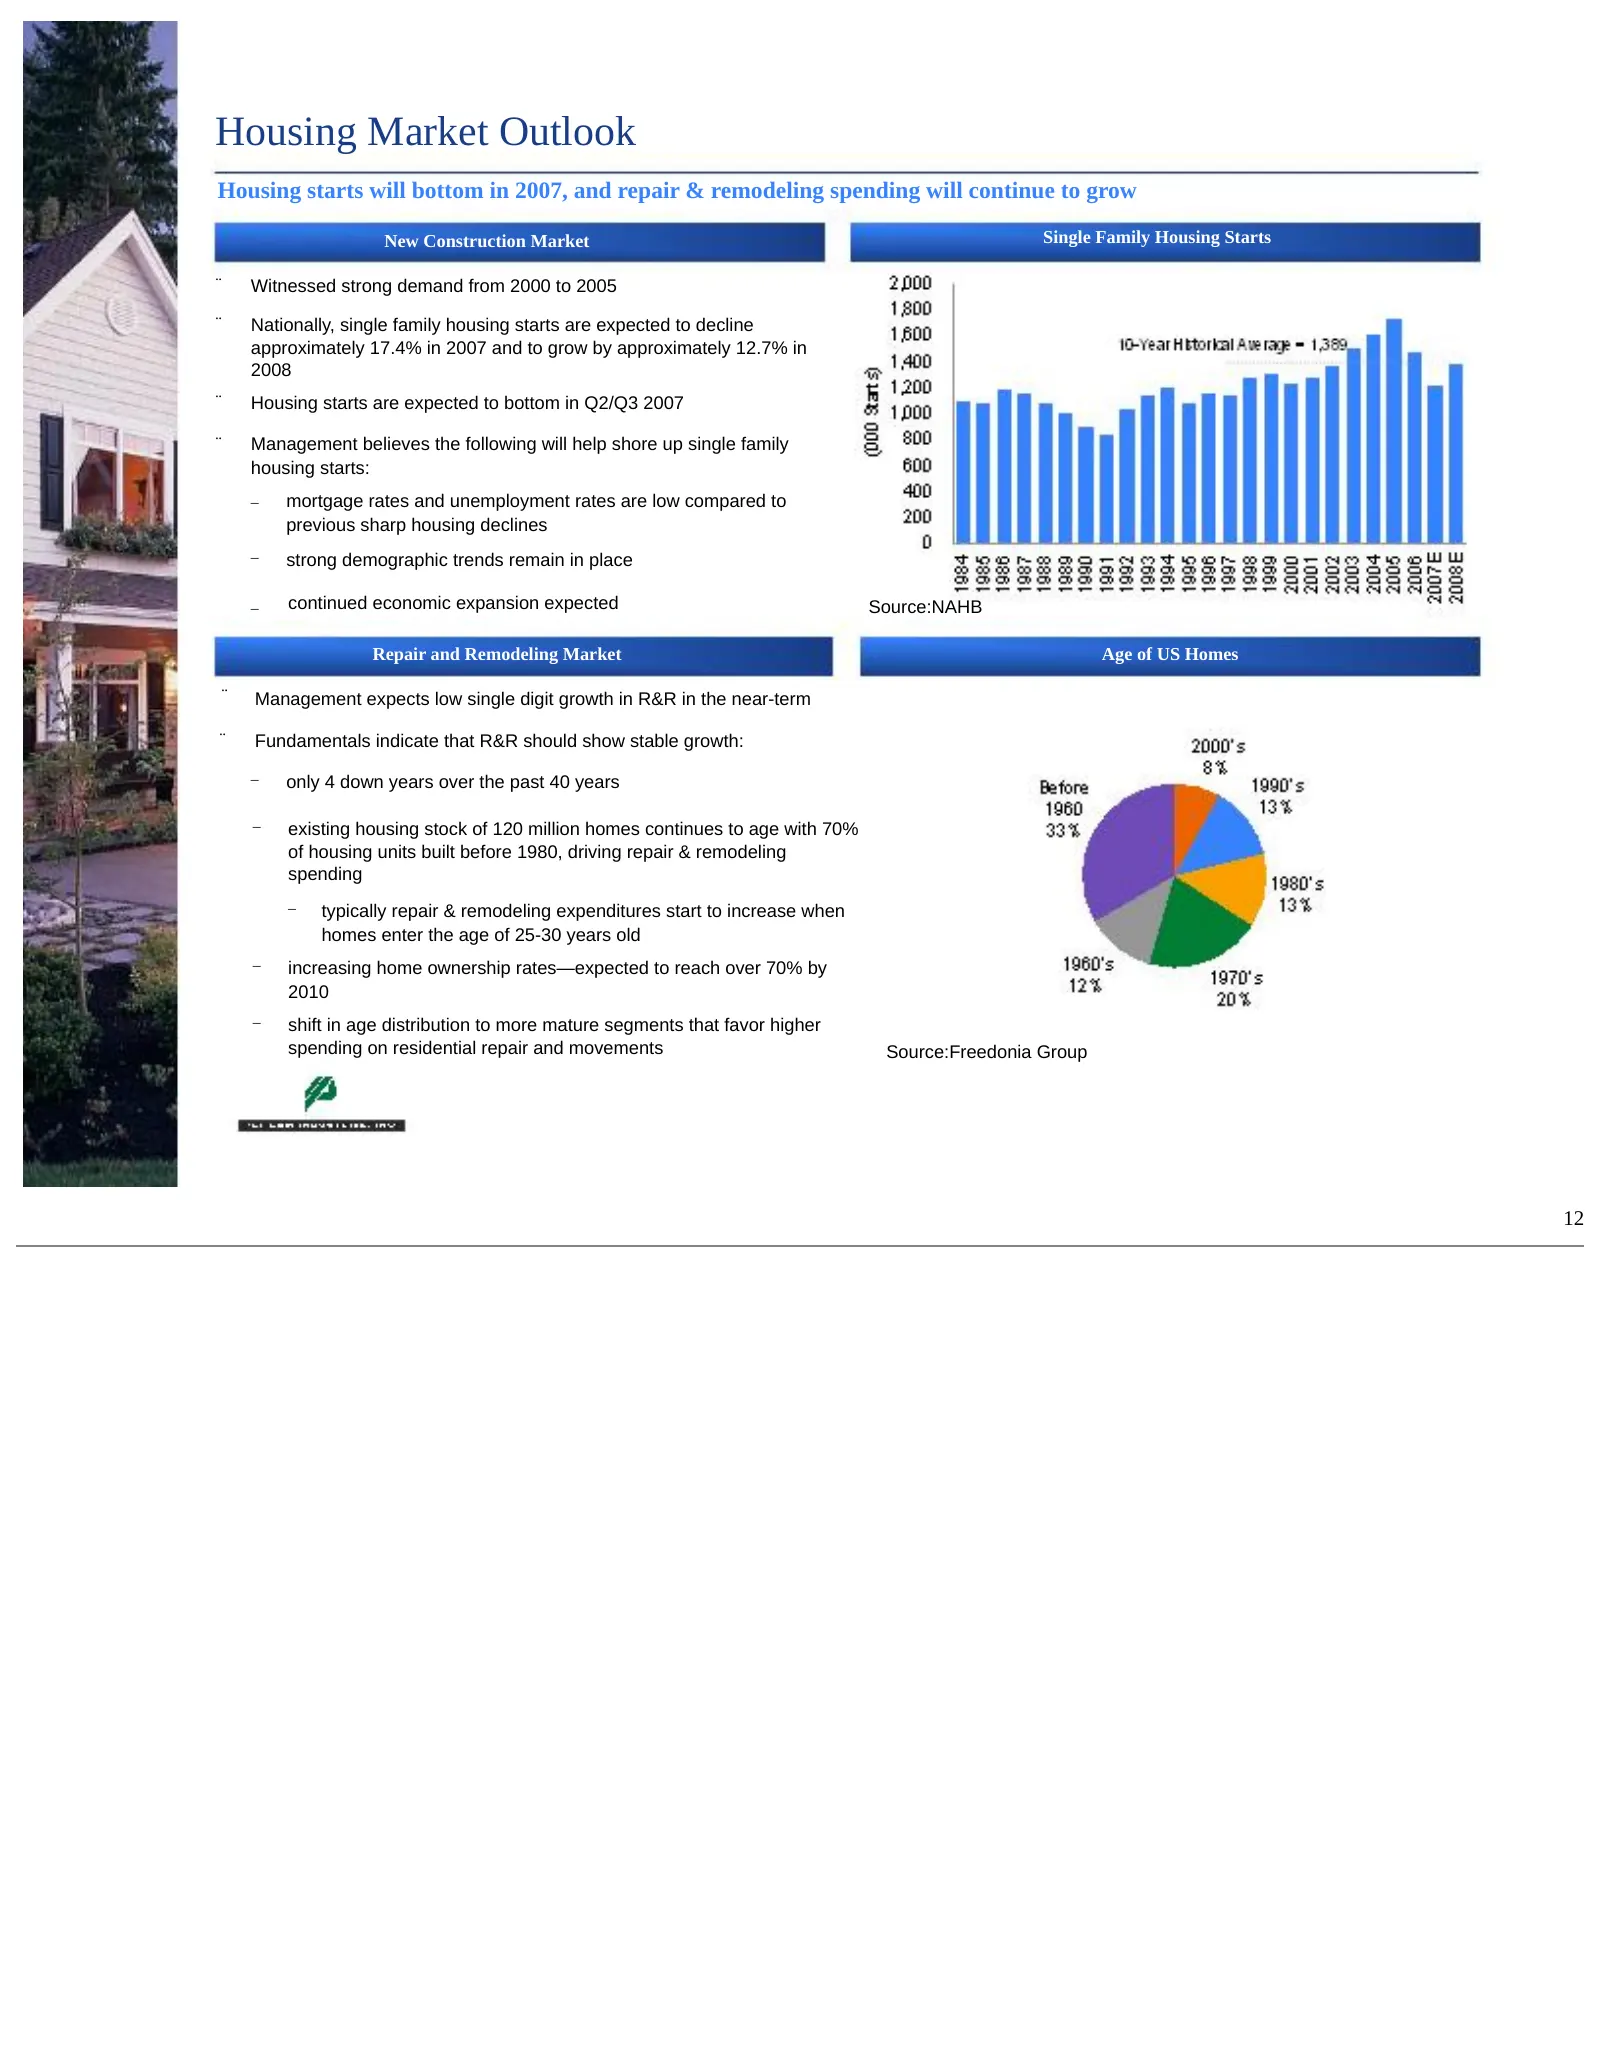
Housing Market Outlook Housing starts will bottom in 2007, and repair & remodeling spending will continue to grow New Construction Market Single Family Housing Starts ¨ Witnessed strong demand from 2000 to 2005 ¨ Nationally, single family housing starts are expected to decline approximately 17.4% in
Slide 14: Transaction Request and Timing
Transaction Request and Timing Jeff Groves, UBS Investment Bank 13
Slide 15: Indicative Term Sheet
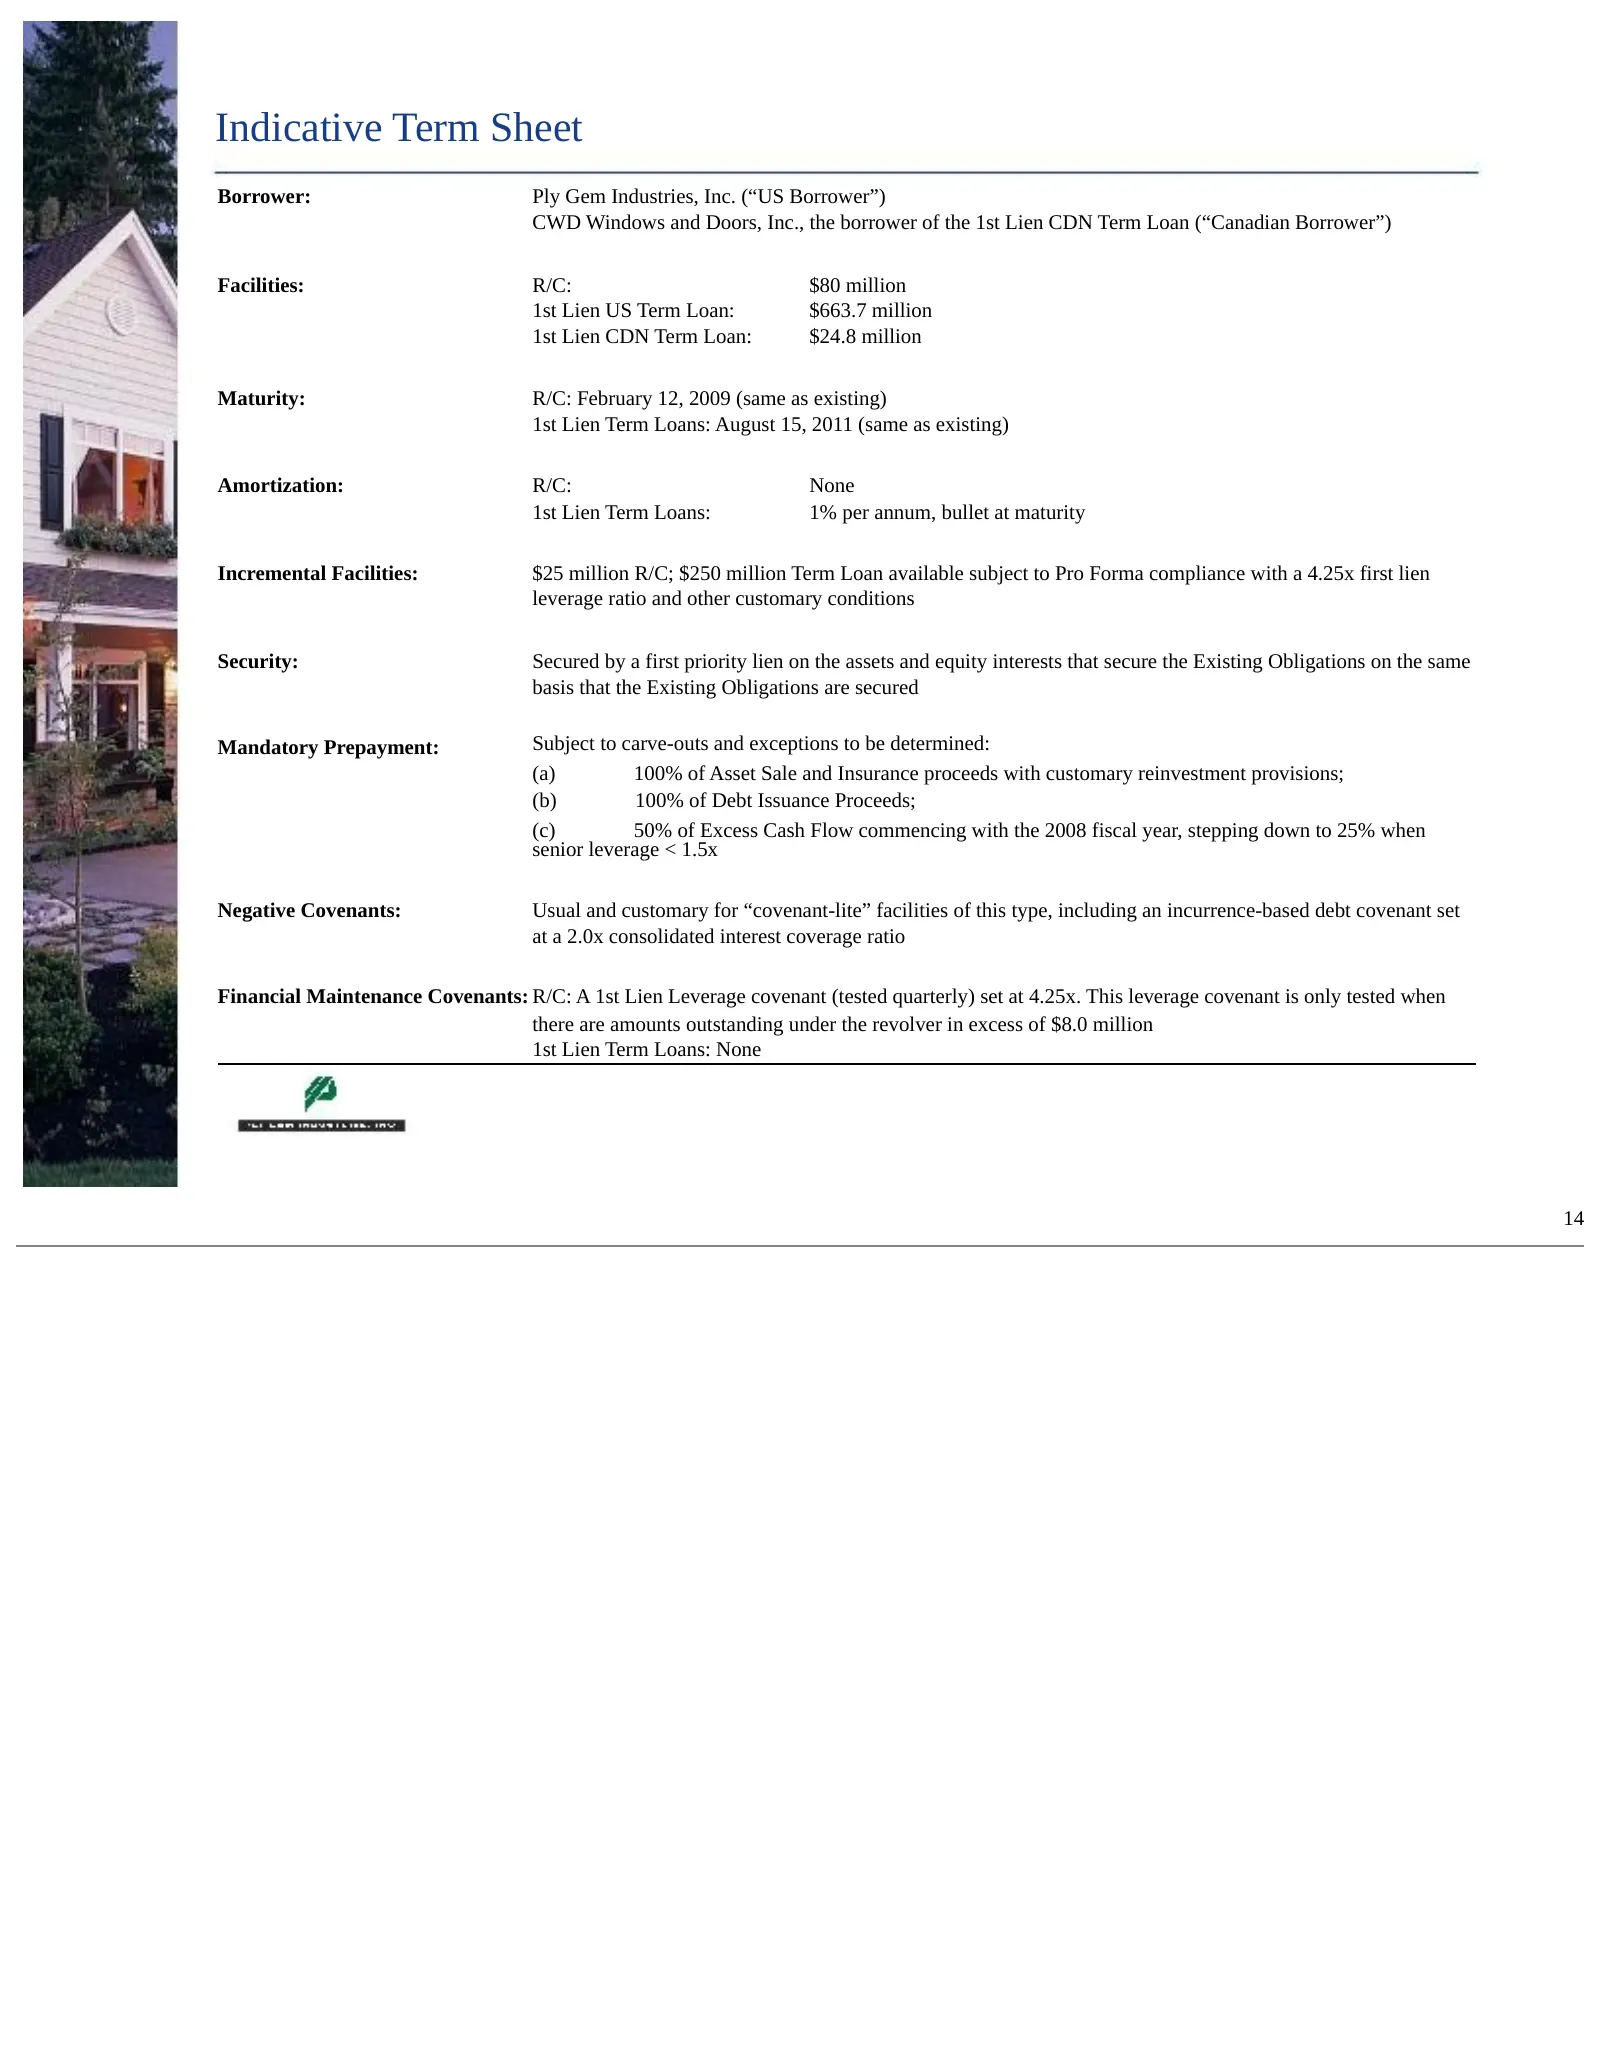
Indicative Term Sheet Borrower: Ply Gem Industries, Inc. (“US Borrower”) CWD Windows and Doors, Inc., the borrower of the 1st Lien CDN Term Loan (“Canadian Borrower”) Facilities: R/C: $80 million 1st Lien US Term Loan: $663.7 million 1st Lien CDN Term Loan: $24.8 million Maturity: R/C: February 12,
Slide 16: Proposed Timetable
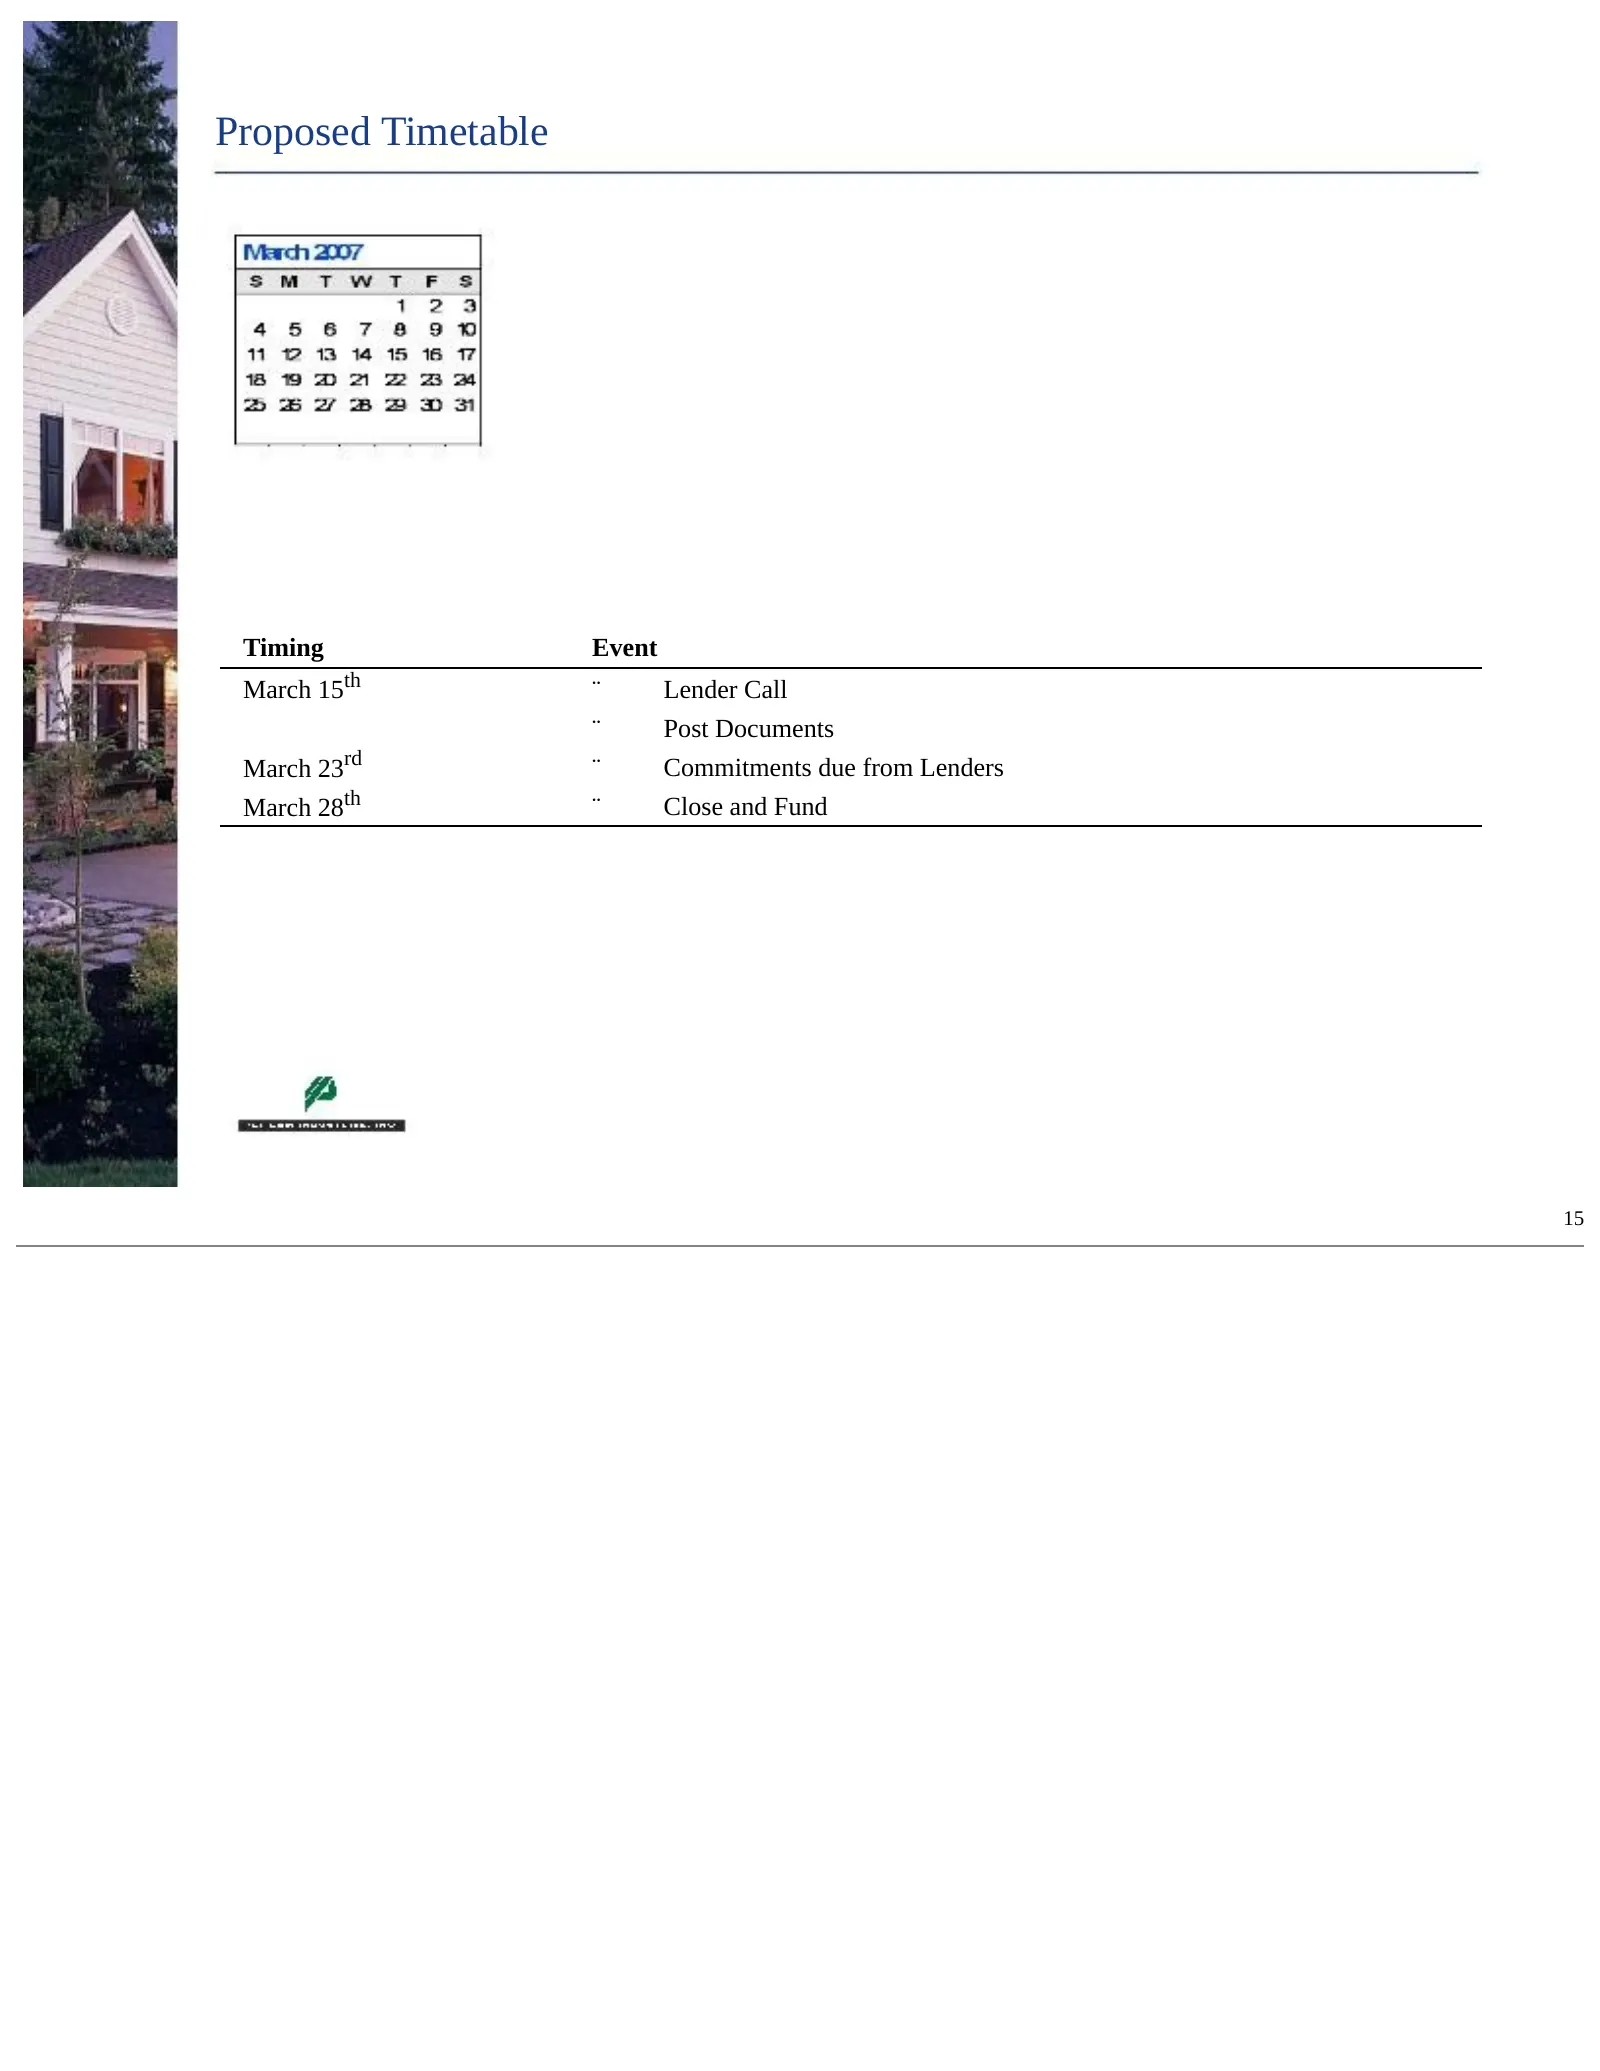
Proposed Timetable Timing Event th ¨ Lender Call March 15 ¨ Post Documents rd ¨ Commitments due from Lenders March 23 th ¨ Close and Fund March 28 15
Slide 17: Key Credit Considerations
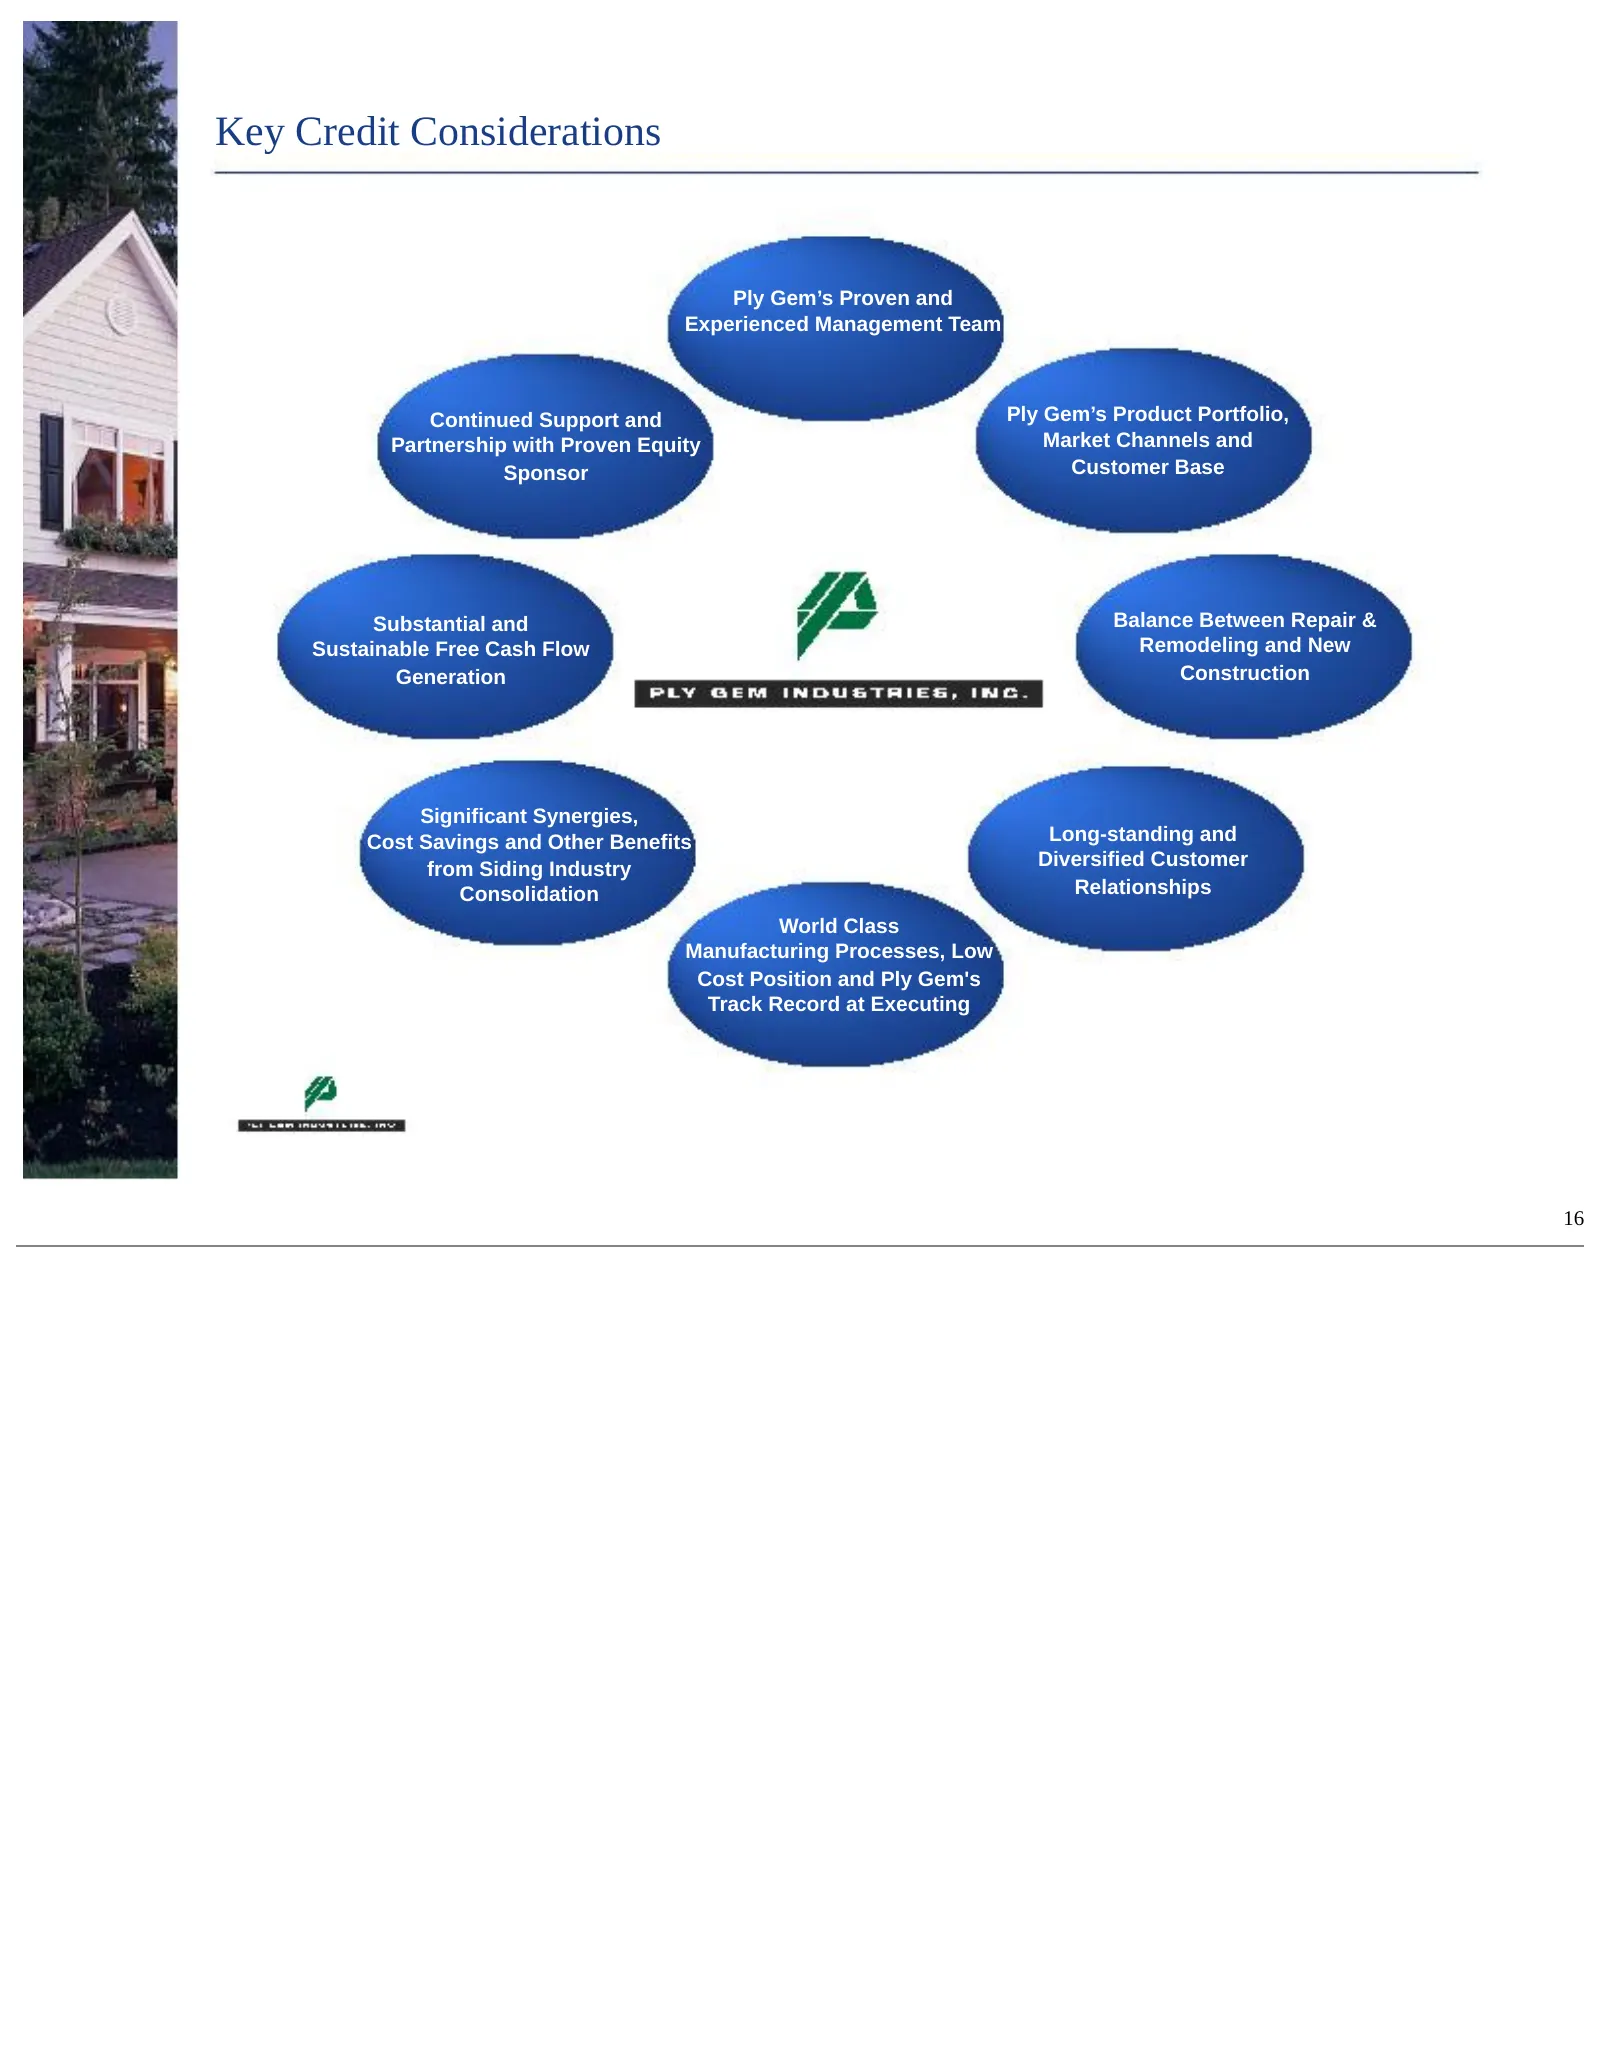
Key Credit Considerations Ply Gem’s Proven and Experienced Management Team Continued Support and Ply Gem’s Product Portfolio, Partnership with Proven Equity Market Channels and Sponsor Customer Base Substantial and Balance Between Repair & Sustainable Free Cash Flow Remodeling and New Generation Con
Slide 18: Summary and Public Q&A
Summary and Public Q&A 17
Slide 19: Supplemental Information
Supplemental Information 18
Slide 20: Computation of Non-GAAP Financial Information
Supplemental Information Computation of Non-GAAP Financial Information ¨ Pro forma net sales – Excluding AHE ¨ Adjusted pro forma EBITDA – Excluding AHE ¨ Pro forma capital expenditures (CAPEX) – Excluding AHE ¨ Pro forma EBITDA less CAPEX – Excluding AHE ¨ Pro forma net sales – Including AHE ¨ Adju
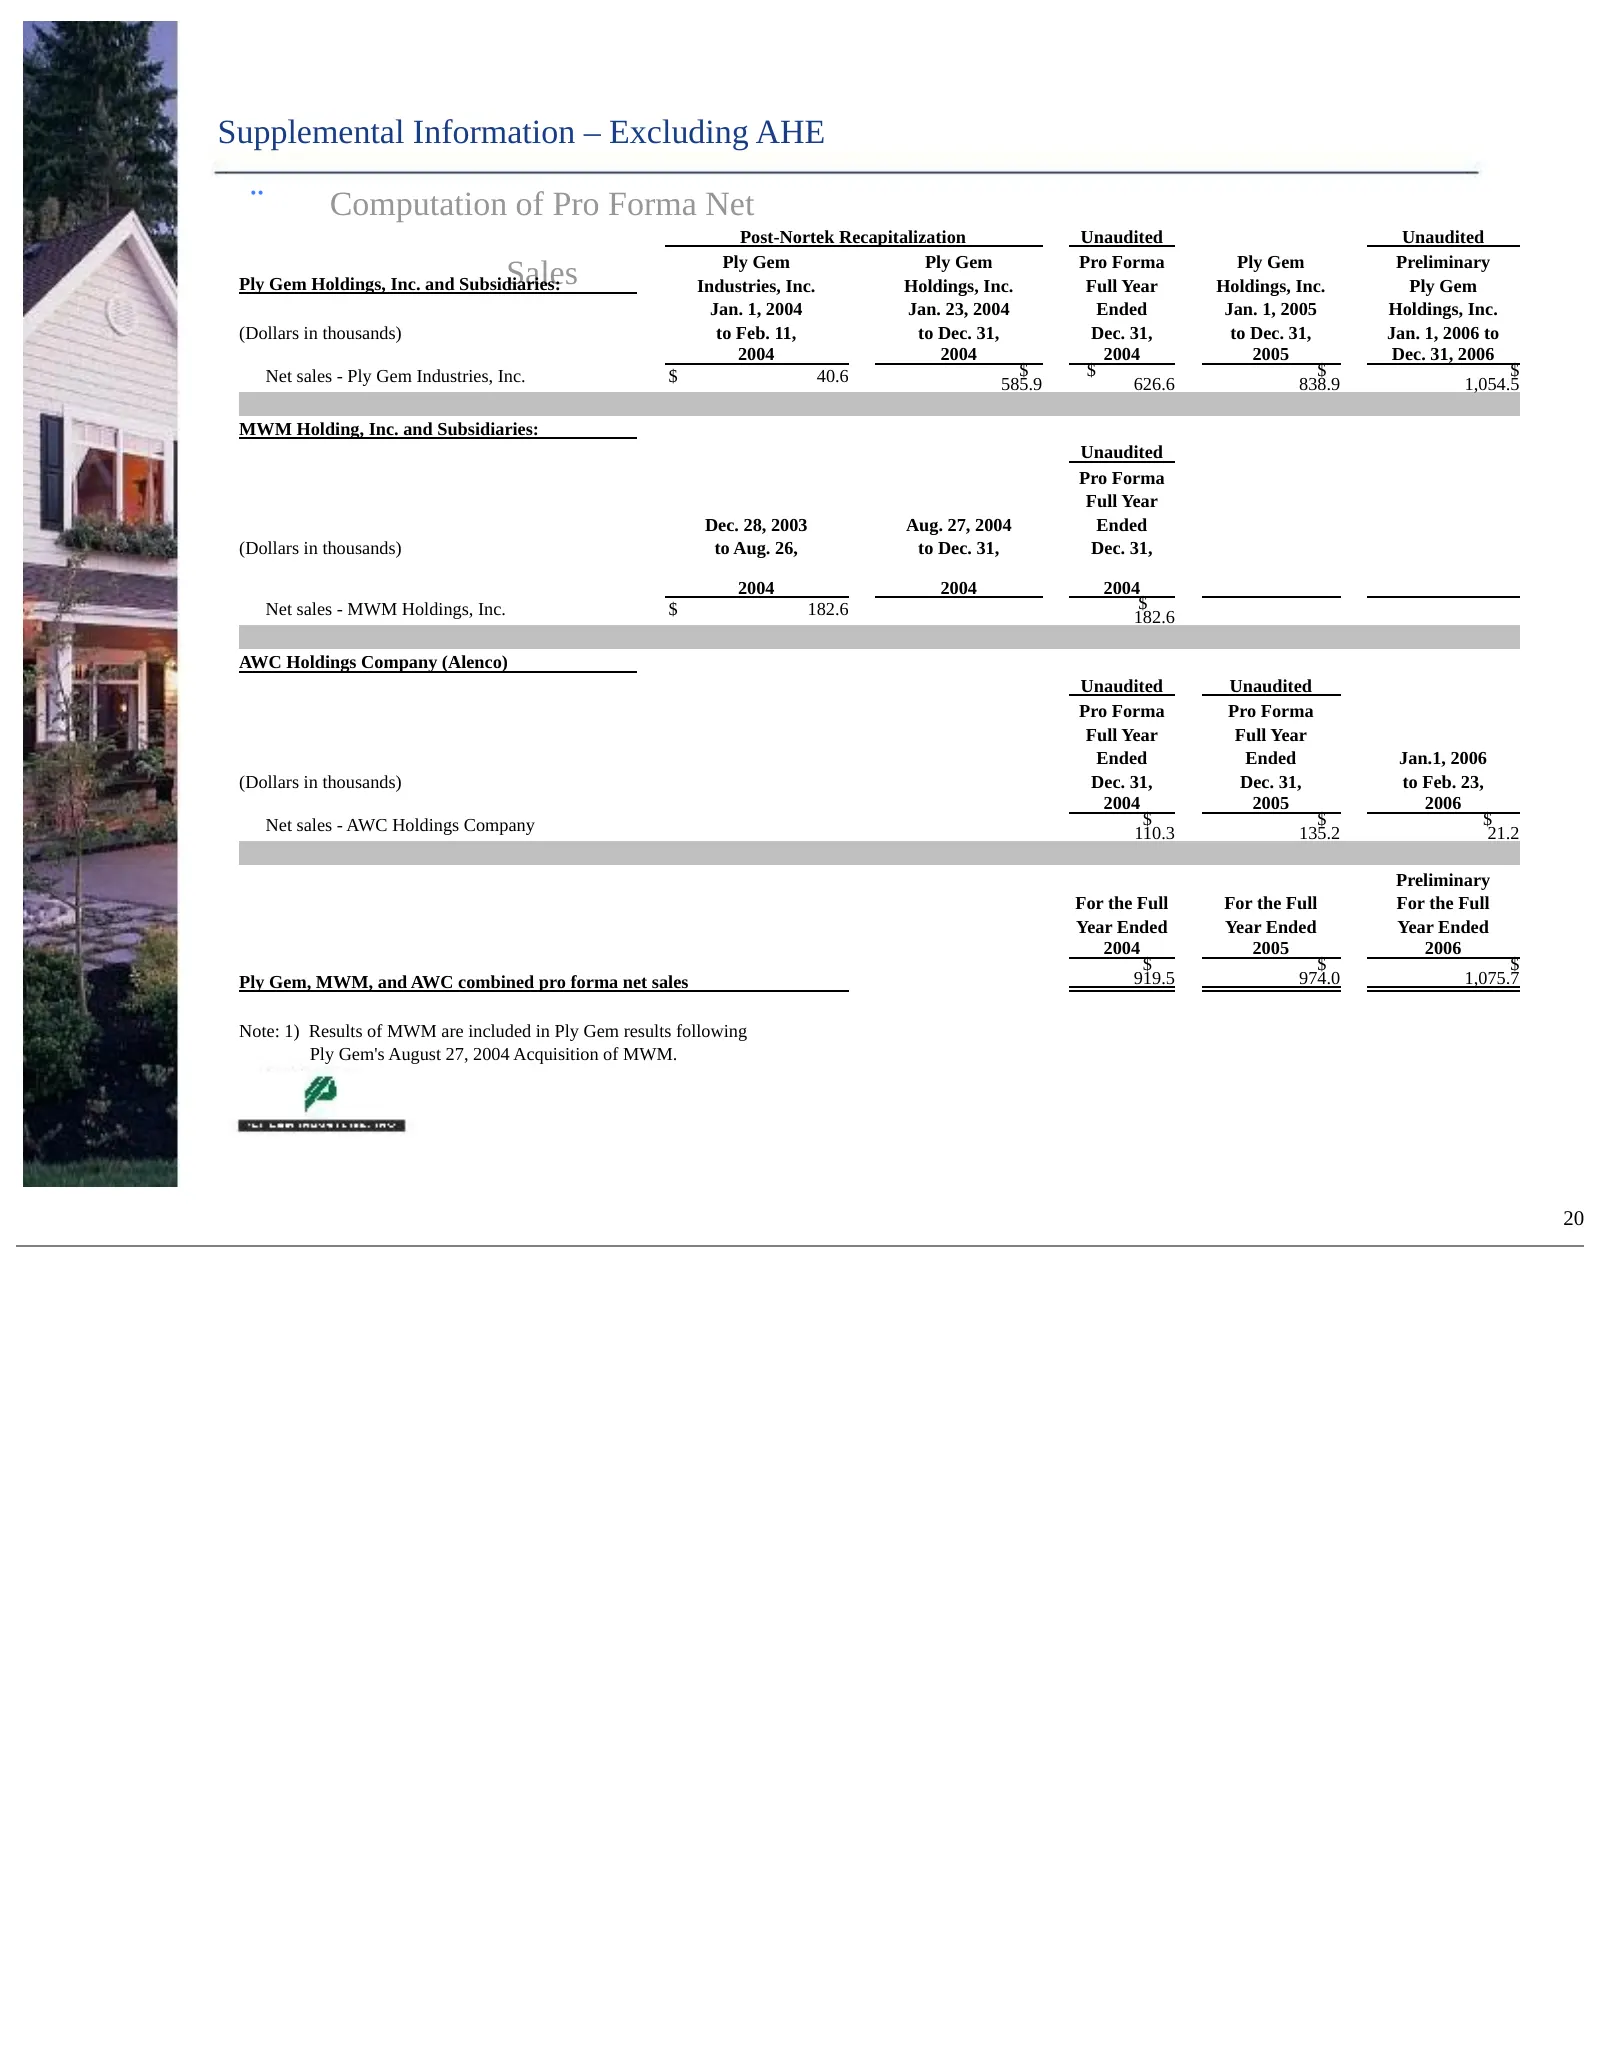
Slide 21: Computation of Pro Forma Net Sales – Excluding AHE
Supplemental Information – Excluding AHE ¨ Computation of Pro Forma Net Post-Nortek Recapitalization Unaudited Unaudited Ply Gem Ply Gem Pro Forma Ply Gem Preliminary Sales Ply Gem Holdings, Inc. and Subsidiaries: Industries, Inc. Holdings, Inc. Full Year Holdings, Inc. Ply Gem Jan. 1, 2004 Jan. 23,
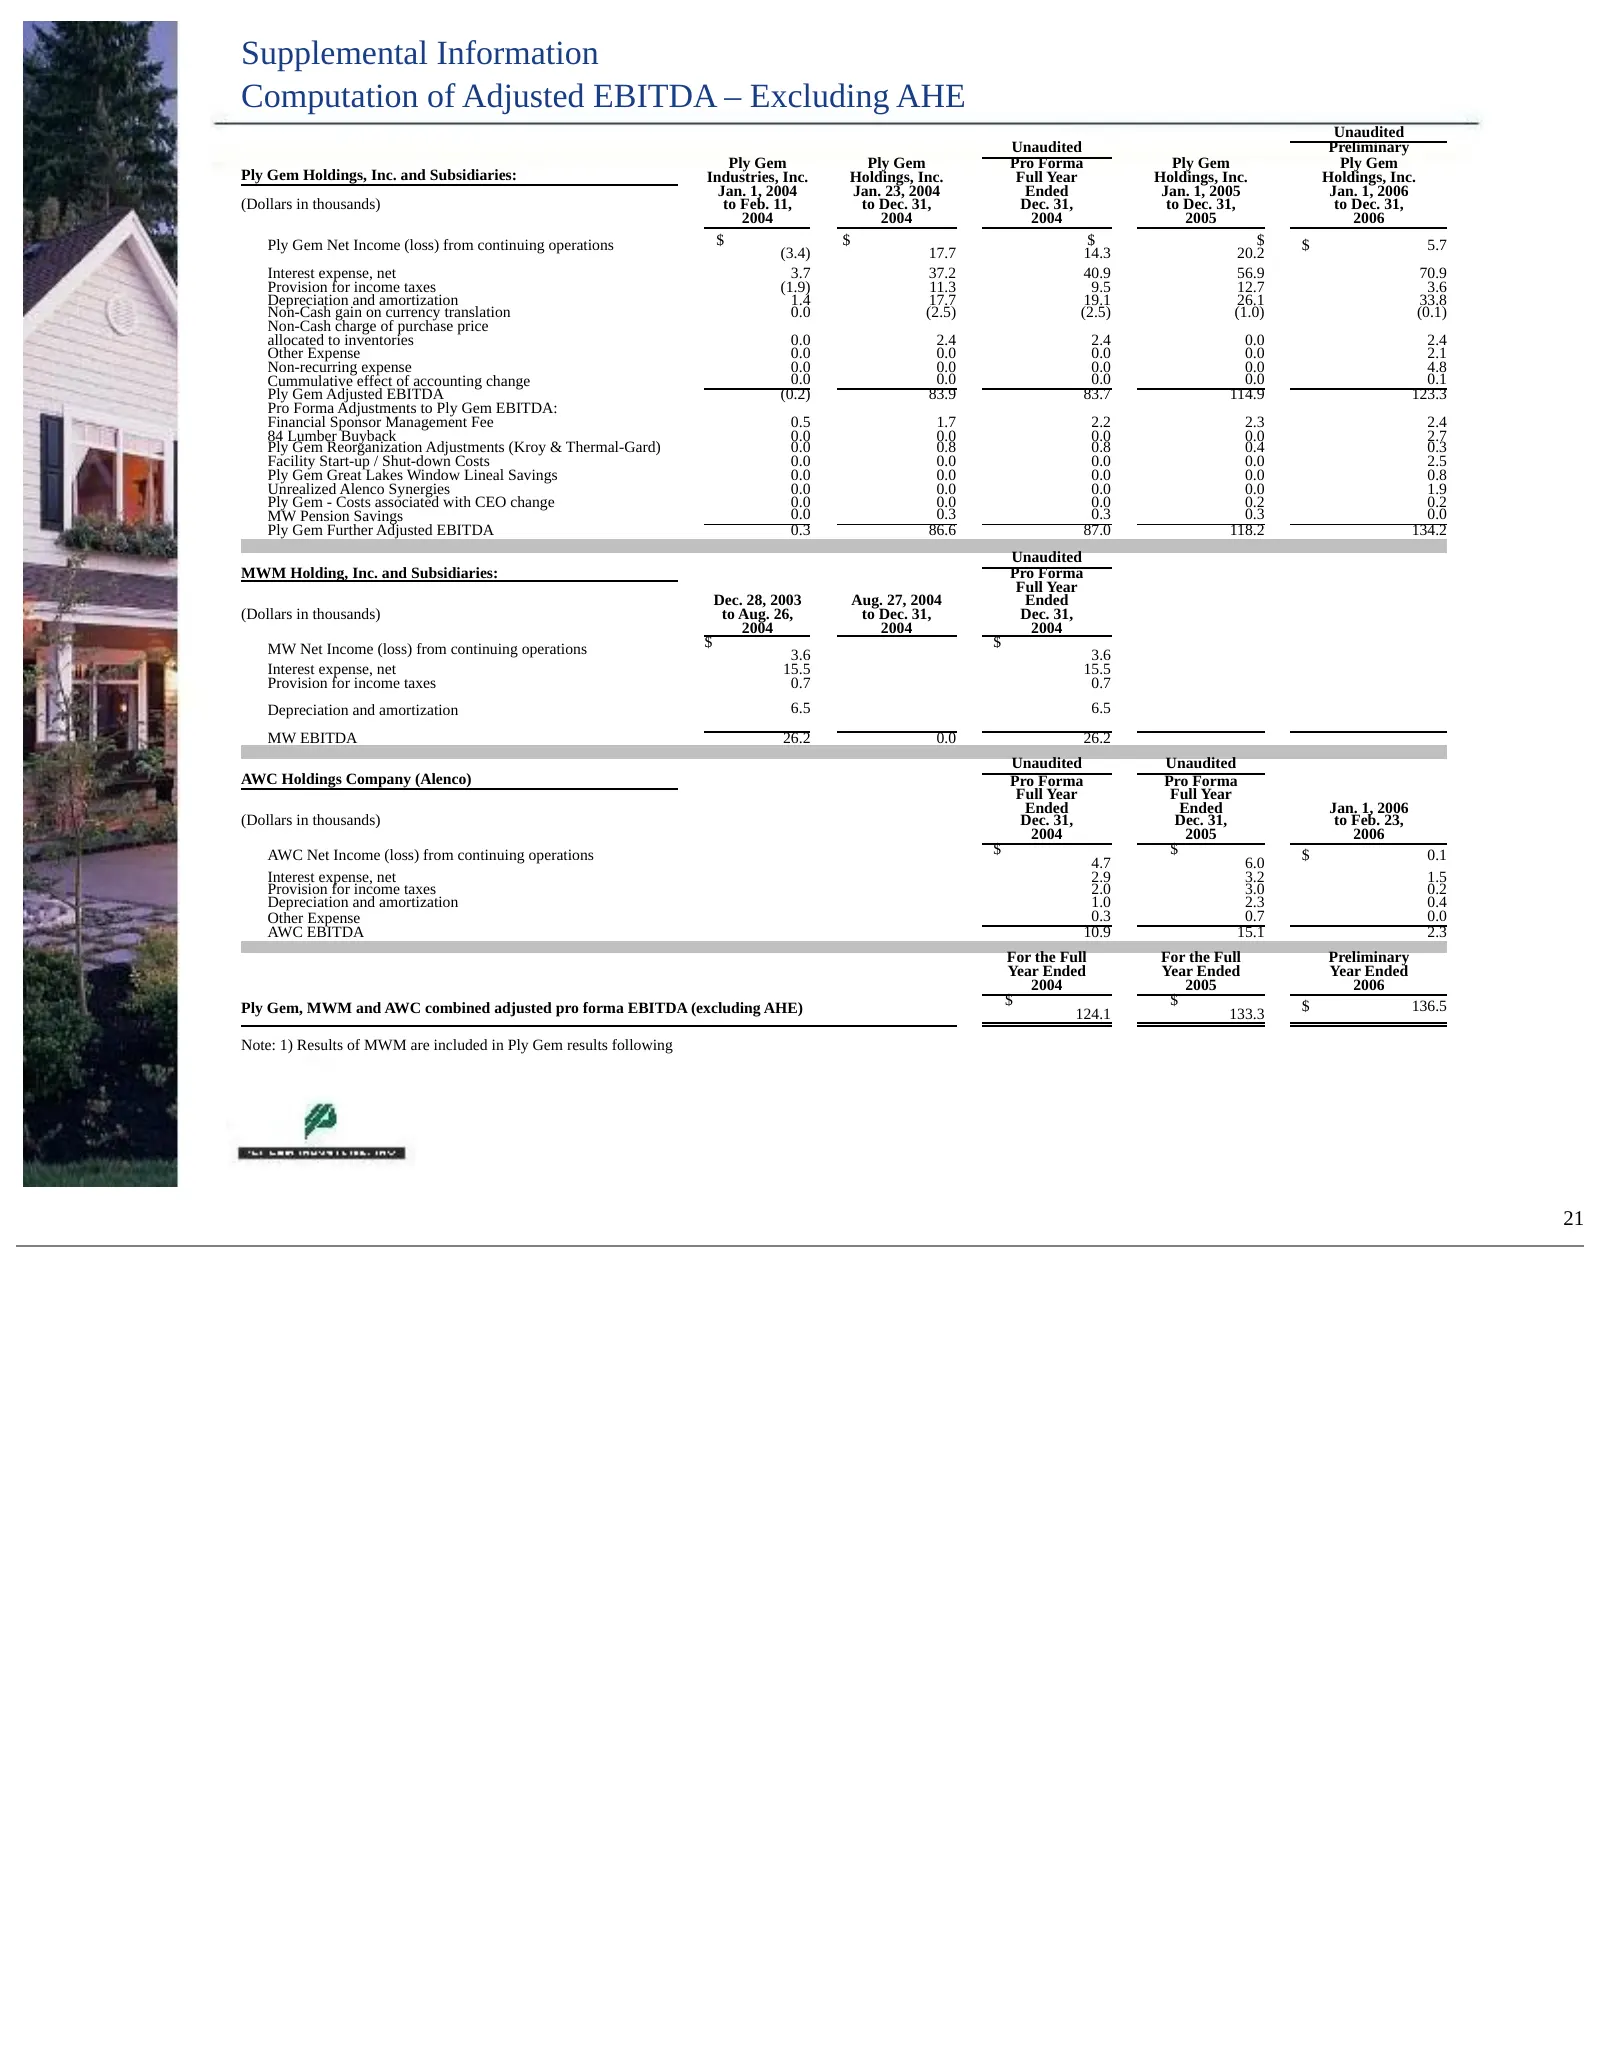
Slide 22: Computation of Adjusted EBITDA – Excluding AHE
Supplemental Information Computation of Adjusted EBITDA – Excluding AHE Unaudited Unaudited Preliminary Ply Gem Ply Gem Pro Forma Ply Gem Ply Gem Ply Gem Holdings, Inc. and Subsidiaries: Industries, Inc. Holdings, Inc. Full Year Holdings, Inc. Holdings, Inc. Jan. 1, 2004 Jan. 23, 2004 Ended Jan. 1,
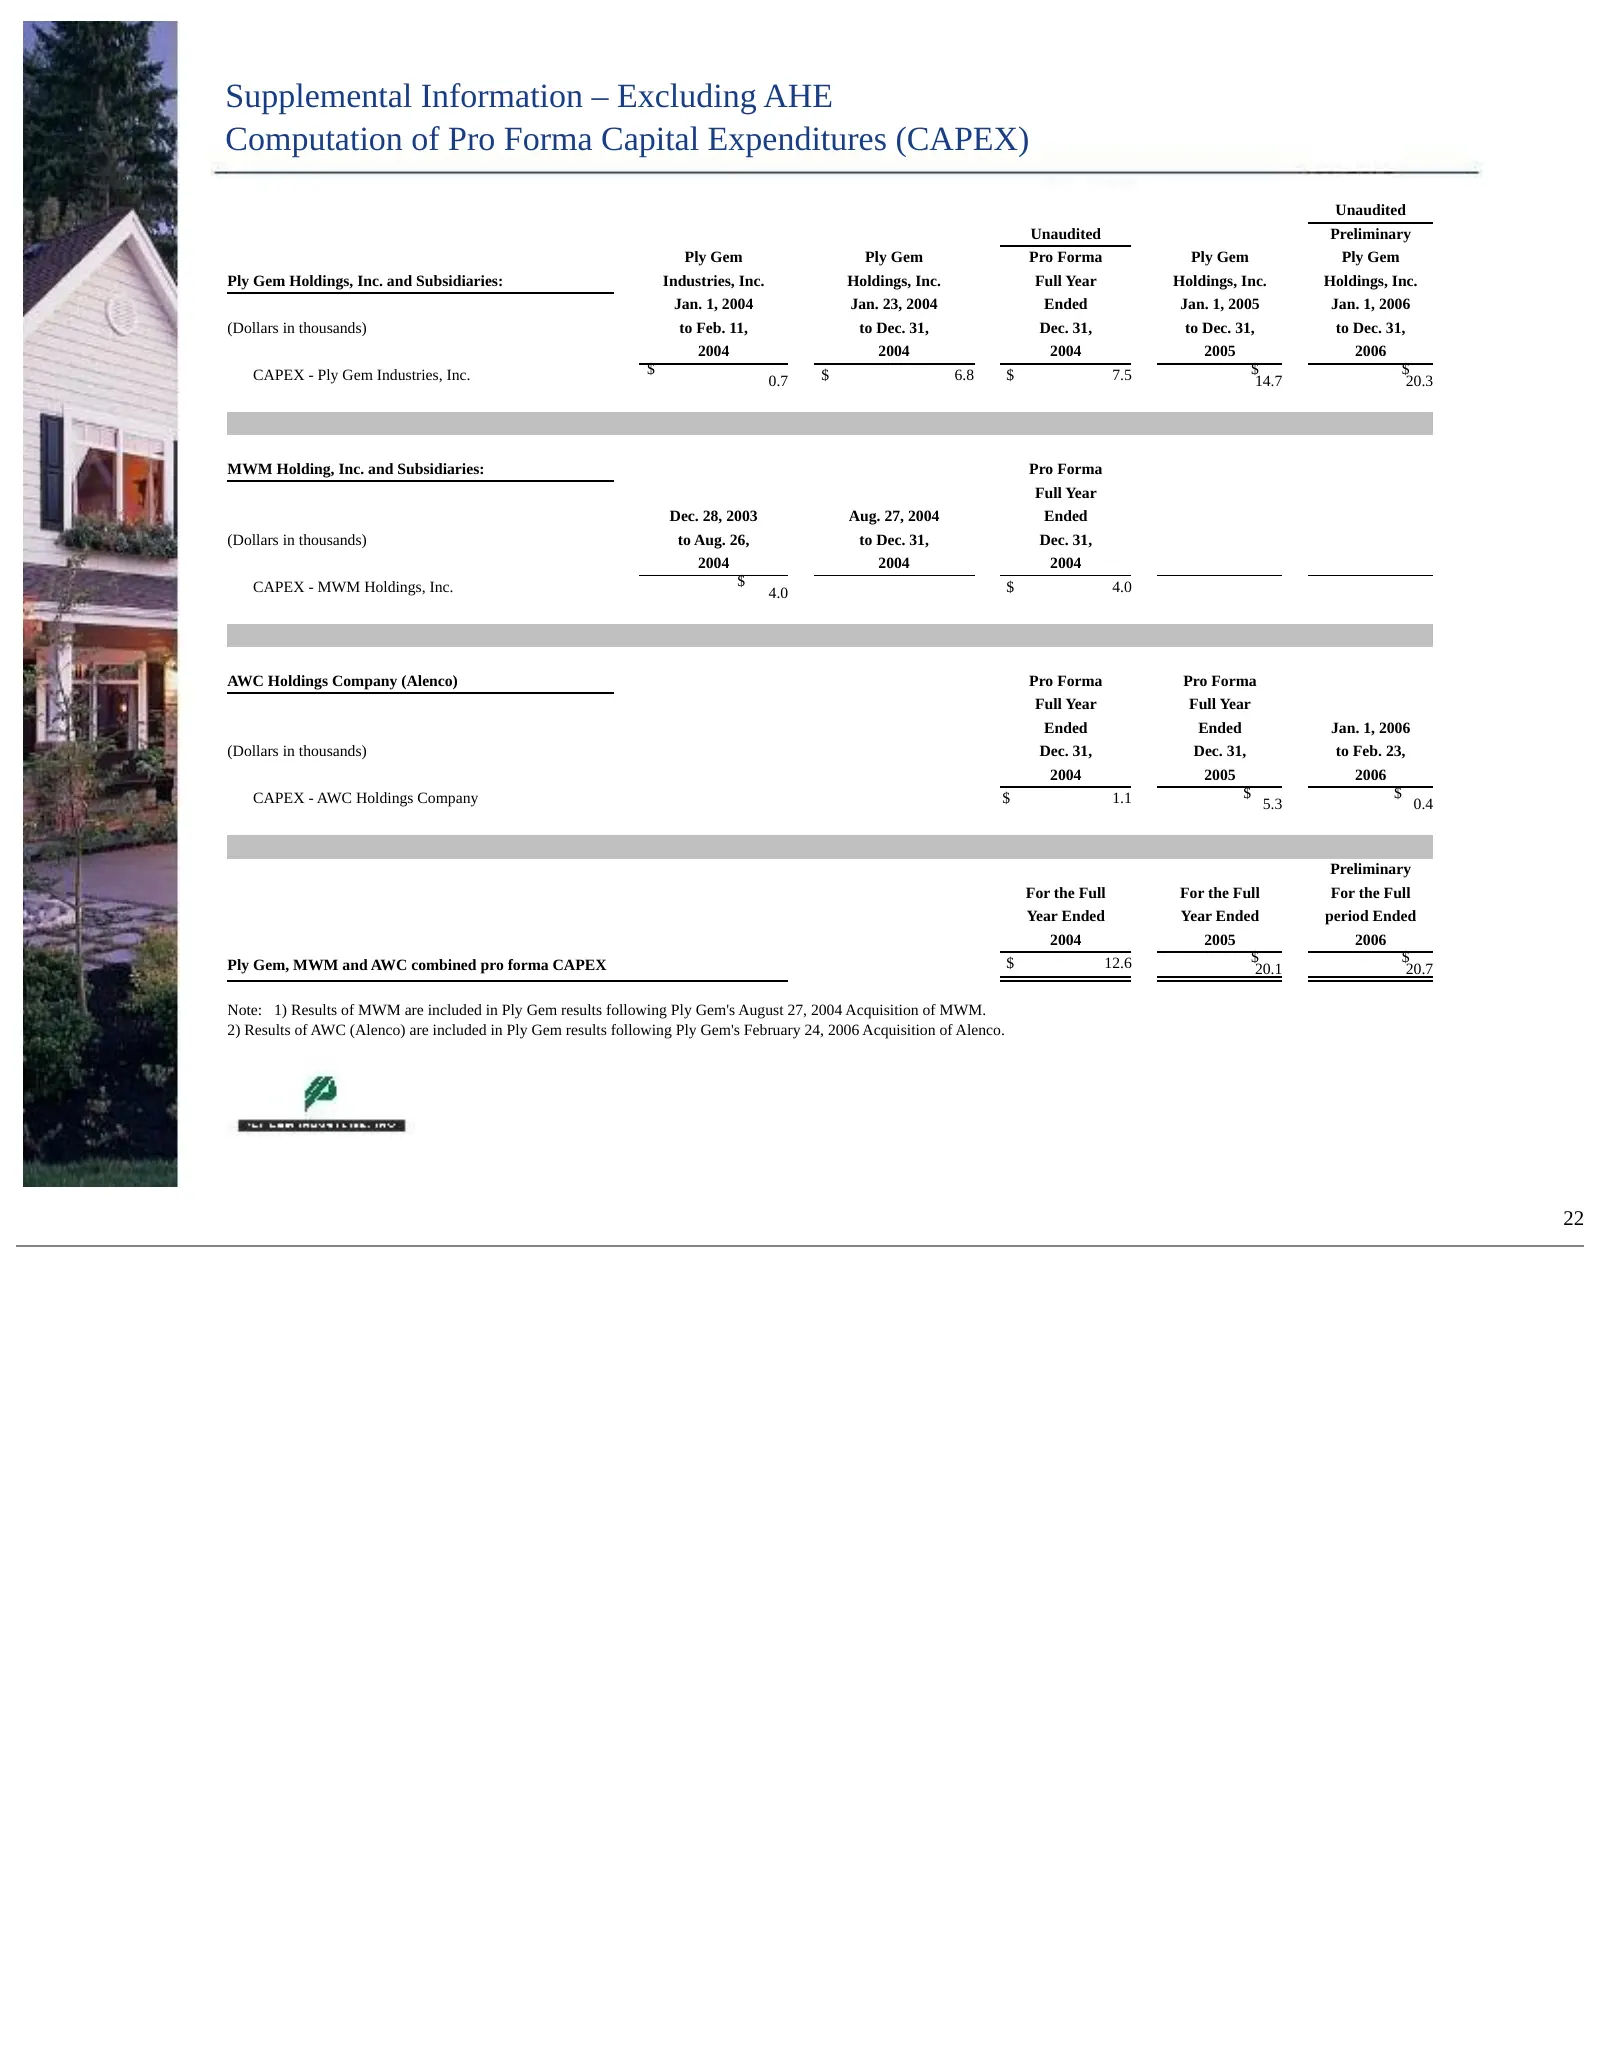
Slide 23: Computation of Pro Forma Capital Expenditures – Excluding AHE
Supplemental Information – Excluding AHE Computation of Pro Forma Capital Expenditures (CAPEX) Unaudited Unaudited Preliminary Ply Gem Ply Gem Pro Forma Ply Gem Ply Gem Ply Gem Holdings, Inc. and Subsidiaries: Industries, Inc. Holdings, Inc. Full Year Holdings, Inc. Holdings, Inc. Jan. 1, 2004 Jan.
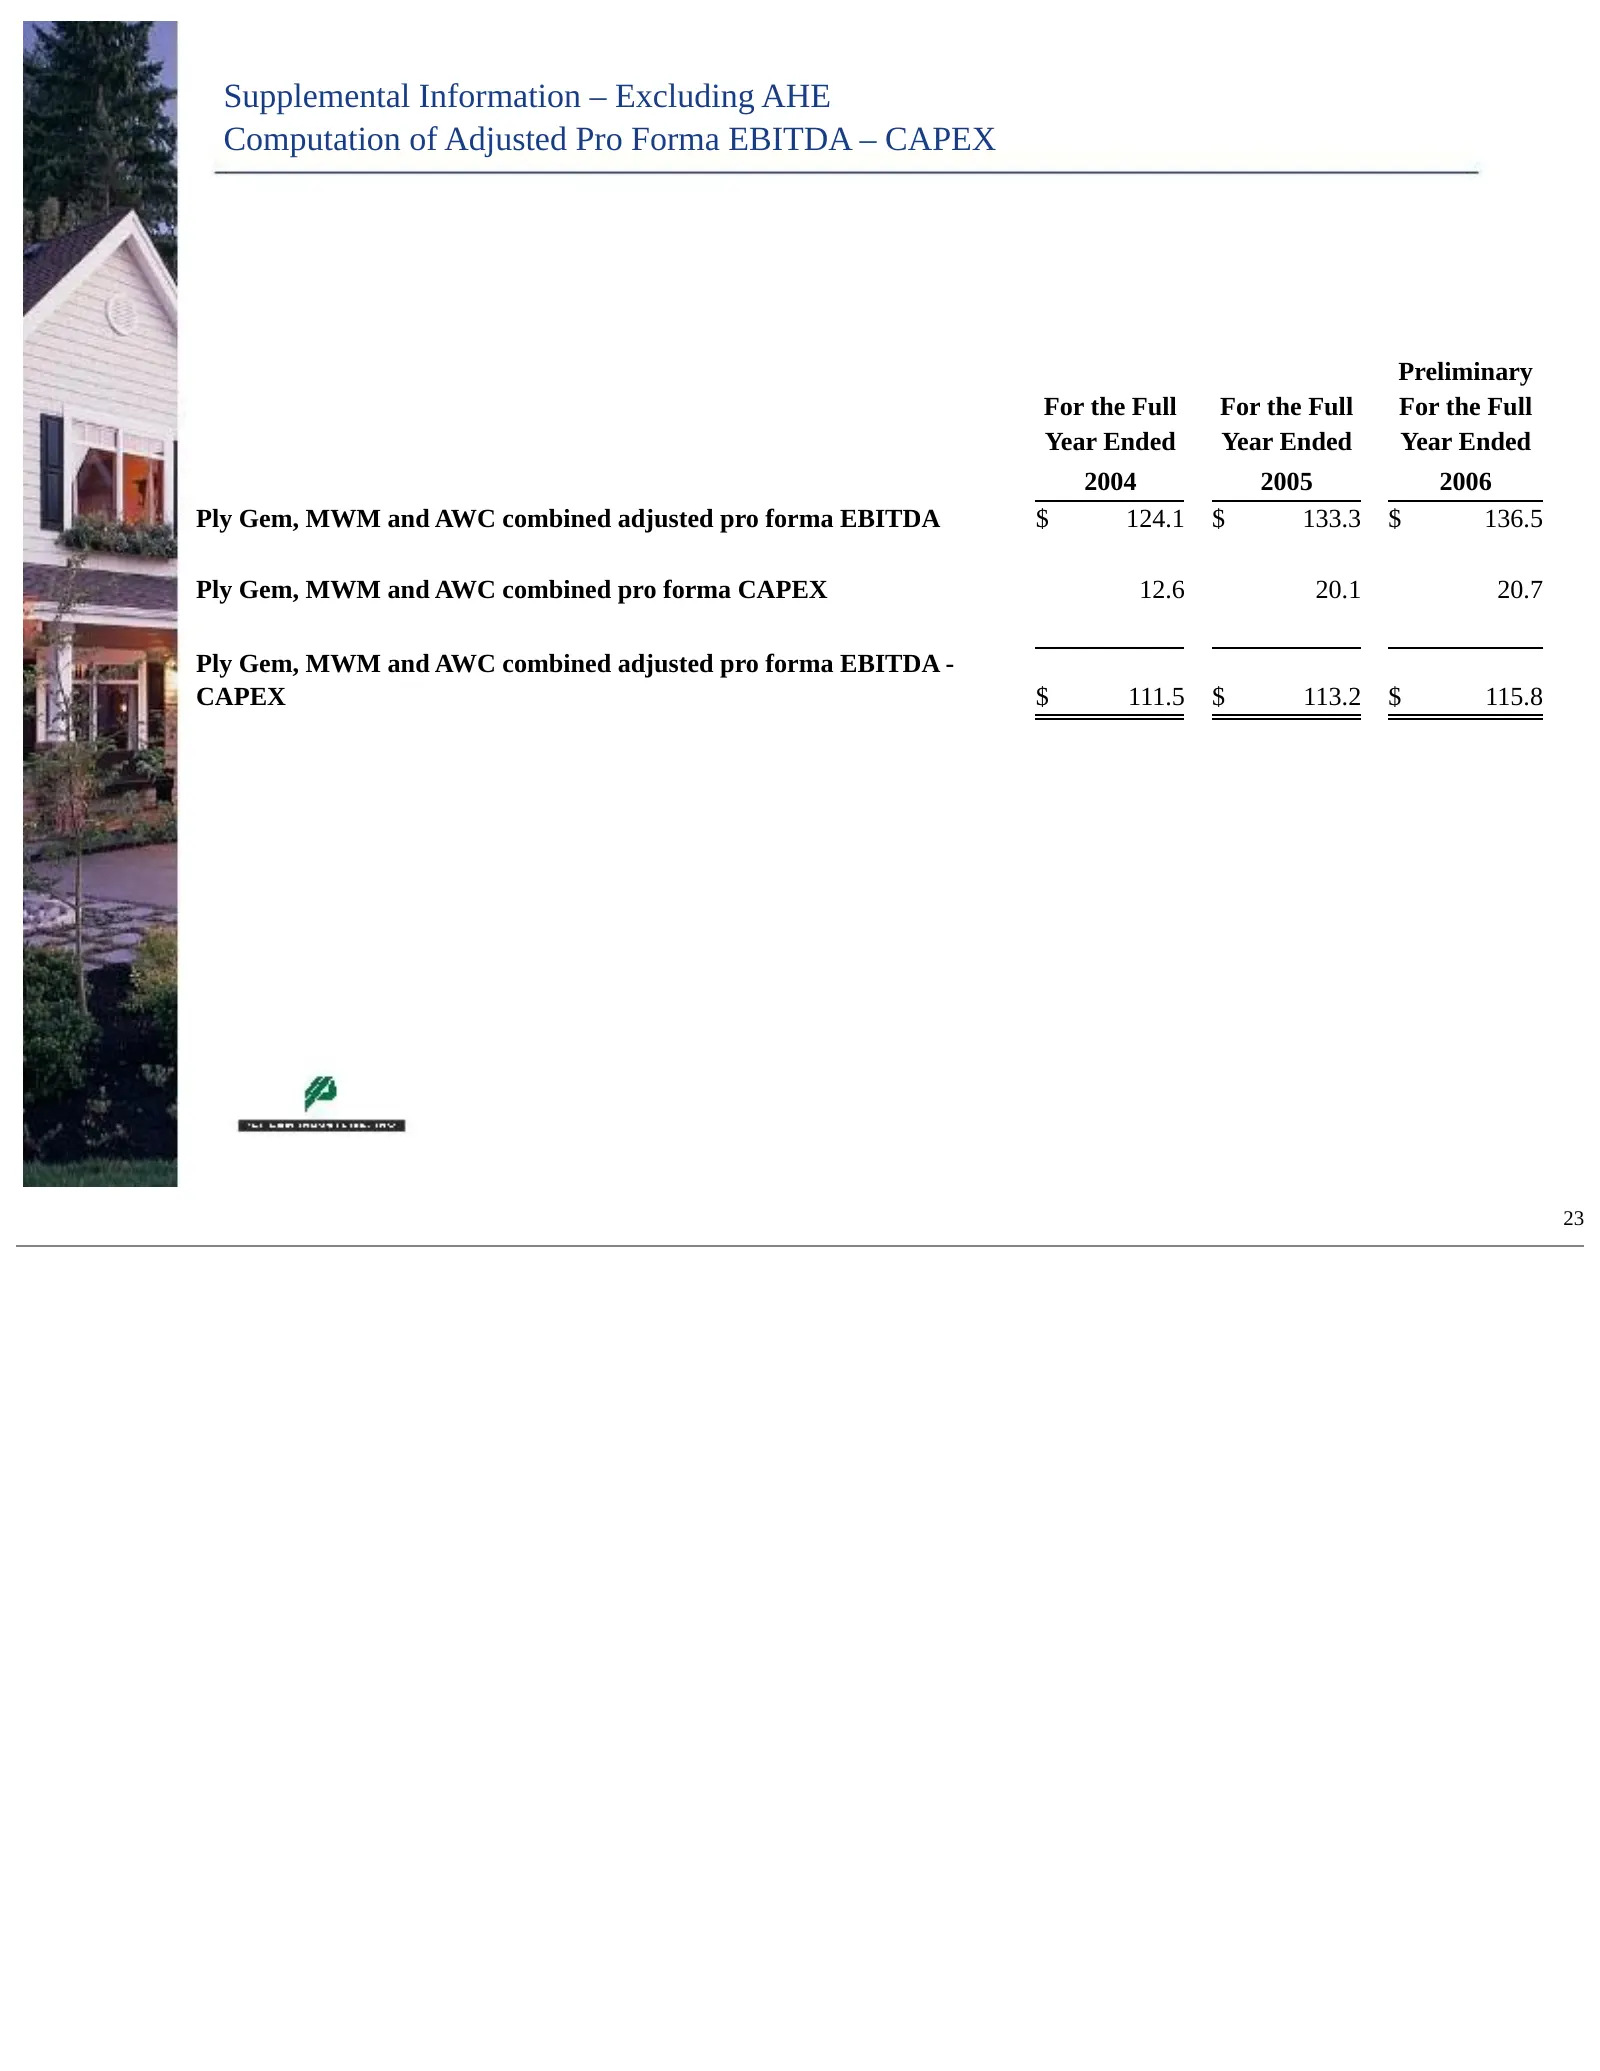
Slide 24: Computation of Adjusted Pro Forma EBITDA – CAPEX – Excluding AHE
Supplemental Information – Excluding AHE Computation of Adjusted Pro Forma EBITDA – CAPEX Preliminary For the Full For the Full For the Full Year Ended Year Ended Year Ended 2004 2005 2006 Ply Gem, MWM and AWC combined adjusted pro forma EBITDA $ 124.1 $ 133.3 $ 136.5 Ply Gem, MWM and AWC combined p
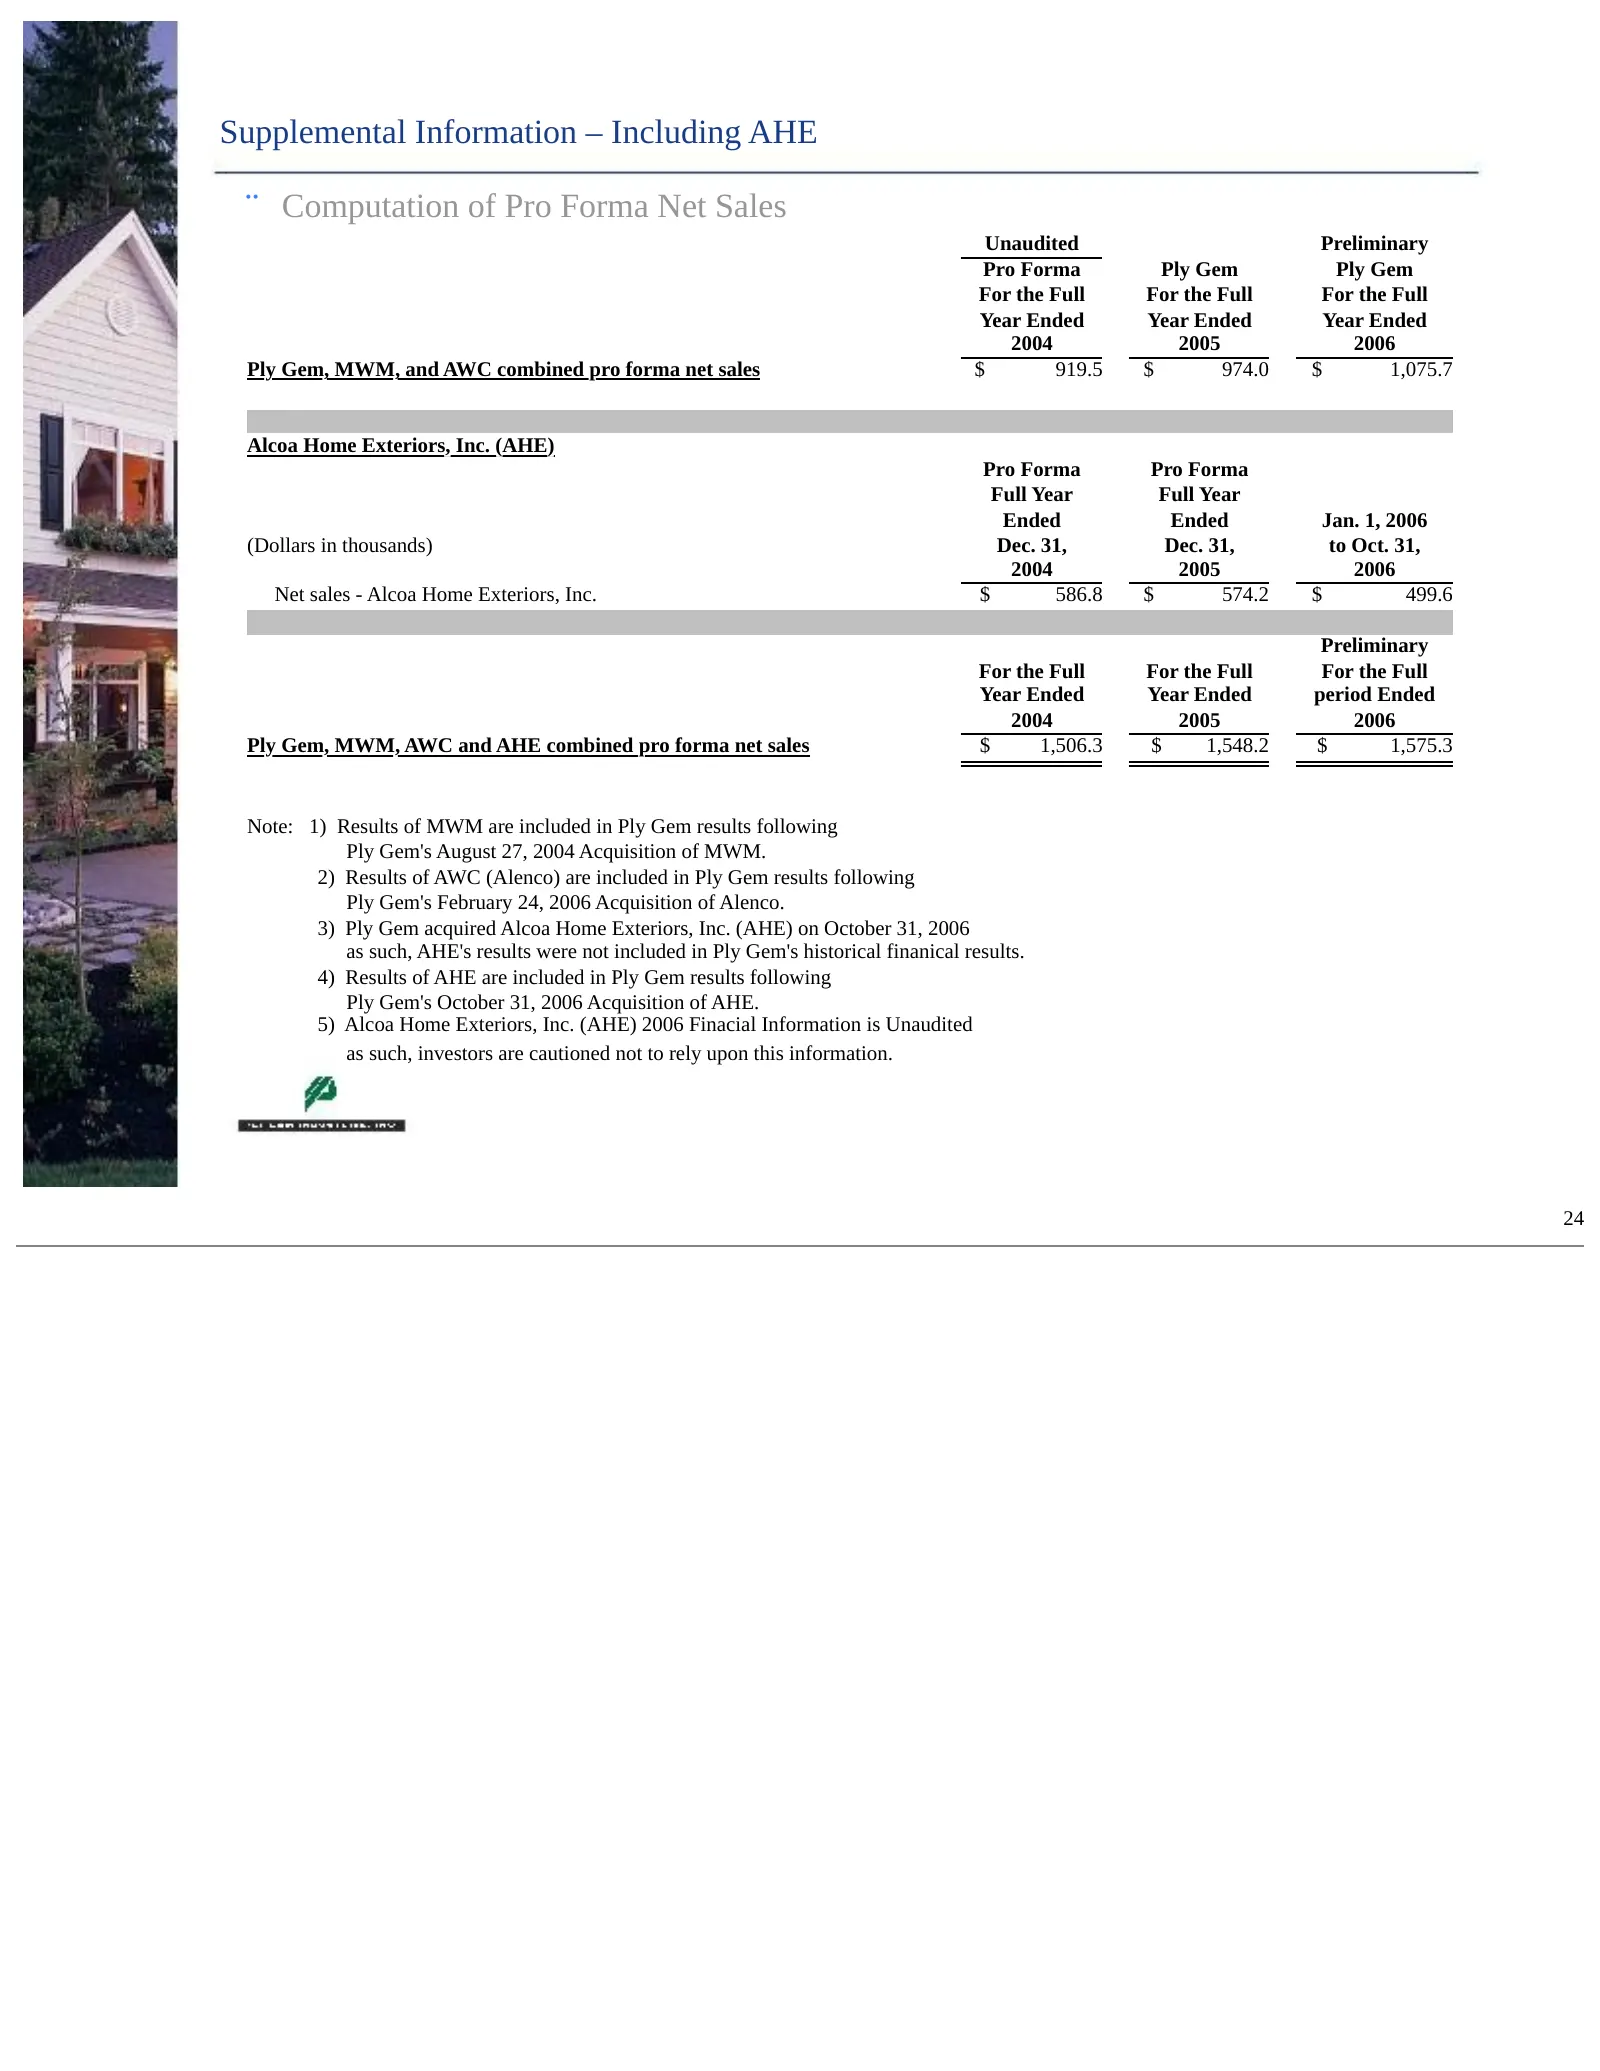
Slide 25: Computation of Pro Forma Net Sales – Including AHE
Supplemental Information – Including AHE ¨ Computation of Pro Forma Net Sales Unaudited Preliminary Pro Forma Ply Gem Ply Gem For the Full For the Full For the Full Year Ended Year Ended Year Ended 2004 2005 2006 Ply Gem, MWM, and AWC combined pro forma net sales $ 919.5 $ 974.0 $ 1,075.7 Alcoa Home
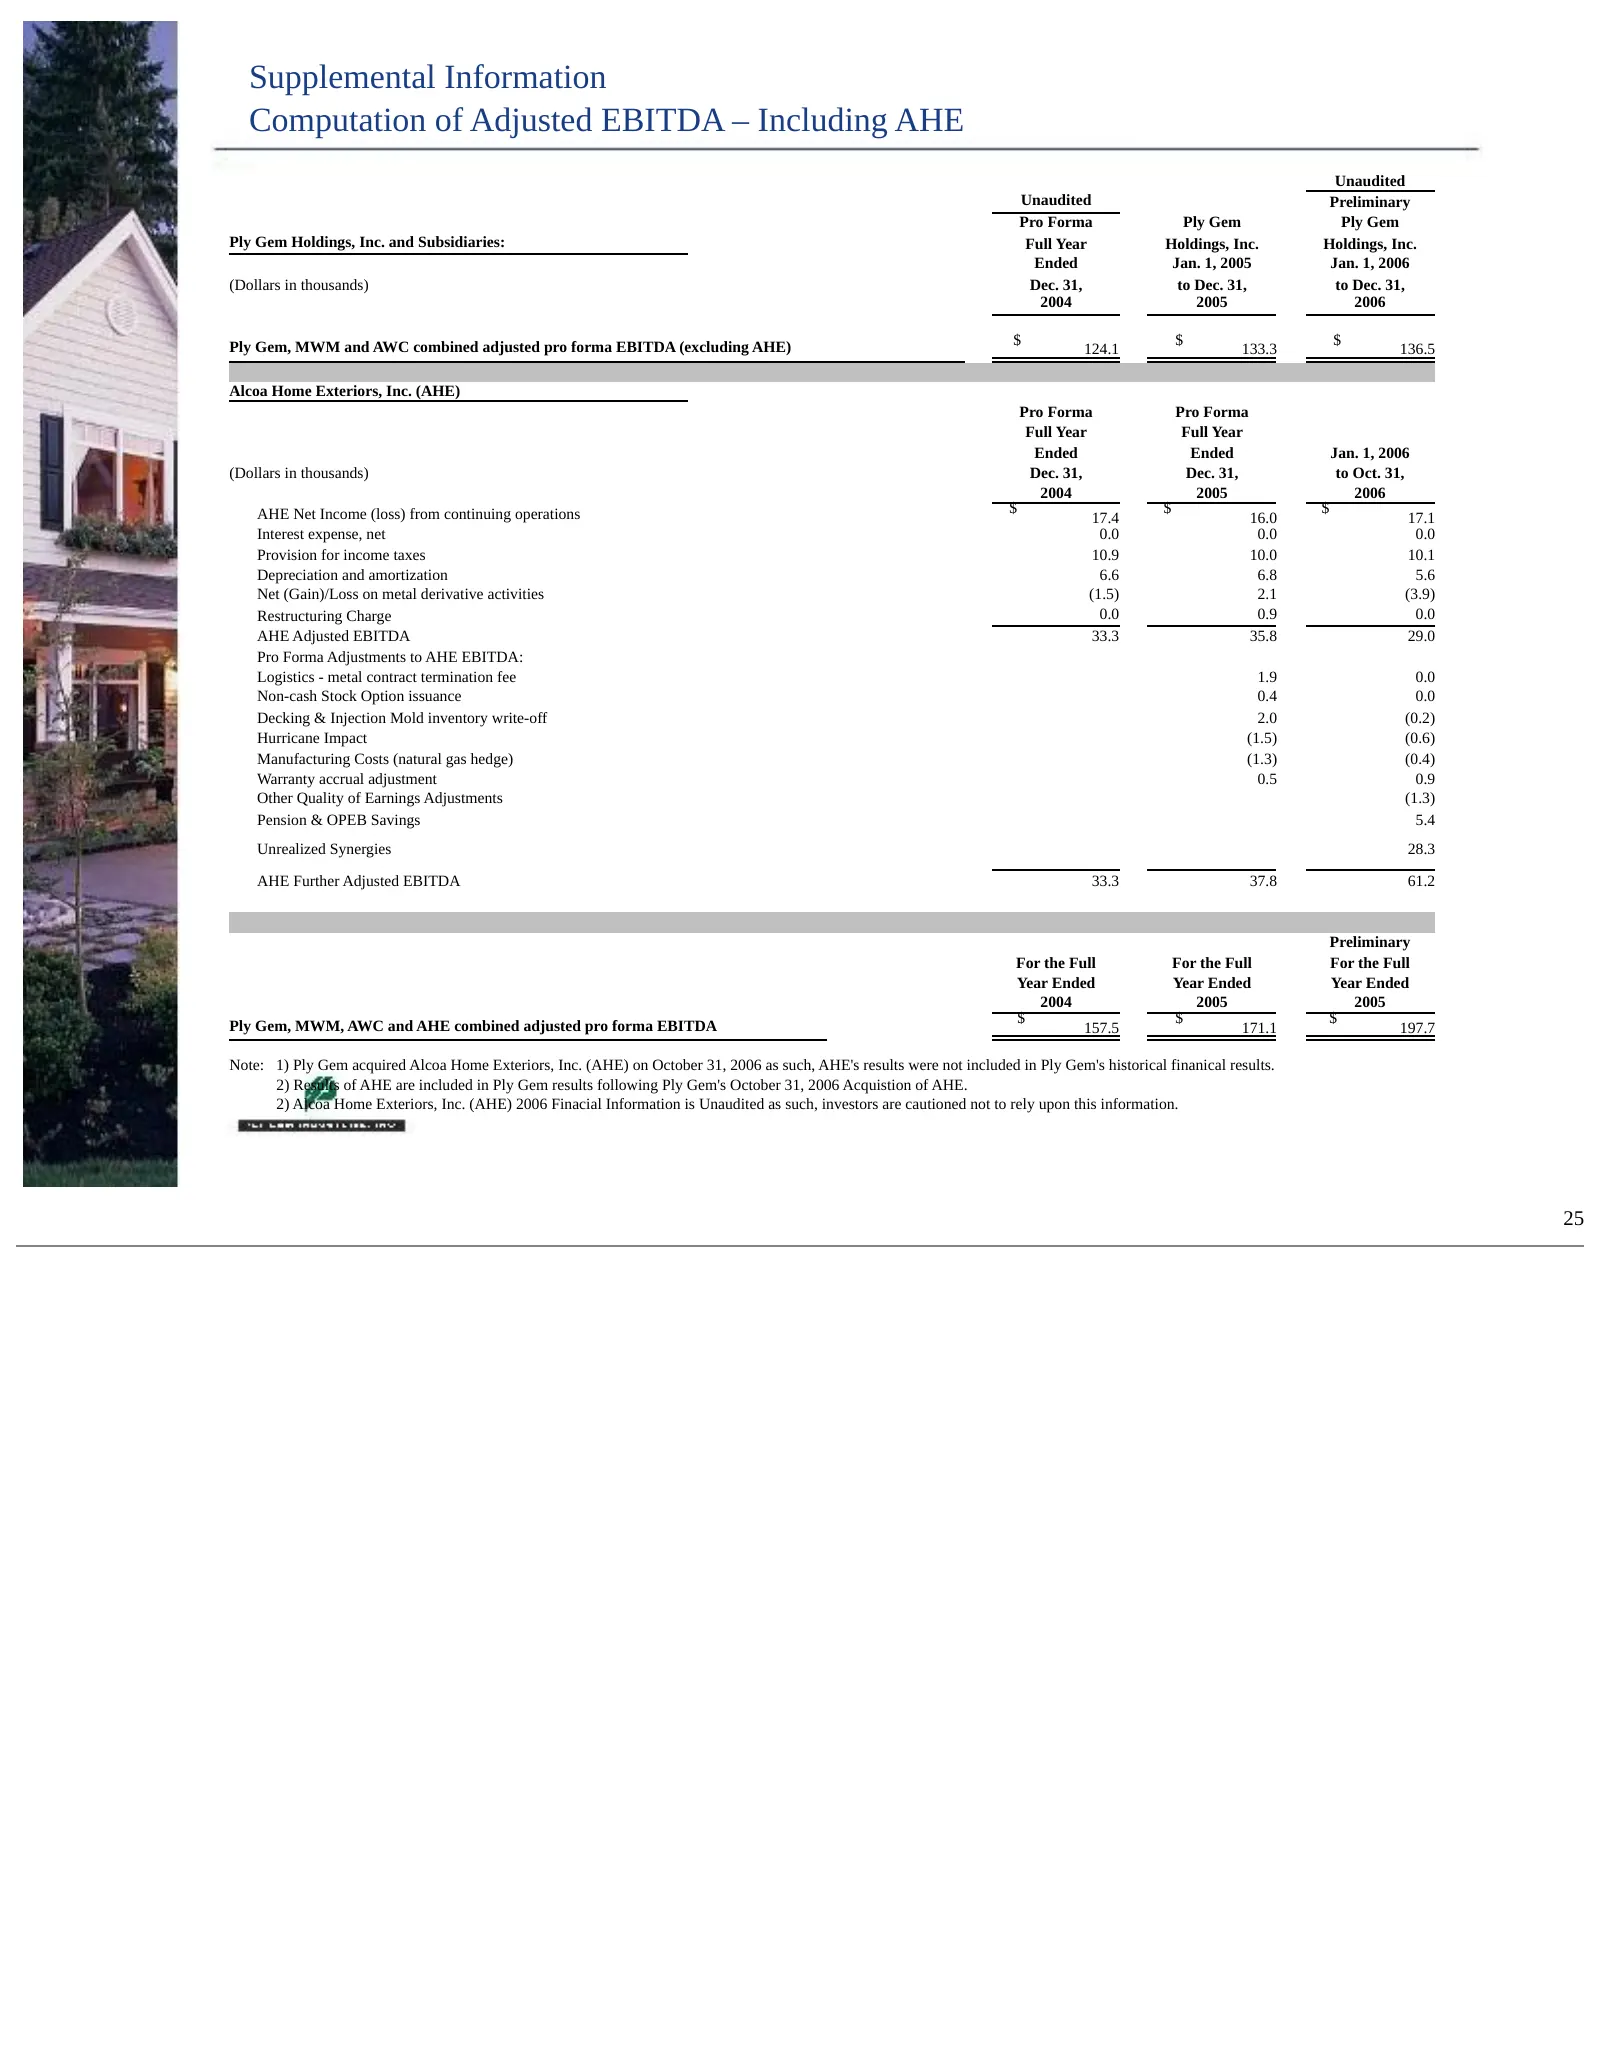
Slide 26: Computation of Adjusted EBITDA – Including AHE
Supplemental Information Supplemental Information Computation of Adjusted EBITDA – Including AHE Unaudited Unaudited Preliminary Pro Forma Ply Gem Ply Gem Ply Gem Holdings, Inc. and Subsidiaries: Full Year Holdings, Inc. Holdings, Inc. Ended Jan. 1, 2005 Jan. 1, 2006 (Dollars in thousands) Dec. 31,
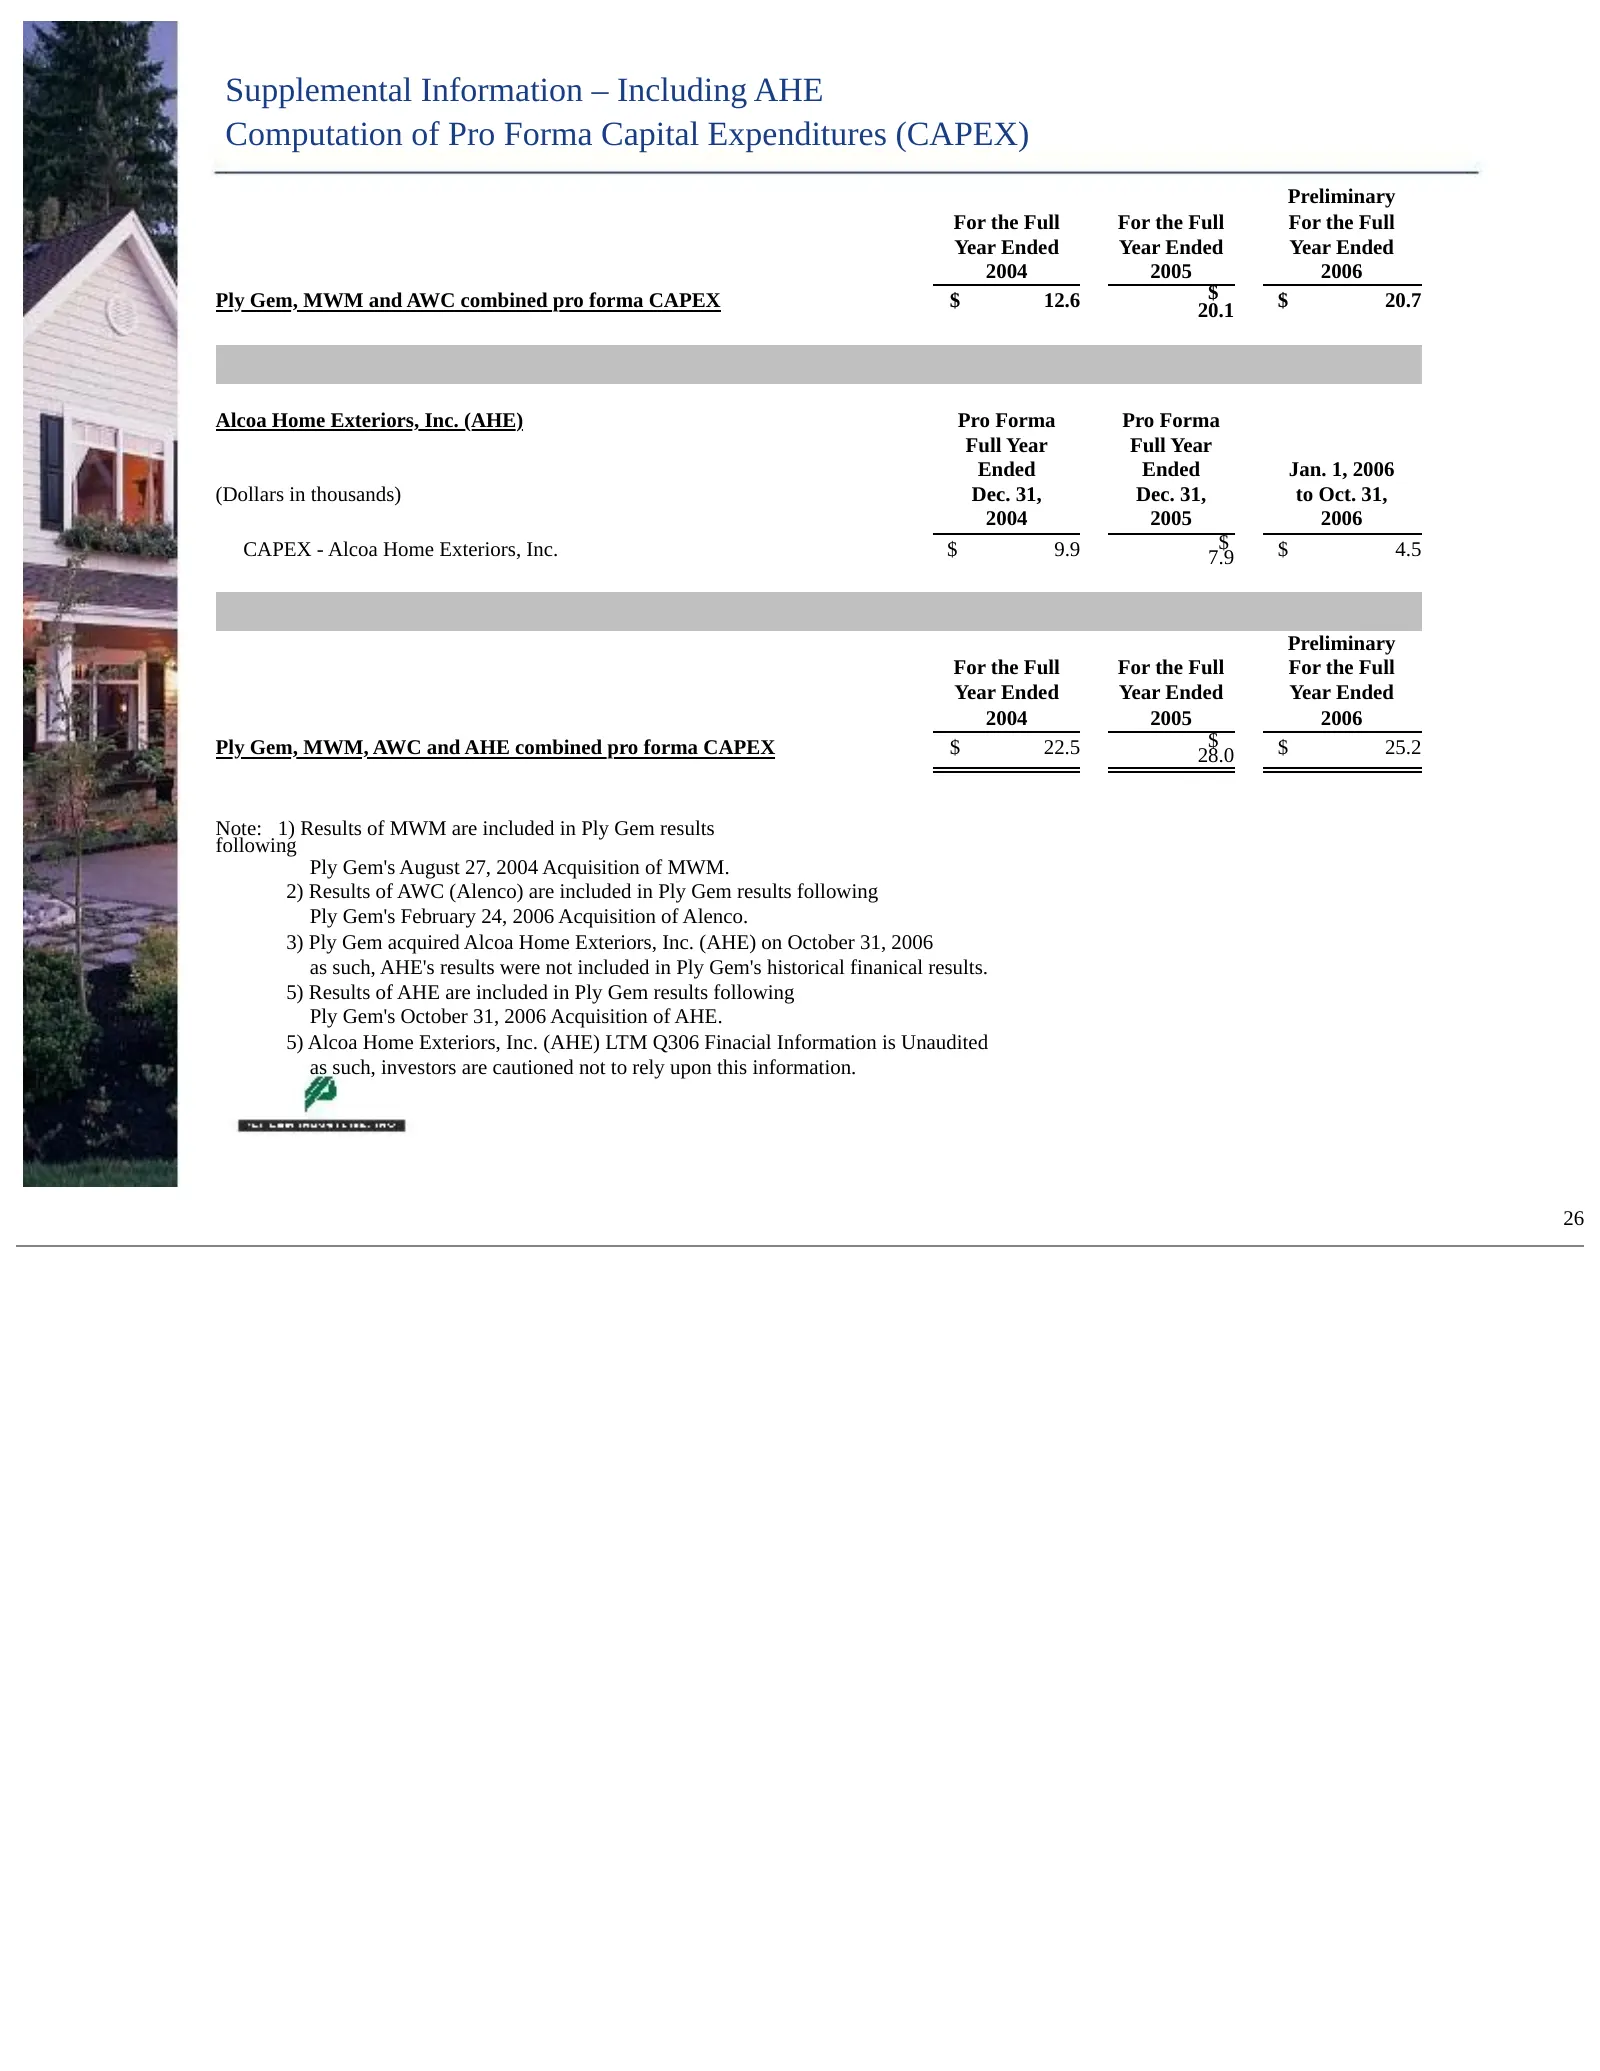
Slide 27: Computation of Pro Forma Capital Expenditures – Including AHE
Supplemental Information – Including AHE Supplemental Information – Including AHE Computation of Pro Forma Capital Expenditures (CAPEX) Preliminary For the Full For the Full For the Full Year Ended Year Ended Year Ended 2004 2005 2006 Ply Gem, MWM and AWC combined pro forma CAPEX $ 12.6 $ $ 20.7 20.
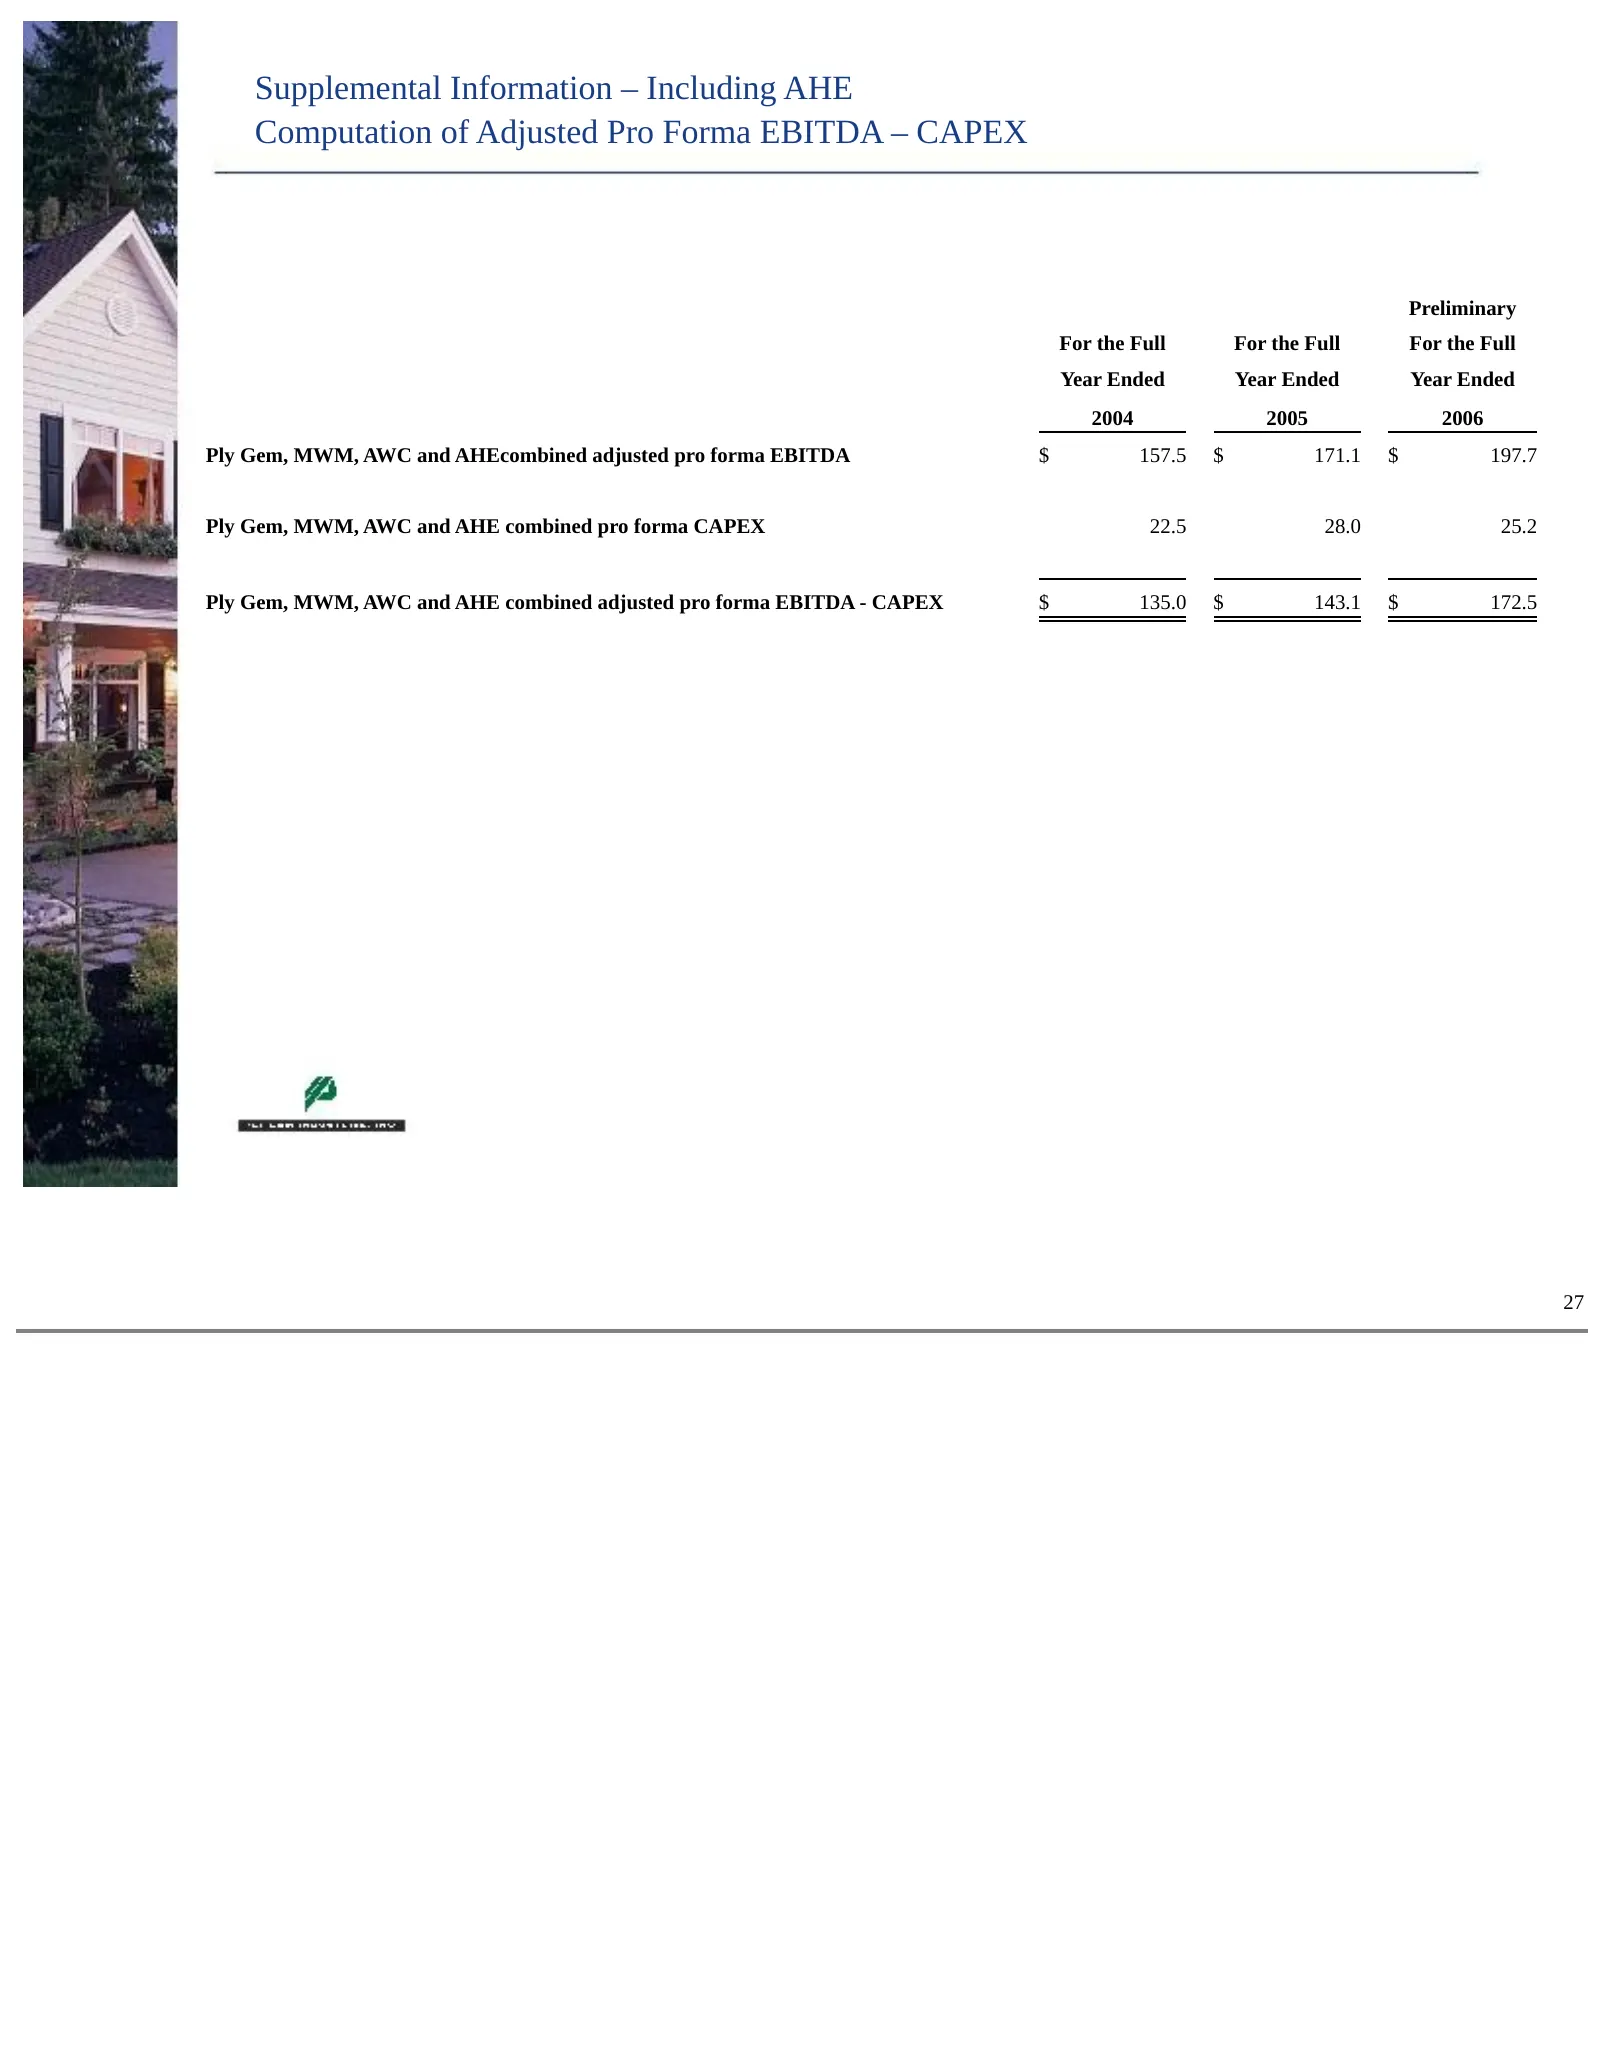
Slide 28: Computation of Adjusted Pro Forma EBITDA – CAPEX – Including AHE
Supplemental Information – Including AHE Supplemental Information – Including AHE Computation of Adjusted Pro Forma EBITDA – CAPEX Preliminary For the Full For the Full For the Full Year Ended Year Ended Year Ended 2004 2005 2006 Ply Gem, MWM, AWC and AHEcombined adjusted pro forma EBITDA $ 157.5 $
Source: SEC EDGAR · 8-K filed Mar 12, 2007
More decks from Ply Gem Holdings Inc
 Debt Investor Presentation (May 2008)35 slides · May 12, 2008
 Investor Presentation (December 2007)47 slides · Dec 4, 2007
 Investor Presentation (October 2007)47 slides · Oct 4, 2007
 Investor Day (April 2007)77 slides · Apr 10, 2007
 Credit Suisse Building Products Conference (January 2007)38 slides · Jan 9, 2007
 Debt Investor Presentation (May 2006)51 slides · May 18, 2006