Florida East Coast Industries Inc
Florida East Coast Industries — Q1 2006 Earnings Presentation
37 slides from Florida East Coast Industries's earnings presentation, Apr 27, 2006
Slide 1: First Quarter 2006 Earnings Review
April 26, 2006 Florida East Coast Industries, Inc. First Quarter 2006 Earnings Review Exhibit 99.1 April 27, 2006
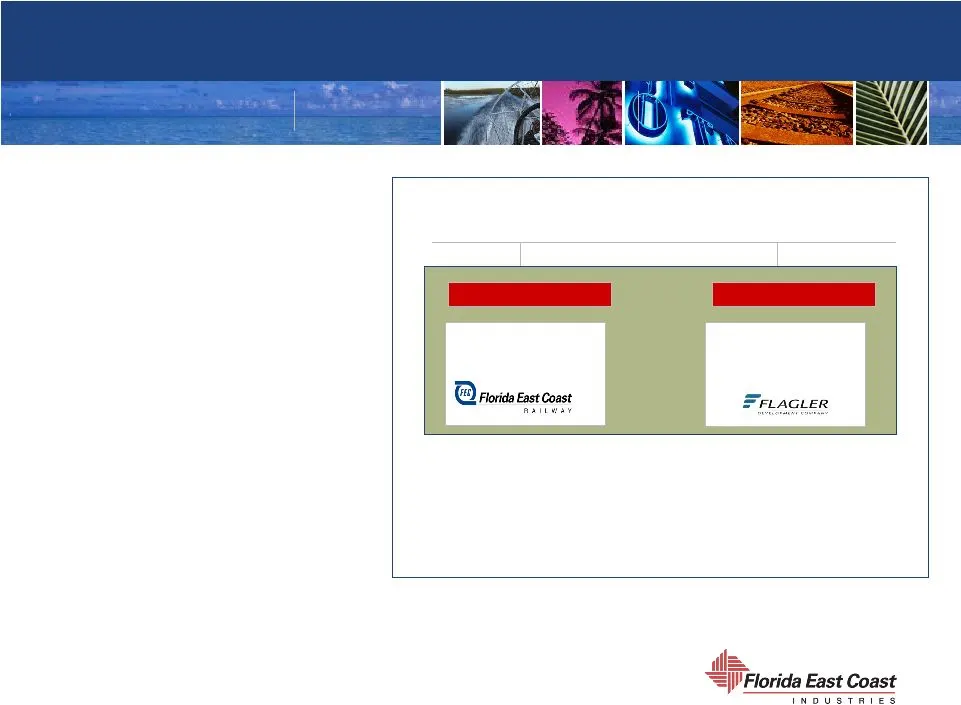
Slide 2: Company Snapshot
RAILROAD REAL ESTATE Company Snapshot Florida East Coast Industries A Florida Railroad and Real Estate Company • Regional freight railroad that operates 351 miles of main line track with the most direct route from Jacksonville to Miami and provides intermodal drayage services in the Southeast U.S. •
Slide 3: Forward-Looking Statements
Florida East Coast Industries, Inc. Forward-Looking Statements This presentation and news release contains forward-looking statements within the meaning of Section 27A of the Securities Act of 1933, as amended, and Section 21E of the Securities Exchange Act of 1934, as amended. These forward-looking
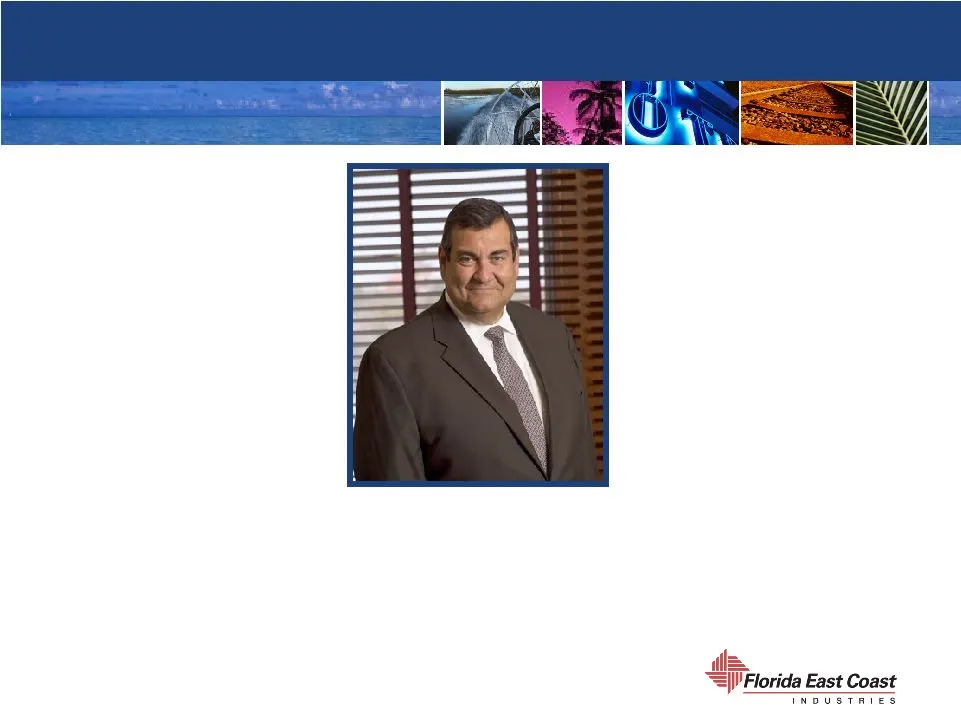
Slide 4: Adolfo Henriques, Chairman, President & CEO
FLORIDA EAST COAST INDUSTRIES, INC. Adolfo Henriques Chairman, President & CEO
Slide 5: First Quarter Overview - Railway
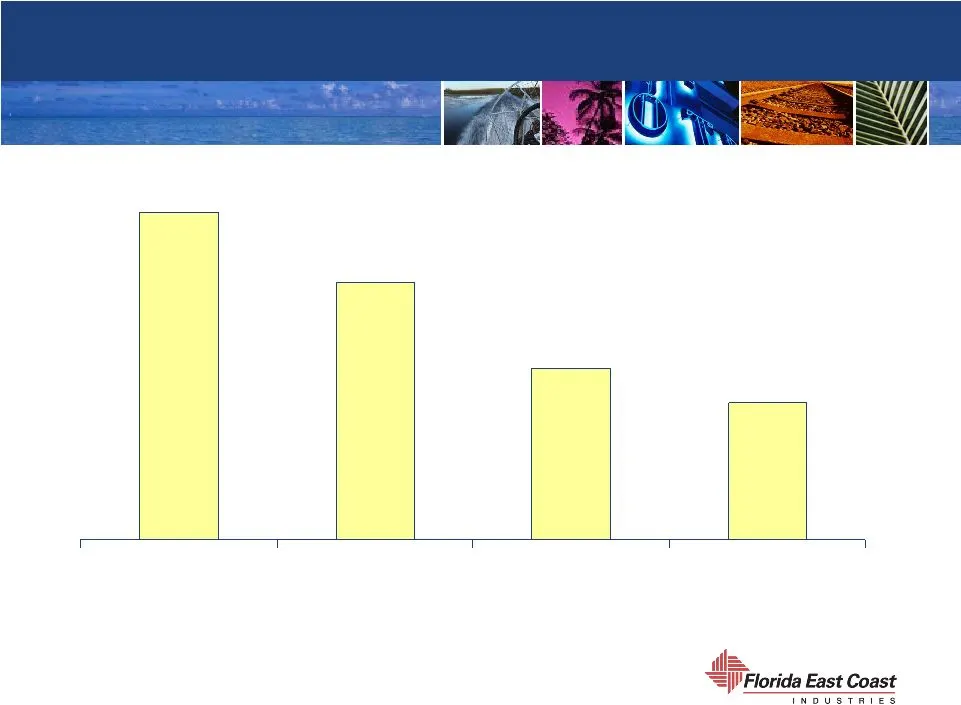
First Quarter Overview • Railway • Revenues increased 19% • Operating profit increased 26% • Operating ratio improved to 71.9% • Solid volume growth • Pricing environment is strong
Slide 6: First Quarter Overview - Real Estate
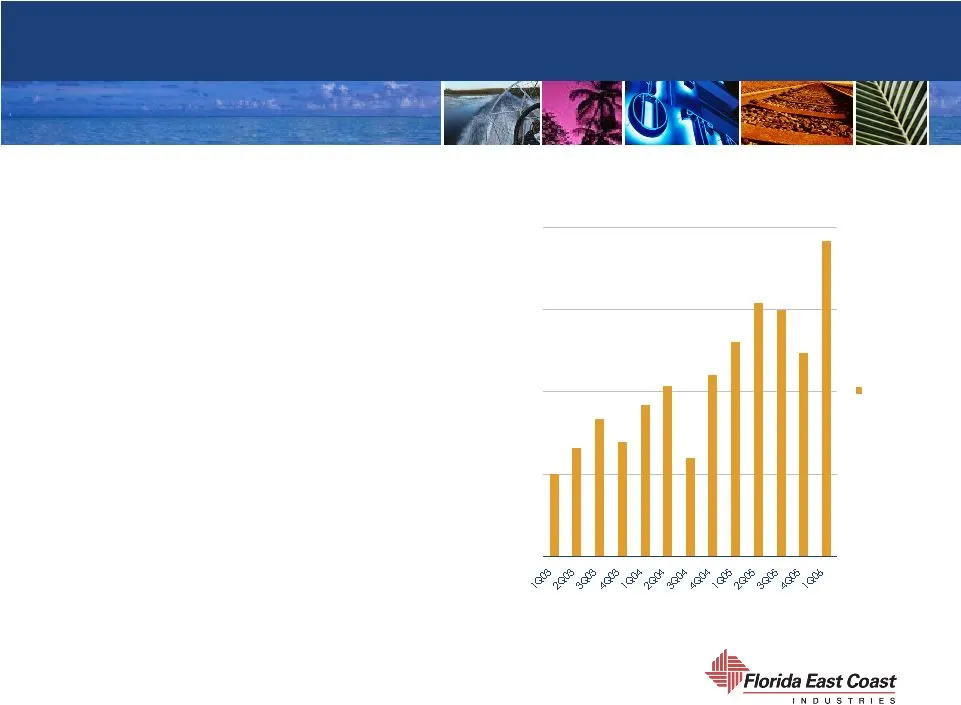
First Quarter Overview • Real Estate • Rental and services revenues increased 14% • Rental properties operating profit before depreciation & amortization increased 9% • 456,000 square feet of new building starts • Overall occupancy remained at 95%
Slide 7: Railway – Increased Aggregate Volumes and Revenues
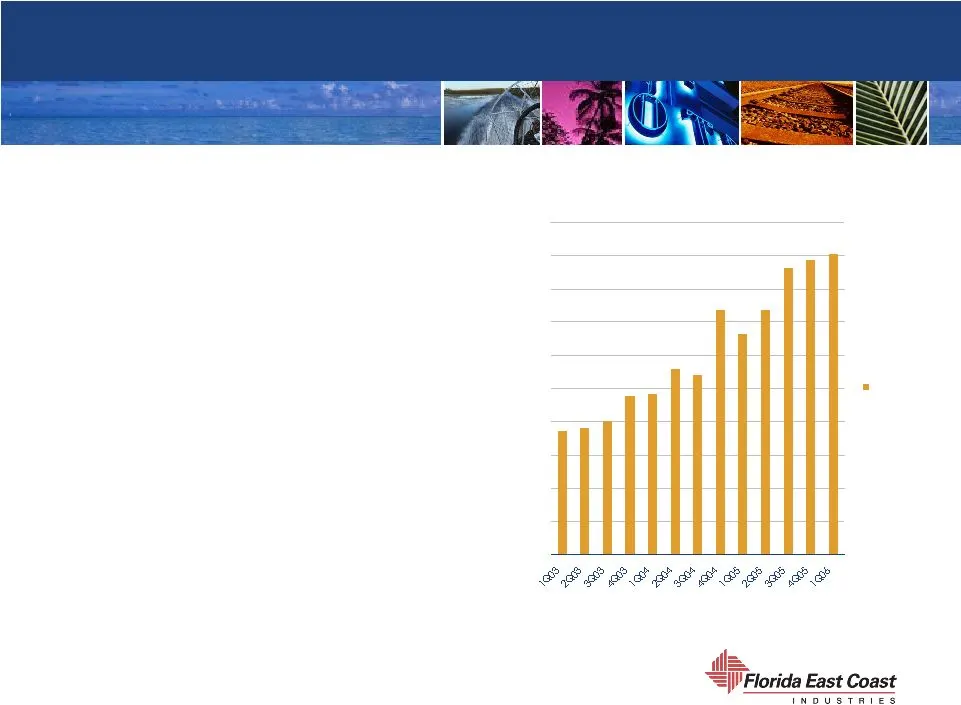
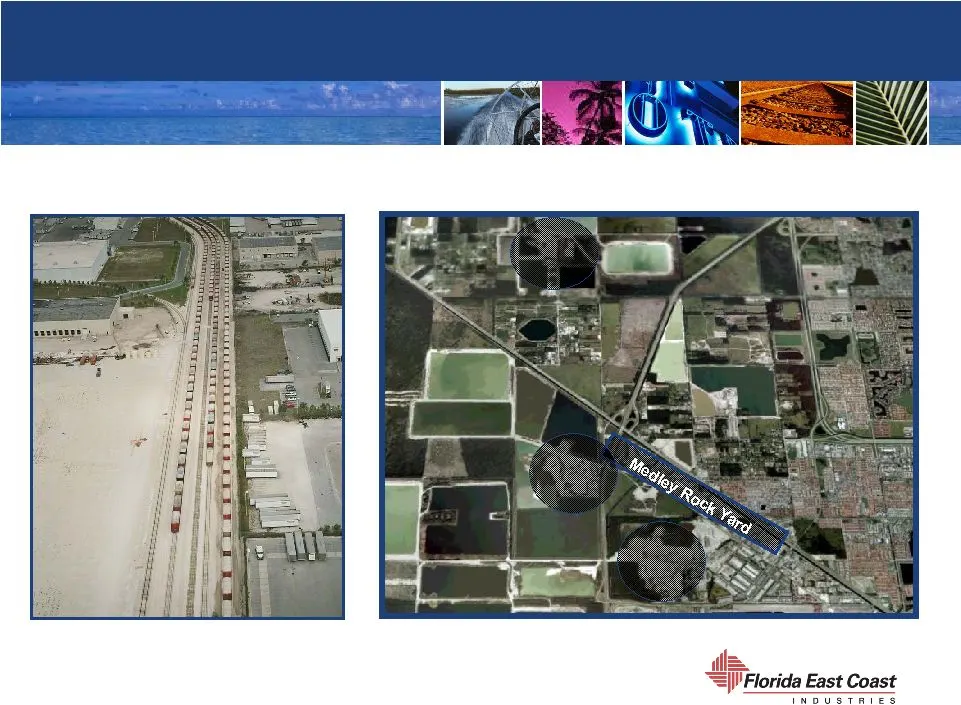
Railway – Increased Aggregate Volumes and Revenues • Aggregate volume up 9% and revenue up 18% • Significant increases in State funding for infrastructure • Third largest producer of aggregate • 60% of its annual aggregate needs • Recent ruling affecting rock mining in South Florida could impact agg
Slide 8: Railway – Continued Intermodal Growth
Railway – Continued Intermodal Growth • Intermodal volume up 6% and revenue up 21% • Florida’s shape and growth supports rail transportation • Rail provides a direct, more cost-effective transportation solution • Florida is an international hub • Exclusive access to ports provides clear competitive
Slide 9: B % B & $ Ao} i
B % 8 B & 8 $ Ao} i
Slide 10: Flagler Development Company
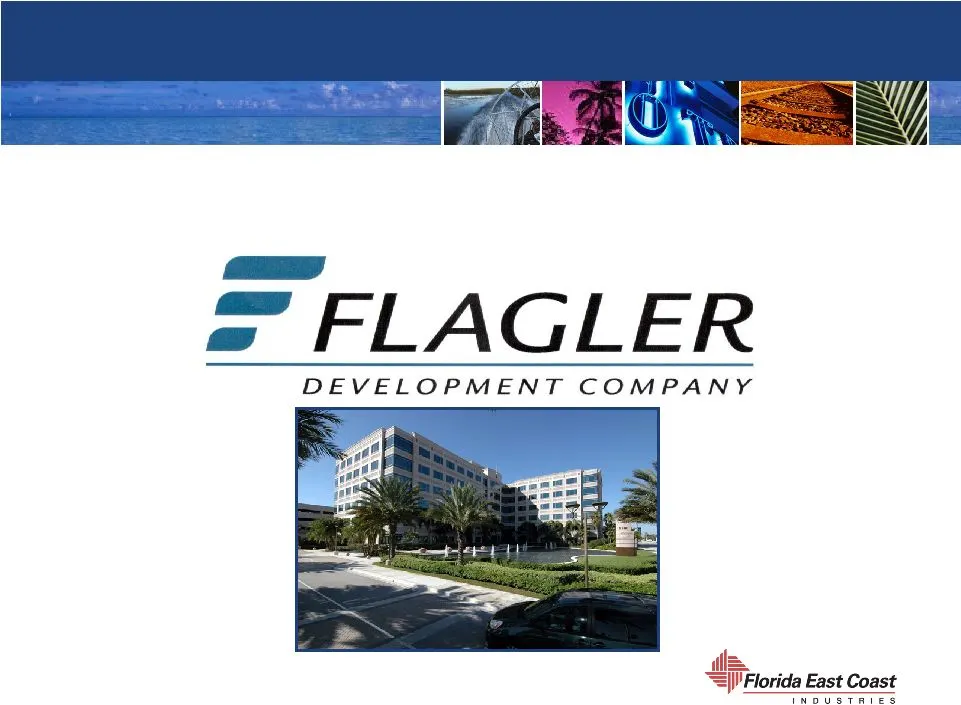
Flagler Development Company Doral Concourse, Doral, FL
Slide 11: Flagler Development Pipeline
Flagler Development Pipeline • Overall Occupancy: 95% • 674,000 square feet in lease-up • 64% leased • 575,000 square feet under construction • 800,000 square feet in pre-development
Slide 12: Flagler Development Activity
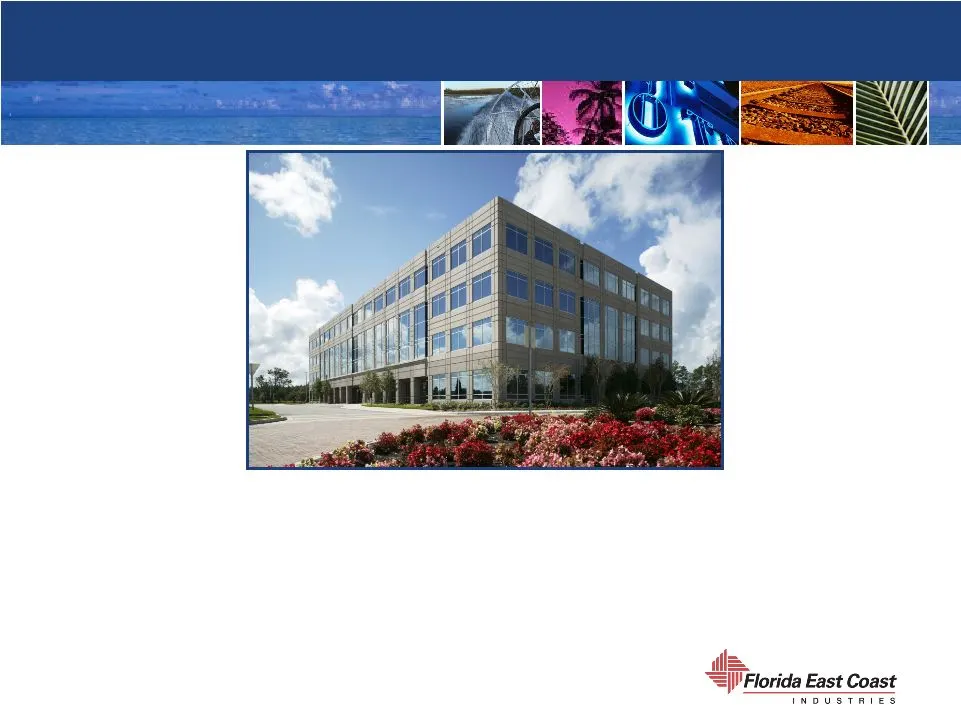
Flagler Development Activity • Lakeside Two fully leased • Construction commenced on Lakeside One Lakeside Two At Flagler Center, Jacksonville, FL
Slide 13: Flagler Development Activity
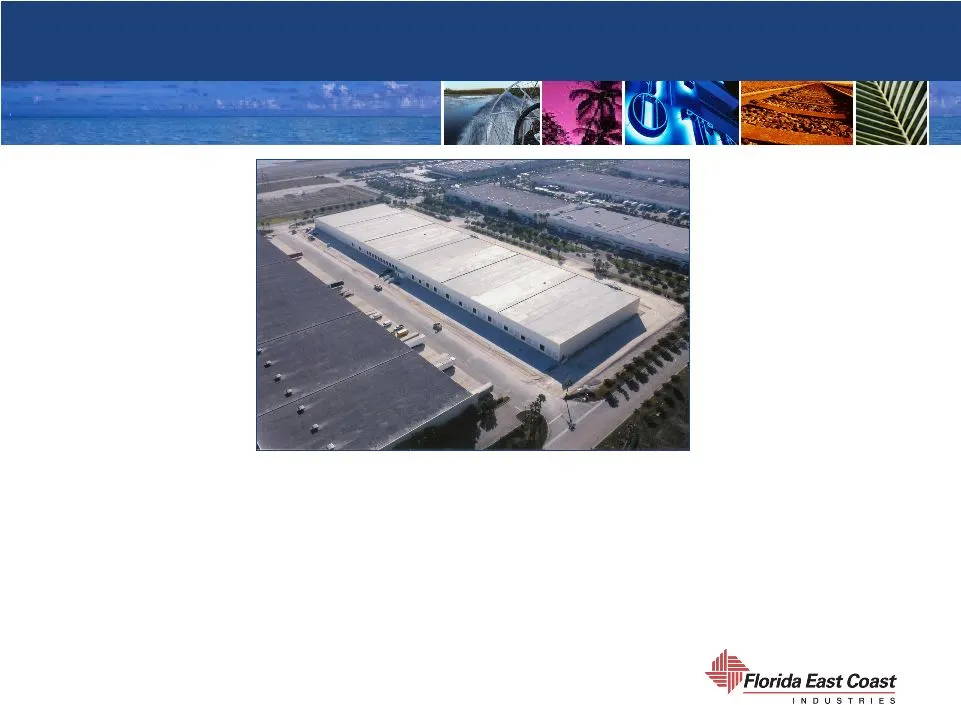
Flagler Development Activity • Building 27 in Flagler Station completed in April 2005 is now 100% occupied • Building 25 in Flagler Station completed in December 2005 is 29% leased • Construction of Buildings 28 & 29 recently commenced Building 27 at Flagler Station, Miami, Florida
Slide 14: Codina Group
Codina Group • Closing acquisition today • Creates an outstanding development landbank in Florida amid a shrinking supply of available land • Codina Group is a well-established and industry- leading operating company • Interests in real estate ventures with key partners and proven track records • Ar
Slide 15: Codina Group
Codina Group • Codina Group entitlement and development progress • County Commission vote to include Beacon Countyline in the Urban Development Boundary • Over 5 million square feet of industrial space planned • Started construction on Building 7 in Beacon Lakes • Started construction on the Coral G
Slide 16: First Quarter Land Sales
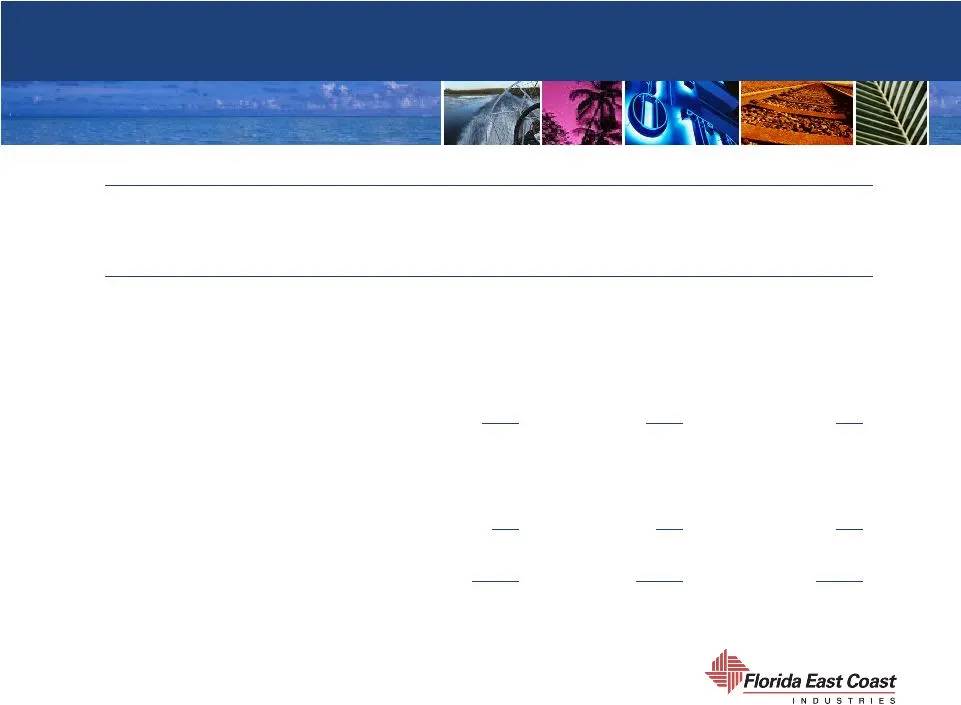
First Quarter Land Sales 2.9 22.6 25.5 Southmark – Orlando 10.6 30.4 41.0 Flagler Realty Sales 3.2 0.2 3.4 Railway Realty Sales $13.8 $30.6 $44.4 Pulte Homes – Flagler Center Citicorp – Flagler Center (In Millions) 11.4 $ 4.1 Realty Sales Revenue 5.2 $ 2.6 Cost 6.2 $ 1.5 Operating Profit
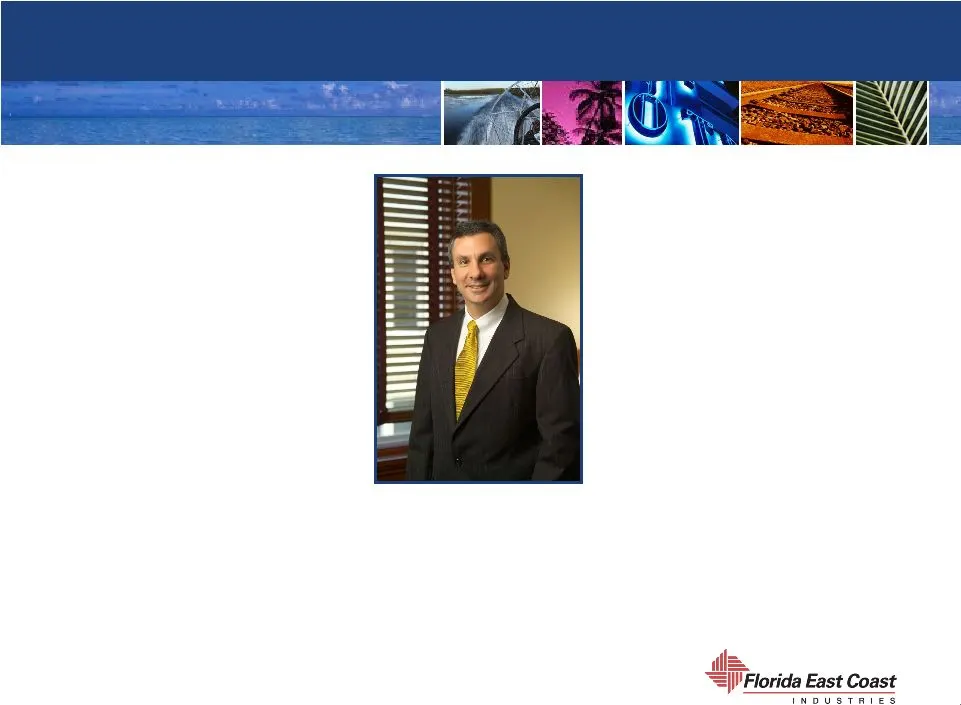
Slide 17: Daniel H. Popky, Chief Financial Officer
FLORIDA EAST COAST INDUSTRIES, INC. Daniel H. Popky Chief Financial Officer
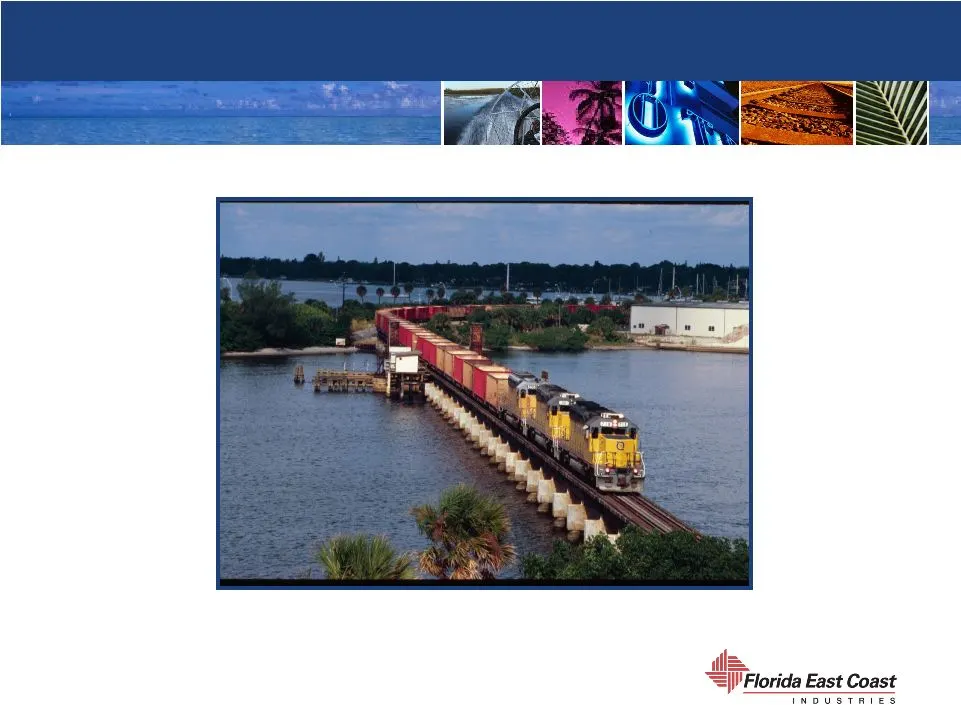
Slide 18: Florida East Coast Railway
FLORIDA EAST COAST RAILWAY
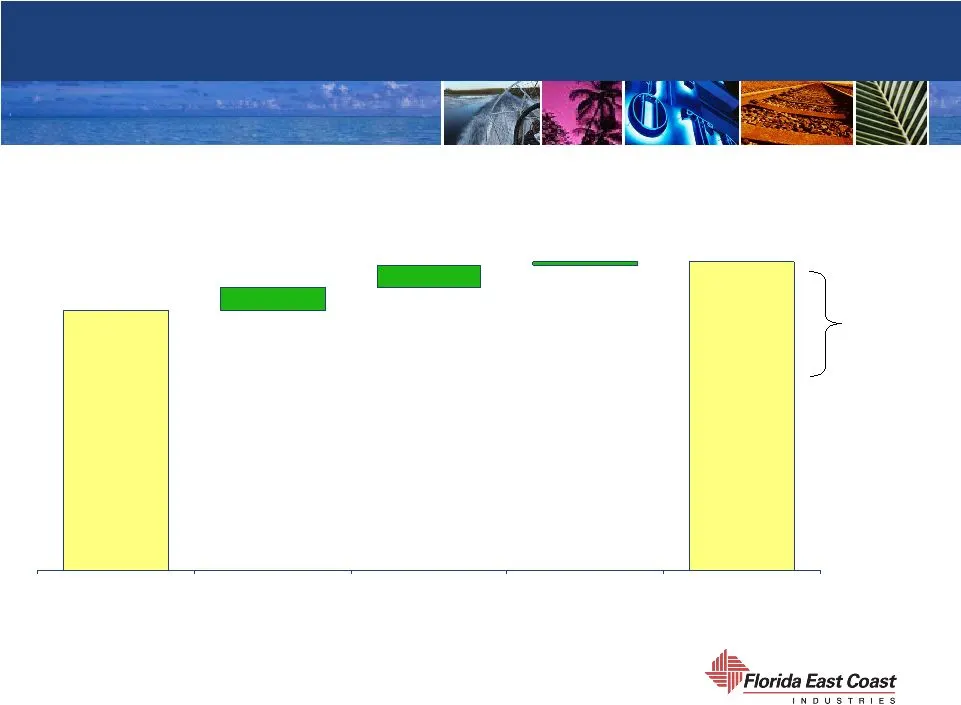
Slide 19: Railway Revenue Growth
Railway Revenue Growth $56.5 $67.1 $5.1 $0.7 $4.8 Q1 Carload Intermodal All Other Q1 First Quarter - in Millions +15.7% +20.7% +58.4% +18.6%
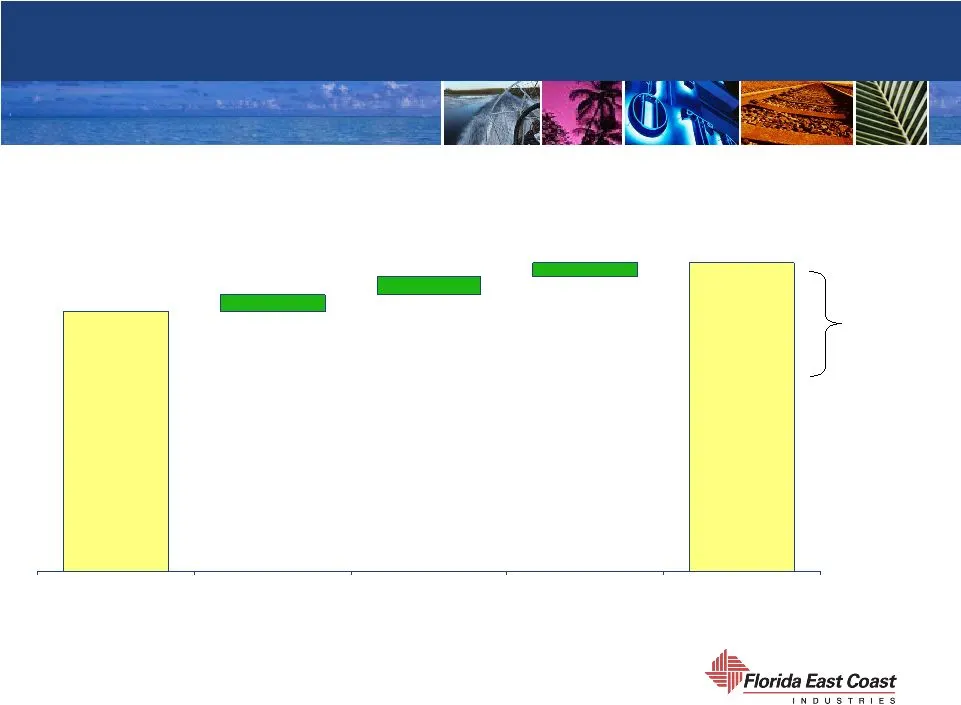
Slide 20: Railway Revenue Growth Detail
Railway Revenue Growth Detail $56.5 $67.1 $3.7 $3.9 $3.0 Q1 Volume Rate & Mix Fuel Recovery Q1 First Quarter - in Millions +6.4% +6.9% +5.3% +18.6%
Slide 21: Commodity Revenue Growth
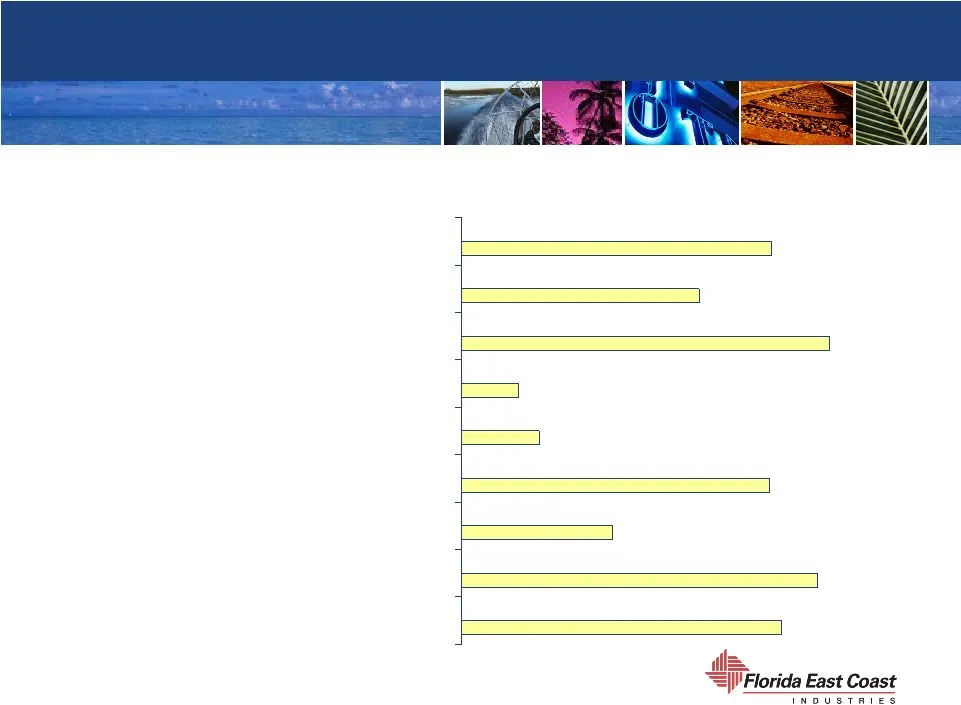
Commodity Revenue Growth Q1 2006 vs Q1 2005 Variance 18.6% 20.7% 8.8% 17.9% 4.5% 3.3% 21.4% 13.8% 18.0% Railway Segment Revenue Growth Intermodal Other Carload Paper & Lumber Chemicals & Distillants Foodstuffs & Kindred Vehicles Construction Materials Aggregate
Slide 22: Railway Profit Growth
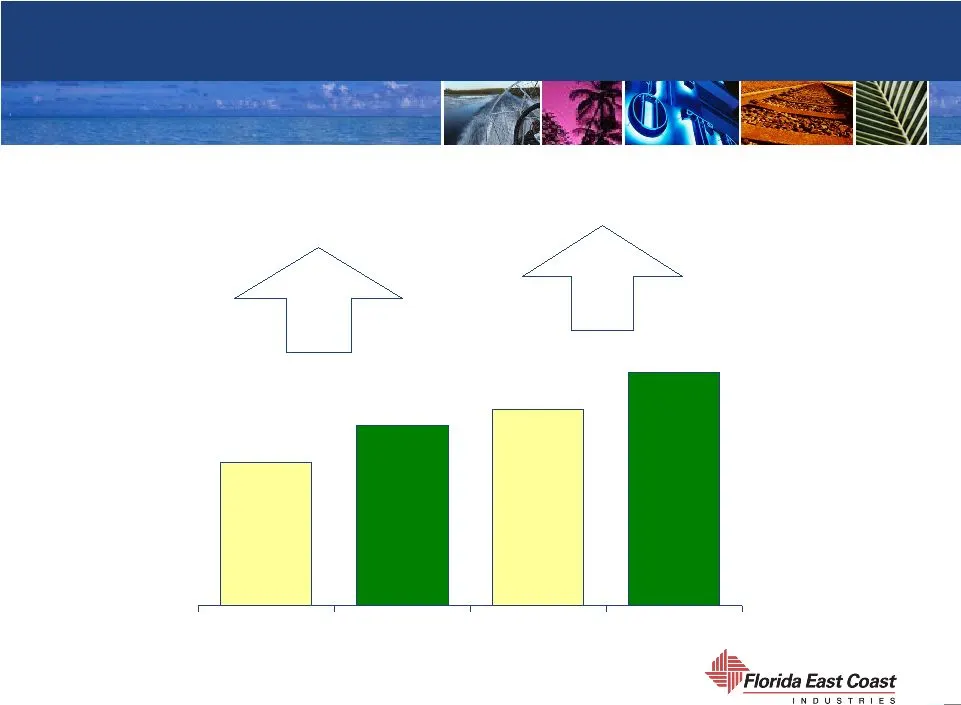
Railway Profit Growth $15.0 $18.8 $20.4 $24.3 Operating Profit Operating Profit before Depreciation* *See page 37 for reconciliation of non-GAAP measures 25.5% 19.3% First Quarter – In Millions
Slide 23: Railway Operating Ratio First Quarter
Railway Operating Ratio First Quarter 80.1% 77.1% 73.5% 71.9%
Slide 24: Railway 2006 Outlook
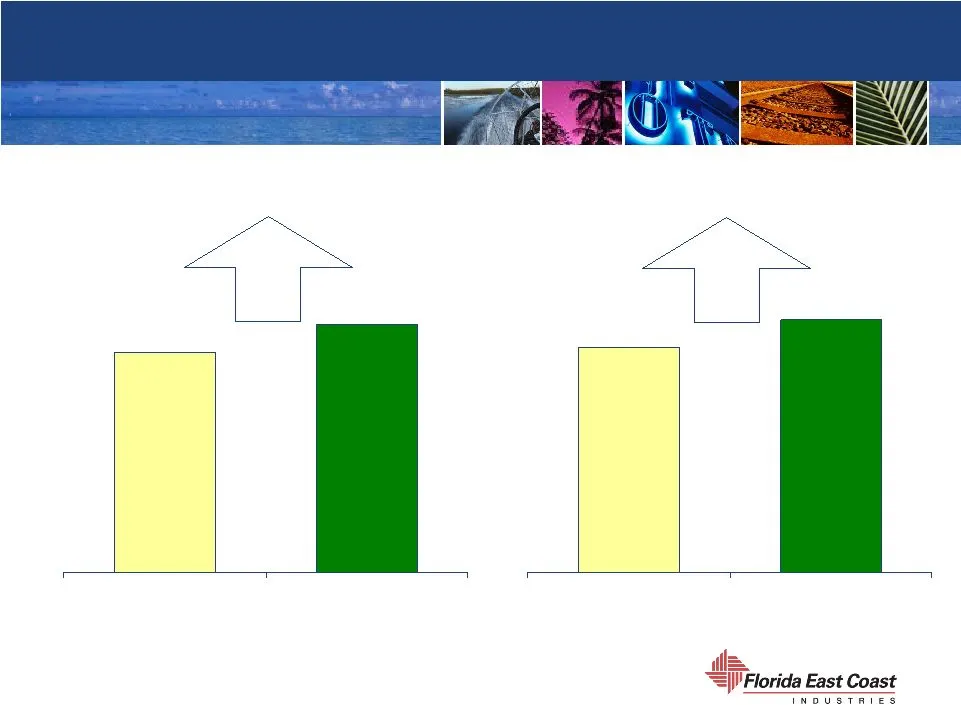
Railway 2006 Outlook Revenues Operating Profit (1) Excludes insurance recoveries related to Hurricane Wilma Full Year – In Millions 9-14% 13-18% $237.9 $260-$270 $63.7 $72-$75 (1)
Slide 25: Railway Capital Expenditures
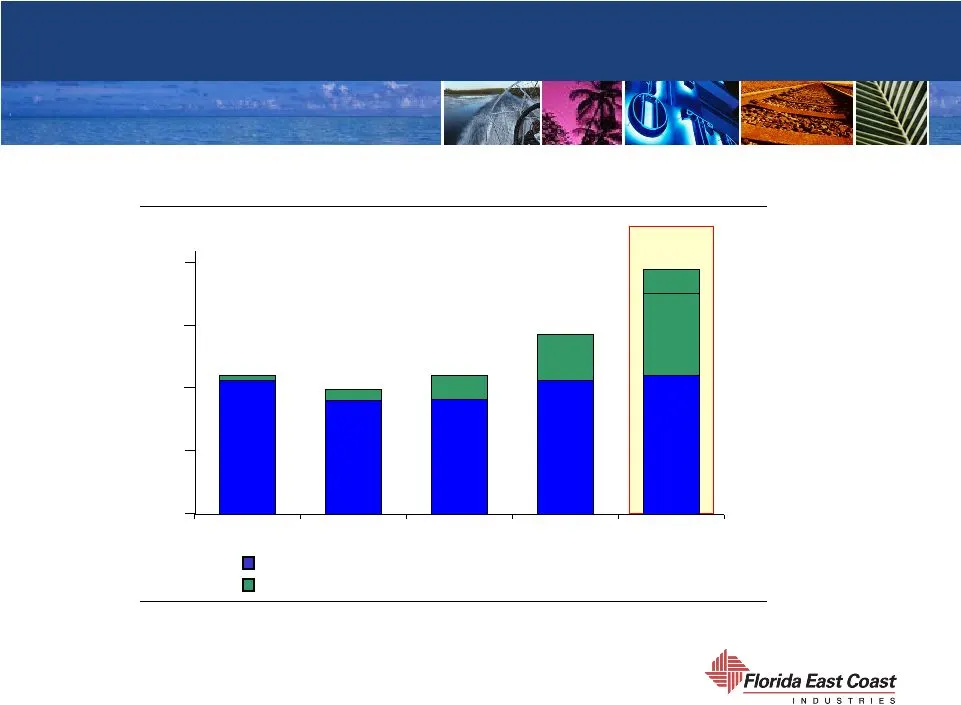
Railway Capital Expenditures 2006 Outlook $30 $27 $30 $39 (1) $48-$53 Maintenance capital Productivity & growth capital * *Before the purchase of any strategic land parcels to be used for industrial development (1)Productivity and growth capital includes $5.1 of land purchased for future development
Slide 26: Flagler Development Company
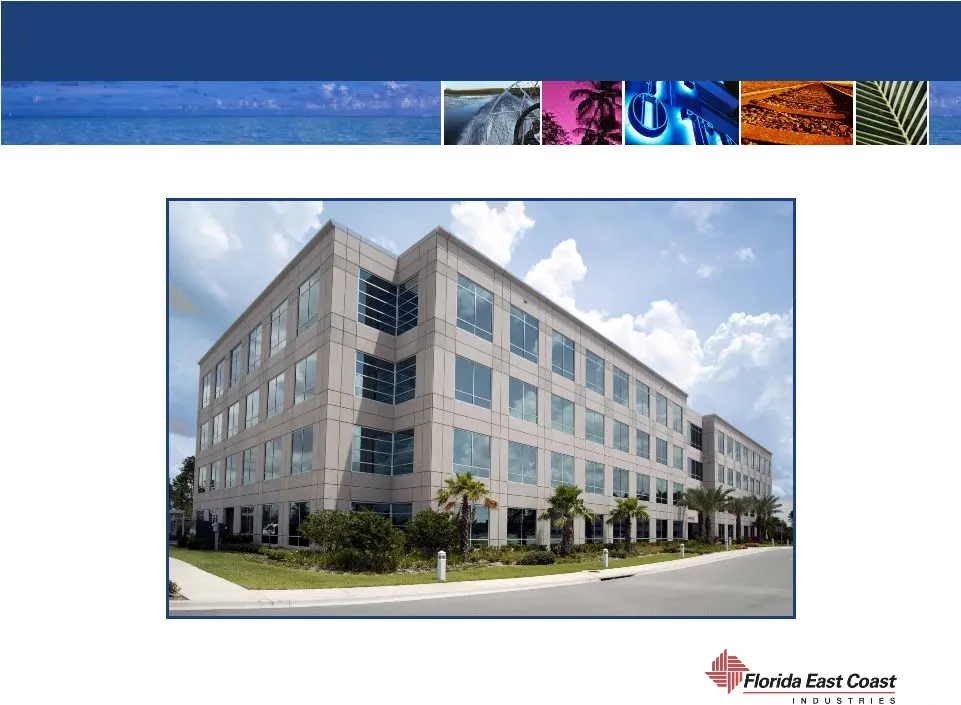
FLAGLER DEVELOPMENT COMPANY Office Building in Lease-Up, SouthPark Center, Orlando, FL
Slide 27: Flagler Rental & Services Revenue Growth
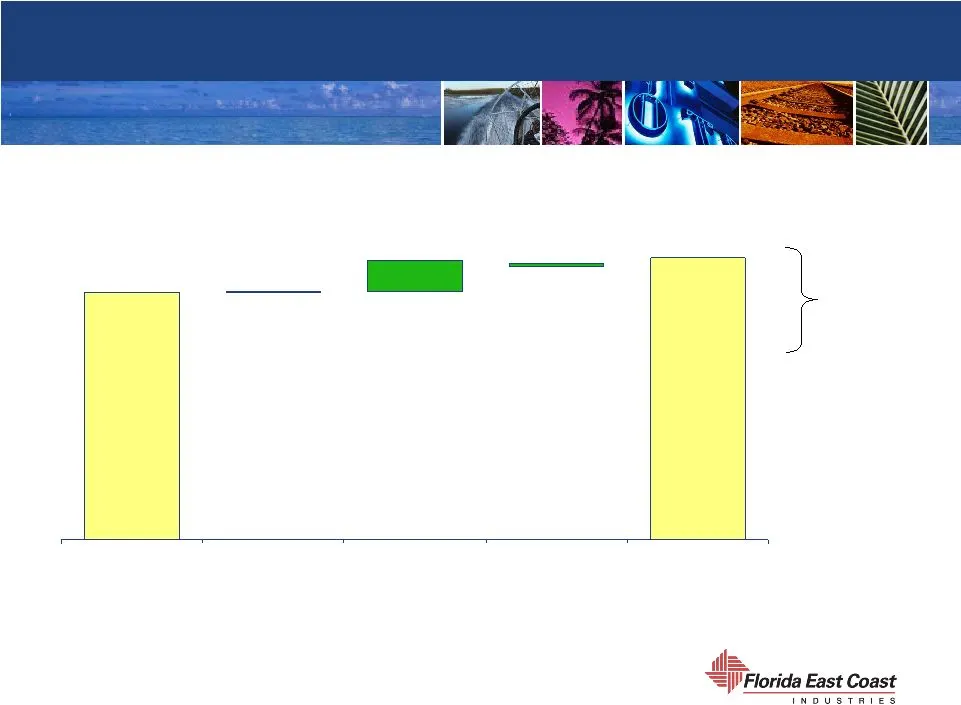
Flagler Rental & Services Revenue Growth Q1 Same Store New in ‘05 Q-1 All Other First Quarter - in Millions $0.2 $23.5 +14.3% $2.6 $0.1 $20.6
Slide 28: Flagler Rental Properties Operating Profit Before D&A Growth
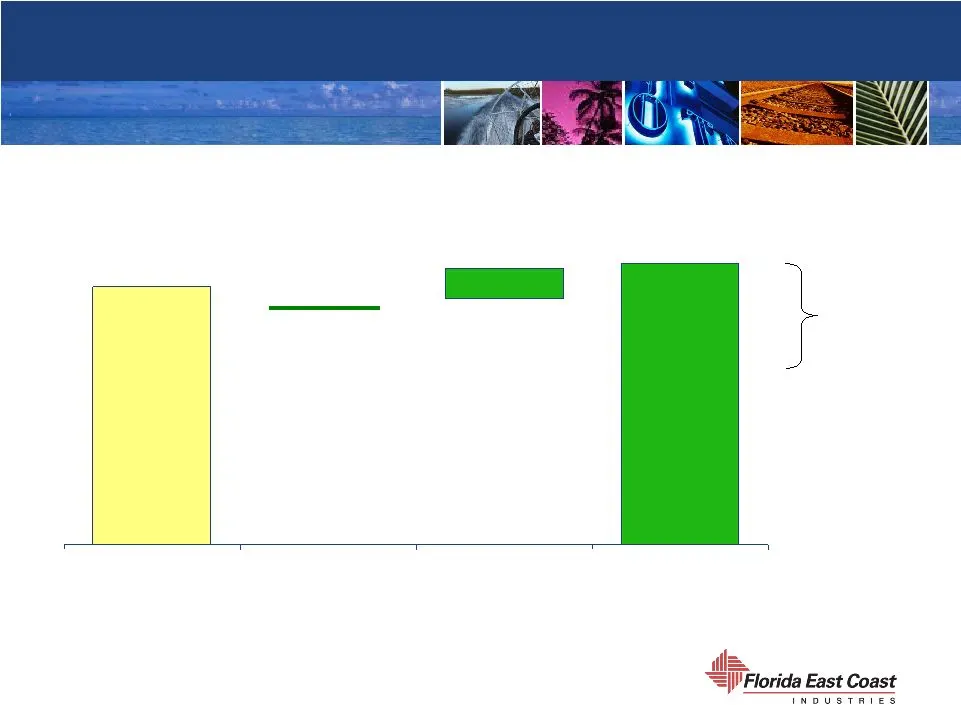
Flagler Rental Properties Operating Profit Before Depreciation & Amortization* Growth Q1 Same Store New in ‘05 Q1 First Quarter - in Millions $14.4 +8.8% $1.6 ($0.4) $13.3 * See page 37 for reconciliation of non-GAAP measures.
Slide 29: Flagler Occupancy and Leasing Activity
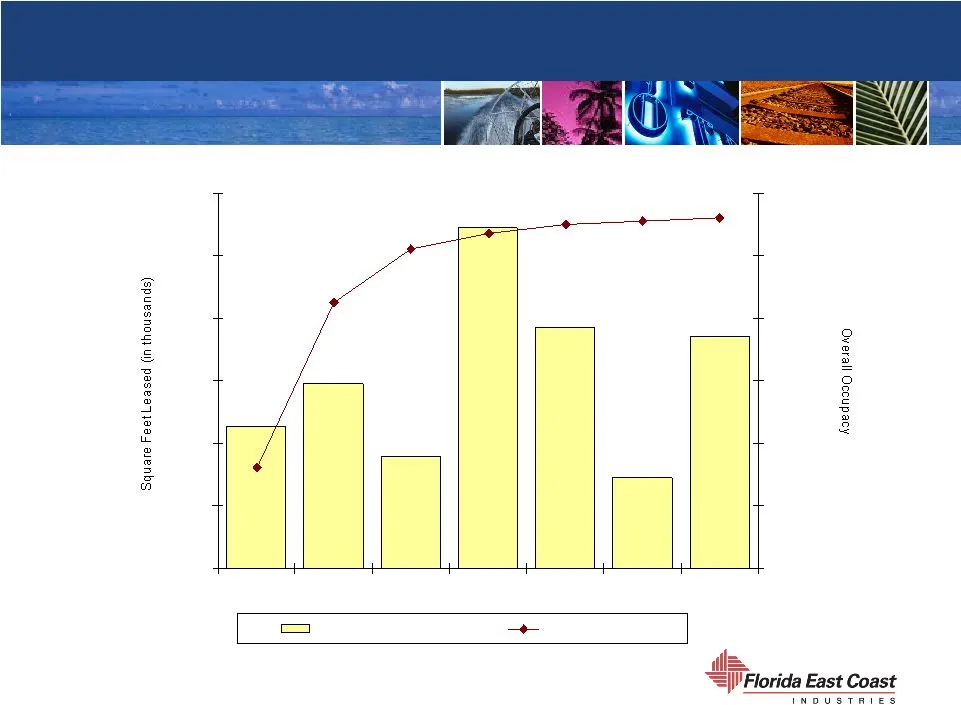
Flagler Occupancy and Leasing Activity (1) 2003 and 2004 leasing activity represents quarterly averages. 92.5% 94.2% 95.0% 95.1% 95.2% 94.7% 87.2% 2003(1) 2004(1) 1Q05 2Q05 3Q05 4Q05 1Q06 84.0% 86.0% 88.0% 90.0% 92.0% 94.0% 96.0% Square Feet Leased Overall Occupancy
Slide 30: Flagler Lease Expirations
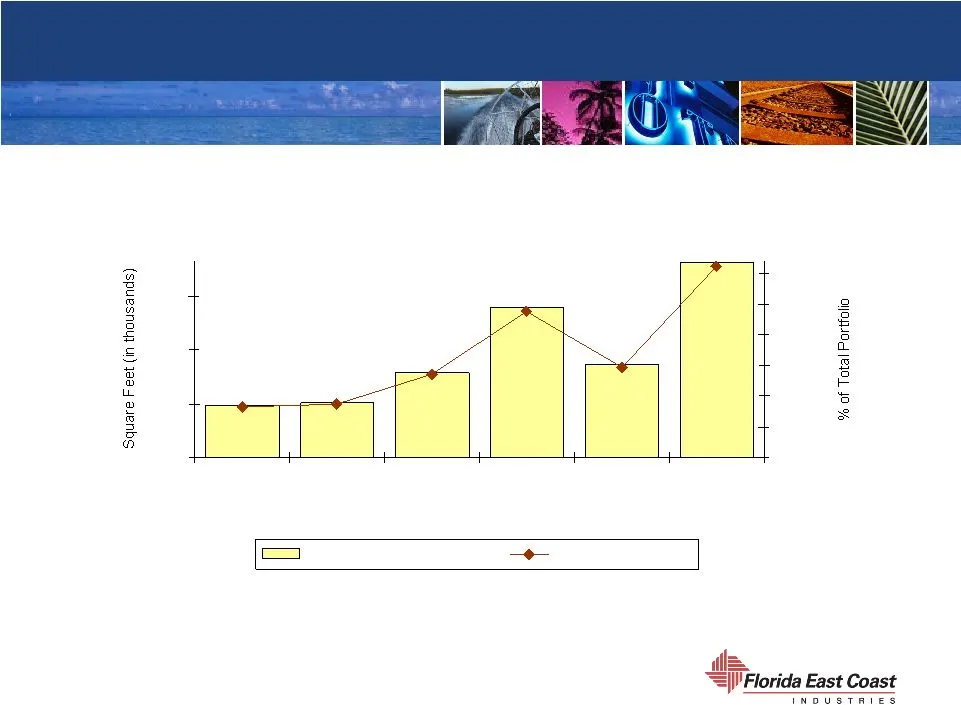
Flagler Lease Expirations 1,036 2,187 1,673 8.7% 13.5% 23.8% 31.1% 14.7% 8.2% Remainder 2011+ 0.0% 5.0% 10.0% 15.0% 20.0% 25.0% 30.0% Total Square Feet Expiring % of Total Portfolio
Slide 31: Flagler 2006 Outlook
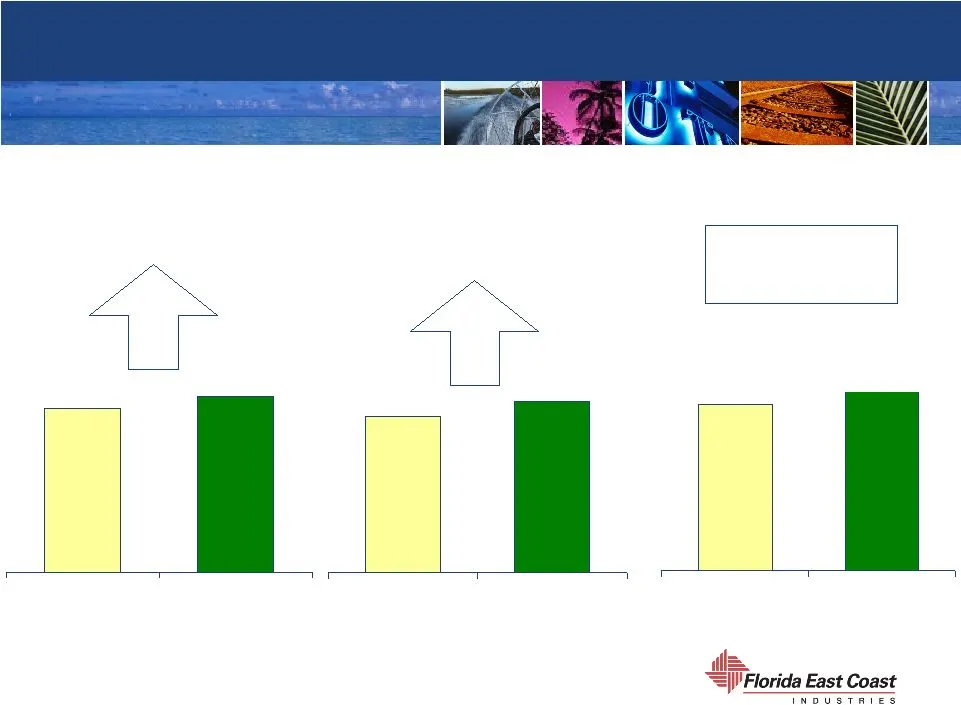
Flagler 2006 Outlook ¹ 4 - 9% Rental & Services Revenues Operating Properties Operating Profit before Depreciation & Amortization* (1) Excludes results from the Codina acquisition and impact to be recorded in 2006 related to Hurricane Wilma * See page 37 for reconciliation of non-GAAP measures Full
Slide 32: Flagler Capital Expenditures
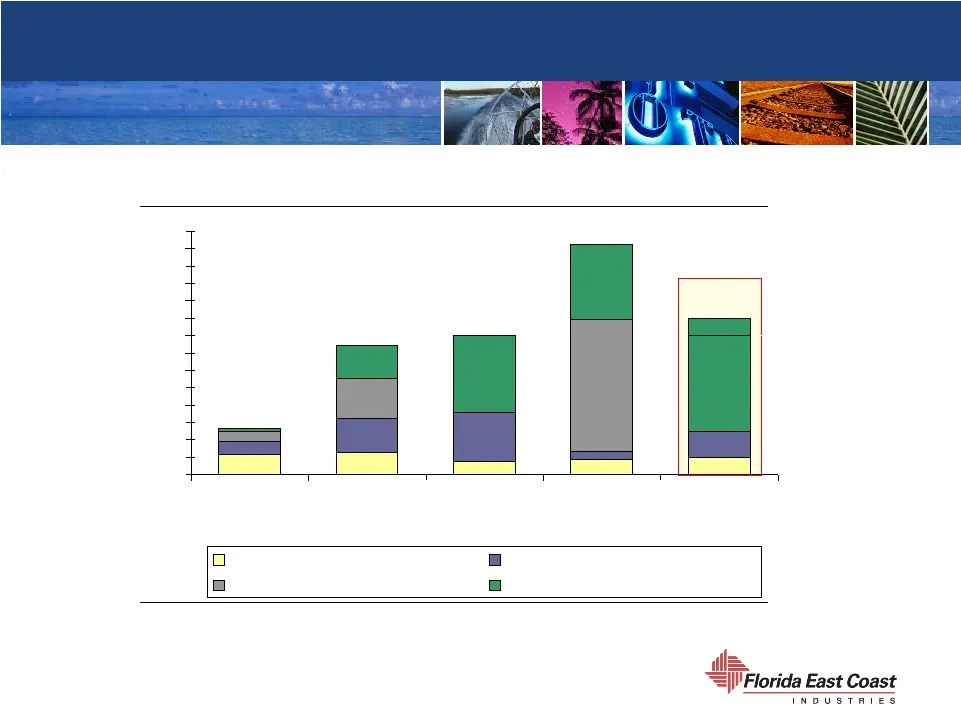
Flagler Capital Expenditures Outlook* Existing Operating Properties Infrastructure Acquisition New Building Construction $27.0 $75.0 $80.0 $132.7 $80-$90 (in millions) * Before any acquisition capex
Slide 33: Florida East Coast Industries, Inc.
FLORIDA EAST COAST INDUSTRIES, INC.
Slide 34: Condensed Consolidated Statements of Cash Flows
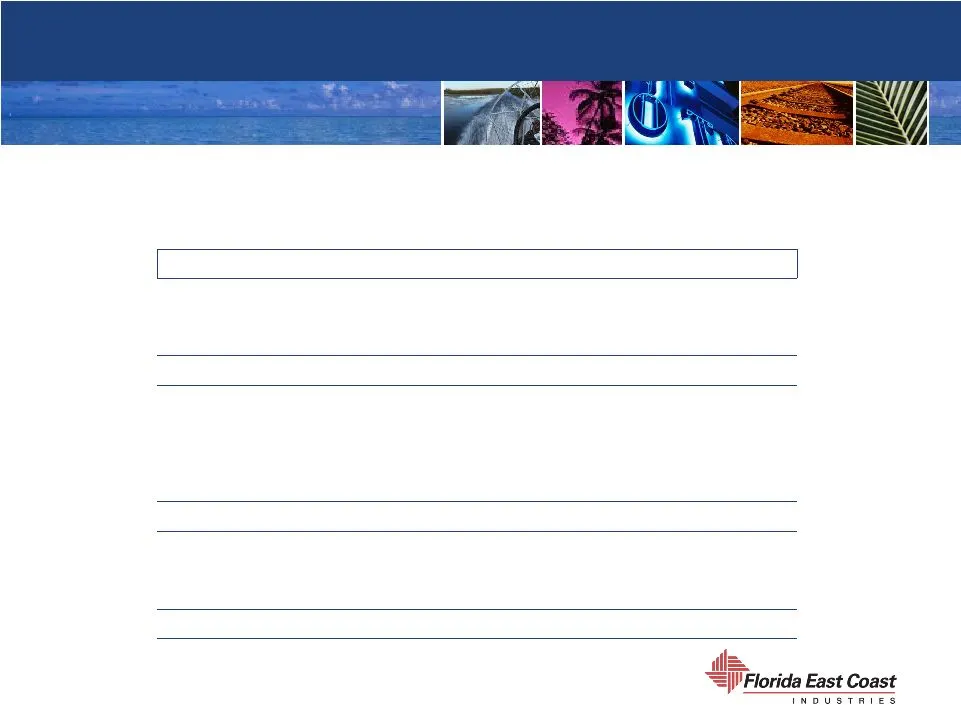
Condensed Consolidated Statements of Cash Flows $56.2 $107.9 Cash and cash equivalents at end of period 126.2 76.0 Cash and cash equivalents at beginning of period (70.0) 31.9 Net increase (decrease) in cash and cash equivalents (1.6) 3.4 Net cash provided by (used in) financing activities 1.2 6.7 O
Slide 35: Adolfo Henriques, Chairman, President & CEO
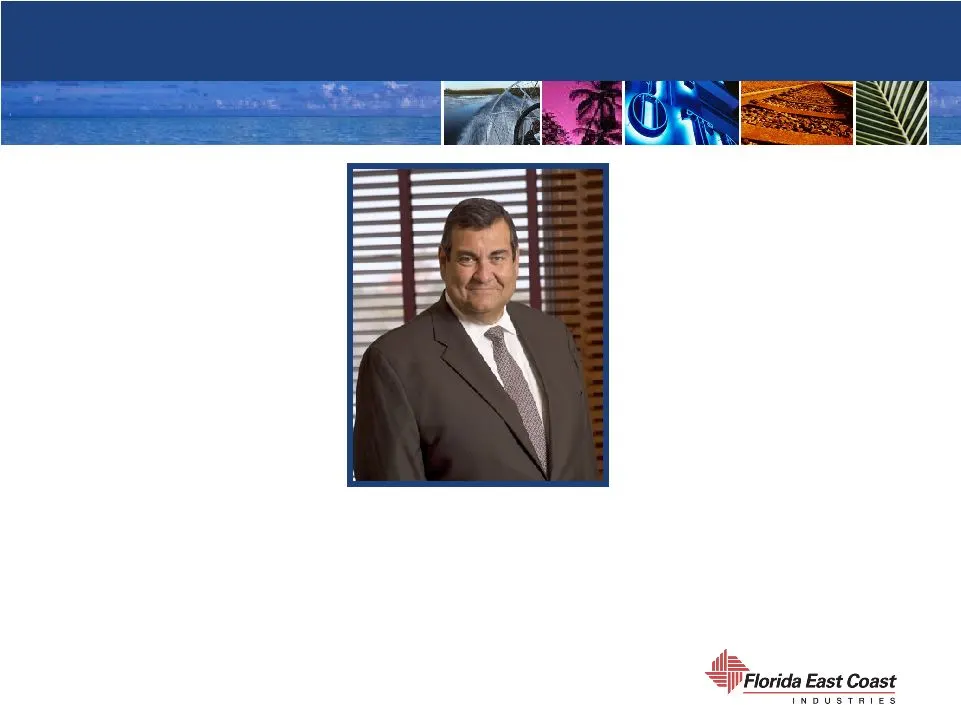
FLORIDA EAST COAST INDUSTRIES, INC. Adolfo Henriques Chairman, President & CEO
Slide 36: Looking Forward
Looking Forward . • Florida economy remains strong • Strategic position provides strong competitive advantage • Expect record results for Railway and rental properties • Codina acquisition enhances our real estate capabilities, adds to asset base and strengthens our team • Railway management team fo
Slide 37: Reconciliation of Non-GAAP to GAAP Measures
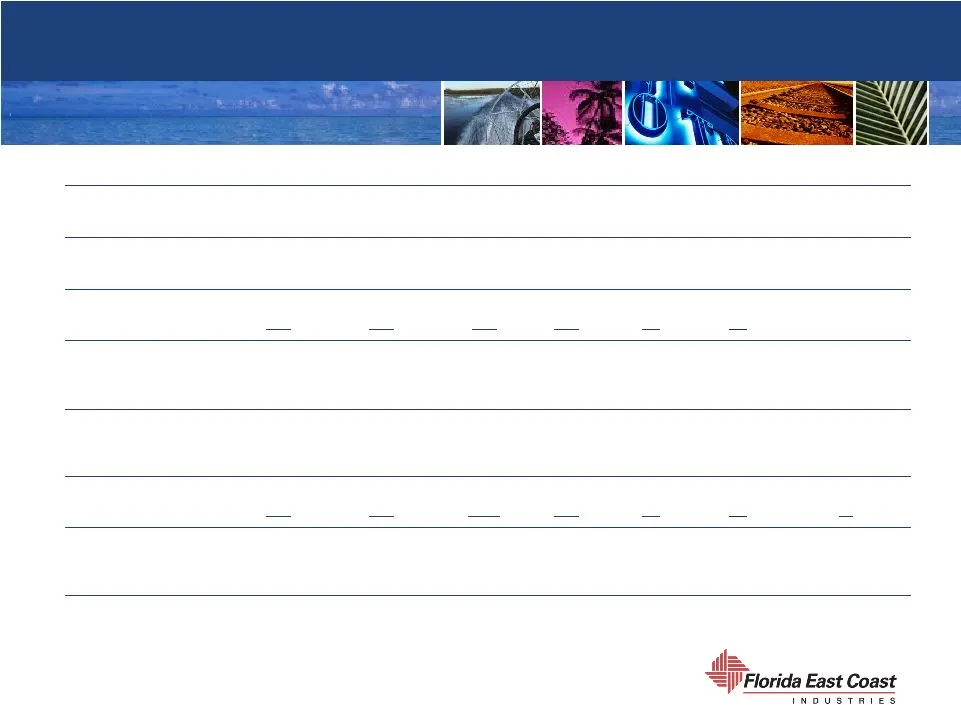
Reconciliation of Non-GAAP to GAAP Measures $13.6 6.1 7.2 $20.4 5.4 $15.0 Q105 $14.4 7.2 7.2 $24.3 5.5 $18.8 Q106 $85.5 $67.5 $62.6 $59.9 Railway Segment ’ s operating profit before depreciation $58-$61 $55.8 $44.8 $40.1 $38.8 Rental properties ’ operating profit before D&A expense 28.2 $23.1 22.3 2
Source: SEC EDGAR · 8-K filed Apr 27, 2006
More decks from Florida East Coast Industries Inc
 Merger or Acquisition (May 2007)15 slides · May 31, 2007
 Q1 2007 Earnings Presentation26 slides · May 9, 2007
 Q4 2006 Earnings Presentation39 slides · Feb 15, 2007
 Q3 2006 Earnings Presentation36 slides · Nov 2, 2006
 Ryan Beck Investor Event (September 2006)80 slides · Sep 13, 2006
 Morgan Keegan 2006 Equity Conference30 slides · Sep 7, 2006