Flutter Entertainment plc · NYSE:FLUT
Flutter Entertainment — Betfair Group — FY2012 Earnings Presentation
51 slides from Flutter Entertainment's earnings presentation, Jun 29, 2012
Slide 1: FY12 Preliminary Results
FY12 PRELIMINARY RESULTS 29 June 2012
Slide 2: Disclaimer
DISCLAIMER This presentation and its contents may not be reproduced, redistributed or passed on, directly or indirectly, to any other person or published, in whole or in part for any purpose without the consent of Betfair Group plc ("Betfair"). This presentation does not constitute or form part of a
Slide 3: Introduction
INTRODUCTION Gerald Corbett – Chairman
Slide 4: Financial Results
FINANCIAL RESULTS Niall Dore - Finance Director
Slide 5: Financial Summary Y/E April 2012
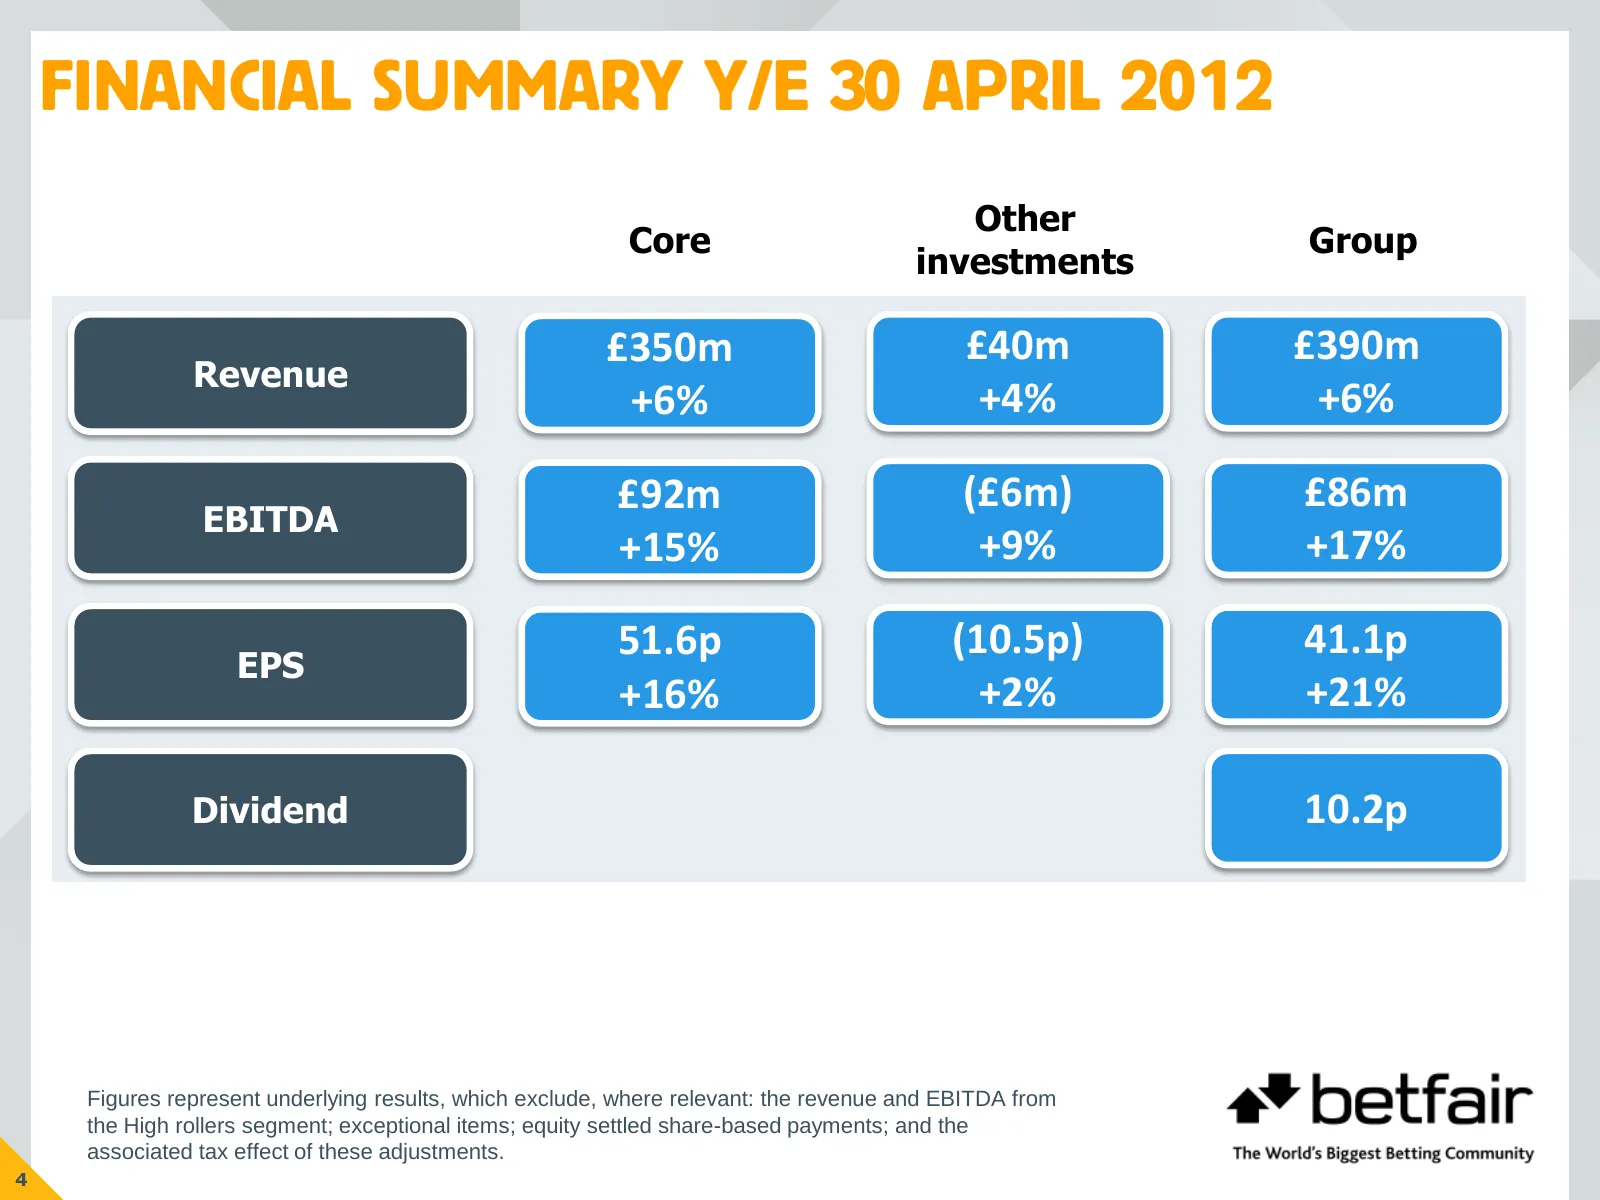
FINANCIAL SUMMARY Y/E 30 APRIL 2012 Other Core Group investments £350m £40m £390m Revenue +6% +4% +6% £92m (£6m) £86m EBITDA +15% +9% +17% 51.6p (10.5p) 41.1p EPS +16% +2% +21% Dividend 10.2p Figures represent underlying results, which exclude, where relevant: the revenue and EBITDA from the High ro
Slide 6: Core Betfair: Q4 Revenue
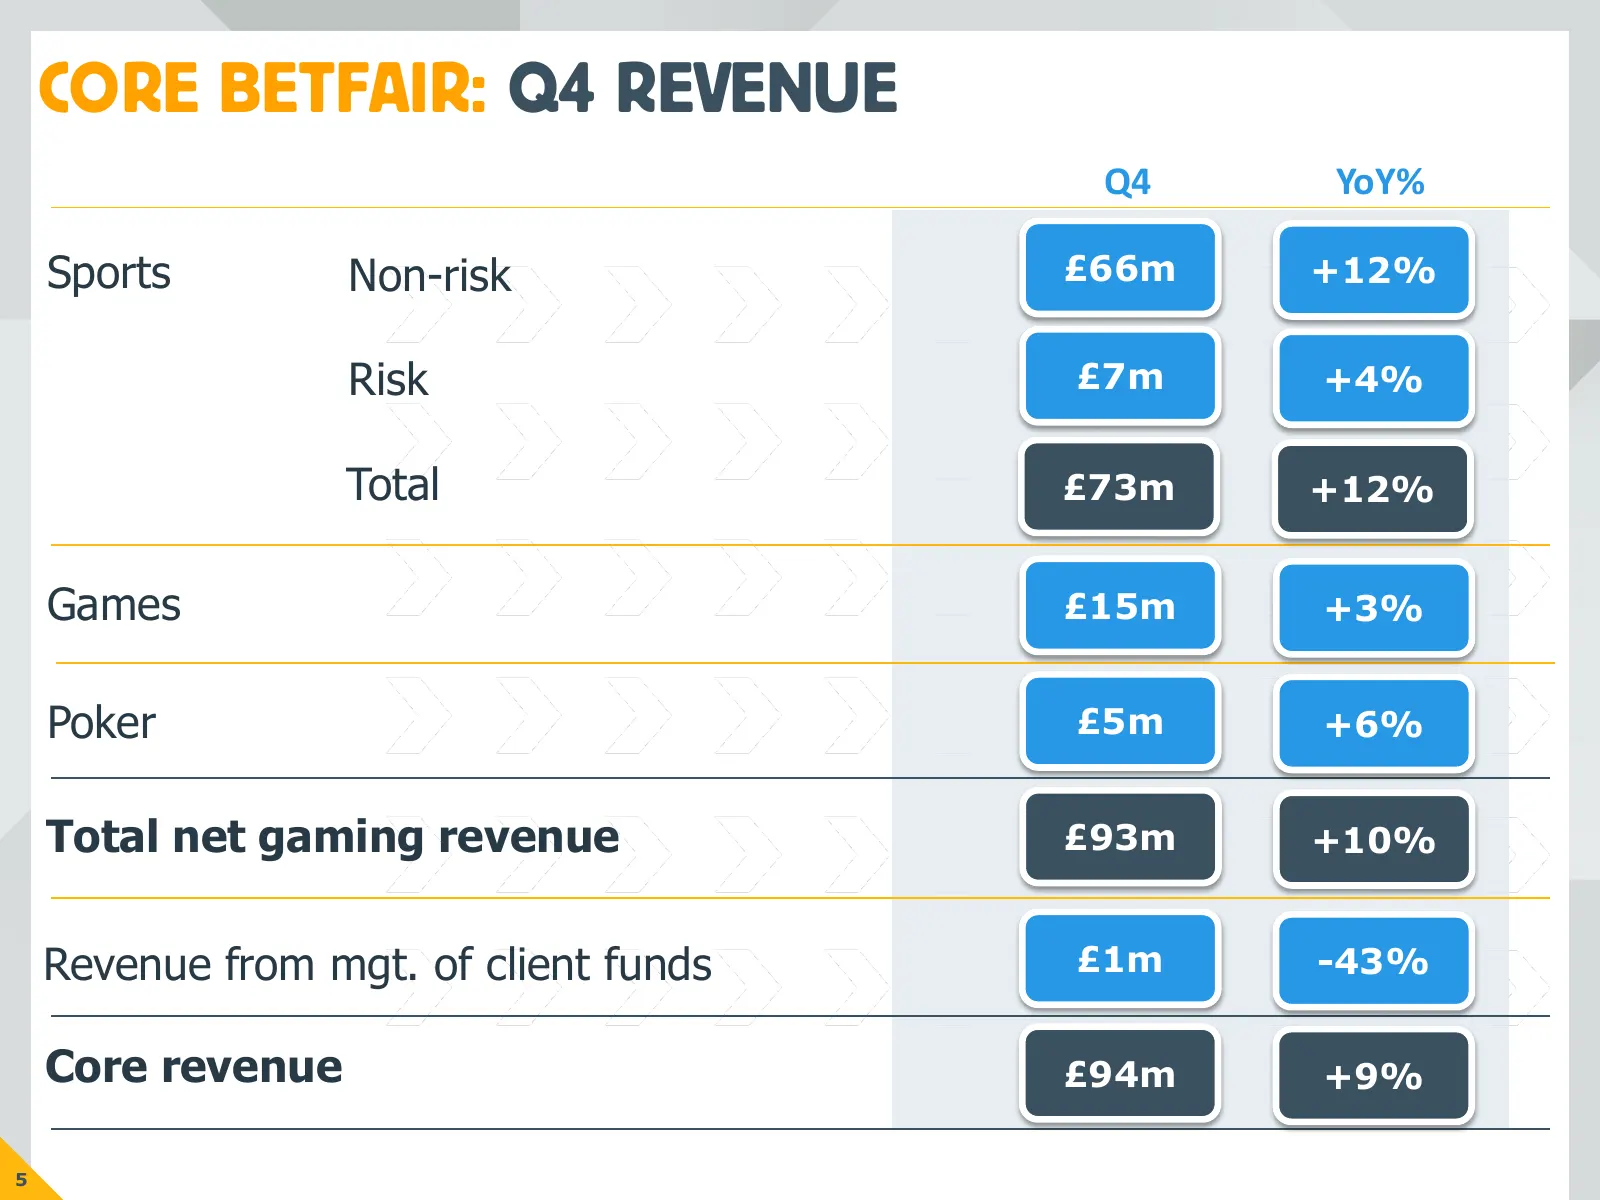
CORE BETFAIR: Q4 REVENUE Q4 YoY% Sports Non-risk £66m +12% Risk £7m +4% Total £73m +12% Games £15m +3% Poker £5m +6% Total net gaming revenue £93m +10% Revenue from mgt. of client funds £1m -43% Core revenue £94m +9% 5
Slide 7: Core Betfair: Quarterly NGR Growth
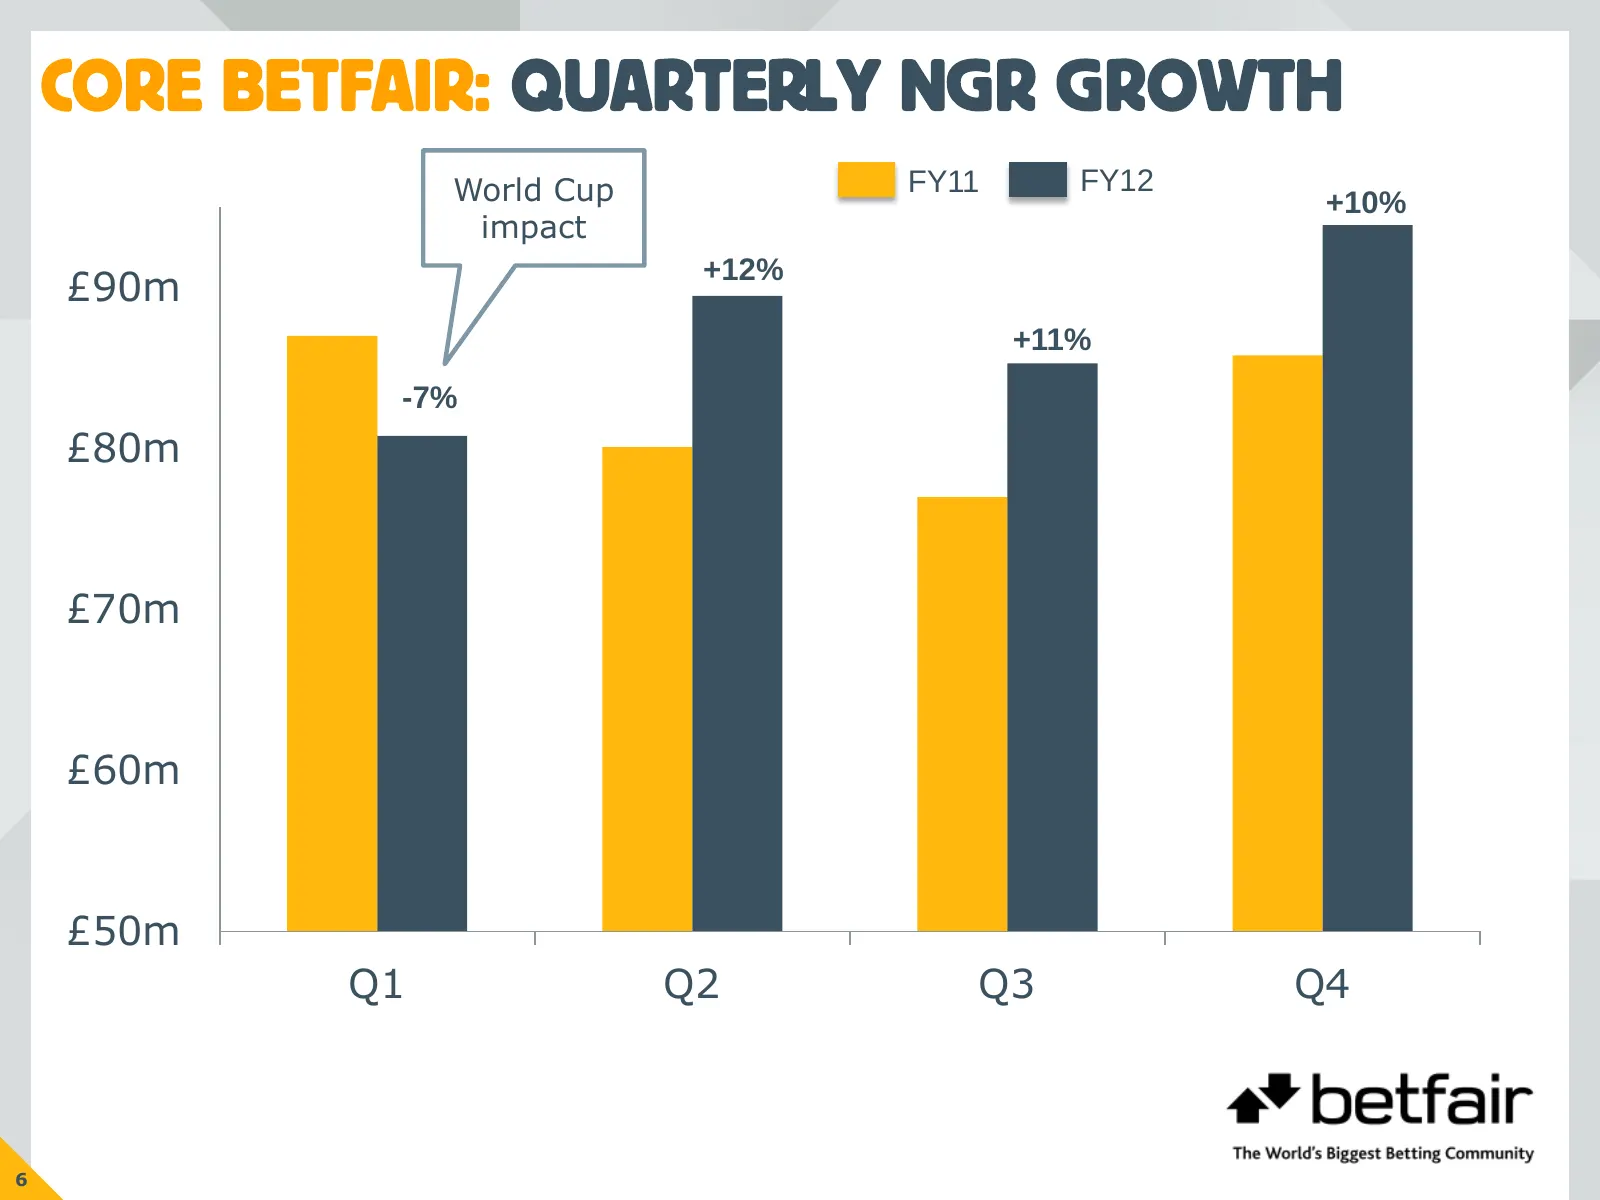
CORE BETFAIR: QUARTERLY NGR GROWTH World Cup FY11 FY12 +10% impact +12% £90m +11% -7% £80m £70m £60m £50m Q1 Q2 Q3 Q4 6
Slide 8: Core Betfair: FY12 Revenue
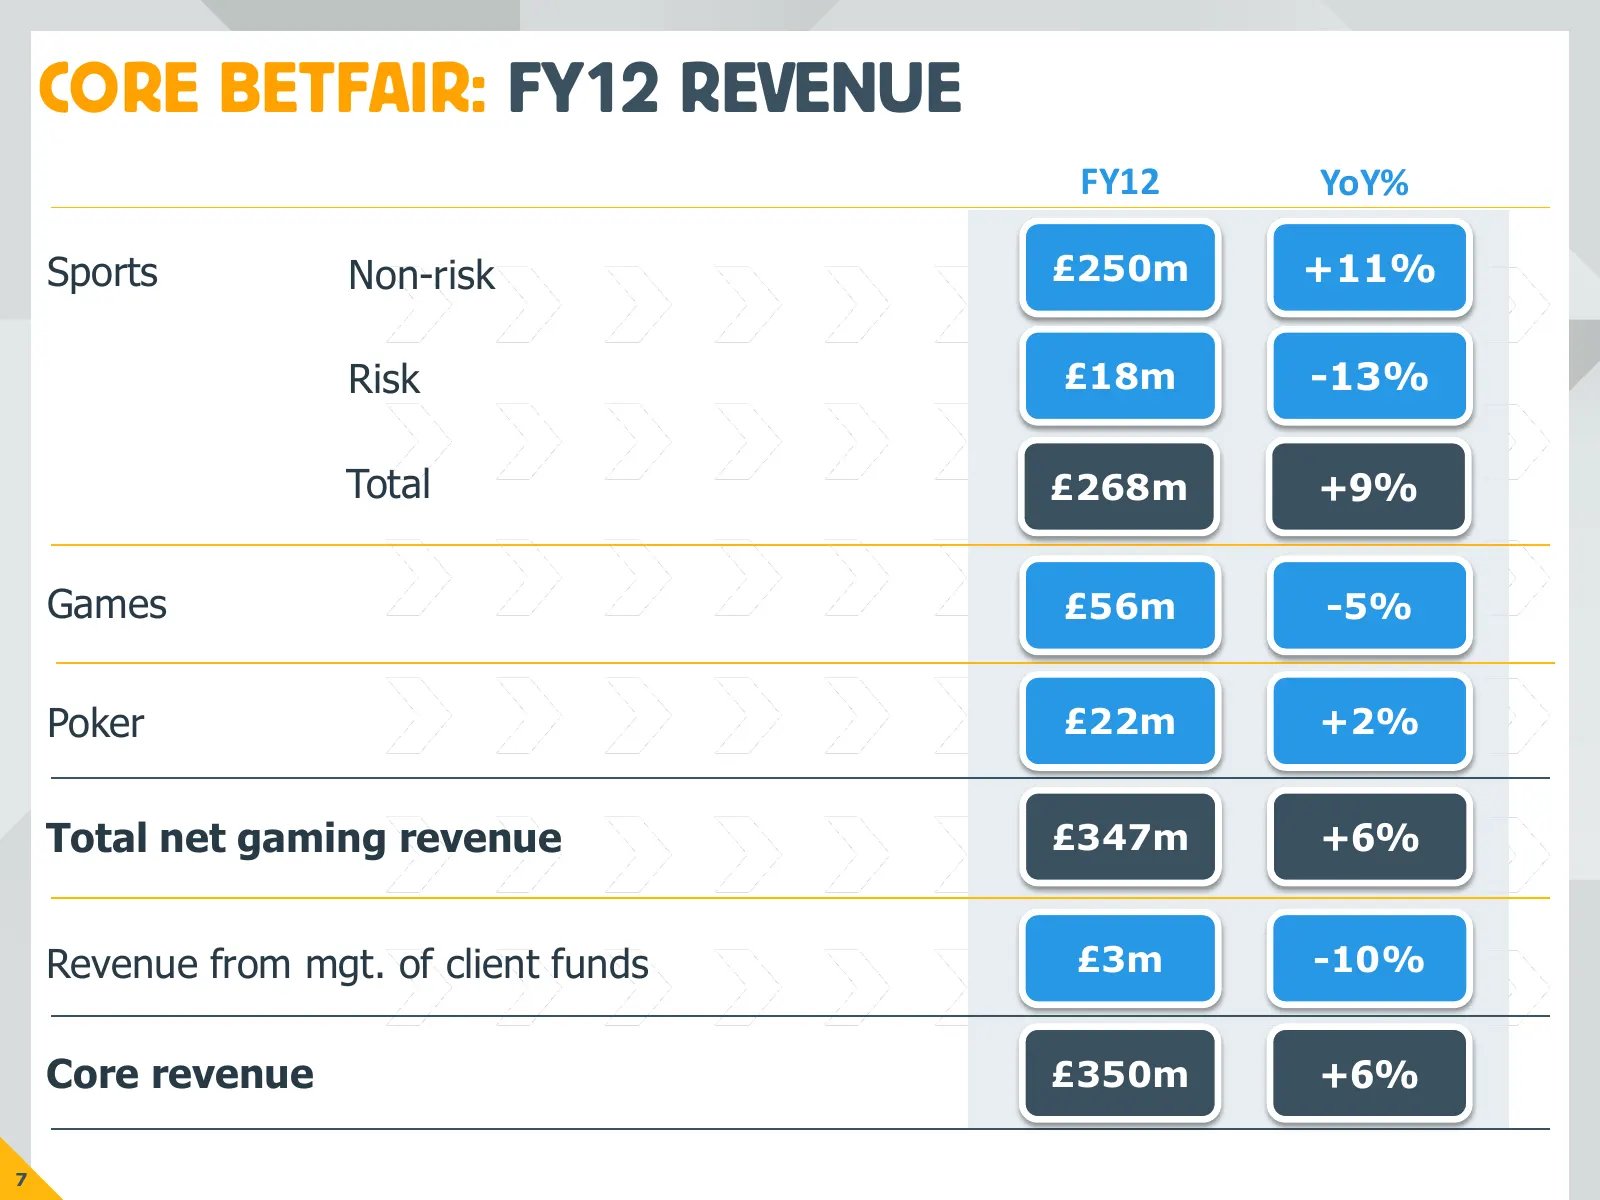
CORE BETFAIR: FY12 REVENUE FY12 YoY% Sports Non-risk £250m +11% Risk £18m -13% Total £268m +9% Games £56m -5% Poker £22m +2% Total net gaming revenue £347m +6% Revenue from mgt. of client funds £3m -10% Core revenue £350m +6% 7
Slide 9: Core Betfair: Italy
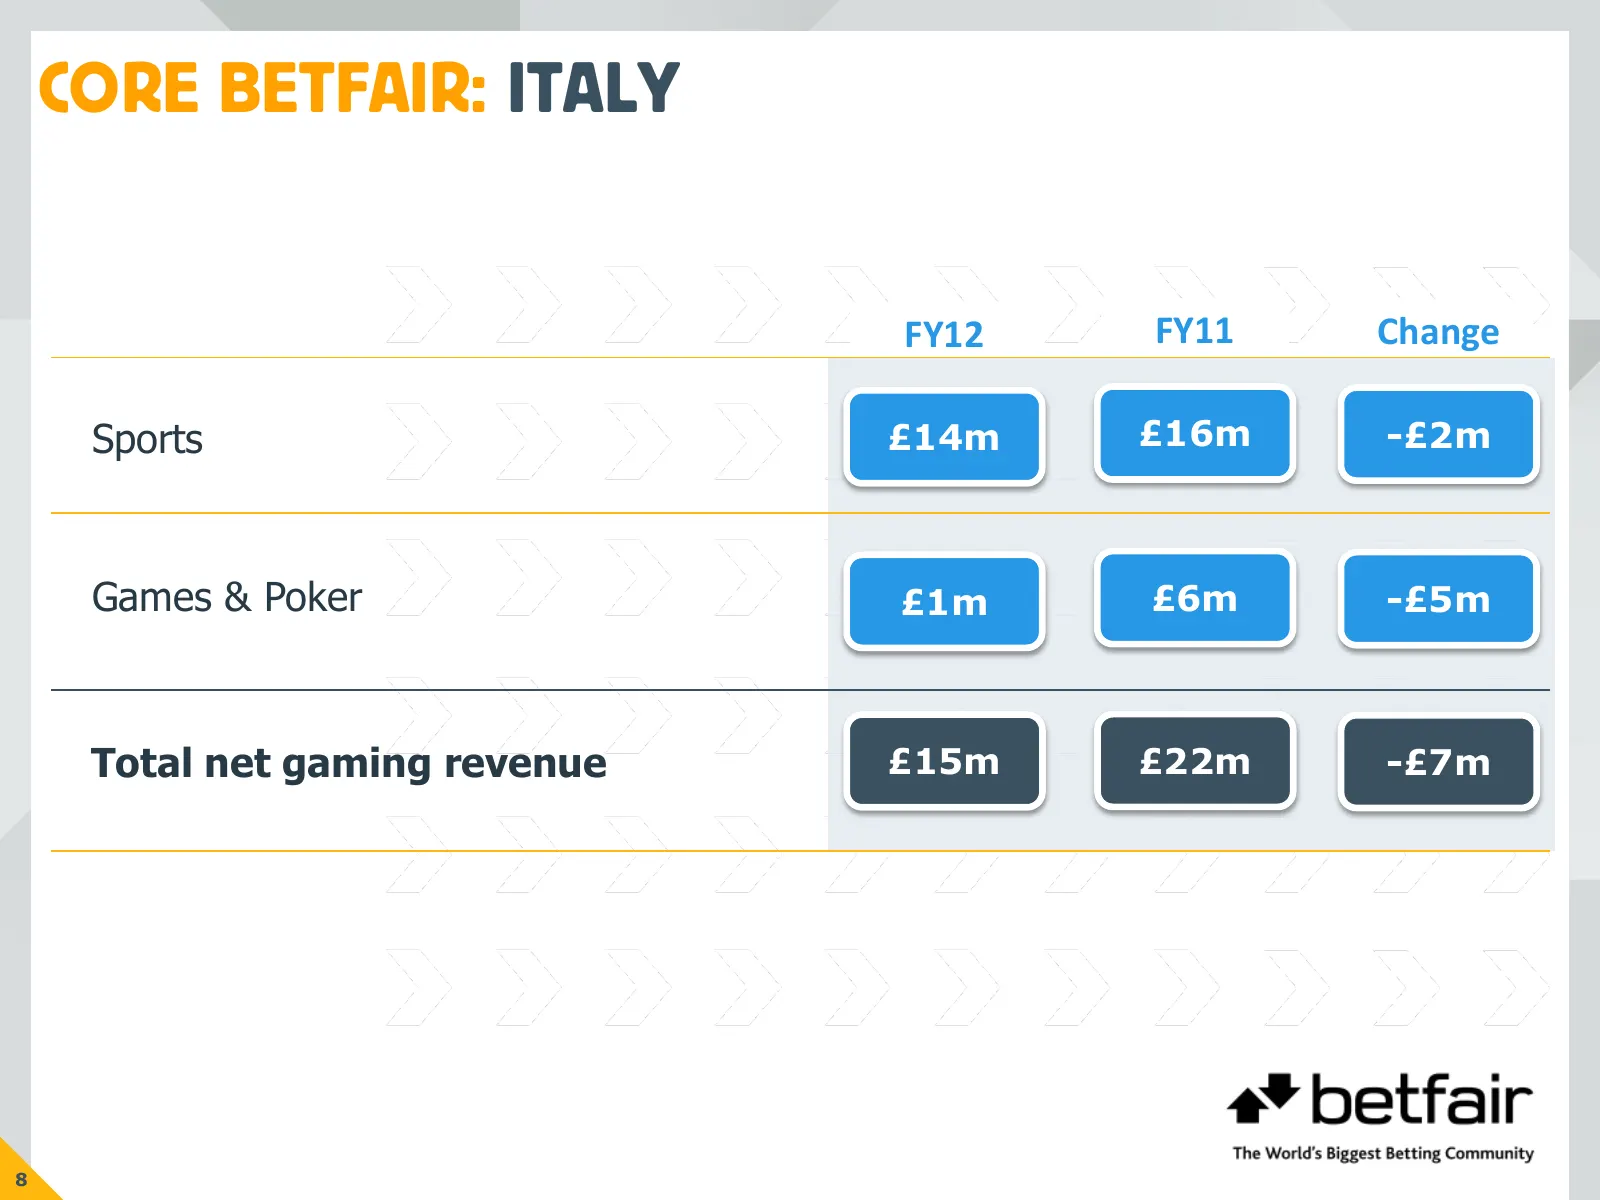
CORE BETFAIR: ITALY FY12 FY11 Change Sports £14m £16m -£2m Games & Poker £1m £6m -£5m Total net gaming revenue £15m £22m -£7m 8
Slide 10: Core Betfair: EBITDA Bridge
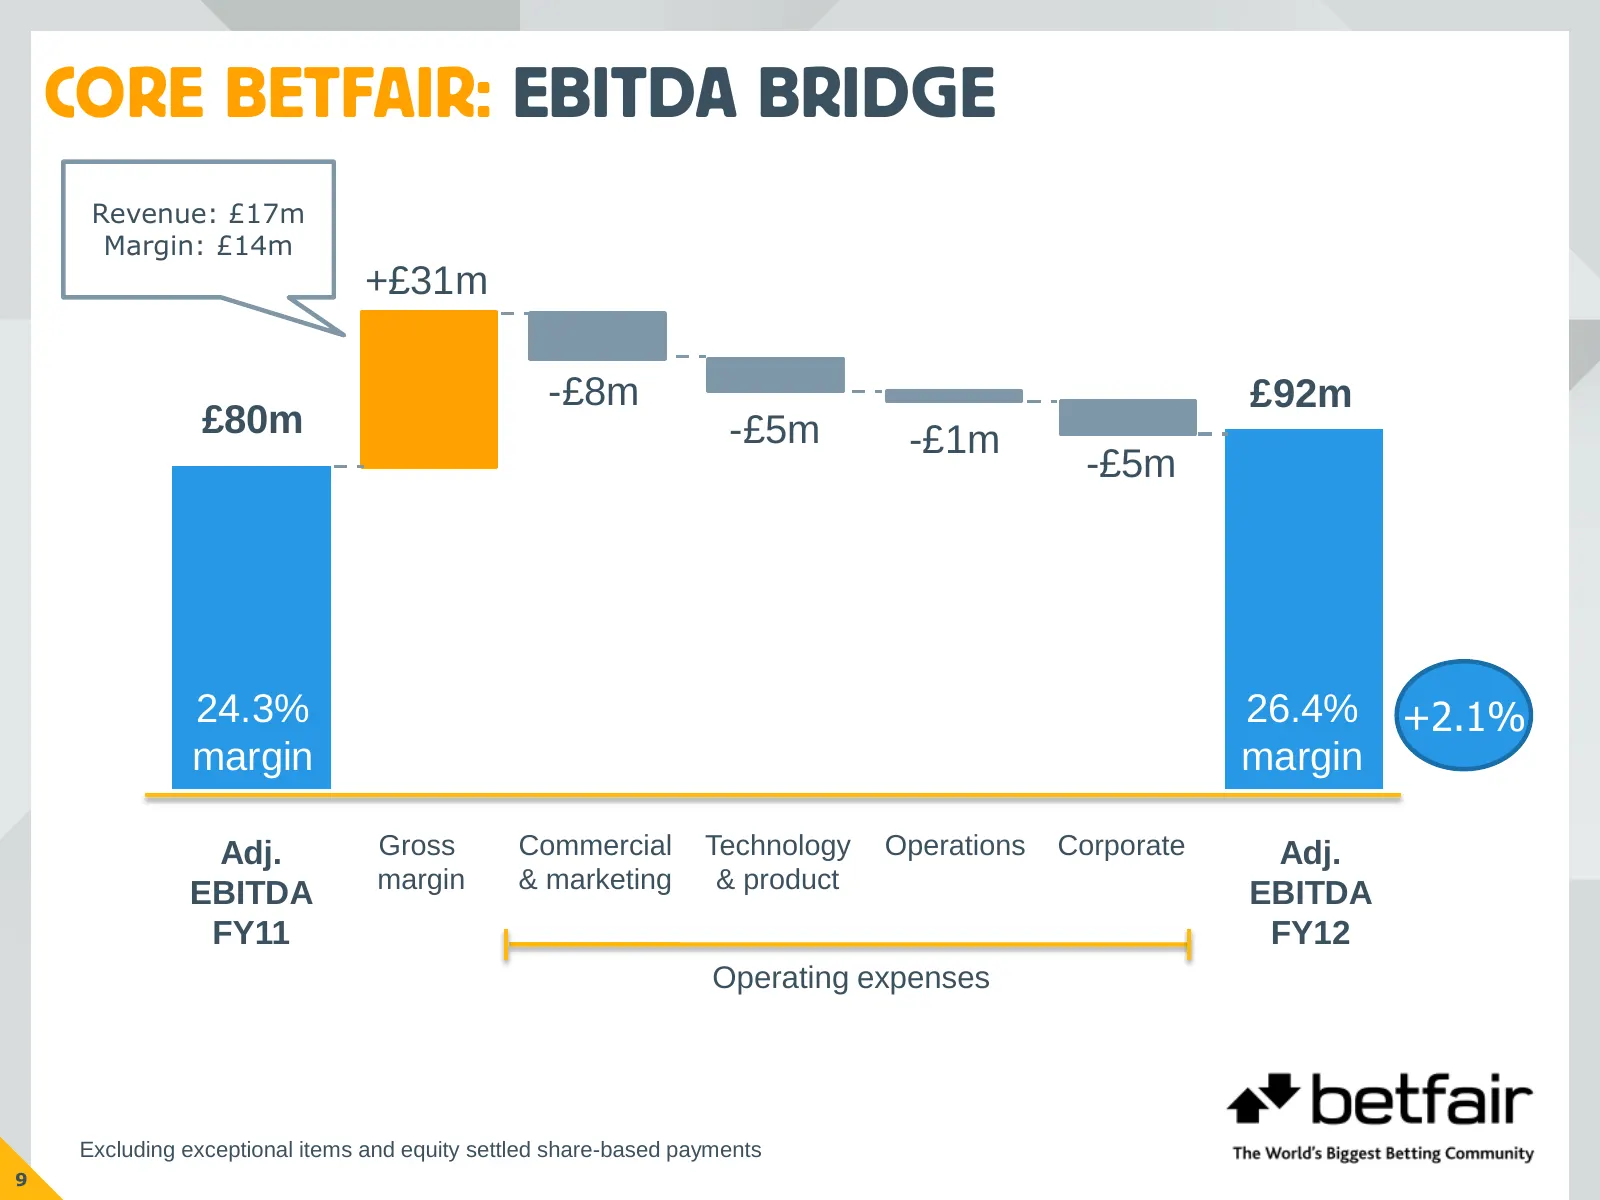
CORE BETFAIR: EBITDA BRIDGE Revenue: £17m Margin: £14m +£31m -£8m £92m £80m -£5m -£1m -£5m 24.3% 26.4% +2.1% margin margin Adj. Gross Commercial Technology Operations Corporate Adj. EBITDA margin & marketing & product EBITDA FY11 FY12 Operating expenses Excluding exceptional items and equity settled
Slide 11: Other Investments: Betfair US
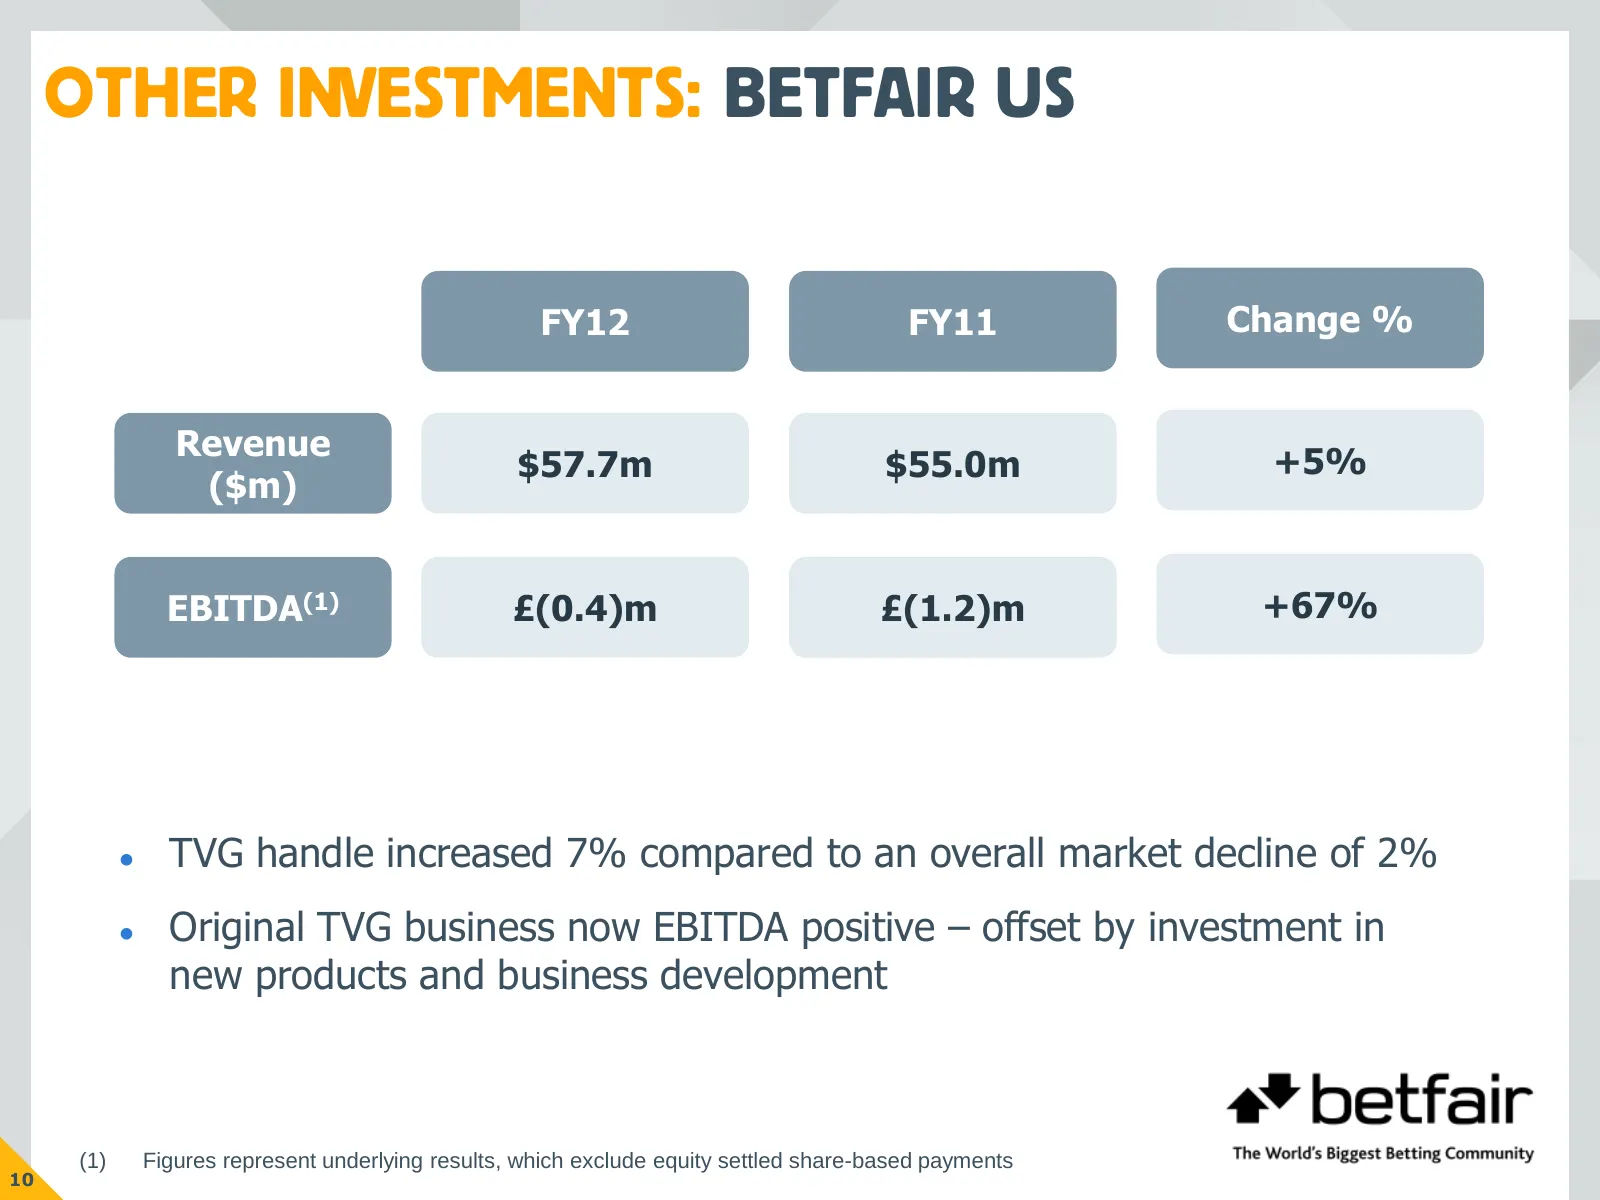
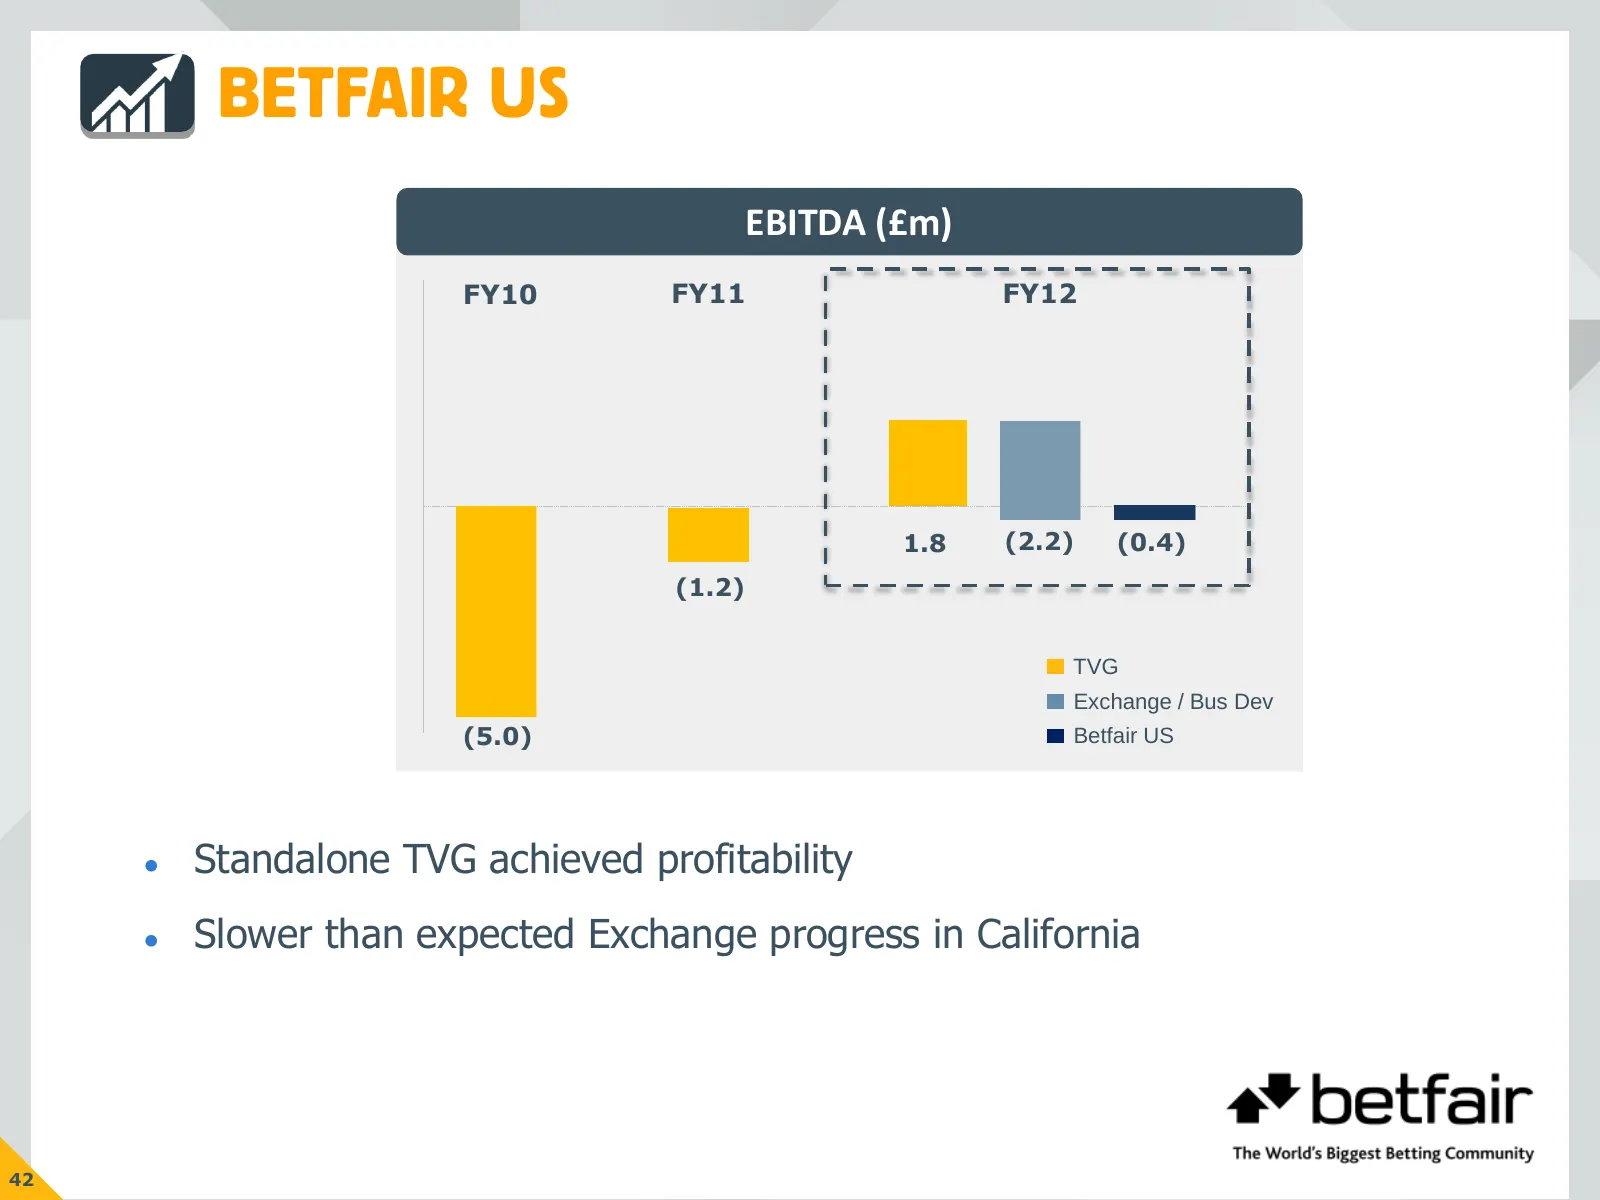
OTHER INVESTMENTS: BETFAIR US FY12 FY11 Change % Revenue $57.7m $55.0m +5% ($m) EBITDA(1) £(0.4)m £(1.2)m +67% TVG handle increased 7% compared to an overall market decline of 2% Original TVG business now EBITDA positive – offset by investment in new products and business development (1) Figures
Slide 12: Other Investments: LMAX
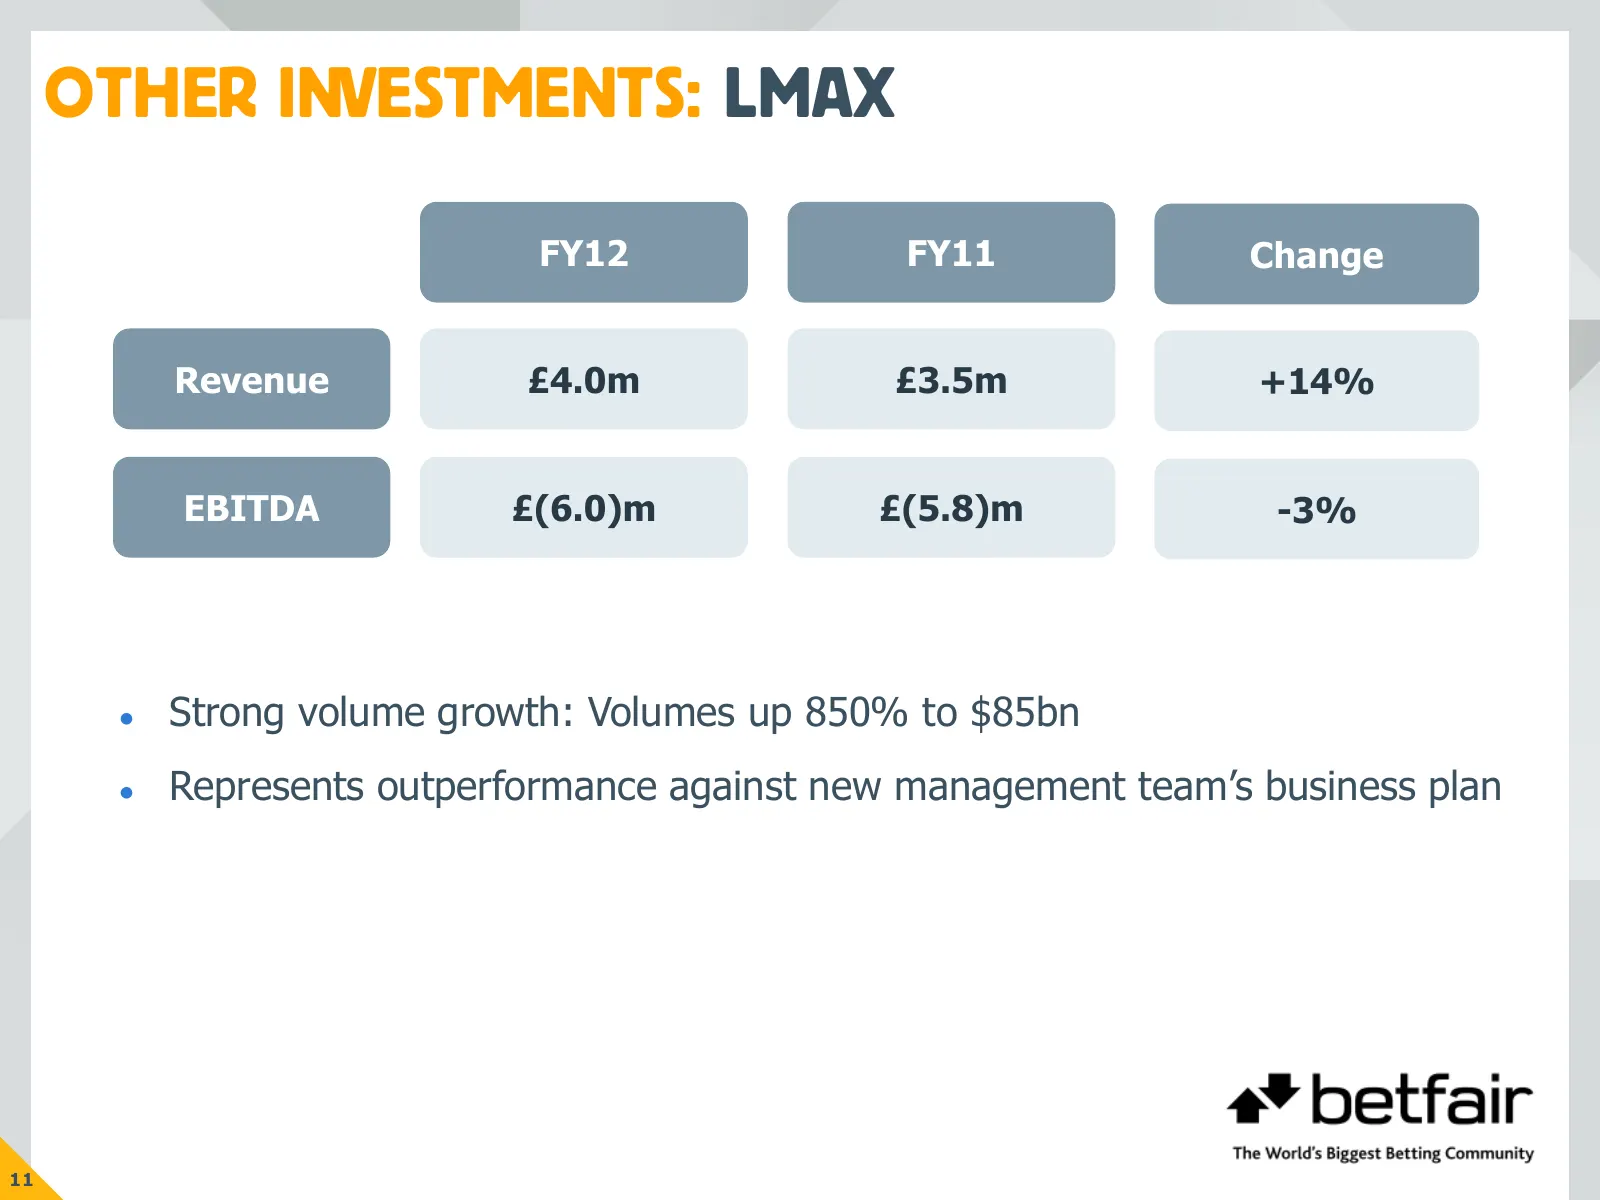
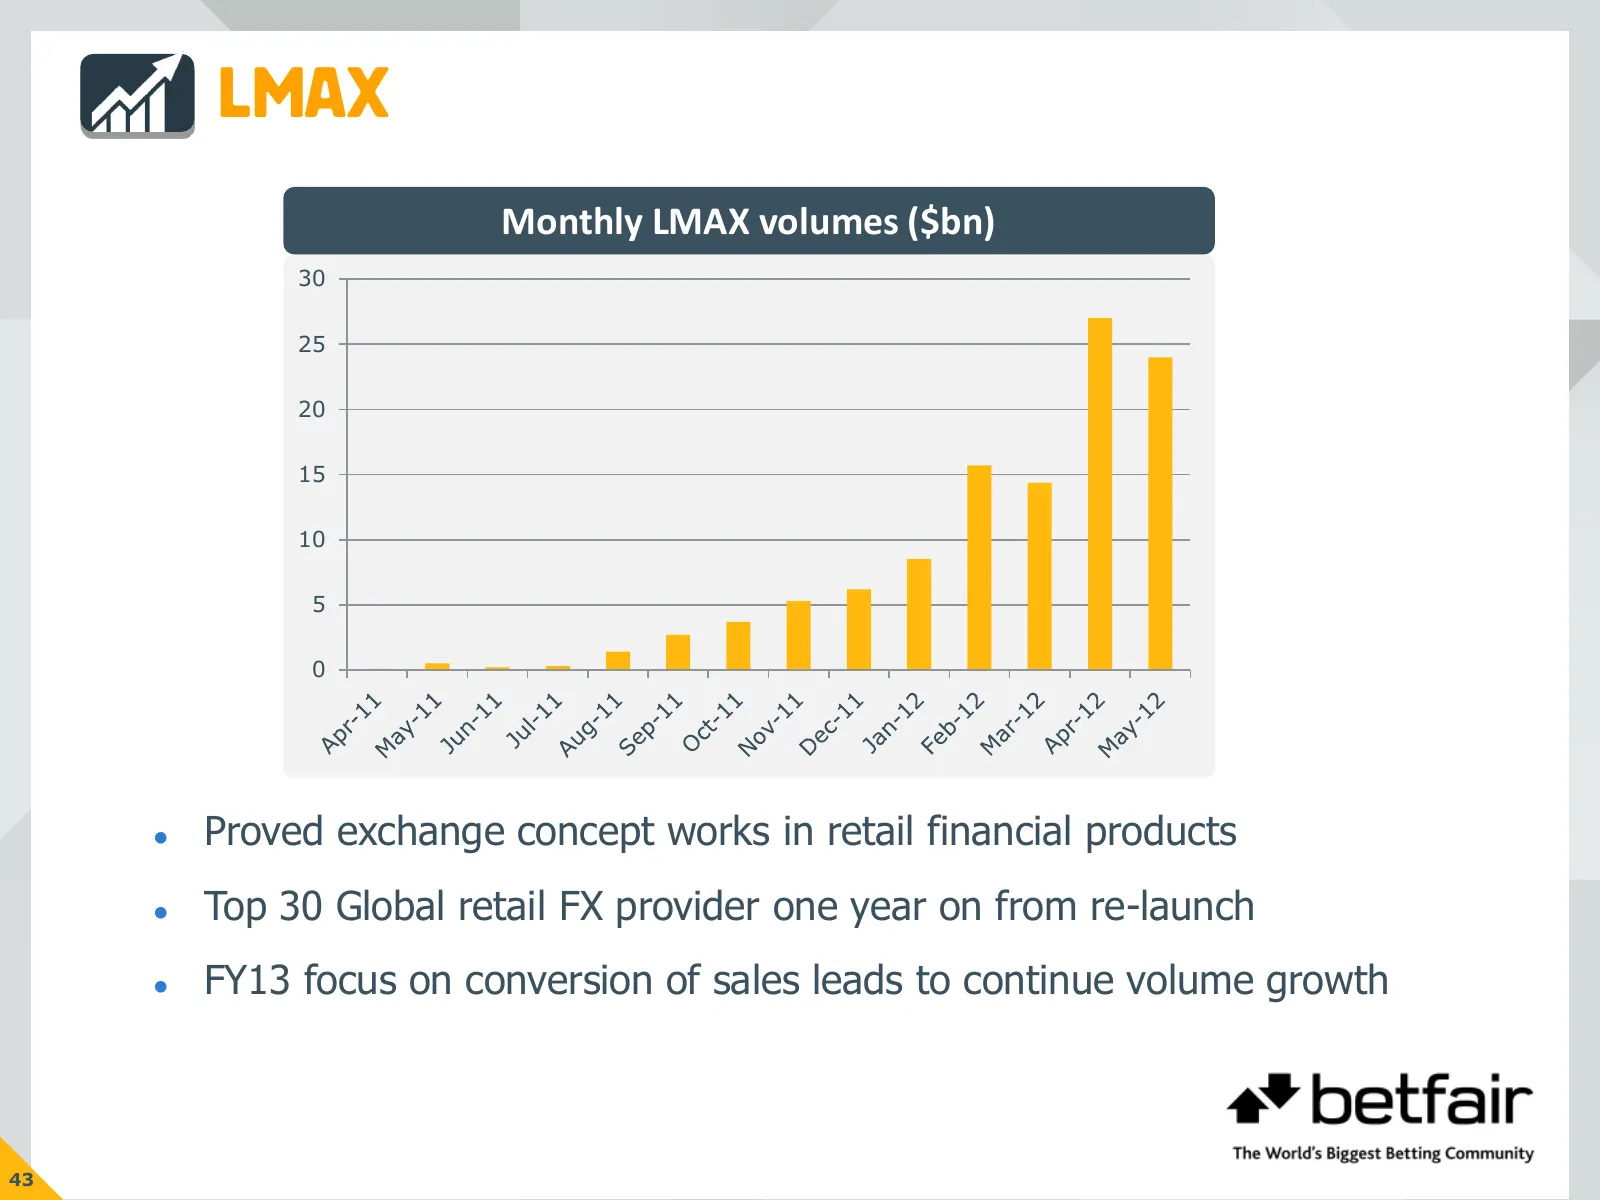
OTHER INVESTMENTS: LMAX FY12 FY11 Change Revenue £4.0m £3.5m +14% EBITDA £(6.0)m £(5.8)m -3% Strong volume growth: Volumes up 850% to $85bn Represents outperformance against new management team’s business plan 11
Slide 13: Betfair Australia
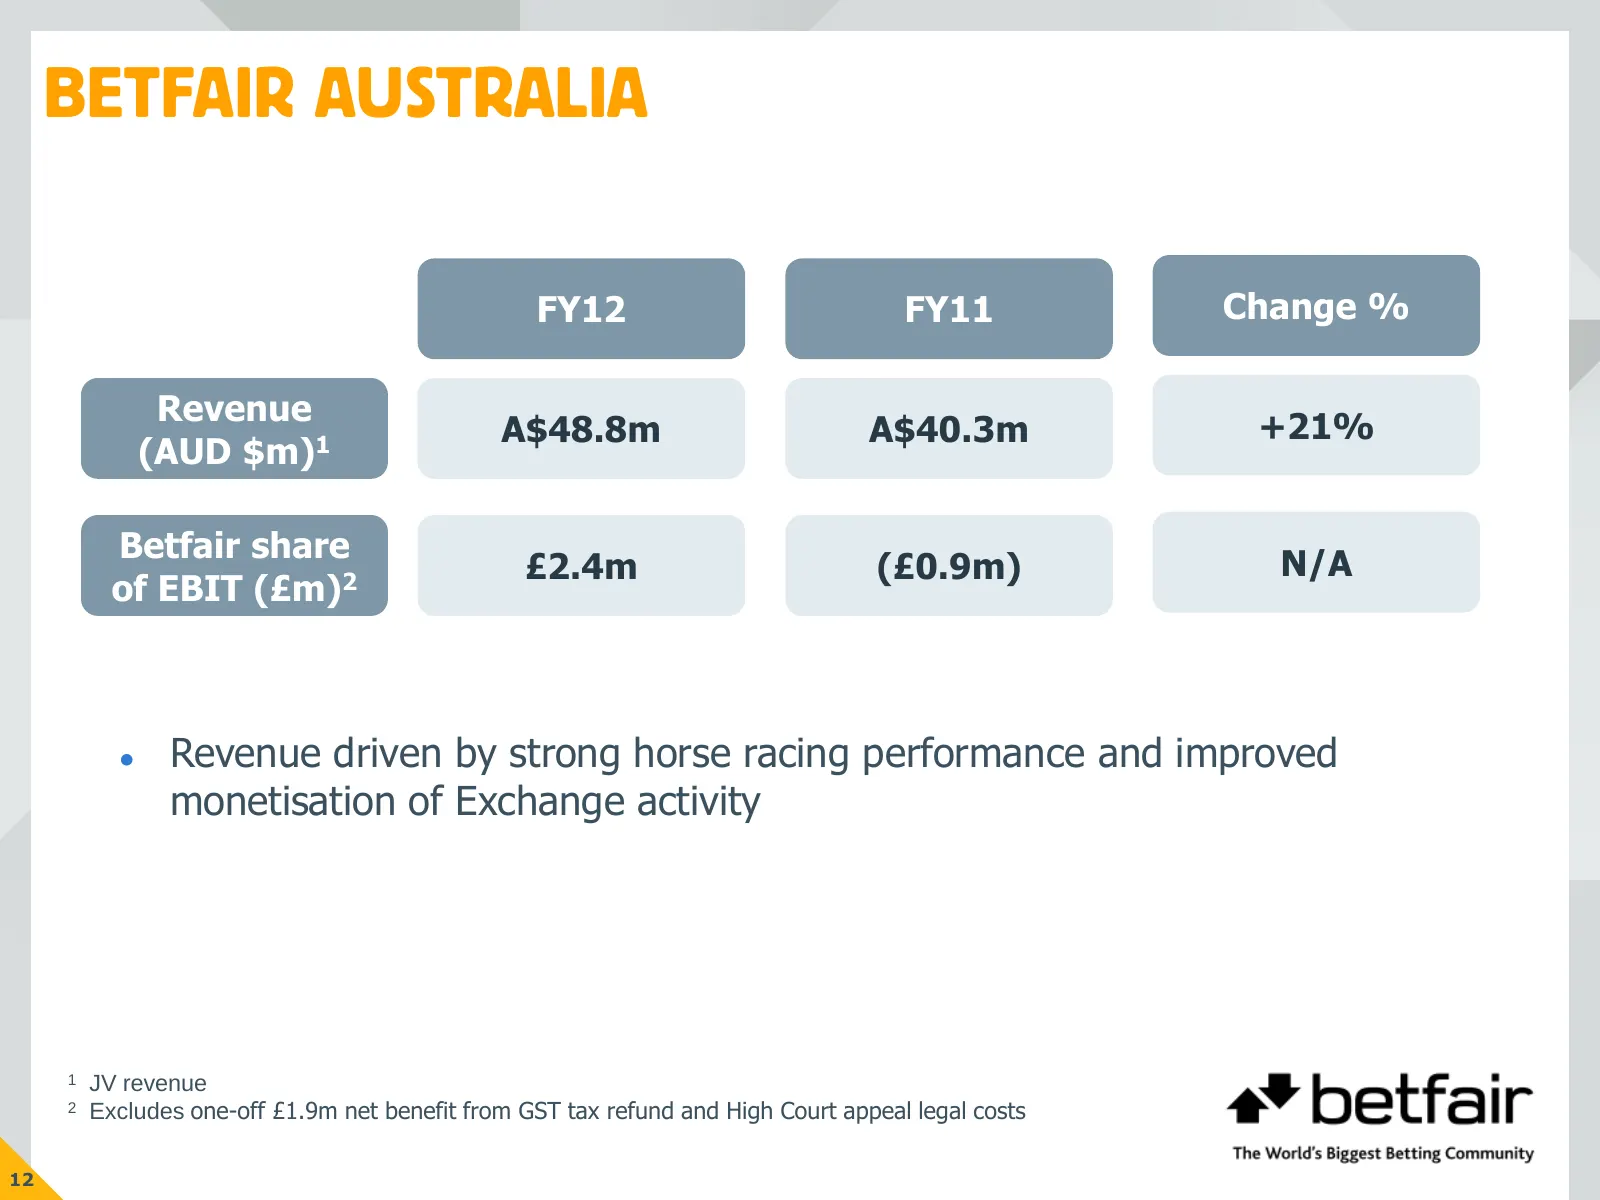
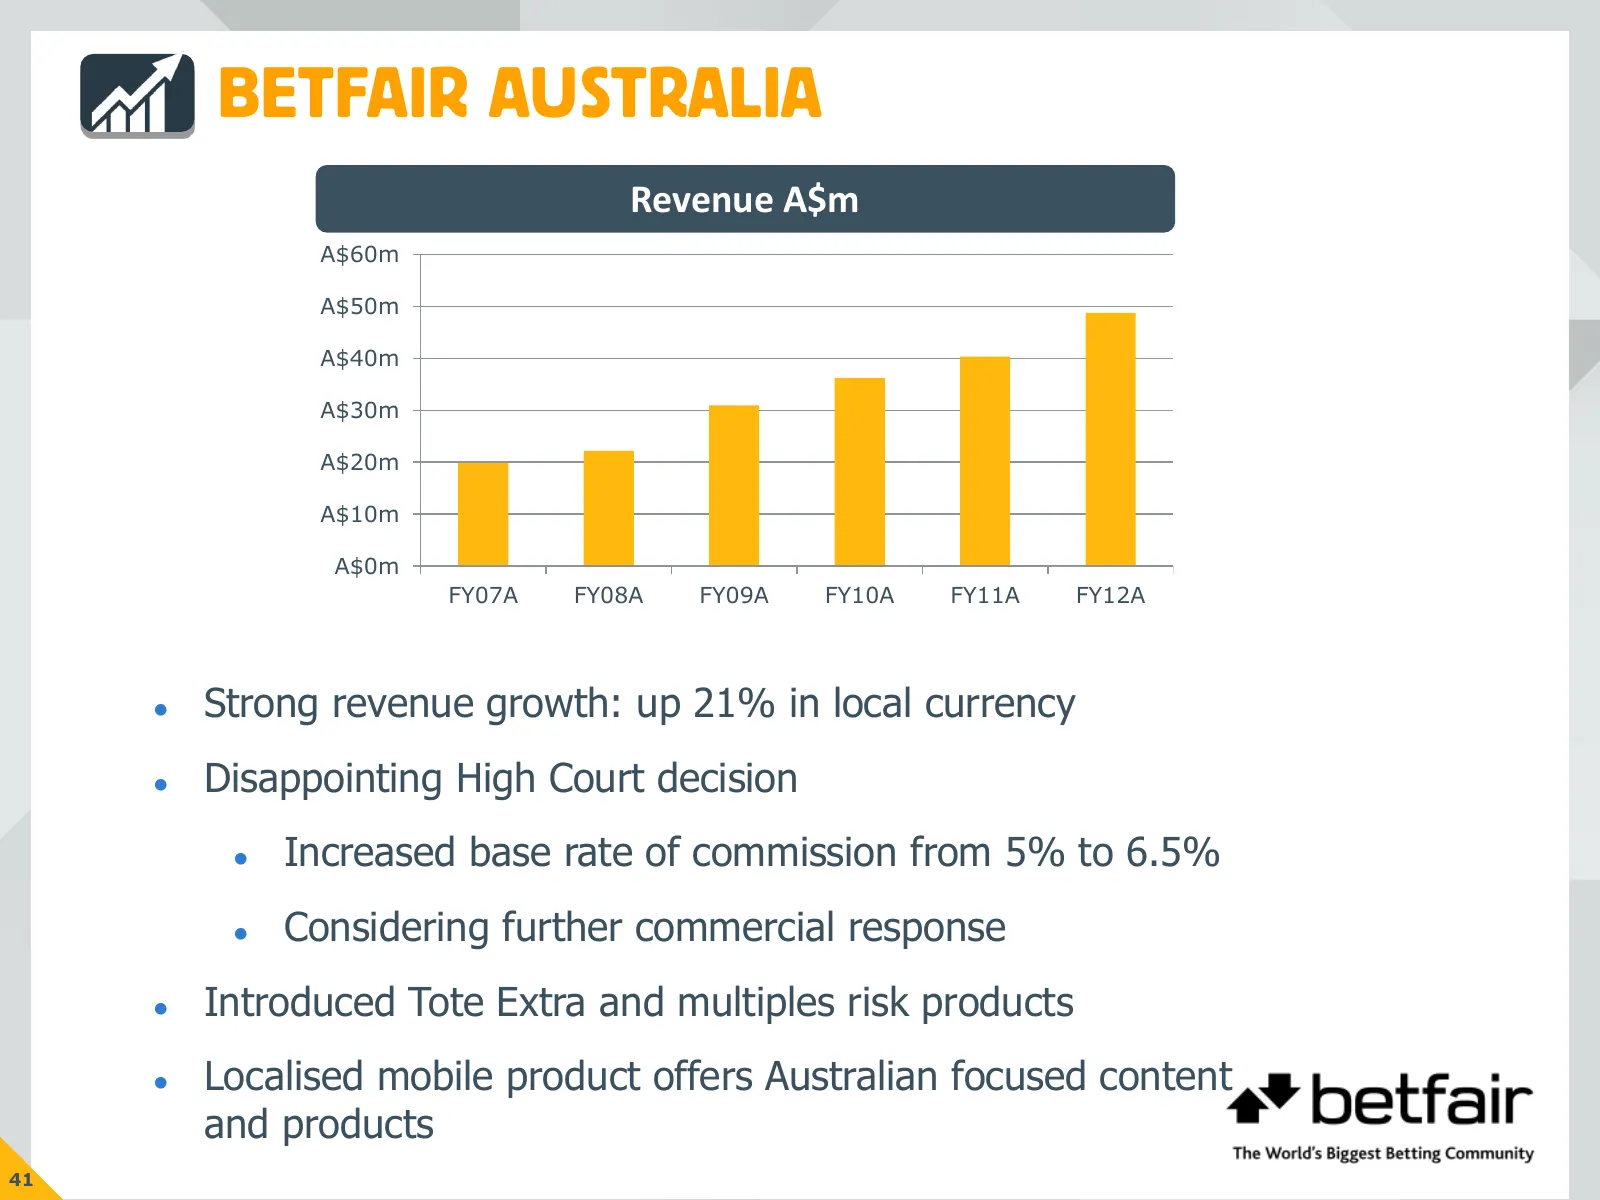
BETFAIR AUSTRALIA FY12 FY11 Change % Revenue A$48.8m A$40.3m +21% (AUD $m)1 Betfair share £2.4m (£0.9m) N/A of EBIT (£m)2 Revenue driven by strong horse racing performance and improved monetisation of Exchange activity 1 JV revenue 2 Excludes one-off £1.9m net benefit from GST tax refund and High
Slide 14: Capex and Depreciation
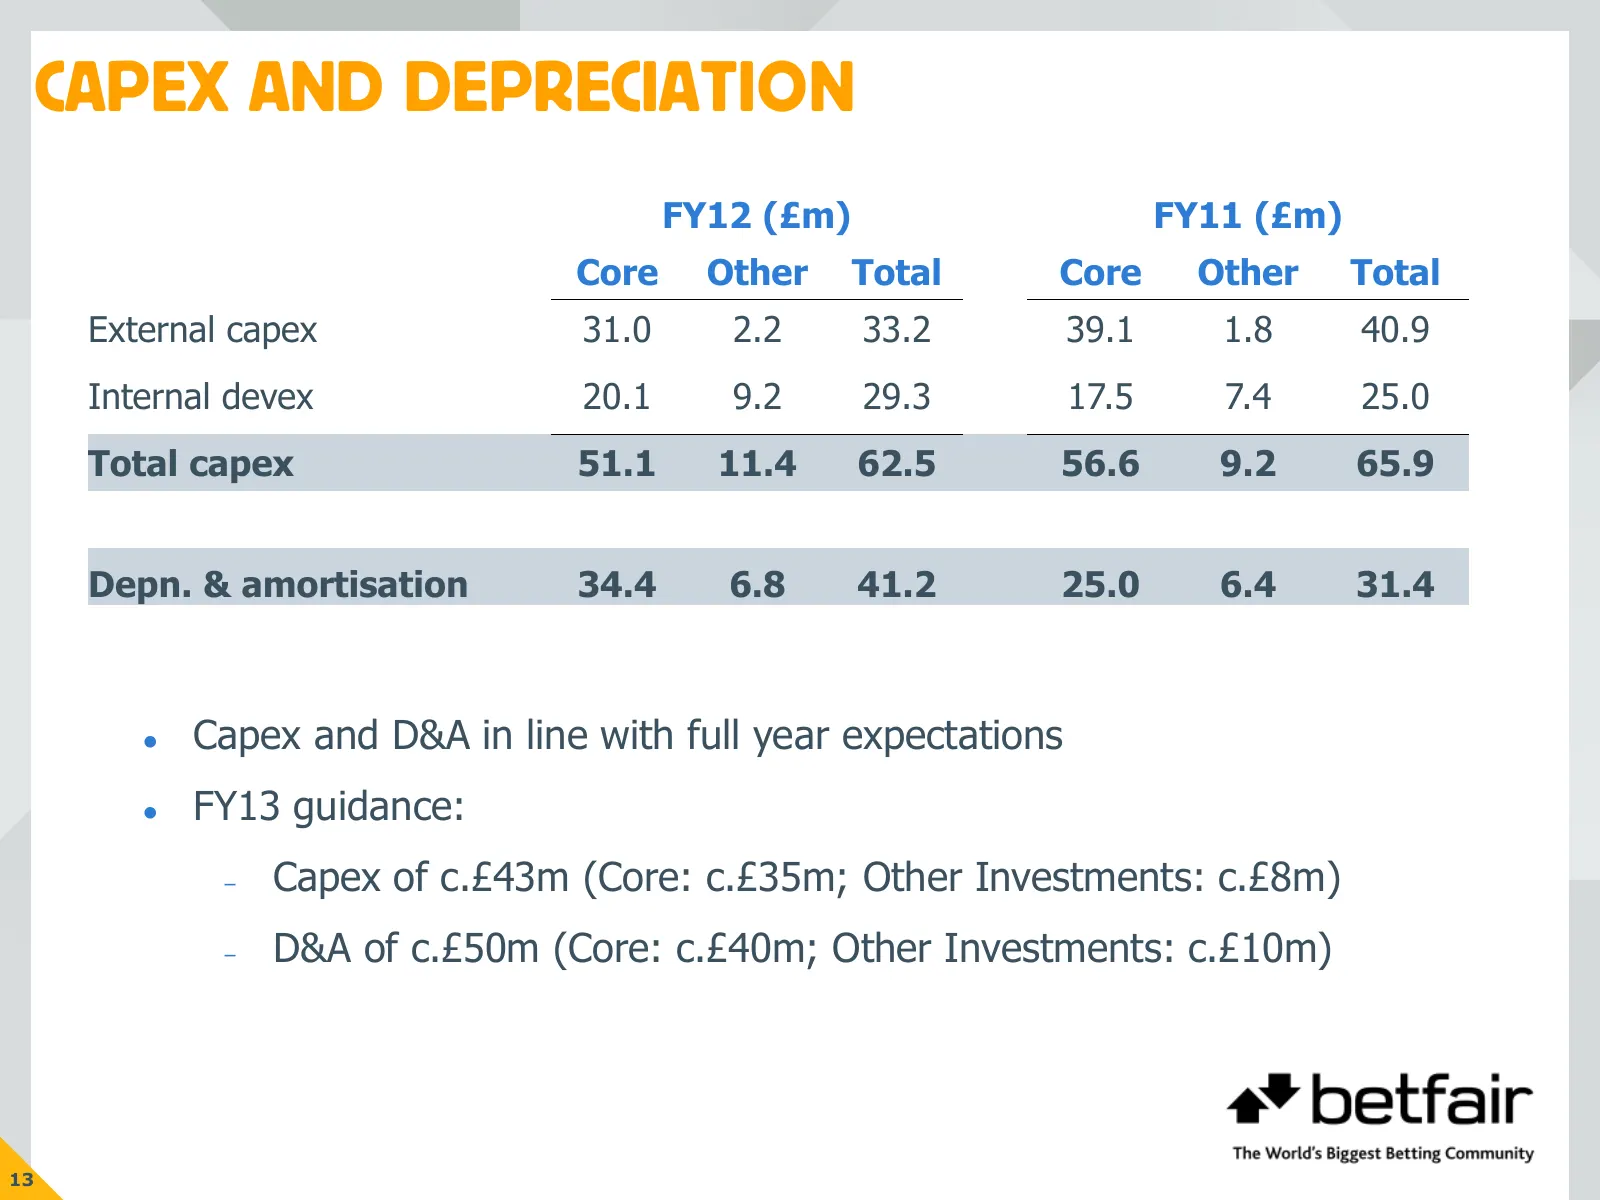
CAPEX AND DEPRECIATION FY12 (£m) FY11 (£m) Core Other Total Core Other Total External capex 31.0 2.2 33.2 39.1 1.8 40.9 Internal devex 20.1 9.2 29.3 17.5 7.4 25.0 Total capex 51.1 11.4 62.5 56.6 9.2 65.9 Depn. & amortisation 34.4 6.8 41.2 25.0 6.4 31.4 Capex and D&A in line with full year expectat
Slide 15: Cash Flow
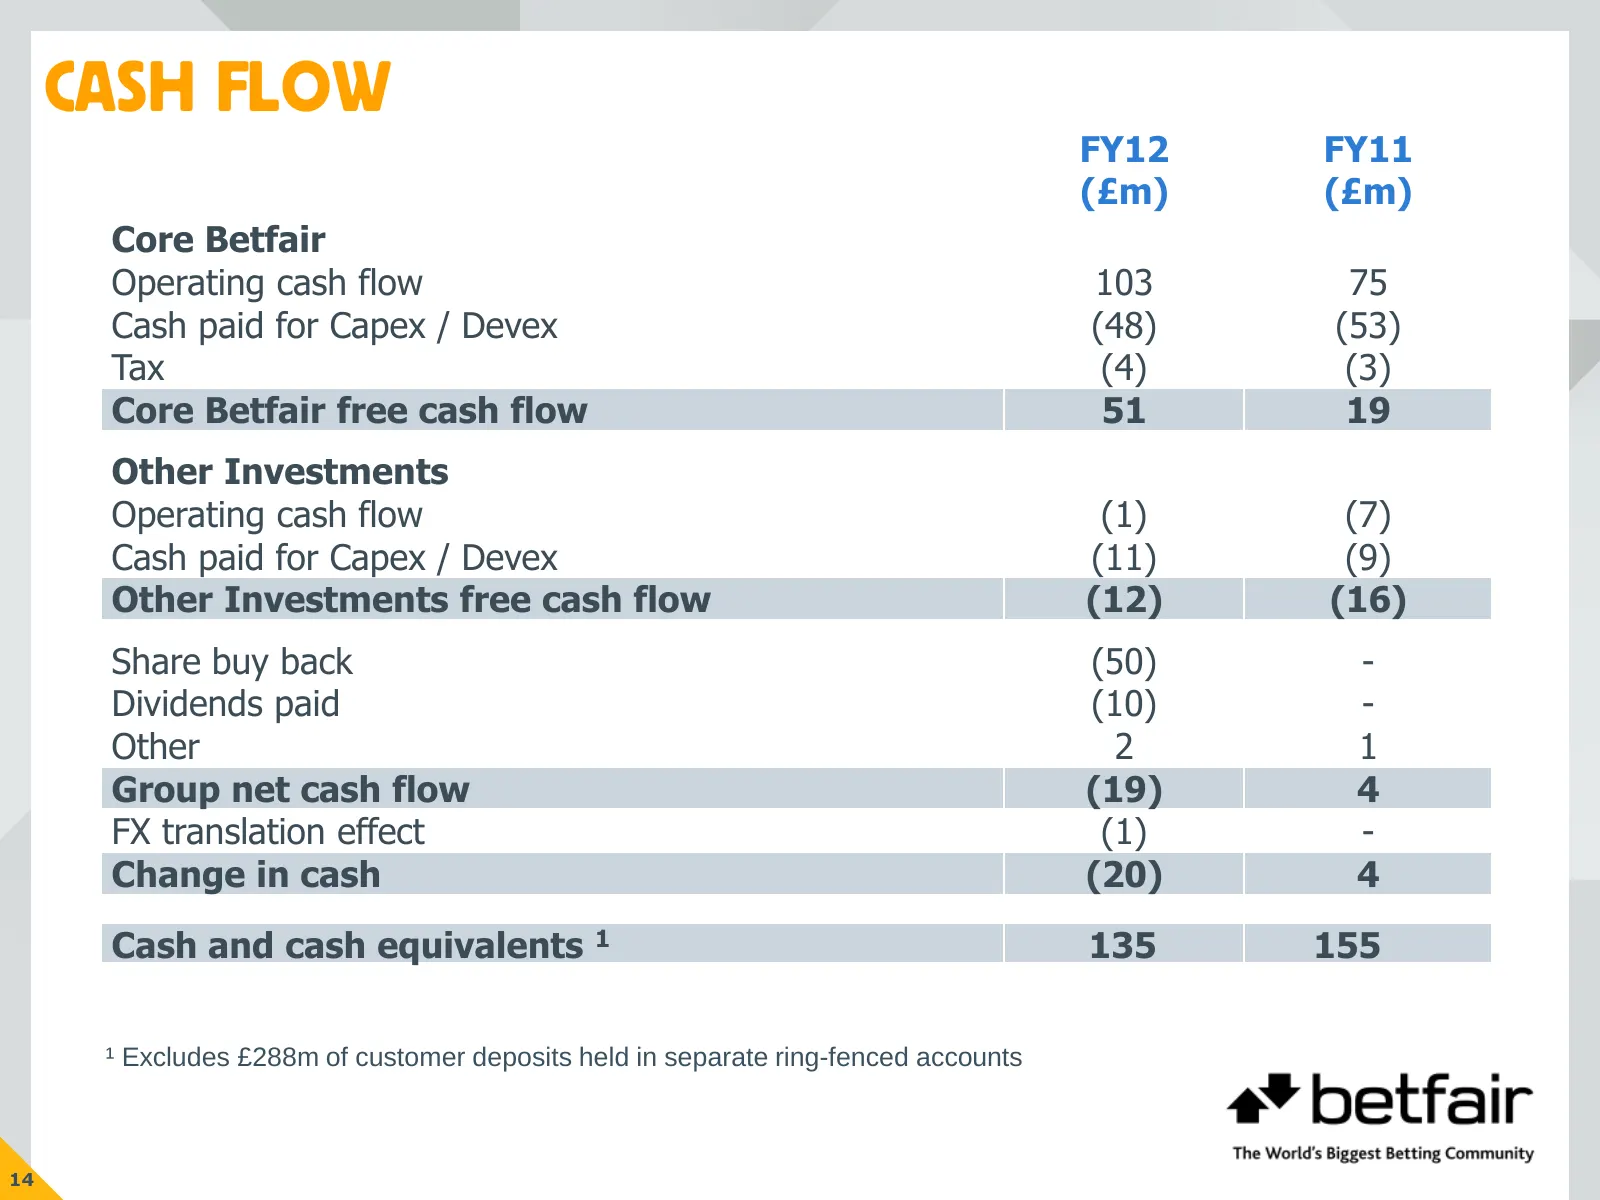
CASH FLOW FY12 FY11 (£m) (£m) Core Betfair Operating cash flow 103 75 Cash paid for Capex / Devex (48) (53) Tax (4) (3) Core Betfair free cash flow 51 19 Other Investments Operating cash flow (1) (7) Cash paid for Capex / Devex (11) (9) Other Investments free cash flow (12) (16) Share buy back (50)
Slide 16: Returns to Shareholders
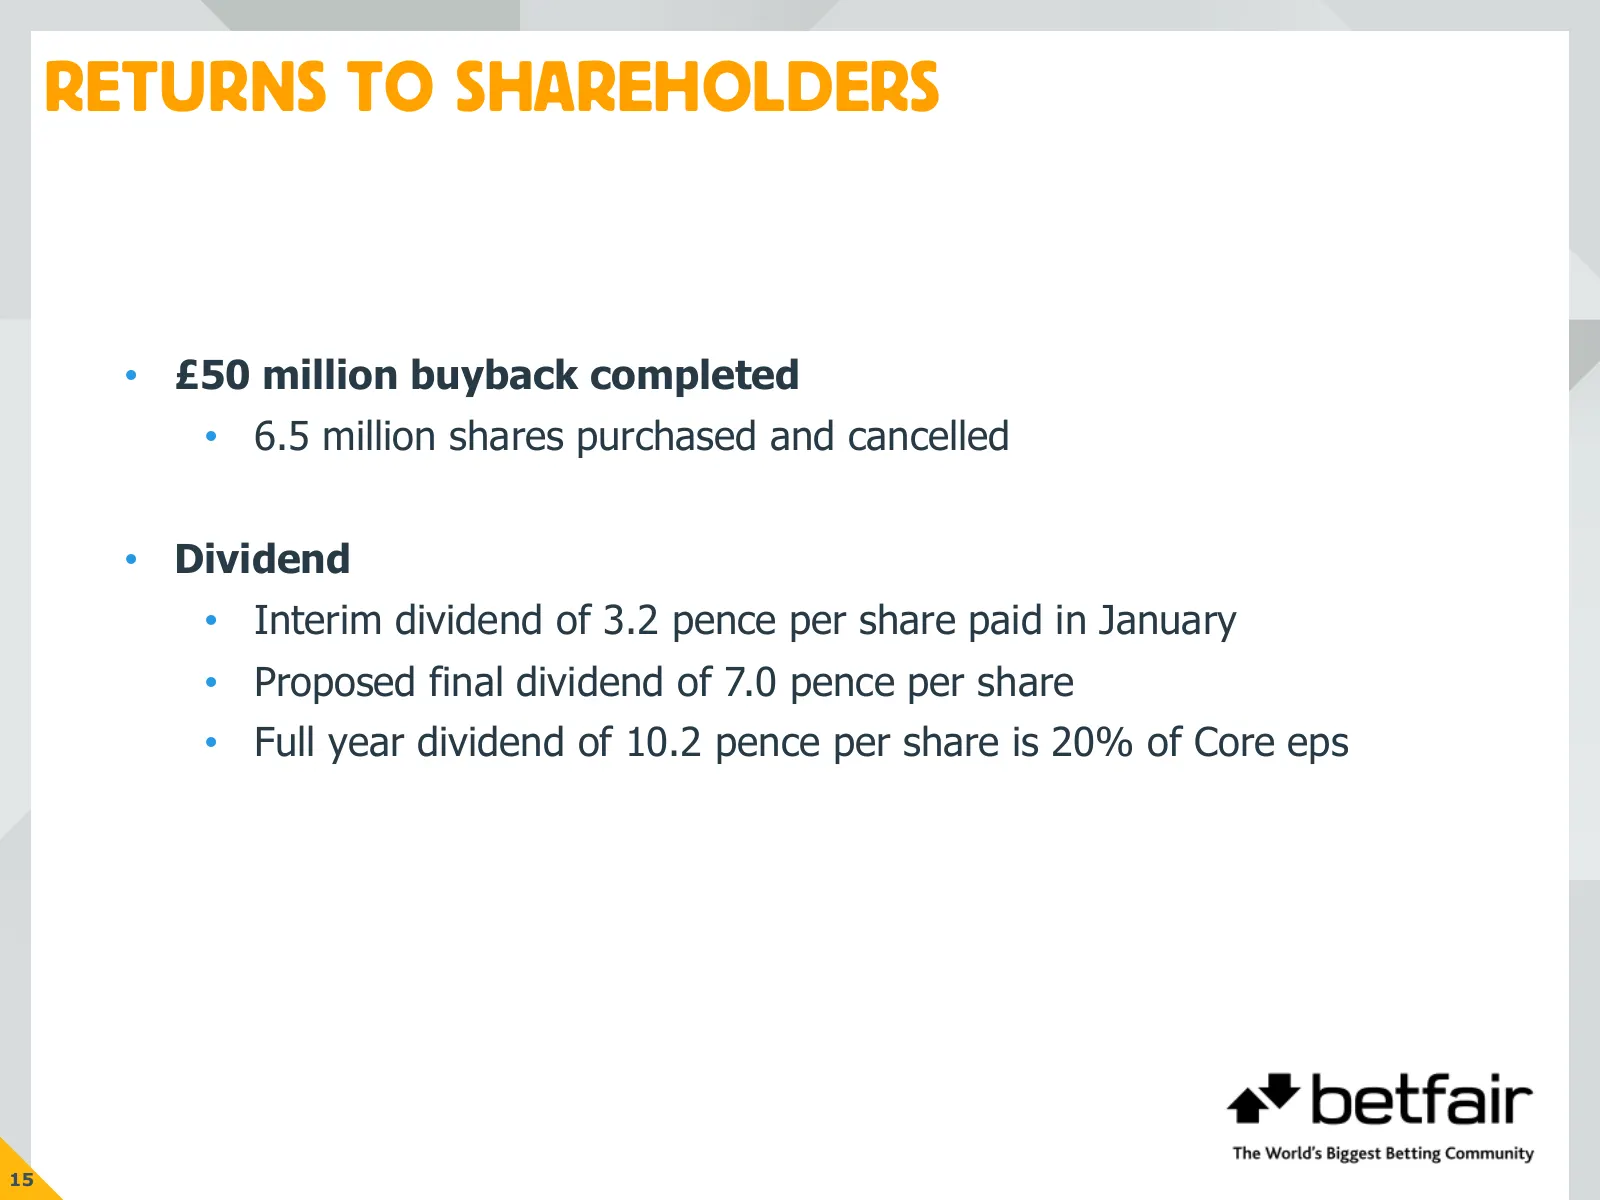
RETURNS TO SHAREHOLDERS • £50 million buyback completed • 6.5 million shares purchased and cancelled • Dividend • Interim dividend of 3.2 pence per share paid in January • Proposed final dividend of 7.0 pence per share • Full year dividend of 10.2 pence per share is 20% of Core eps 15
Slide 17: Financial Summary
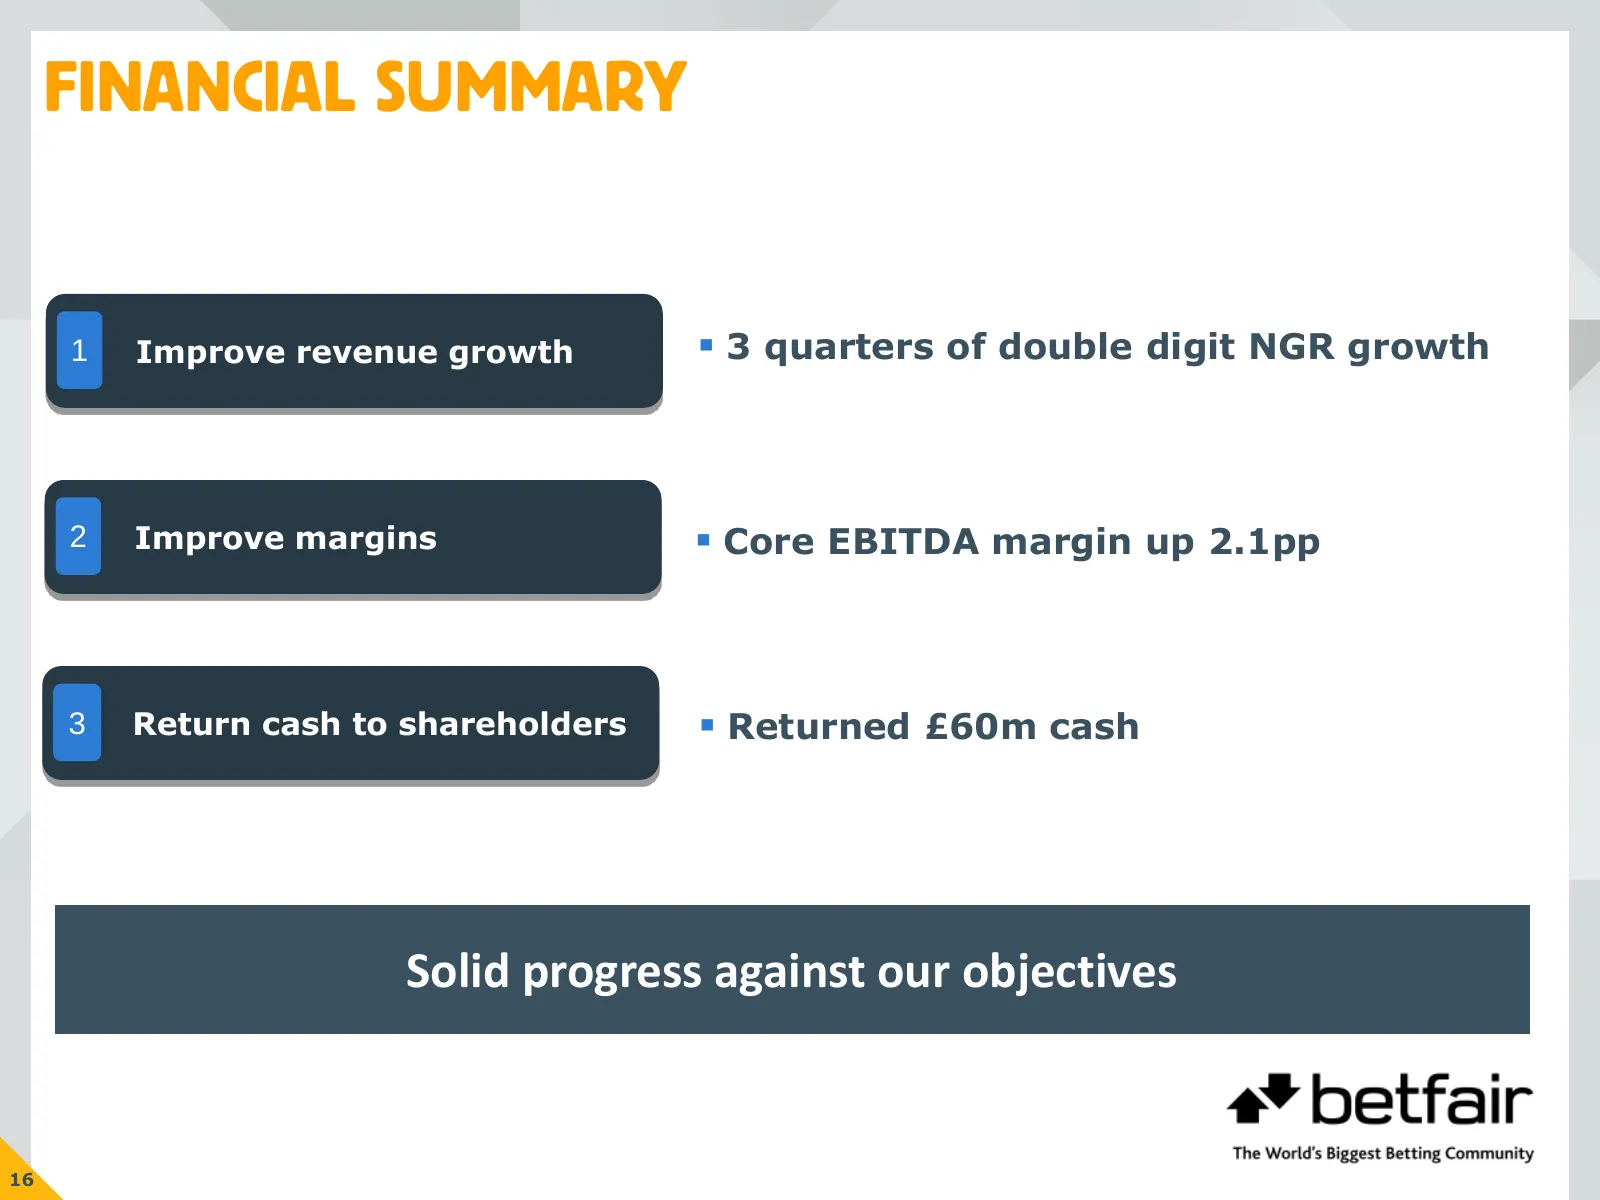
FINANCIAL SUMMARY 1 Improve revenue growth 3 quarters of double digit NGR growth 2 Improve margins Core EBITDA margin up 2.1pp 3 Return cash to shareholders Returned £60m cash Solid progress against our objectives 16
Slide 18: Business Review
BUSINESS REVIEW Stephen Morana – Interim CEO
Slide 19: Operational Highlights
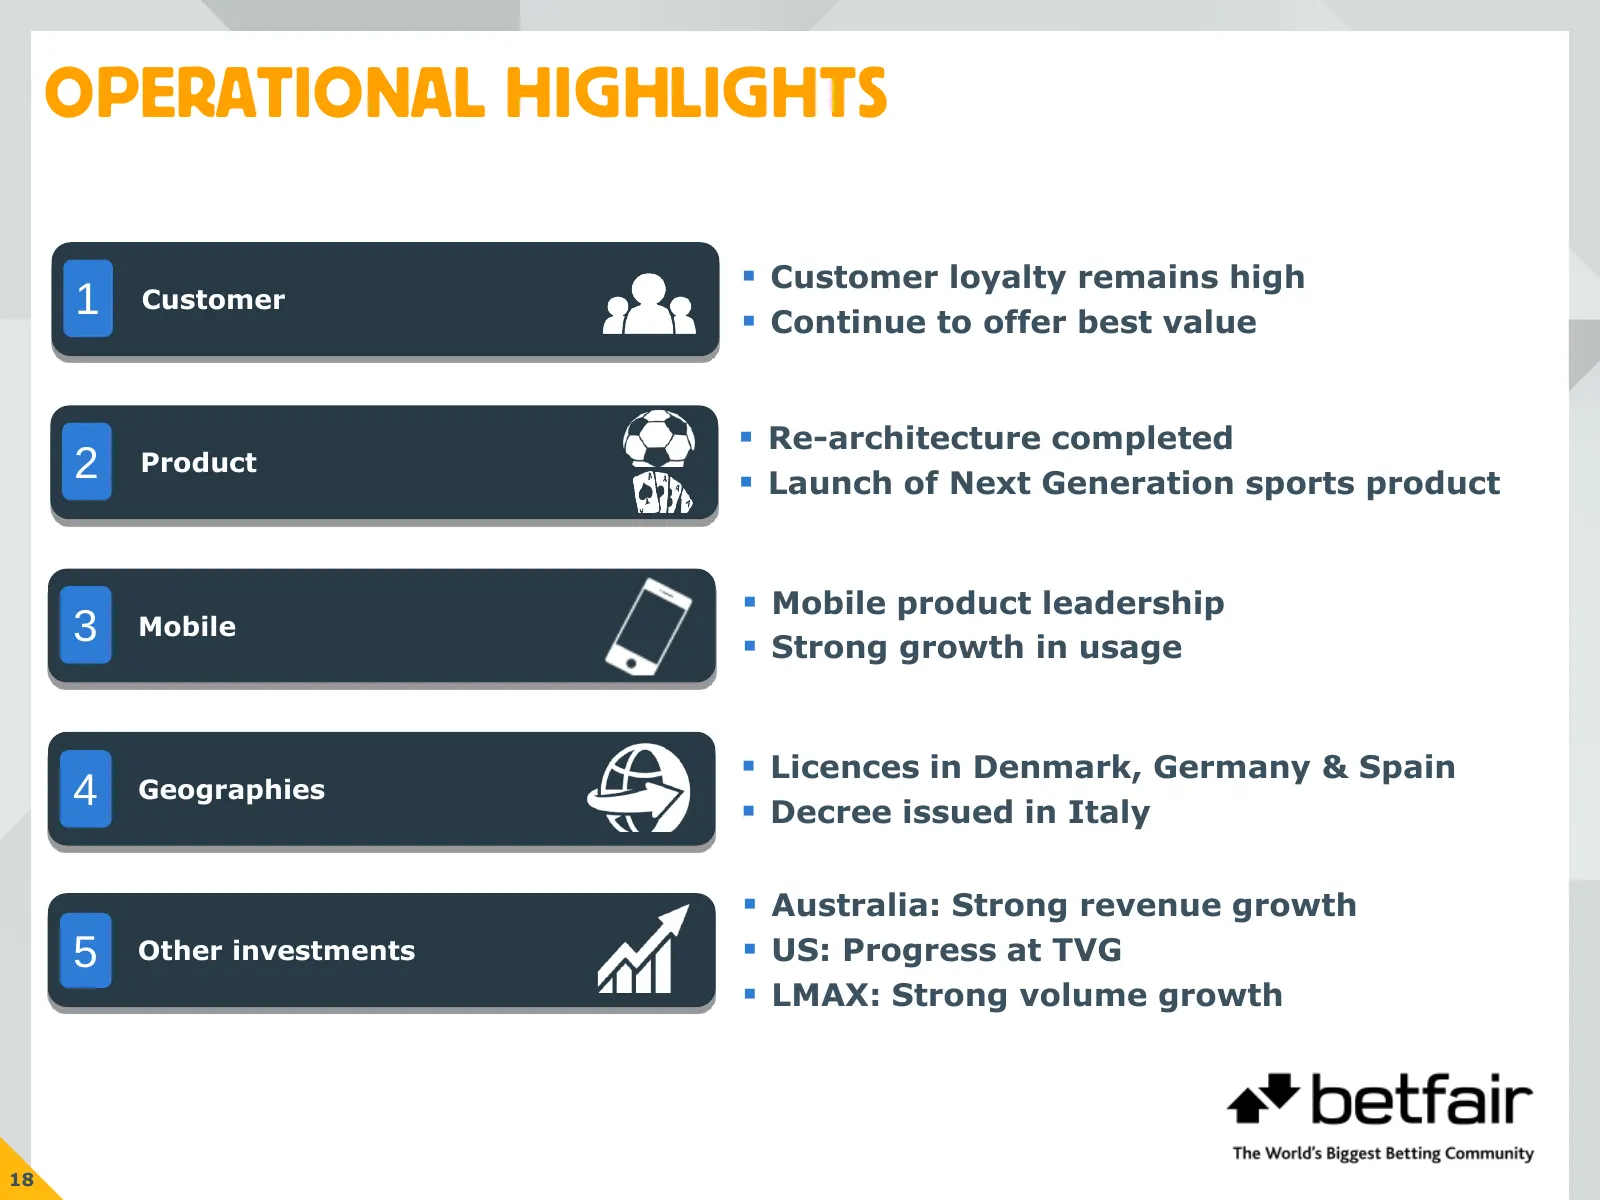
OPERATIONAL HIGHLIGHTS Customer loyalty remains high 1 Customer Continue to offer best value Re-architecture completed 2 Product Launch of Next Generation sports product Mobile product leadership 3 Mobile Strong growth in usage Licences in Denmark, Germany & Spain 4 Geographies Decre
Slide 20: Customer
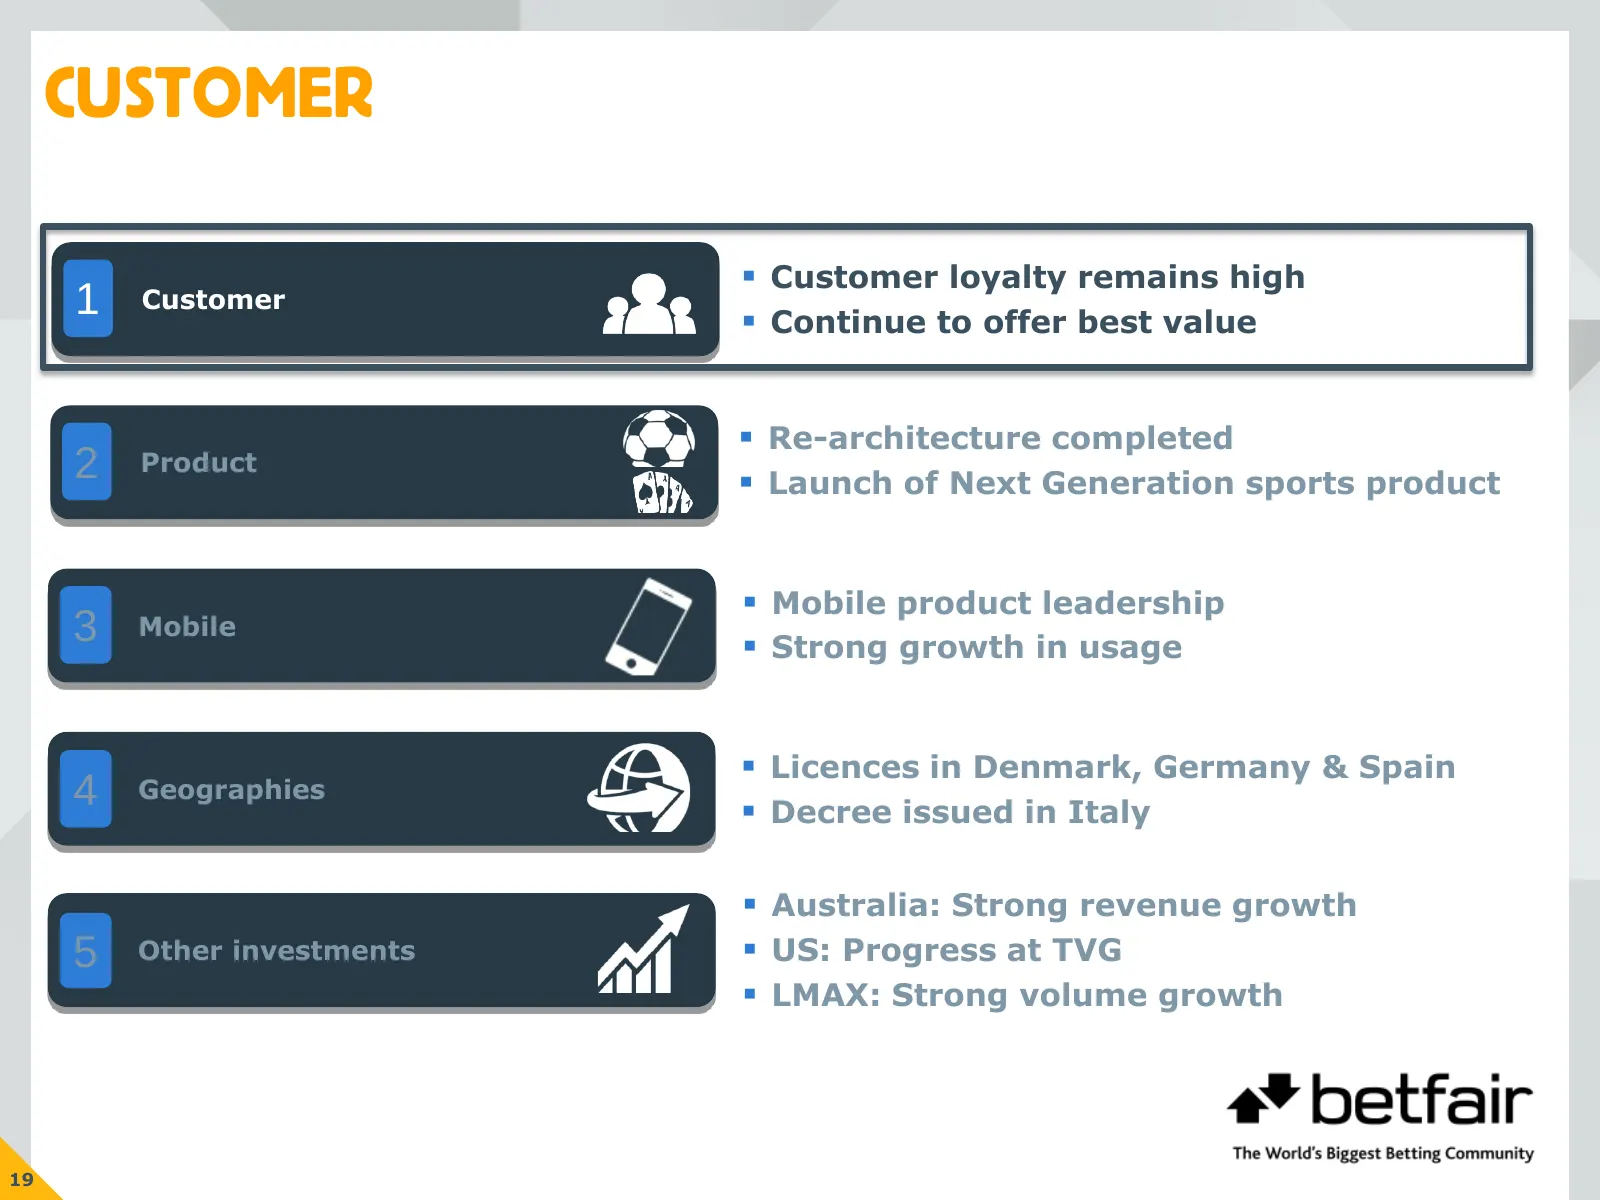
CUSTOMER Customer loyalty remains high 1 Customer Continue to offer best value Re-architecture completed 2 Product Launch of Next Generation sports product Mobile product leadership 3 Mobile Strong growth in usage Licences in Denmark, Germany & Spain 4 Geographies Decree issued in It
Slide 21: Customer Loyalty
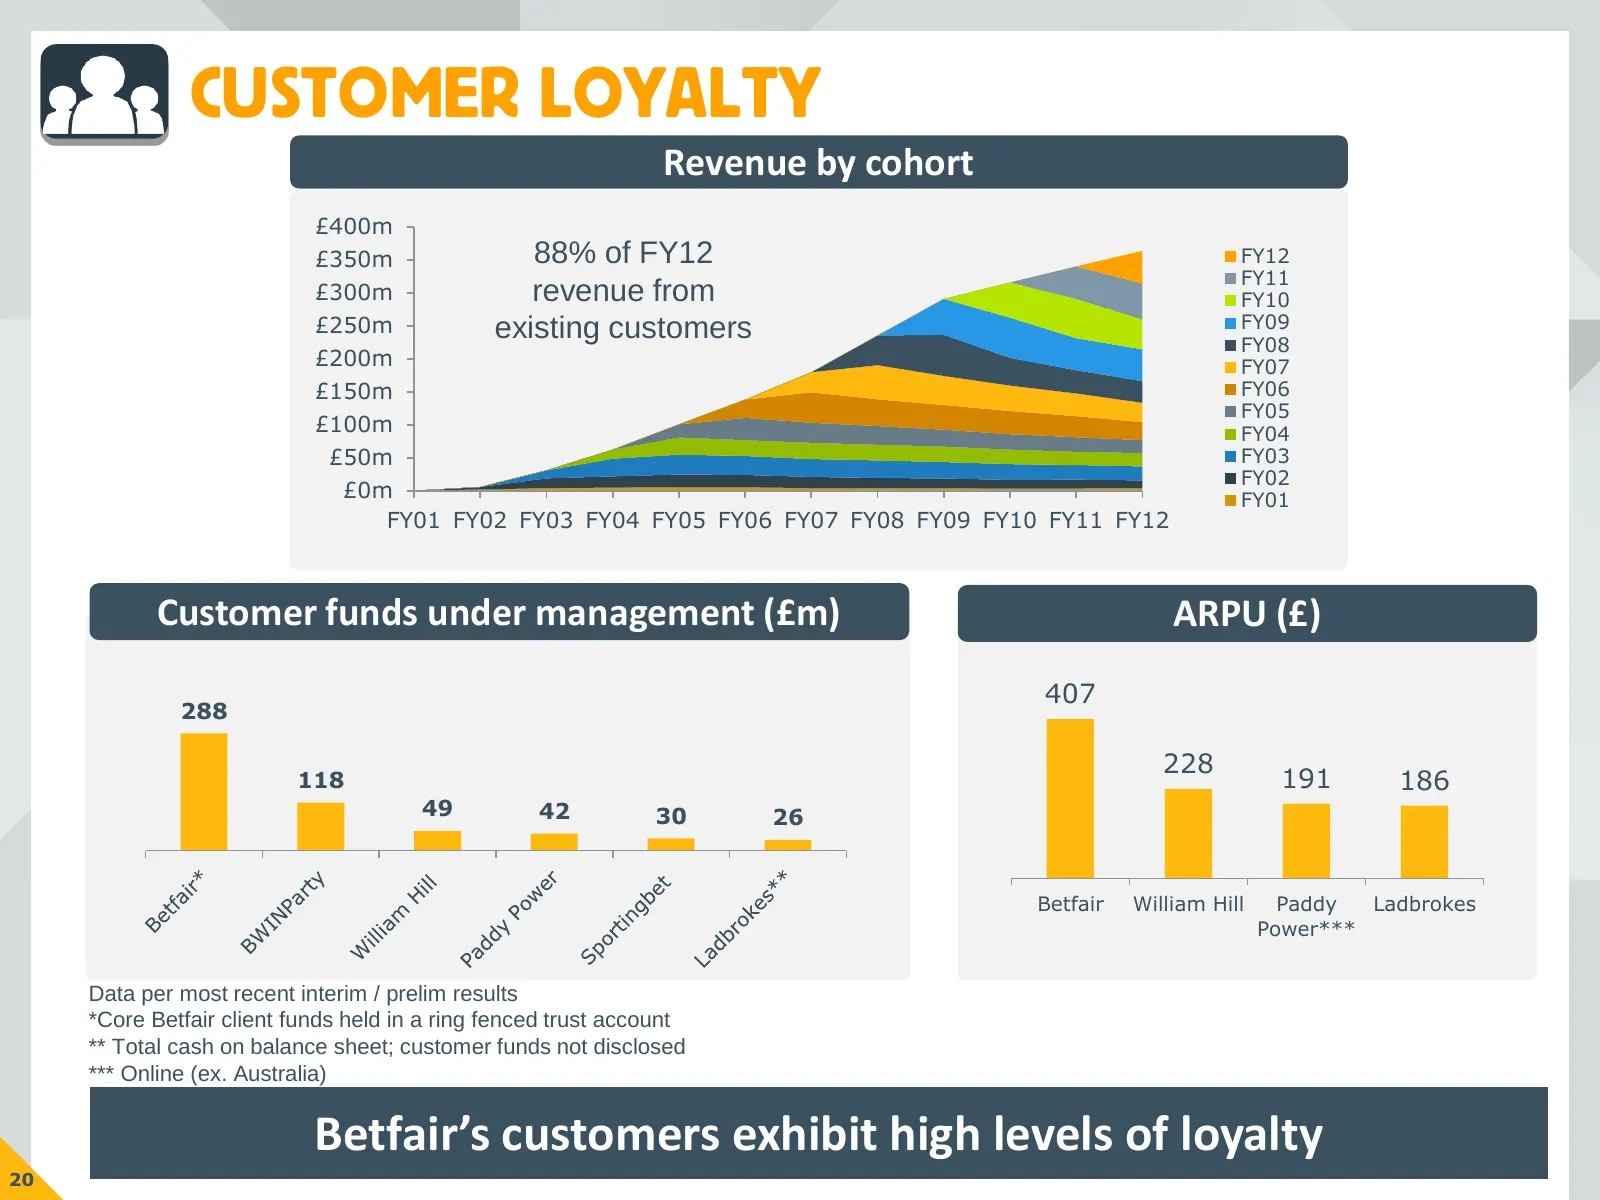
CUSTOMER LOYALTY Revenue by cohort £400m £350m 88% of FY12 FY12 FY11 £300m revenue from FY10 £250m existing customers FY09 FY08 £200m FY07 £150m FY06 FY05 £100m FY04 £50m FY03 FY02 £0m FY01 FY01 FY02 FY03 FY04 FY05 FY06 FY07 FY08 FY09 FY10 FY11 FY12 Customer funds under management (£m) ARPU (£) 407
Slide 22: Customer Feedback: Pros & Cons
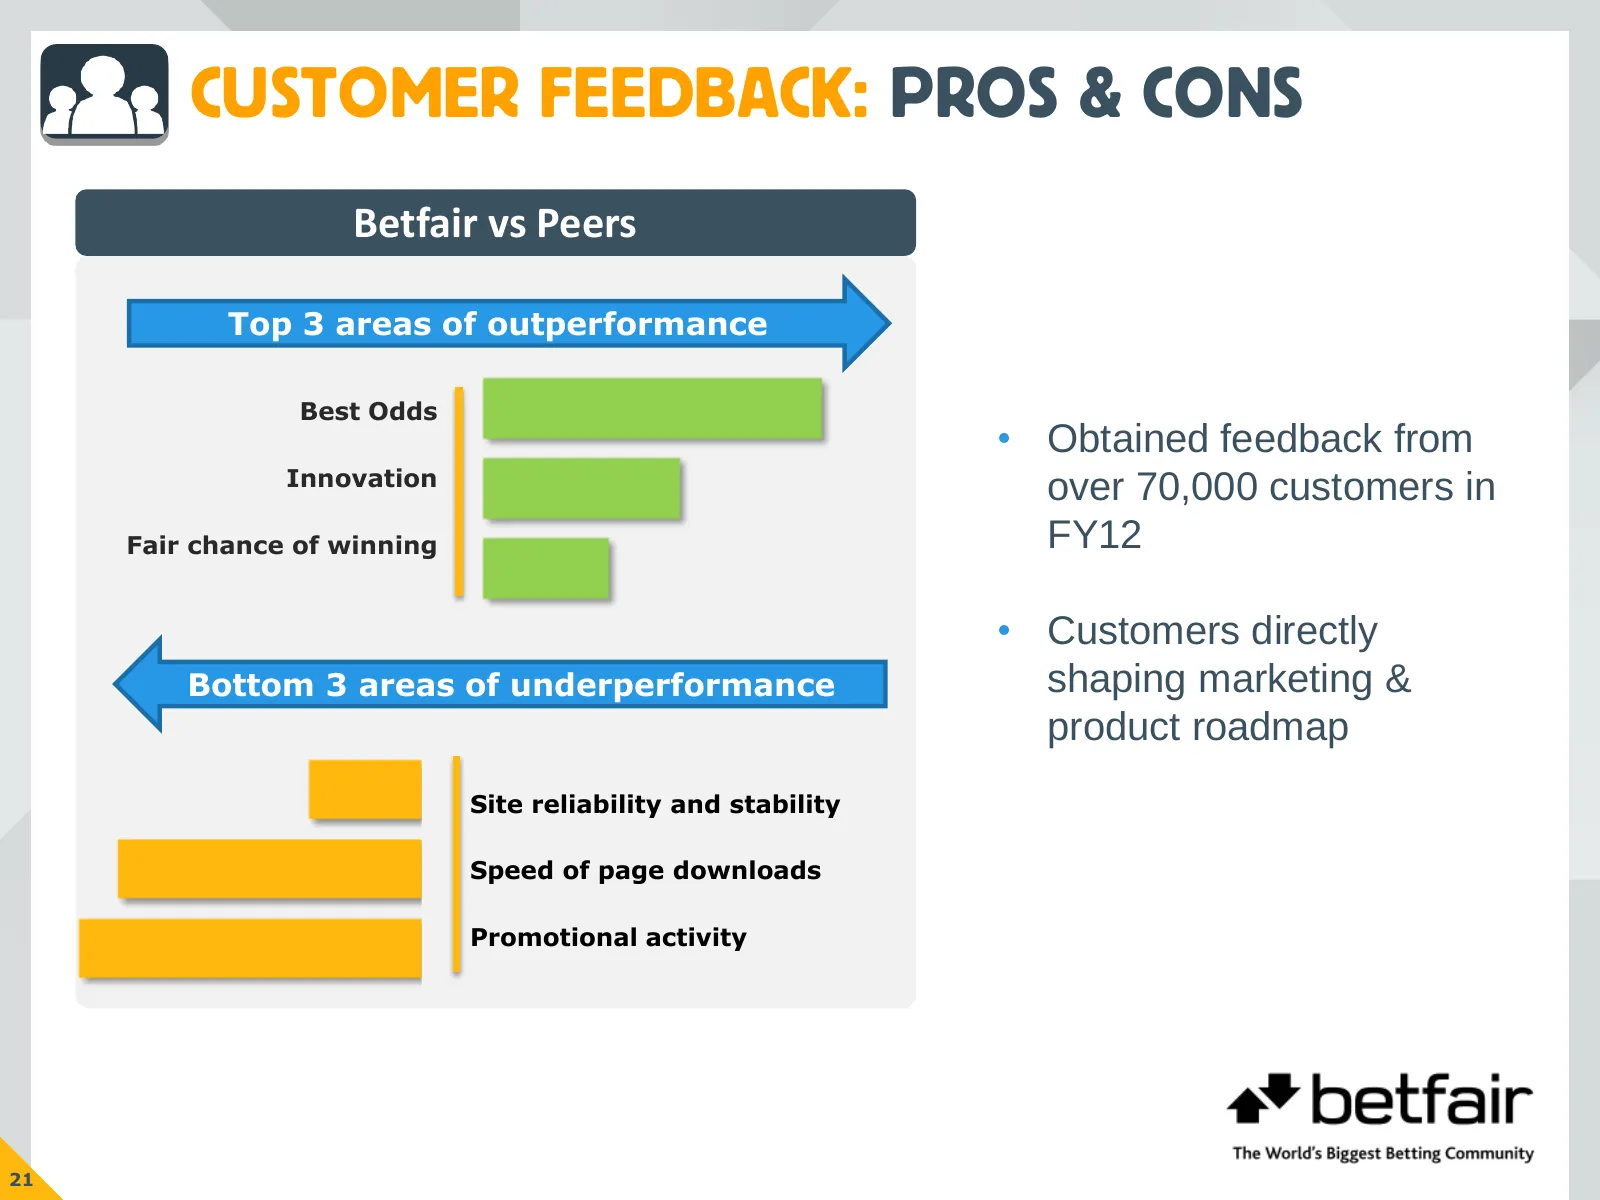
CUSTOMER FEEDBACK: PROS & CONS Betfair vs Peers Top 3 areas of outperformance Best Odds • Obtained feedback from Innovation over 70,000 customers in Fair chance of winning FY12 • Customers directly Bottom 3 areas of underperformance shaping marketing & product roadmap Site reliability and stability
Slide 23: Customer Value
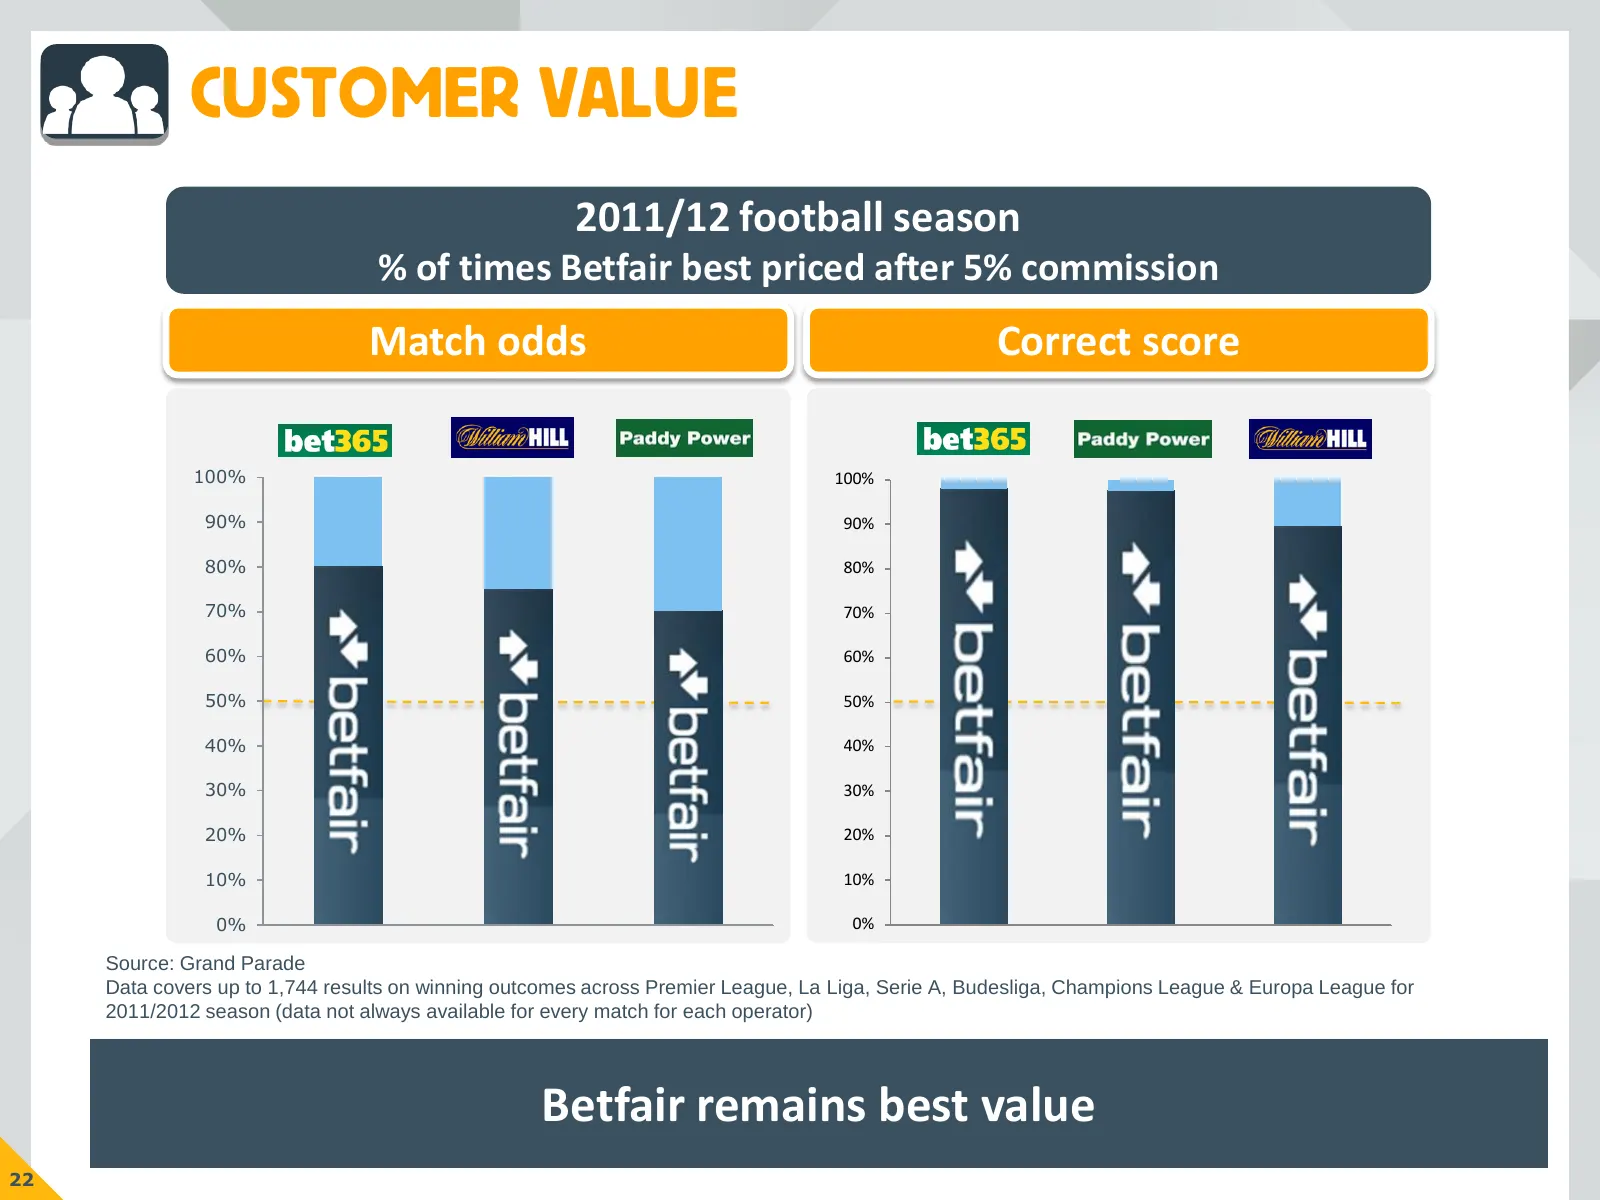
CUSTOMER VALUE 2011/12 football season % of times Betfair best priced after 5% commission Match odds Correct score 100% 100% 90% 90% 80% 80% 70% 70% 60% 60% 50% 50% 40% 40% 30% 30% 20% 20% 10% 10% 0% Bet36 5 Wi lliam H ill Paddy Power 0% Paddy Powe r Sportingbet William Hill Source: Grand Parade Dat
Slide 24: Exchange Offers a Chance of Winning
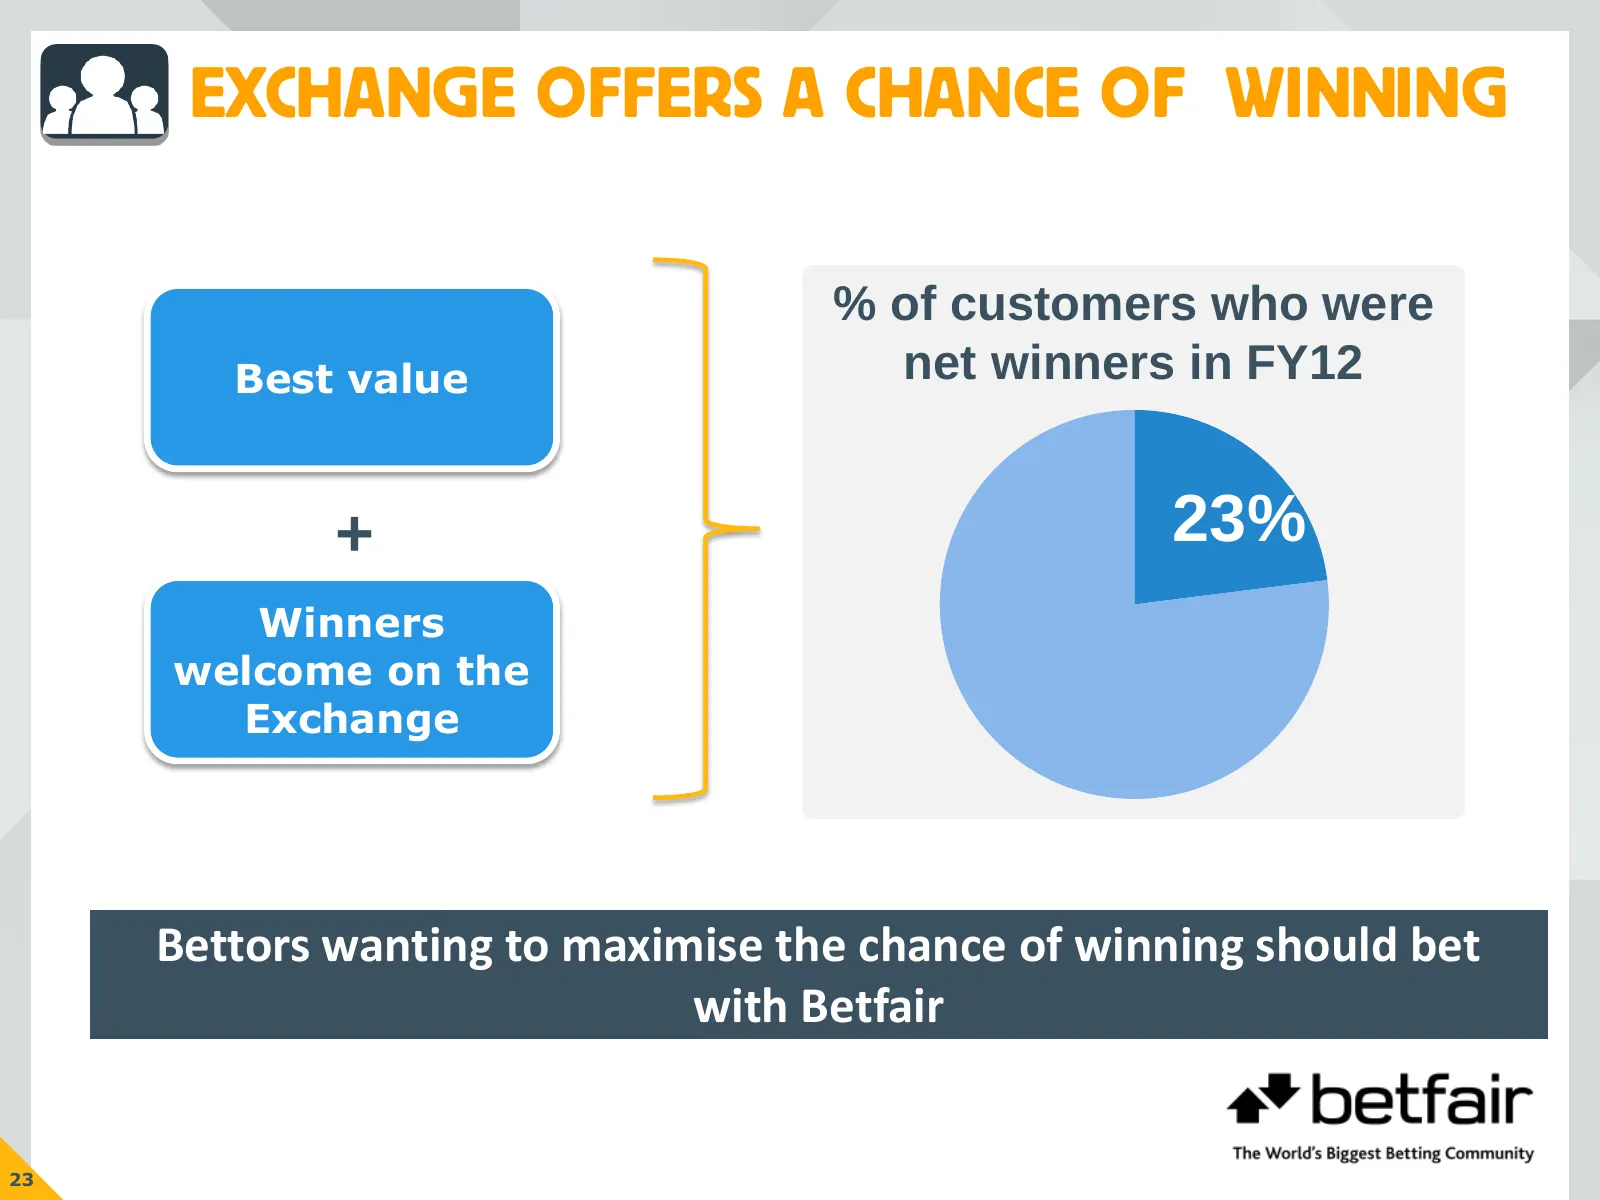
EXCHANGE OFFERS A CHANCE OF WINNING % of customers who were Best value net winners in FY12 + 23% Winners welcome on the Exchange Bettors wanting to maximise the chance of winning should bet with Betfair 23
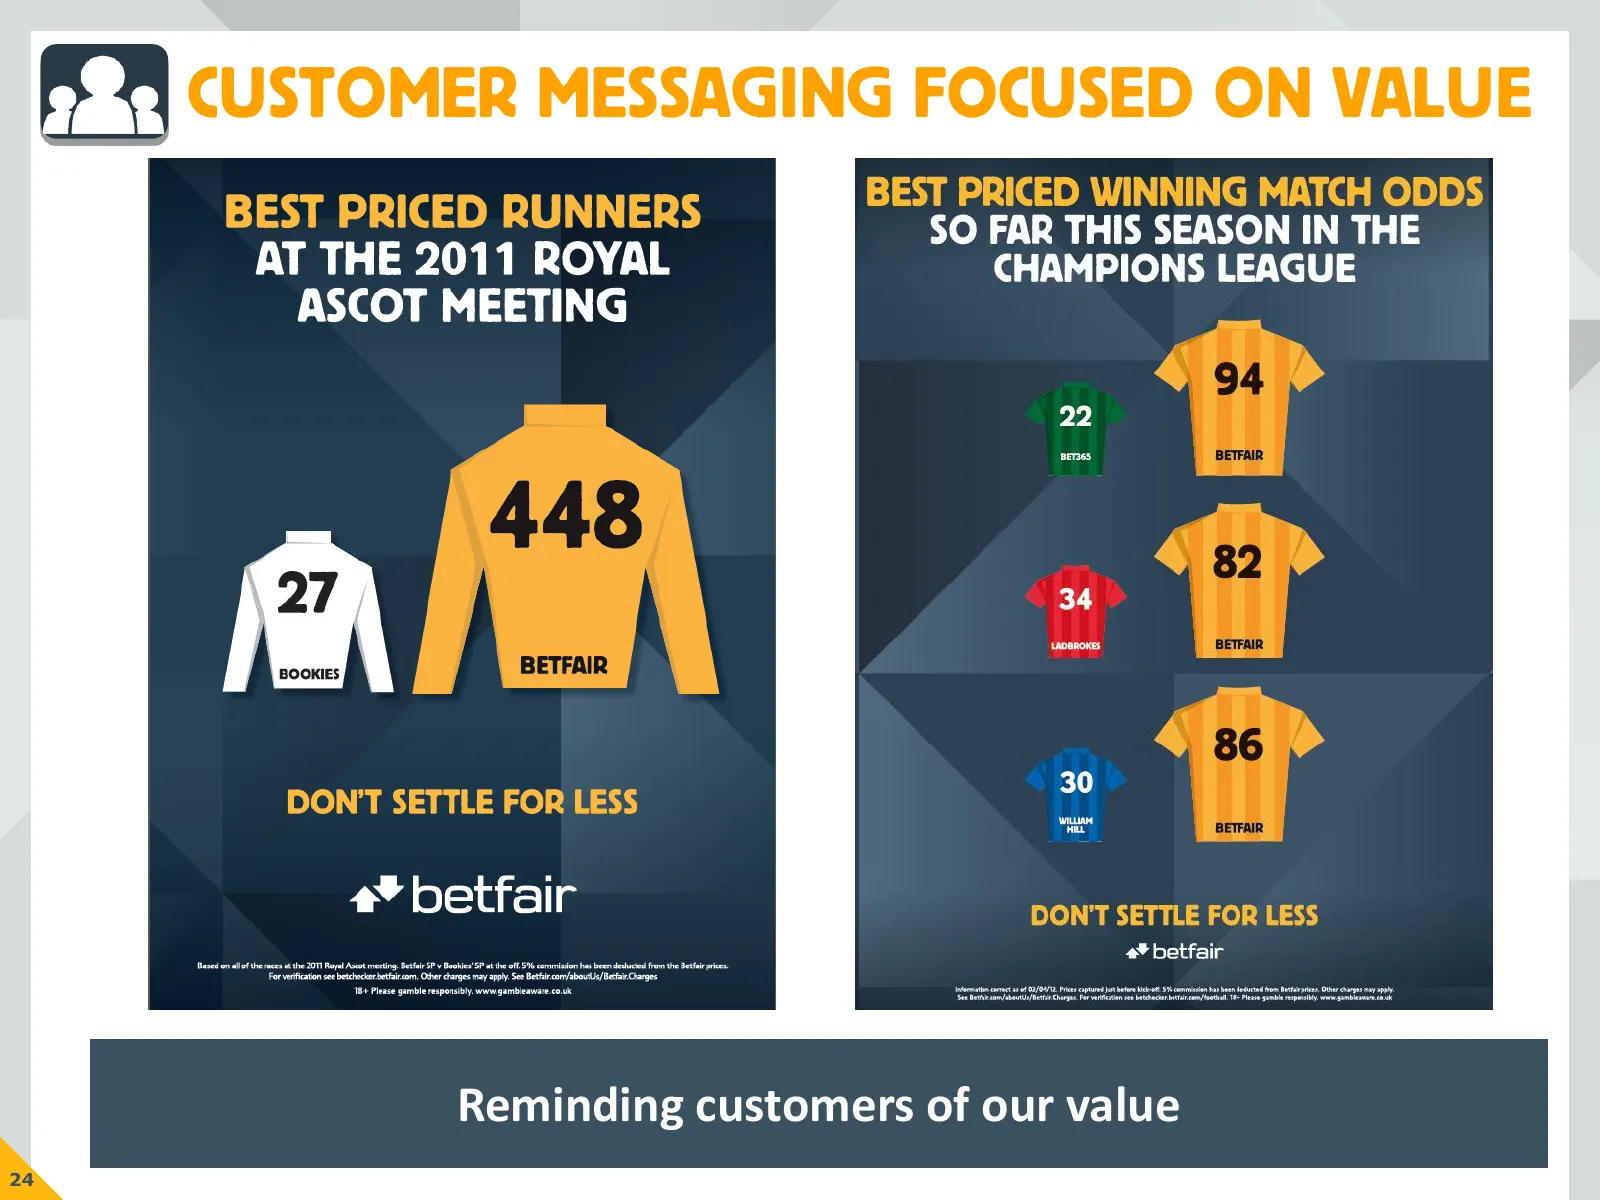
Slide 25: Customer Messaging Focused on Value
CUSTOMER MESSAGING FOCUSED ON VALUE Reminding customers of our value 24
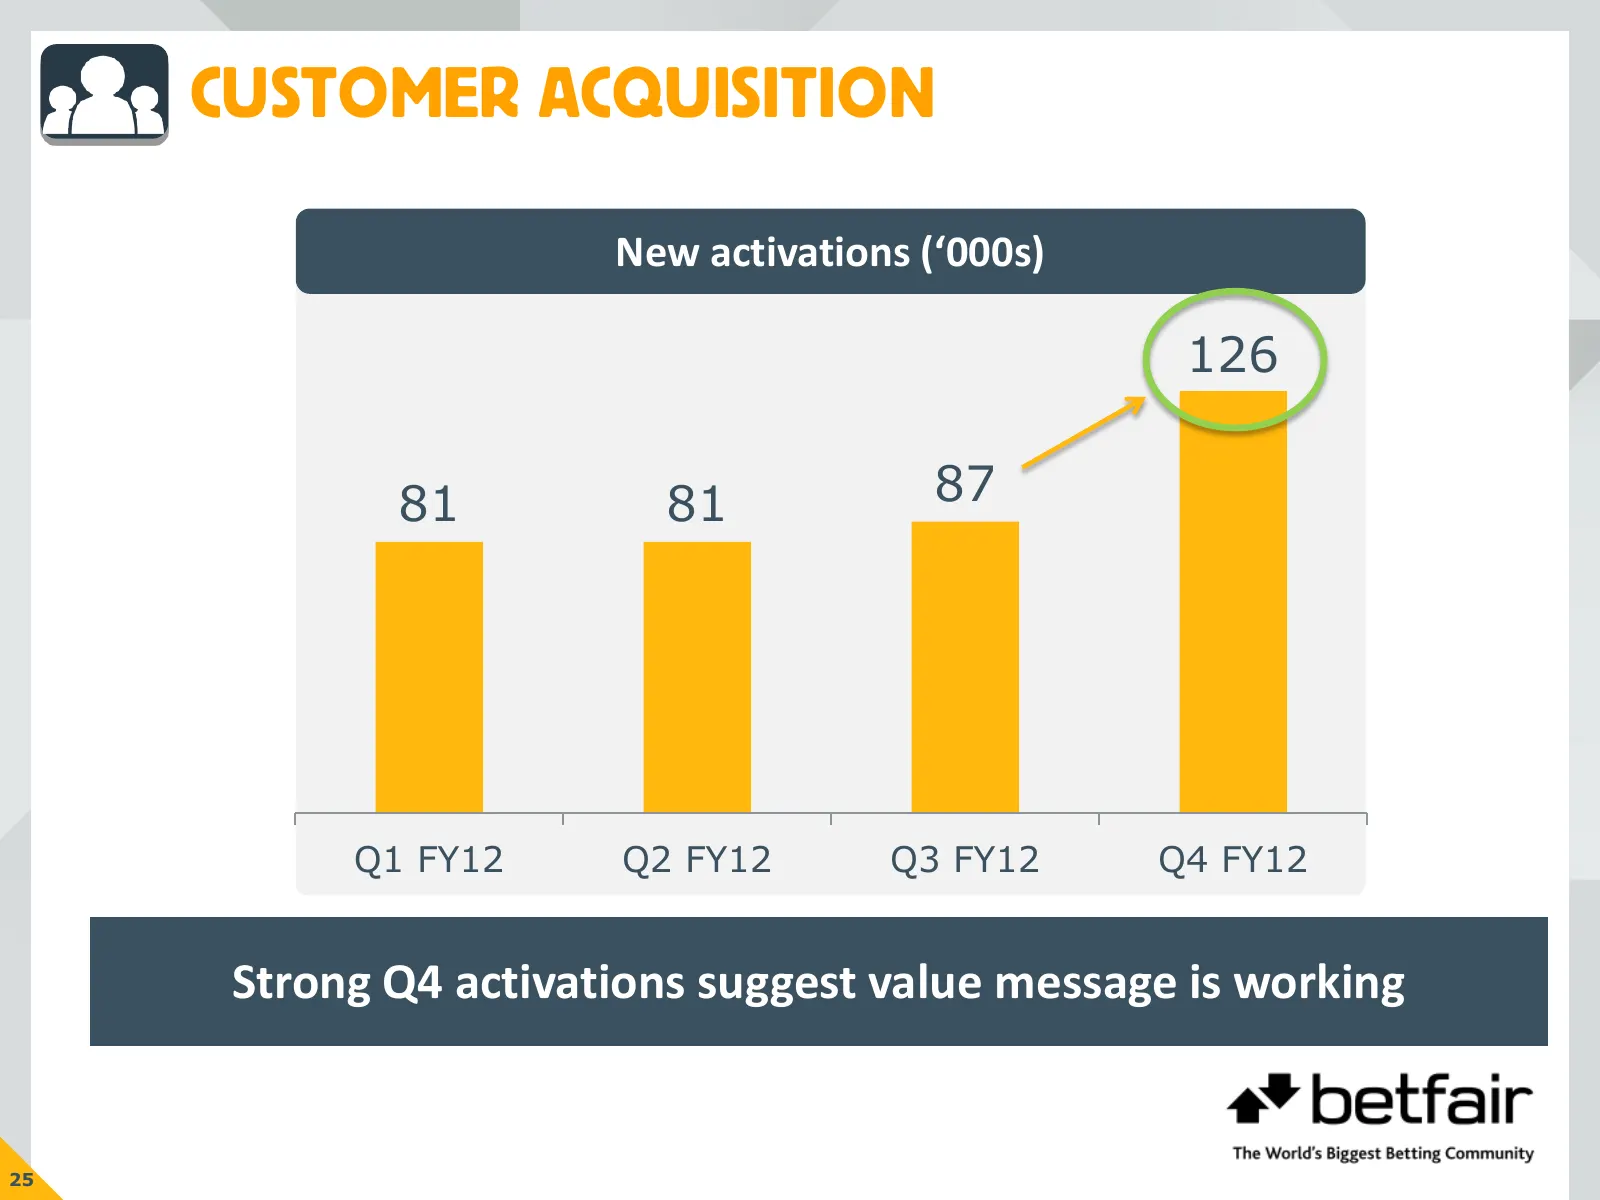
Slide 26: Customer Acquisition
CUSTOMER ACQUISITION New activations (‘000s) 126 81 81 87 Q1 FY12 Q2 FY12 Q3 FY12 Q4 FY12 Strong Q4 activations suggest value message is working 25
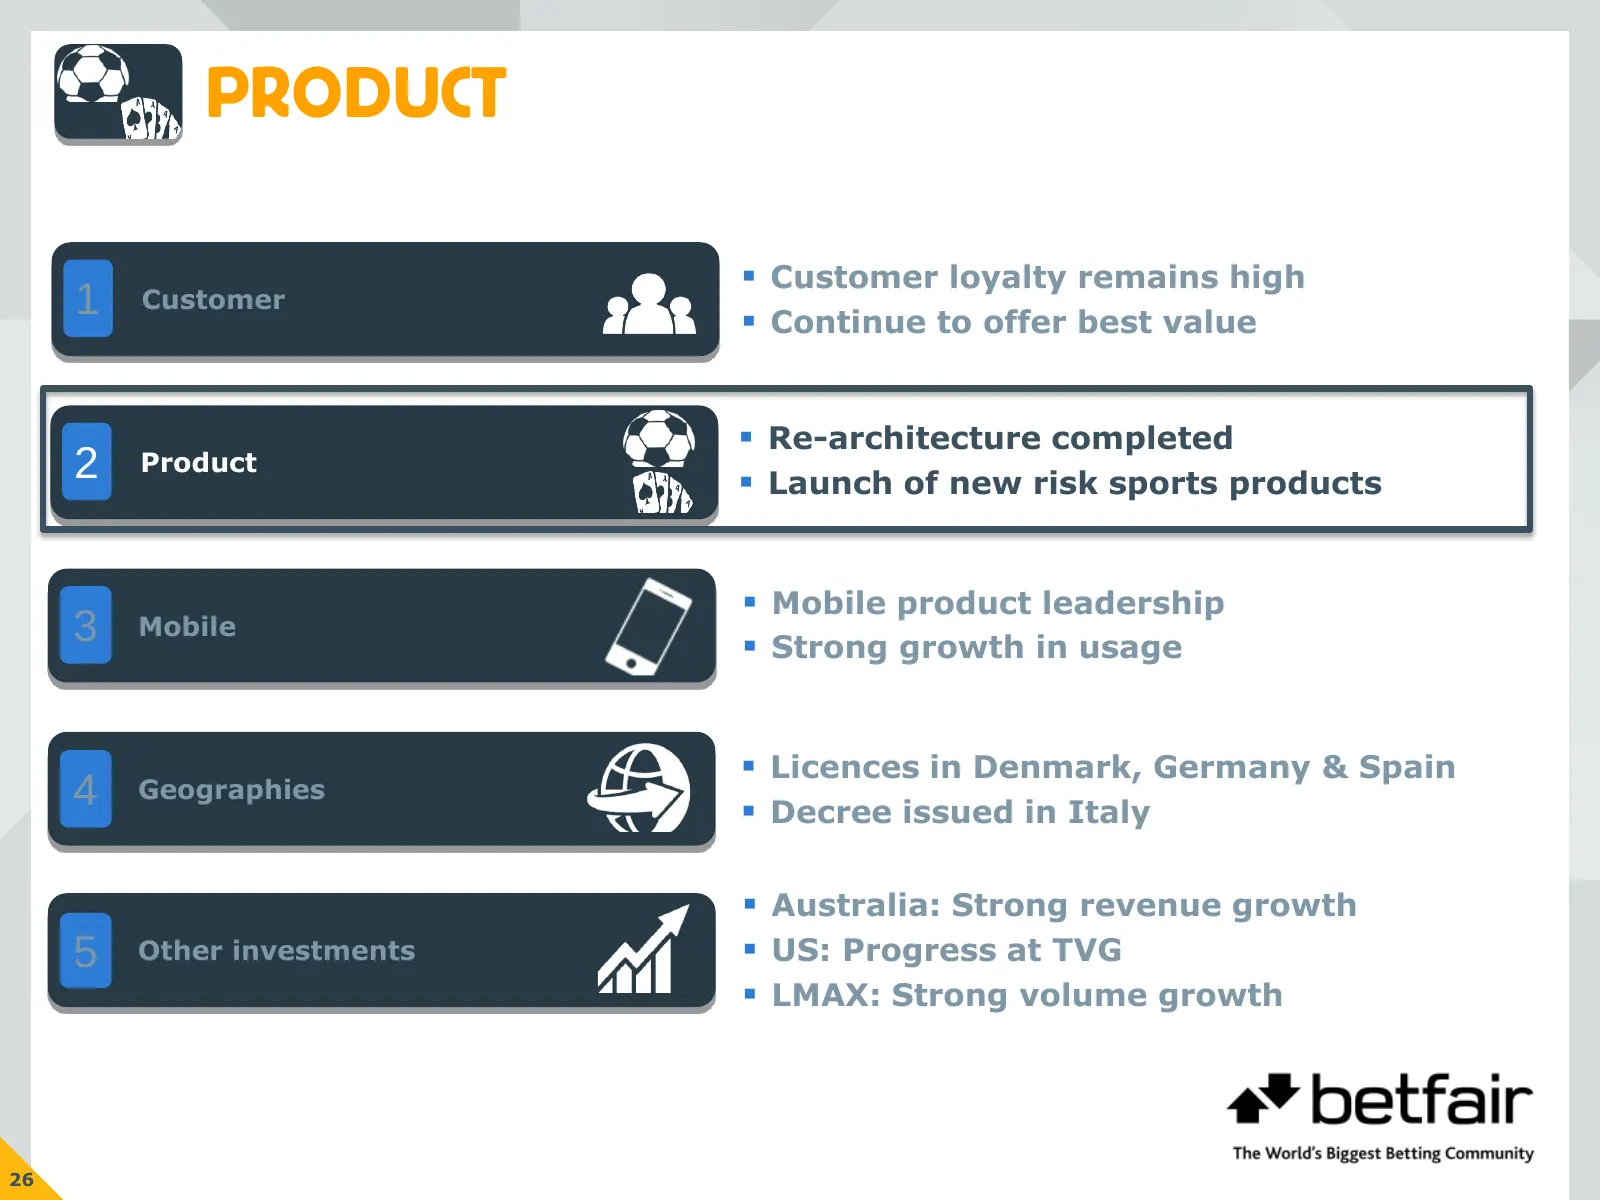
Slide 27: Product
PRODUCT Customer loyalty remains high 1 Customer Continue to offer best value Re-architecture completed 2 Product Launch of new risk sports products Mobile product leadership 3 Mobile Strong growth in usage Licences in Denmark, Germany & Spain 4 Geographies Decree issued in Italy A
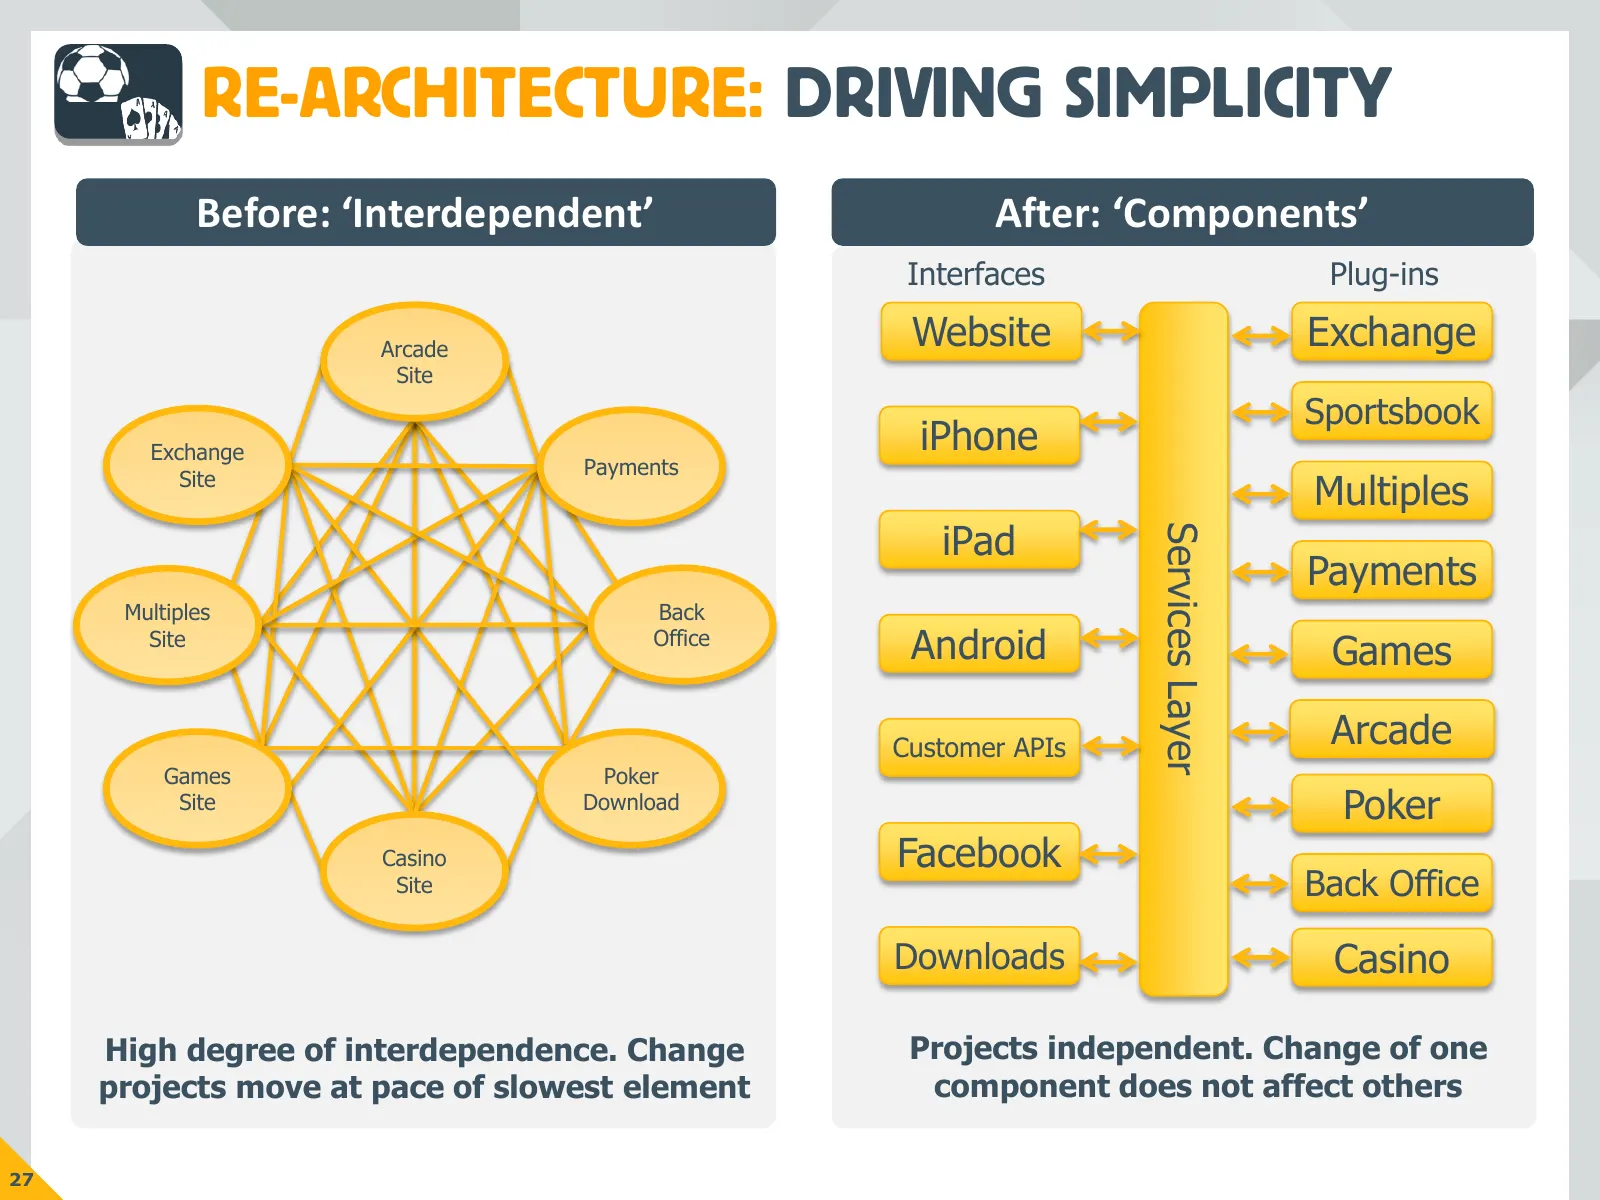
Slide 28: Re-architecture: Driving Simplicity
RE-ARCHITECTURE: DRIVING SIMPLICITY Before: ‘Interdependent’ After: ‘Components’ Interfaces Plug-ins Arcade Website Exchange Site Sportsbook Exchange iPhone Payments Site Multiples iPad Services Layer Payments Multiples Back Site Office Android Games Customer APIs Arcade Games Poker Site Download Po
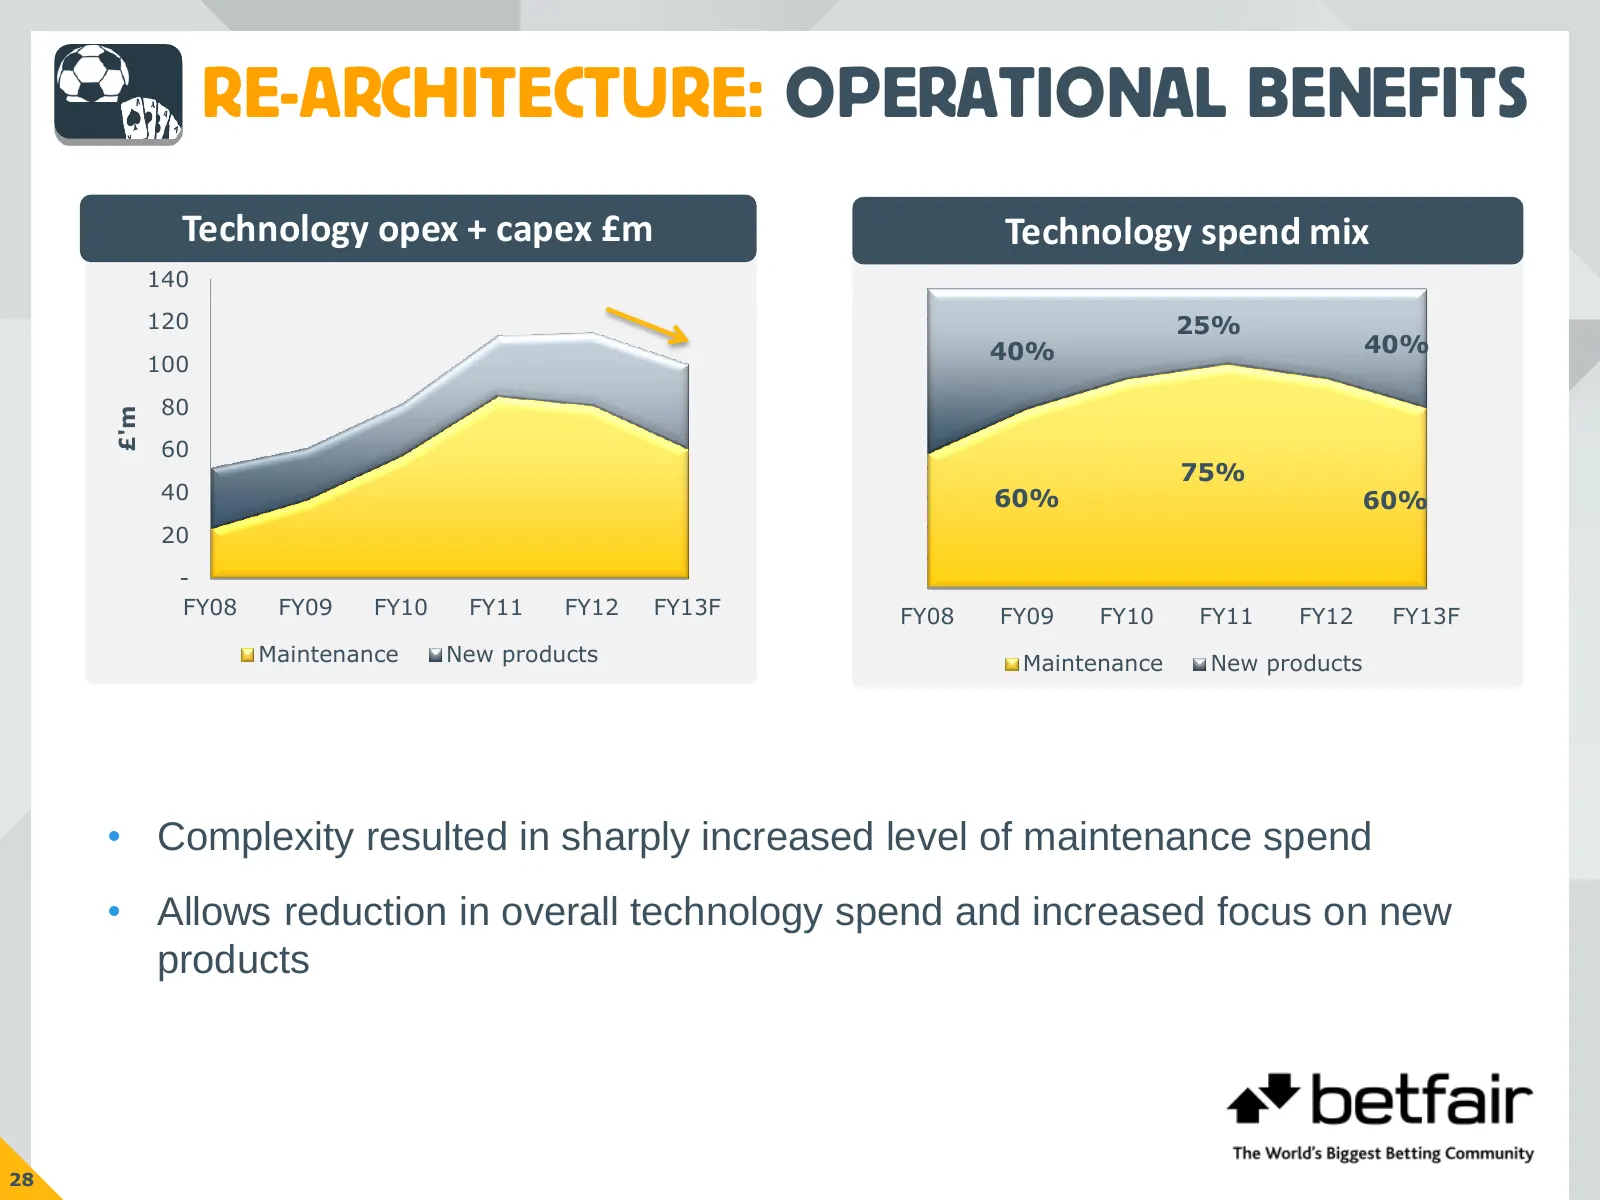
Slide 29: Re-architecture: Operational Benefits
RE-ARCHITECTURE: OPERATIONAL BENEFITS Technology opex + capex £m Technology spend mix 140 120 25% 40% 40% 100 80 £'m 60 75% 40 60% 60% 20 - FY08 FY09 FY10 FY11 FY12 FY13F FY08 FY09 FY10 FY11 FY12 FY13F Maintenance New products Maintenance New products • Complexity resulted in sharply increased level
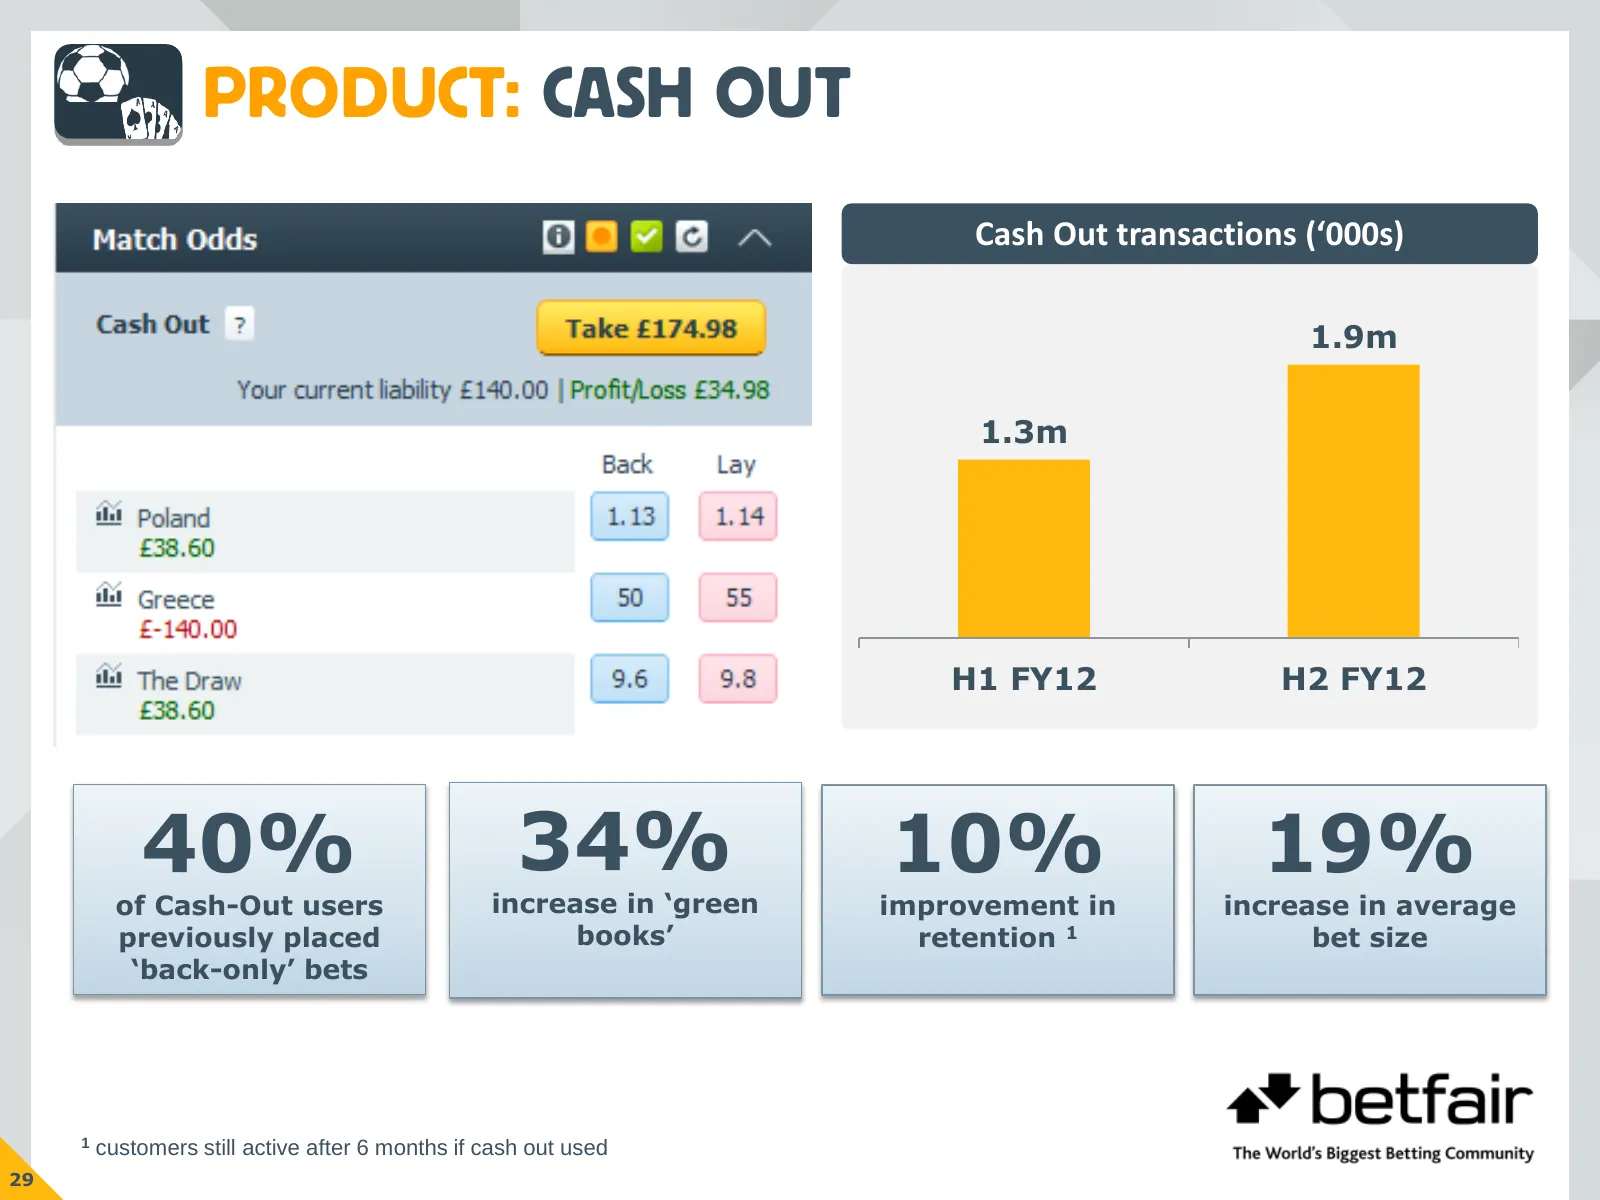
Slide 30: Product: Cash Out
PRODUCT: CASH OUT Cash Out transactions (‘000s) 1.9m 1.3m H1 FY12 H2 FY12 40% 34% 10% 19% of Cash-Out users increase in ‘green improvement in increase in average previously placed books’ retention 1 bet size ‘back-only’ bets 1 customers still active after 6 months if cash out used 29
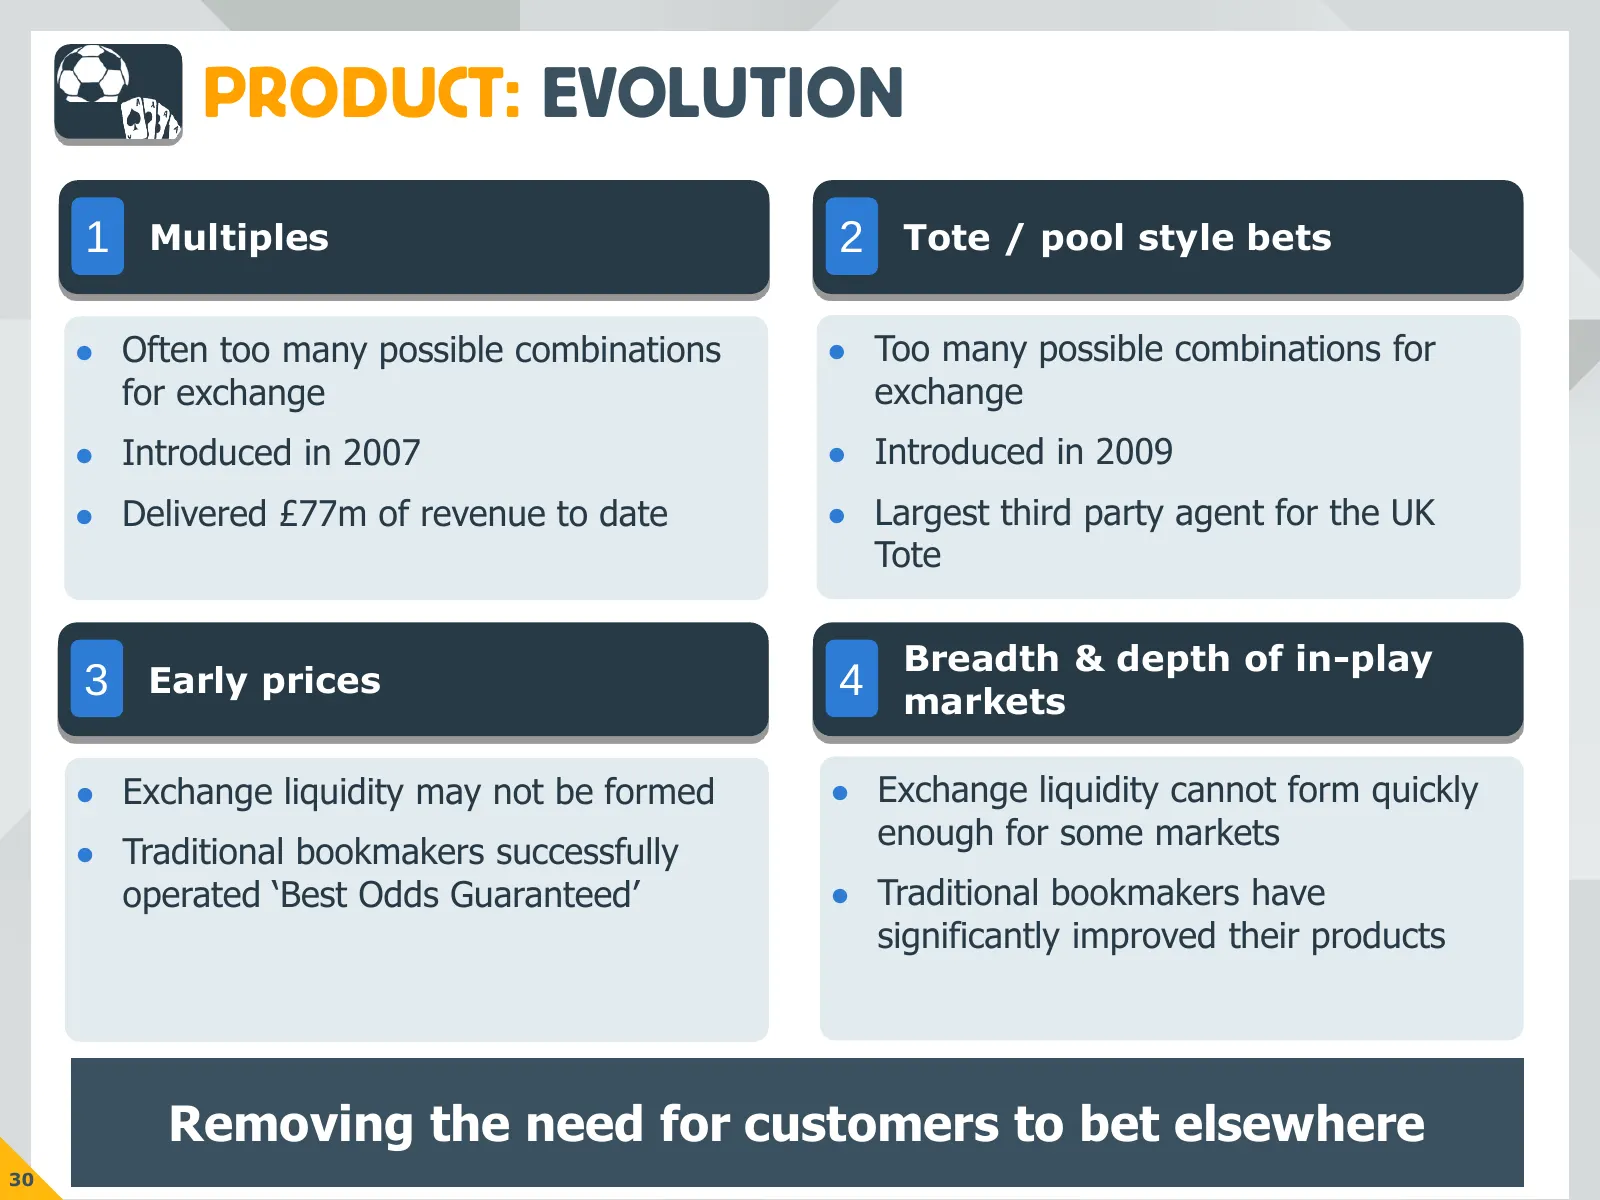
Slide 31: Product: Evolution
PRODUCT: EVOLUTION 1 Multiples 2 Tote / pool style bets Often too many possible combinations Too many possible combinations for for exchange exchange Introduced in 2007 Introduced in 2009 Delivered £77m of revenue to date Largest third party agent for the UK Tote Breadth & depth of in-pl
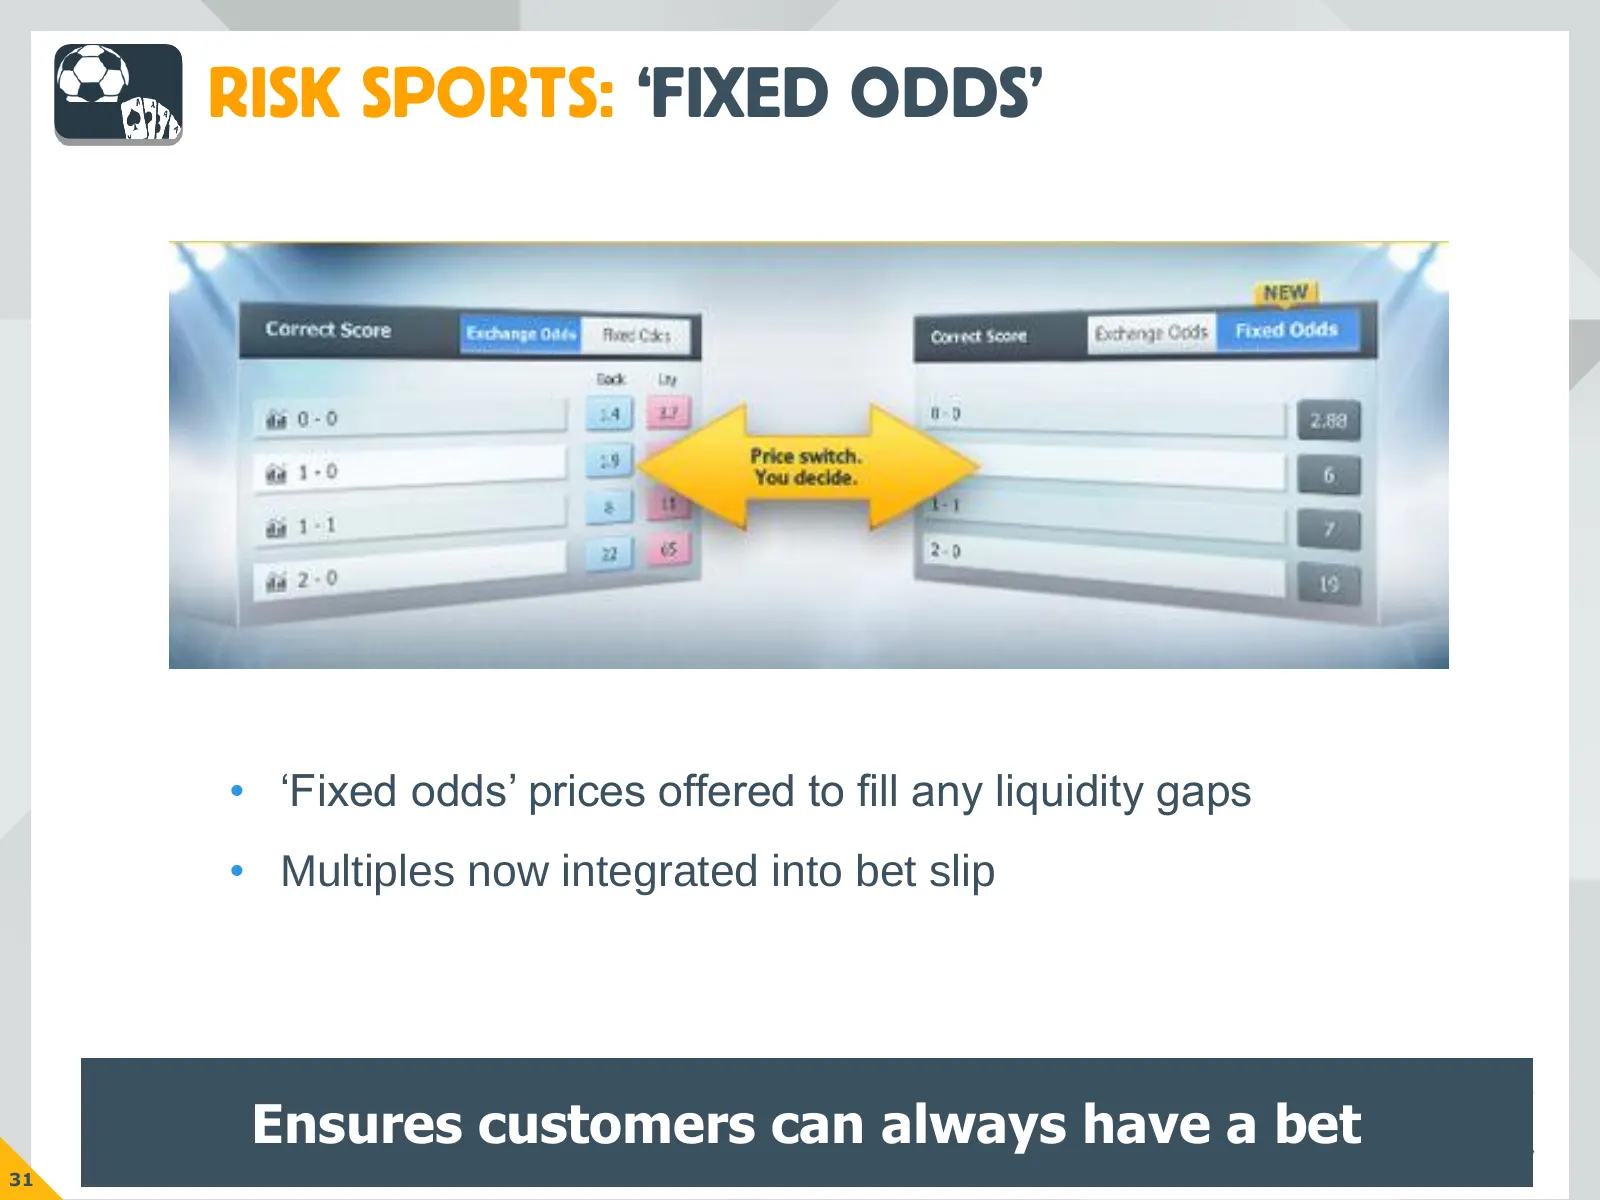
Slide 32: Risk Sports: 'Fixed Odds'
RISK SPORTS: ‘FIXED ODDS’ • ‘Fixed odds’ prices offered to fill any liquidity gaps • Multiples now integrated into bet slip Ensures customers can always have a bet 31
Slide 33: Gaming
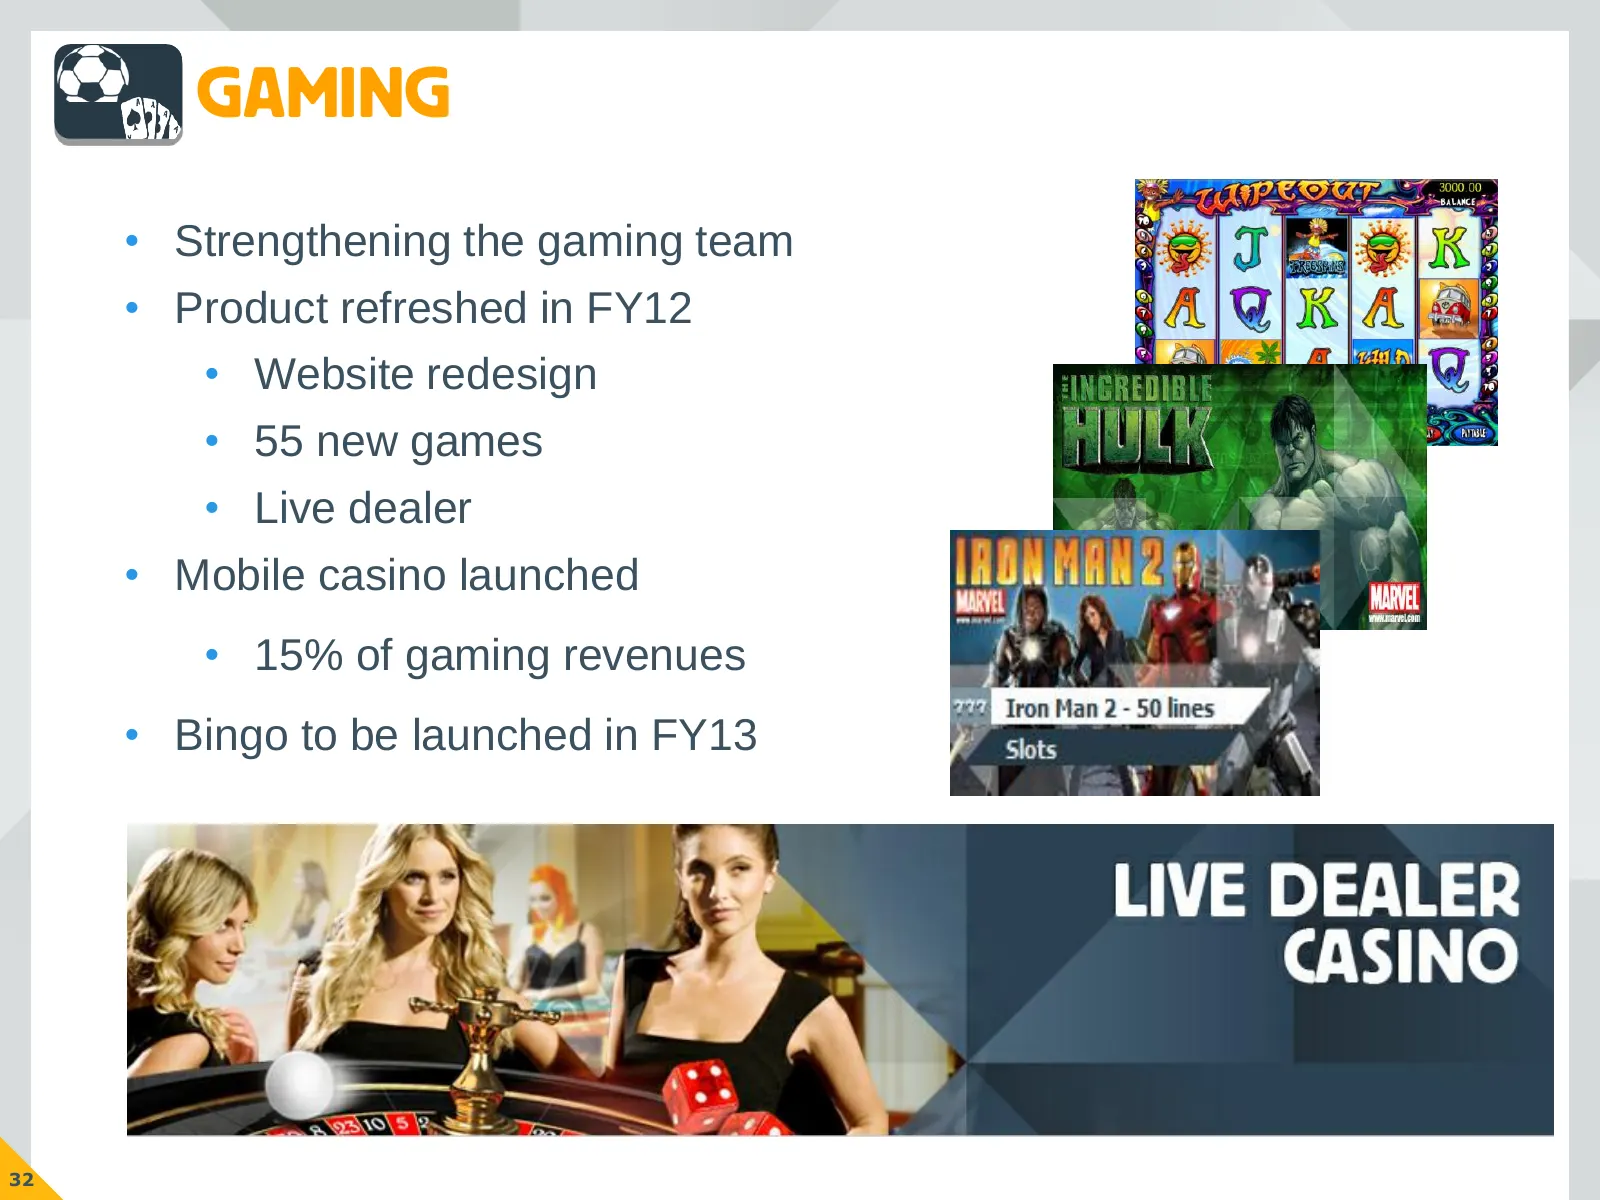
GAMING • Strengthening the gaming team • Product refreshed in FY12 • Website redesign • 55 new games • Live dealer • Mobile casino launched • 15% of gaming revenues • Bingo to be launched in FY13 32
Slide 34: Mobile
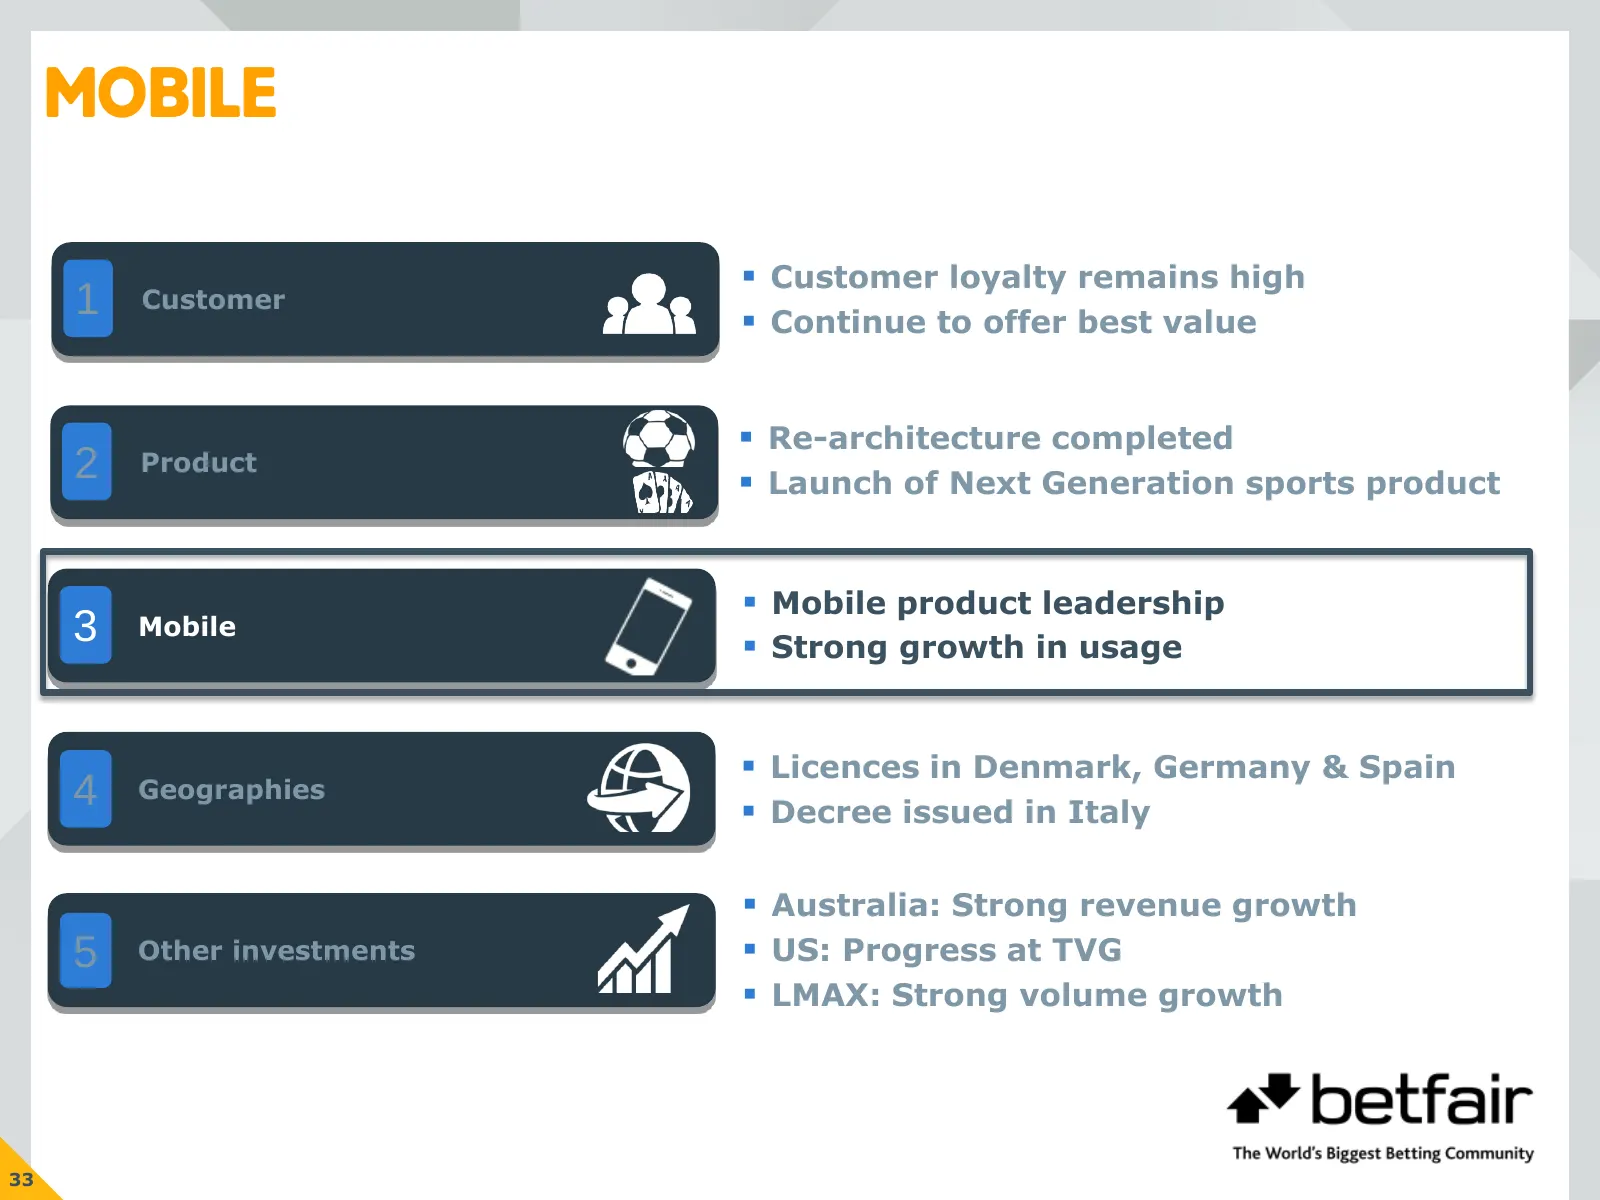
MOBILE Customer loyalty remains high 1 Customer Continue to offer best value Re-architecture completed 2 Product Launch of Next Generation sports product Mobile product leadership 3 Mobile Strong growth in usage Licences in Denmark, Germany & Spain 4 Geographies Decree issued in Ital
Slide 35: Mobile: Product
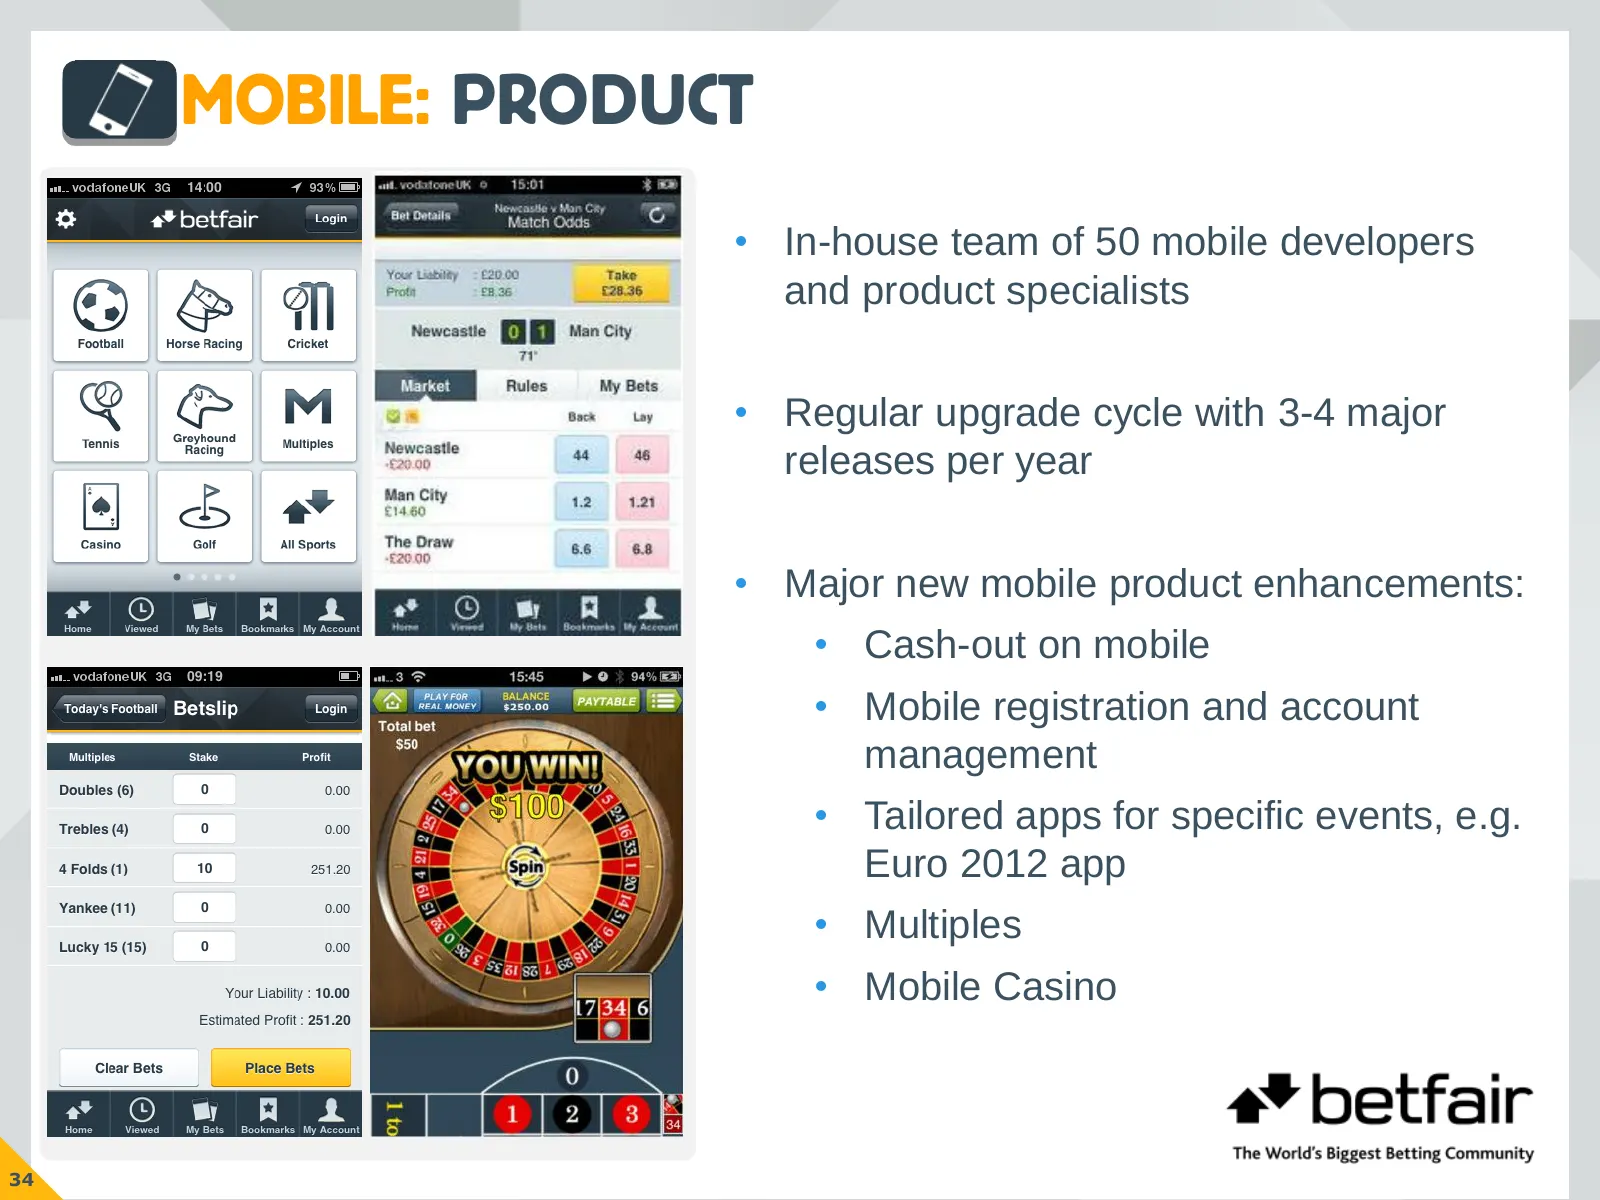
MOBILE: PRODUCT • In-house team of 50 mobile developers and product specialists • Regular upgrade cycle with 3-4 major releases per year • Major new mobile product enhancements: • Cash-out on mobile • Mobile registration and account management • Tailored apps for specific events, e.g. Euro 2012 app
Slide 36: Mobile: Internationalisation
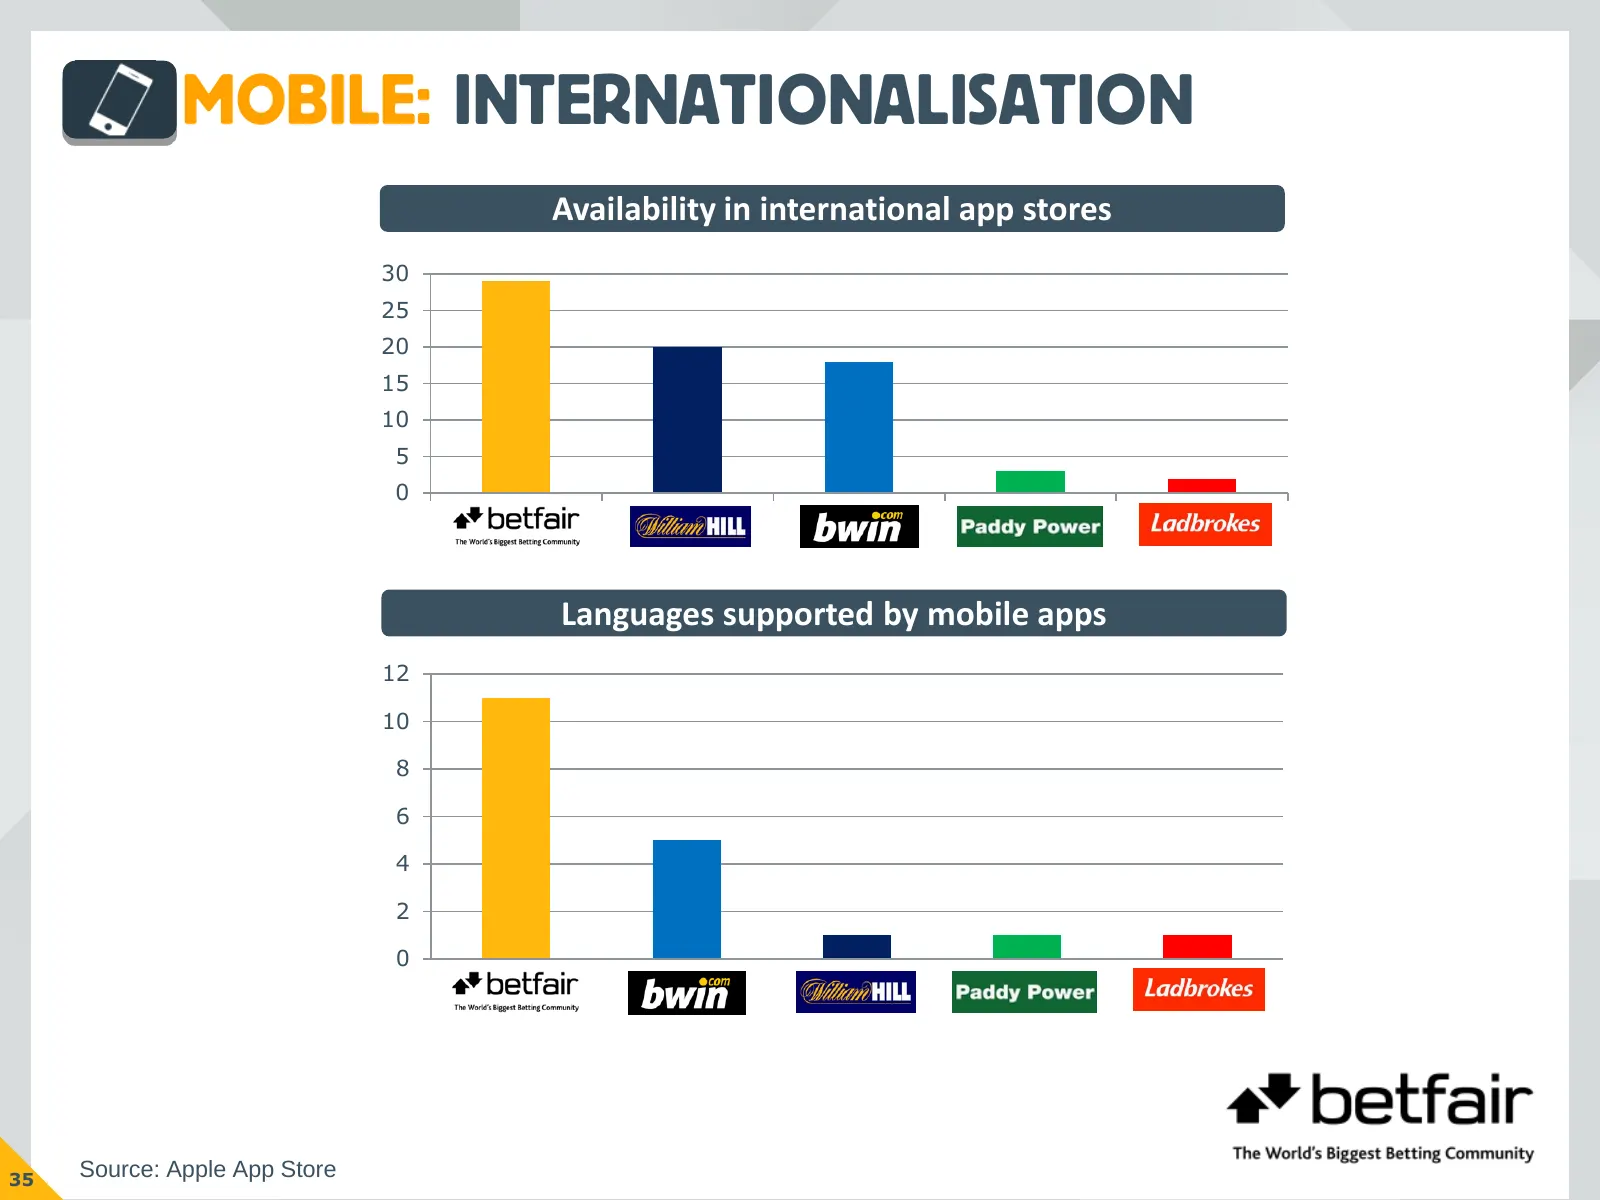
MOBILE: INTERNATIONALISATION Availability in international app stores 30 25 20 15 10 5 0 Languages supported by mobile apps 12 10 8 6 4 2 0 35 Source: Apple App Store
Slide 37: Mobile: KPIs
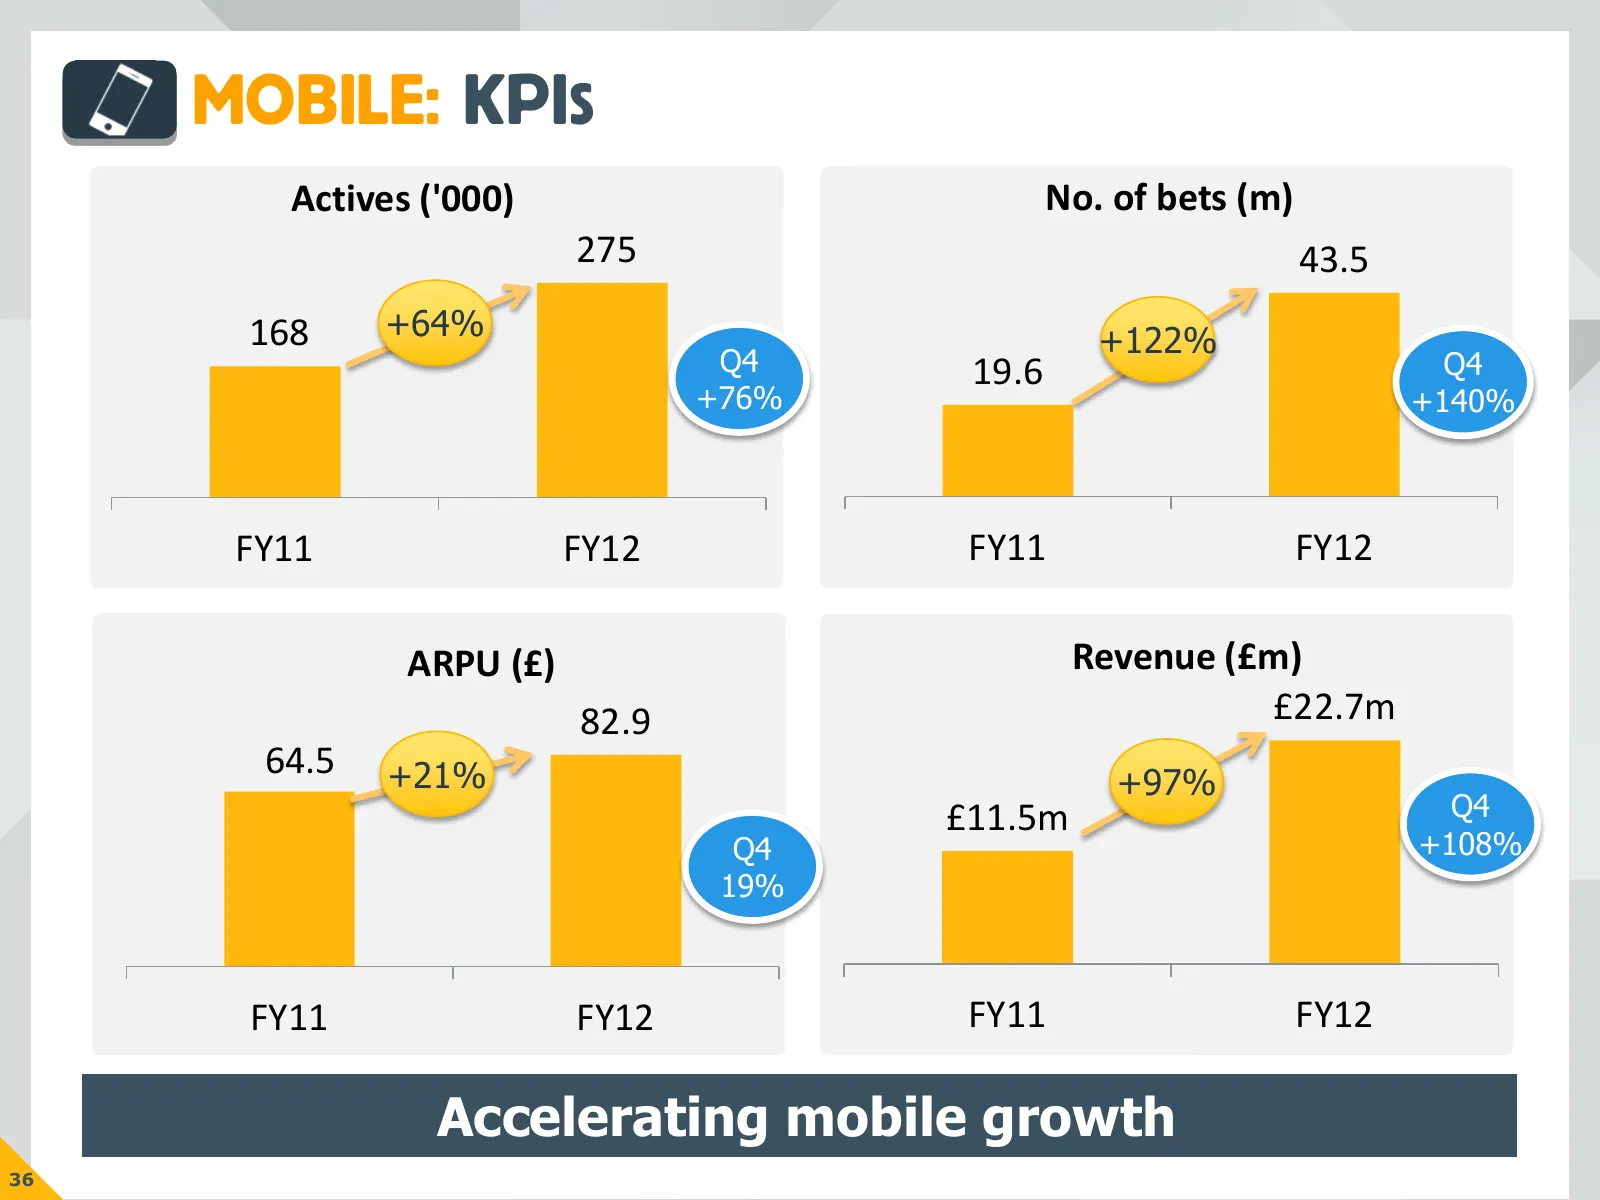
MOBILE: KPIS Actives ('000) No. of bets (m) 275 43.5 168 +64% +122% Q4 19.6 Q4 +76% +140% FY11 FY12 FY11 FY12 ARPU (£) Revenue (£m) 82.9 £22.7m 64.5 +21% +97% £11.5m Q4 Q4 +108% 19% FY11 FY12 FY11 FY12 Accelerating mobile growth 36
Slide 38: Geographies
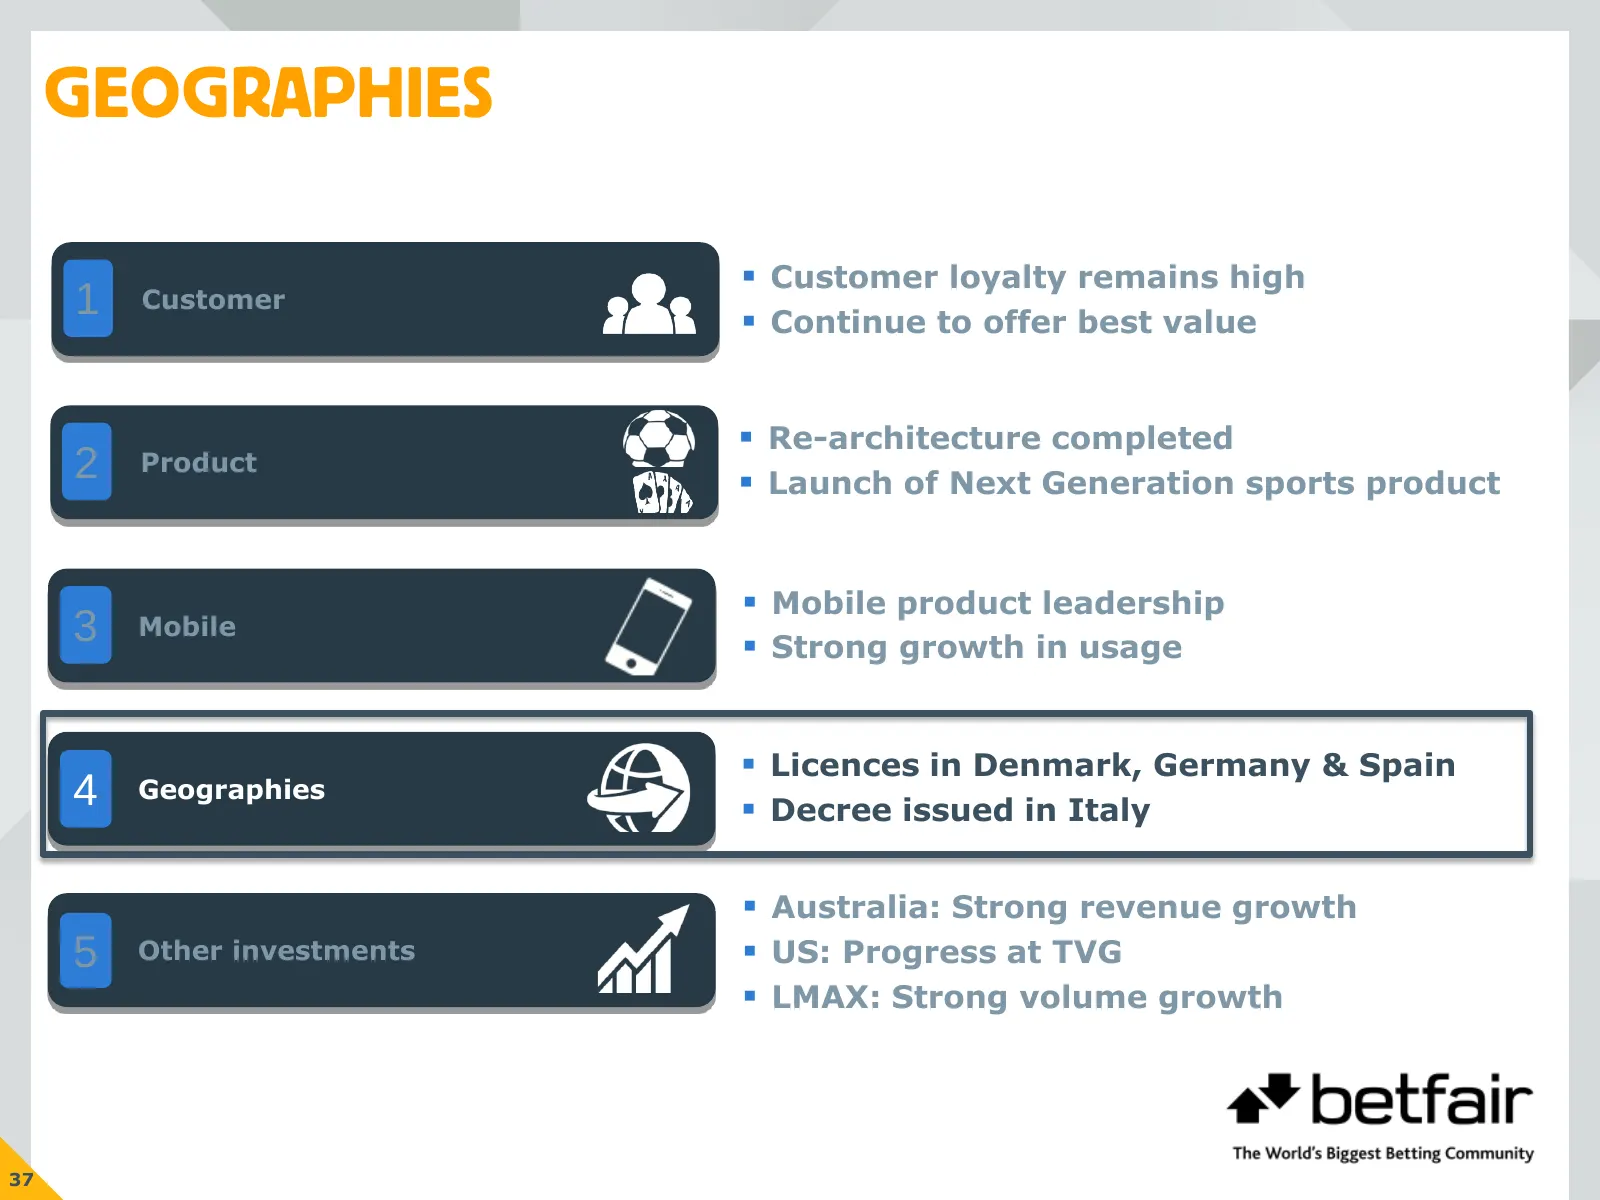
GEOGRAPHIES Customer loyalty remains high 1 Customer Continue to offer best value Re-architecture completed 2 Product Launch of Next Generation sports product Mobile product leadership 3 Mobile Strong growth in usage Licences in Denmark, Germany & Spain 4 Geographies Decree issued in
Slide 39: Regulation Update
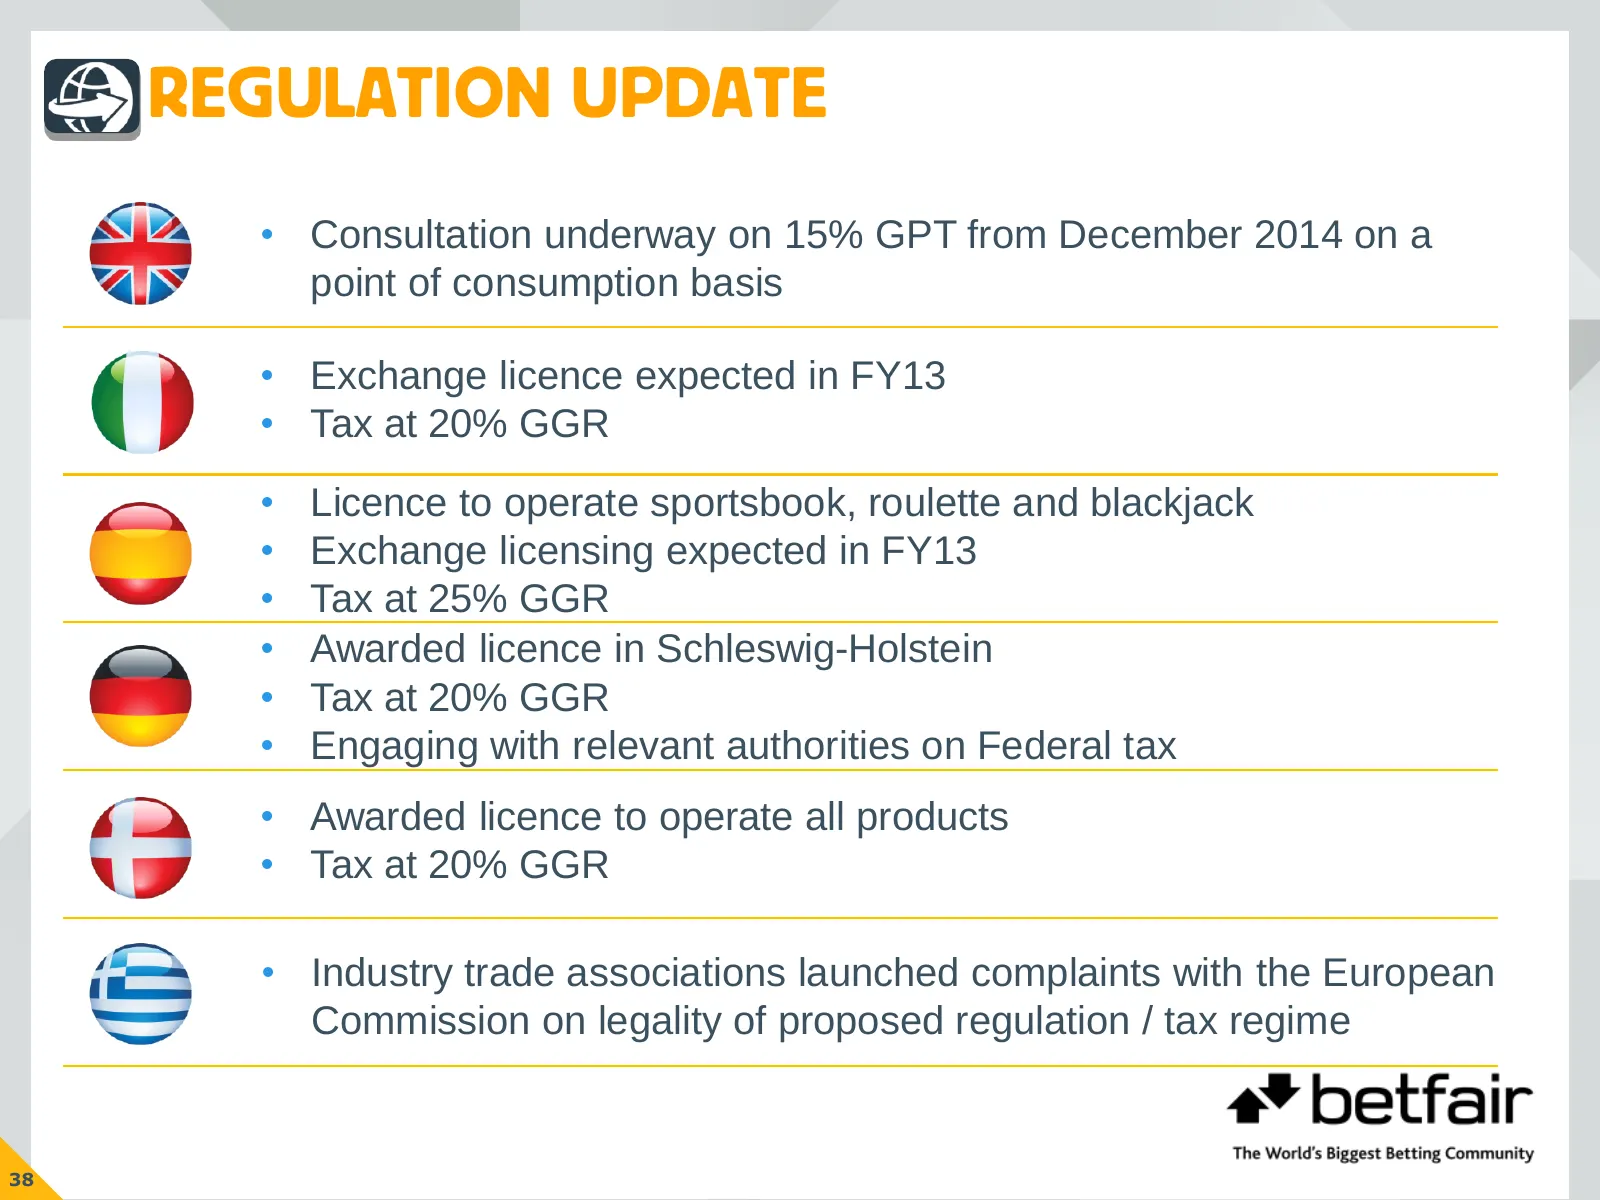
REGULATION UPDATE • Consultation underway on 15% GPT from December 2014 on a point of consumption basis • Exchange licence expected in FY13 • Tax at 20% GGR • Licence to operate sportsbook, roulette and blackjack • Exchange licensing expected in FY13 • Tax at 25% GGR • Awarded licence in Schleswig-H
Slide 40: Regulated Mix
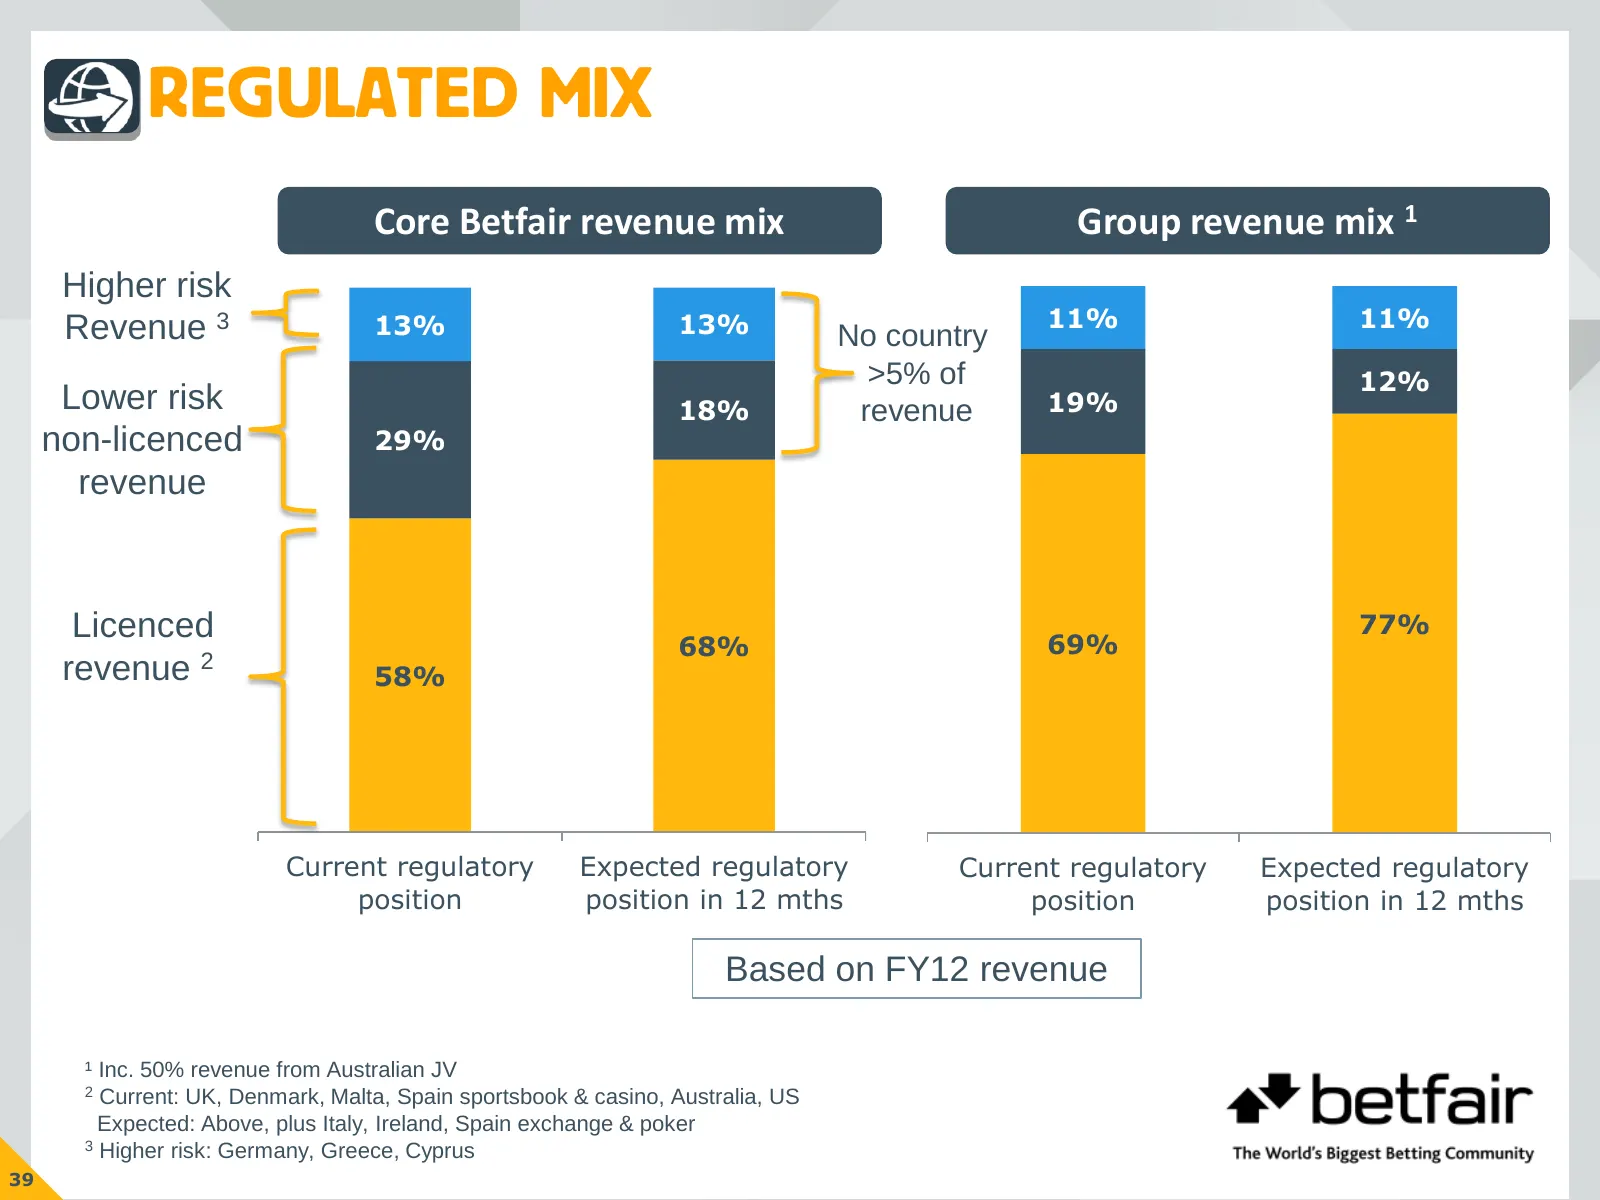
REGULATED MIX Core Betfair revenue mix Group revenue mix 1 Higher risk Revenue 3 13% 13% 11% 11% No country >5% of 12% Lower risk 18% revenue 19% non-licenced 29% revenue Licenced 77% 68% 69% revenue 2 58% Current regulatory Expected regulatory Current regulatory Expected regulatory position positio
Slide 41: Other Investments
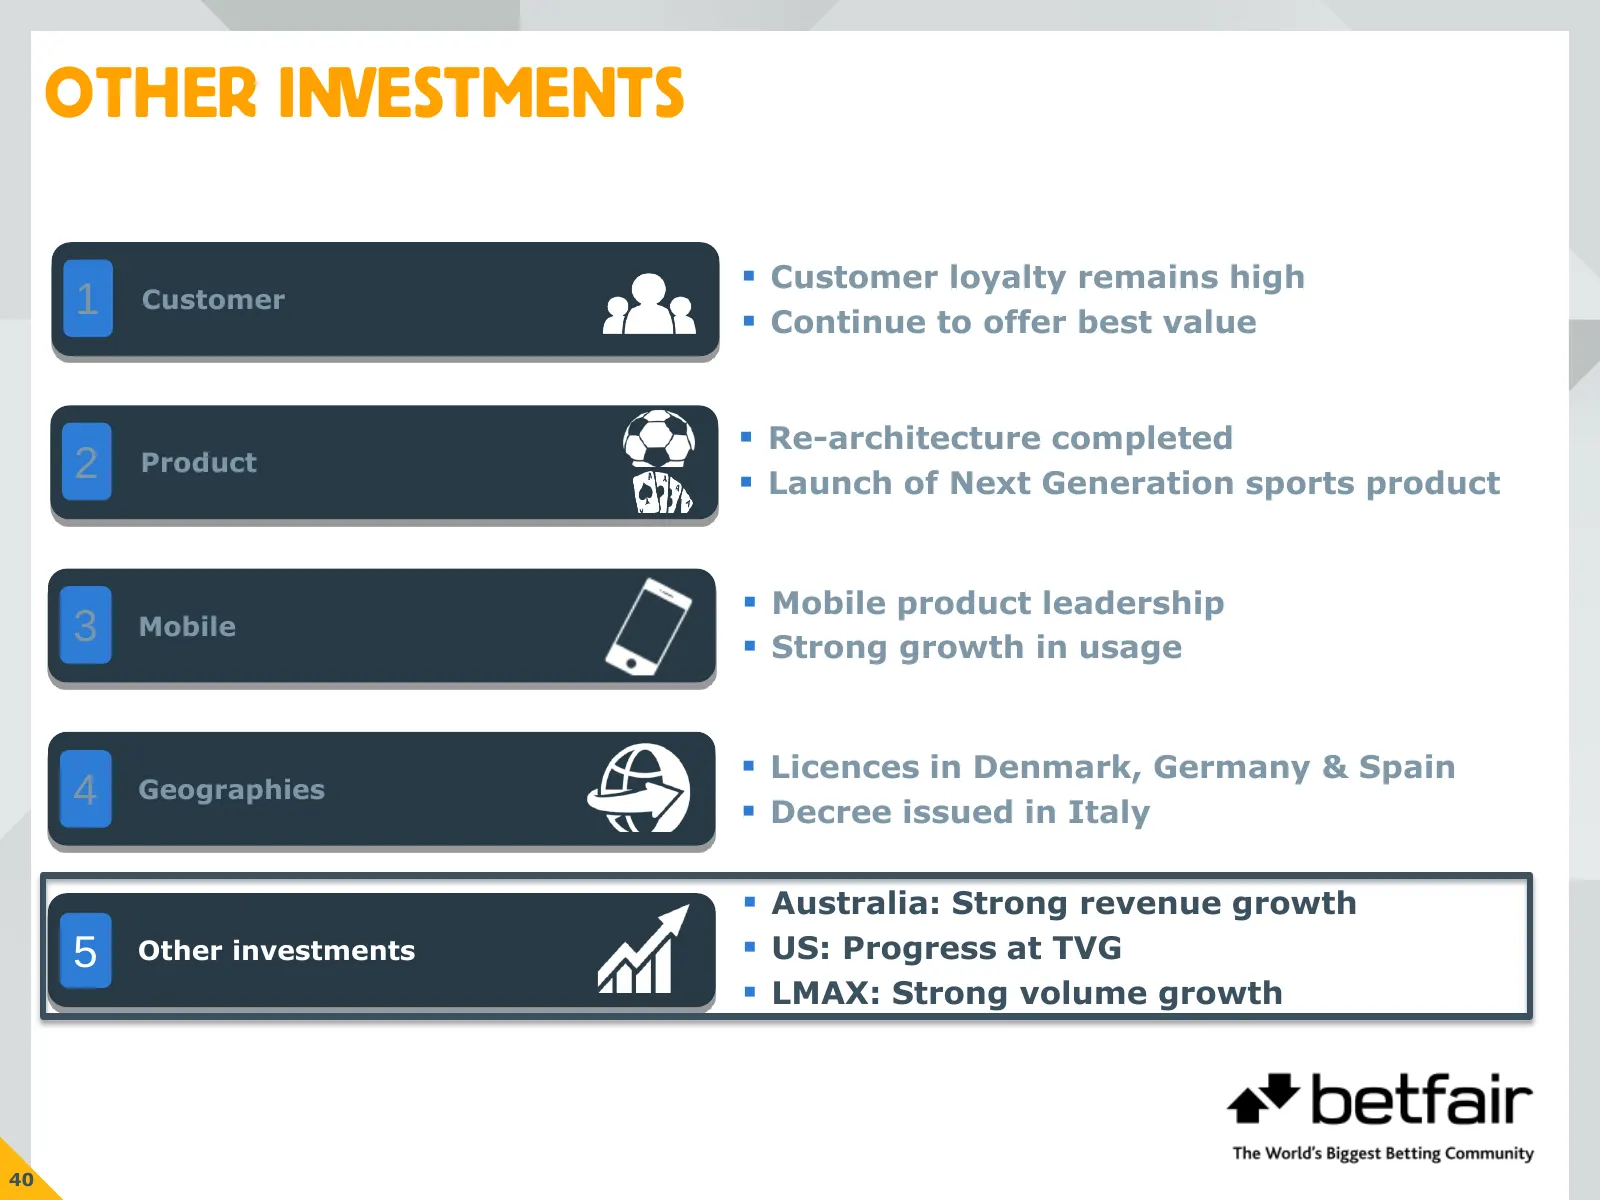
OTHER INVESTMENTS Customer loyalty remains high 1 Customer Continue to offer best value Re-architecture completed 2 Product Launch of Next Generation sports product Mobile product leadership 3 Mobile Strong growth in usage Licences in Denmark, Germany & Spain 4 Geographies Decree iss
Slide 42: Betfair Australia
BETFAIR AUSTRALIA Revenue A$m A$60m A$50m A$40m A$30m A$20m A$10m A$0m FY07A FY08A FY09A FY10A FY11A FY12A Strong revenue growth: up 21% in local currency Disappointing High Court decision Increased base rate of commission from 5% to 6.5% Considering further commercial response Introduced
Slide 43: Betfair US
BETFAIR US EBITDA (£m) FY10 FY11 FY12 1.8 (2.2) (0.4) (1.2) TVG Exchange / Bus Dev (5.0) Betfair US Standalone TVG achieved profitability Slower than expected Exchange progress in California 42
Slide 44: LMAX
LMAX Monthly LMAX volumes ($bn) 30 25 20 15 10 5 0 Proved exchange concept works in retail financial products Top 30 Global retail FX provider one year on from re-launch FY13 focus on conversion of sales leads to continue volume growth 43
Slide 45: Current Trading and Outlook
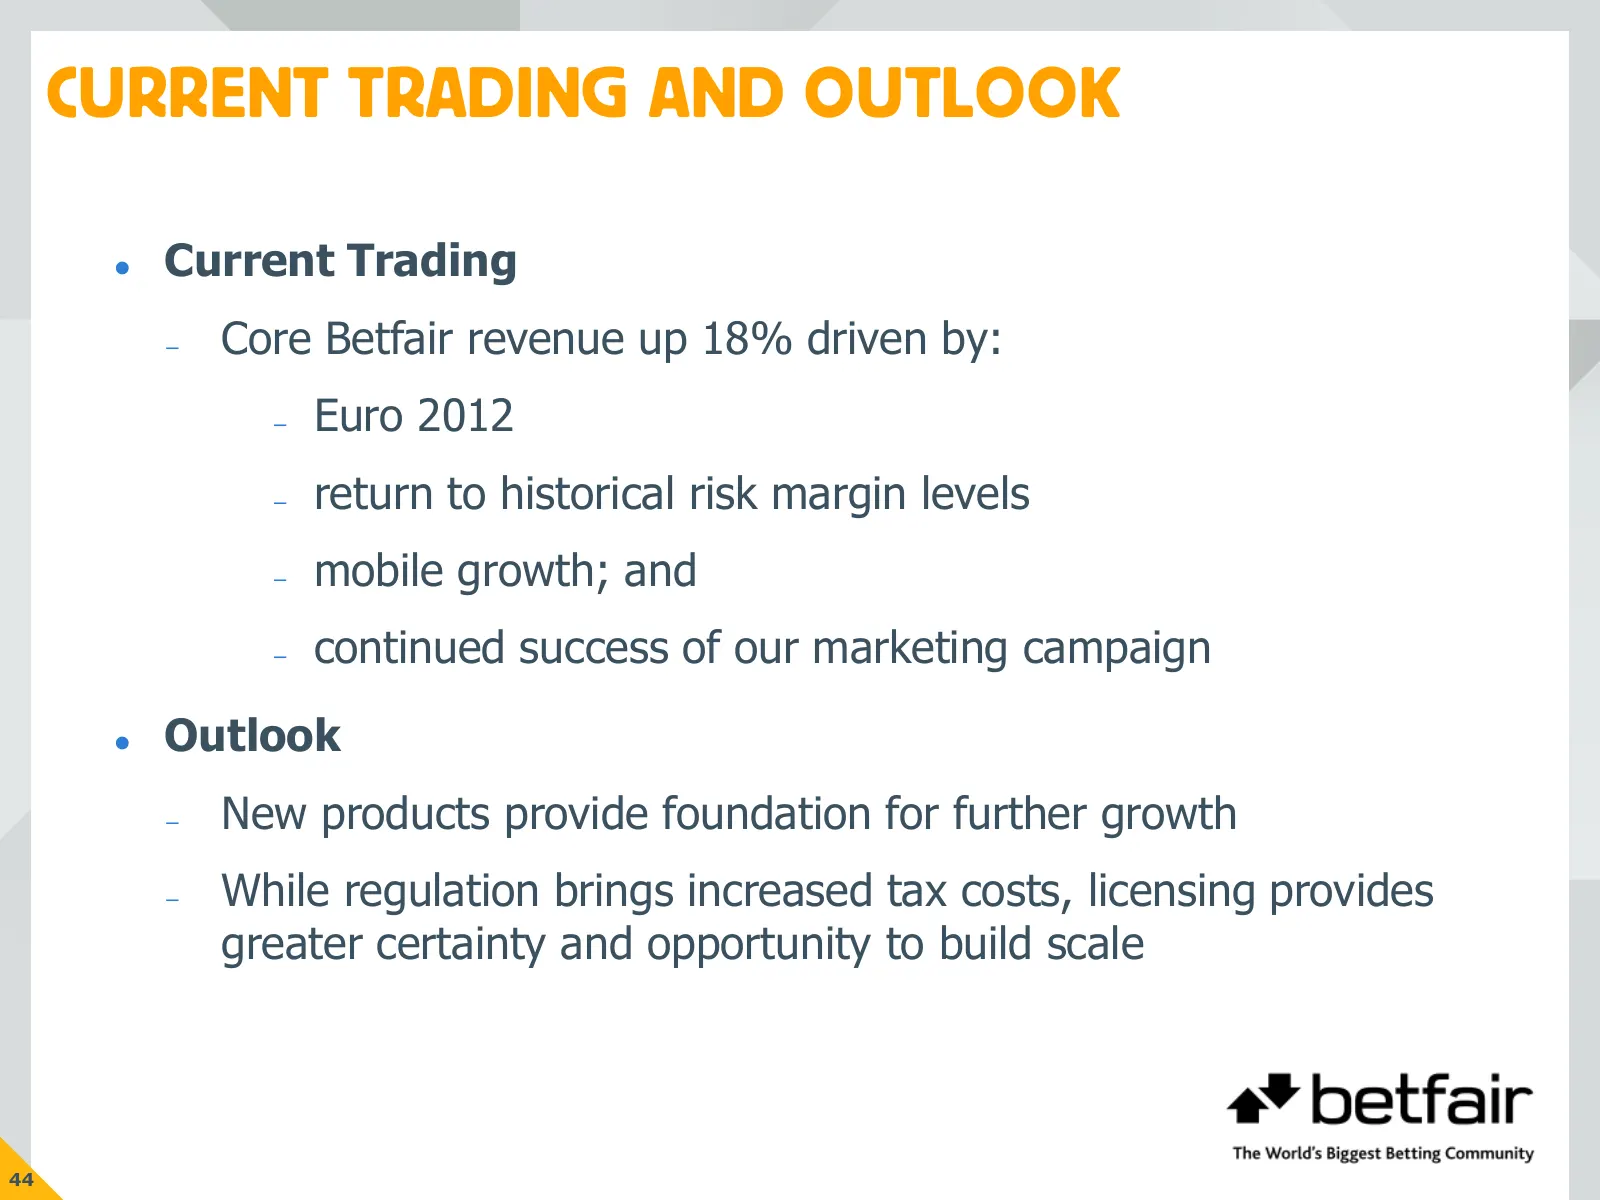
CURRENT TRADING AND OUTLOOK Current Trading – Core Betfair revenue up 18% driven by: – Euro 2012 – return to historical risk margin levels – mobile growth; and – continued success of our marketing campaign Outlook – New products provide foundation for further growth – While regulation brings inc
Slide 46: Summary
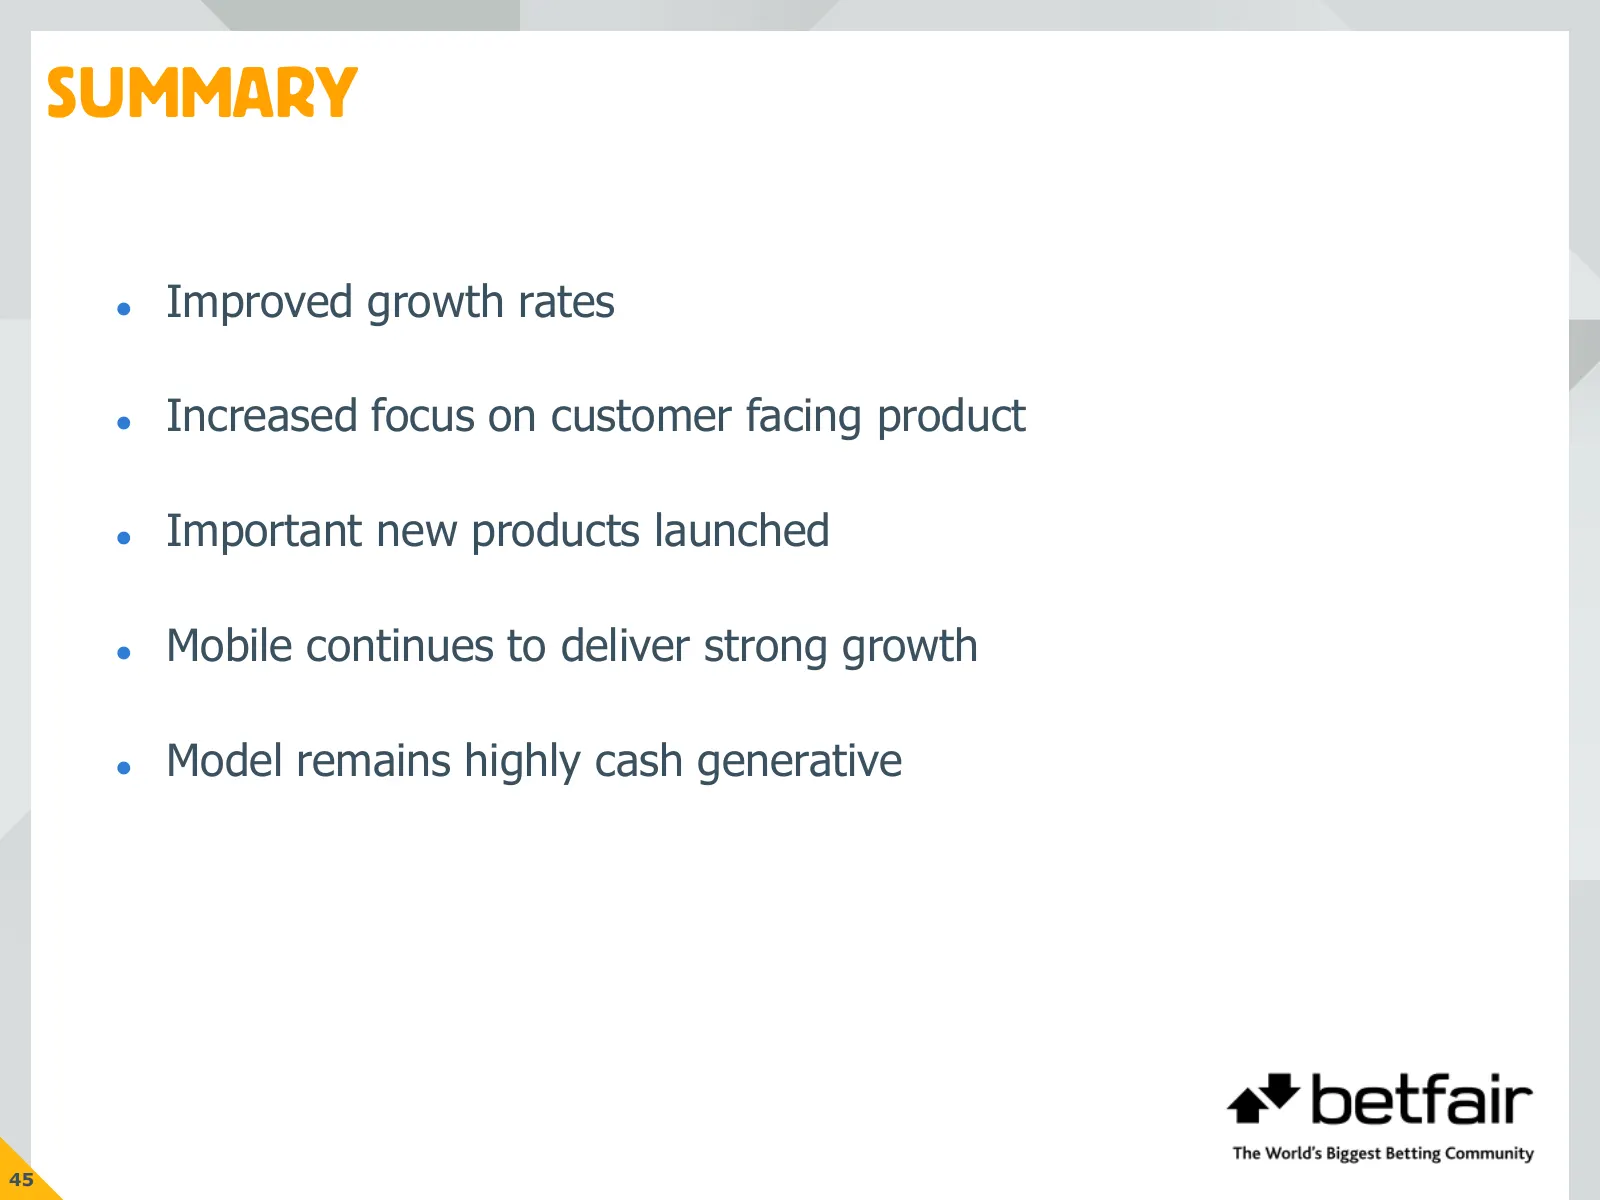
SUMMARY Improved growth rates Increased focus on customer facing product Important new products launched Mobile continues to deliver strong growth Model remains highly cash generative 45

Slide 47: Betfair: The World's Biggest Betting Community
a* betfair The World's Biggest Betting Community
Slide 48: Exchange Performance
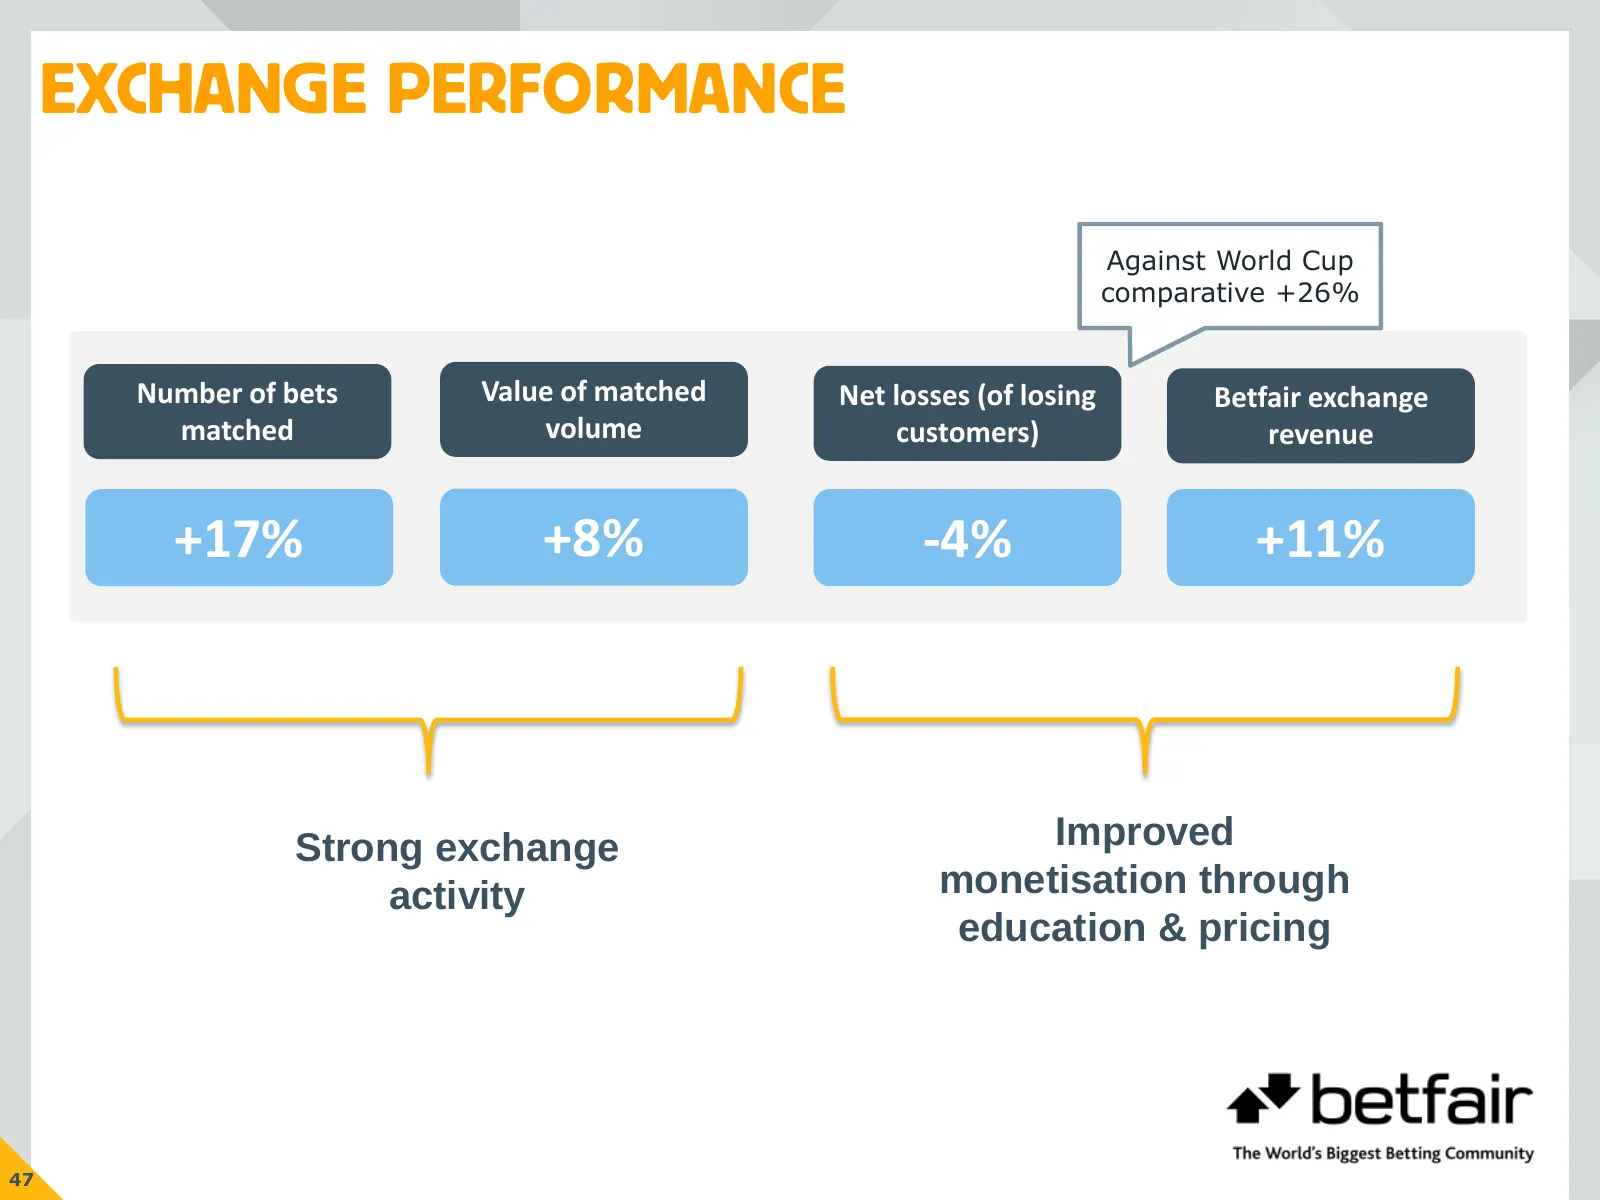
EXCHANGE PERFORMANCE Against World Cup comparative +26% Number of bets Value of matched Net losses (of losing Betfair exchange matched volume customers) revenue +17% +8% -4% +11% Strong exchange Improved activity monetisation through education & pricing 47
Slide 49: Underlying Group Income Statement
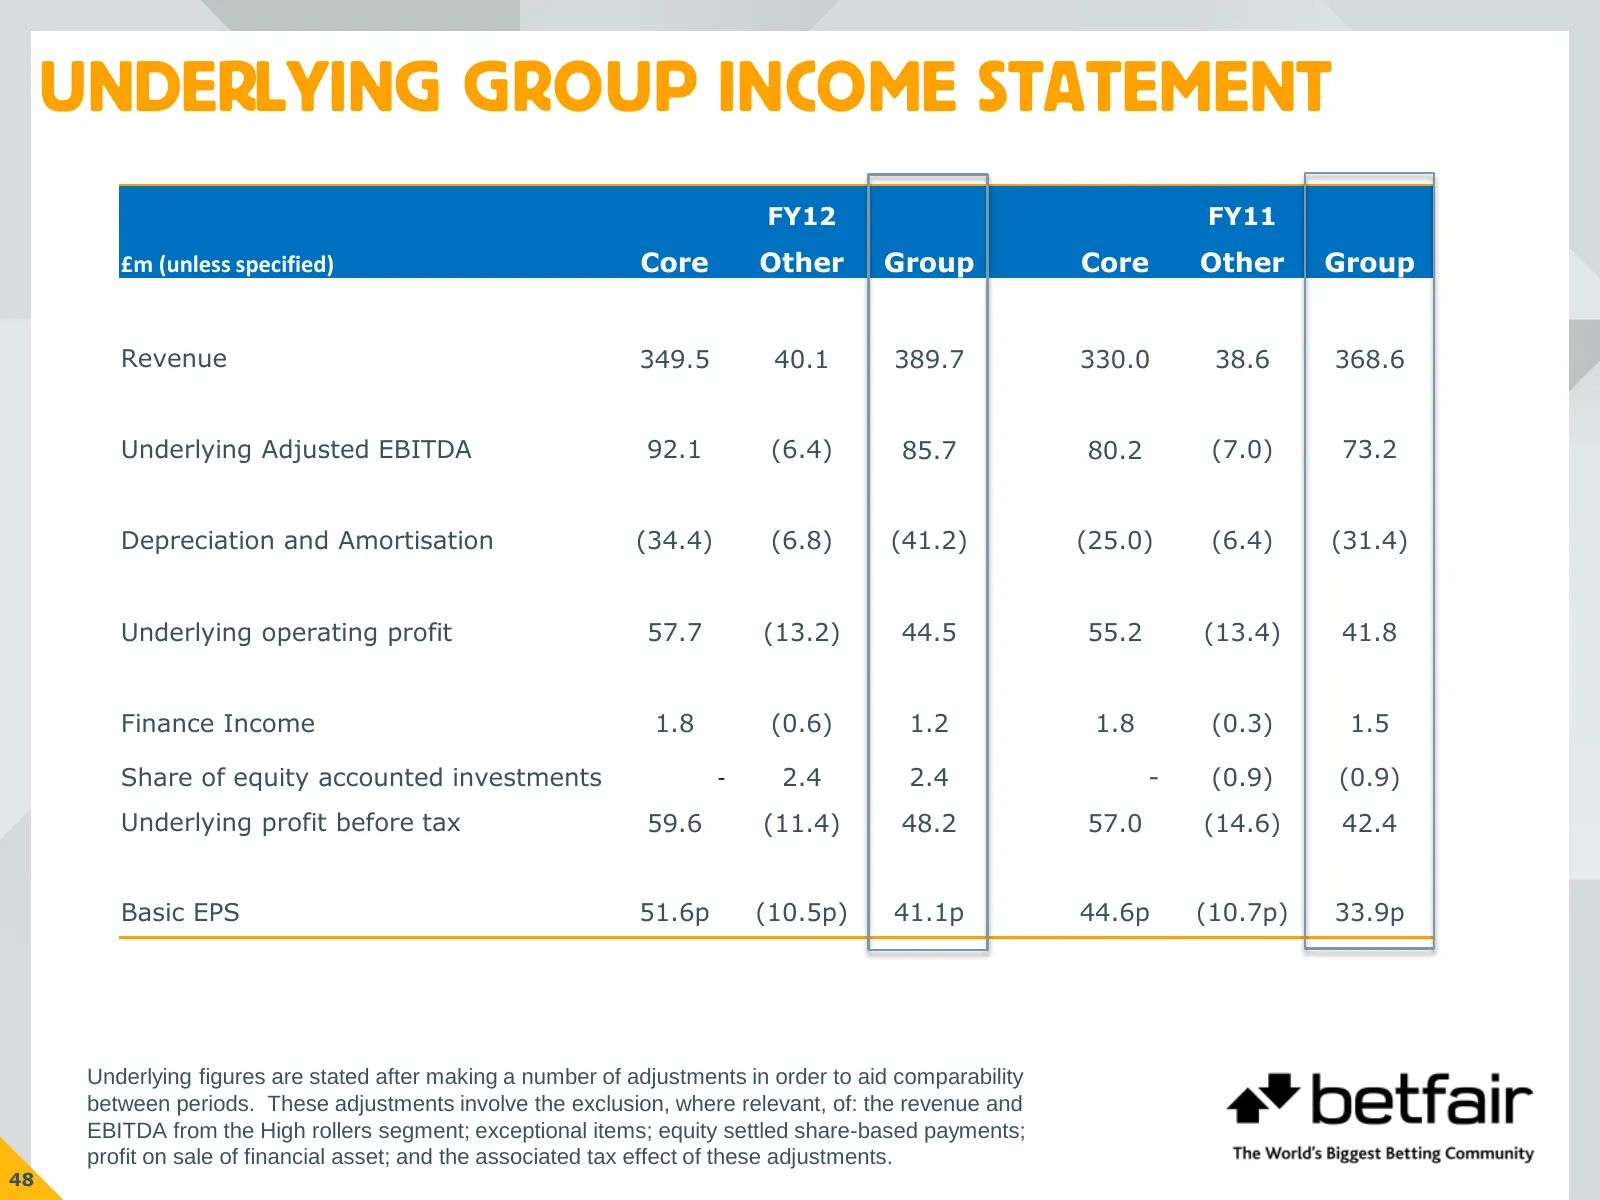
UNDERLYING GROUP INCOME STATEMENT FY12 FY11 £m (unless specified) Core Other Group Core Other Group Revenue 349.5 40.1 389.7 330.0 38.6 368.6 Underlying Adjusted EBITDA 92.1 (6.4) 85.7 80.2 (7.0) 73.2 Depreciation and Amortisation (34.4) (6.8) (41.2) (25.0) (6.4) (31.4) Underlying operating profit 5
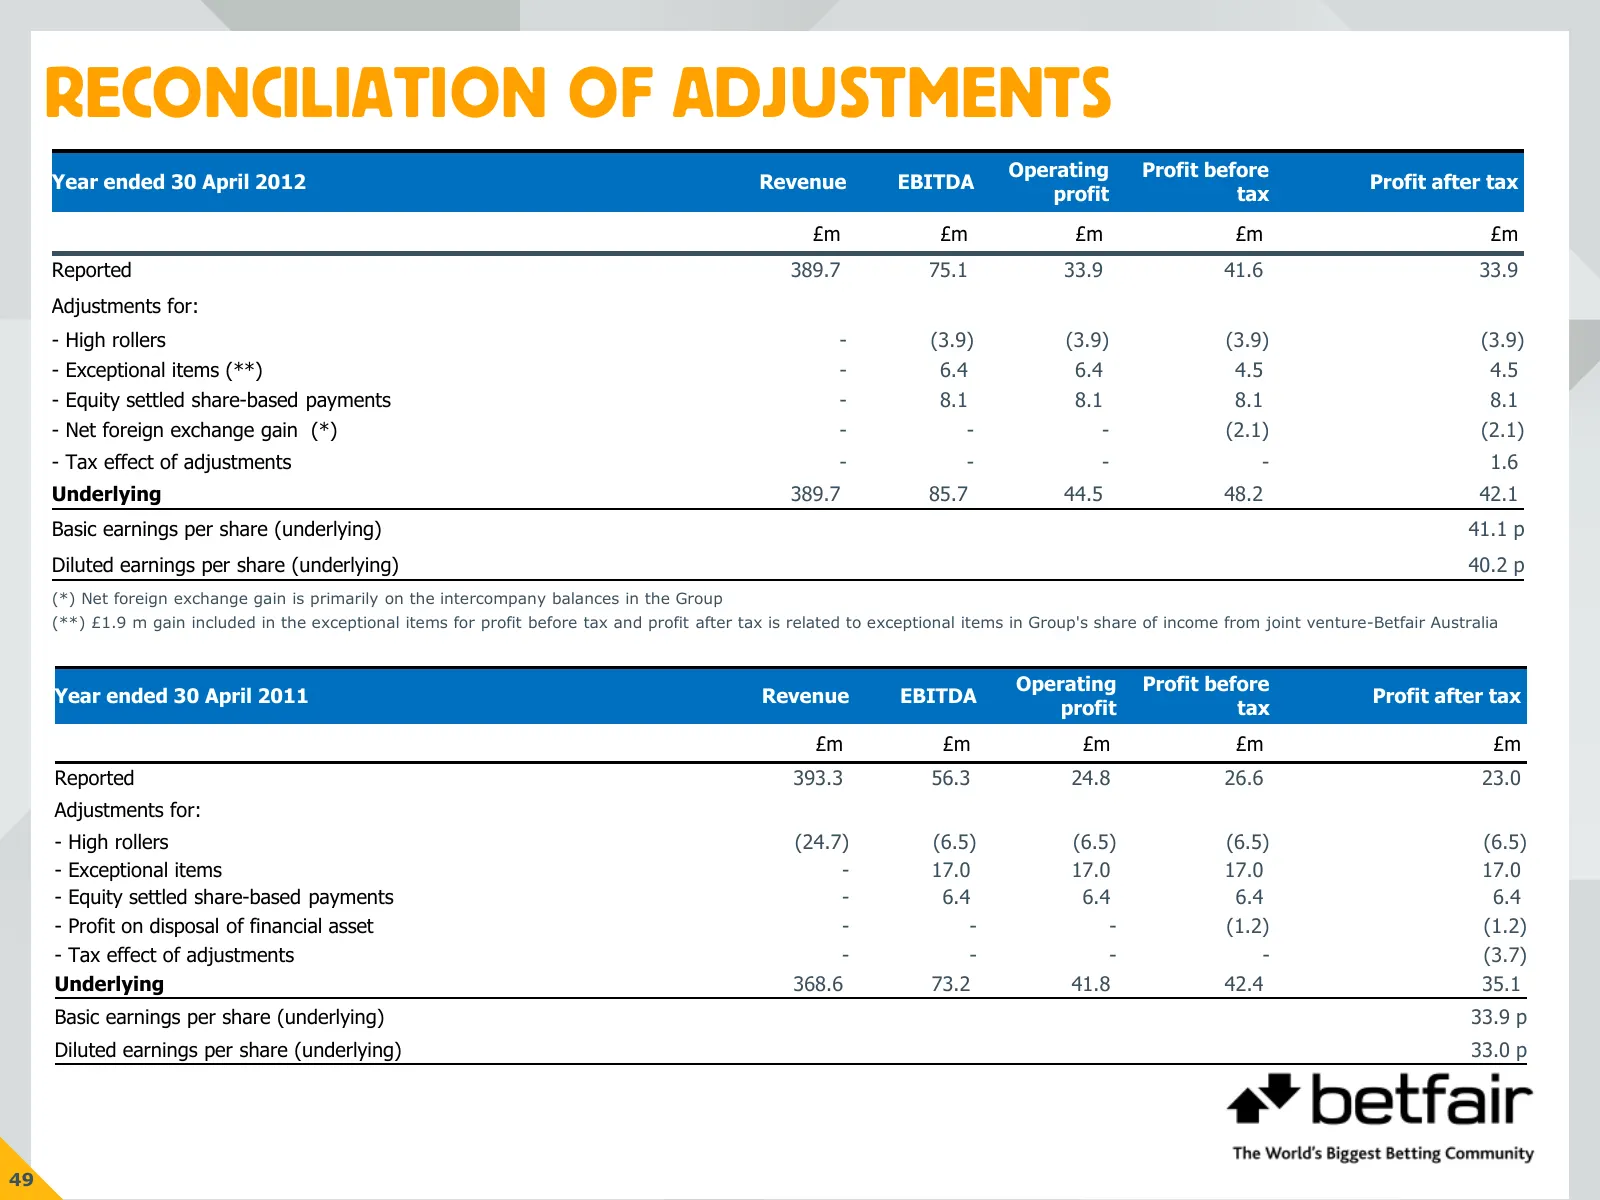
Slide 50: Reconciliation of Adjustments
RECONCILIATION OF ADJUSTMENTS Operating Profit before Year ended 30 April 2012 Revenue EBITDA Profit after tax. profit tax £m. £m. £m. £m. £m. Reported 389.7. 75.1. 33.9. 41.6. 33.9. Adjustments for: - High rollers - (3.9) (3.9) (3.9) (3.9) - Exceptional items (**) - 6.4. 6.4. 4.5. 4.5. - Equity set
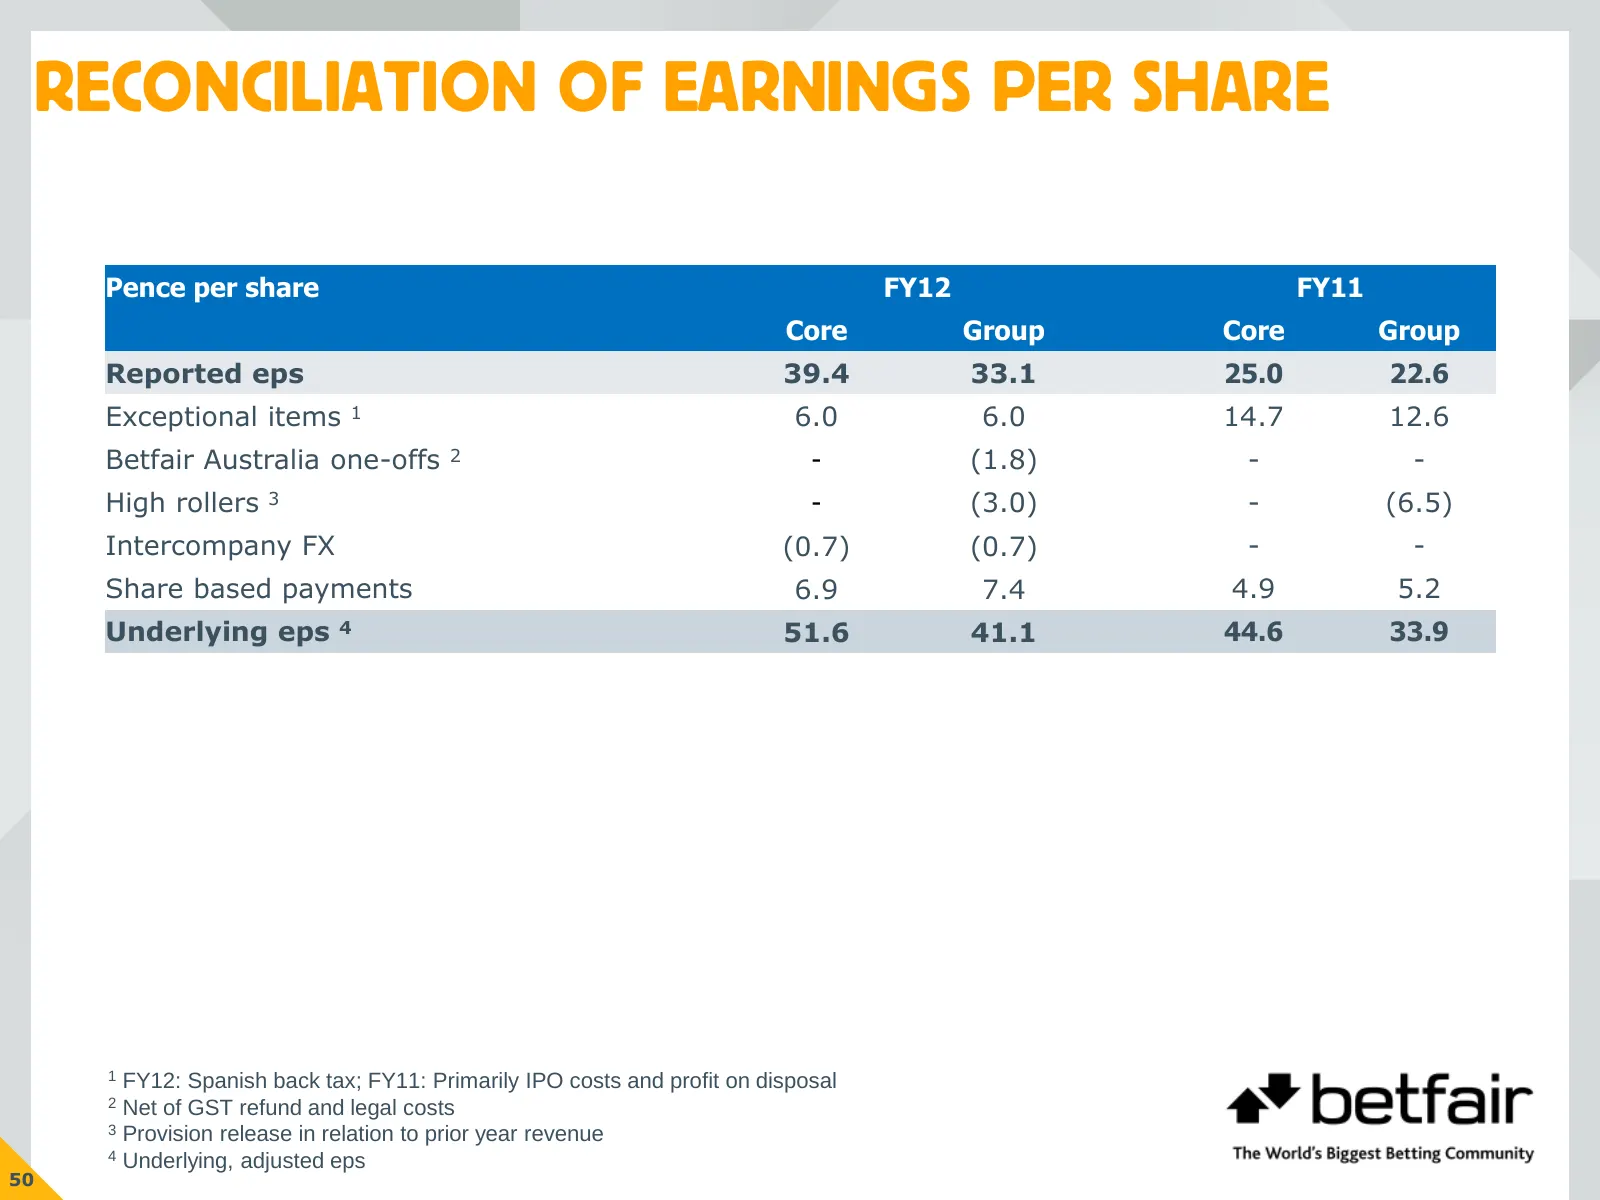
Slide 51: Reconciliation of Earnings per Share
RECONCILIATION OF EARNINGS PER SHARE Pence per share FY12 FY11 Core Group Core Group Reported eps 39.4 33.1 25.0 22.6 Exceptional items 1 6.0 6.0 14.7 12.6 Betfair Australia one-offs 2 - (1.8) - - High rollers 3 - (3.0) - (6.5) Intercompany FX (0.7) (0.7) - - Share based payments 6.9 7.4 4.9 5.2 Und
Source: Internet Archive copy of flutter.com
More decks from Flutter Entertainment plc
 Q3 2026 Earnings Presentation15 slides · Nov 4, 2026
 Q2 2026 Earnings Presentation14 slides · Aug 5, 2026
 Investor Day (September 2024)152 slides · Sep 25, 2024
 Q2 2024 Earnings Presentation20 slides · Aug 13, 2024
 Q1 2024 Earnings Presentation20 slides · May 14, 2024
 FY2023 Earnings Presentation36 slides · Mar 26, 2024