Arlington Asset Investment Corp
Arlington Asset Investment — Q3 2020 Earnings Presentation
20 slides from Arlington Asset Investment's earnings presentation, Nov 4, 2020

Slide 1: Investor Presentation Third Quarter 2020
Investor Presentation Third Quarter 2020 Exhibit 99.2
Slide 2: Information Related to Forward-Looking Statements
Information Related to Forward-Looking Statements Statements concerning interest rates, portfolio allocation, financing costs, portfolio hedging, prepayments, dividends, book value, utilization of loss carryforwards, any change in long-term tax structures (including any REIT election), use of equity
Slide 3: Contents
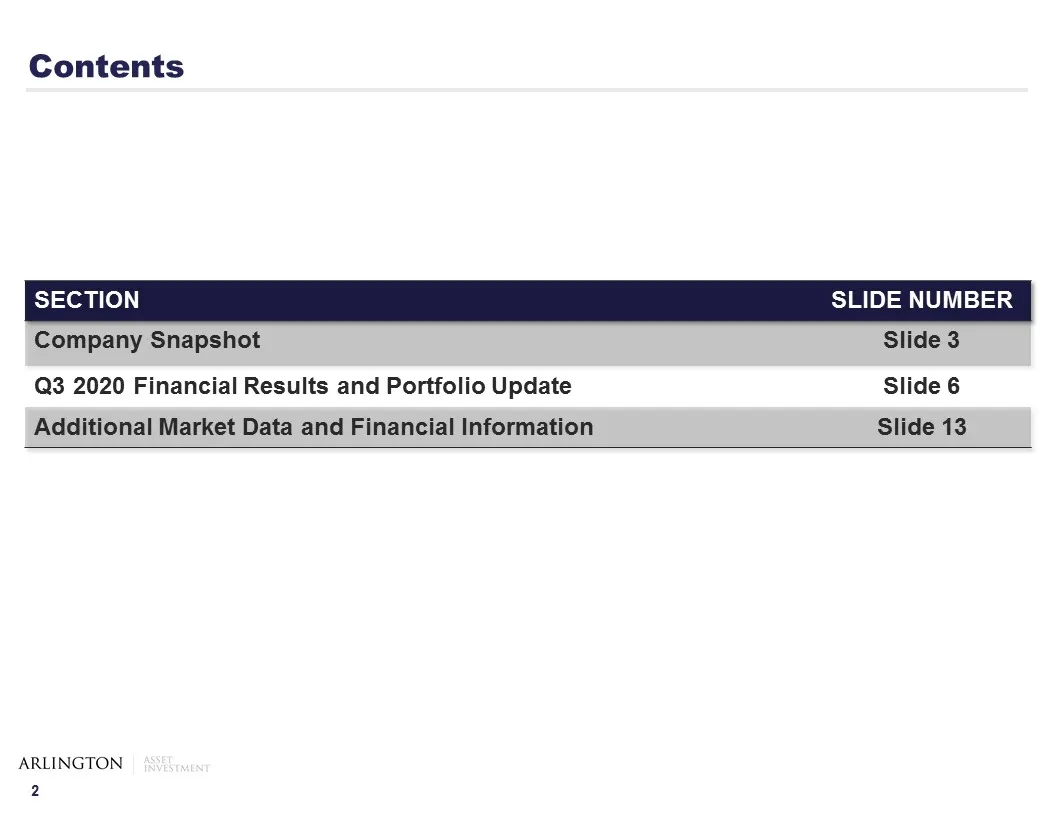
Contents SECTION SLIDE NUMBER Company Snapshot Slide 3 Q3 2020 Financial Results and Portfolio Update Slide 6 Additional Market Data and Financial Information Slide 13

Slide 4: Company Snapshot
ARLINGTON COMPANY SNAPSHOT
Slide 5: Publicly Traded Capital
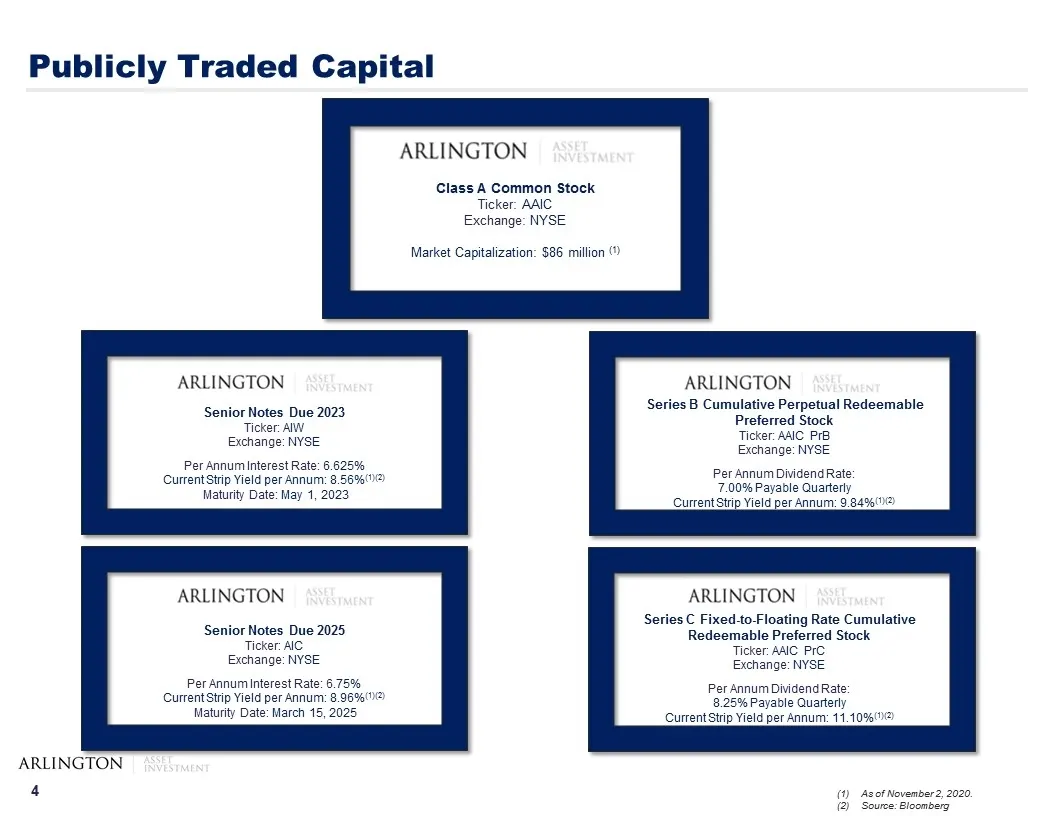
Publicly Traded Capital Class A Common Stock Ticker: AAIC Exchange: NYSE Market Capitalization: $86 million (1) Senior Notes Due 2023 Ticker: AIW Exchange: NYSE Per Annum Interest Rate: 6.625% Current Strip Yield per Annum: 8.56%(1)(2) Maturity Date: May 1, 2023 Senior Notes Due 2025 Ticker: AIC Exc
Slide 6: Company Snapshot
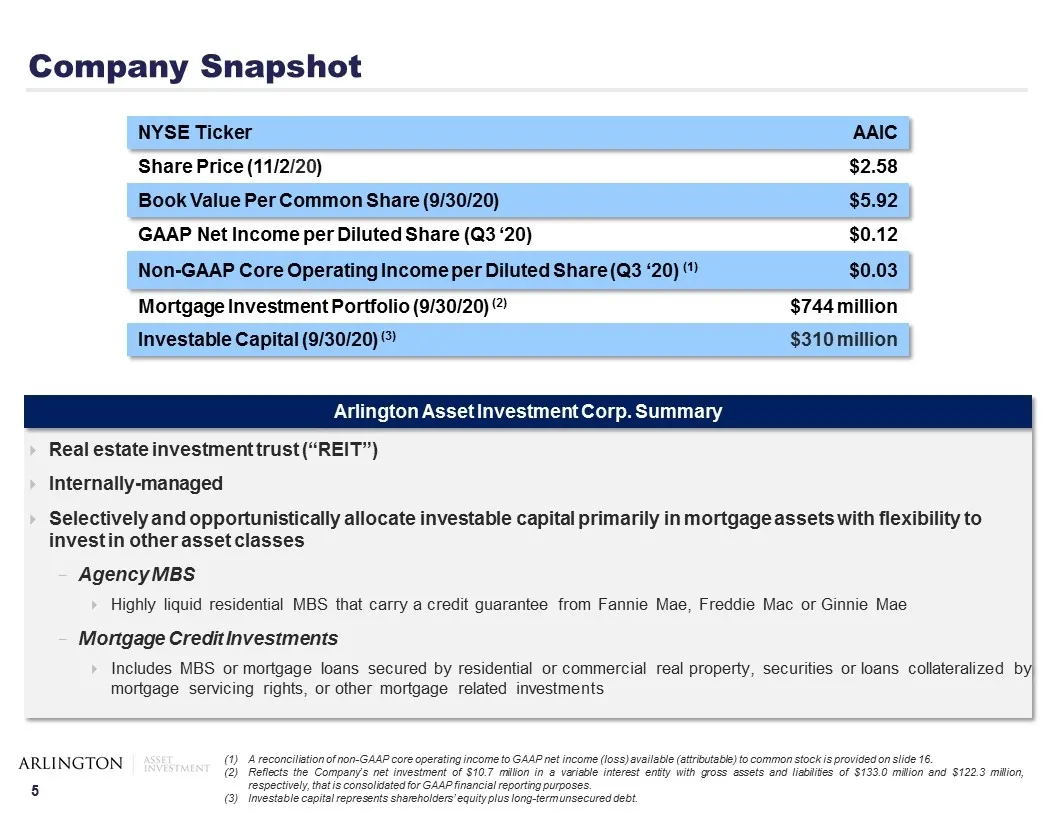
Company Snapshot Real estate investment trust (“REIT”) Internally-managed Selectively and opportunistically allocate investable capital primarily in mortgage assets with flexibility to invest in other asset classes Agency MBS Highly liquid residential MBS that carry a credit guarantee from Fannie Ma

Slide 7: Q3 2020 Financial Results and Portfolio Update
Q3 2020 FINANCIAL RESULTS AND PORTFOLIO UPDATE
Slide 8: Q3 2020 Financial Highlights
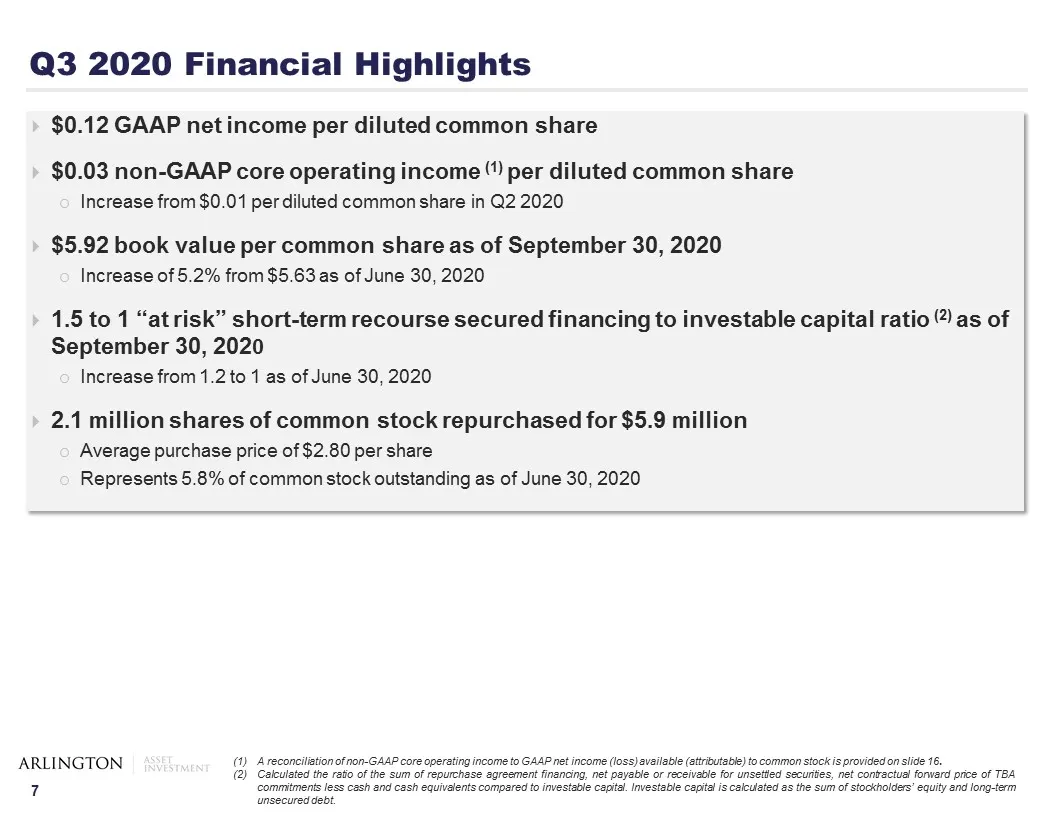
Q3 2020 Financial Highlights $0.12 GAAP net income per diluted common share $0.03 non-GAAP core operating income (1) per diluted common share Increase from $0.01 per diluted common share in Q2 2020 $5.92 book value per common share as of September 30, 2020 Increase of 5.2% from $5.63 as of June 30,
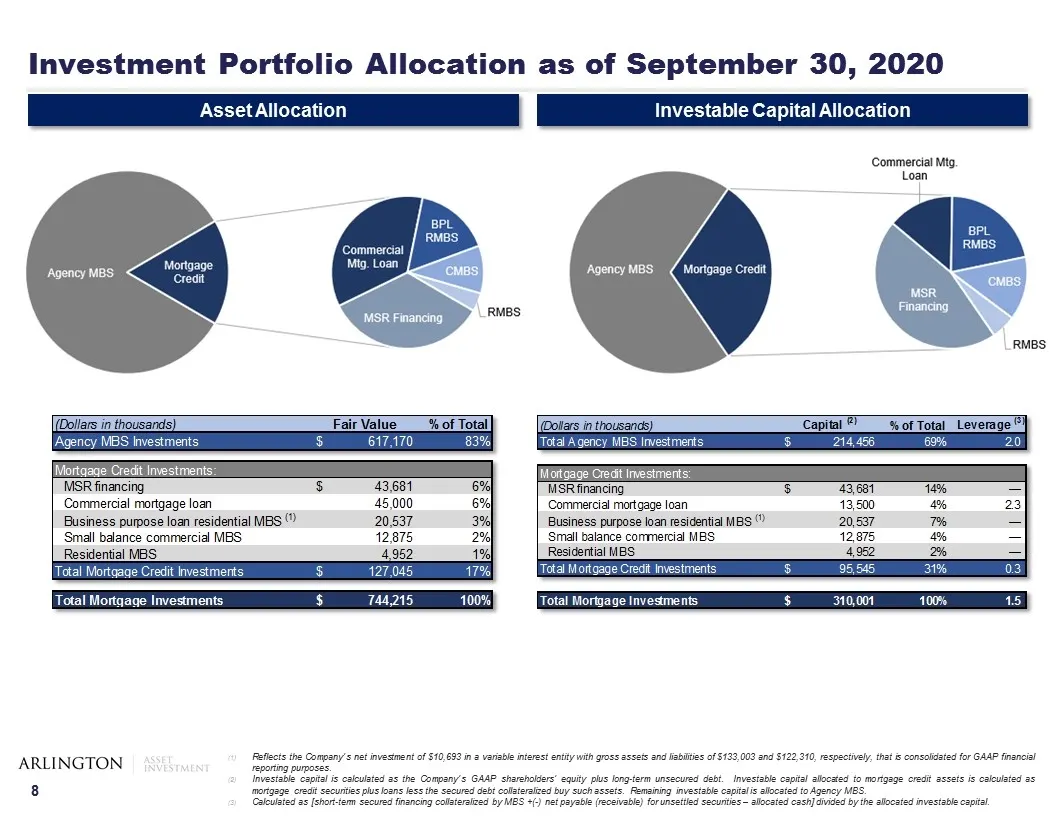
Slide 9: Investment Portfolio Allocation as of September 30, 2020
Investment Portfolio Allocation as of September 30, 2020 Asset Allocation Investable Capital Allocation Reflects the Company’s net investment of $10,693 in a variable interest entity with gross assets and liabilities of $133,003 and $122,310, respectively, that is consolidated for GAAP financial rep
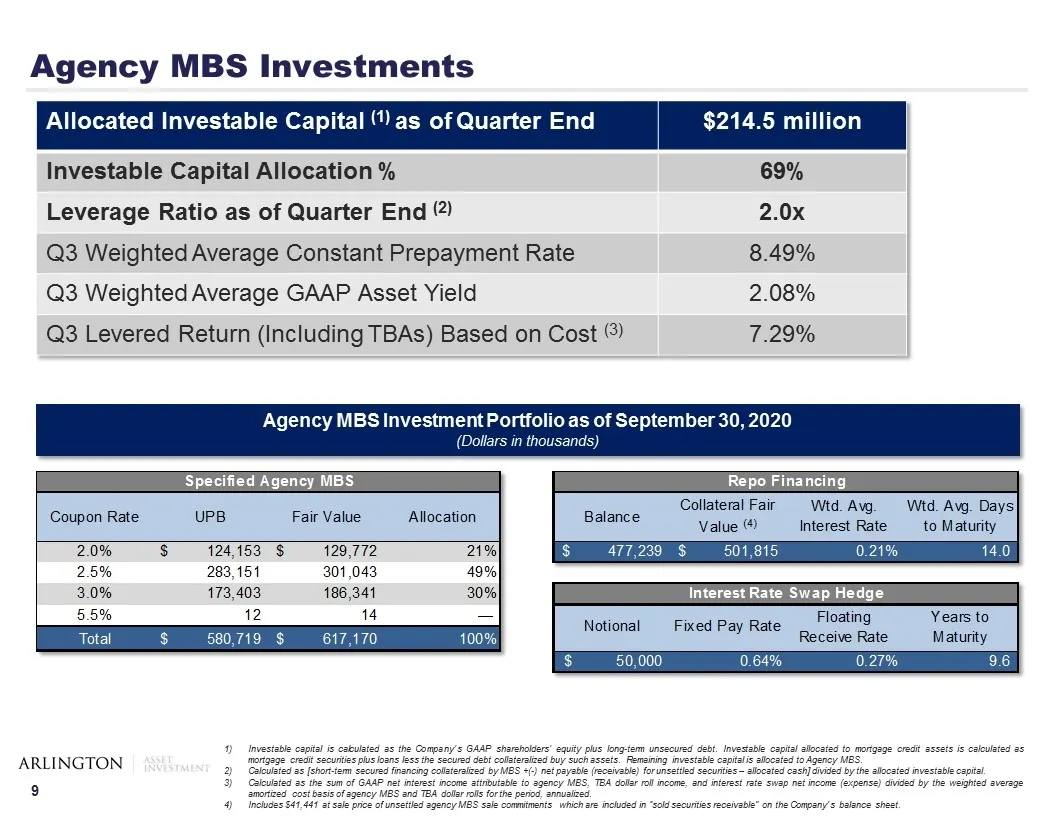
Slide 10: Agency MBS Investments
Agency MBS Investments Agency MBS Investment Portfolio as of September 30, 2020 (Dollars in thousands) Investable capital is calculated as the Company’s GAAP shareholders’ equity plus long-term unsecured debt. Investable capital allocated to mortgage credit assets is calculated as mortgage credit se
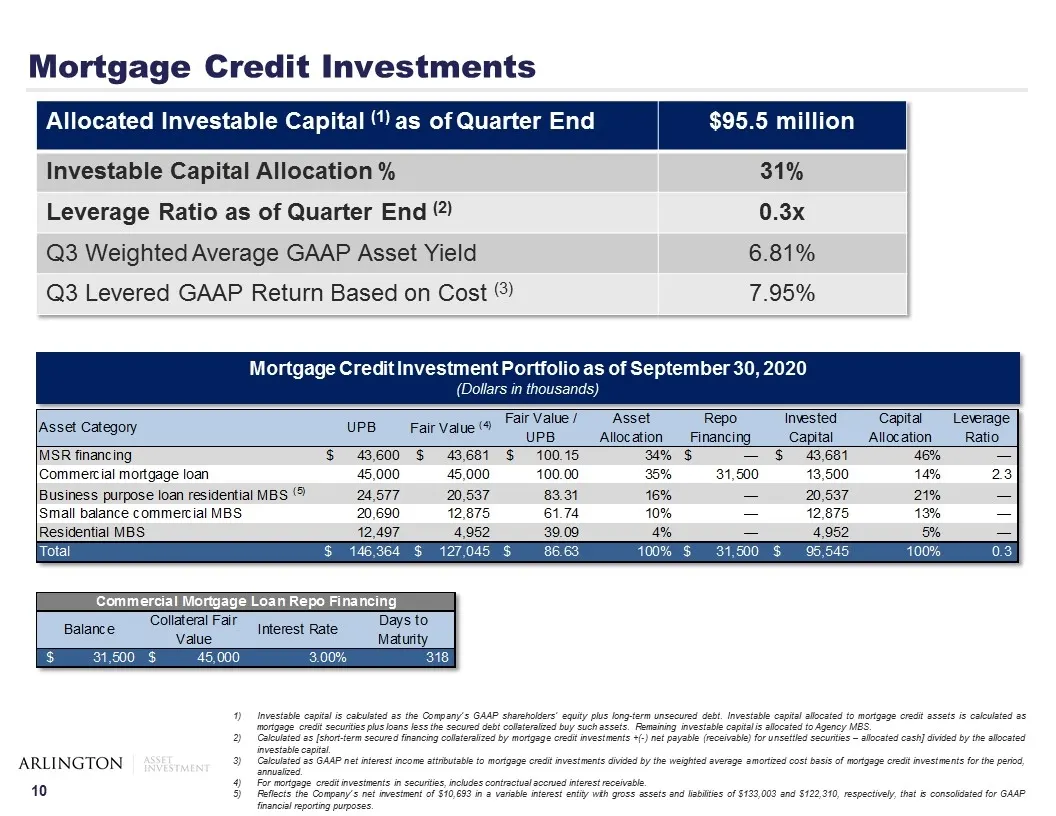
Slide 11: Mortgage Credit Investments
Mortgage Credit Investments Investable capital is calculated as the Company’s GAAP shareholders’ equity plus long-term unsecured debt. Investable capital allocated to mortgage credit assets is calculated as mortgage credit securities plus loans less the secured debt collateralized buy such assets. R
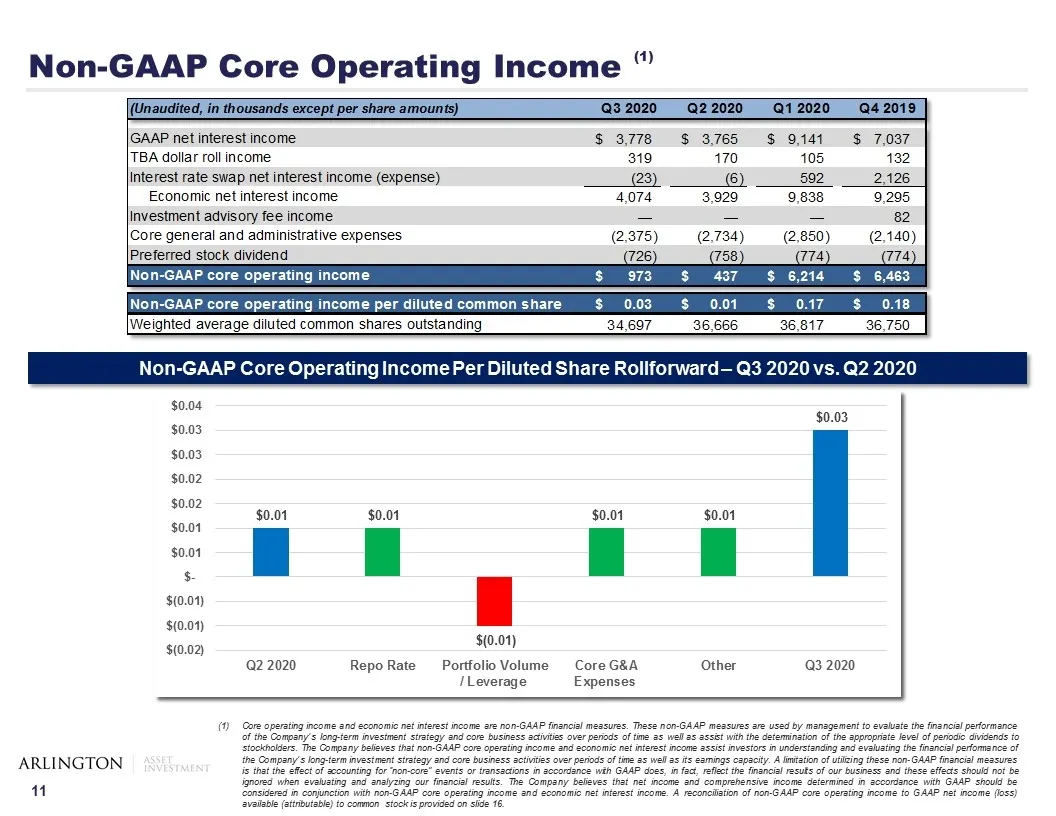
Slide 12: Non-GAAP Core Operating Income
Non-GAAP Core Operating Income (1) Core operating income and economic net interest income are non-GAAP financial measures. These non-GAAP measures are used by management to evaluate the financial performance of the Company’s long-term investment strategy and core business activities over periods of
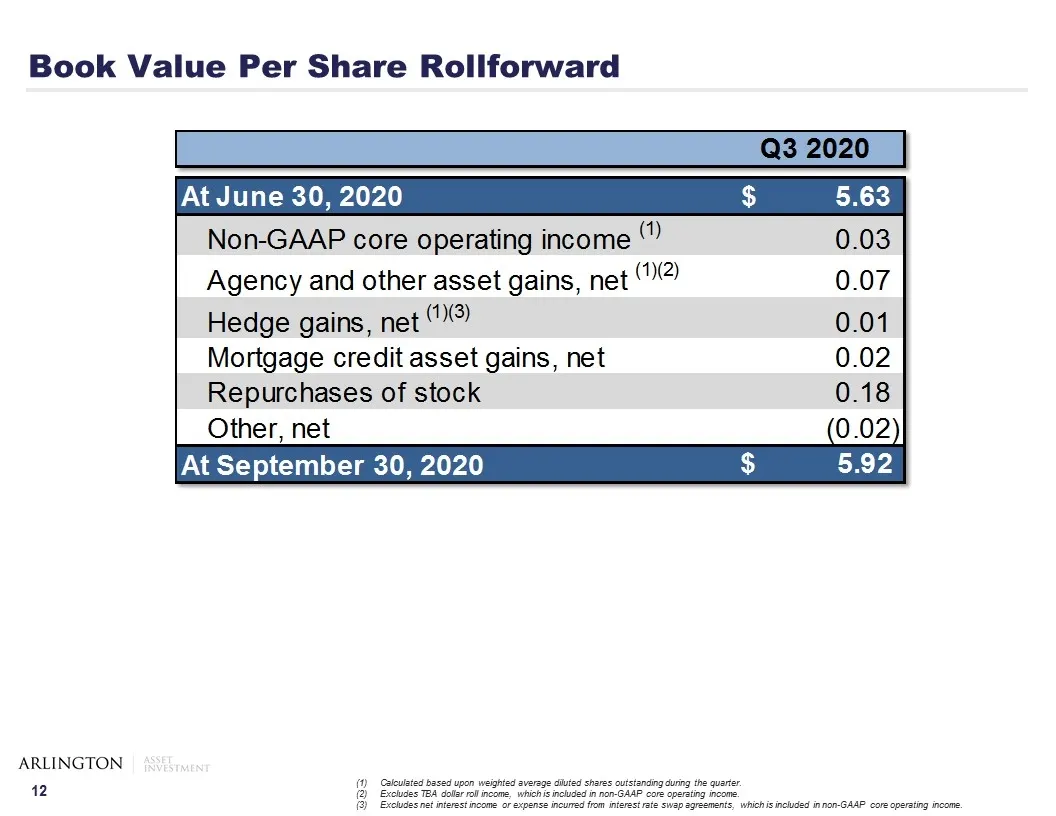
Slide 13: Book Value Per Share Rollforward
Book Value Per Share Rollforward Calculated based upon weighted average diluted shares outstanding during the quarter. Excludes TBA dollar roll income, which is included in non-GAAP core operating income. Excludes net interest income or expense incurred from interest rate swap agreements, which is i

Slide 14: Additional Market Data and Financial Information
ADDITIONAL MARKET DATA AND FINANCIAL INFORMATION
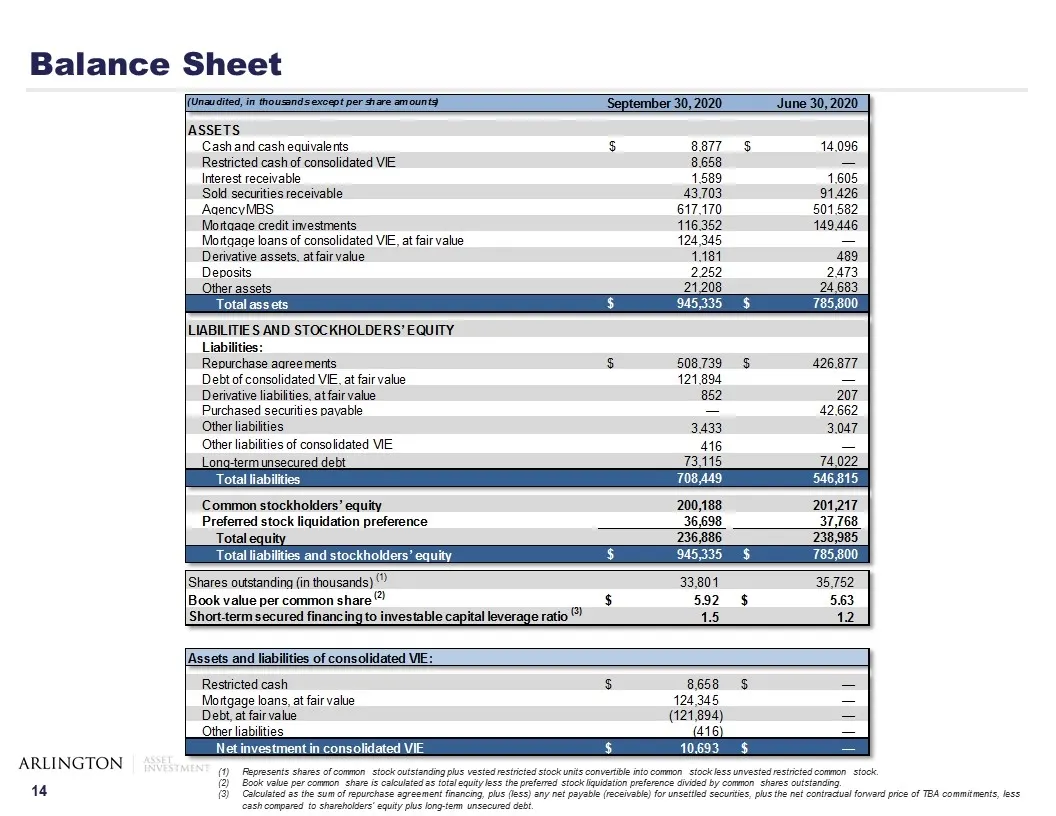
Slide 15: Balance Sheet
Balance Sheet Represents shares of common stock outstanding plus vested restricted stock units convertible into common stock less unvested restricted common stock. Book value per common share is calculated as total equity less the preferred stock liquidation preference divided by common shares outst
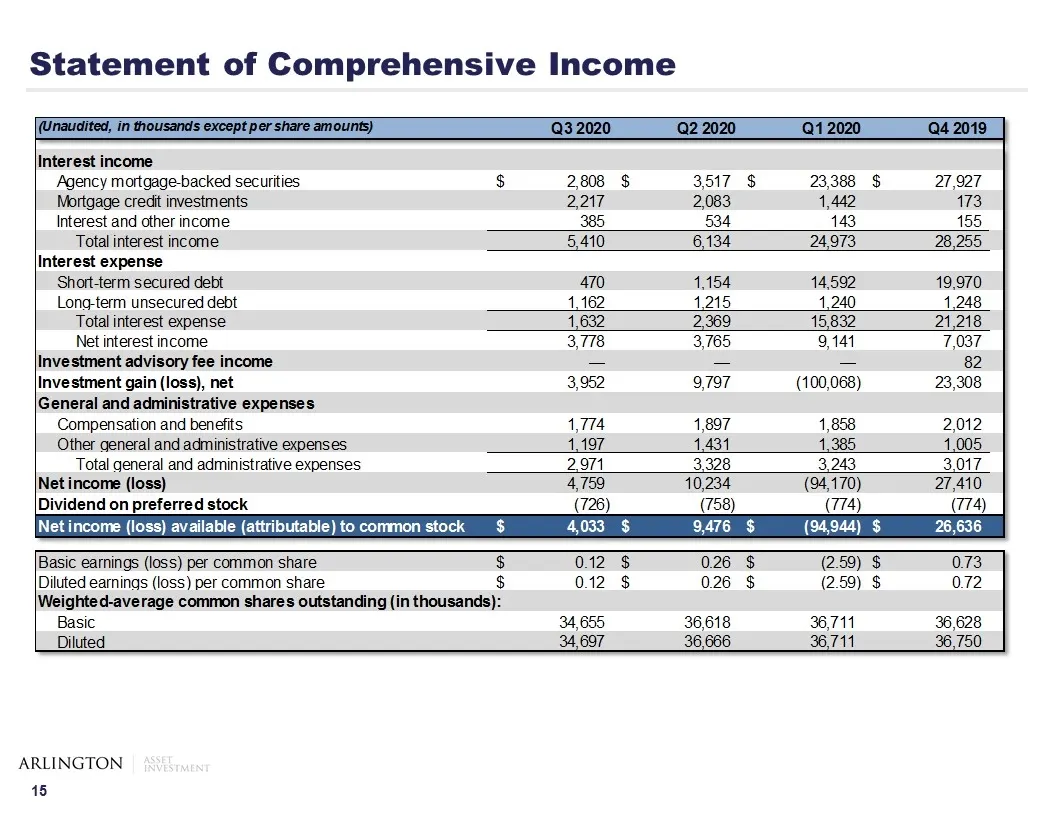
Slide 16: Statement of Comprehensive Income
Statement of Comprehensive Income
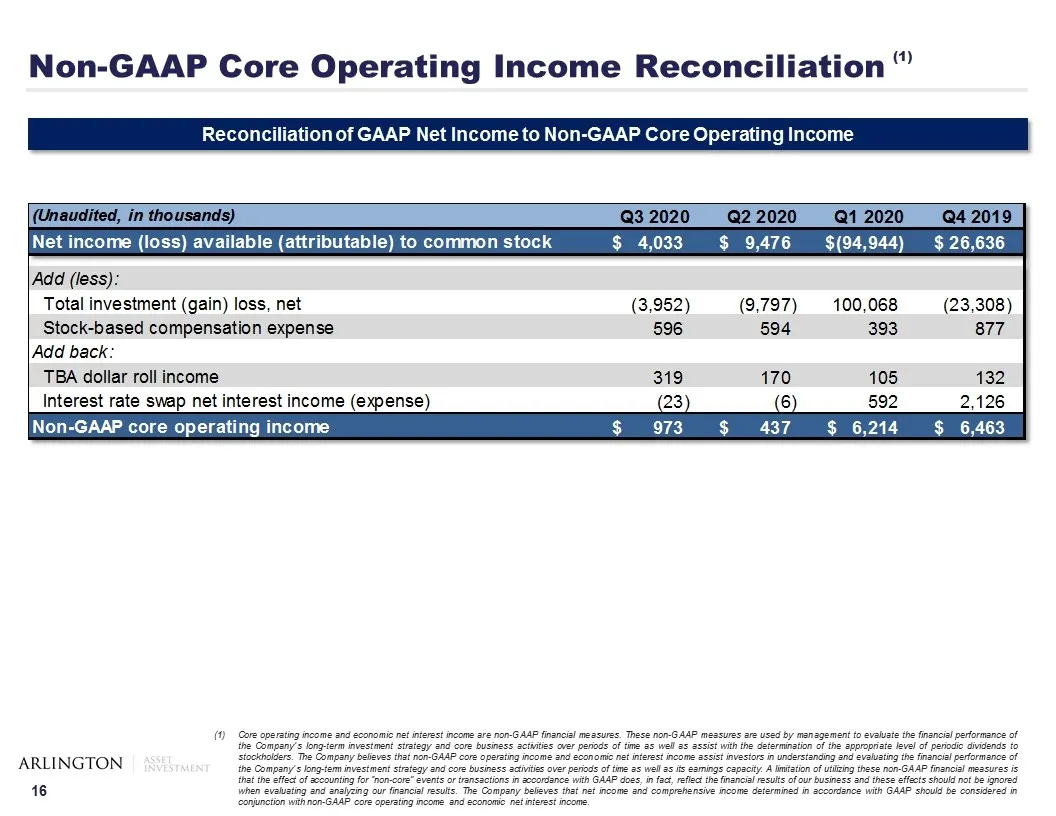
Slide 17: Non-GAAP Core Operating Income Reconciliation
Non-GAAP Core Operating Income Reconciliation (1) Core operating income and economic net interest income are non-GAAP financial measures. These non-GAAP measures are used by management to evaluate the financial performance of the Company’s long-term investment strategy and core business activities o
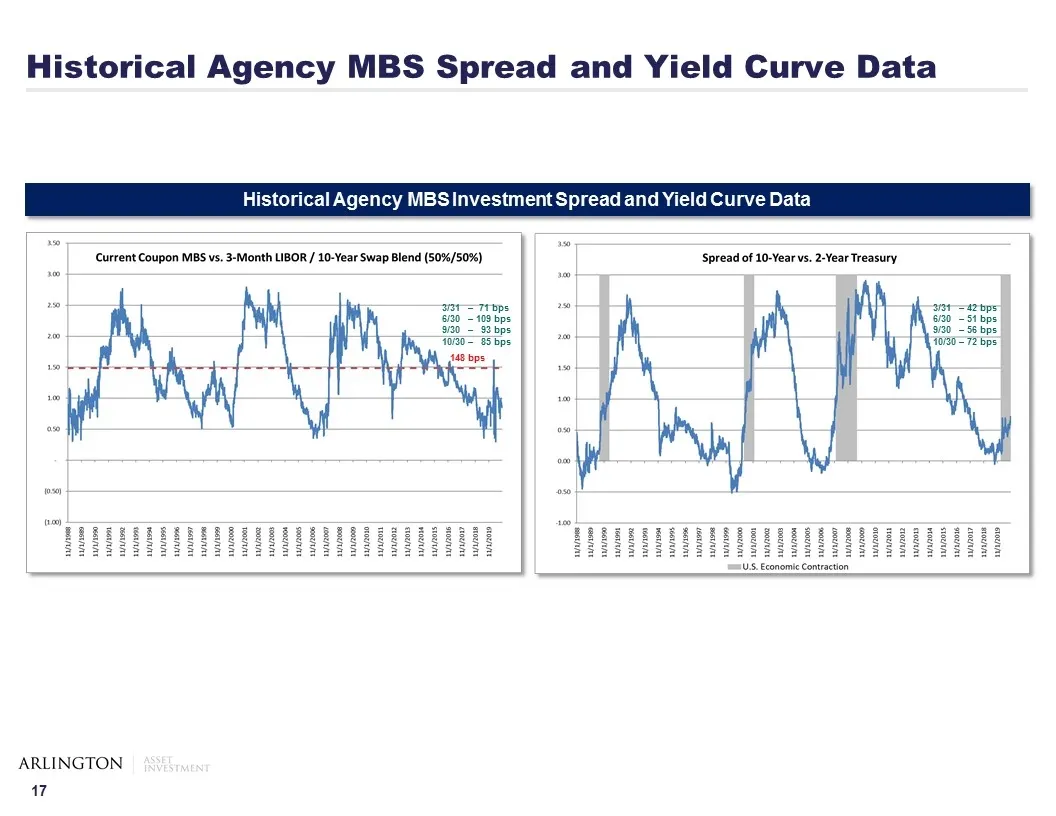
Slide 18: Historical Agency MBS Spread and Yield Curve Data
Historical Agency MBS Investment Spread and Yield Curve Data 148 bps 3/31 – 71 bps 6/30 – 109 bps 9/30 – 93 bps 10/30 – 85 bps 3/31 – 42 bps 6/30 – 51 bps 9/30 – 56 bps 10/30 – 72 bps Historical Agency MBS Spread and Yield Curve Data
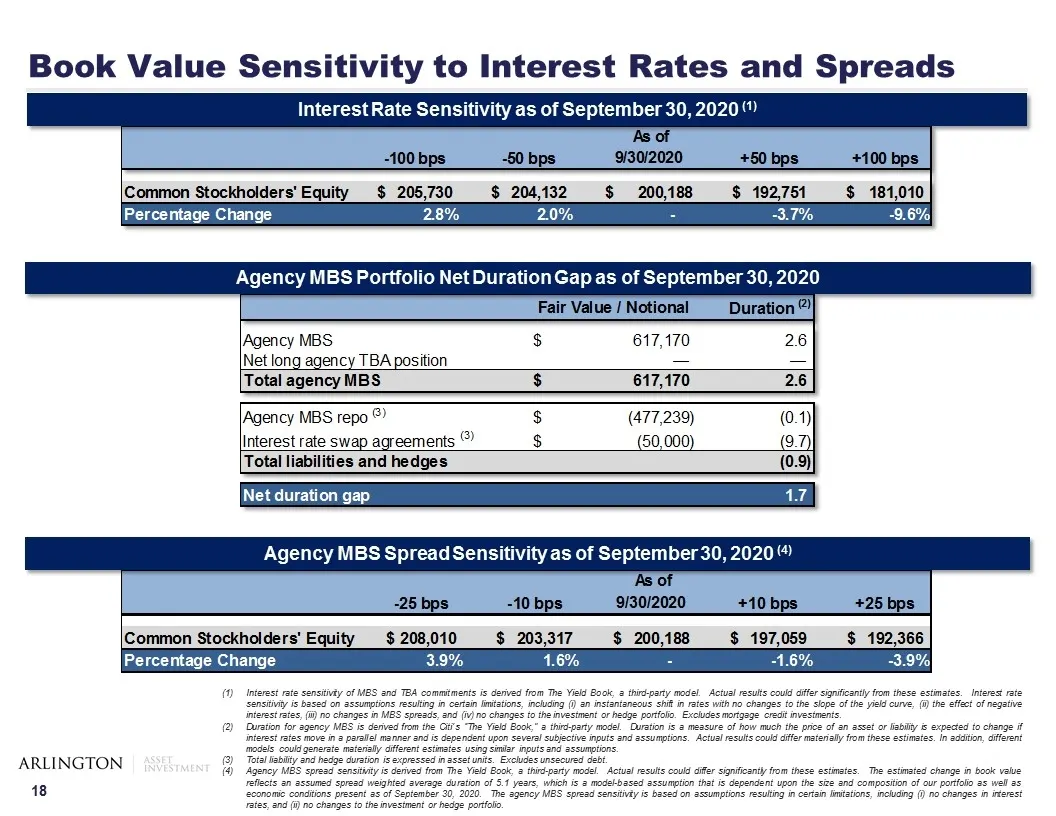
Slide 19: Interest Rate Sensitivity
Interest rate sensitivity of MBS and TBA commitments is derived from The Yield Book, a third-party model. Actual results could differ significantly from these estimates. Interest rate sensitivity is based on assumptions resulting in certain limitations, including (i) an instantaneous shift in rates
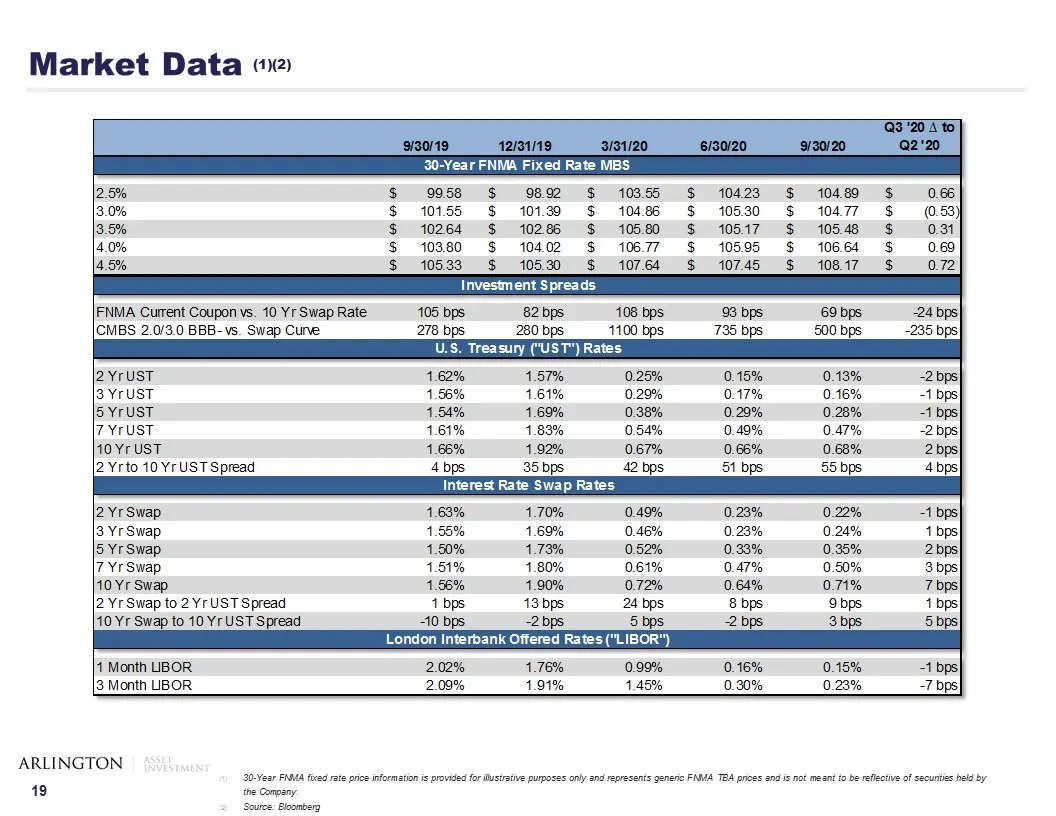
Slide 20: Market Data
Market Data (1)(2) 30-Year FNMA fixed rate price information is provided for illustrative purposes only and represents generic FNMA TBA prices and is not meant to be reflective of securities held by the Company. Source: Bloomberg
Source: SEC EDGAR · 8-K filed Nov 4, 2020
More decks from Arlington Asset Investment Corp
 Q3 2023 Earnings Presentation12 slides · Nov 13, 2023
 Q2 2023 Earnings Presentation12 slides · Aug 14, 2023
 Q1 2023 Earnings Presentation16 slides · May 15, 2023
 Q4 2022 Earnings Presentation20 slides · Mar 31, 2023
 Q3 2022 Earnings Presentation29 slides · Nov 15, 2022
 Q2 2022 Earnings Presentation31 slides · Aug 10, 2022