Memorial Resource Development Corp
Memorial Resource Development — EnerCom - The Oil & Gas Conference 21 (August 2016)
23 slides from Memorial Resource Development's conference presentation, Aug 15, 2016
Slide 1: EnerCom - The Oil & Gas Conference
FILED BY RANGE RESOURCES CORPORATION PURSUANT TO RULE 425 UNDER THE SECURITIES ACT OF 1933 AND DEEMED FILED PURSUANT TO RULE 14a-12 UNDER THE SECURITIES EXCHANGE ACT OF 1934 SUBJECT COMPANY: MEMORIAL RESOURCE DEVELOPMENT CORP. (FILE NO. 001-36490) August 15, 2016 Jeff Ventura – Chairman, President &
Slide 2: Forward-Looking Statements
Forward-Looking Statements This communication contains certain “forward-looking statements” within the meaning of federal securities laws, including within the meaning of the safe harbor provisions of the Private Securities Litigation Reform Act of 1995 that are not limited to historical facts, but
Slide 3: Range's Keys for Success
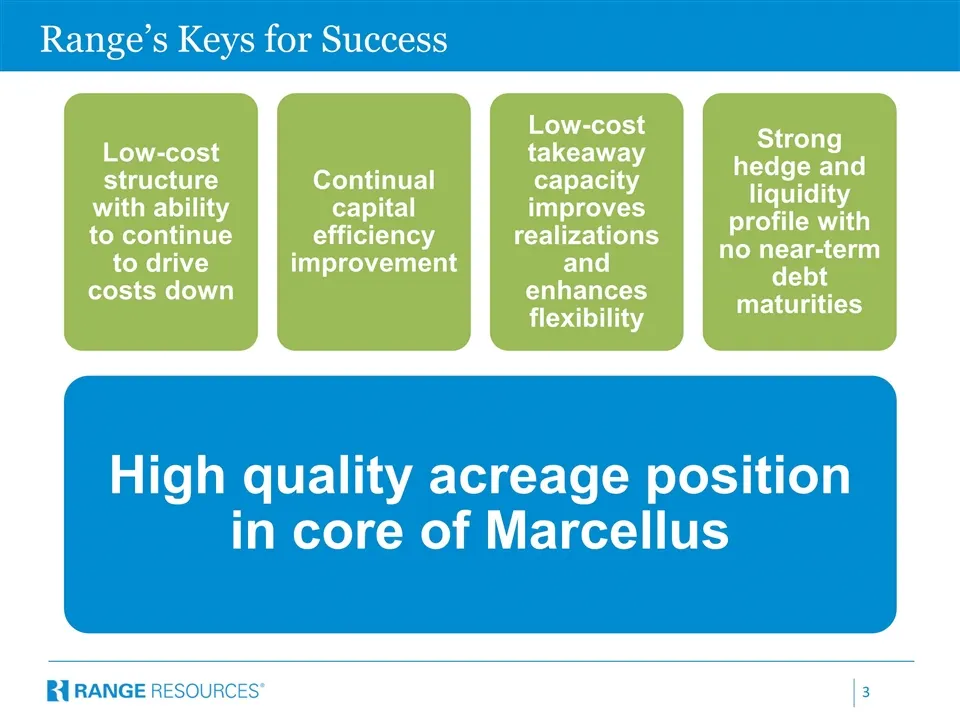
Range’s Keys for Success High quality acreage position in core of Marcellus Low-cost structure with ability to continue to drive costs down Continual capital efficiency improvement Low-cost takeaway capacity improves realizations and enhances flexibility Strong hedge and liquidity profile with no ne
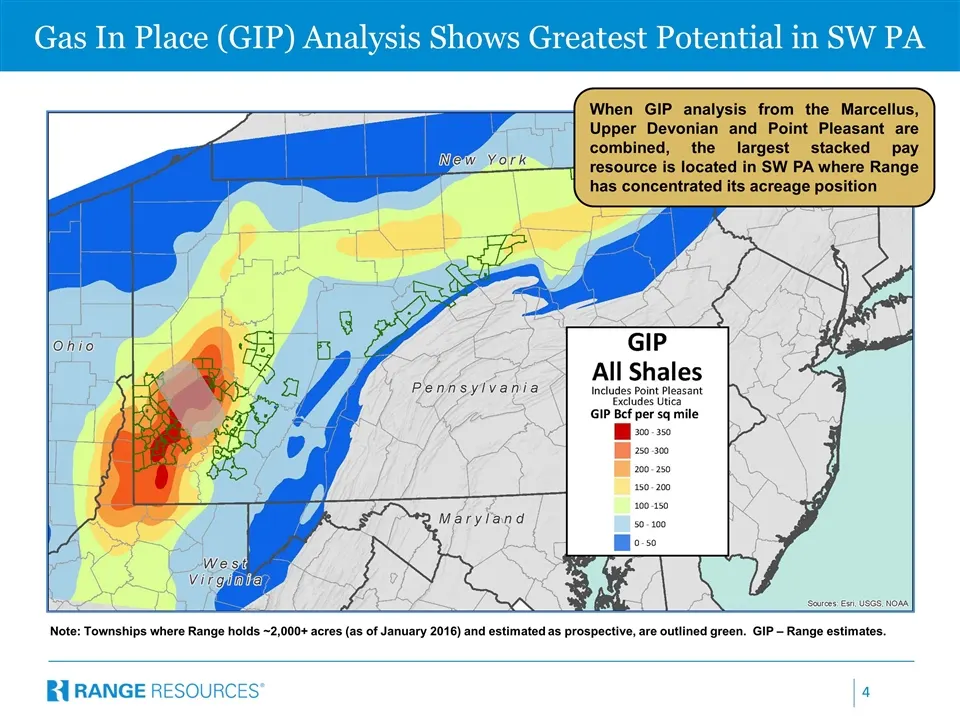
Slide 4: Gas In Place Analysis Shows Greatest Potential in SW PA
Gas In Place (GIP) Analysis Shows Greatest Potential in SW PA Note: Townships where Range holds ~2,000+ acres (as of January 2016) and estimated as prospective, are outlined green. GIP – Range estimates. When GIP analysis from the Marcellus, Upper Devonian and Point Pleasant are combined, the larges
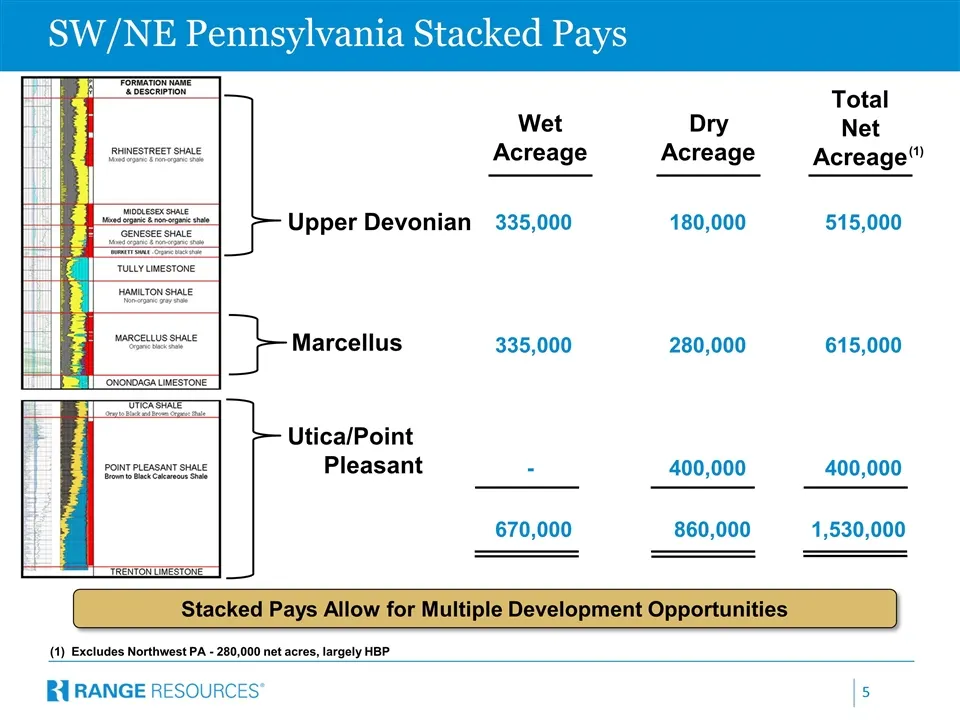
Slide 5: SW/NE Pennsylvania Stacked Pays
SW/NE Pennsylvania Stacked Pays Upper Devonian 335,000 180,000515,000 335,000 280,000615,000 - 400,000400,000 670,000 860,000 1,530,000 Marcellus Utica/Point Pleasant Wet Acreage Dry Acreage Total Net Acreage (1) (1) Excludes Northwest PA - 280,000 net acres, largely HBP Stacked Pays Allow for Multi
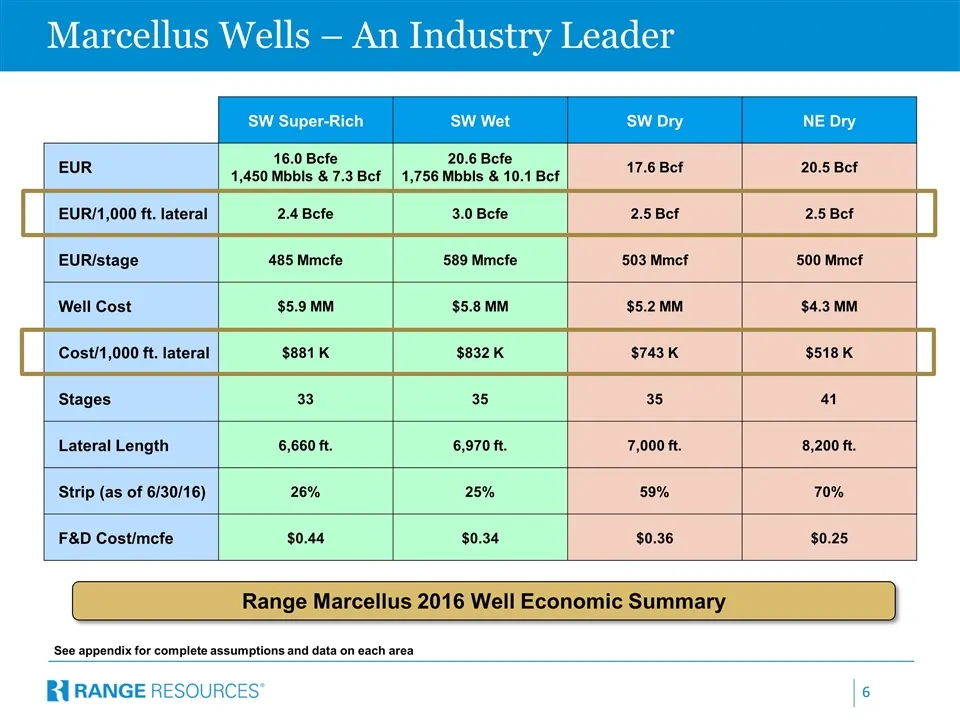
Slide 6: Marcellus Wells – An Industry Leader
Marcellus Wells – An Industry Leader See appendix for complete assumptions and data on each area SW Super-Rich SW Wet SW Dry NE Dry EUR 16.0 Bcfe 1,450 Mbbls & 7.3 Bcf 20.6 Bcfe 1,756 Mbbls & 10.1 Bcf 17.6 Bcf 20.5 Bcf EUR/1,000 ft. lateral 2.4 Bcfe 3.0 Bcfe 2.5 Bcf 2.5 Bcf EUR/stage 485 Mmcfe 589 M
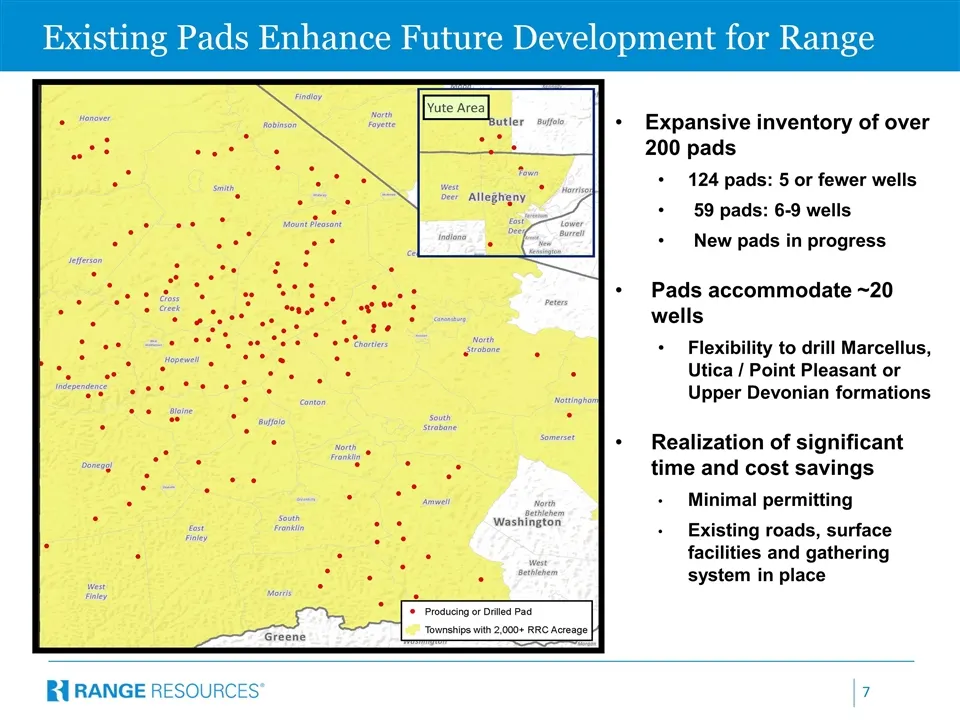
Slide 7: Existing Pads Enhance Future Development for Range
Existing Pads Enhance Future Development for Range Expansive inventory of over 200 pads 124 pads: 5 or fewer wells 59 pads: 6-9 wells New pads in progress Pads accommodate ~20 wells Flexibility to drill Marcellus, Utica / Point Pleasant or Upper Devonian formations Realization of significant time an
Slide 8: Sustained Growth + Improving Capital Efficiency
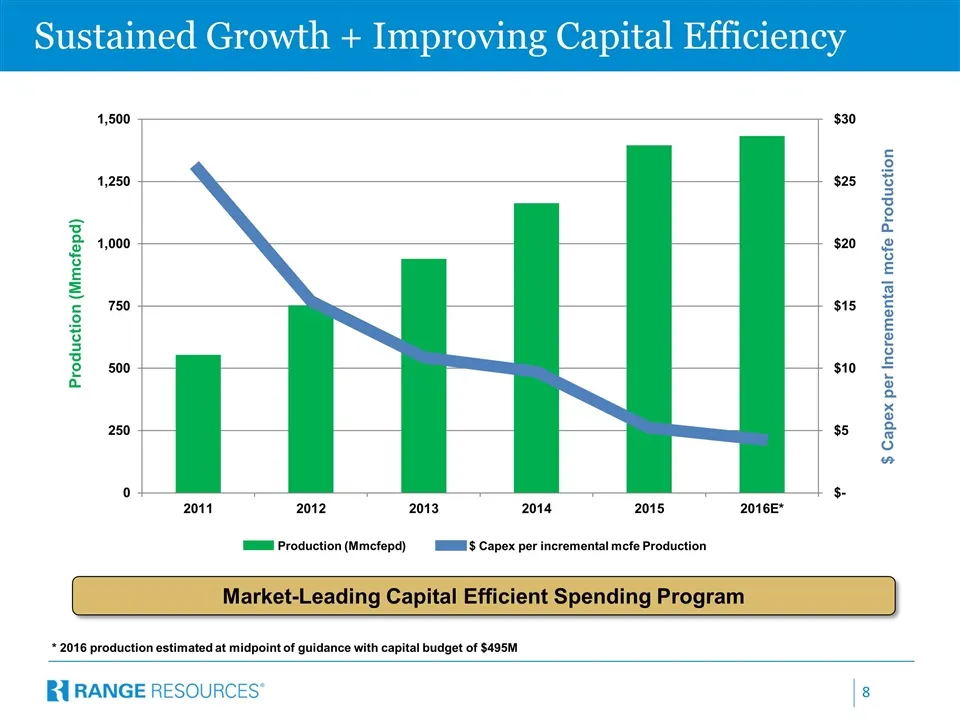
Sustained Growth + Improving Capital Efficiency Market-Leading Capital Efficient Spending Program * 2016 production estimated at midpoint of guidance with capital budget of $495M $ Capex per incremental mcfe Production Production (Mmcfepd)
Slide 9: Driving Down Unit Costs
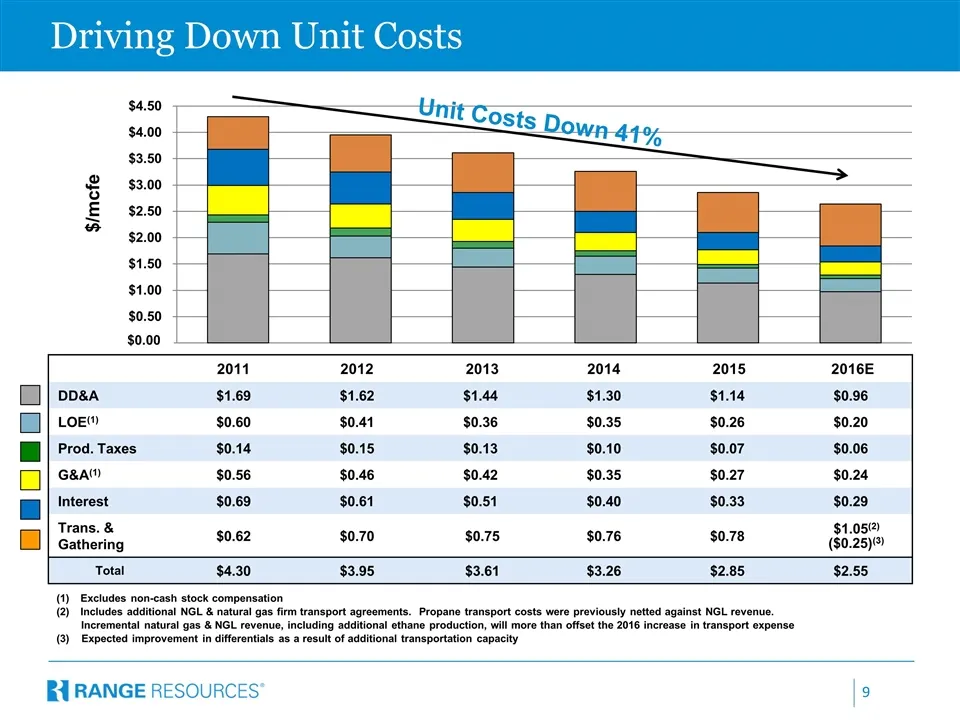
Driving Down Unit Costs $/mcfe 2011 2012 2013 2014 2015 2016E DD&A $1.69 $1.62 $1.44 $1.30 $1.14 $0.96 LOE (1) $0.60 $0.41 $0.36 $0.35 $0.26 $0.20 Prod. Taxes $0.14 $0.15 $0.13 $0.10 $0.07 $0.06 G&A (1) $0.56 $0.46 $0.42 $0.35 $0.27 $0.24 Interest $0.69 $0.61 $0.51 $0.40 $0.33 $0.29 Trans. & Gatheri
Slide 10: Near-Term Price Enhancements
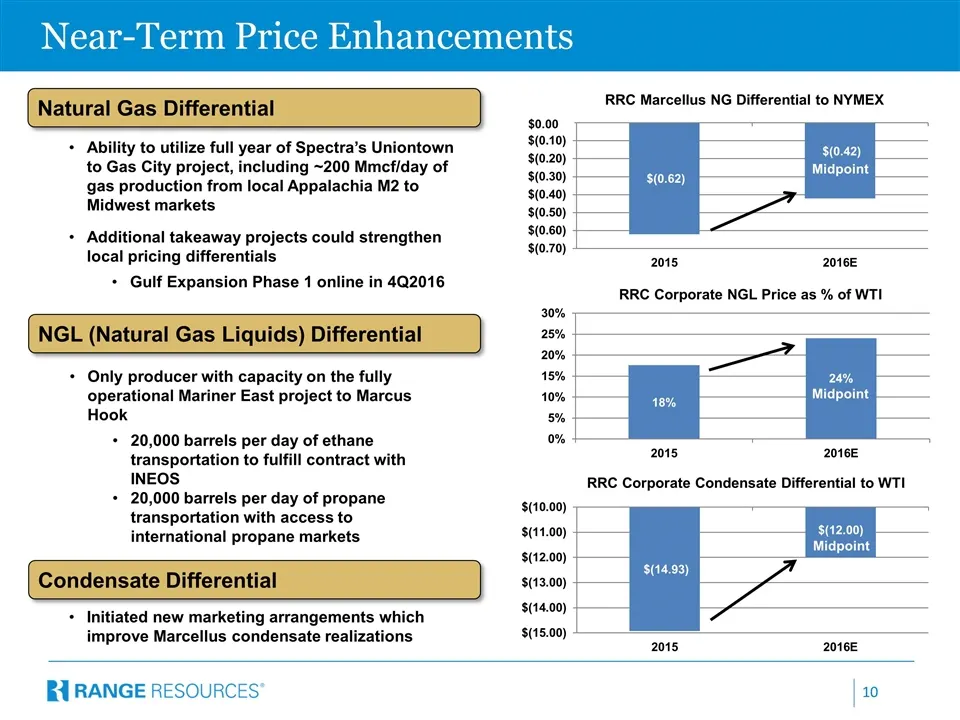
Near-Term Price Enhancements Ability to utilize full year of Spectra’s Uniontown to Gas City project, including ~200 Mmcf/day of gas production from local Appalachia M2 to Midwest markets Additional takeaway projects could strengthen local pricing differentials Gulf Expansion Phase 1 online in 4Q201
Slide 11: Appalachia Gas Transportation Arrangements
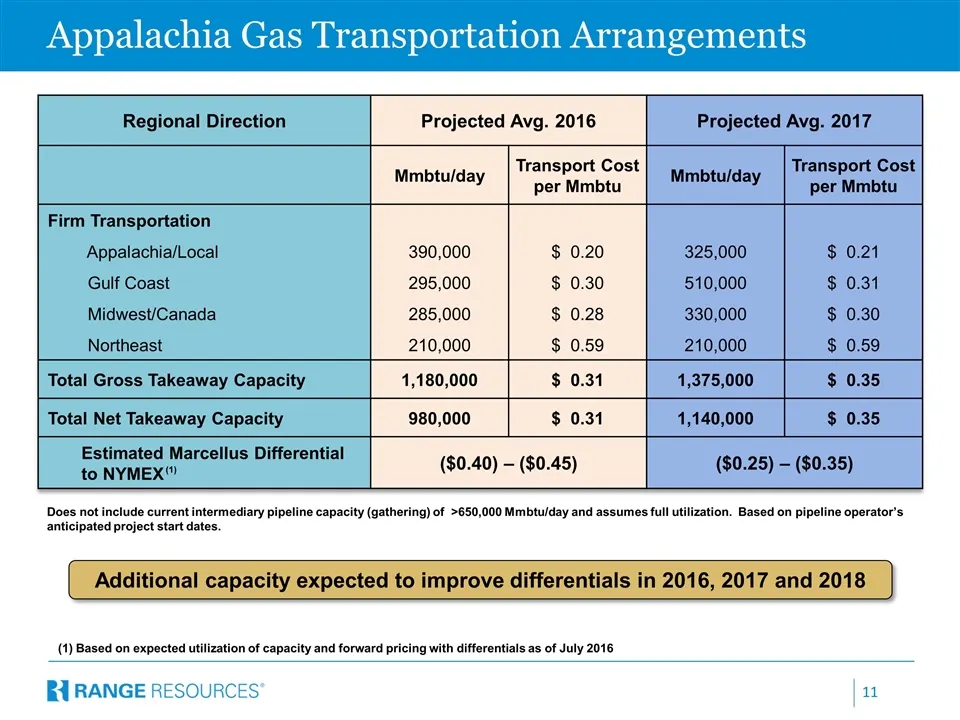
Regional Direction Projected Avg. 2016 Projected Avg. 2017 Mmbtu/day Transport Cost per Mmbtu Mmbtu/day Transport Cost per Mmbtu Firm Transportation Appalachia/Local 390,000 $ 0.20 325,000 $ 0.21 Gulf Coast 295,000 $ 0.30 510,000 $ 0.31 Midwest/Canada 285,000 $ 0.28 330,000 $ 0.30 Northeast 210,000
Slide 12: Strong Unhedged Recycle Ratio
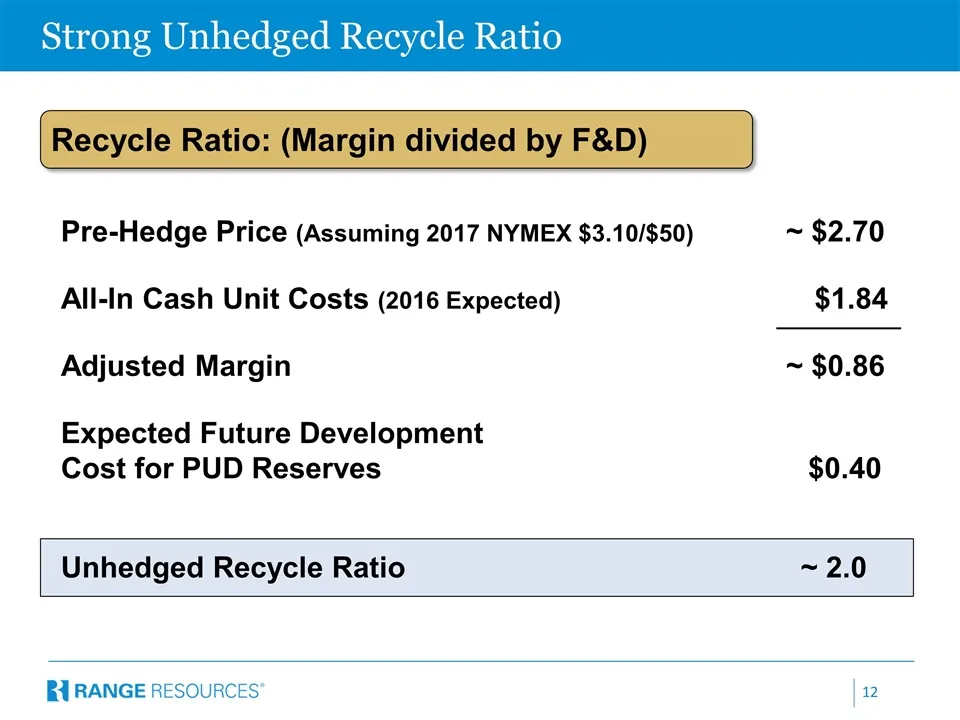
Strong Unhedged Recycle Ratio Pre-Hedge Price (Assuming 2017 NYMEX $3.10/$50) ~ $2.70 All-In Cash Unit Costs (2016 Expected) $1.84 Adjusted Margin ~ $0.86 Expected Future Development Cost for PUD Reserves $0.40 Unhedged Recycle Ratio ~ 2.0 Recycle Ratio: (Margin divided by F&D)
Slide 13: Liquidity and Financial Capacity (pre-merger)
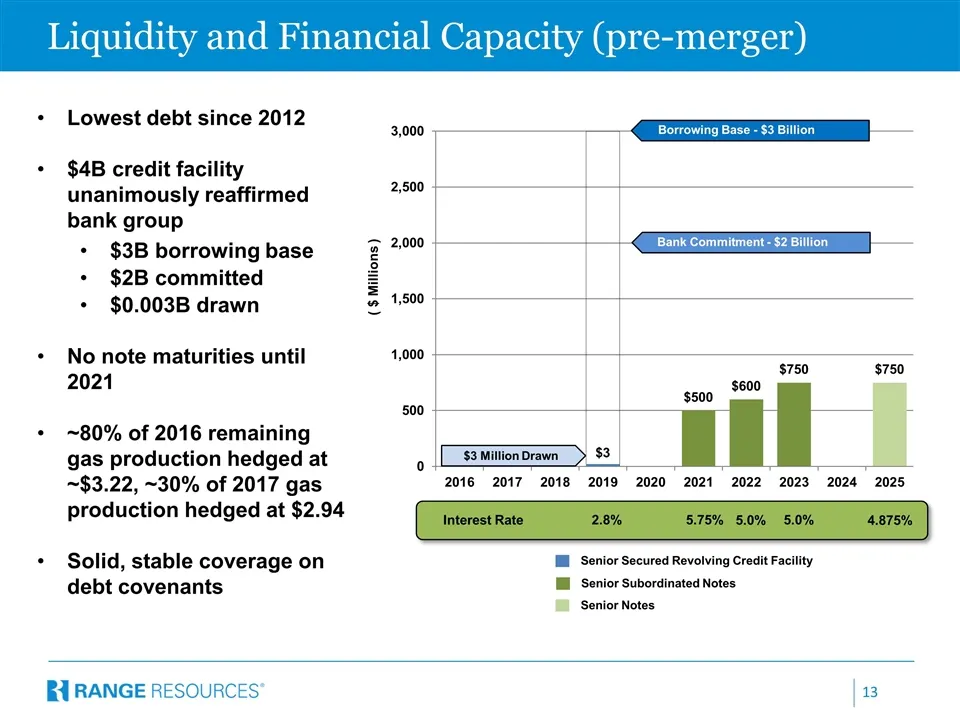
Liquidity and Financial Capacity (pre-merger) ( $ Millions ) Senior Secured Revolving Credit Facility Senior Subordinated Notes Senior Notes Interest Rate 2.8% 5.75% 5.0% 5.0% 4.875% $3 Million Drawn Bank Commitment - $2 Billion Borrowing Base - $3 Billion Lowest debt since 2012 $4B credit facility
Slide 14: Proposed Merger with Memorial Resource Development
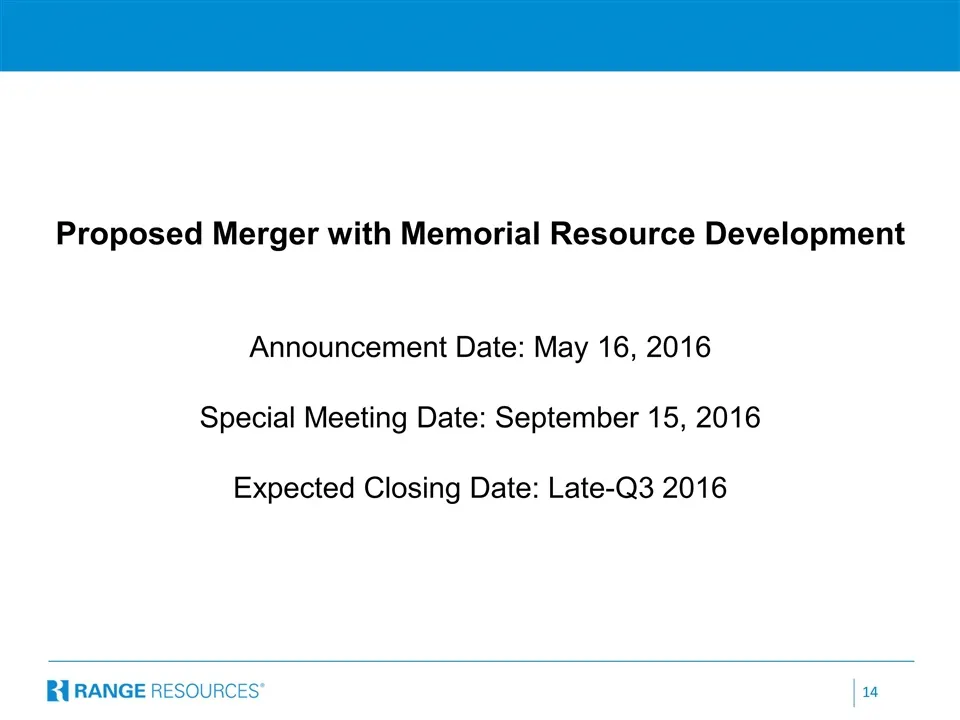
Proposed Merger with Memorial Resource Development Announcement Date: May 16, 2016 Special Meeting Date: September 15, 2016 Expected Closing Date: Late-Q3 2016
Slide 15: Highlights of Merger
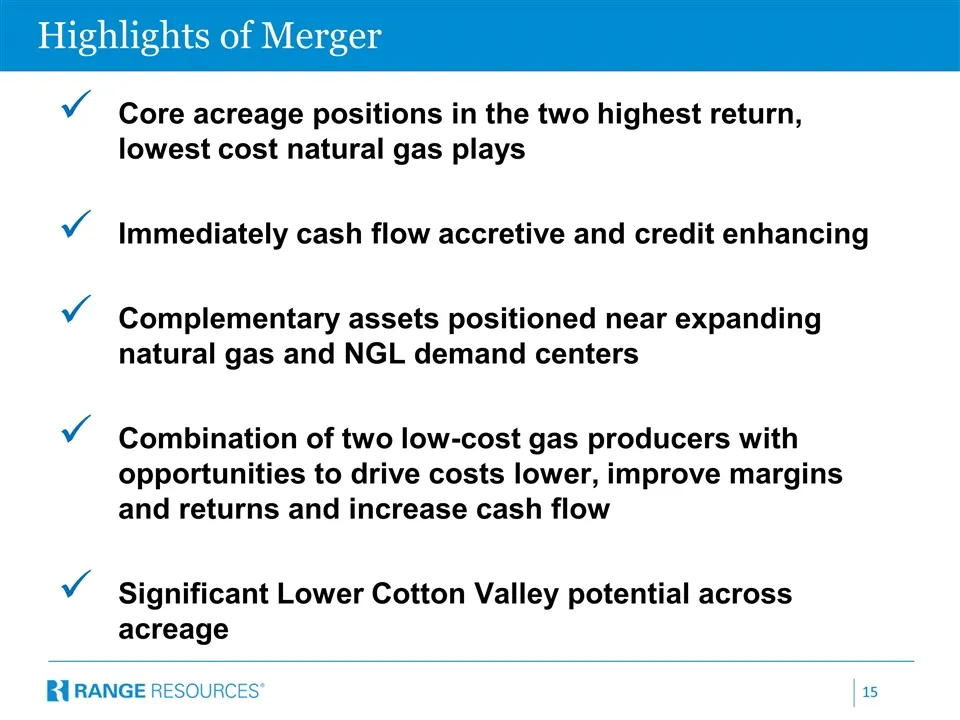
Highlights of Merger Core acreage positions in the two highest return, lowest cost natural gas plays Immediately cash flow accretive and credit enhancing Complementary assets positioned near expanding natural gas and NGL demand centers Combination of two low-cost gas producers with opportunities to
Slide 16: Combining Two High Quality Assets
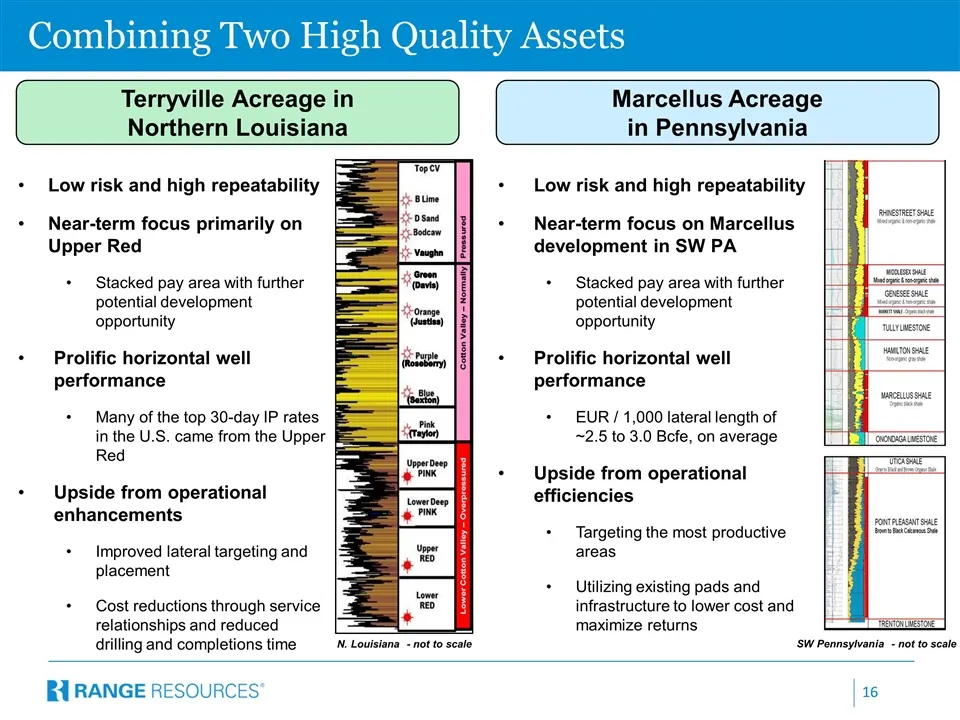
Combining Two High Quality Assets Low risk and high repeatability Near-term focus primarily on Upper Red Stacked pay area with further potential development opportunity Prolific horizontal well performance Many of the top 30-day IP rates in the U.S. came from the Upper Red Upside from operational en
Slide 17: Immediately Accretive & Credit Enhancing
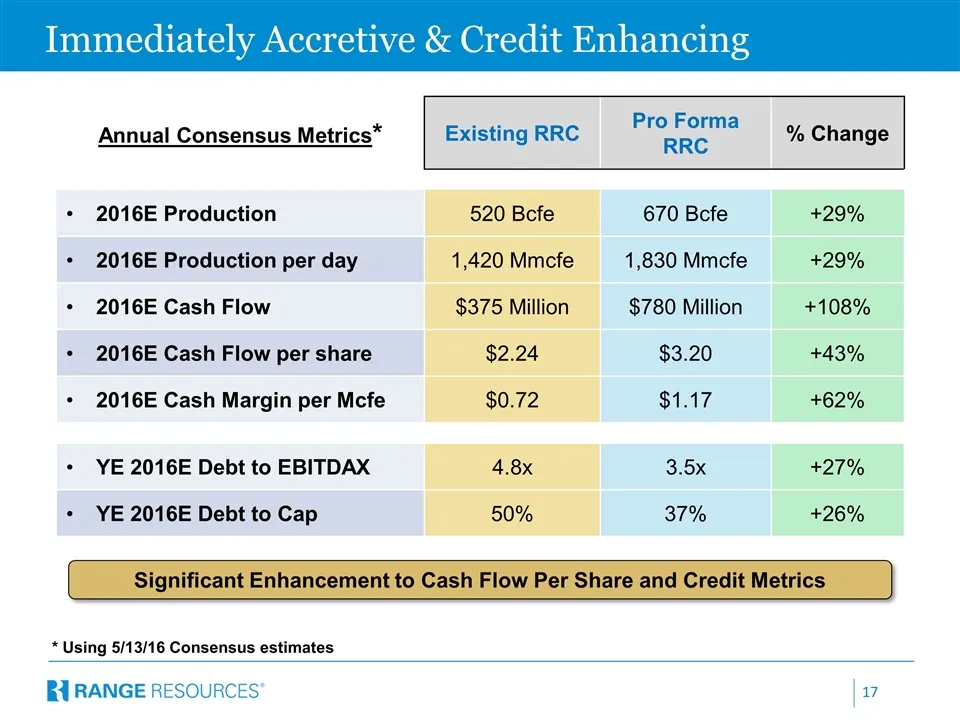
Immediately Accretive & Credit Enhancing Annual Consensus Metrics* Existing RRC Pro Forma RRC % Change 2016E Production 520 Bcfe 670 Bcfe +29% 2016E Production per day 1,420 Mmcfe 1,830 Mmcfe +29% 2016E Cash Flow $375 Million $780 Million +108% 2016E Cash Flow per share $2.24 $3.20 +43% 2016E Cash M
Slide 18: Marketing and Operational Efficiencies
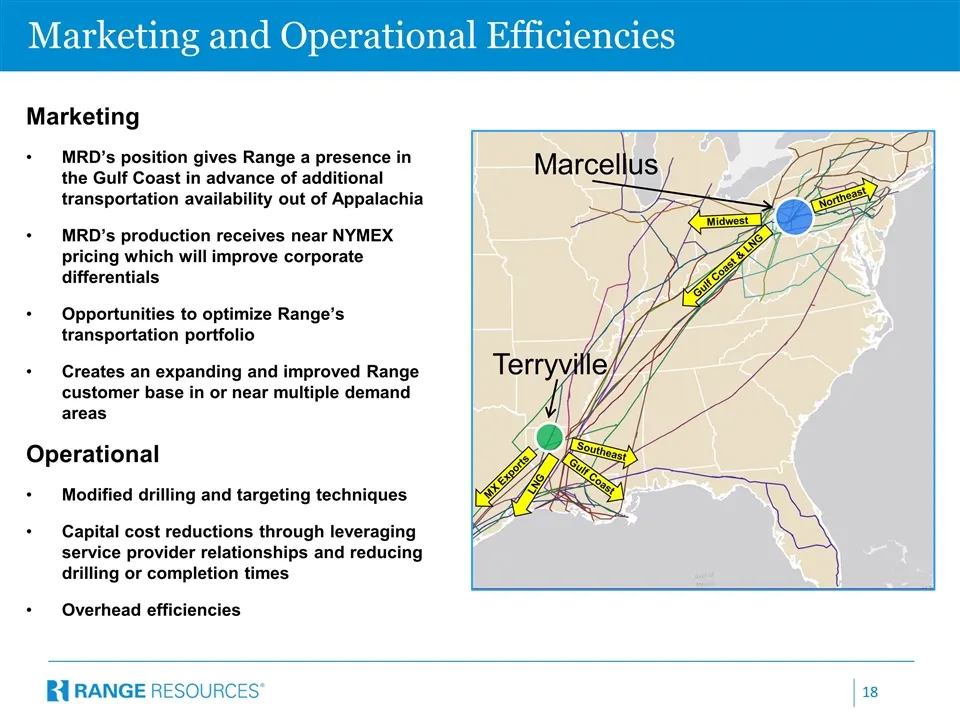
Marketing and Operational Efficiencies Marketing MRD’s position gives Range a presence in the Gulf Coast in advance of additional transportation availability out of Appalachia MRD’s production receives near NYMEX pricing which will improve corporate differentials Opportunities to optimize Range’s tr
Slide 19: 220,000 Acres of Lower Cotton Valley Potential
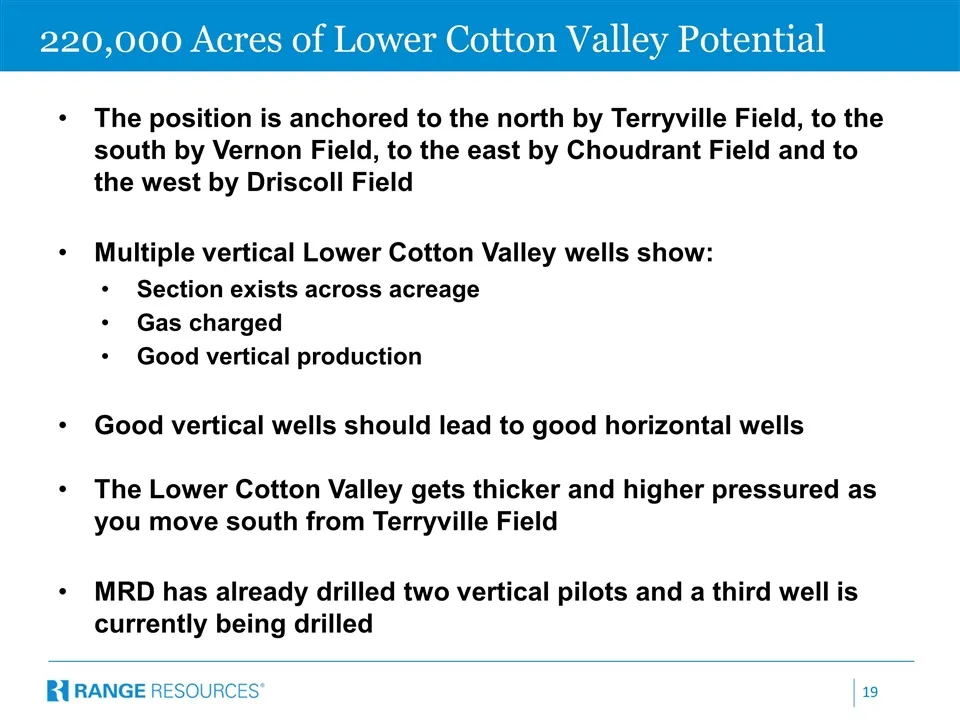
220,000 Acres of Lower Cotton Valley Potential The position is anchored to the north by Terryville Field, to the south by Vernon Field, to the east by Choudrant Field and to the west by Driscoll Field Multiple vertical Lower Cotton Valley wells show: Section exists across acreage Gas charged Good ve
Slide 20: 2017 Growth Trajectory
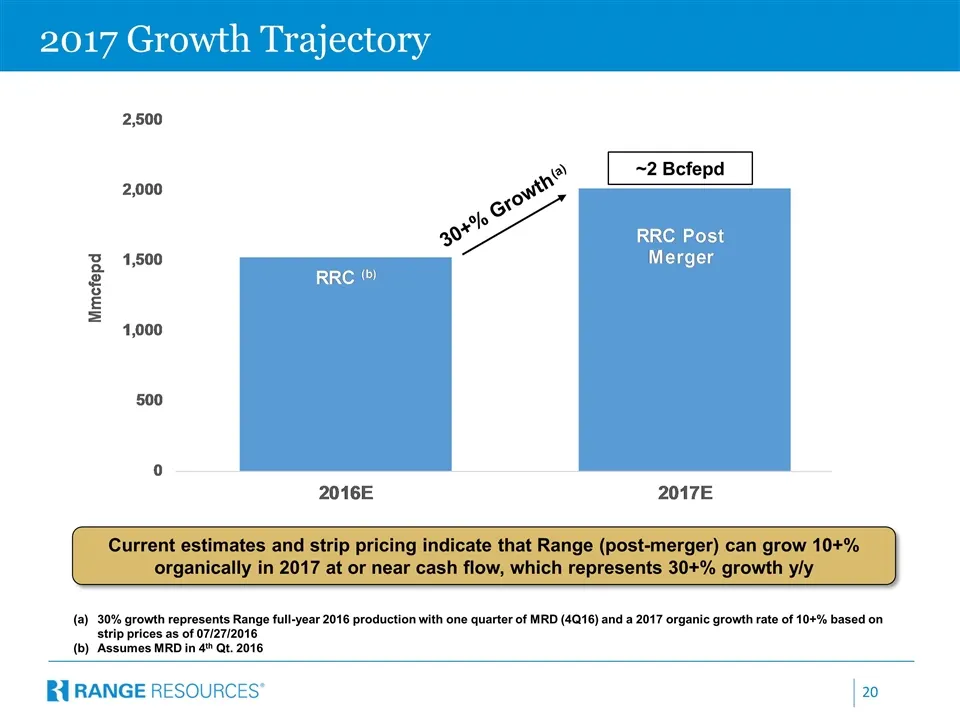
2017 Growth Trajectory 30% growth represents Range full-year 2016 production with one quarter of MRD (4Q16) and a 2017 organic growth rate of 10+% based on strip prices as of 07/27/2016 Assumes MRD in 4th Qt. 2016 Current estimates and strip pricing indicate that Range (post-merger) can grow 10+% or
Slide 21: Why Invest in Range?
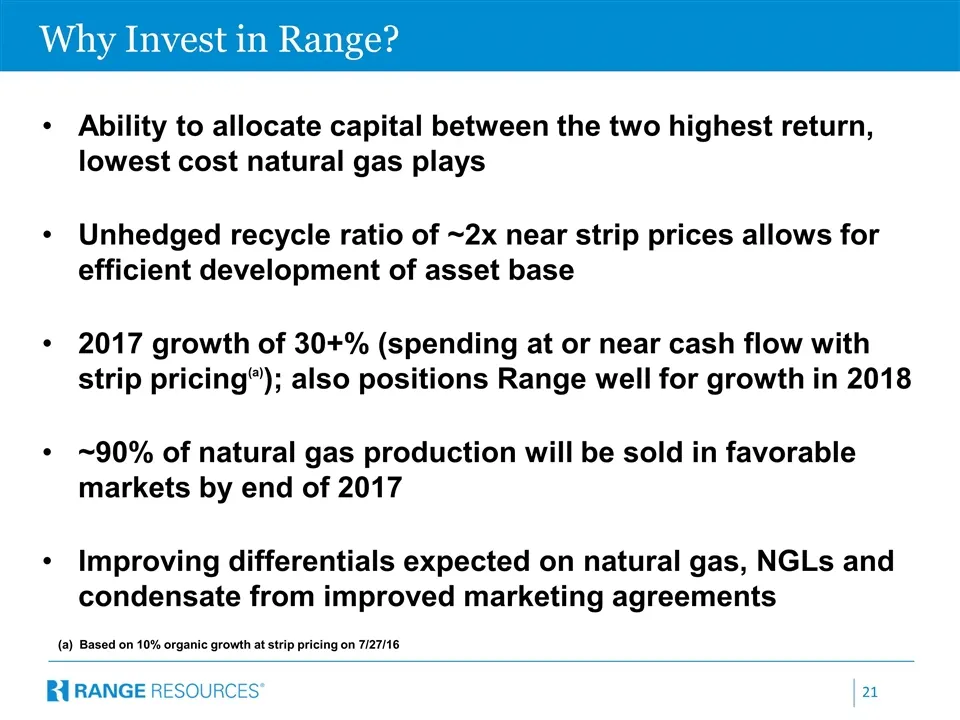
Why Invest in Range? (a) Based on 10% organic growth at strip pricing on 7/27/16 Ability to allocate capital between the two highest return, lowest cost natural gas plays Unhedged recycle ratio of ~2x near strip prices allows for efficient development of asset base 2017 growth of 30+% (spending at o
Slide 22: Contact Information
Contact Information Range Resources Corporation 100 Throckmorton, Suite 1200 Fort Worth, Texas 76102 Laith Sando, Vice President – Investor Relations (817) 869-4267 lsando@rangeresources.com David Amend, Investor Relations Manager (817) 869-4266 damend@rangeresources.com Michael Freeman, Senior Fina
Slide 23: Important Additional Information/Participants in the Solicitation
Important Additional Information/Participants in the Solicitation Important Additional Information This communication does not constitute an offer to sell or the solicitation of an offer to buy any securities or a solicitation of any vote or approval. This communication is being made in respect of t
Source: SEC EDGAR · 425 filed Aug 15, 2016