Flutter Entertainment plc · NYSE:FLUT
Flutter Entertainment — Paddy Power — H1 2010 Earnings Presentation
29 slides from Flutter Entertainment's earnings presentation, 2010
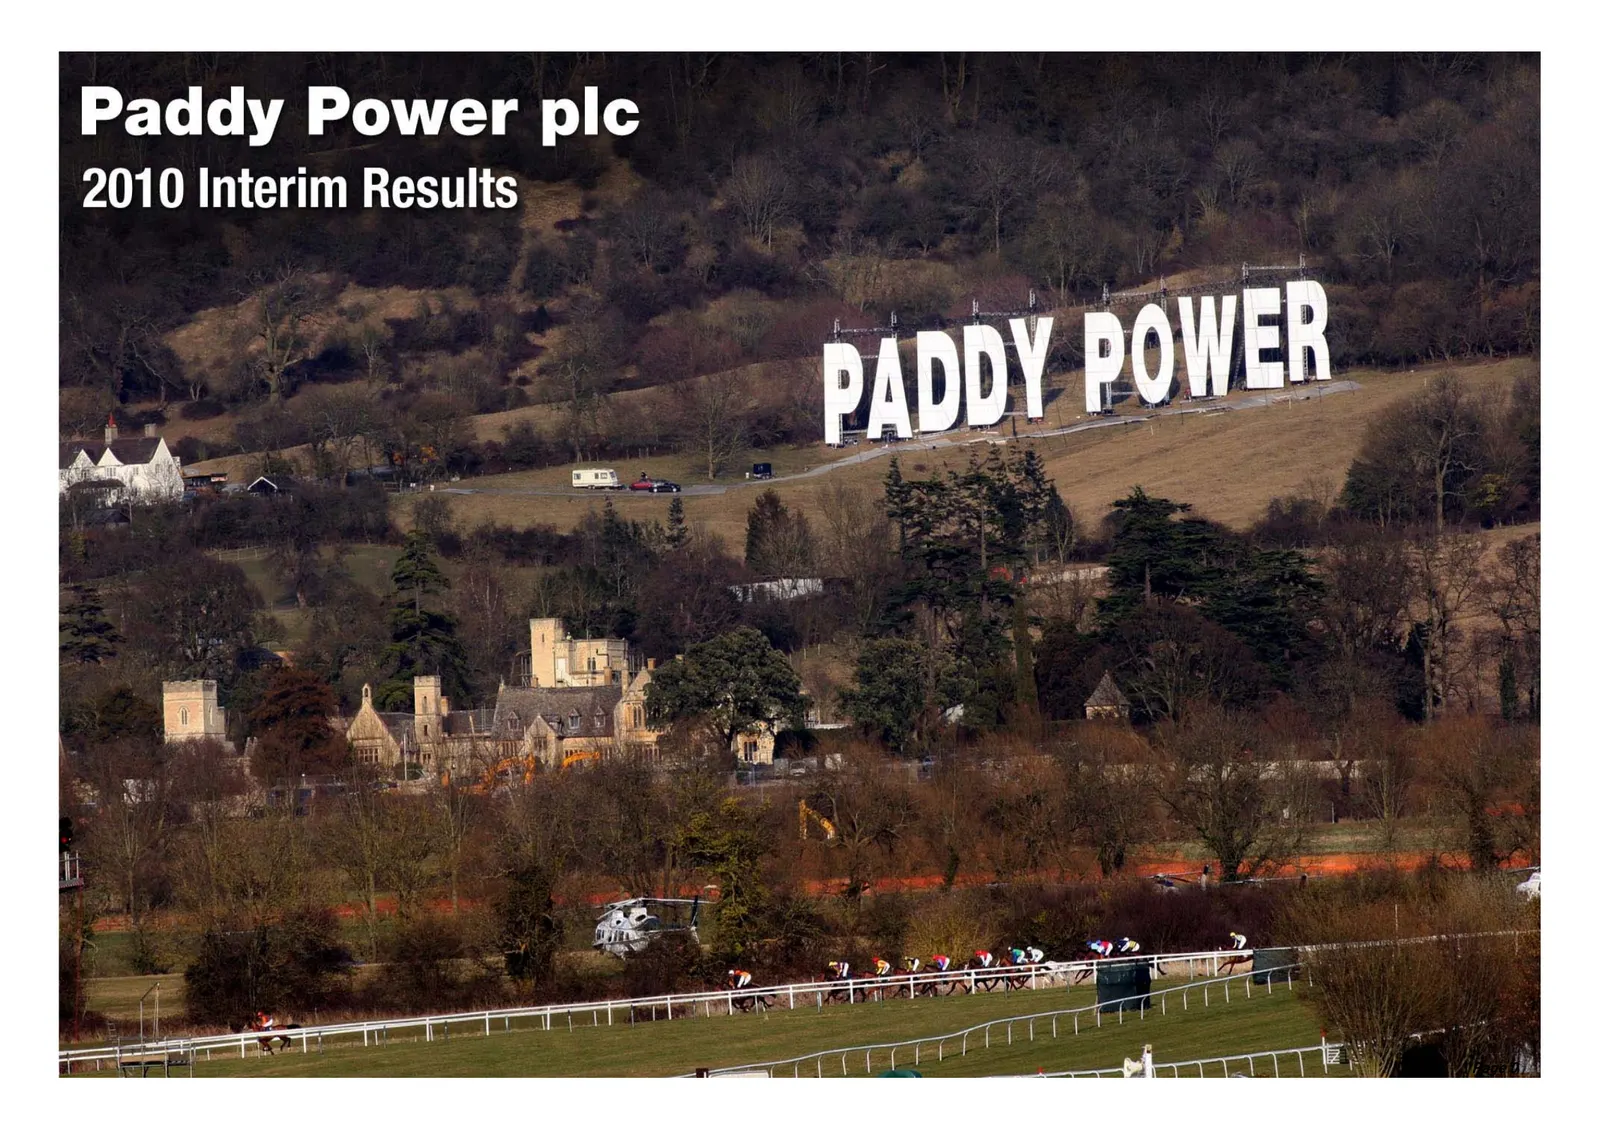
Slide 1: Paddy Power plc 2010 Interim Results
Paddy Power plc 2010 Interim Results
Slide 2: Introduction
Introduction Introduction Financial Performance Divisional Review Strategy & Outlook Page 1
Slide 3: Highlights
Highlights Very strong profit growth Substantial scale in regulated markets Geographic diversification Strong momentum and opportunities Page 2
Slide 4: Financial Performance
Financial Performance Introduction Financial Performance Divisional Review Strategy & Outlook Page 3
Slide 5: Financial Highlights
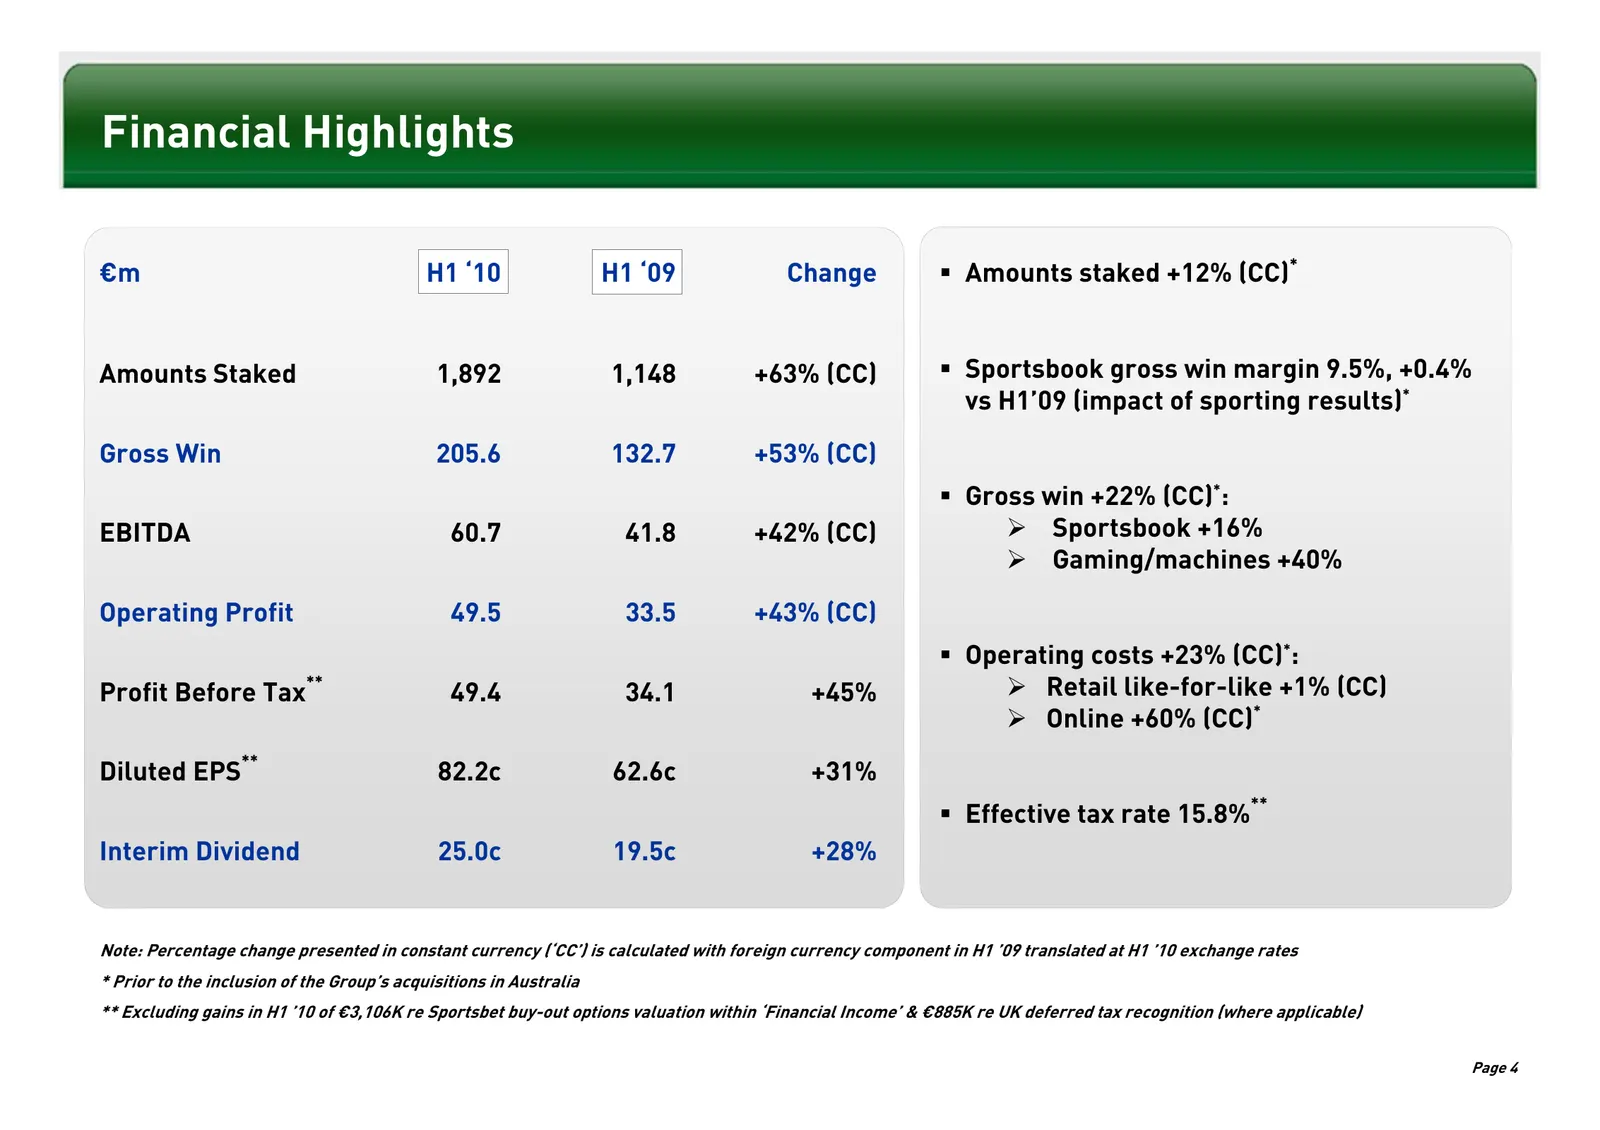
Financial Highlights €m H1 ‘10 H1 ‘09 Change Amounts staked +12% (CC)* Amounts Staked 1,892 1,148 +63% (CC) Sportsbook gross win margin 9.5%, +0.4% vs H1’09 (impact of sporting results)* Gross Win 205.6 132.7 +53% (CC) Gross win +22% (CC)*: EBITDA 60.7 41.8 +42% (CC) ¾ Sportsbook +16% ¾ Gaming
Slide 6: Financial Highlights - Divisional
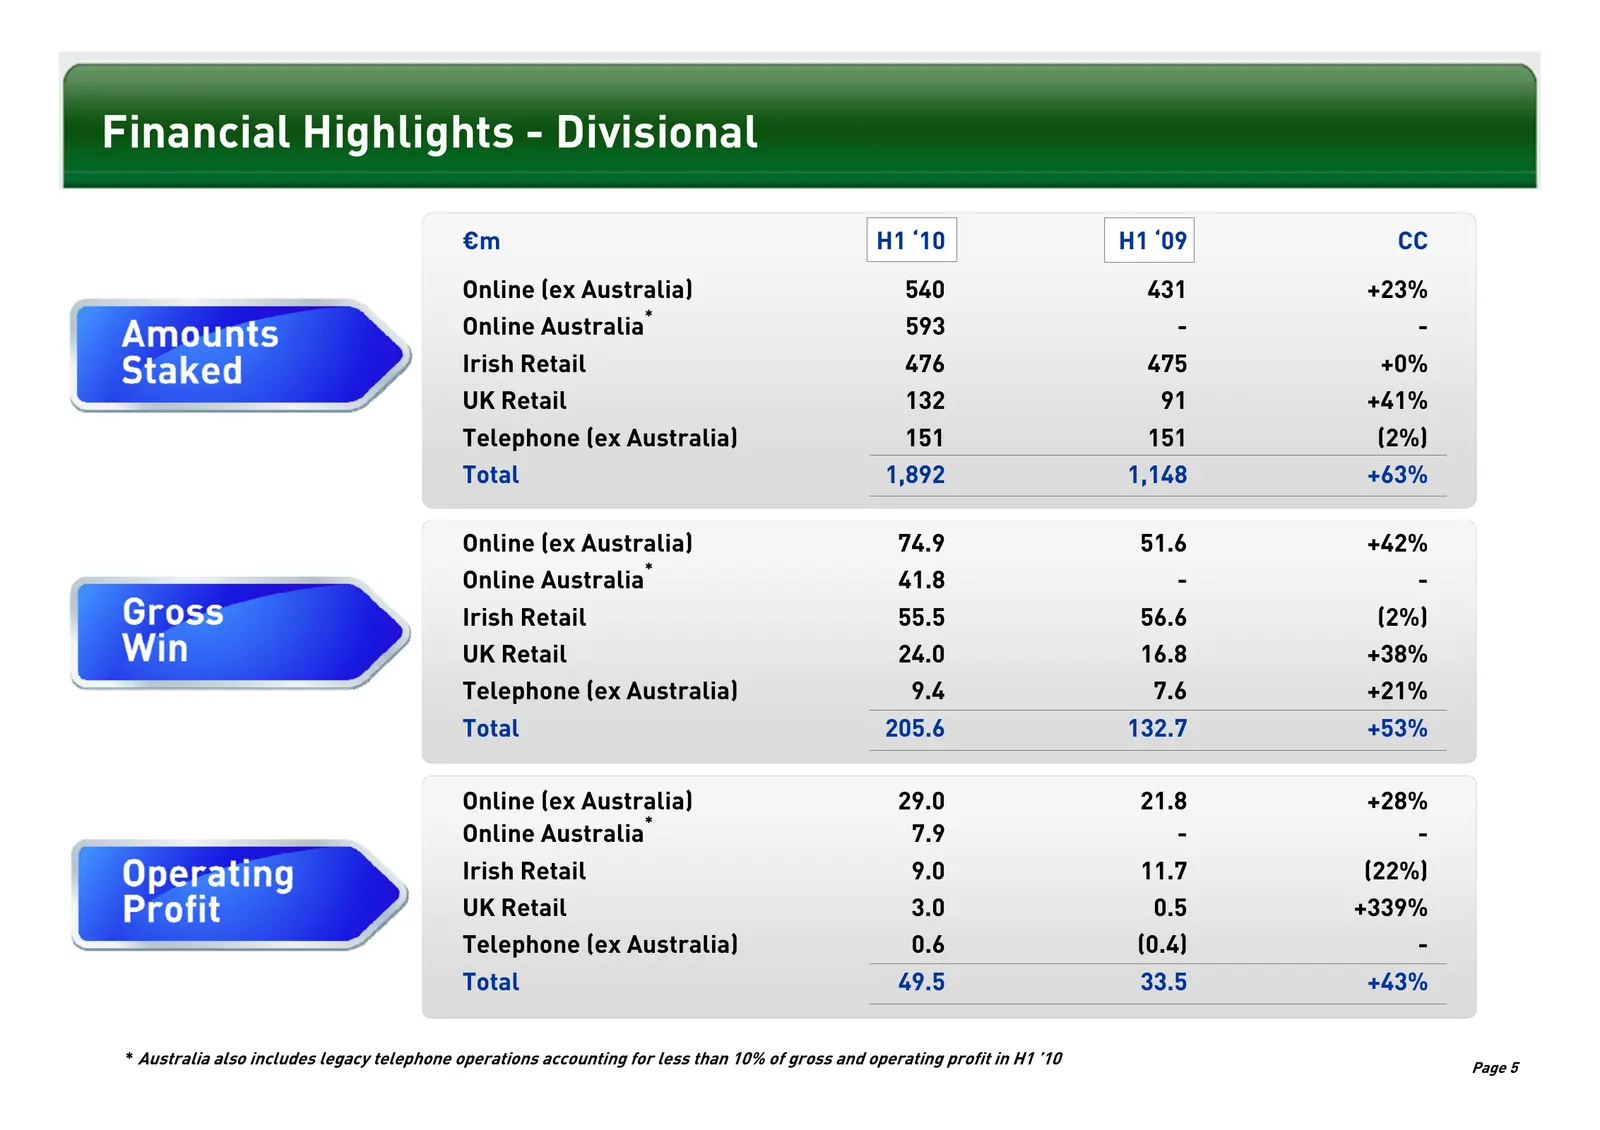
Financial Highlights - Divisional €m H1 ‘10 H1 ‘09 CC Online (ex Australia) 540 431 +23% * Online Australia 593 - - Irish Retail 476 475 +0% UK Retail 132 91 +41% Telephone (ex Australia) 151 151 (2%) Total 1,892 1,148 +63% Online (ex Australia) 74.9 51.6 +42% * Online Australia 41.8 - - Irish Retai
Slide 7: Cash Flow
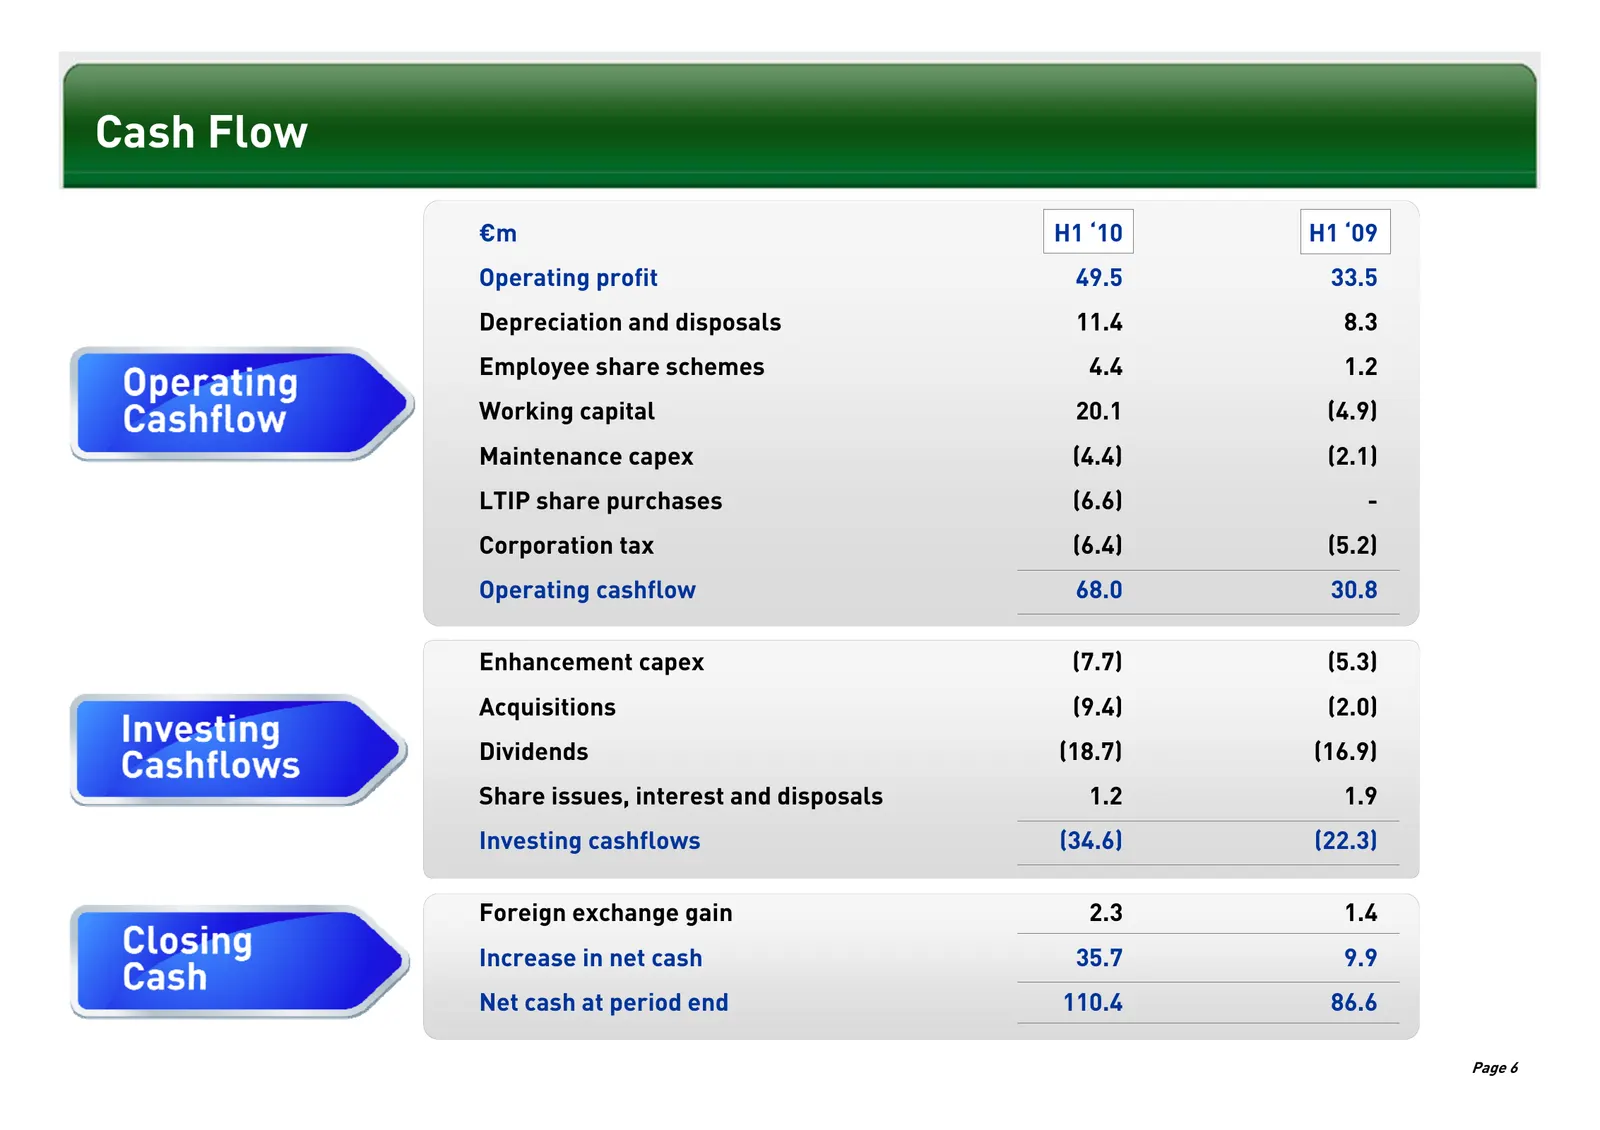
Cash Flow €m H1 ‘10 H1 ‘09 Operating profit 49.5 33.5 Depreciation and disposals 11.4 8.3 Employee share schemes 4.4 1.2 Working capital 20.1 (4.9) Maintenance capex (4.4) (2.1) LTIP share purchases (6.6) - Corporation tax (6.4) (5.2) Operating cashflow 68.0 30.8 Enhancement capex (7.7) (5.3) Acquis
Slide 8: Capital Structure
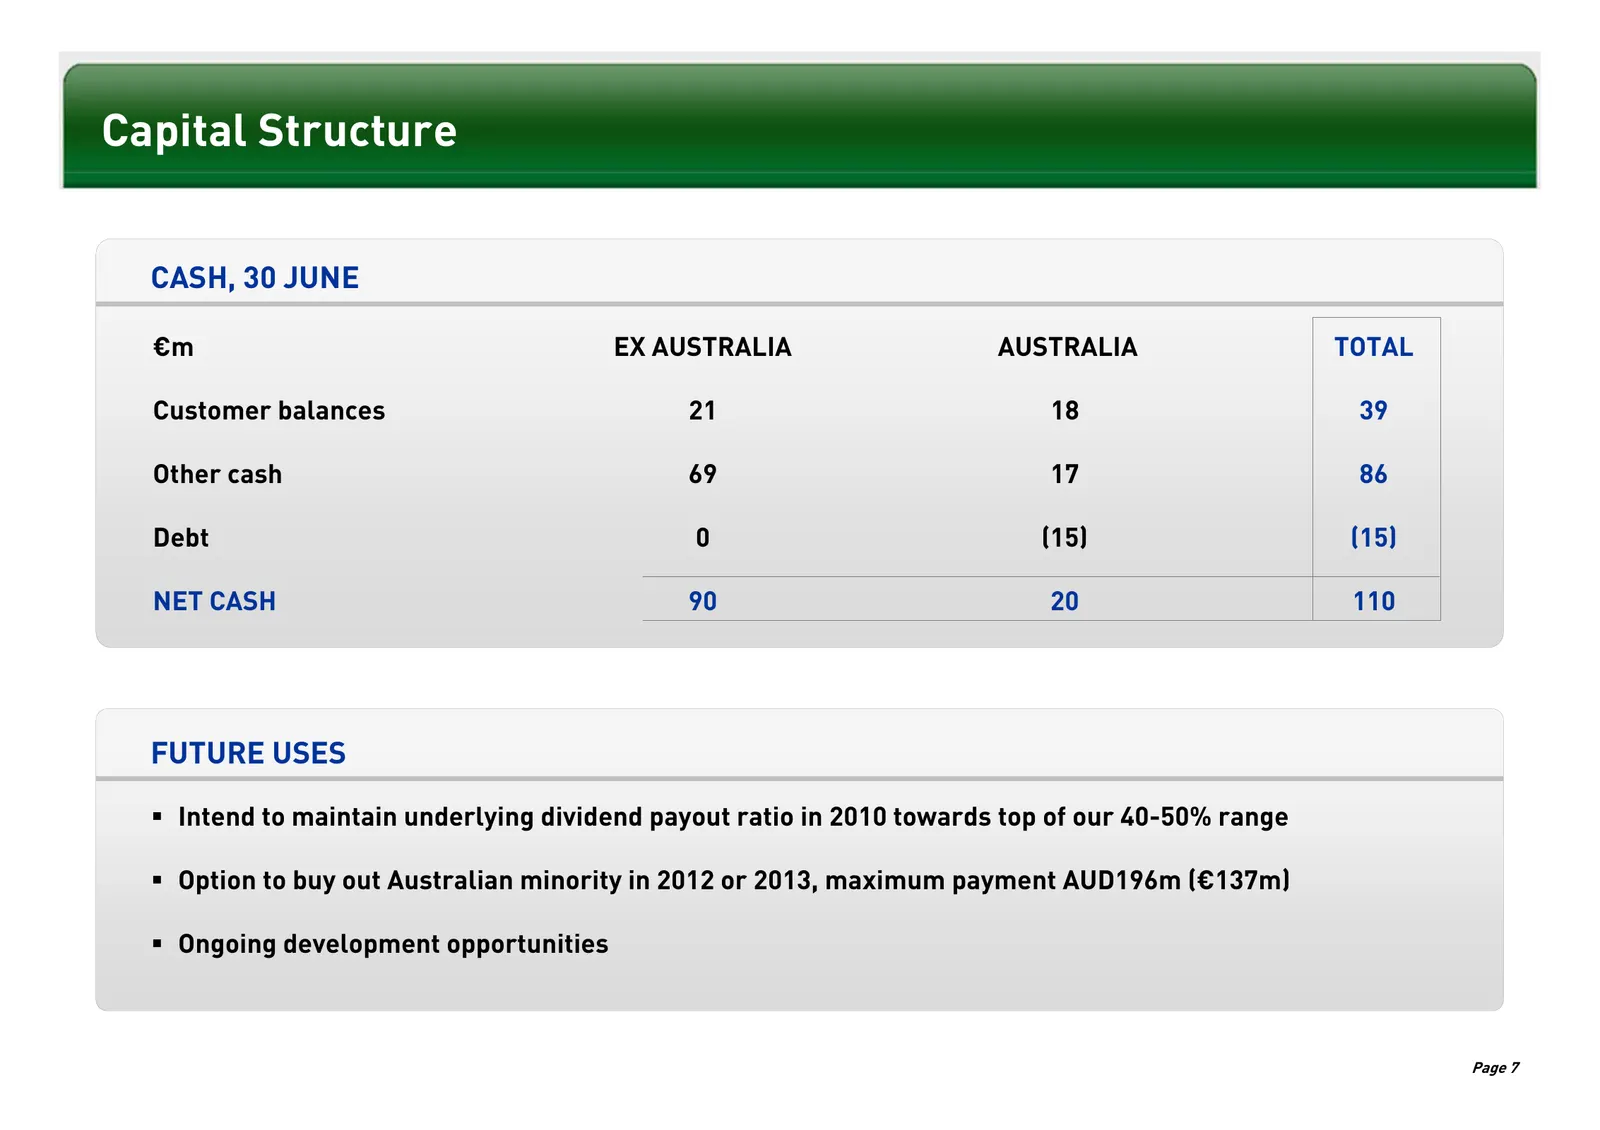
Capital Structure CASH, 30 JUNE €m EX AUSTRALIA AUSTRALIA TOTAL Customer balances 21 18 39 Other cash 69 17 86 Debt 0 (15) (15) NET CASH 90 20 110 FUTURE USES Intend to maintain underlying dividend payout ratio in 2010 towards top of our 40-50% range Option to buy out Australian minority in 2012
Slide 9: Divisional Review
Divisional Review Introduction Financial Performance Divisional Review Strategy & Outlook Page 8
Slide 10: Online Scale and Momentum
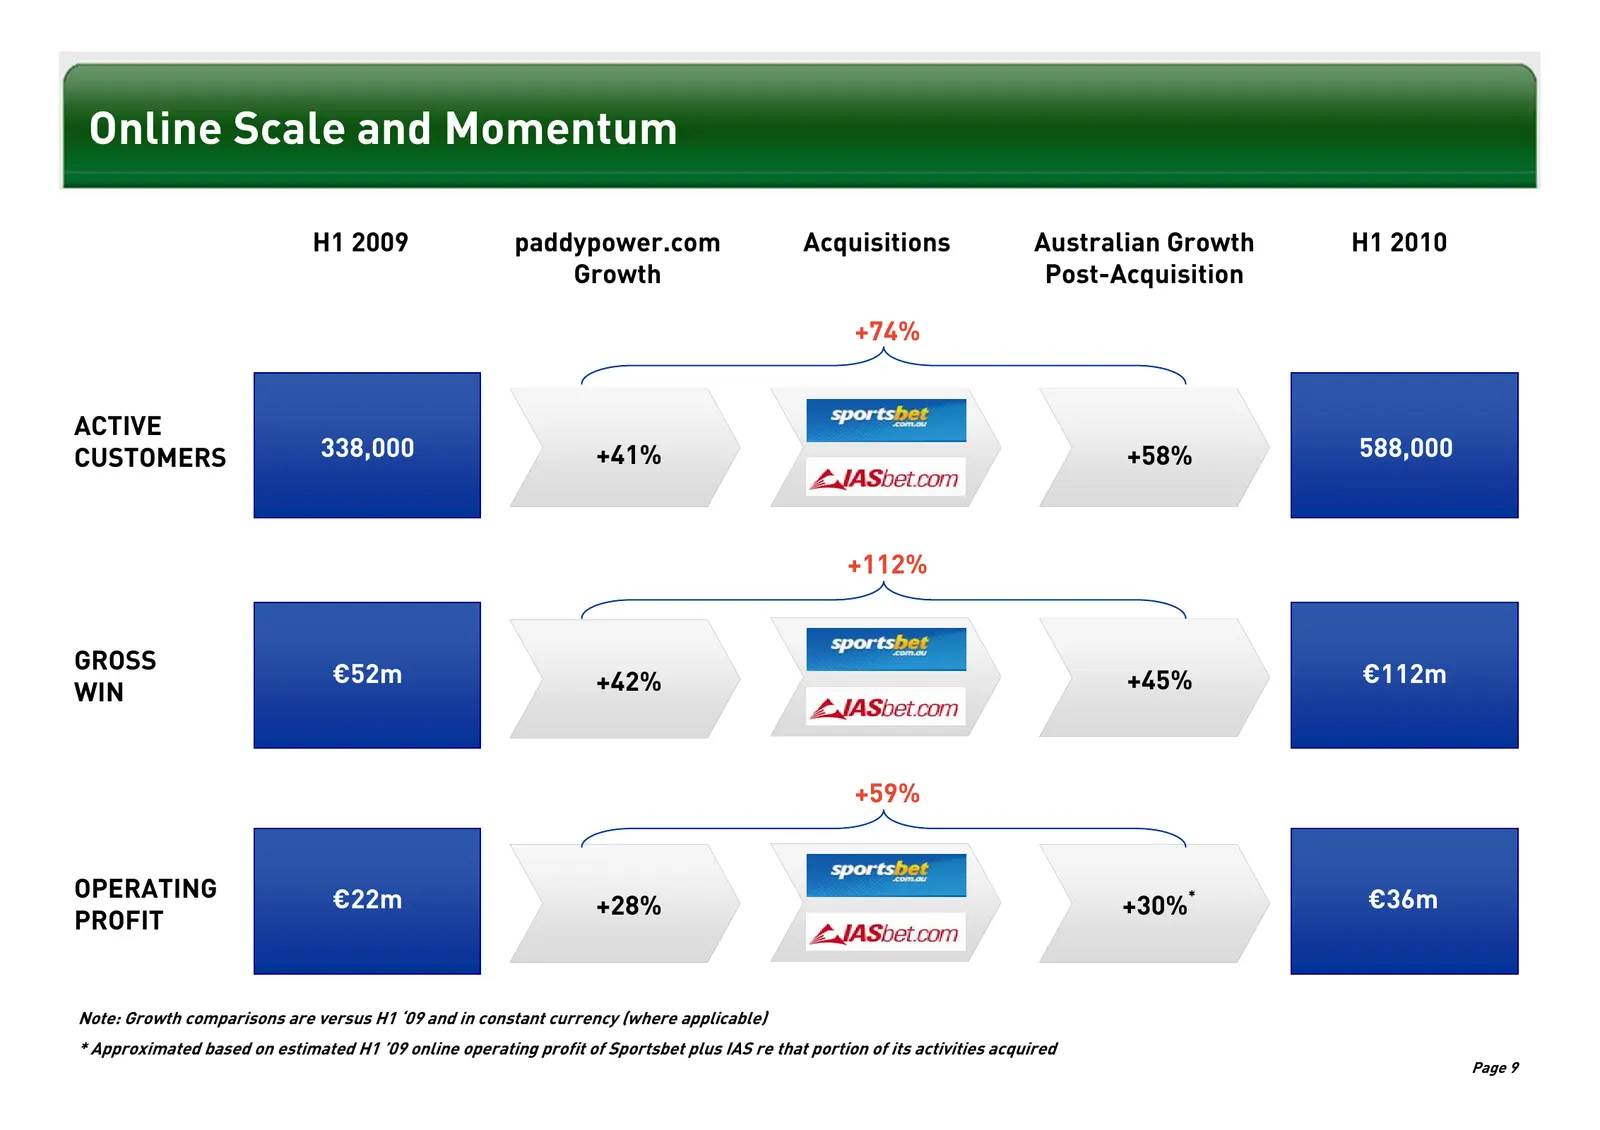
Online Scale and Momentum H1 2009 paddypower.com Acquisitions Australian Growth H1 2010 Growth Post-Acquisition +74% ACTIVE CUSTOMERS 338,000 +41% +58% 588,000 +112% GROSS €52m +42% +45% €112m WIN +59% OPERATING €22m * €36m +28% +30% PROFIT Note: Growth comparisons are versus H1 ‘09 and in constant
Slide 11: Online (ex Australia)
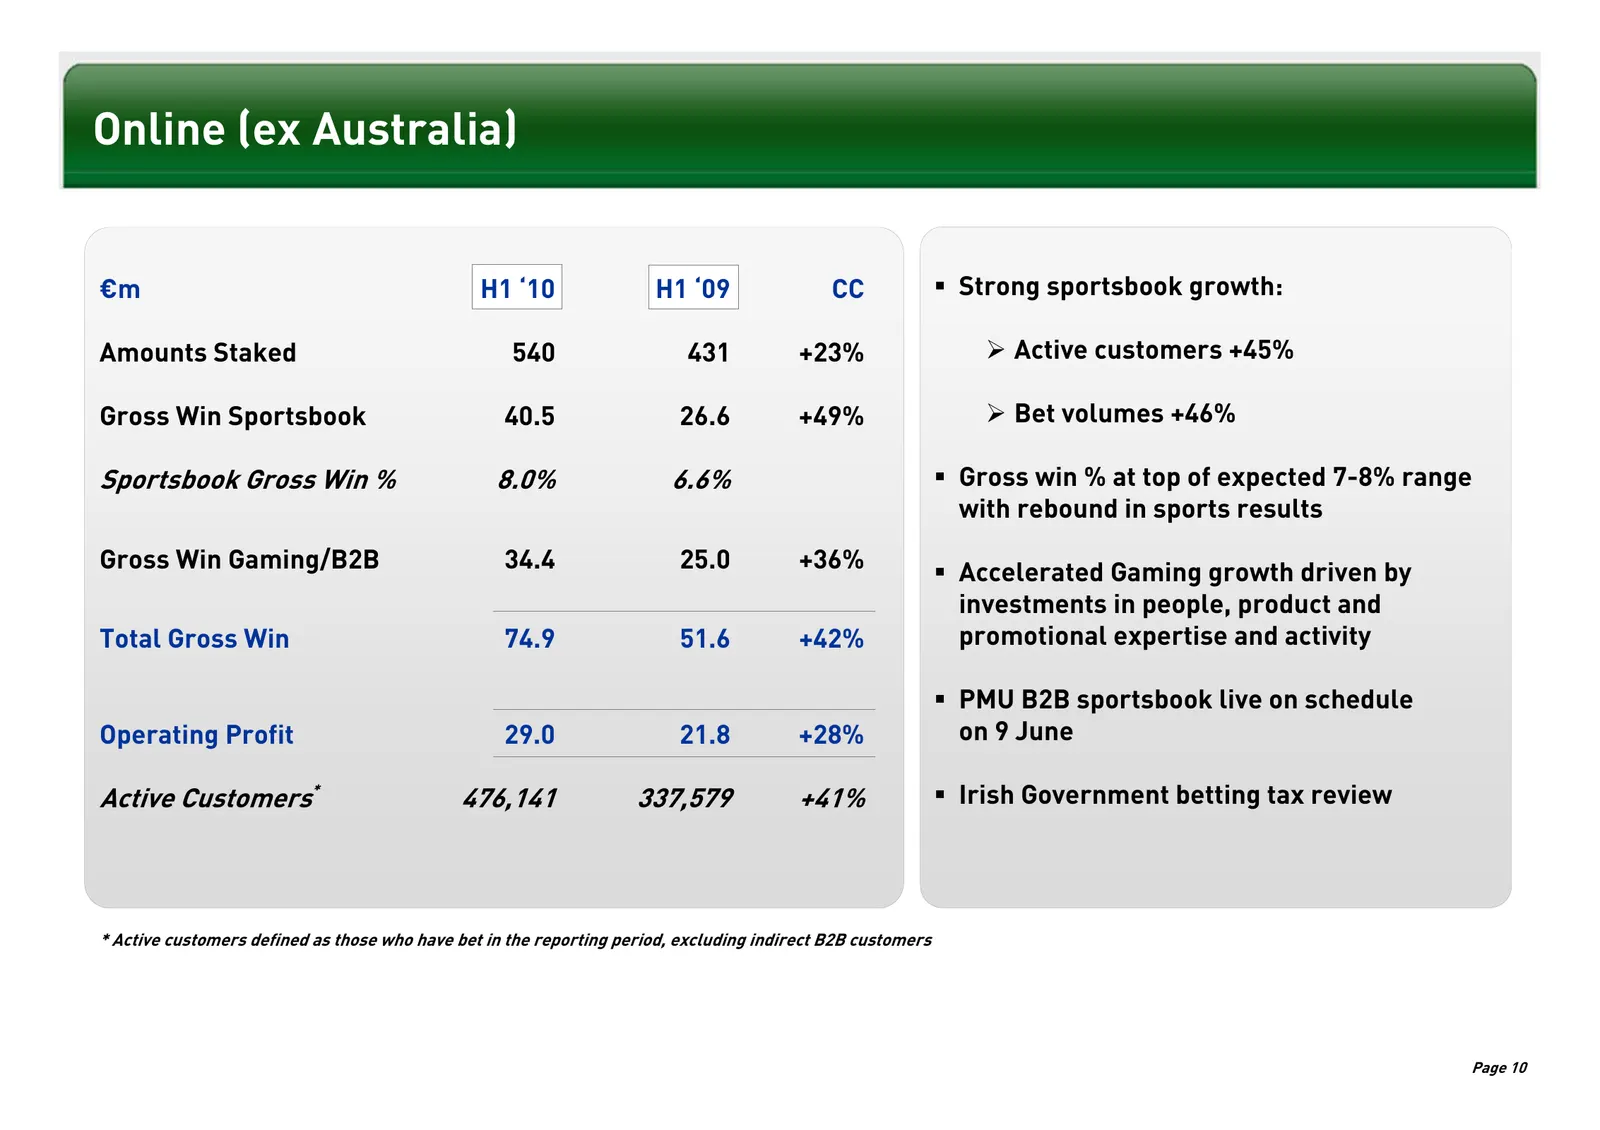
Online (ex Australia) €m H1 ‘10 H1 ‘09 CC Strong sportsbook growth: Amounts Staked 540 431 +23% ¾ Active customers +45% Gross Win Sportsbook 40.5 26.6 +49% ¾ Bet volumes +46% Sportsbook Gross Win % 8.0% 6.6% Gross win % at top of expected 7-8% range with rebound in sports results Gross Win Gamin
Slide 12: Online Operating Cost Growth
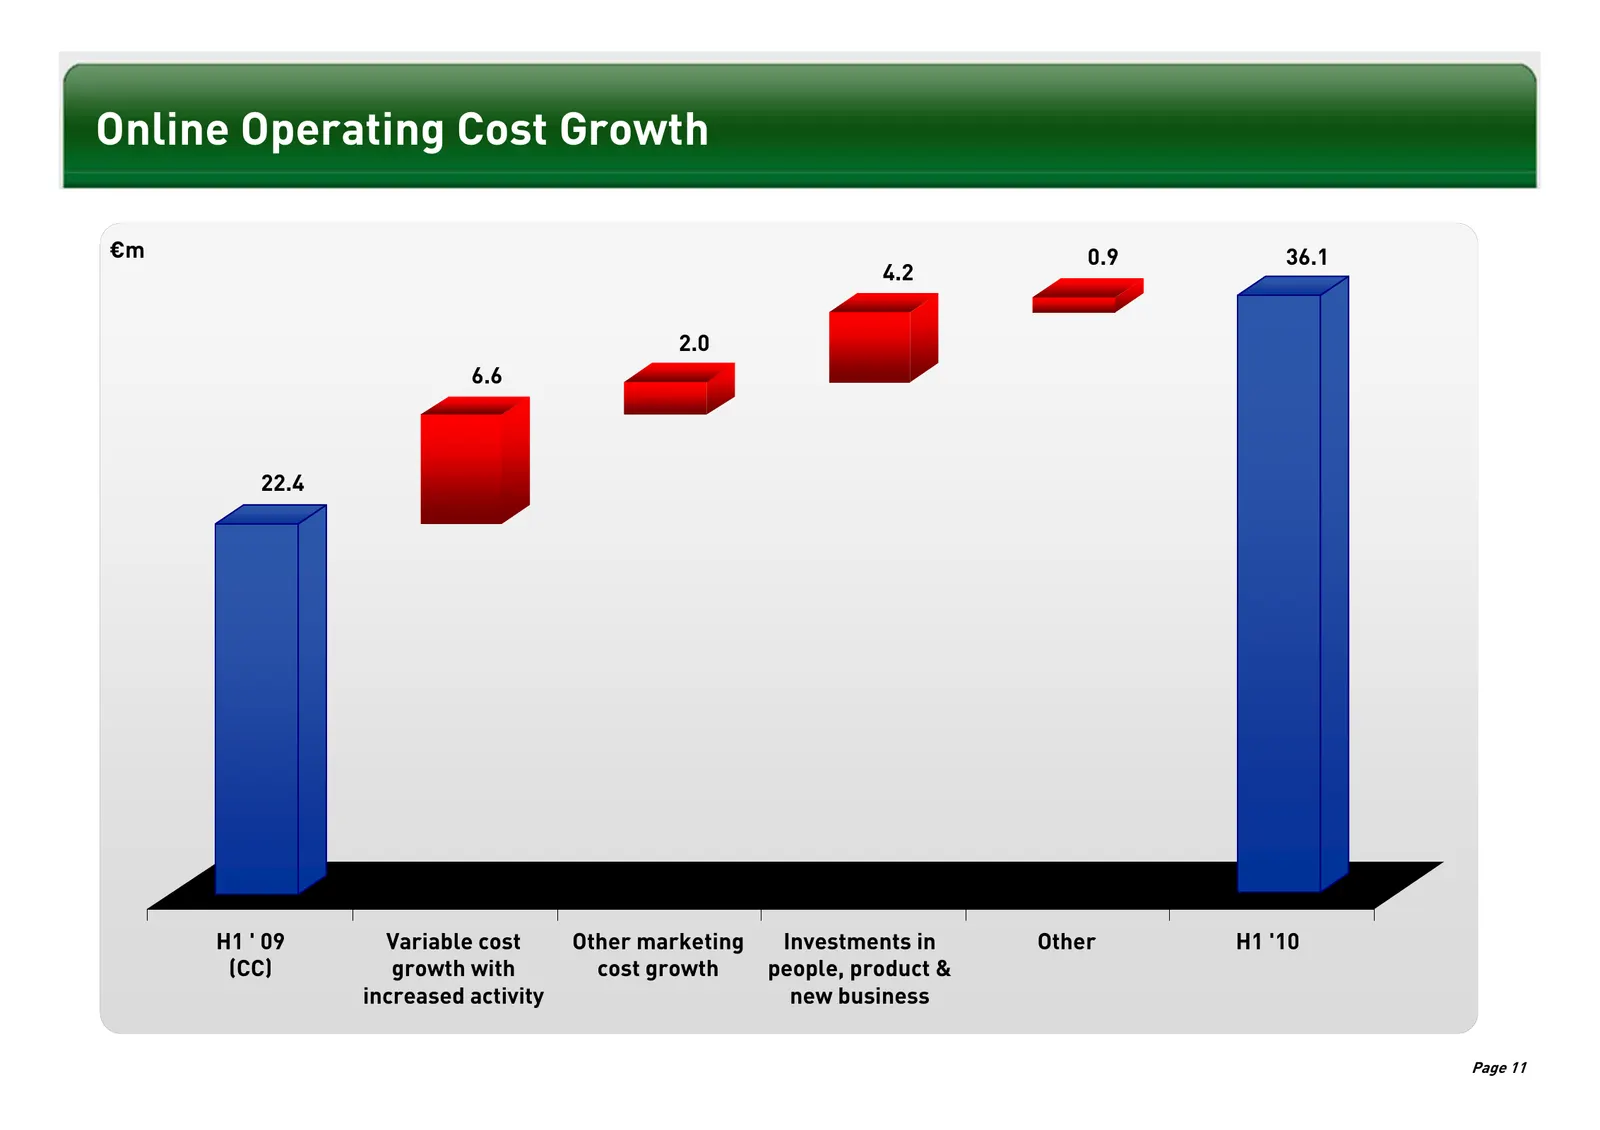
Online Operating Cost Growth €m 0.9 36.1 4.2 2.0 6.6 22.4 H1 ' 09 Variable cost Other marketing Investments in Other H1 '10 (CC) growth with cost growth people, product & increased activity new business Page 11
Slide 13: Acceleration in Momentum
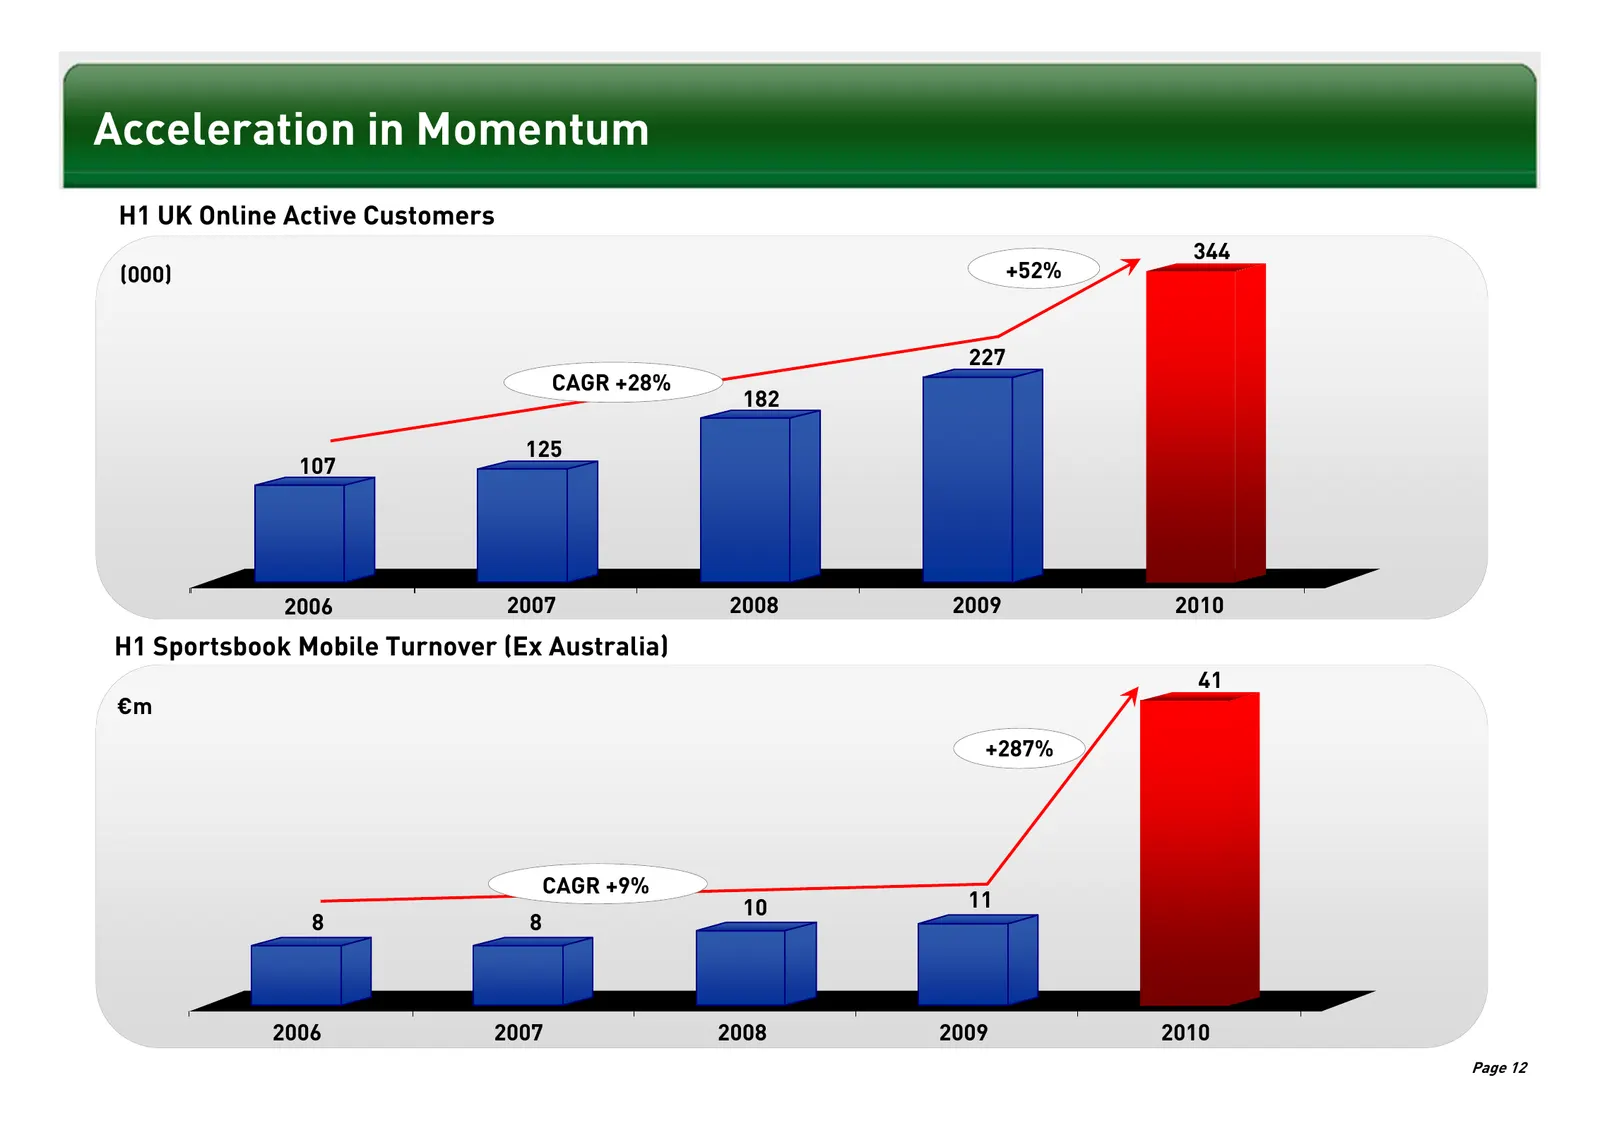
Acceleration in Momentum H1 UK Online Active Customers 344 (000) +52% 227 CAGR +28% 182 125 107 2006 2007 2008 2009 2010 H1 Sportsbook Mobile Turnover (Ex Australia) 41 €m +287% CAGR +9% 10 11 8 8 2006 2007 2008 2009 2010 Page 12
Slide 14: Australia
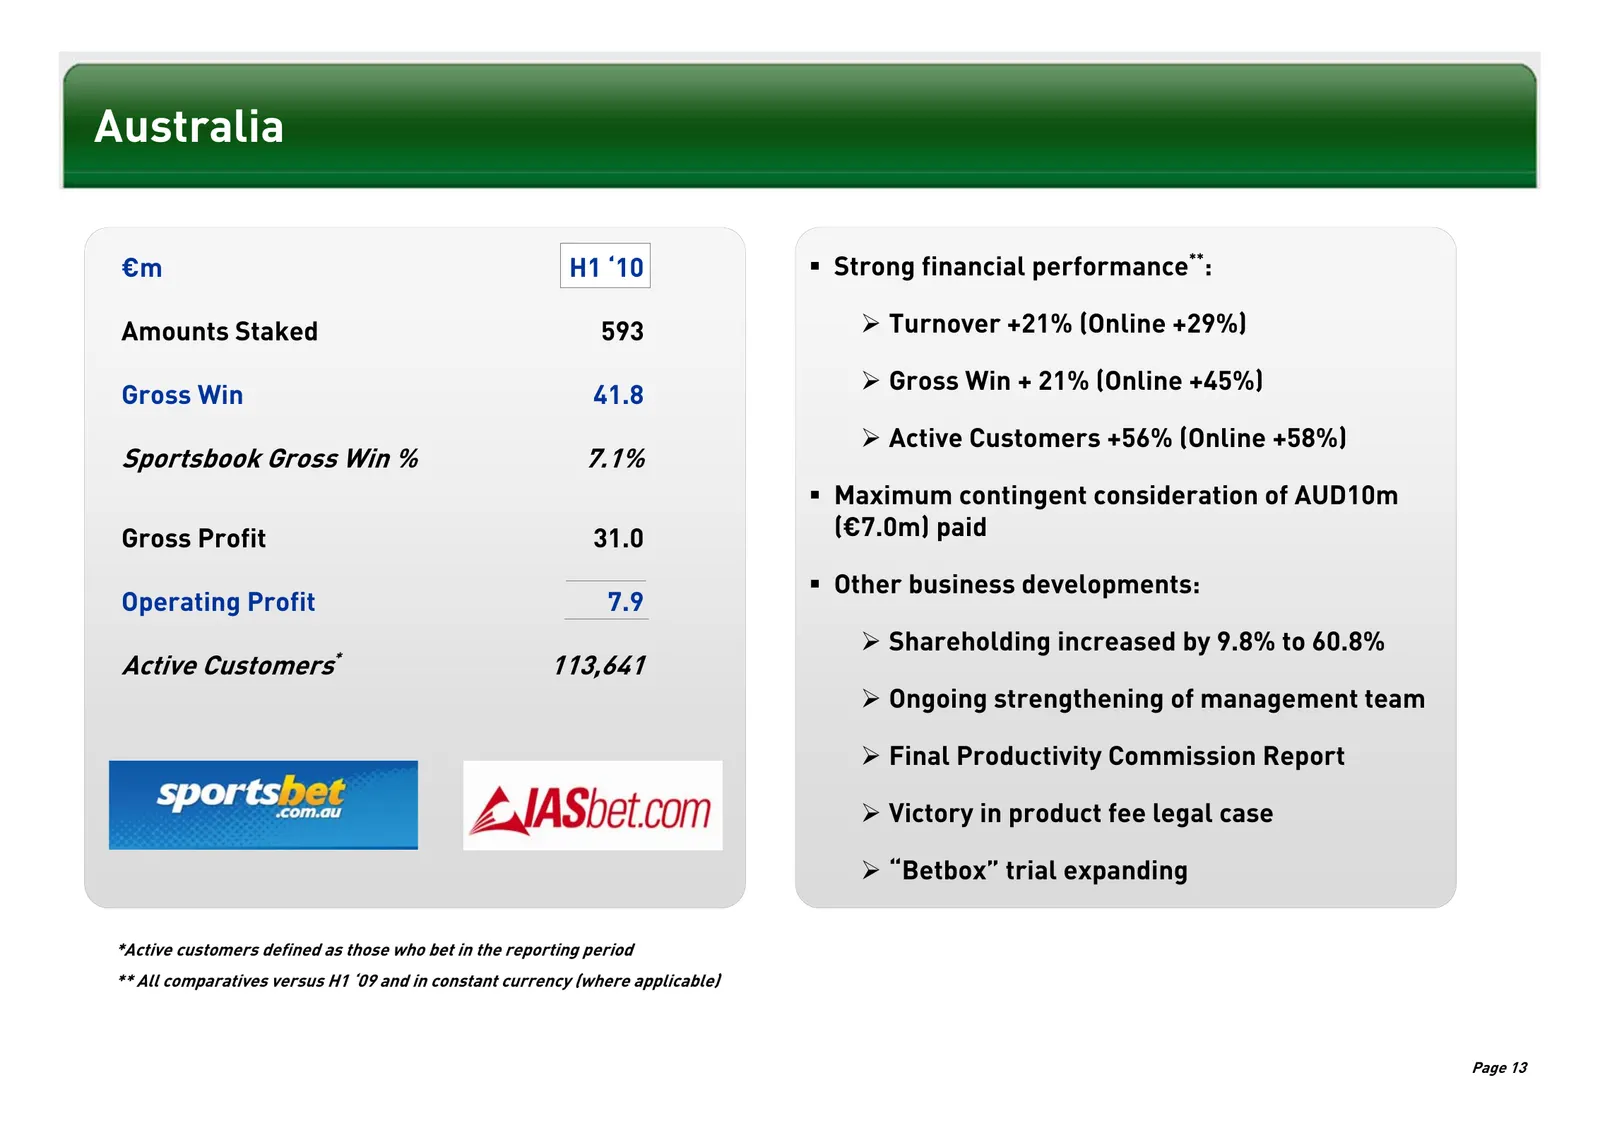
Australia €m H1 ‘10 Strong financial performance**: Amounts Staked 593 ¾ Turnover +21% (Online +29%) ¾ Gross Win + 21% (Online +45%) Gross Win 41.8 ¾ Active Customers +56% (Online +58%) Sportsbook Gross Win % 7.1% Maximum contingent consideration of AUD10m Gross Profit 31.0 (€7.0m) paid Other
Slide 15: Strong Momentum...and Substantial Potential
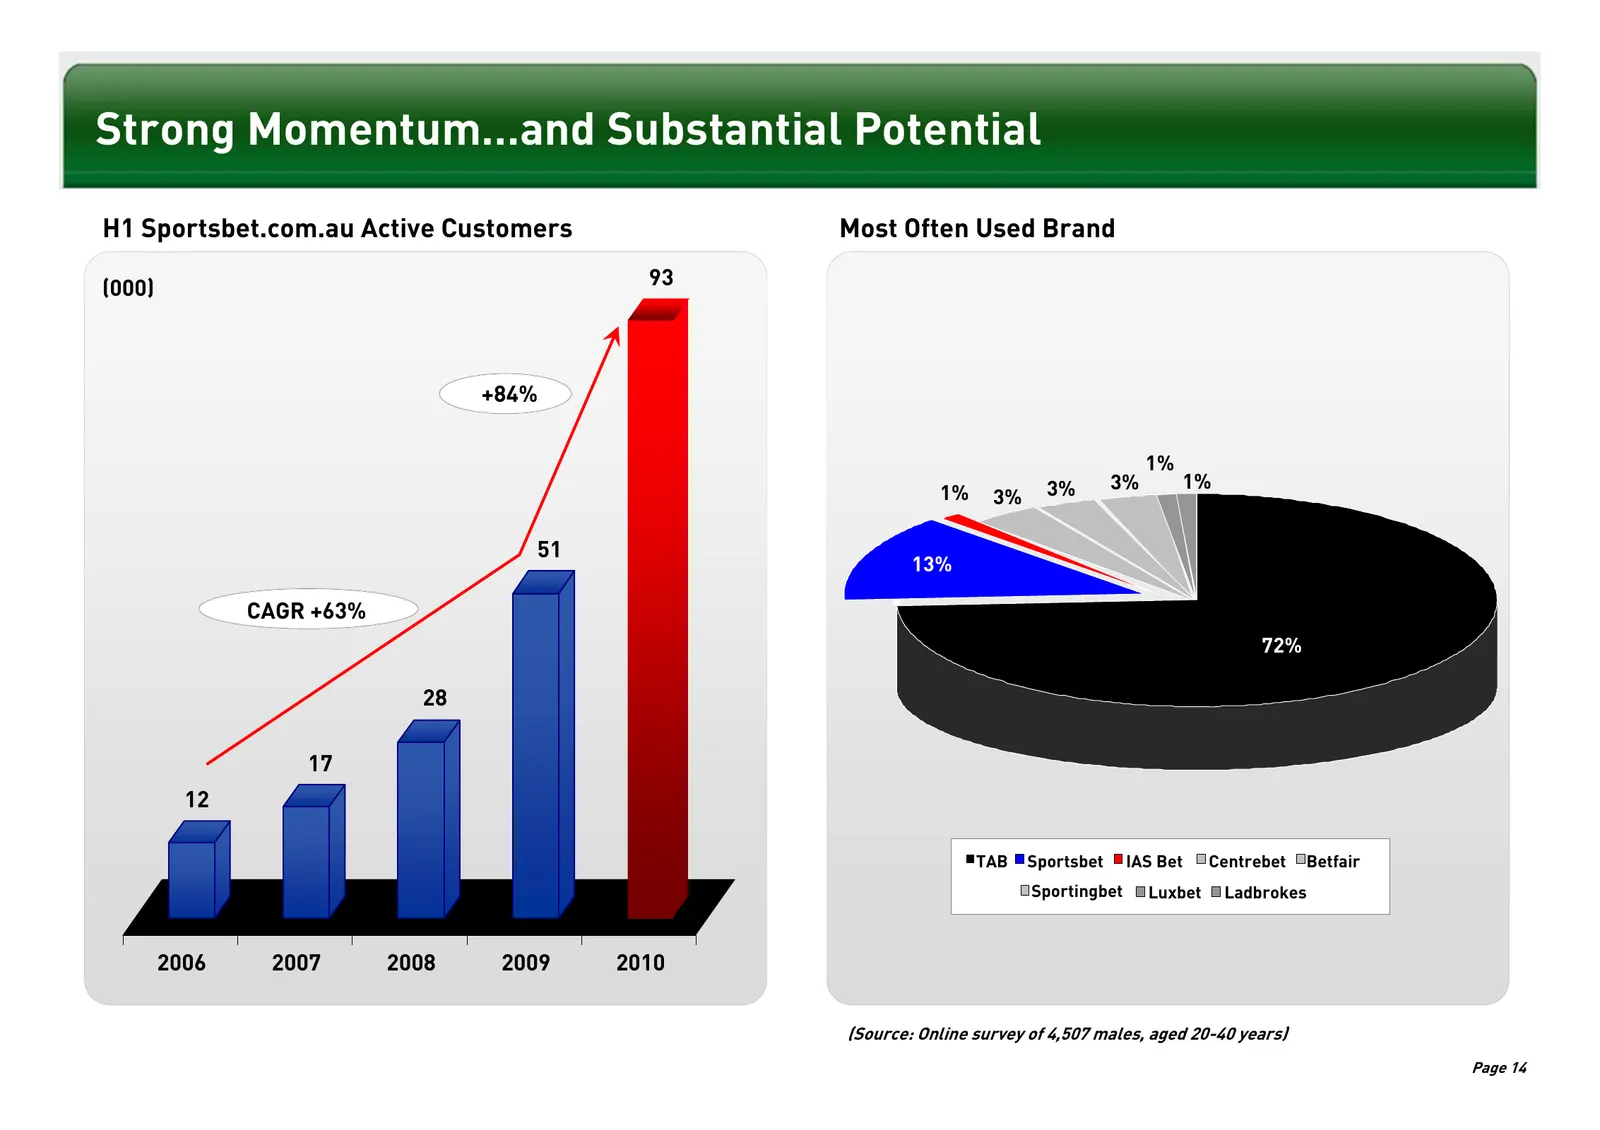
Strong Momentum…and Substantial Potential H1 Sportsbet.com.au Active Customers Most Often Used Brand (000) 93 +84% 1% 3% 3% 1% 1% 3% 51 13% CAGR +63% 72% 28 17 12 TAB Sportsbet IAS Bet Centrebet Betfair Sportingbet Luxbet Ladbrokes 2006 2007 2008 2009 2010 (Source: Online survey of 4,507 males, aged
Slide 16: Irish Retail
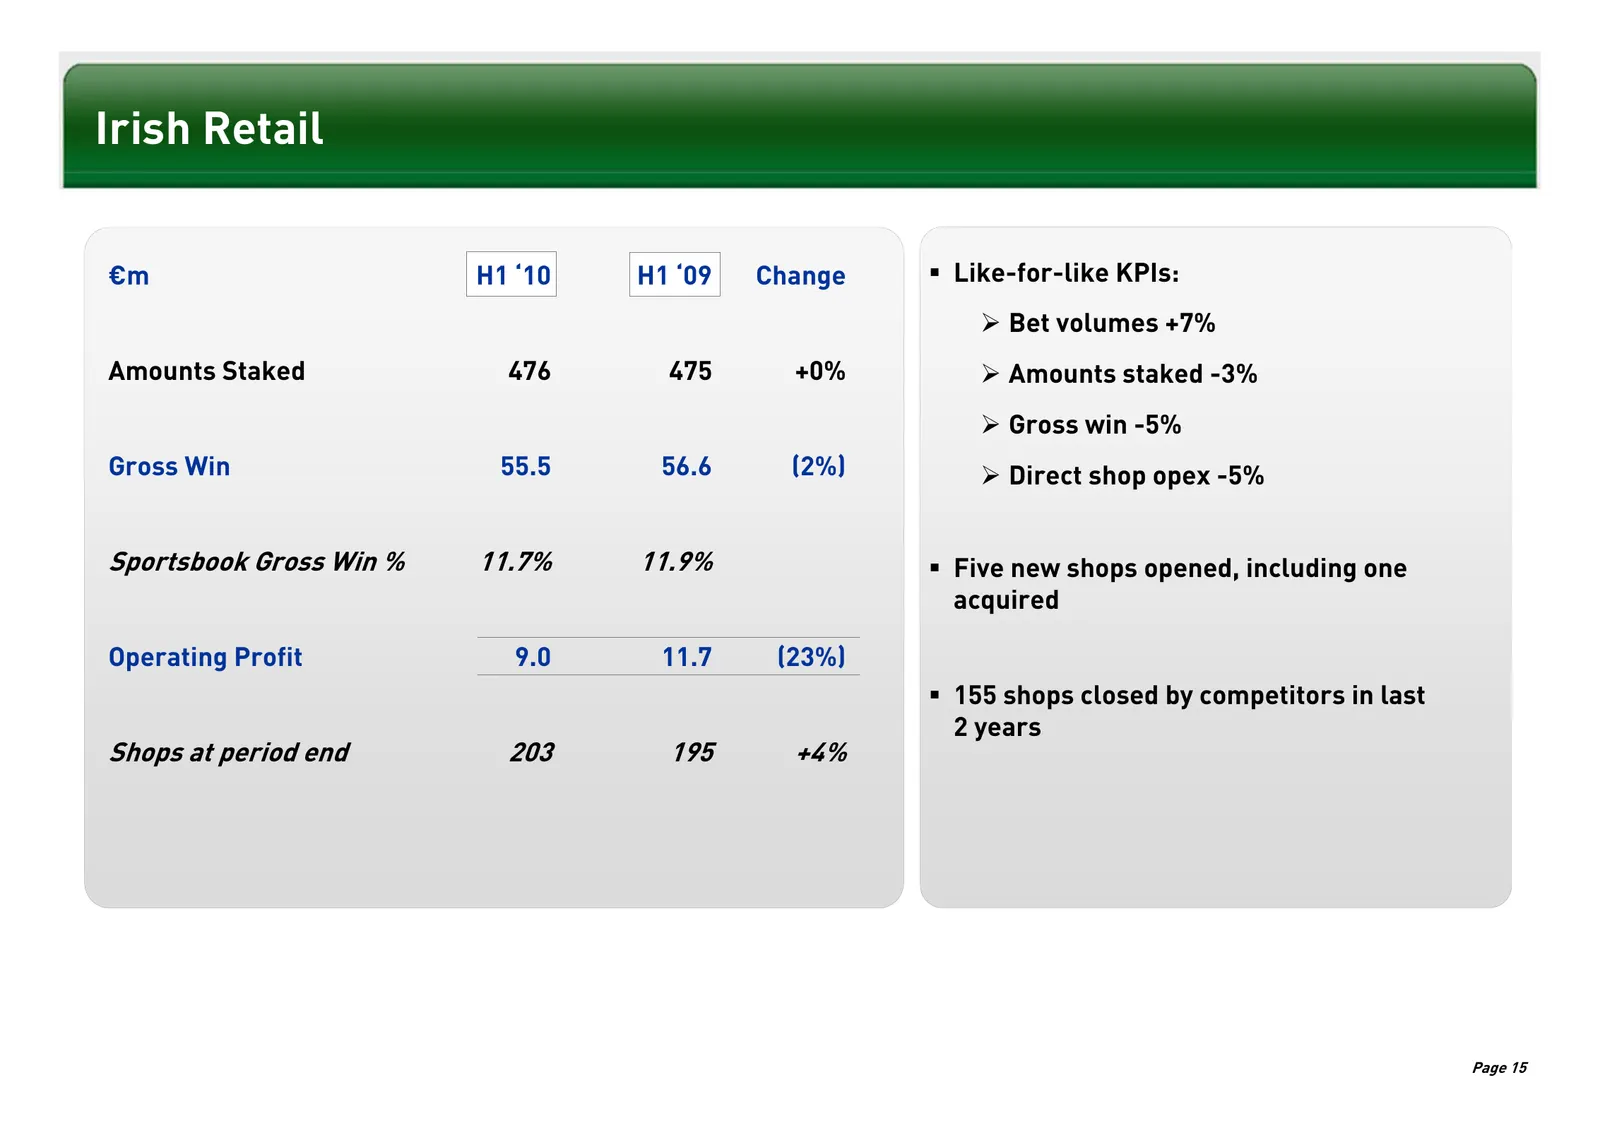
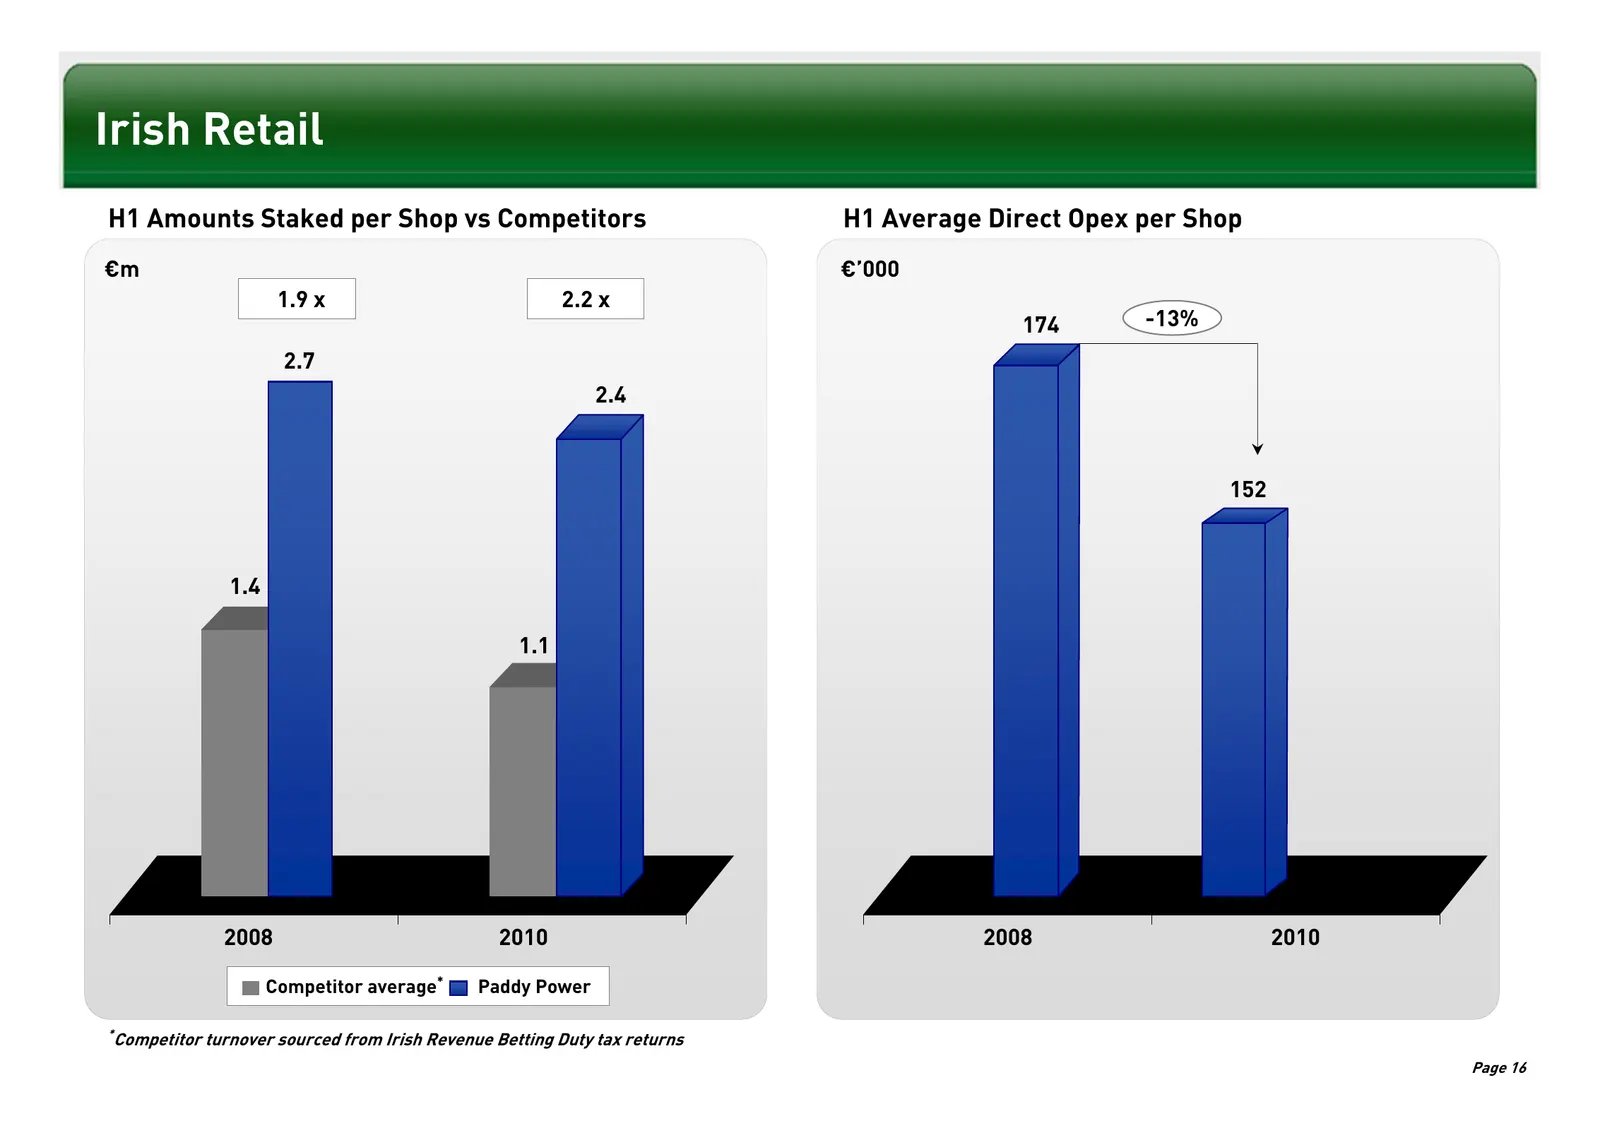
Irish Retail €m H1 ‘10 H1 ‘09 Change Like-for-like KPIs: ¾ Bet volumes +7% Amounts Staked 476 475 +0% ¾ Amounts staked -3% ¾ Gross win -5% Gross Win 55.5 56.6 (2%) ¾ Direct shop opex -5% Sportsbook Gross Win % 11.7% 11.9% Five new shops opened, including one acquired Operating Profit 9.0 11.7 (2
Slide 17: Irish Retail
Irish Retail H1 Amounts Staked per Shop vs Competitors H1 Average Direct Opex per Shop €m €’000 1.9 x 2.2 x 174 -13% 2.7 174.4 2.4 152 1.4 1.1 2008 2010 2008 2010 Competitor average* Paddy Power * Competitor turnover sourced from Irish Revenue Betting Duty tax returns Page 16
Slide 18: UK Retail
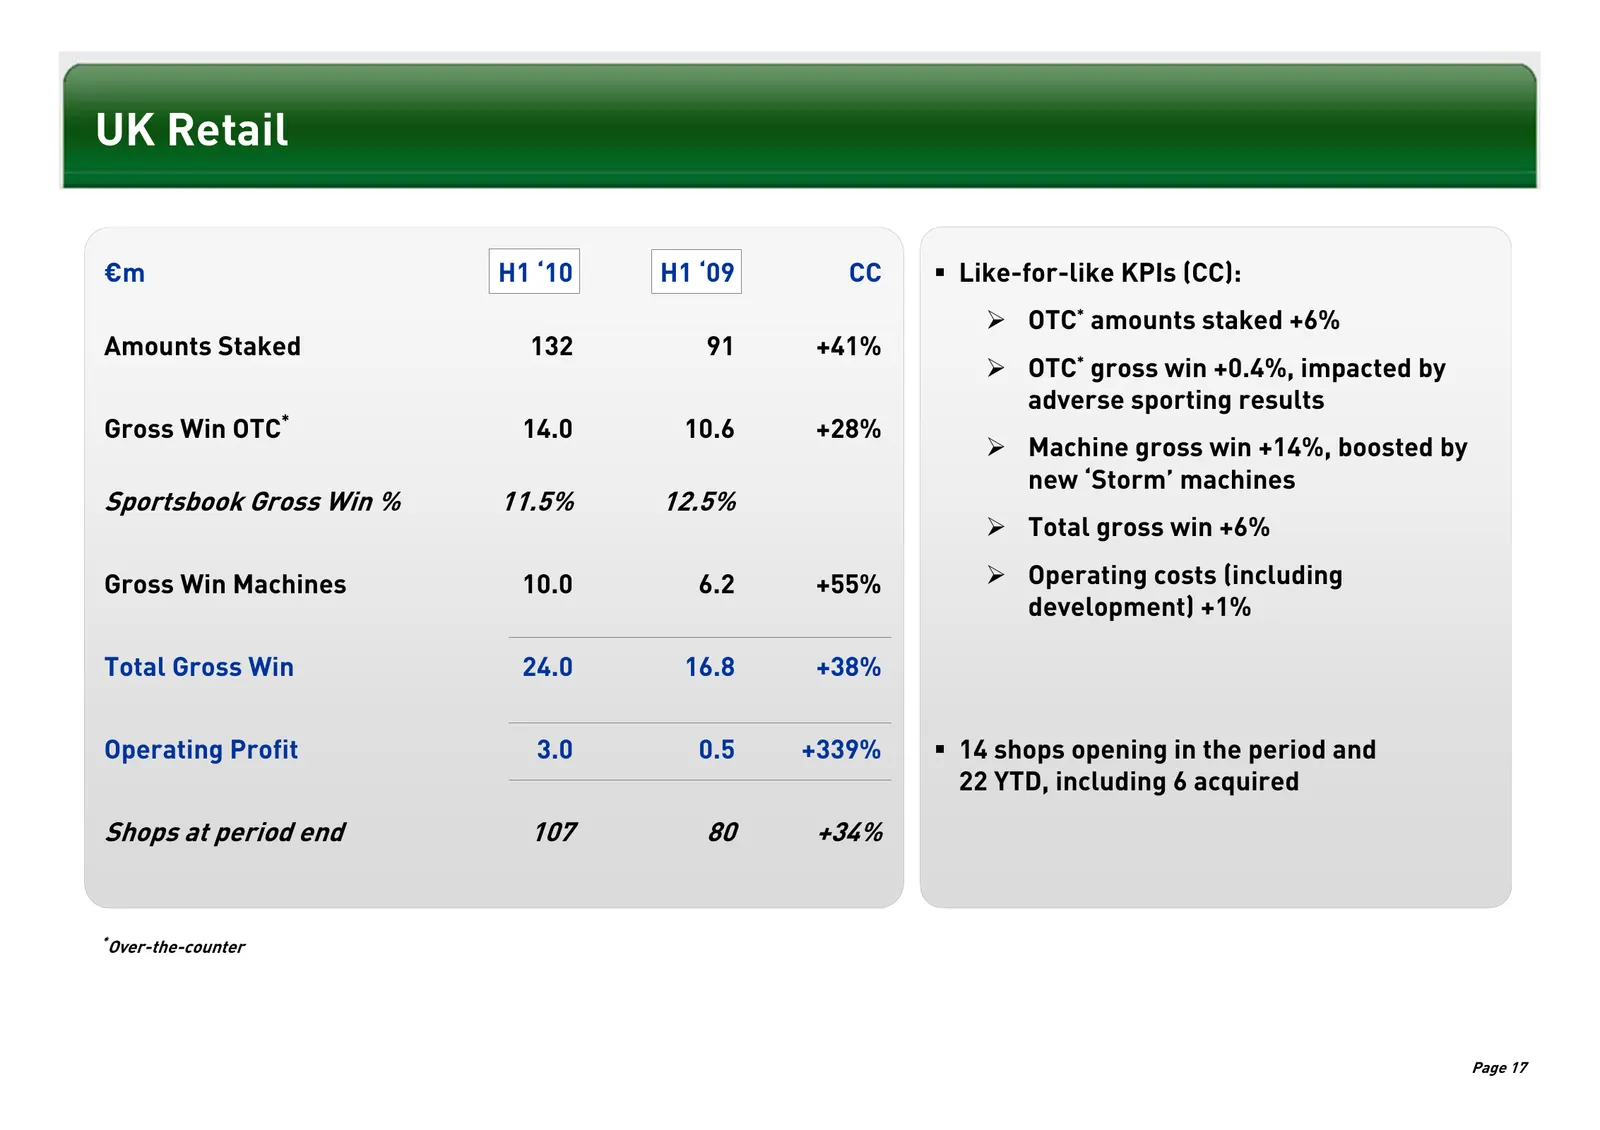
UK Retail €m H1 ‘10 H1 ‘09 CC Like-for-like KPIs (CC): ¾ OTC* amounts staked +6% Amounts Staked 132 91 +41% ¾ OTC* gross win +0.4%, impacted by adverse sporting results Gross Win OTC* 14.0 10.6 +28% ¾ Machine gross win +14%, boosted by new ‘Storm’ machines Sportsbook Gross Win % 11.5% 12.5% ¾ Tota
Slide 19: GB Retail Return on Capital
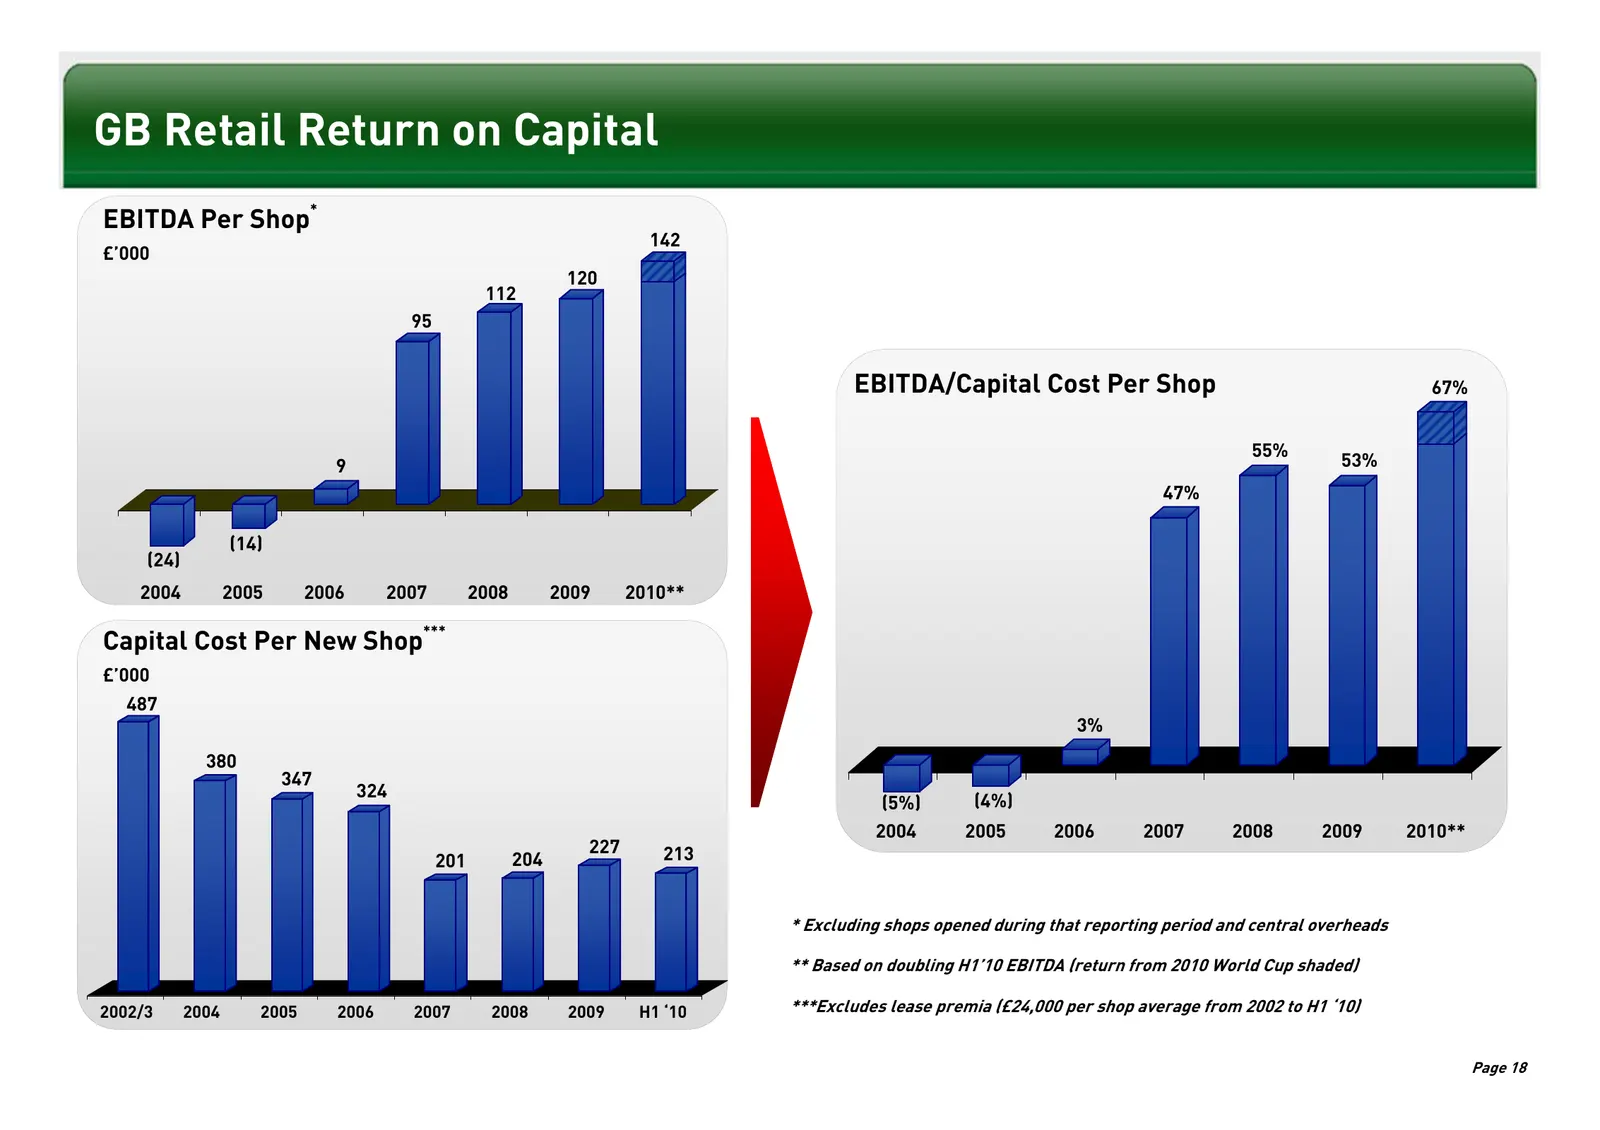
GB Retail Return on Capital * EBITDA Per Shop 142 £’000 120 112 95 EBITDA/Capital Cost Per Shop 67% 55% 9 53% 47% (14) (24) 2004 2005 2006 2007 2008 2009 2010** *** Capital Cost Per New Shop £’000 487 3% 380 347 324 (4%) (5%) 2004 2005 2006 2007 2008 2009 2010** 227 213 201 204 * Excluding shops ope
Slide 20: Telephone
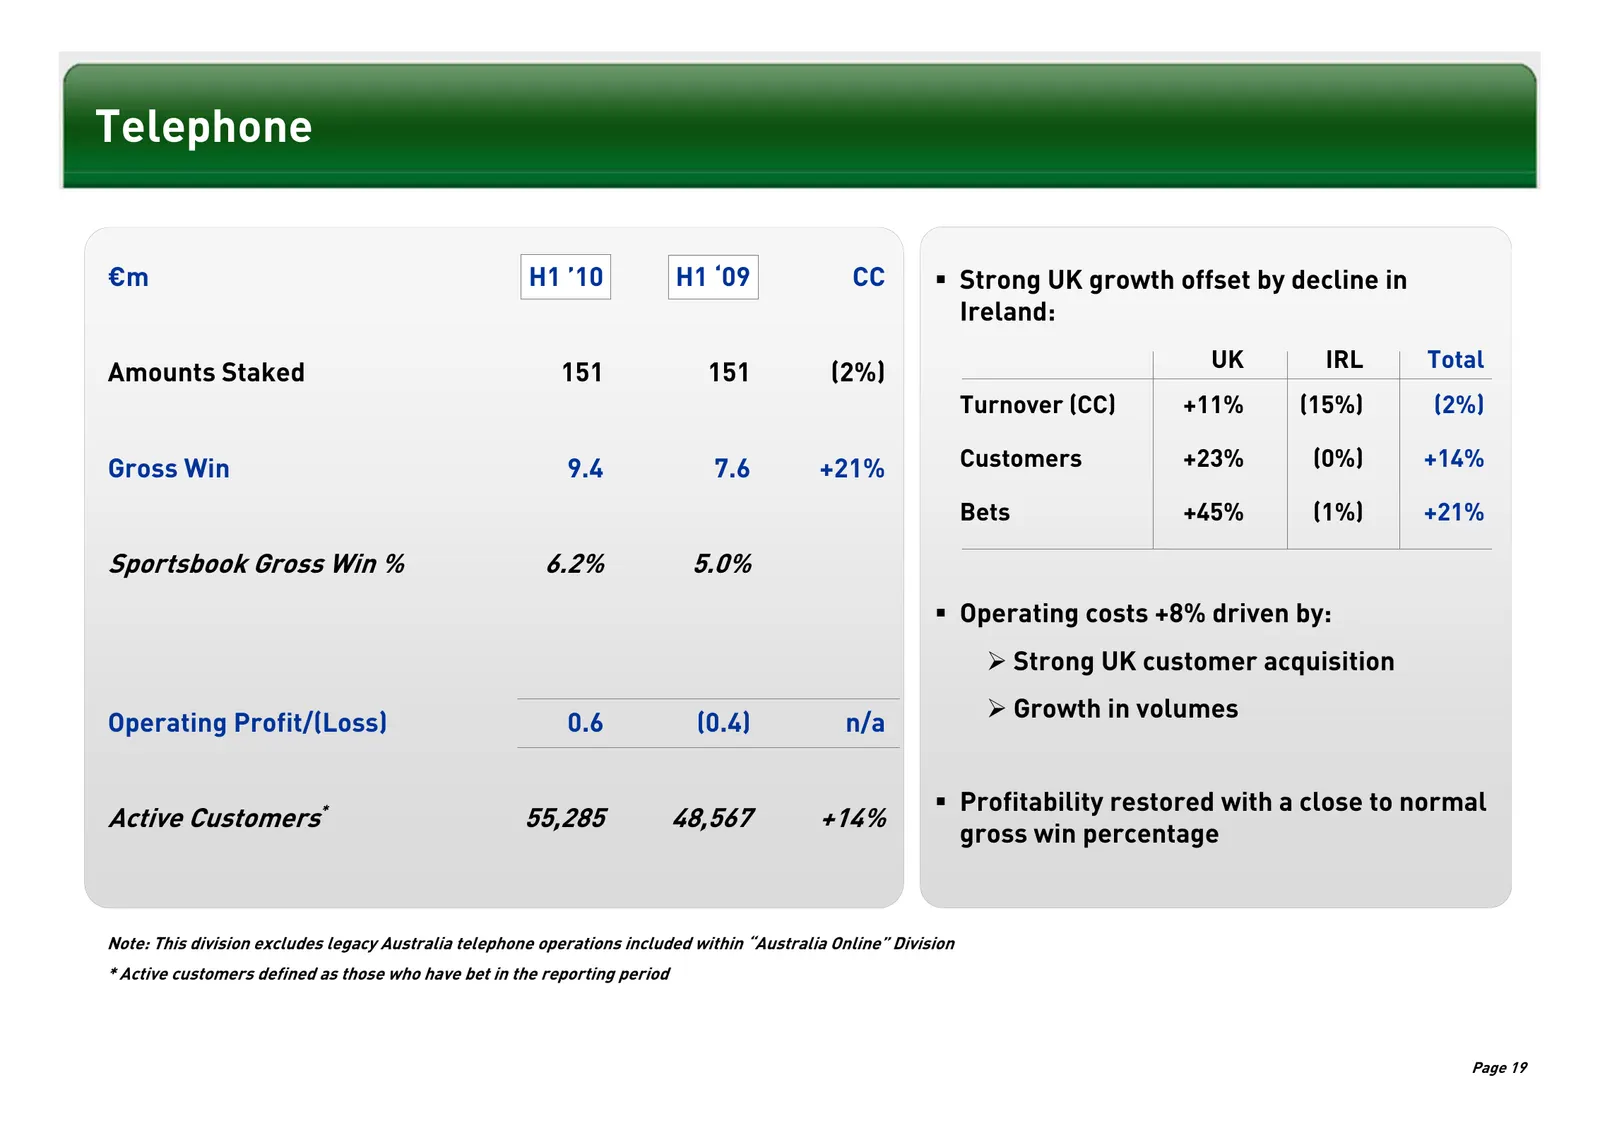
Telephone €m H1 ’10 H1 ‘09 CC Strong UK growth offset by decline in Ireland: UK IRL Total Amounts Staked 151 151 (2%) Turnover (CC) +11% (15%) (2%) Gross Win 9.4 7.6 +21% Customers +23% (0%) +14% Bets +45% (1%) +21% Sportsbook Gross Win % 6.2% 5.0% Operating costs +8% driven by: ¾ Strong UK cust
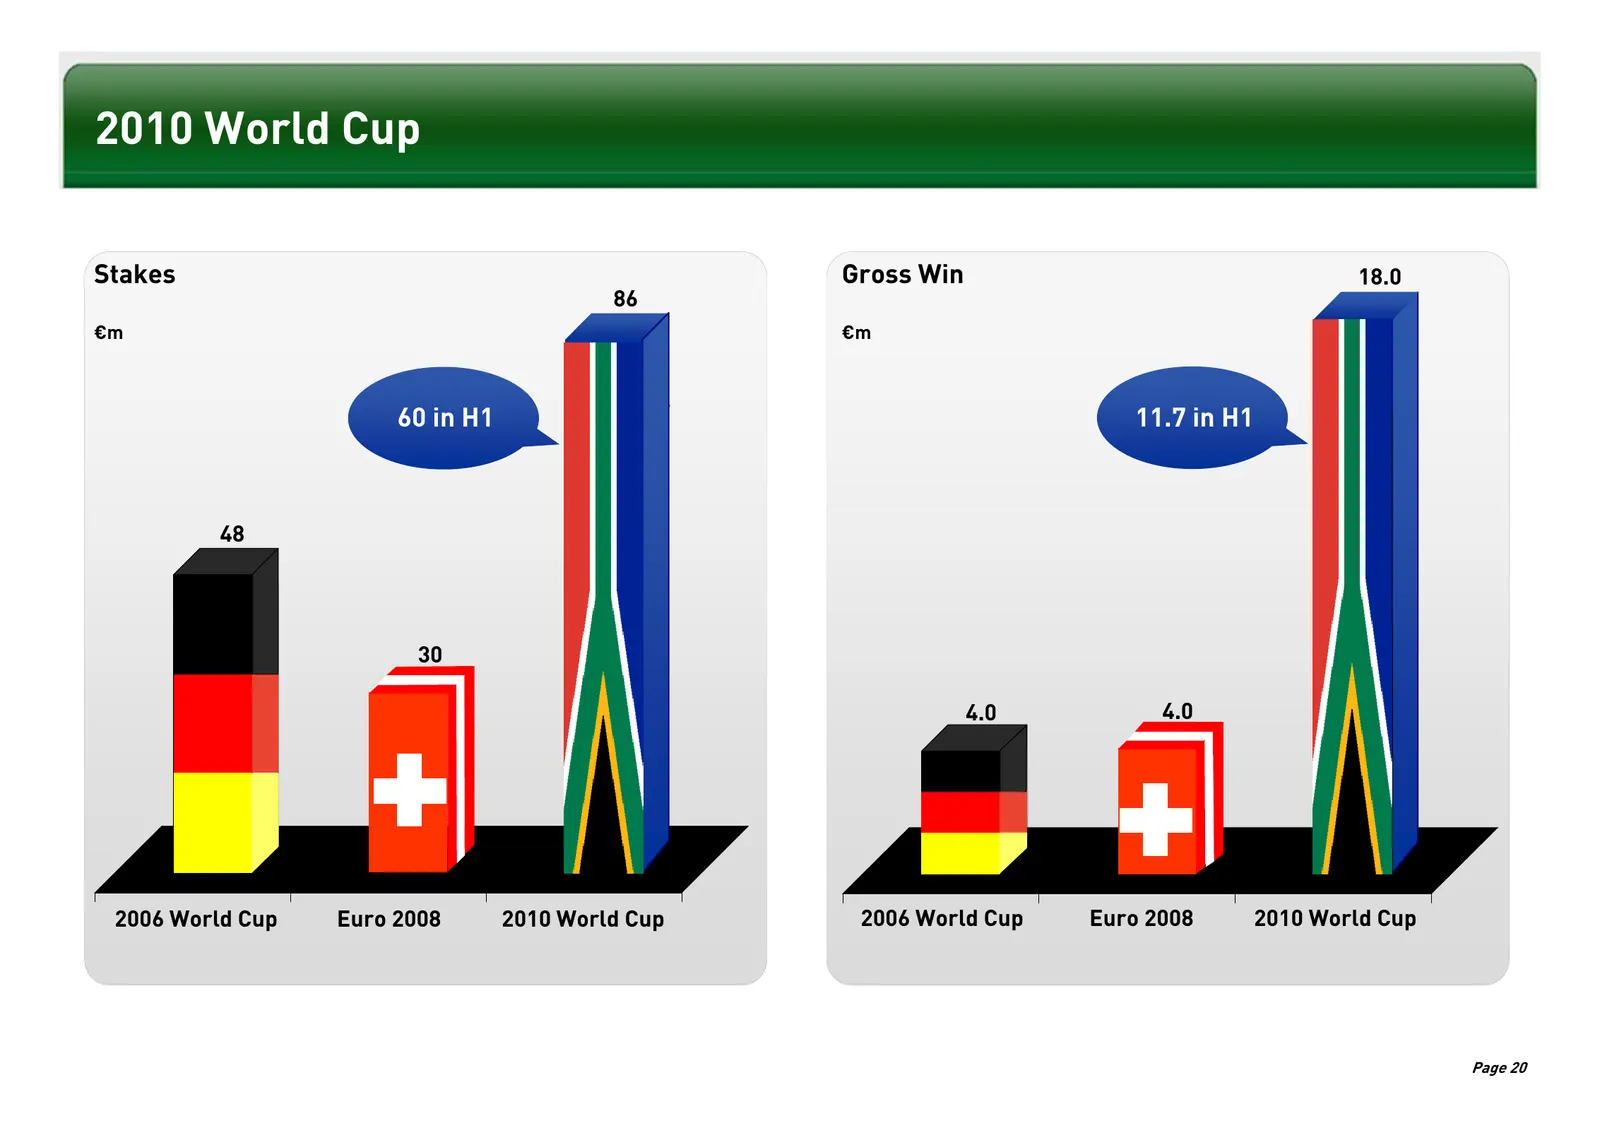
Slide 21: 2010 World Cup
2010 World Cup Stakes Gross Win 18.0 86 €m €m 60 in H1 11.7 in H1 48 30 4.0 4.0 2006 World Cup Euro 2008 2010 World Cup 2006 World Cup Euro 2008 2010 World Cup Page 20
Slide 22: Strategy & Outlook
Strategy & Outlook Introduction Financial Performance Divisional Review Strategy & Outlook Page 21
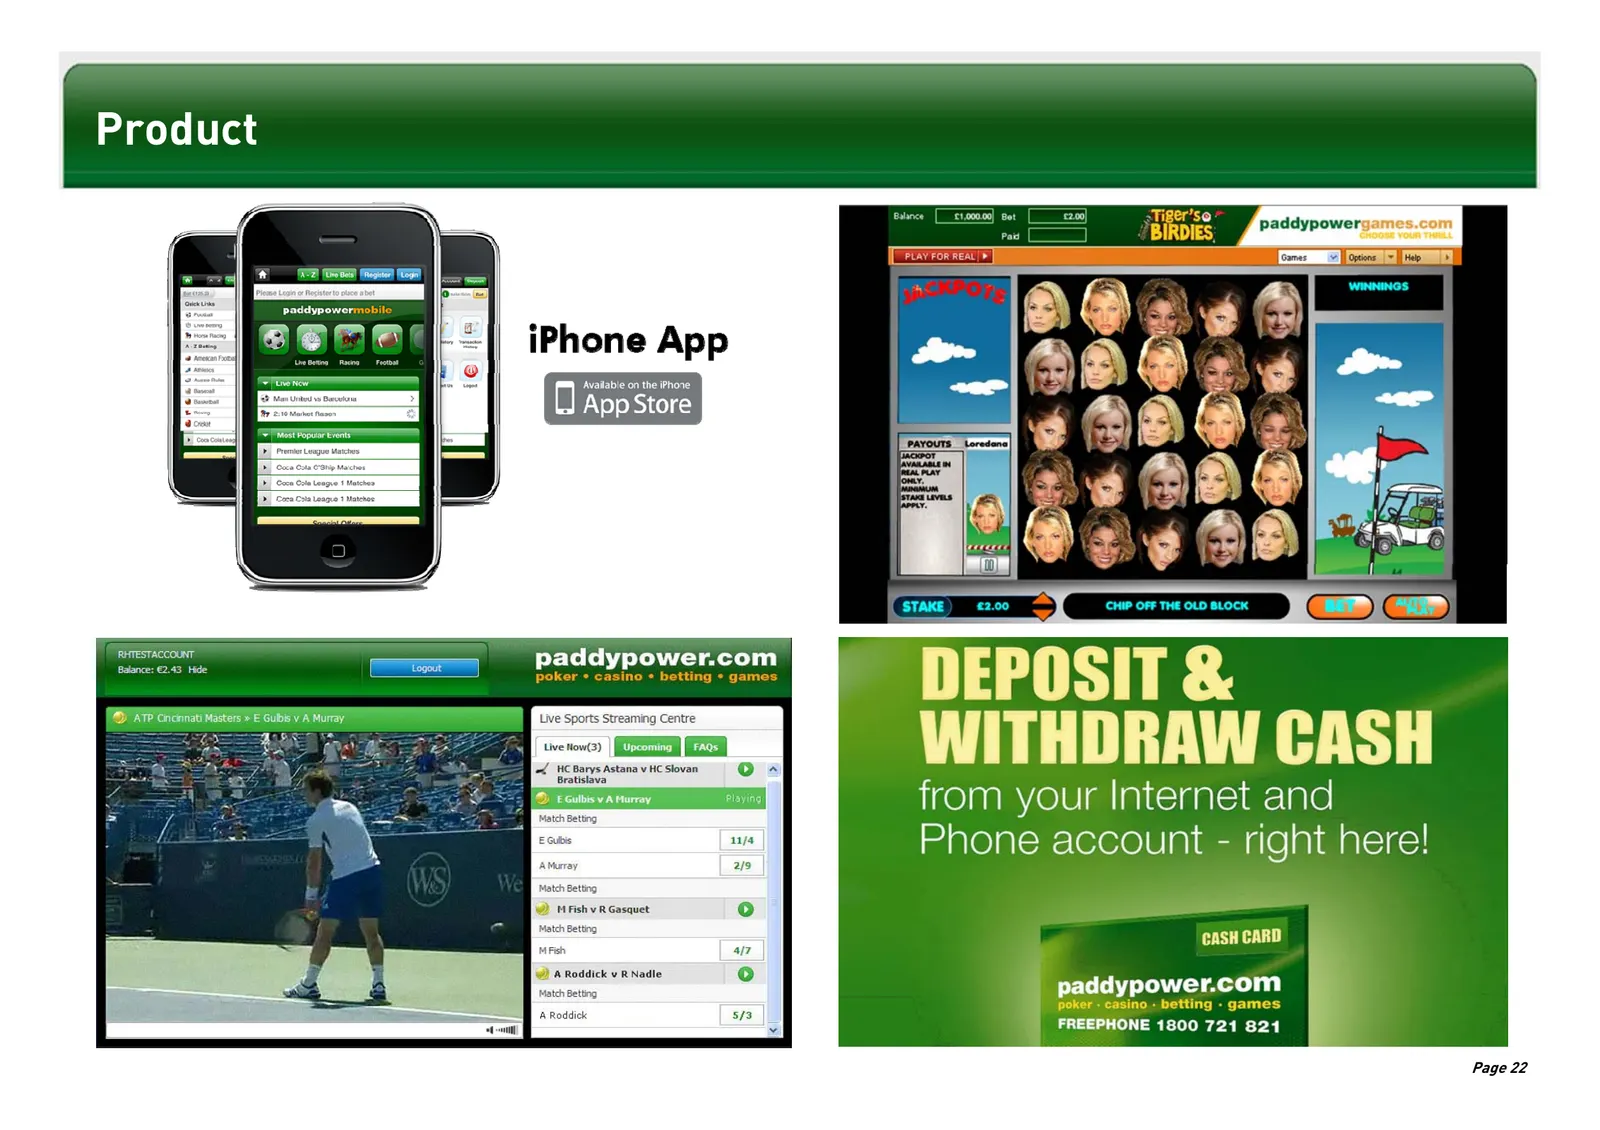
Slide 23: Product
Product Tiger’se ~ paddypower NT) (Ure wats! [Rogier [Cogn Yasser iPhone App 0 Available on the iPhone App Store sities paddypower.com ____ poker casino « betting * games © ATP Cincinnati Masters » E Gubis v A Murray Live Sports Streaming Centre if HC Barys Astana v HC Slovan Bratislava Dcemevaram n

Slide 24: Value
MONEY-BACK IF DUNGUIB WINS WE'LL REFUND ALL LOSING WIN BETS IF DUNGUIB WINS THE SUPREME NOVICES’* £100 FREE BET WHEN YOU STAKE €50 ON YOUR FIRST BET** FREEPHONE 08000 565 265 paddypower.com poker - casino - betting - games ye Sportsiee If Tiger wins, ge Luma ~ & 5 a) If Tiger Woods wins the US Maste
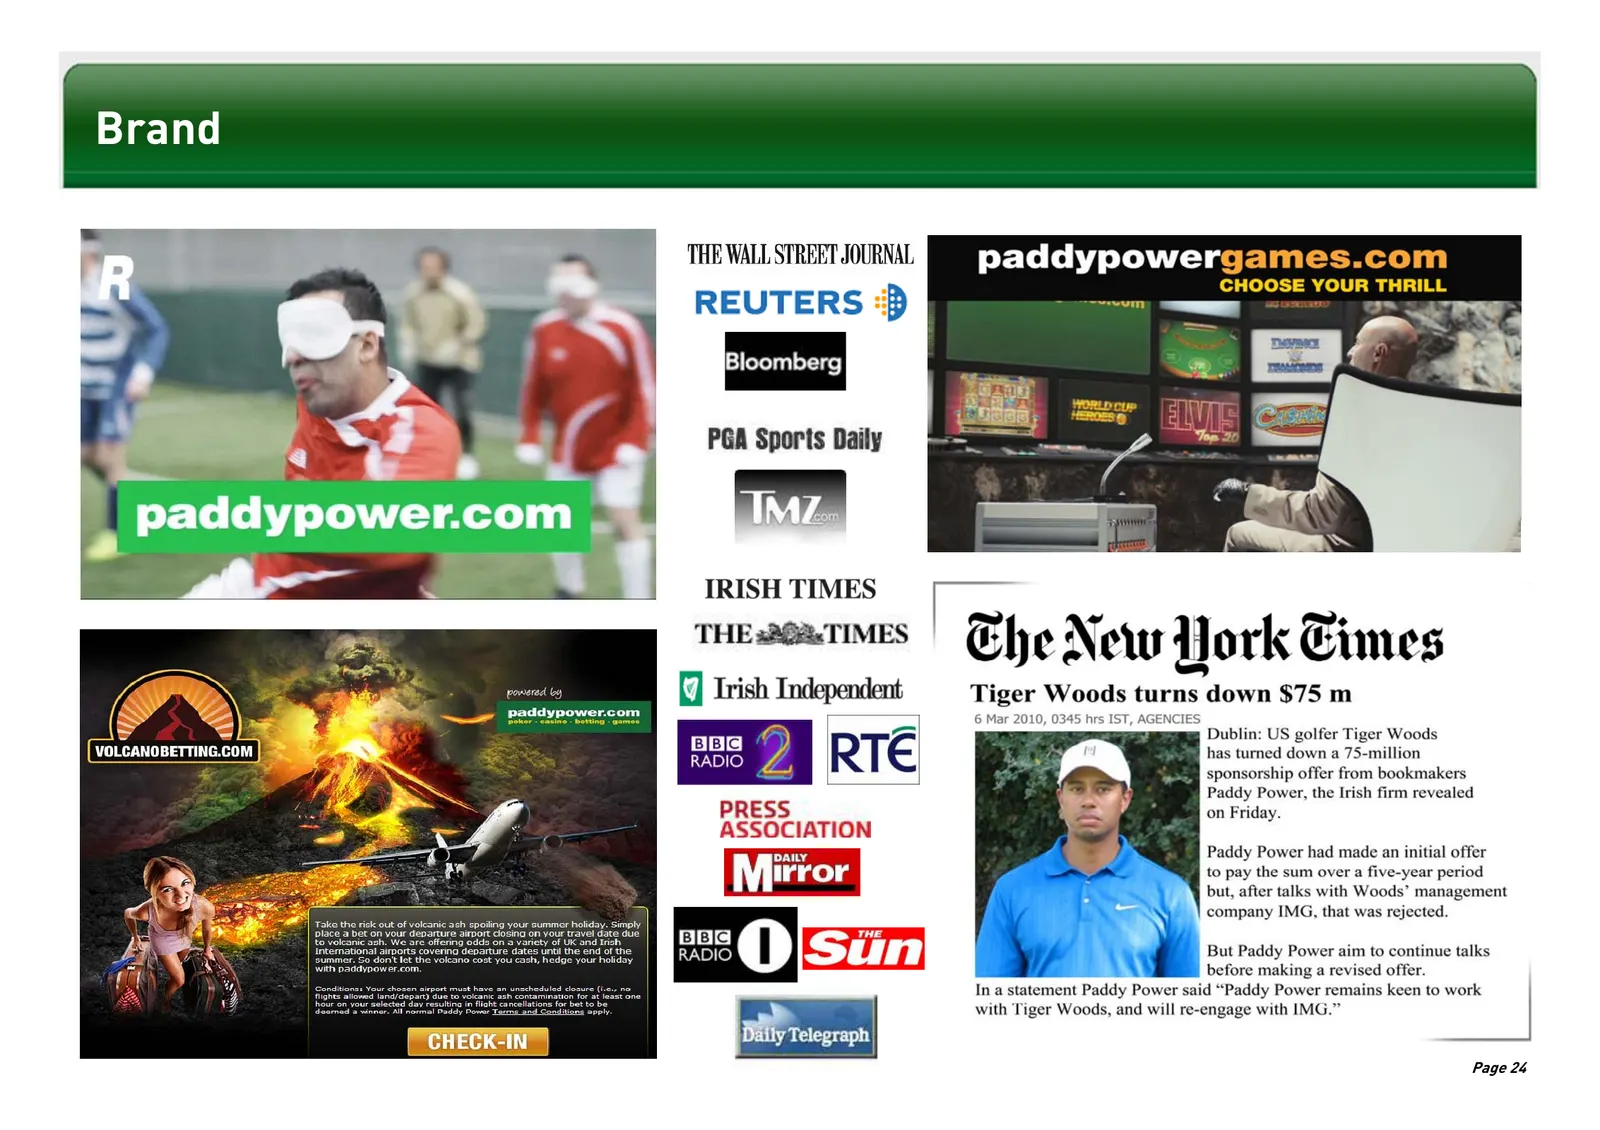
Slide 25: Brand
= a ie il Y ~ THE WALL STREET JOURNAL paddypowergames.com CHOOSE YOUR THRILL REUTERS :B —— . mil \ Bloomberg PGA Sports Daily IRISH TIMES «| Phan ome Tuewenrimes " Ehe New dork Cimes Ge ee , a {] Irish Independent Tiger Woods turns down $75 m “ poker ts 7 6 Mar 2010, 0345 hrs IST, AGENCIES te a = VO
Slide 26: Brand Benefit: Top UK Brand Awareness
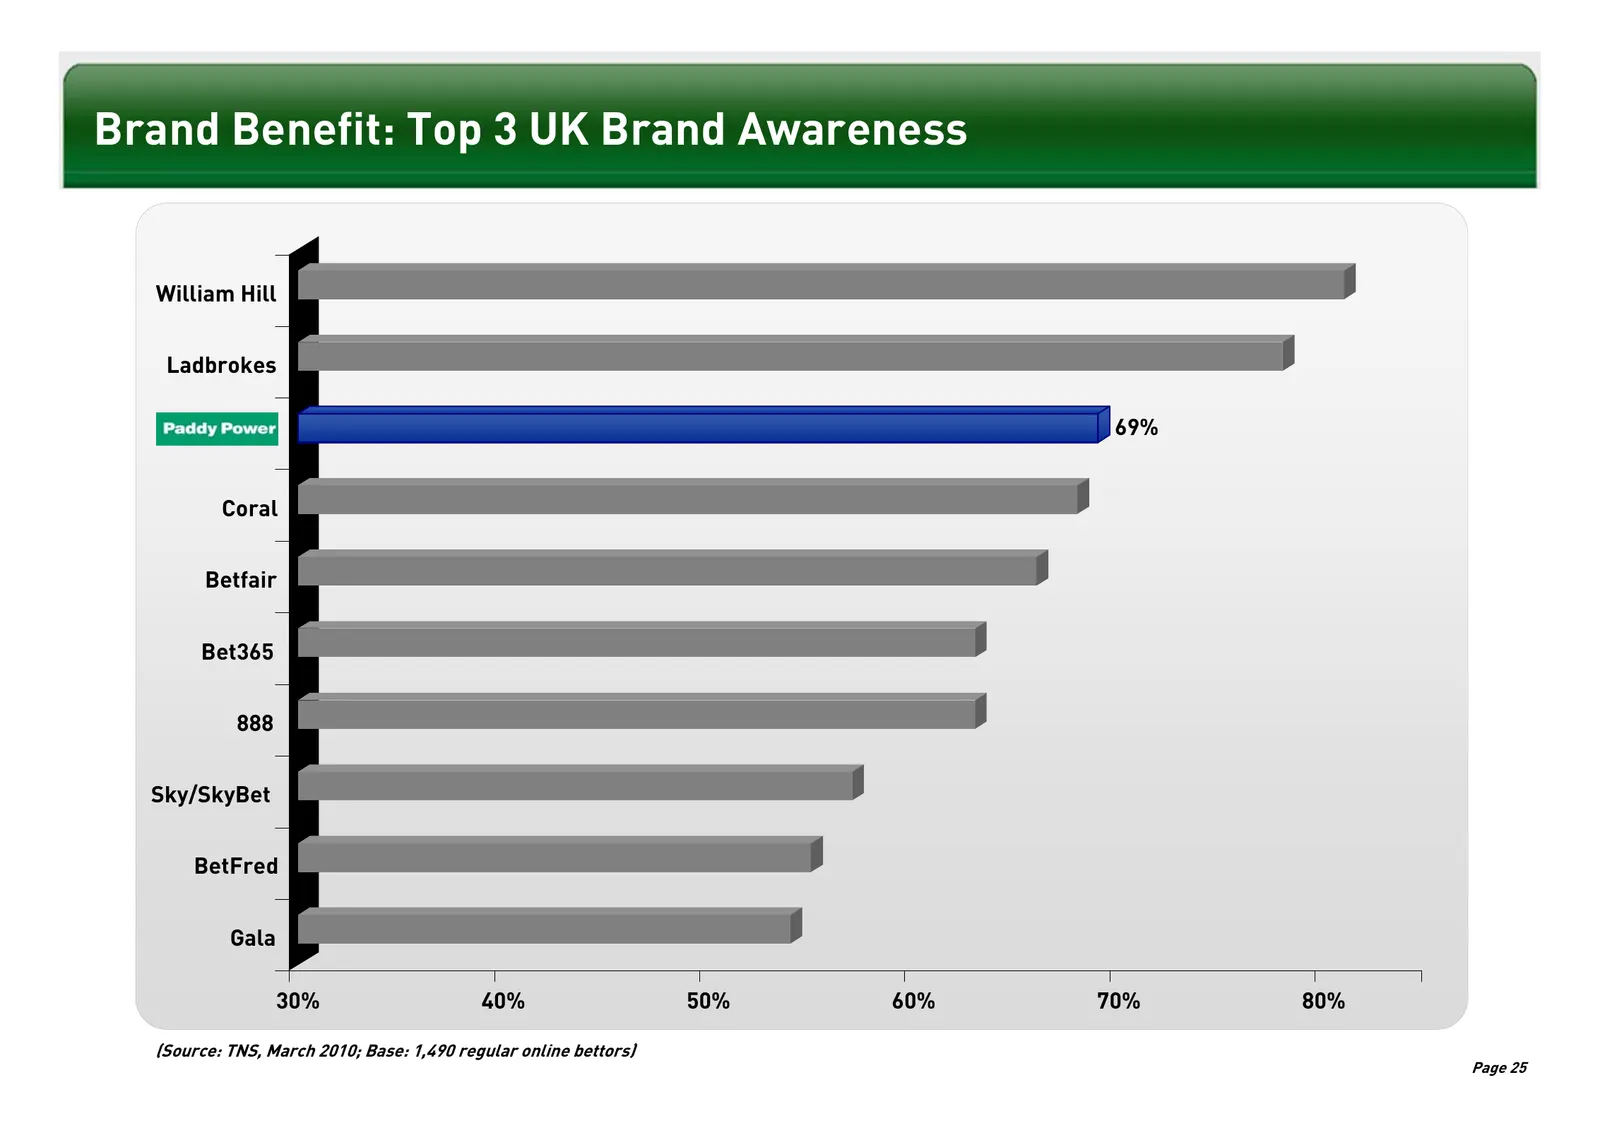
Brand Benefit: Top 3 UK Brand Awareness William Hill Ladbrokes 69% Coral Betfair Bet365 888 Sky/SkyBet BetFred Gala 30% 40% 50% 60% 70% 80% (Source: TNS, March 2010; Base: 1,490 regular online bettors) Page 25
Slide 27: Increased International and Online Exposure
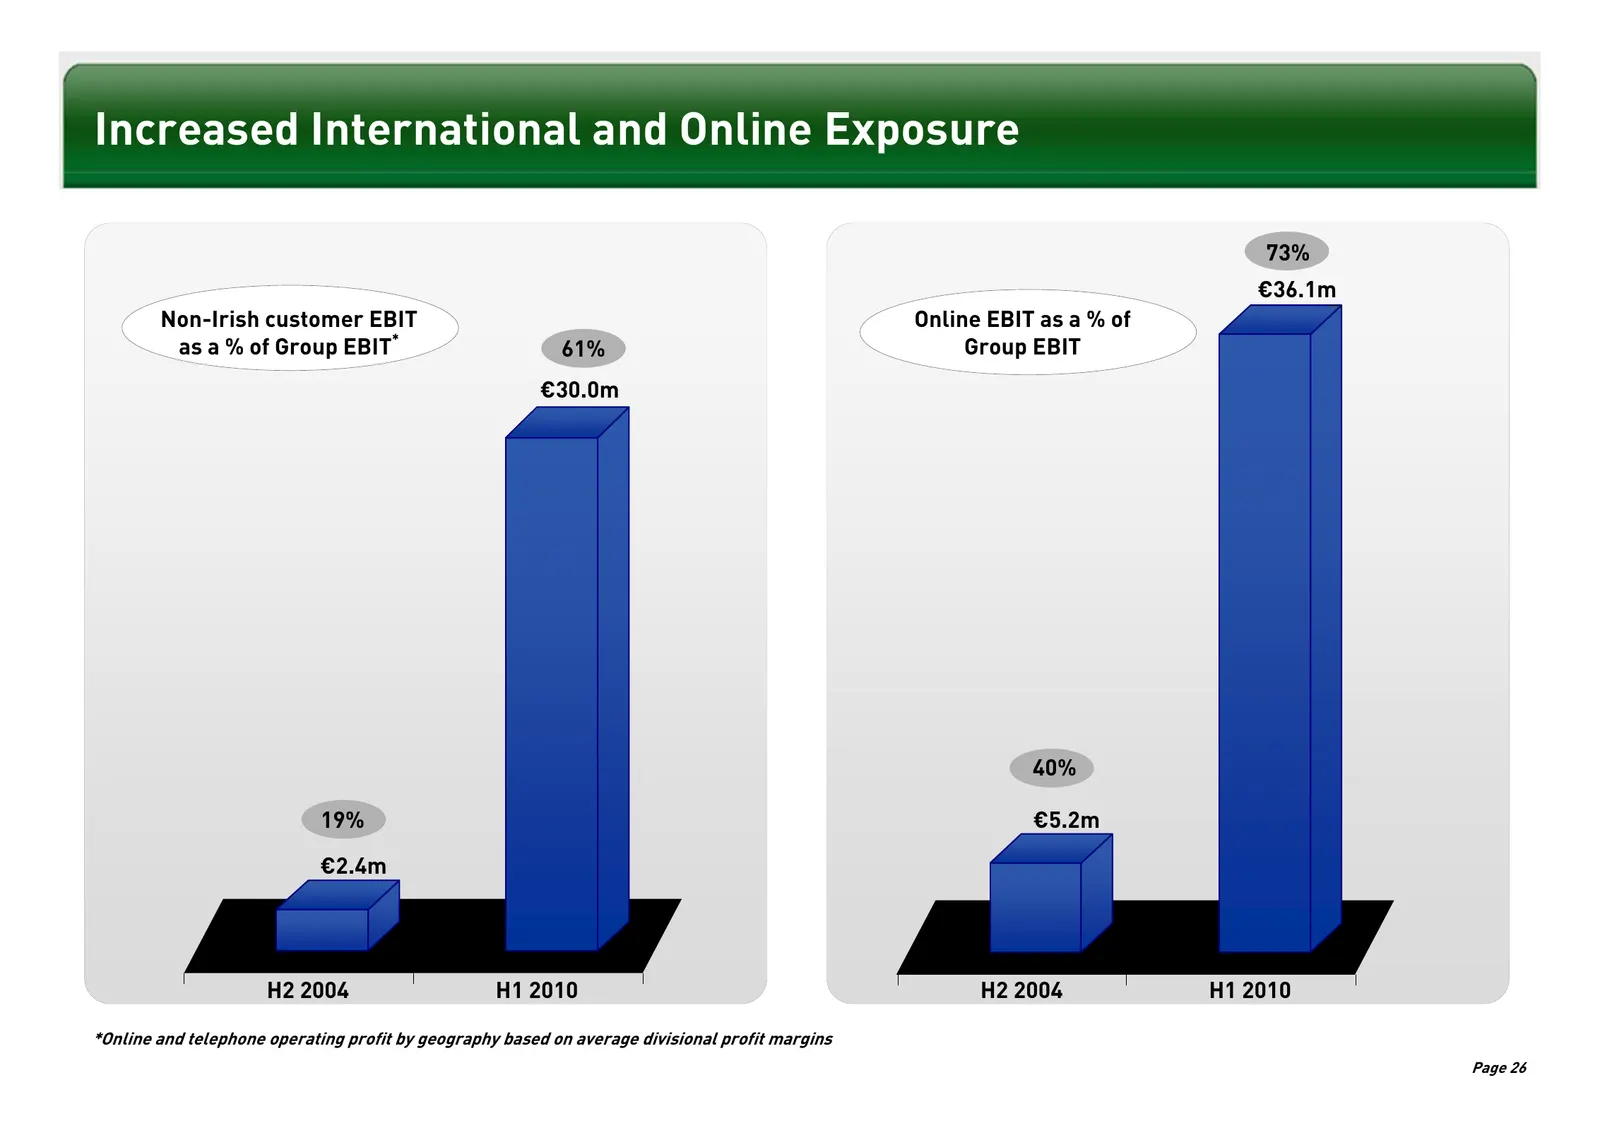
Increased International and Online Exposure 73% €36.1m Non-Irish customer EBIT Online EBIT as a % of as a % of Group EBIT* 61% Group EBIT €30.0m 40% 19% €5.2m €2.4m H2 2004 H1 2010 H2 2004 H1 2010 *Online and telephone operating profit by geography based on average divisional profit margins Page 26
Slide 28: Very Strong H1 Momentum
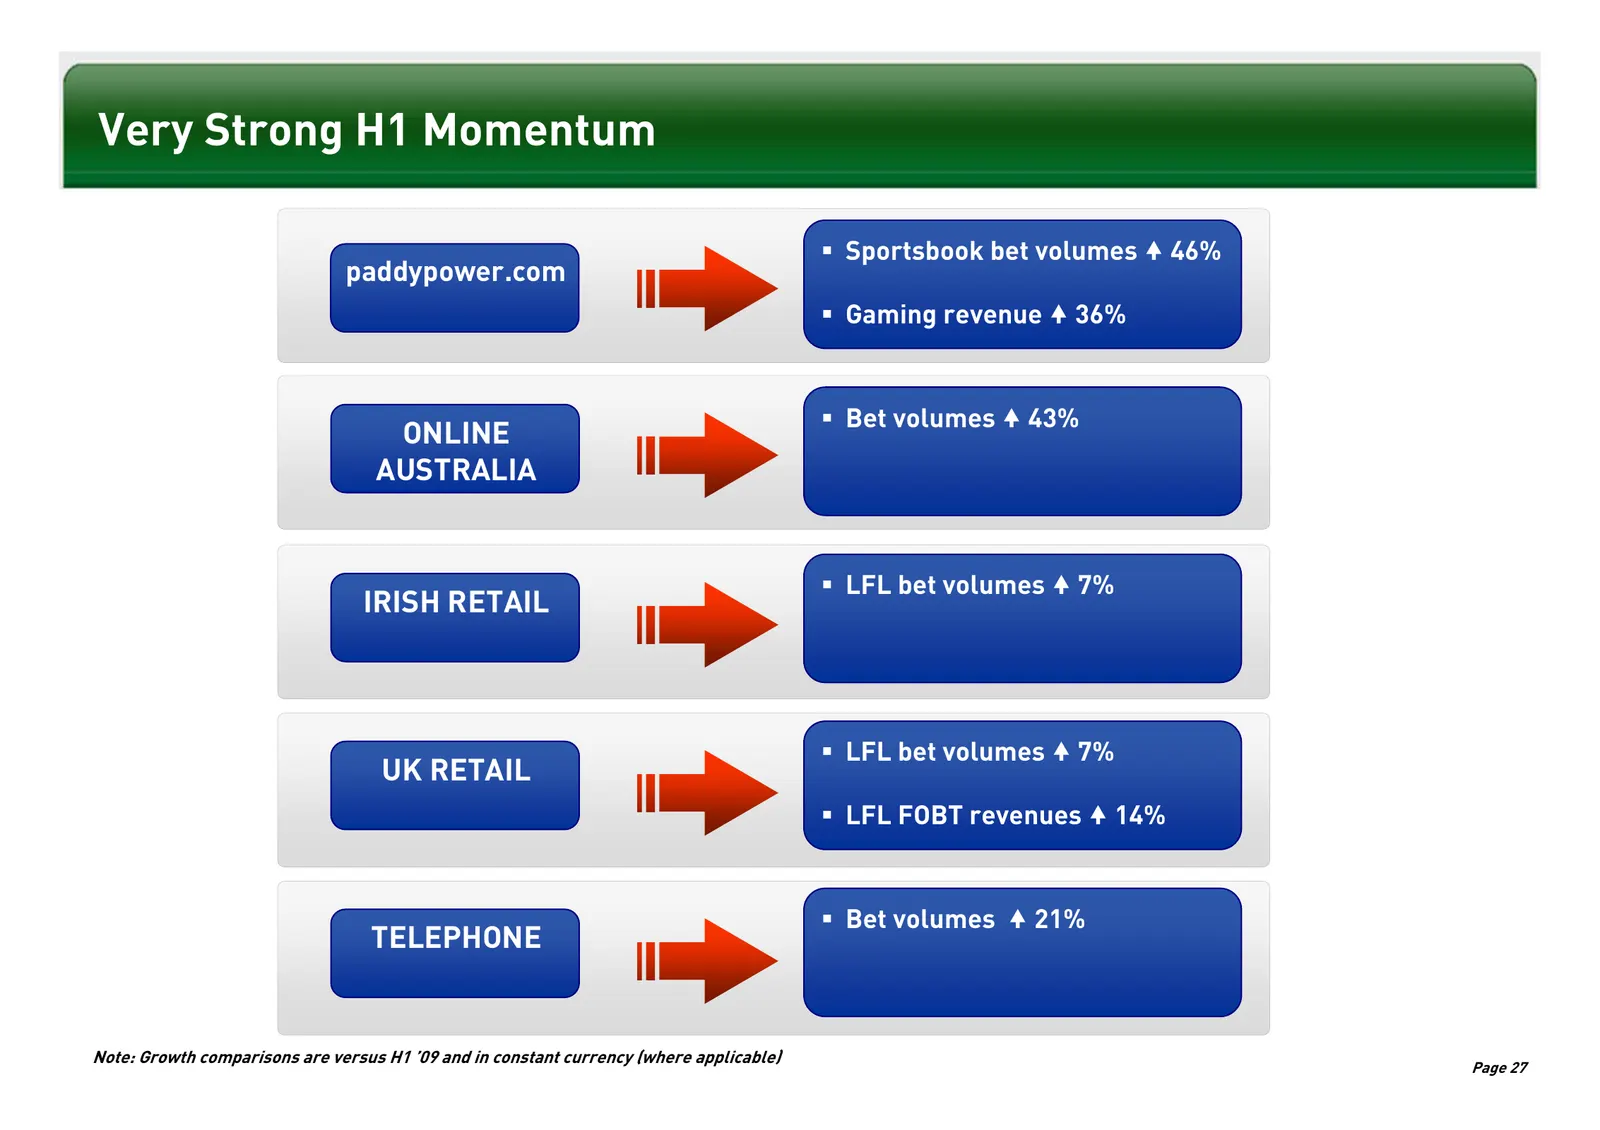
Very Strong H1 Momentum Sportsbook bet volumes y 46% paddypower.com Gaming revenue y 36% Bet volumes y 43% ONLINE AUSTRALIA LFL bet volumes y 7% IRISH RETAIL LFL bet volumes y 7% UK RETAIL LFL FOBT revenues y 14% Bet volumes y 21% TELEPHONE Note: Growth comparisons are versus H1 ’09 an
Slide 29: Opportunities & Outlook
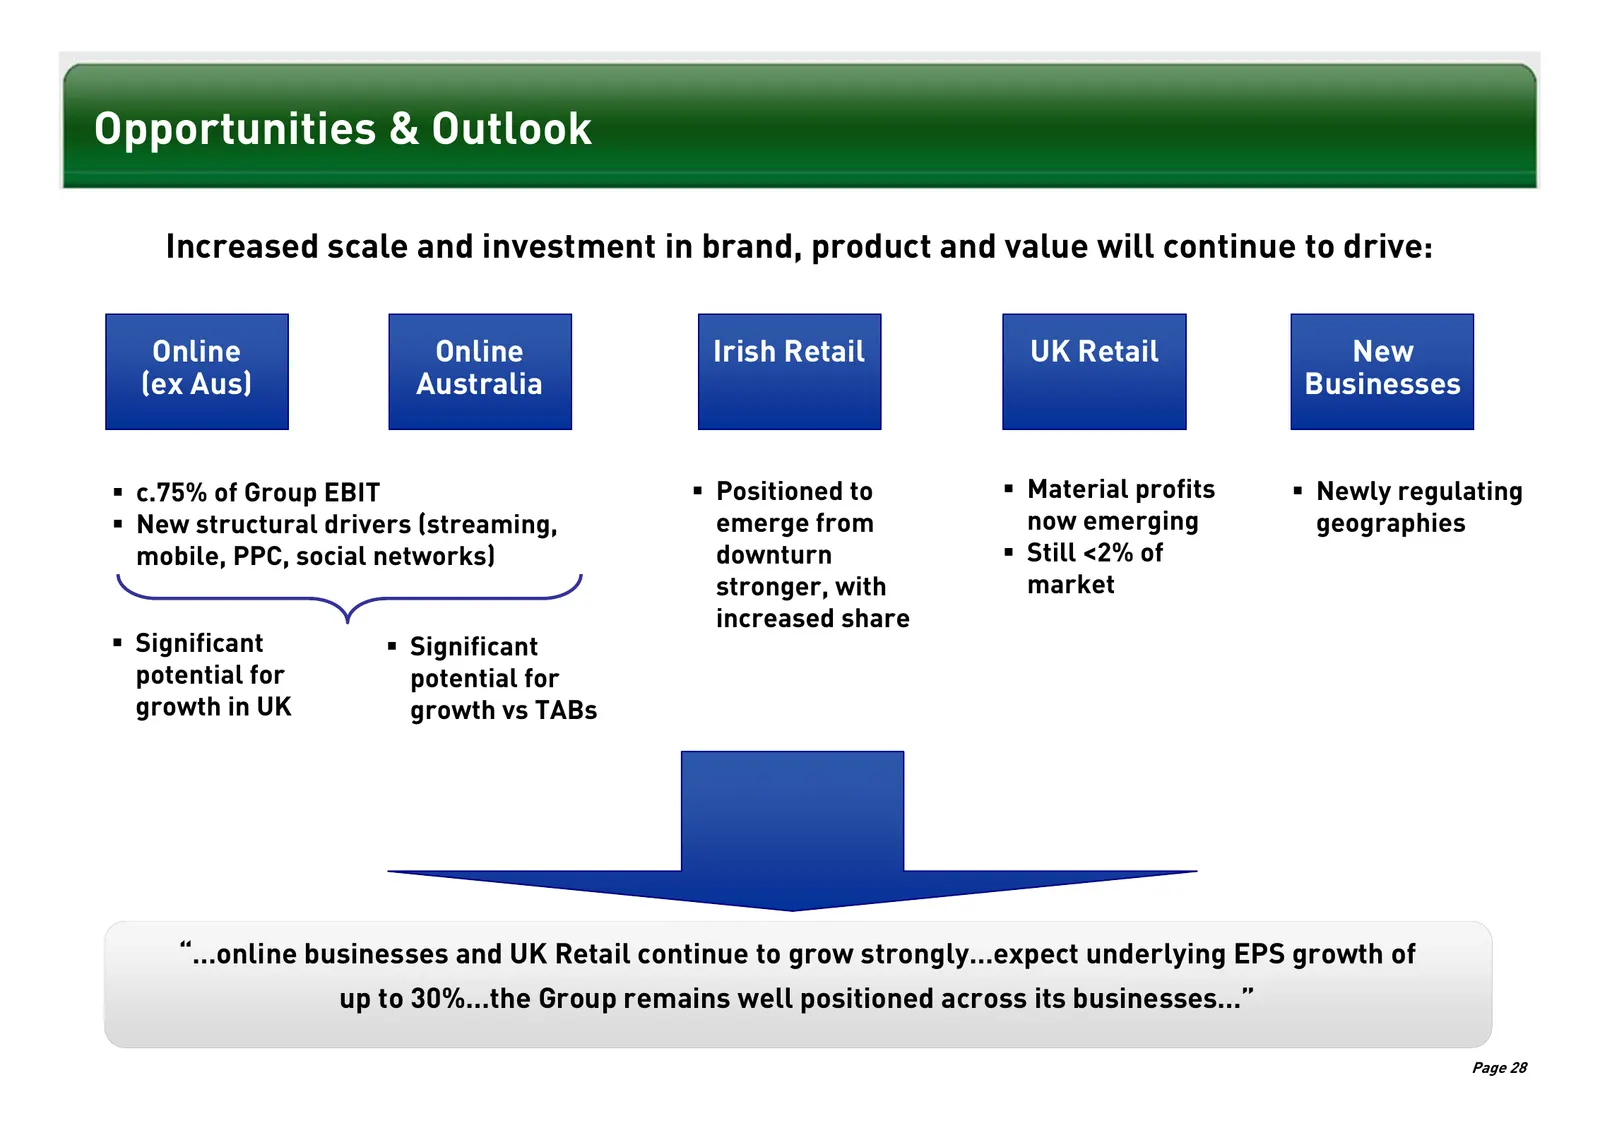
Opportunities & Outlook Increased scale and investment in brand, product and value will continue to drive: Online Online Irish Retail UK Retail New (ex Aus) Australia Businesses c.75% of Group EBIT Positioned to Material profits Newly regulating New structural drivers (streaming, emerge fr
Source: Internet Archive copy of flutter.com
More decks from Flutter Entertainment plc
 Q3 2026 Earnings Presentation15 slides · Nov 4, 2026
 Q2 2026 Earnings Presentation14 slides · Aug 5, 2026
 Investor Day (September 2024)152 slides · Sep 25, 2024
 Q2 2024 Earnings Presentation20 slides · Aug 13, 2024
 Q1 2024 Earnings Presentation20 slides · May 14, 2024
 FY2023 Earnings Presentation36 slides · Mar 26, 2024