NHPC Limited · NSE:NHPC
NHPC — H1 FY2012-13 Earnings Presentation
31 slides from NHPC's earnings presentation, Nov 5, 2012
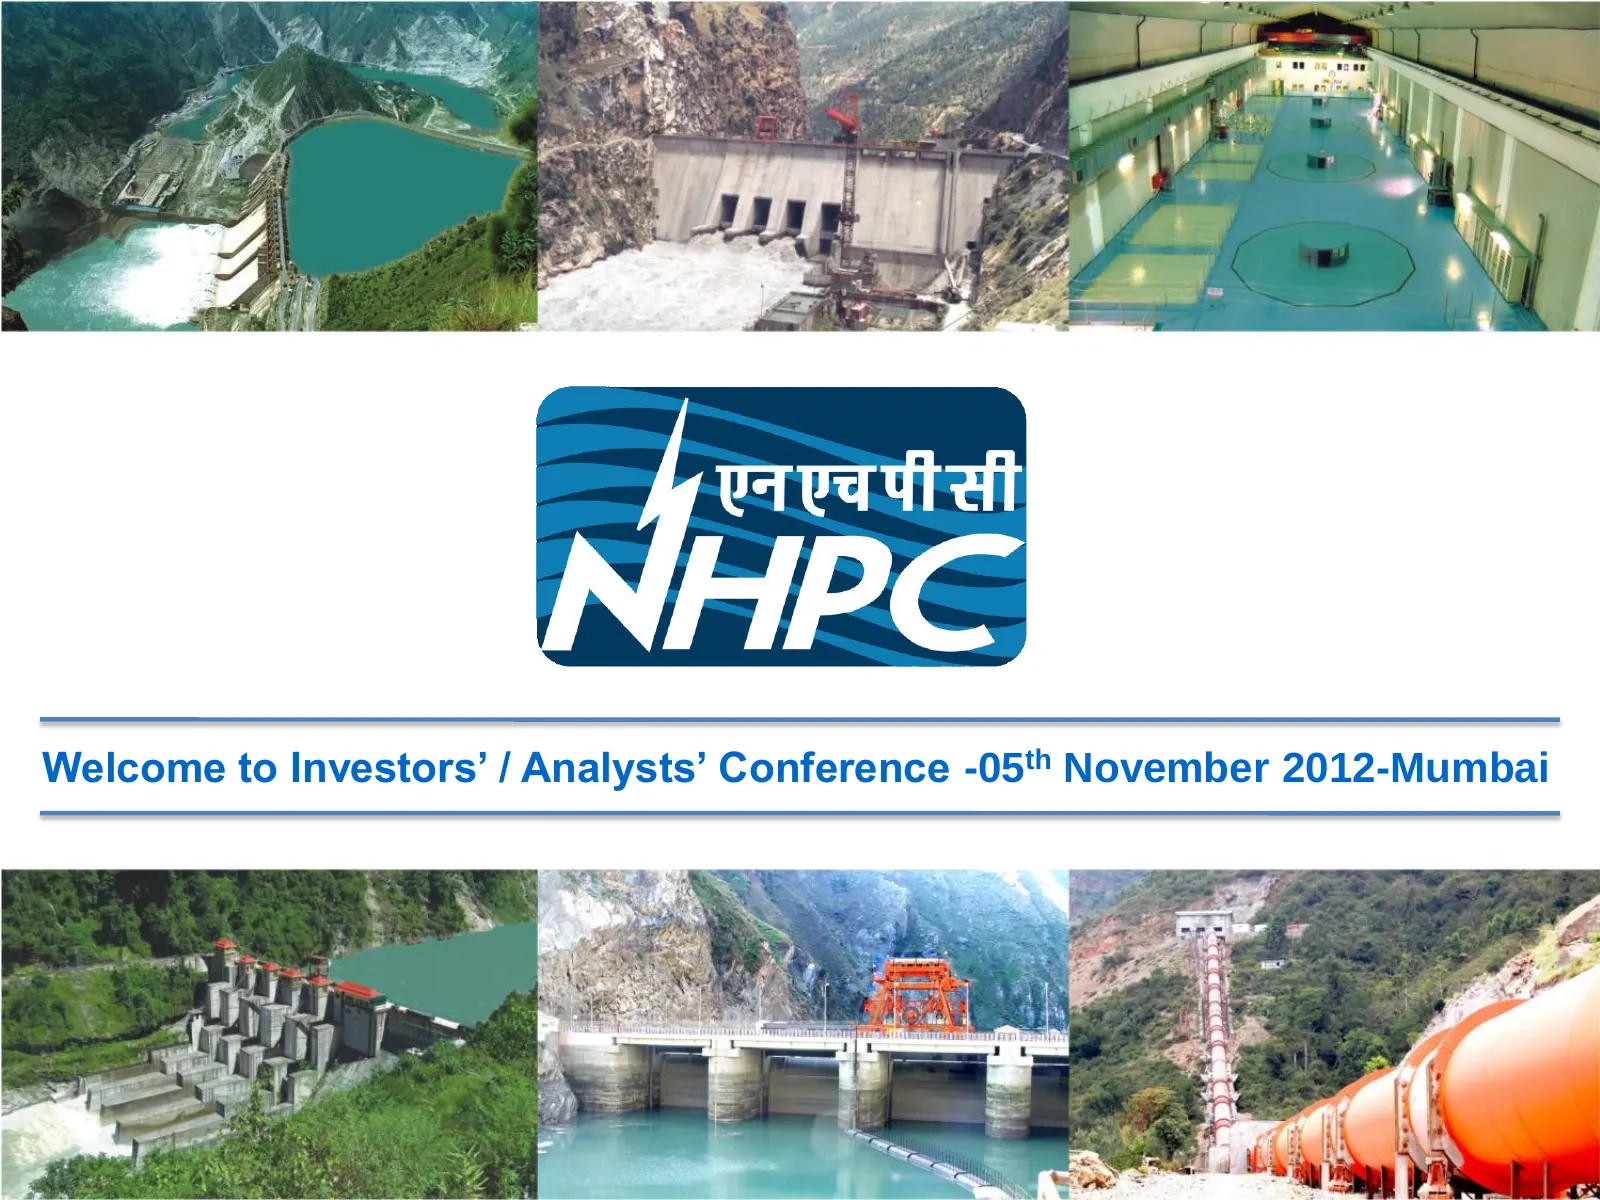
Slide 1: Welcome to Investors' / Analysts' Conference, 5 November 2012, Mumbai
Welcome to Investors’ / Analysts’ Conference -05th November 2012-Mumbai 1
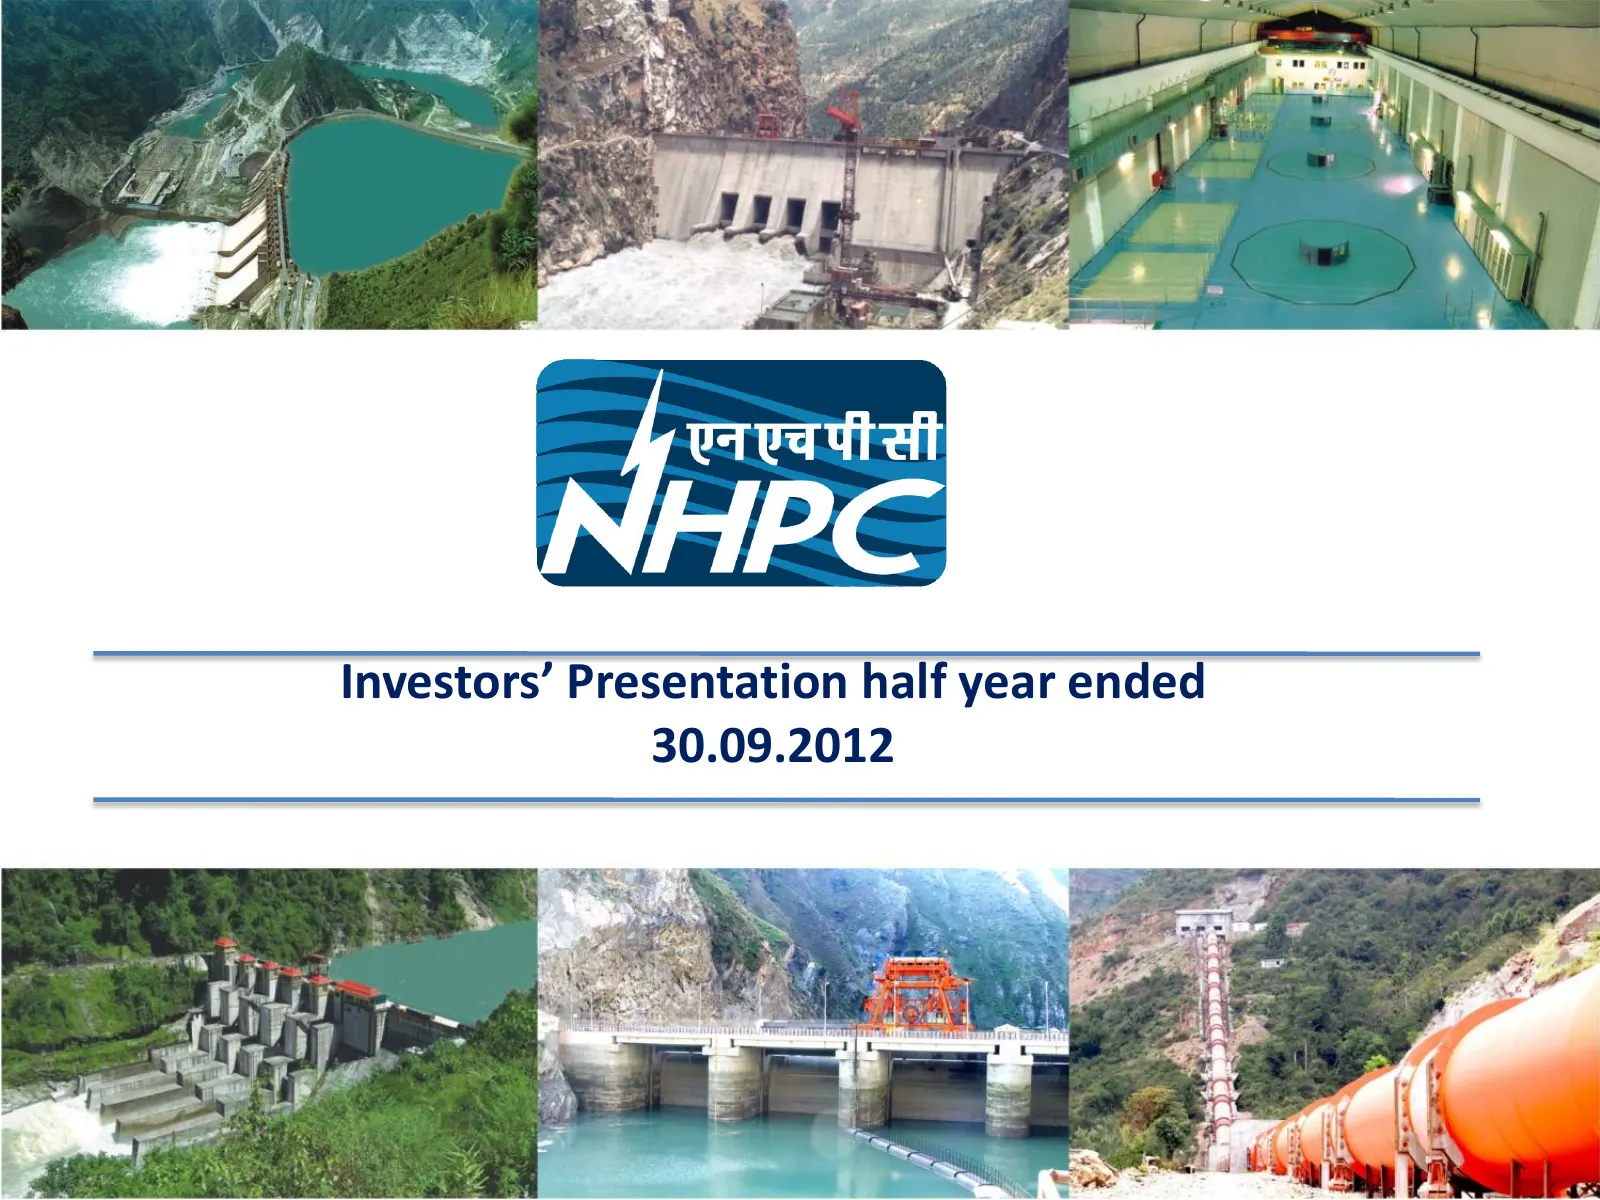
Slide 2: Investors' Presentation half year ended 30.09.2012
Investors’ Presentation half year ended 30.09.2012 2
Slide 3: Agenda
Agenda Hydro Scenario in India NHPC Overview Significant Expansion Plan Performance Highlights 3 3
Slide 4: Hydro Scenario in India
Hydro Scenario in India 4
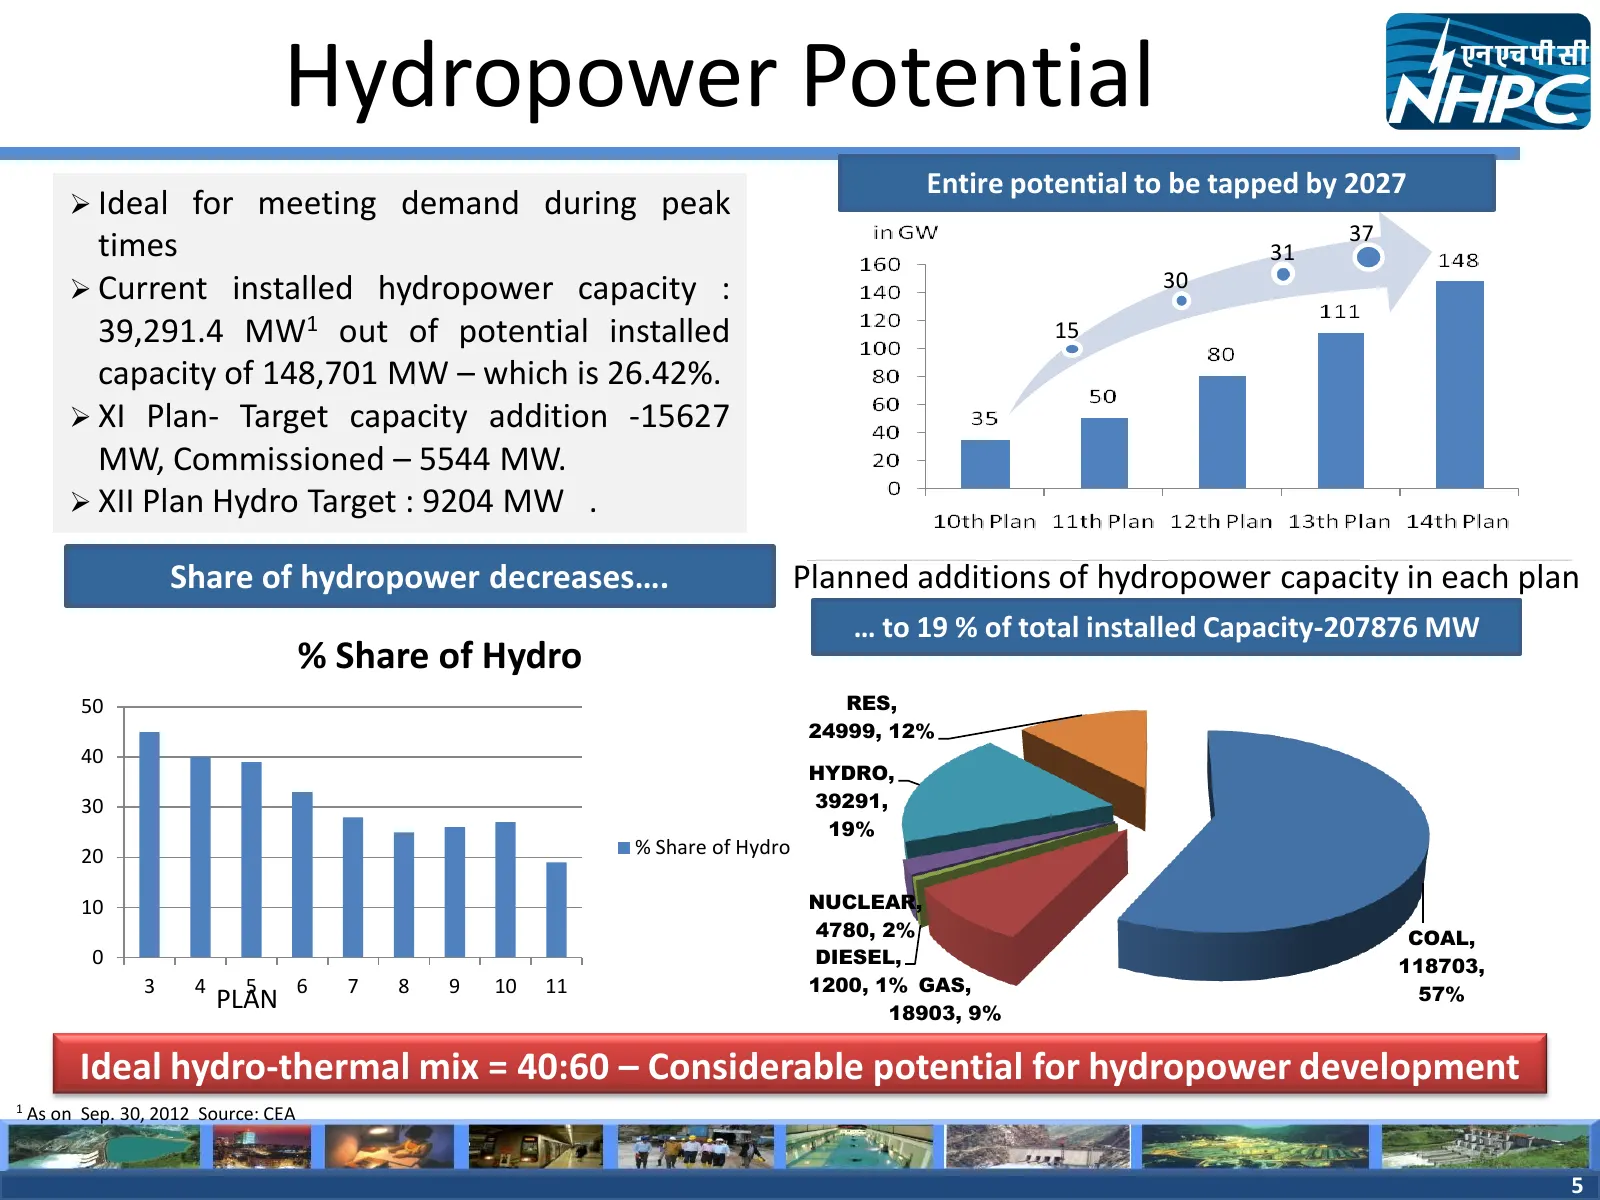
Slide 5: Hydropower Potential
Hydropower Potential Entire potential to be tapped by 2027 Ideal for meeting demand during peak 37 times 31 Current installed hydropower capacity : 30 39,291.4 MW1 out of potential installed 15 capacity of 148,701 MW – which is 26.42%. XI Plan- Target capacity addition -15627 MW, Commissioned
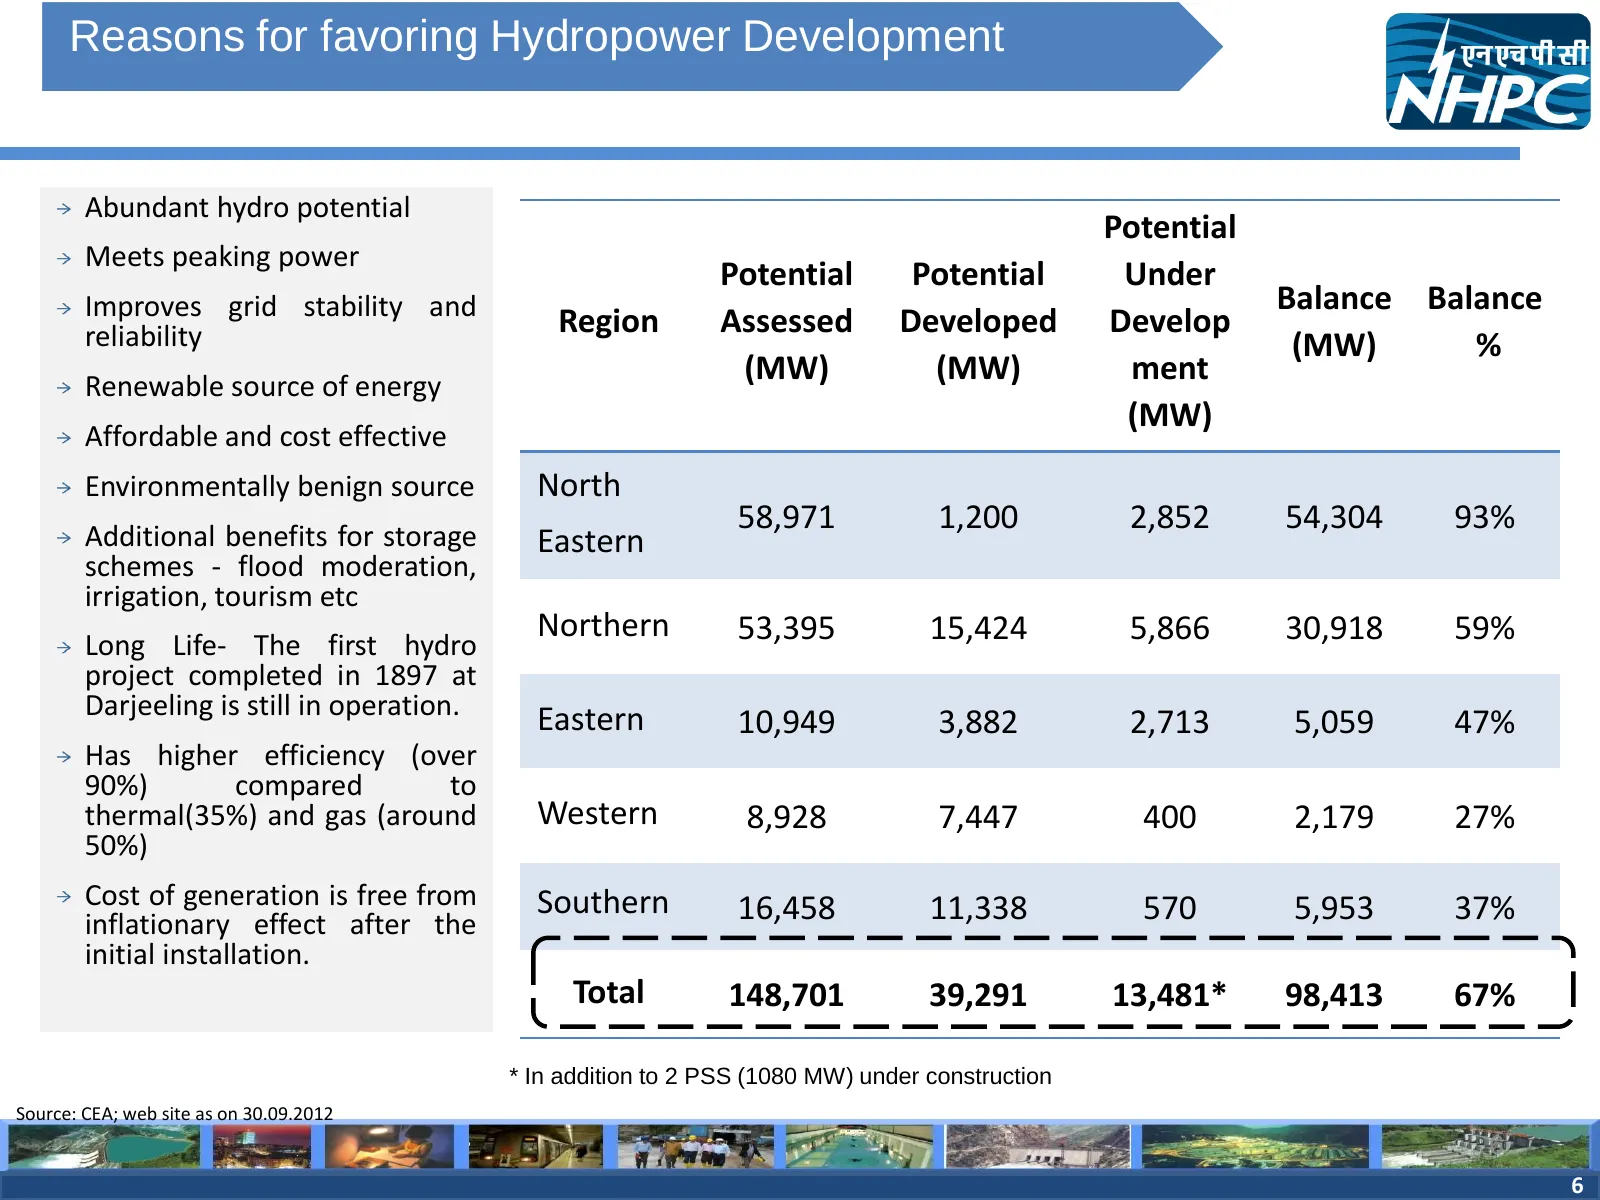
Slide 6: Reasons for favoring Hydropower Development
Reasons for favoring Hydropower Development Abundant hydro potential Potential Meets peaking power Potential Potential Under Improves grid stability and Balance Balance reliability Region Assessed Developed Develop (MW) % Renewable source of energy (MW) (MW) ment (MW) Affordable and cost effective E
Slide 7: NHPC Overview
NHPC Overview 7
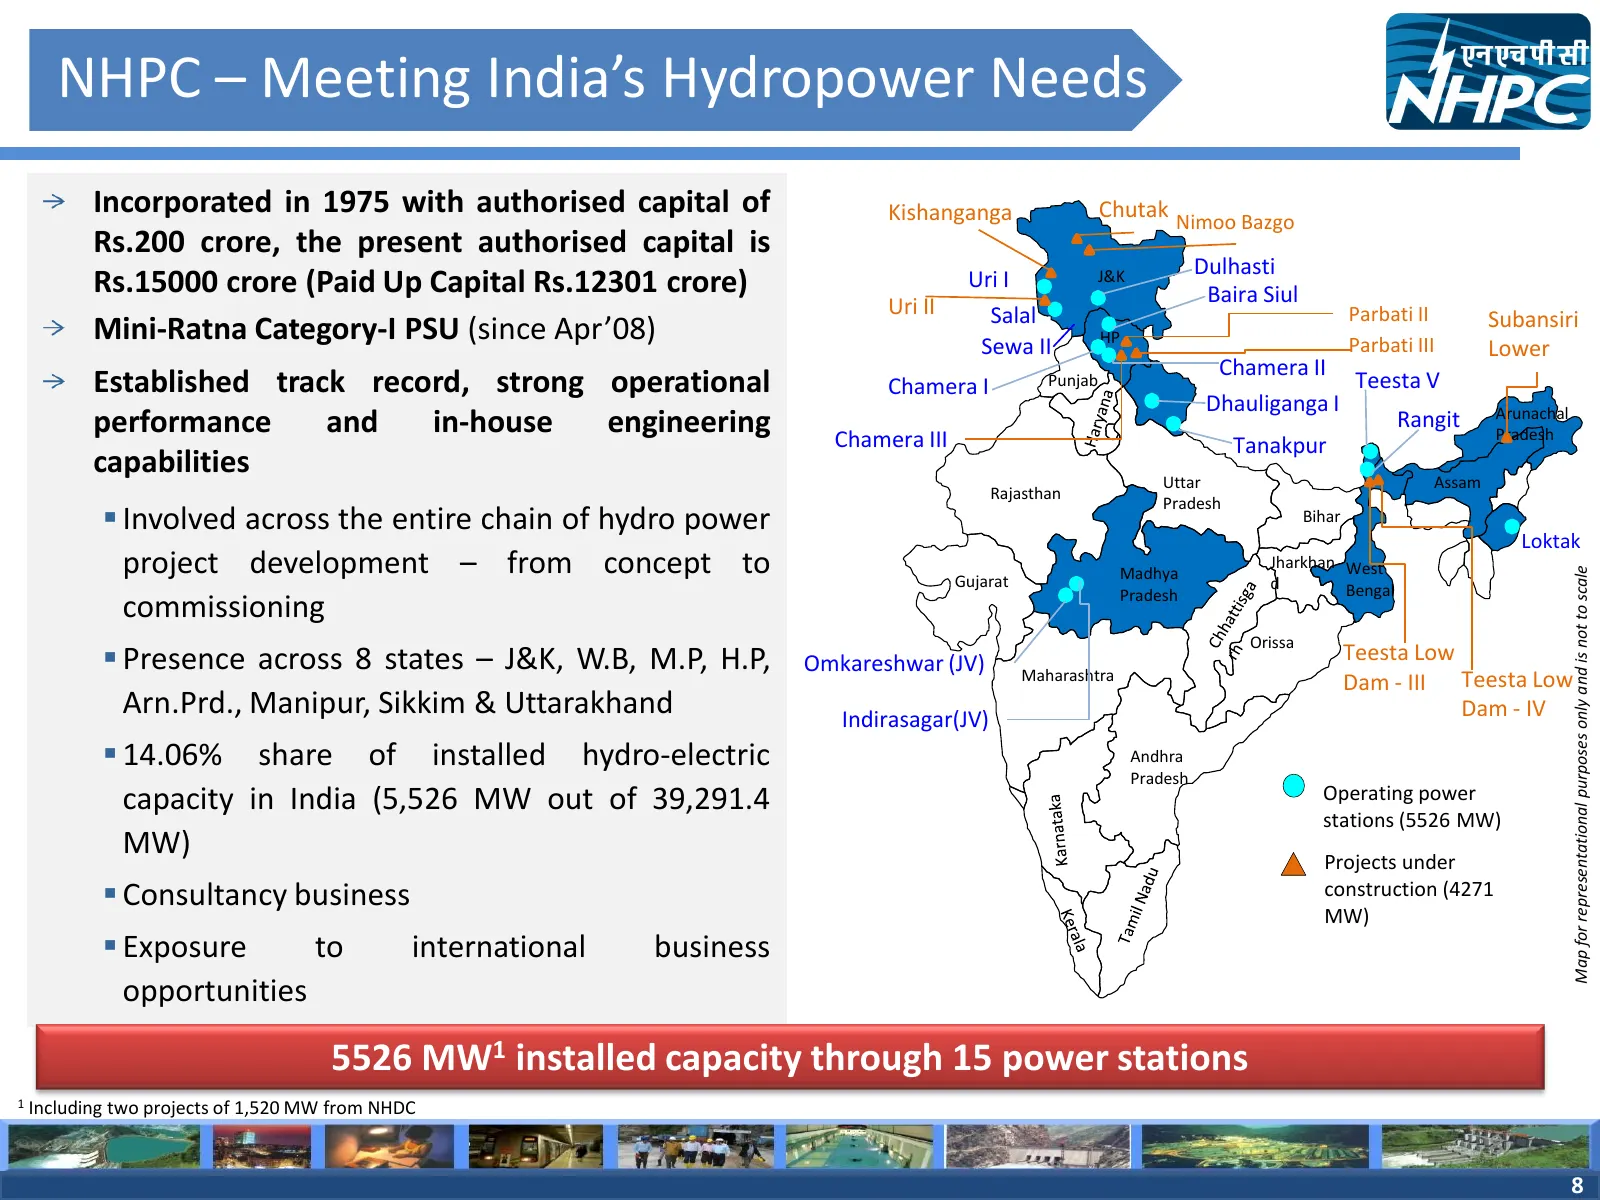
Slide 8: NHPC – Meeting India's Hydropower Needs
NHPC – Meeting India’s Hydropower Needs Incorporated in 1975 with authorised capital of Kishanganga Chutak Nimoo Bazgo Rs.200 crore, the present authorised capital is Dulhasti Rs.15000 crore (Paid Up Capital Rs.12301 crore) Uri I J&K Baira Siul Uri II Salal Parbati II Mini-Ratna Category-I PSU (sinc
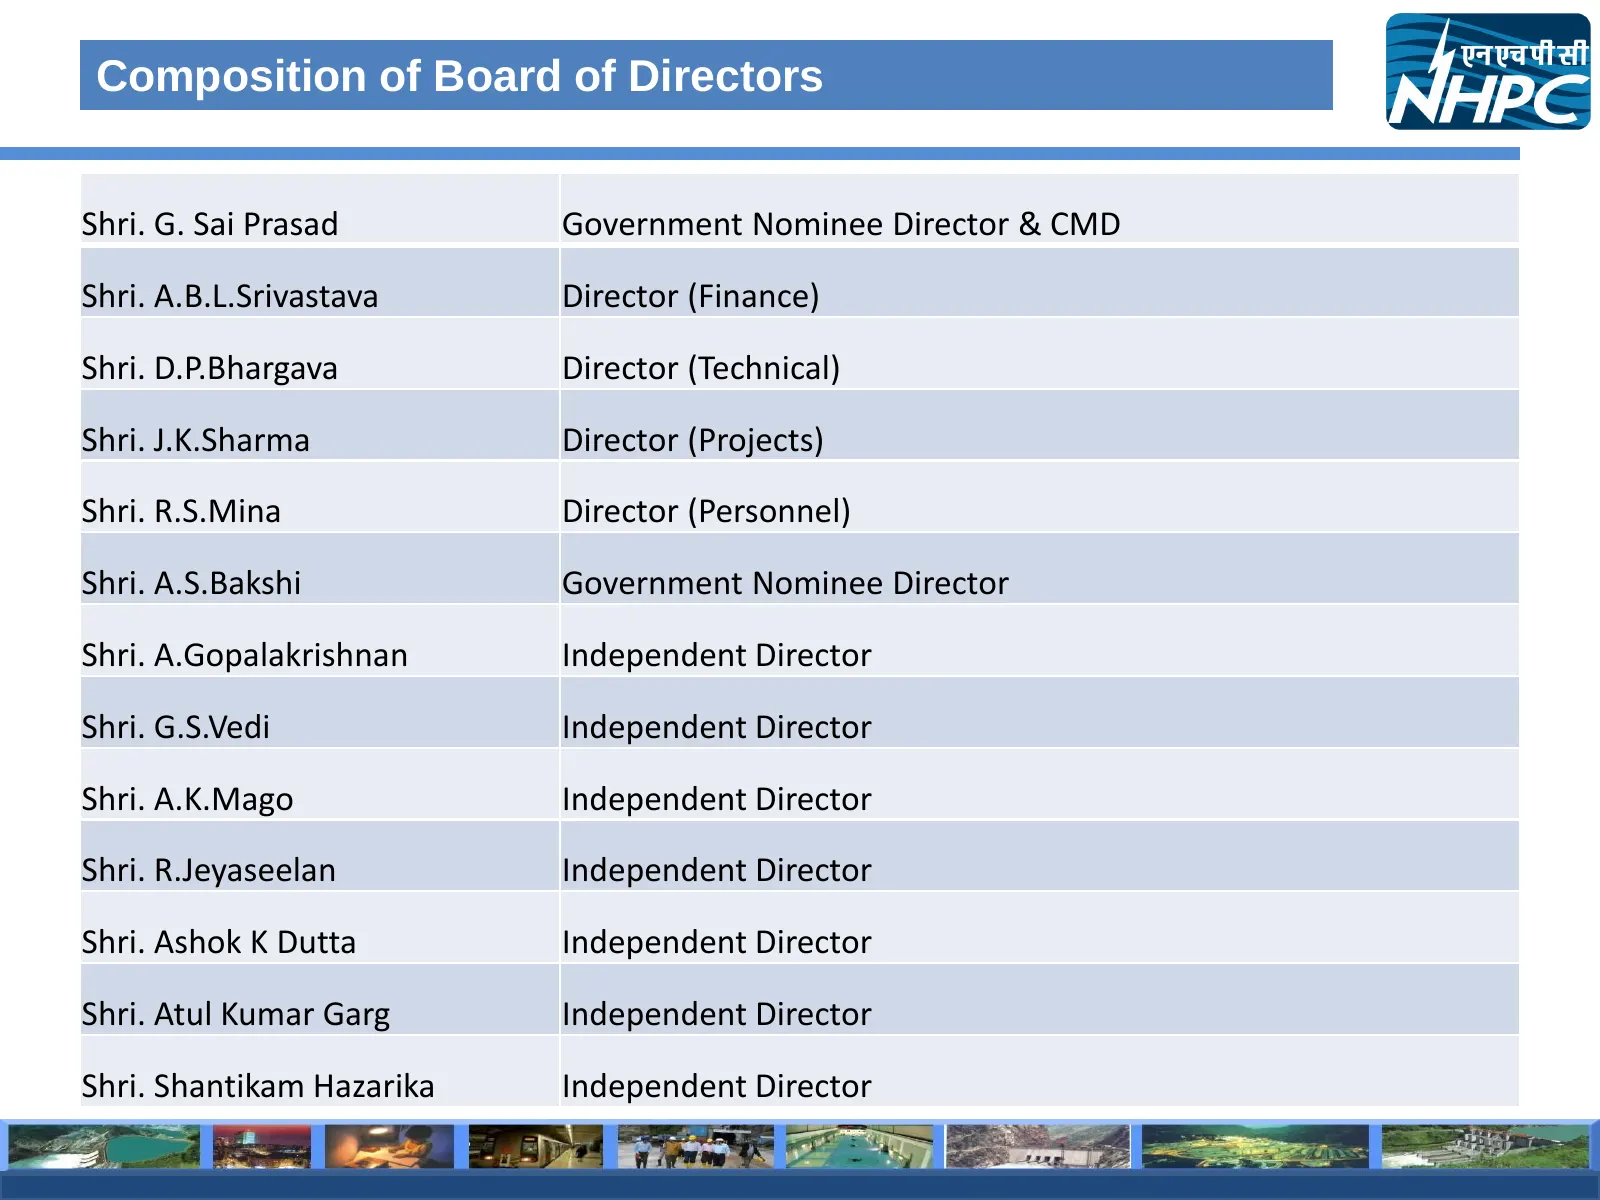
Slide 9: Composition of Board of Directors
Composition of Board of Directors Shri. G. Sai Prasad Government Nominee Director & CMD Shri. A.B.L.Srivastava Director (Finance) Shri. D.P.Bhargava Director (Technical) Shri. J.K.Sharma Director (Projects) Shri. R.S.Mina Director (Personnel) Shri. A.S.Bakshi Government Nominee Director Shri. A.Gopa
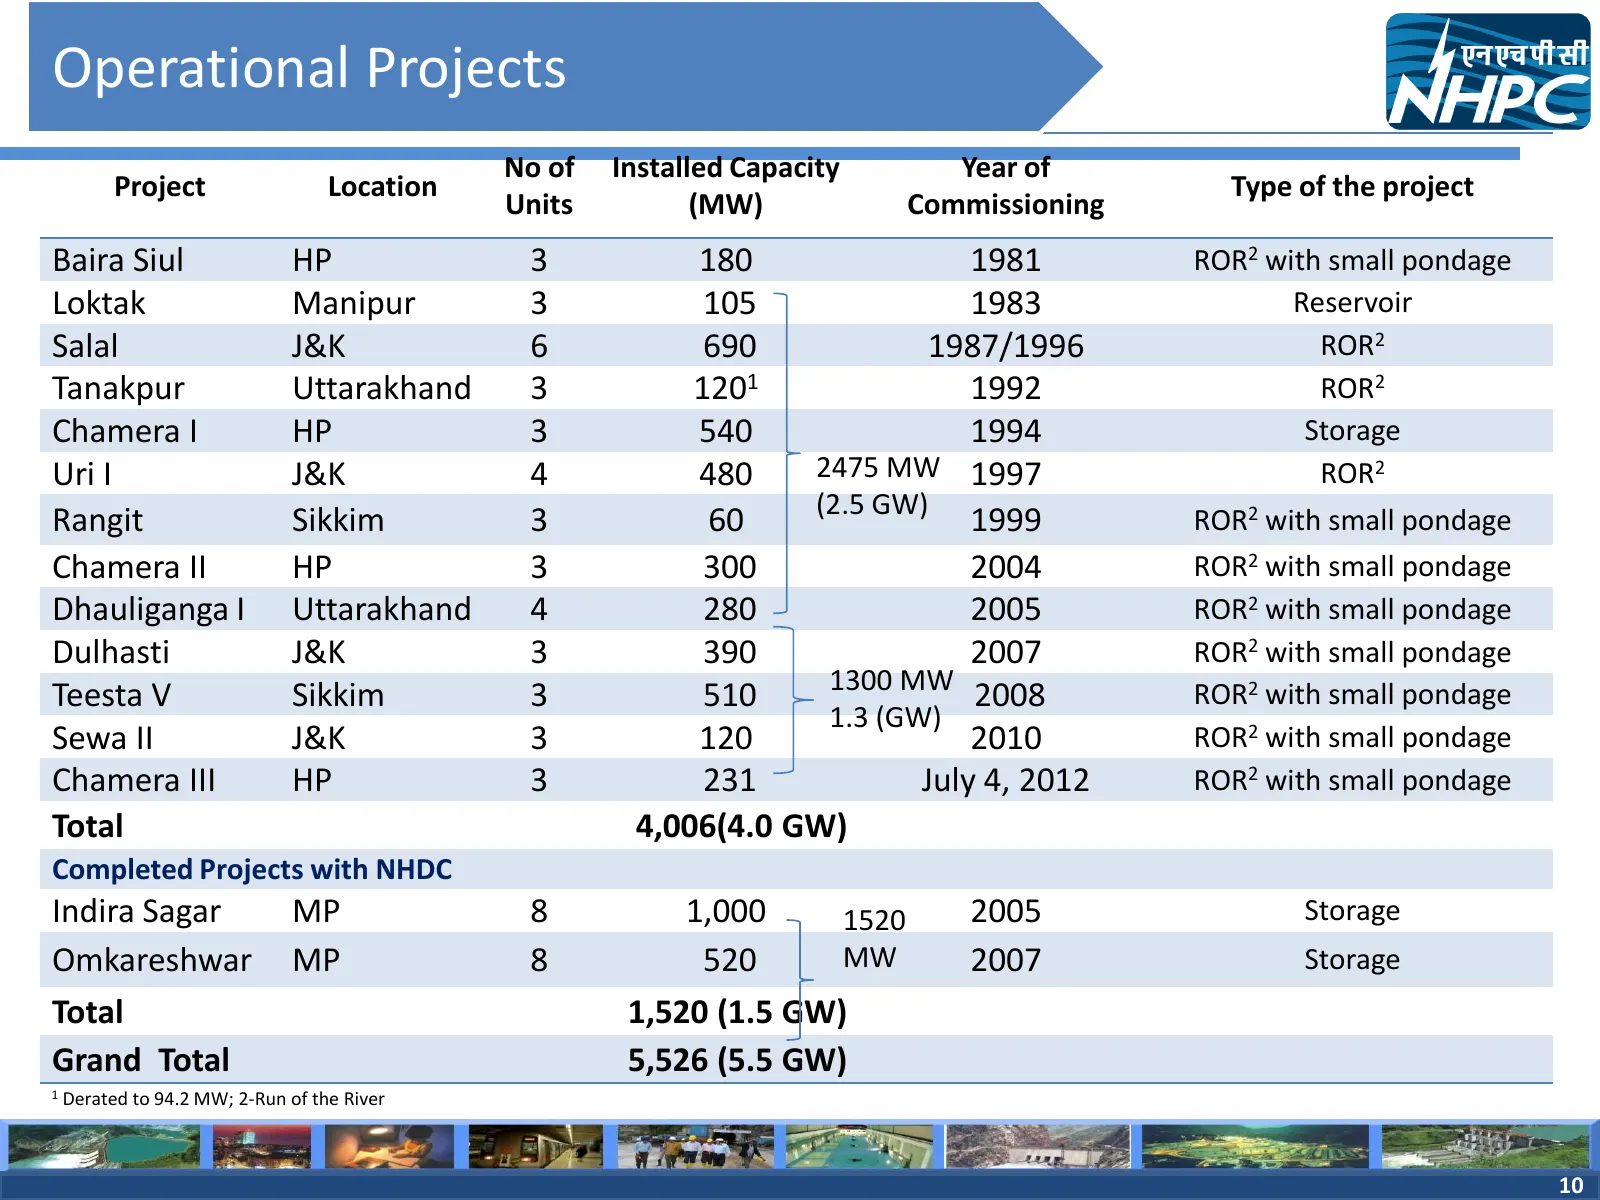
Slide 10: Operational Projects
Operational Projects No of Installed Capacity Year of Project Location Type of the project Units (MW) Commissioning Baira Siul HP 3 180 1981 ROR2 with small pondage Loktak Manipur 3 105 1983 Reservoir Salal J&K 6 690 1987/1996 ROR2 Tanakpur Uttarakhand 3 120 1 1992 ROR2 Chamera I HP 3 540 1994 Stora
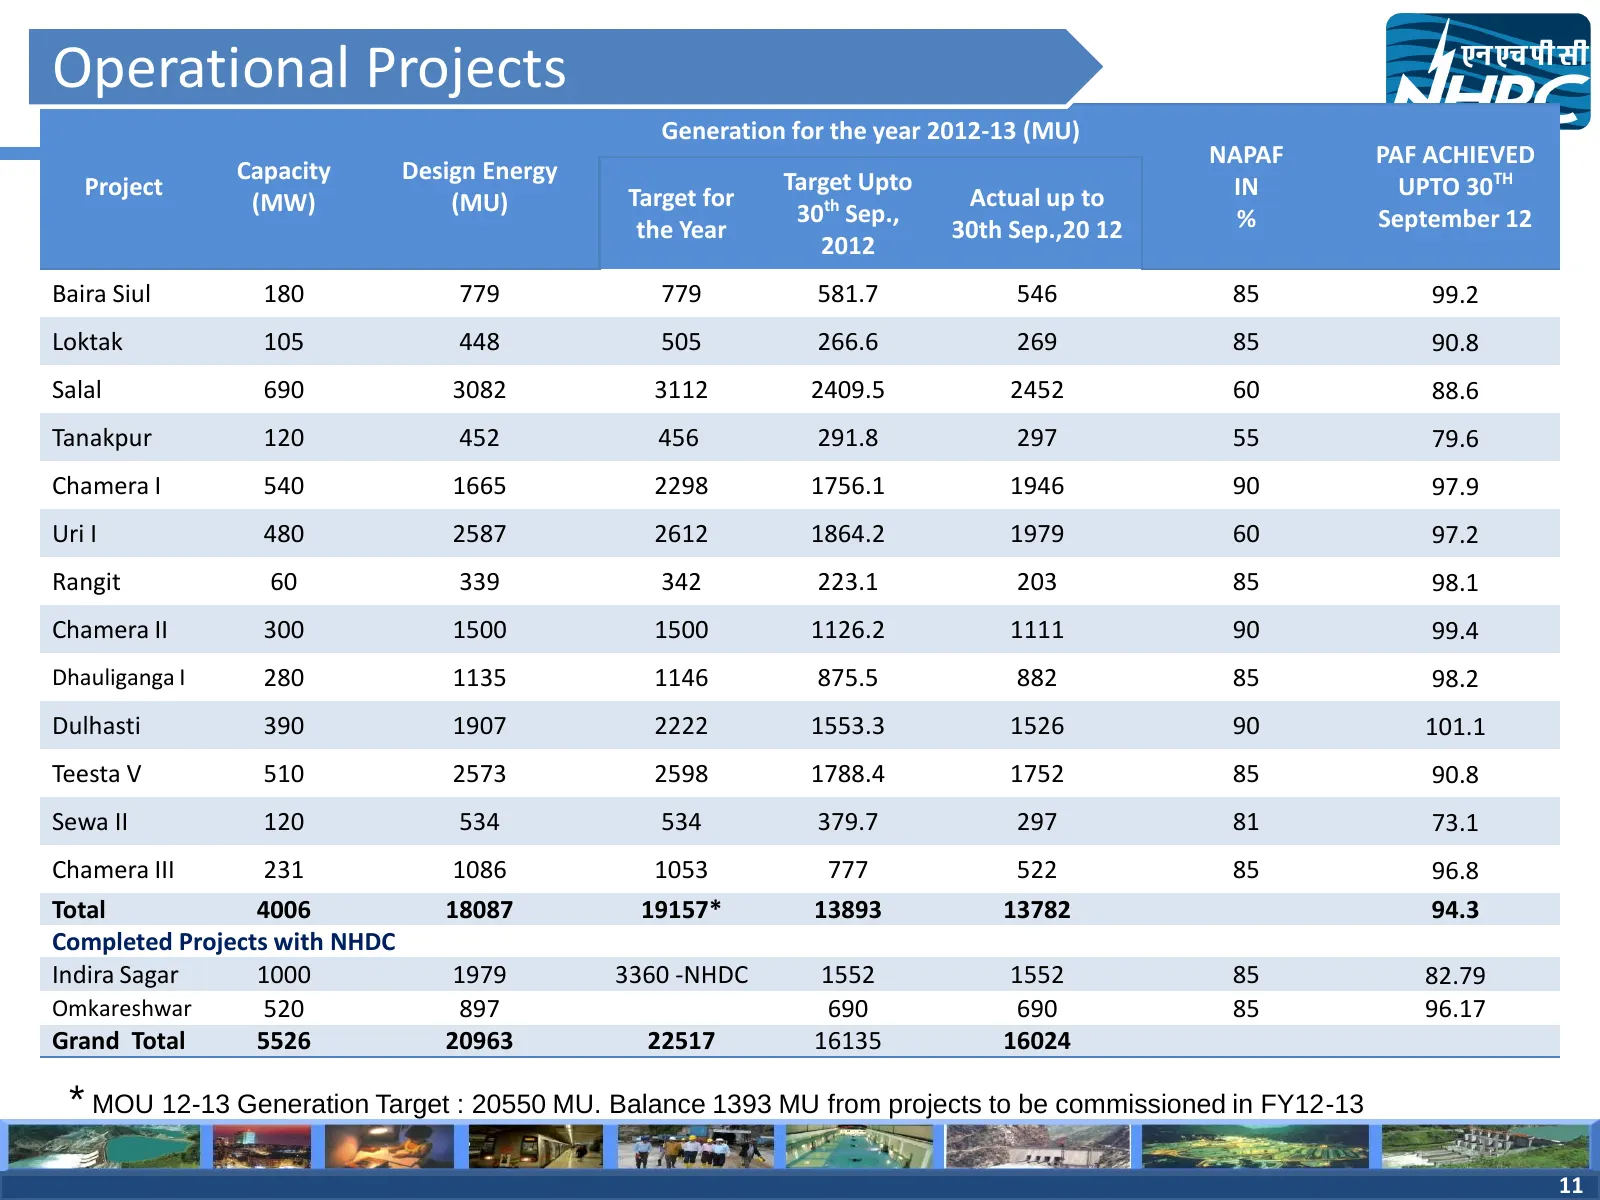
Slide 11: Operational Projects
Operational Projects Generation for the year 2012-13 (MU) NAPAF PAF ACHIEVED Capacity Design Energy Target Upto Project Target for Actual up to IN UPTO 30TH (MW) (MU) 30th Sep., the Year 30th Sep.,20 12 % September 12 2012 Baira Siul 180 779 779 581.7 546 85 99.2 Loktak 105 448 505 266.6 269 85 90.8
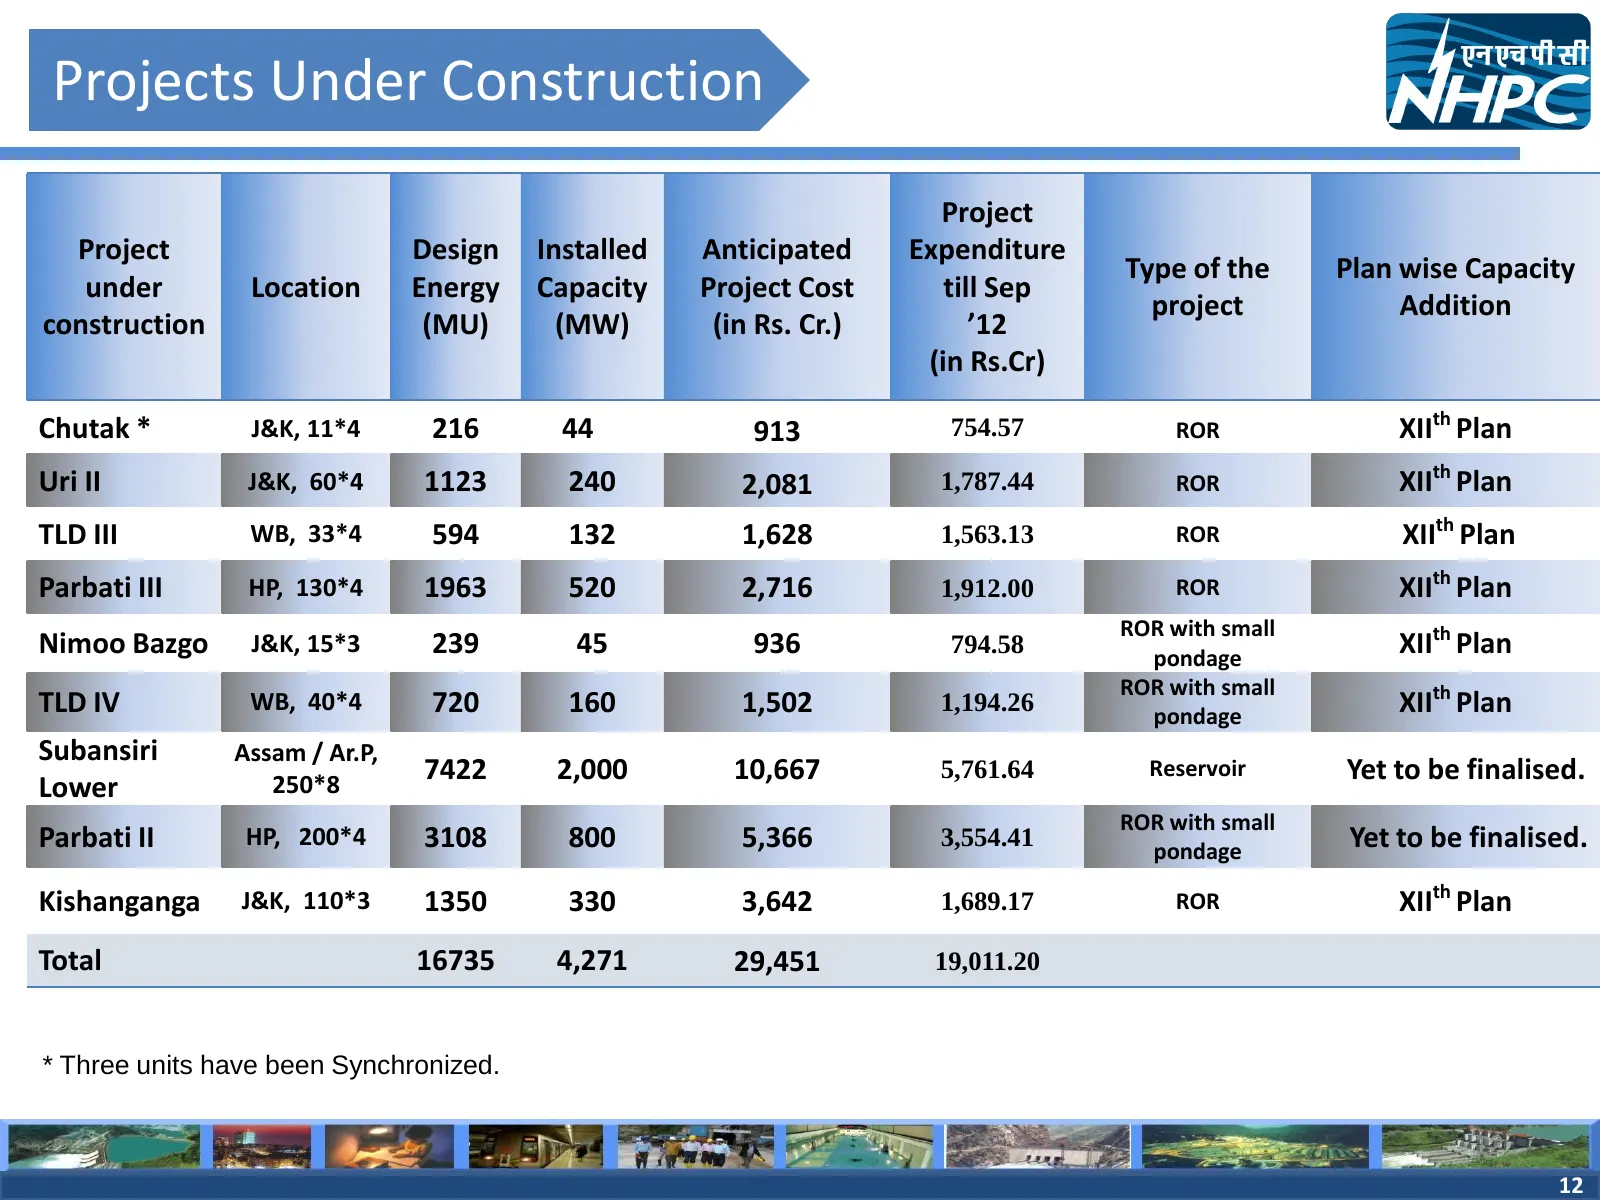
Slide 12: Projects Under Construction
Projects Under Construction Project Project Design Installed Anticipated Expenditure Type of the Plan wise Capacity under Location Energy Capacity Project Cost till Sep project Addition construction (MU) (MW) (in Rs. Cr.) ’12 (in Rs.Cr) Chutak * J&K, 11*4 216 44 913 754.57 ROR XIIth Plan Uri II J&K,
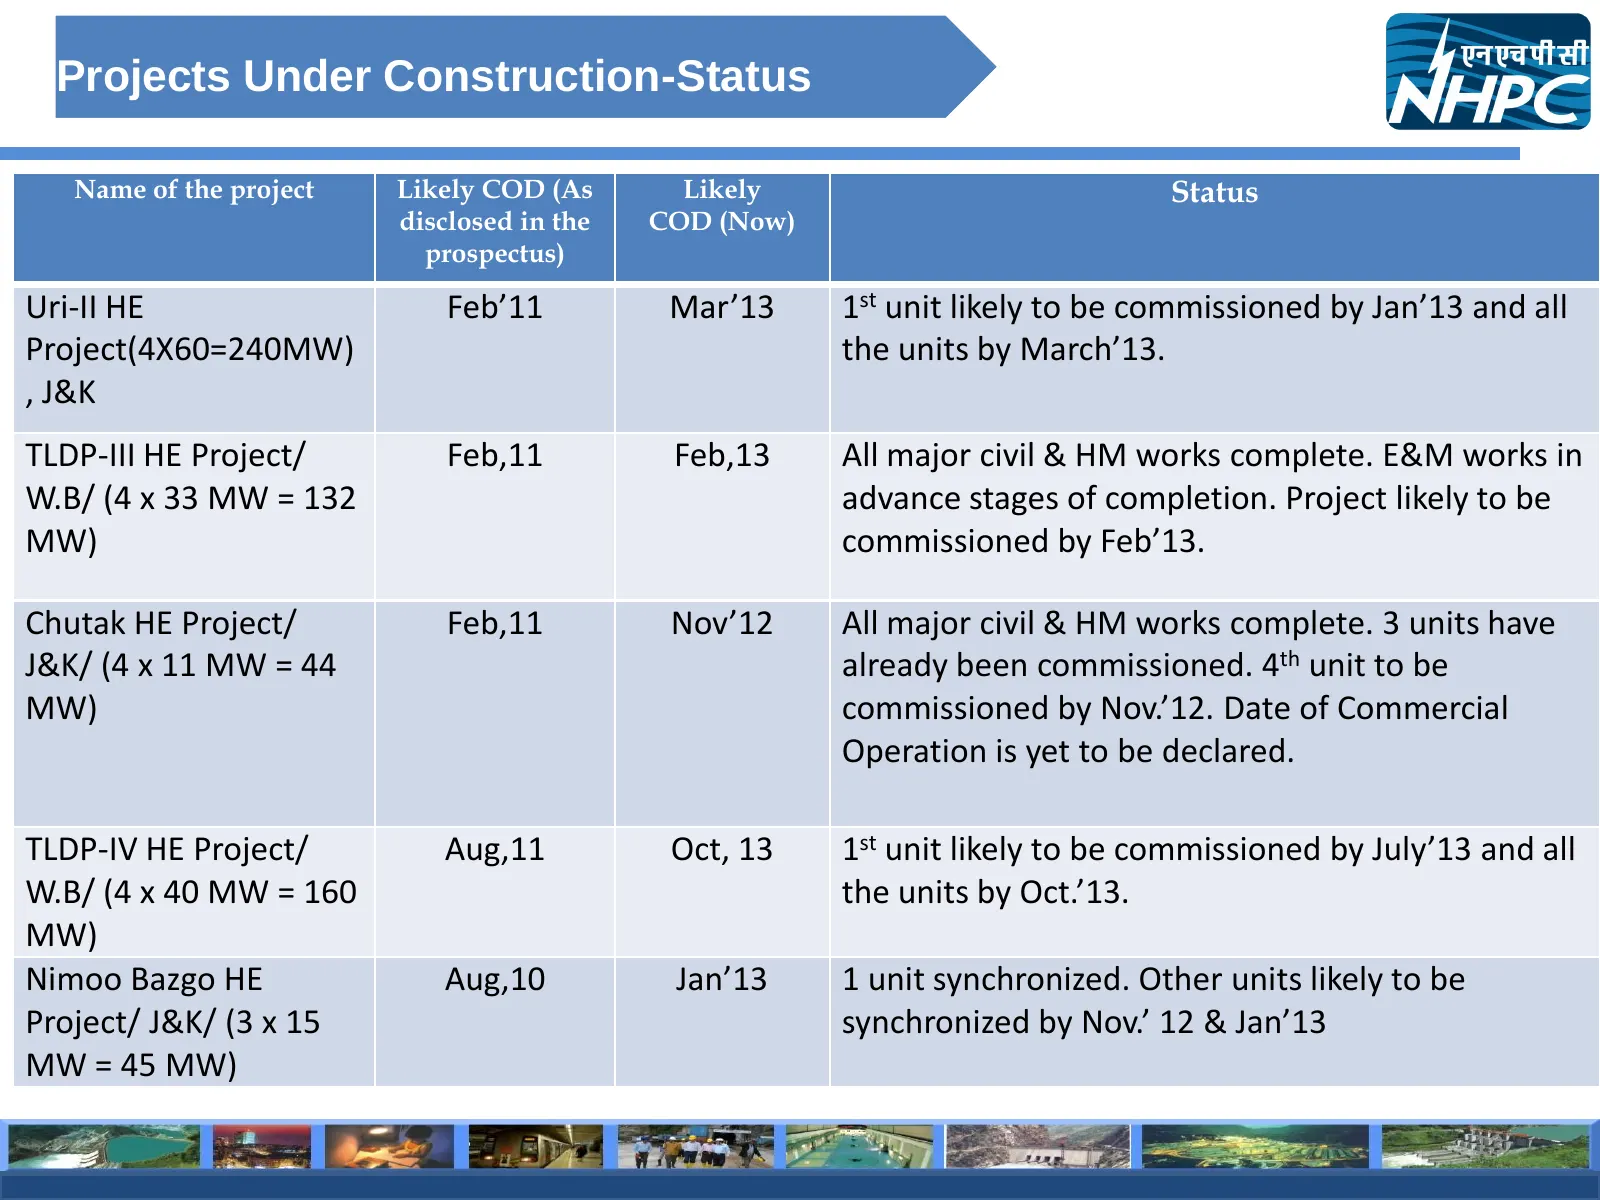
Slide 13: Projects Under Construction-Status
Projects Under Construction-Status Name of the project Likely COD (As Likely Status disclosed in the COD (Now) prospectus) Uri-II HE Feb’11 Mar’13 1st unit likely to be commissioned by Jan’13 and all Project(4X60=240MW) the units by March’13. , J&K TLDP-III HE Project/ Feb,11 Feb,13 All major civil
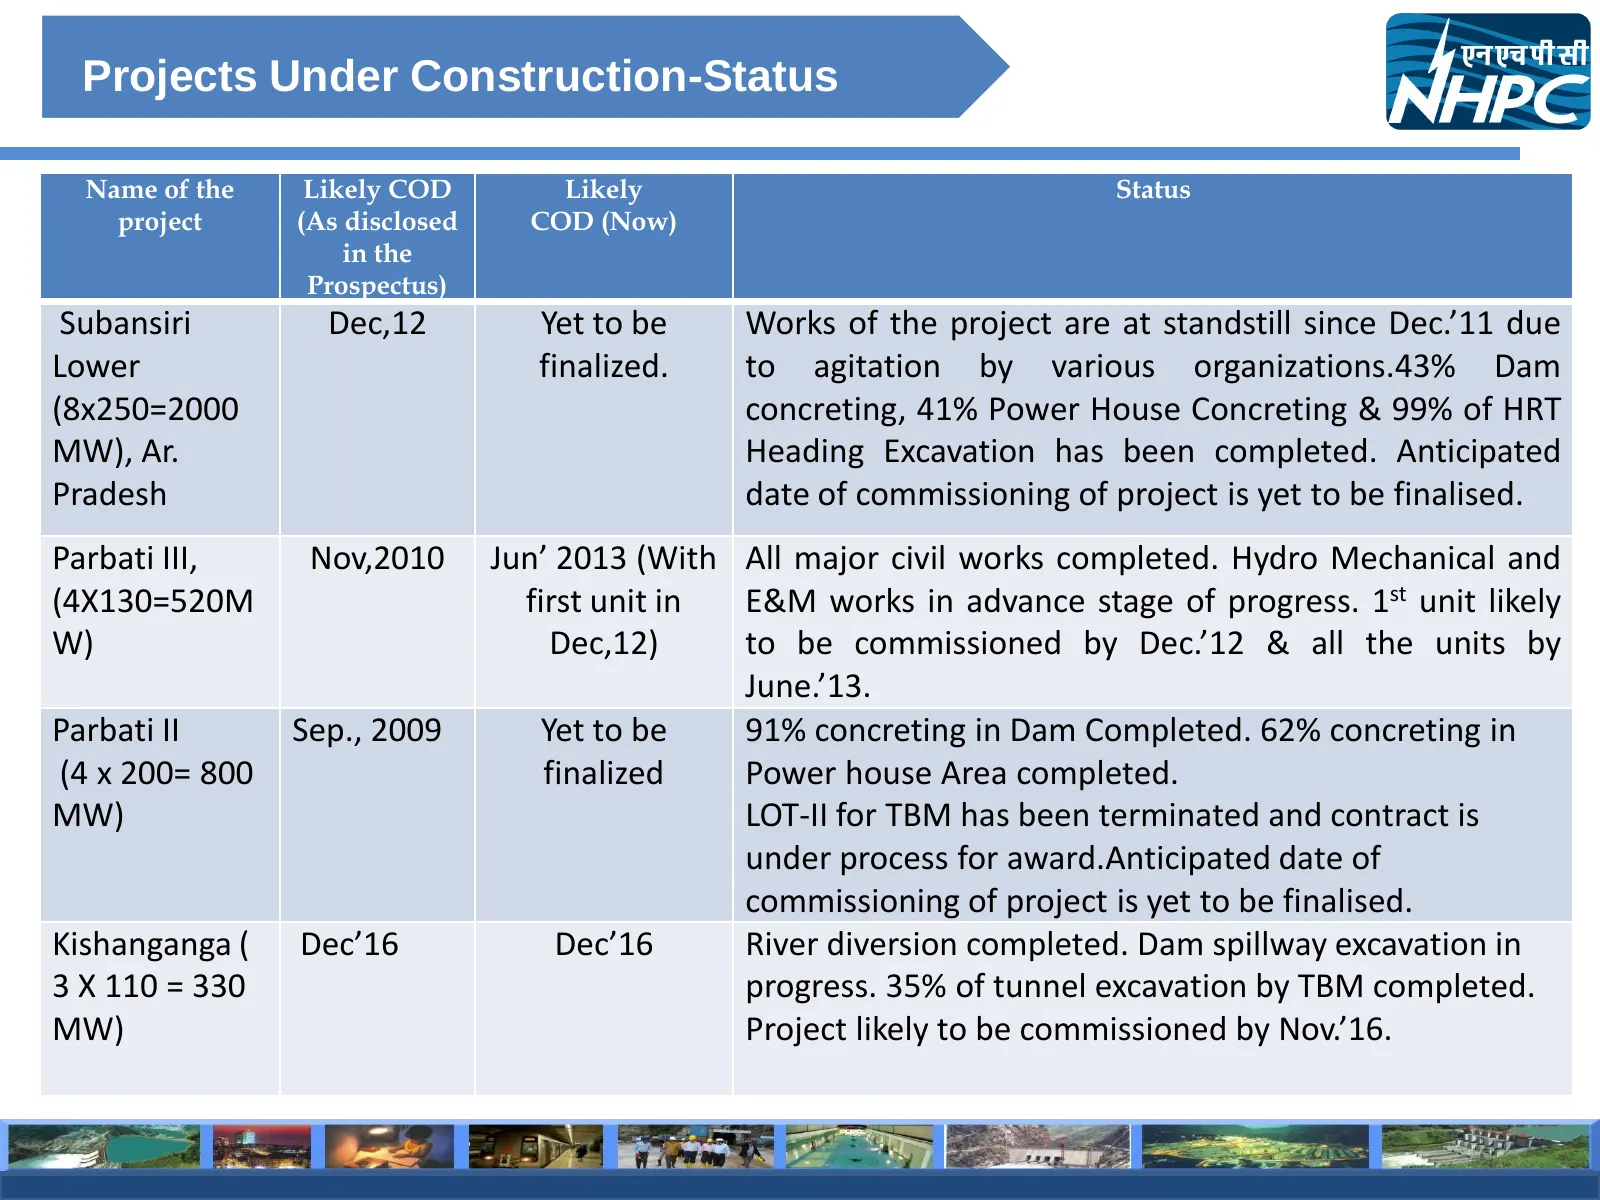
Slide 14: Projects Under Construction-Status
Projects Under Construction-Status Name of the Likely COD Likely Status project (As disclosed COD (Now) in the Prospectus) Subansiri Dec,12 Yet to be Works of the project are at standstill since Dec.’11 due Lower finalized. to agitation by various organizations.43% Dam (8x250=2000 concreting, 41% Po
Slide 15: Significant Expansion Plans
Significant Expansion Plans 15
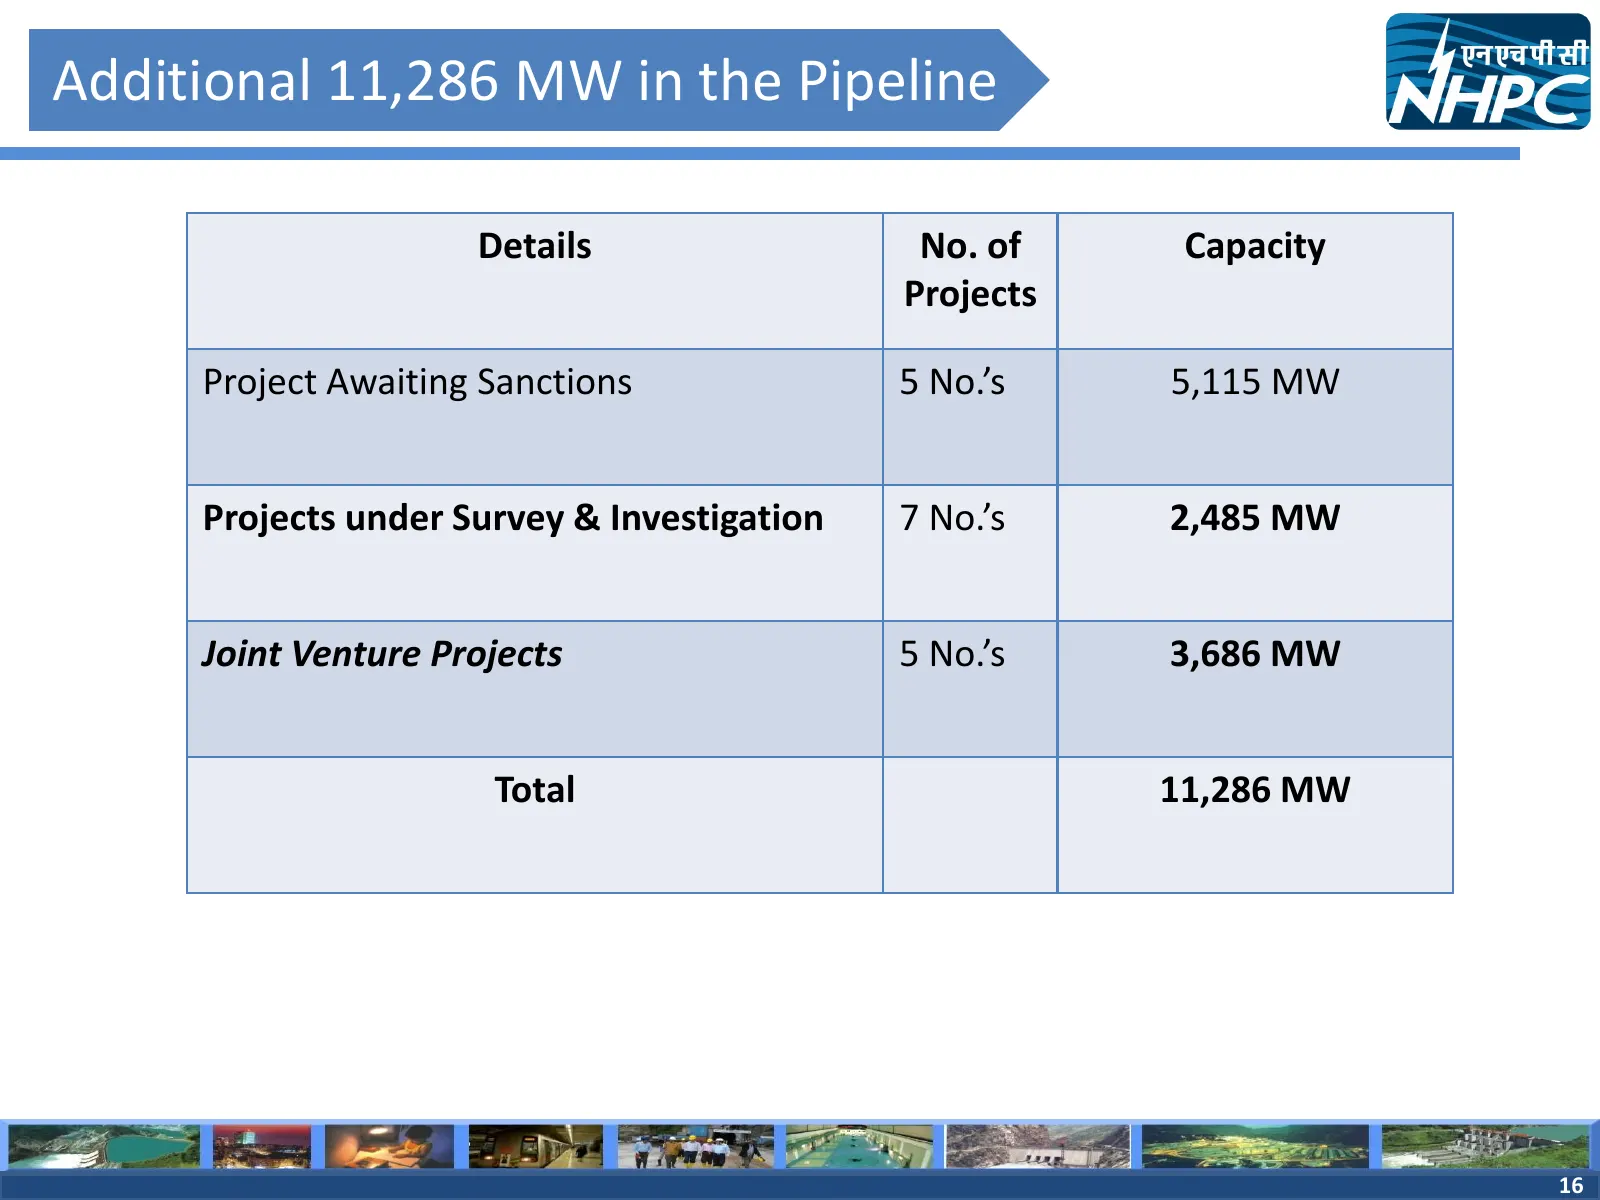
Slide 16: Additional 11,286 MW in the Pipeline
Additional 11,286 MW in the Pipeline Details No. of Capacity Projects Project Awaiting Sanctions 5 No.’s 5,115 MW Projects under Survey & Investigation 7 No.’s 2,485 MW Joint Venture Projects 5 No.’s 3,686 MW Total 11,286 MW 16 16
Slide 17: Additional 11,286 MW in the Pipeline
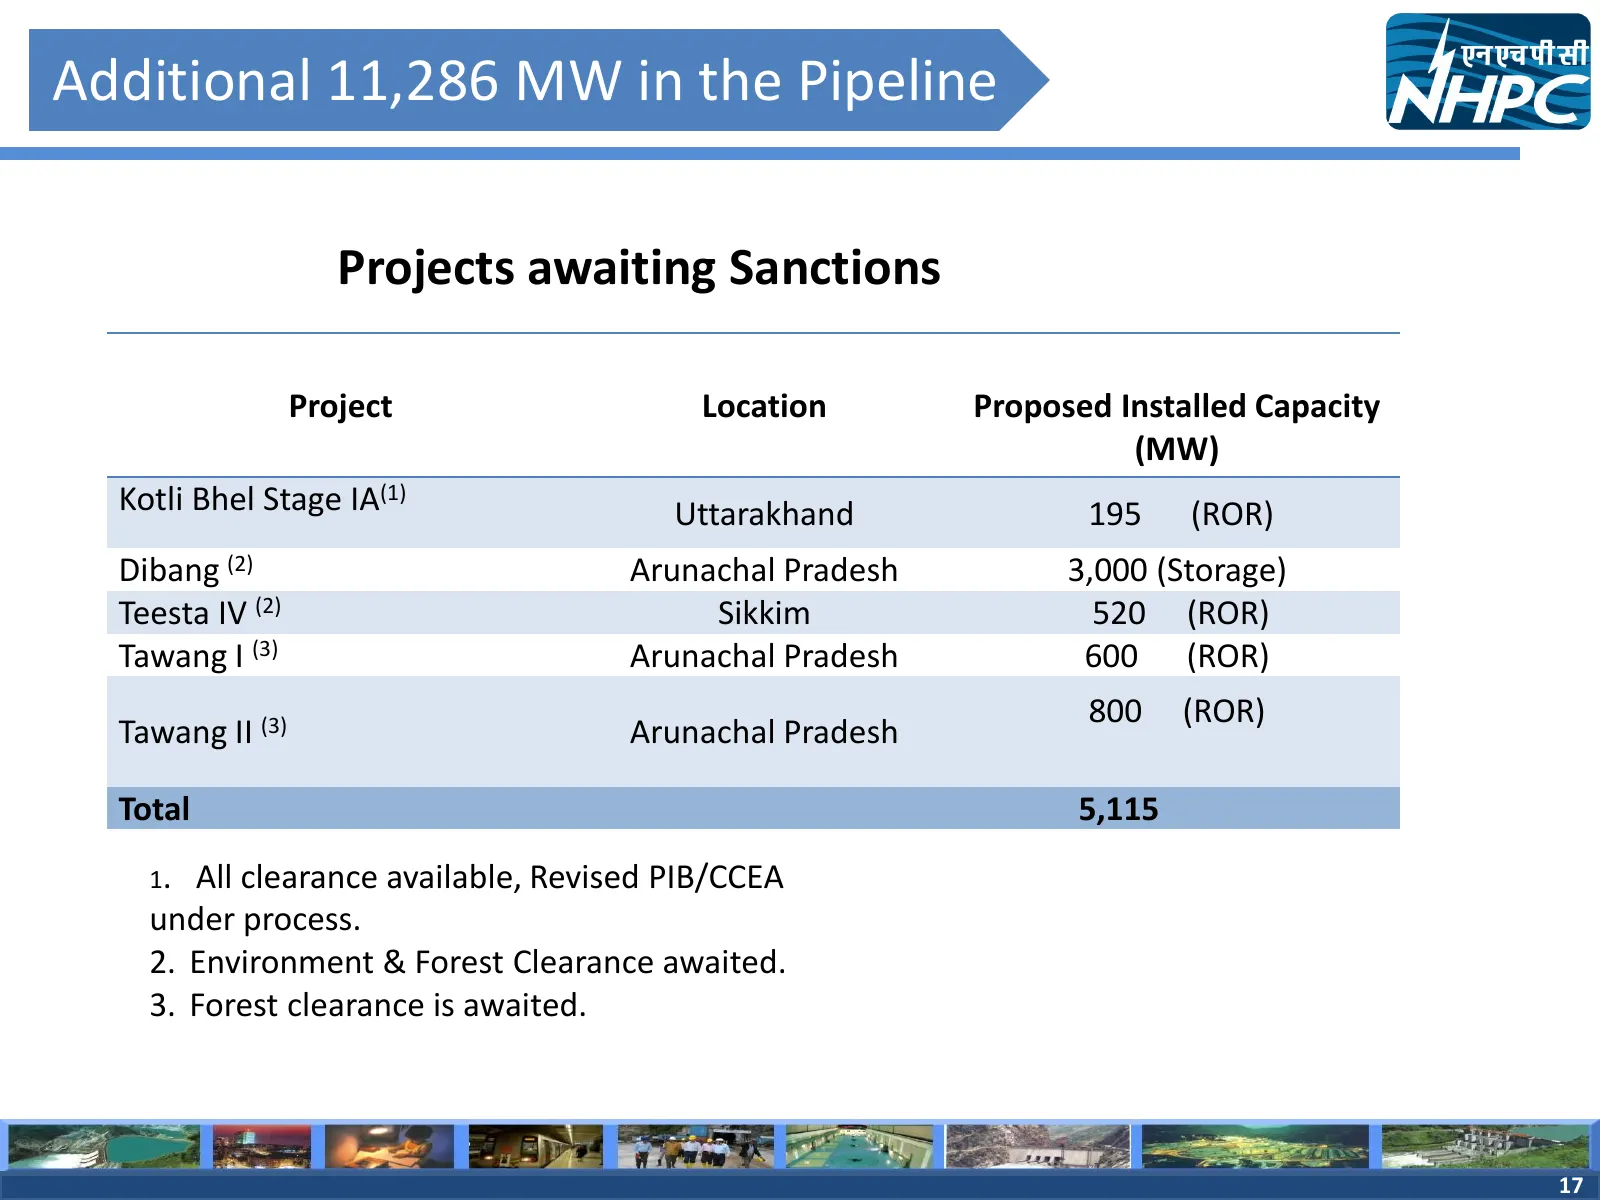
Additional 11,286 MW in the Pipeline Projects awaiting Sanctions Project Location Proposed Installed Capacity (MW) Kotli Bhel Stage IA(1) Uttarakhand 195 (ROR) Dibang (2) Arunachal Pradesh 3,000 (Storage) Teesta IV (2) Sikkim 520 (ROR) Tawang I (3) Arunachal Pradesh 600 (ROR) 800 (ROR) Tawang II (3)
Slide 18: Additional 11,286 MW in the Pipeline
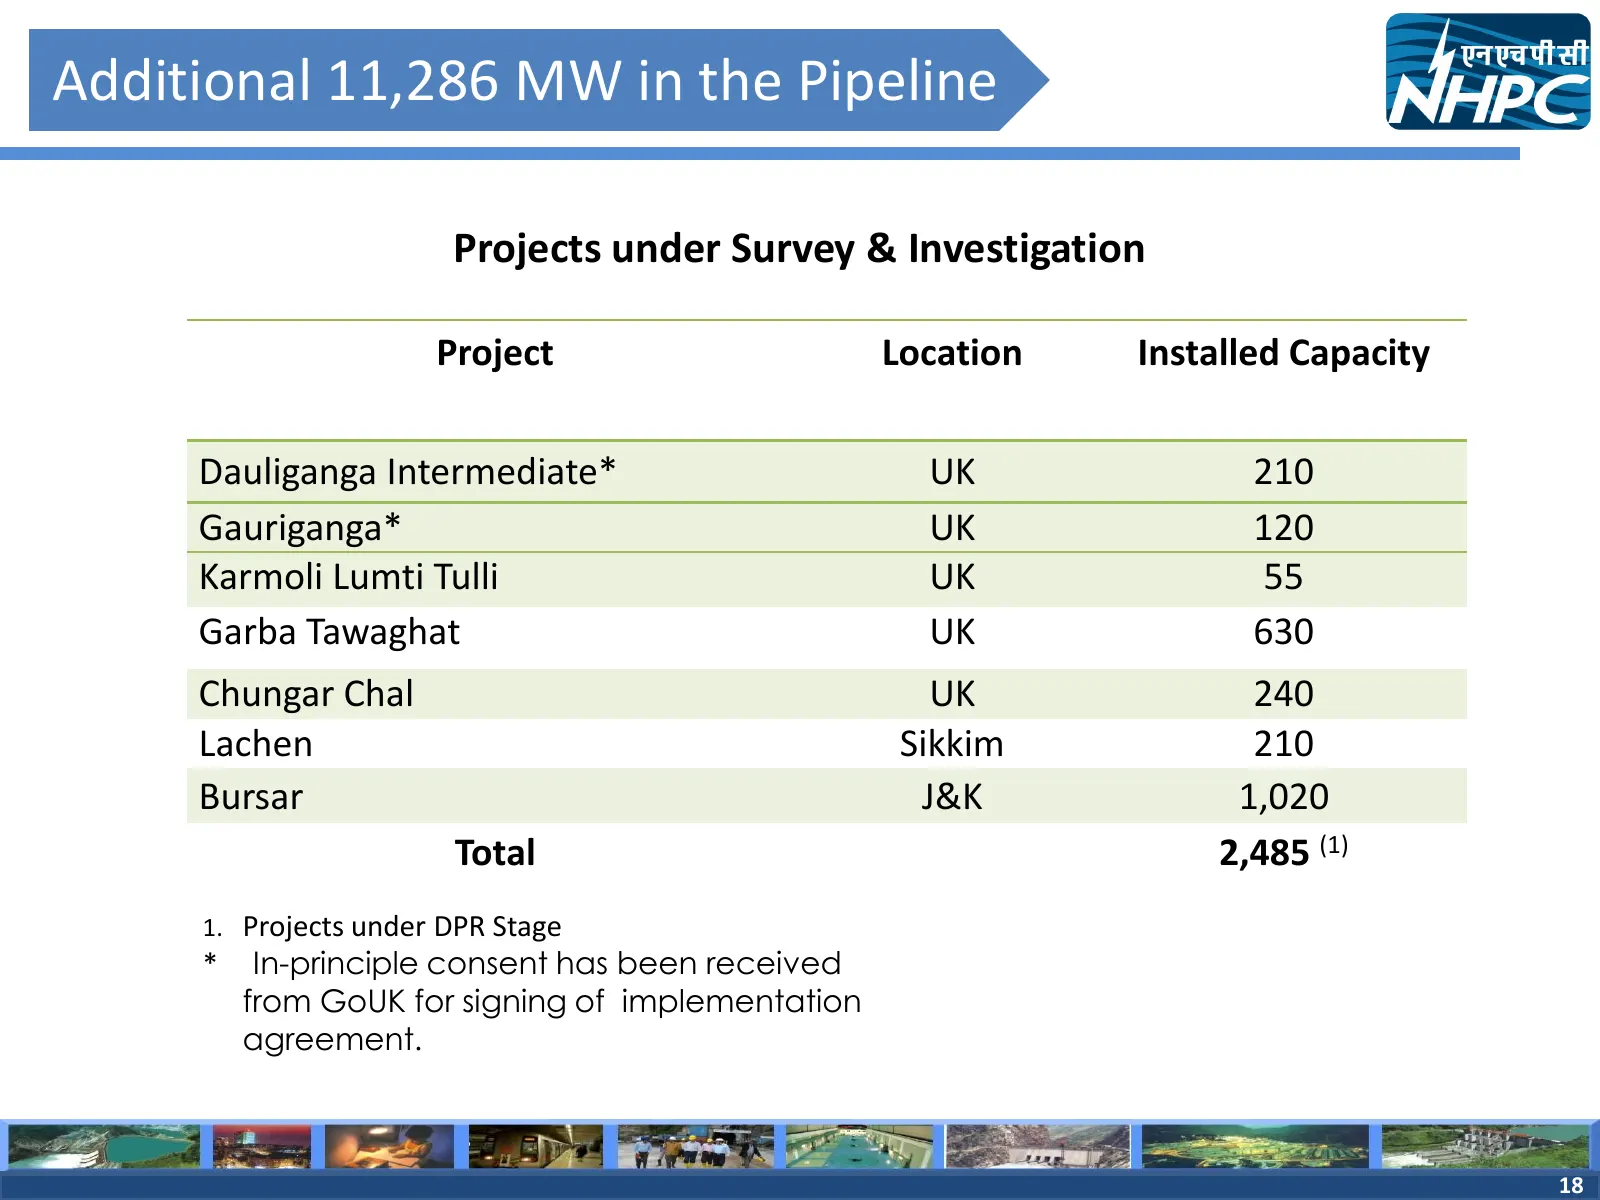
Additional 11,286 MW in the Pipeline Projects under Survey & Investigation Project Location Installed Capacity Dauliganga Intermediate* UK 210 Gauriganga* UK 120 Karmoli Lumti Tulli UK 55 Garba Tawaghat UK 630 Chungar Chal UK 240 Lachen Sikkim 210 Bursar J&K 1,020 Total 2,485 (1) 1. Projects under D
Slide 19: Additional 11,286 MW in the Pipeline
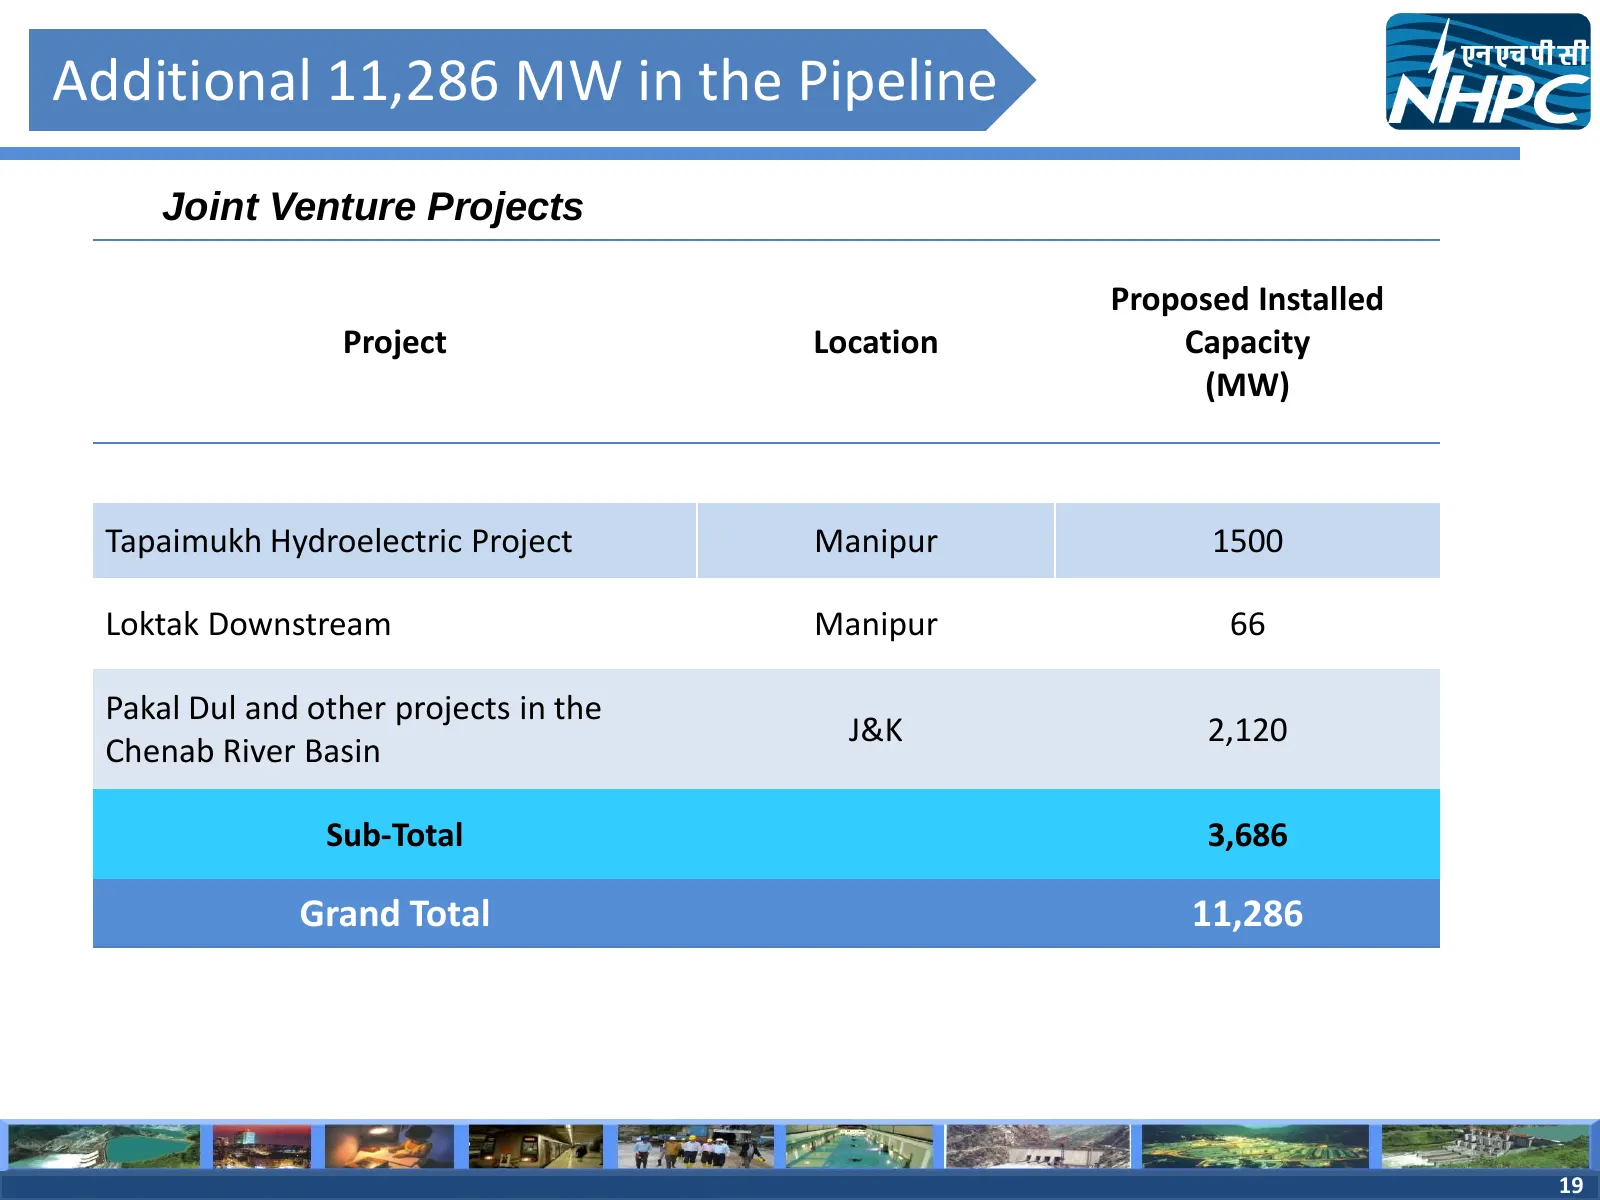
Additional 11,286 MW in the Pipeline Joint Venture Projects Proposed Installed Project Location Capacity (MW) Tapaimukh Hydroelectric Project Manipur 1500 Loktak Downstream Manipur 66 Pakal Dul and other projects in the J&K 2,120 Chenab River Basin Sub-Total 3,686 Grand Total 11,286 19 19
Slide 20: Major Subsidiary/Joint Ventures
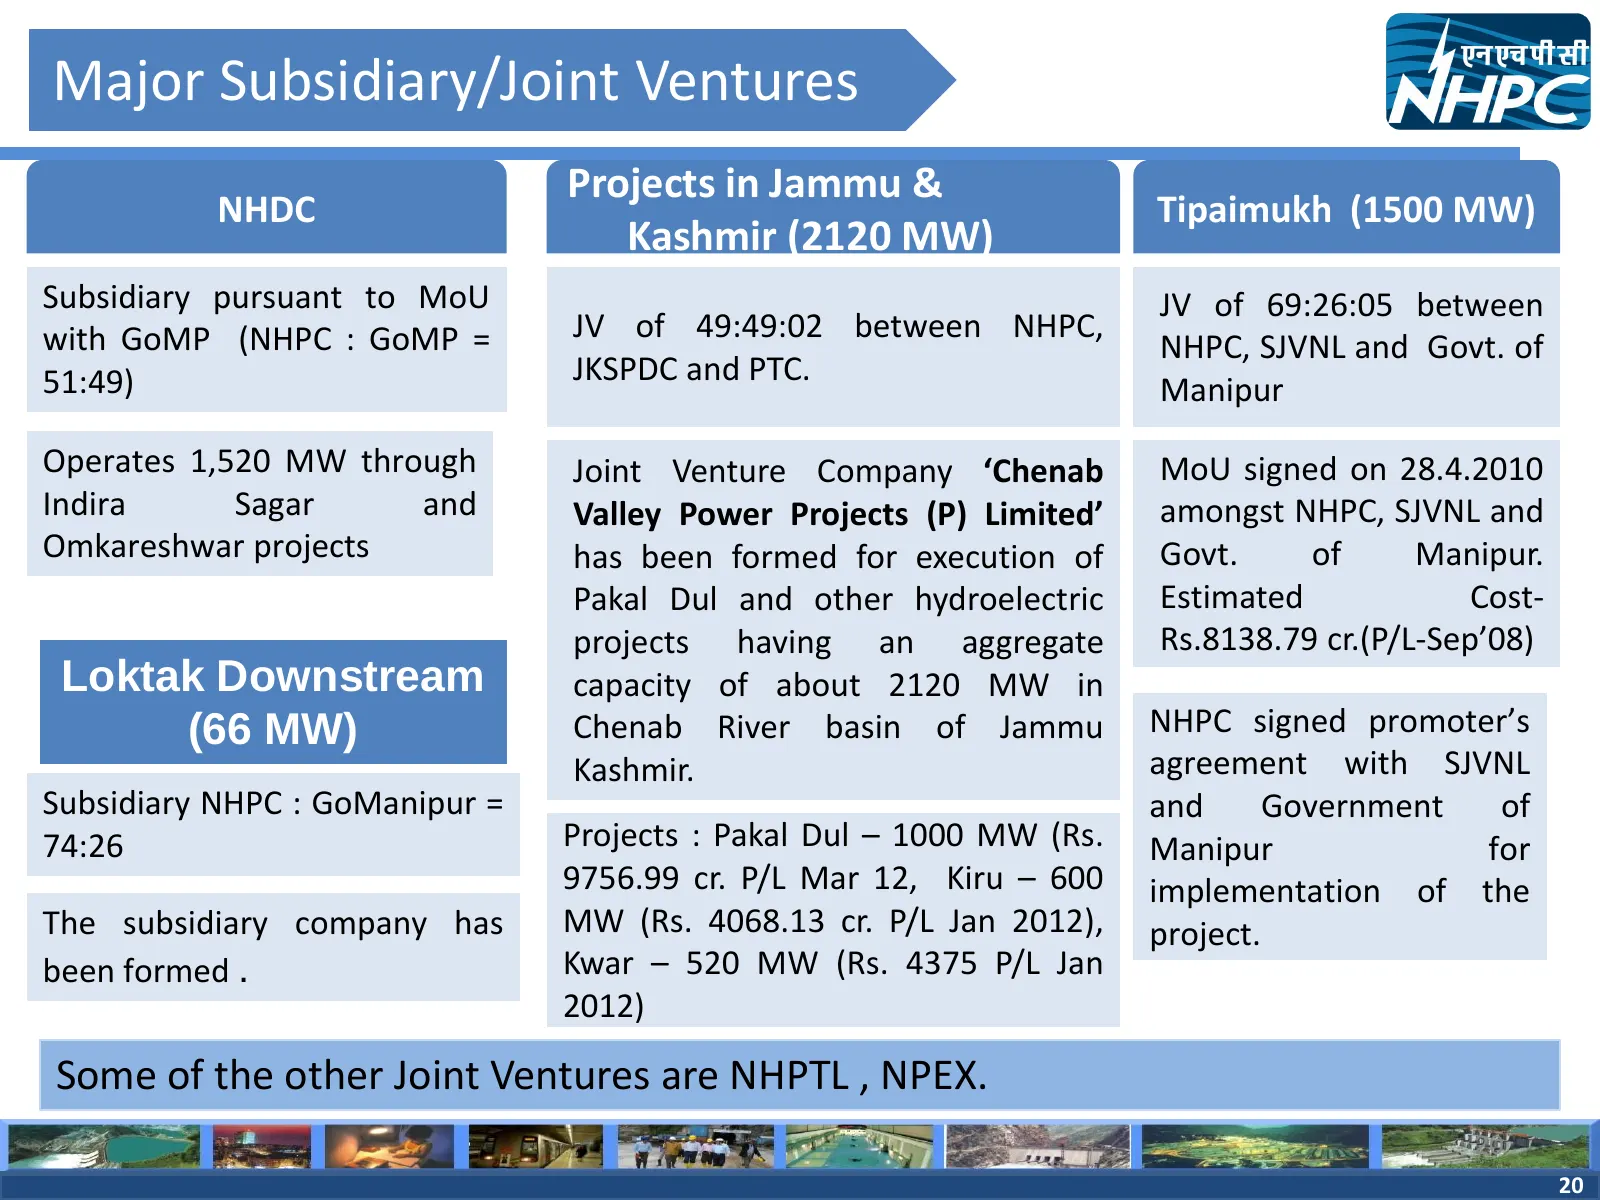
Major Subsidiary/Joint Ventures Projects in Jammu & NHDC Tipaimukh (1500 MW) Kashmir (2120 MW) Subsidiary pursuant to MoU JV of 69:26:05 between with GoMP (NHPC : GoMP = JV of 49:49:02 between NHPC, NHPC, SJVNL and Govt. of 51:49) JKSPDC and PTC. Manipur Operates 1,520 MW through Joint Venture Compa
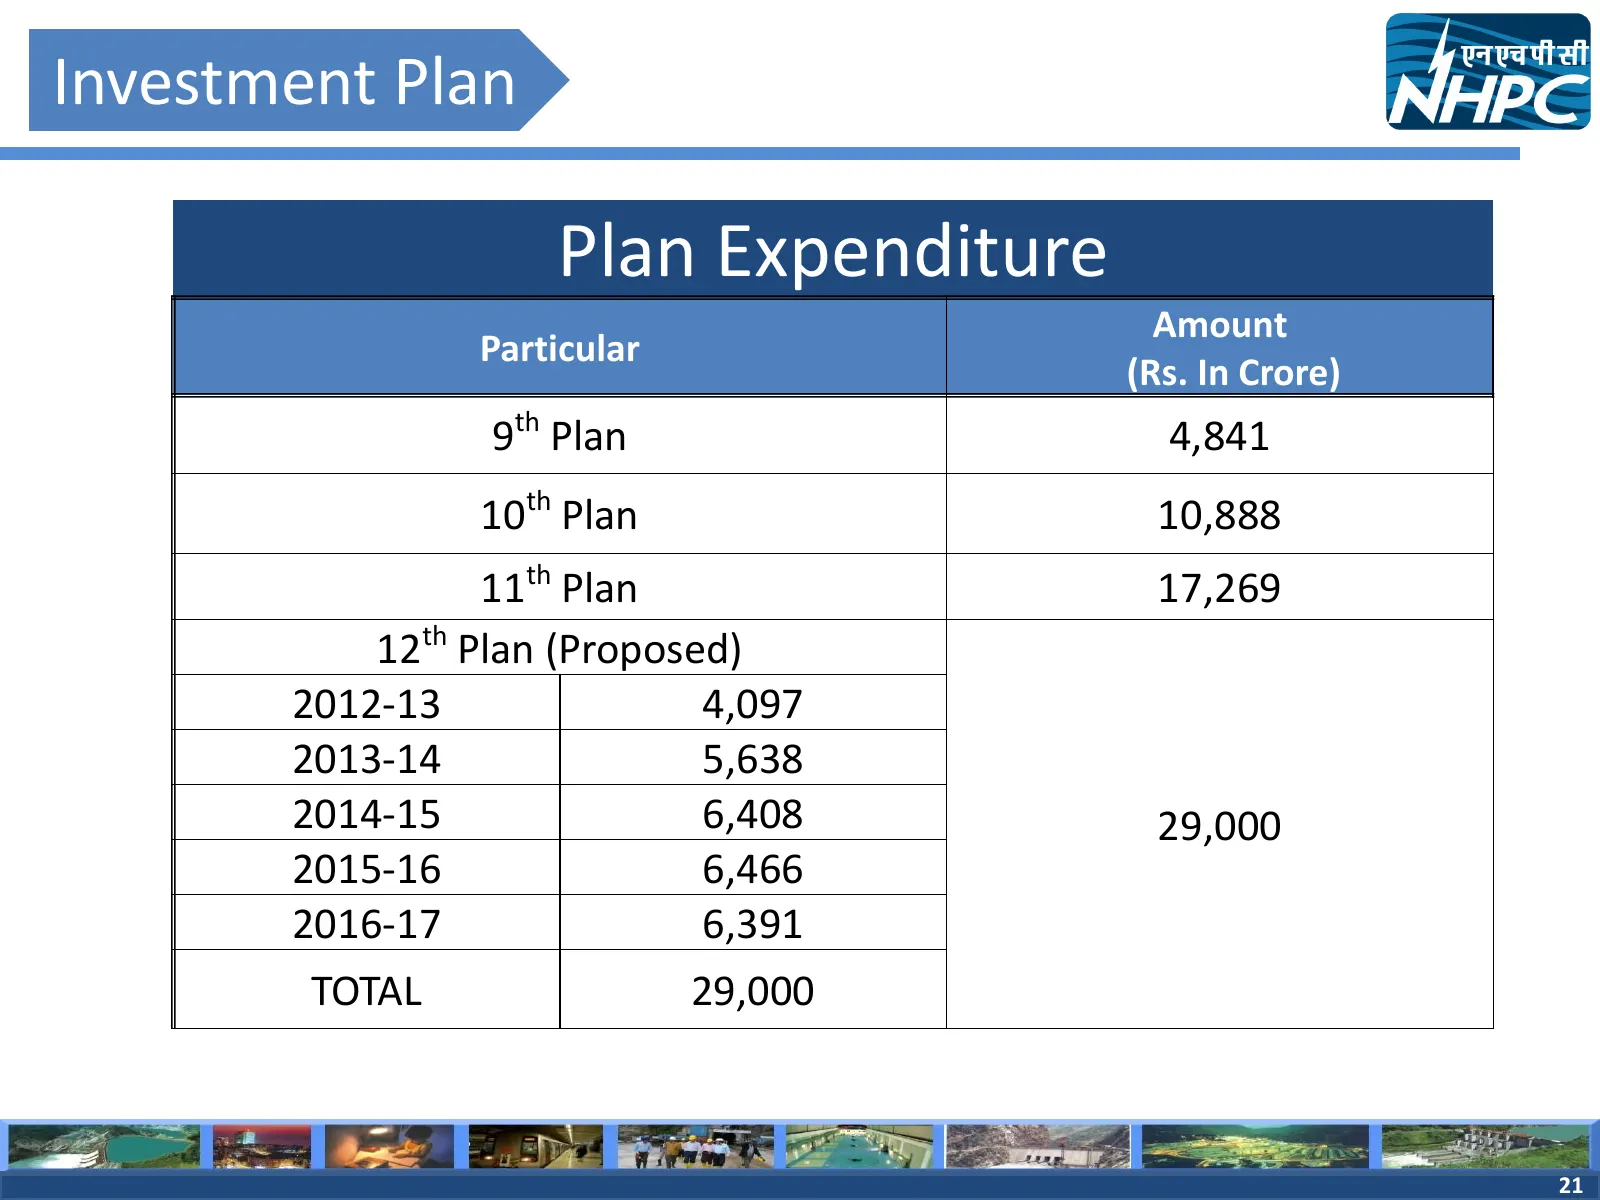
Slide 21: Plan Expenditure
Investment Plan Plan Expenditure Amount Particular (Rs. In Crore) 9th Plan 4,841 10th Plan 10,888 11th Plan 17,269 12th Plan (Proposed) 2012-13 4,097 2013-14 5,638 2014-15 6,408 29,000 2015-16 6,466 2016-17 6,391 TOTAL 29,000 21 21
Slide 22: Performance Highlights
Performance Highlights 22
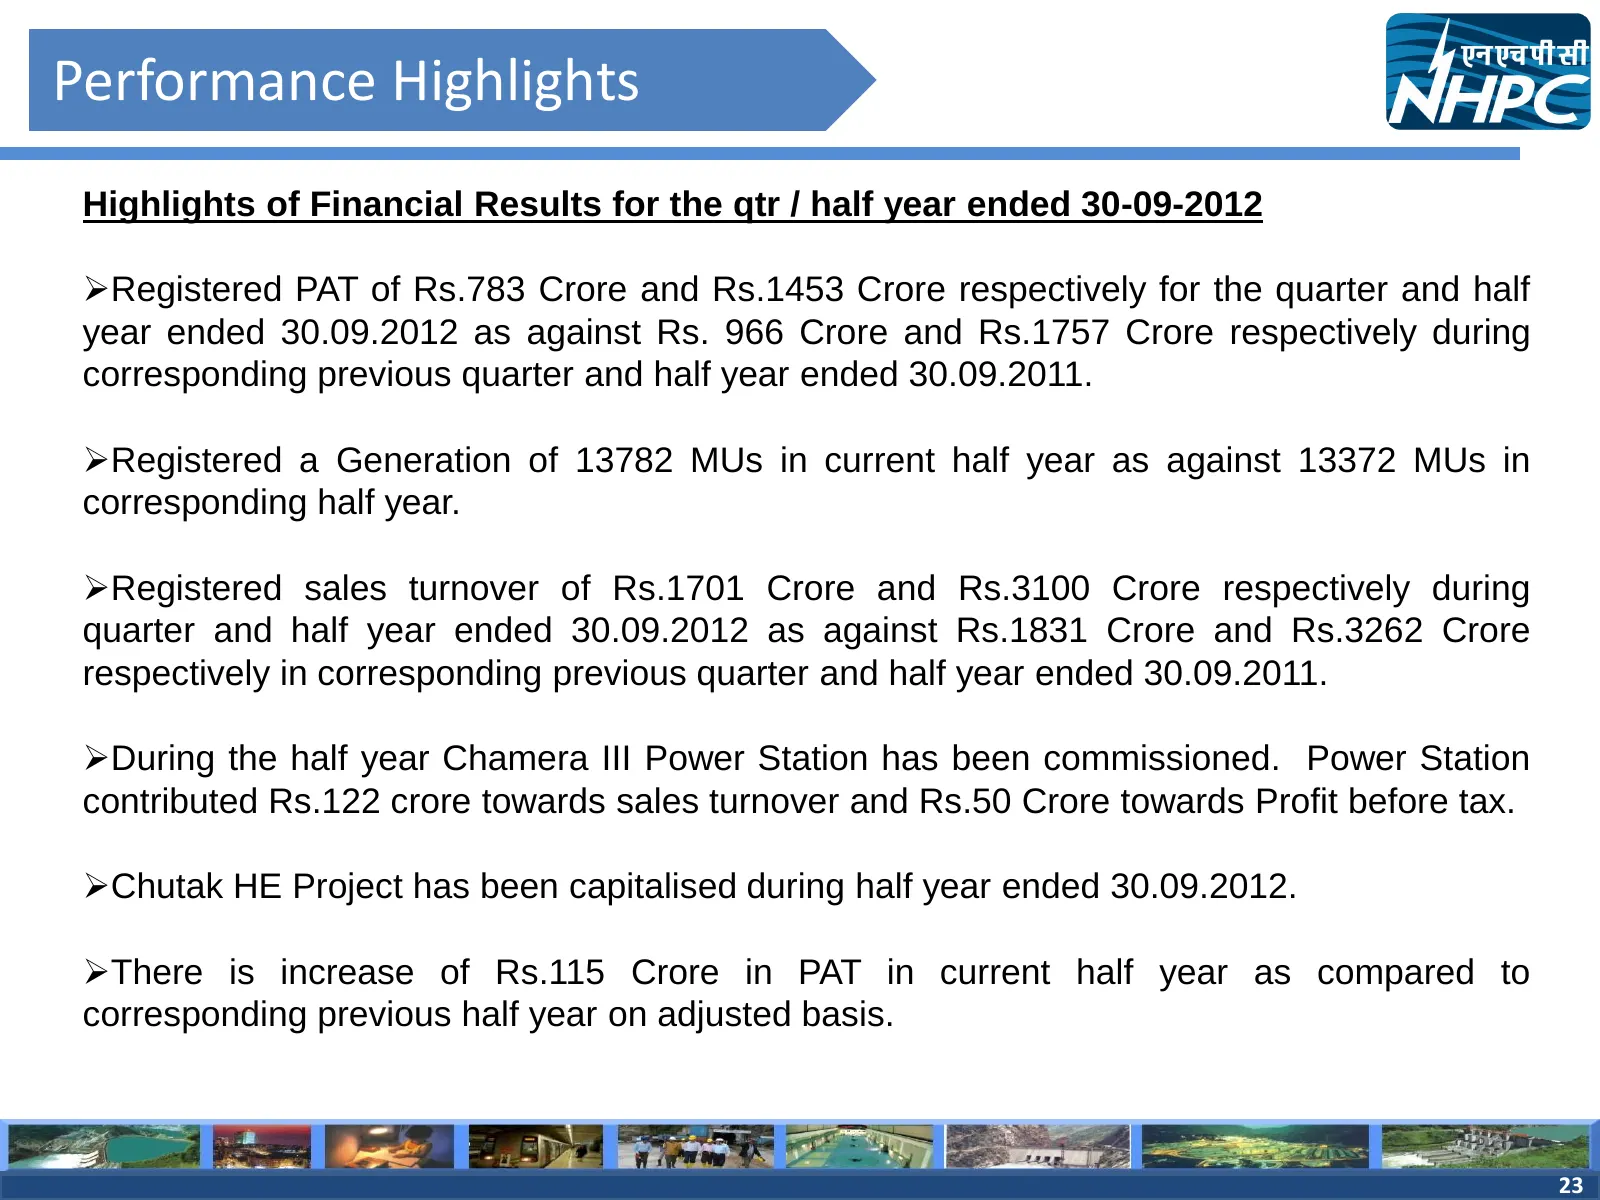
Slide 23: Performance Highlights
Performance Highlights Highlights of Financial Results for the qtr / half year ended 30-09-2012 Registered PAT of Rs.783 Crore and Rs.1453 Crore respectively for the quarter and half year ended 30.09.2012 as against Rs. 966 Crore and Rs.1757 Crore respectively during corresponding previous quarter
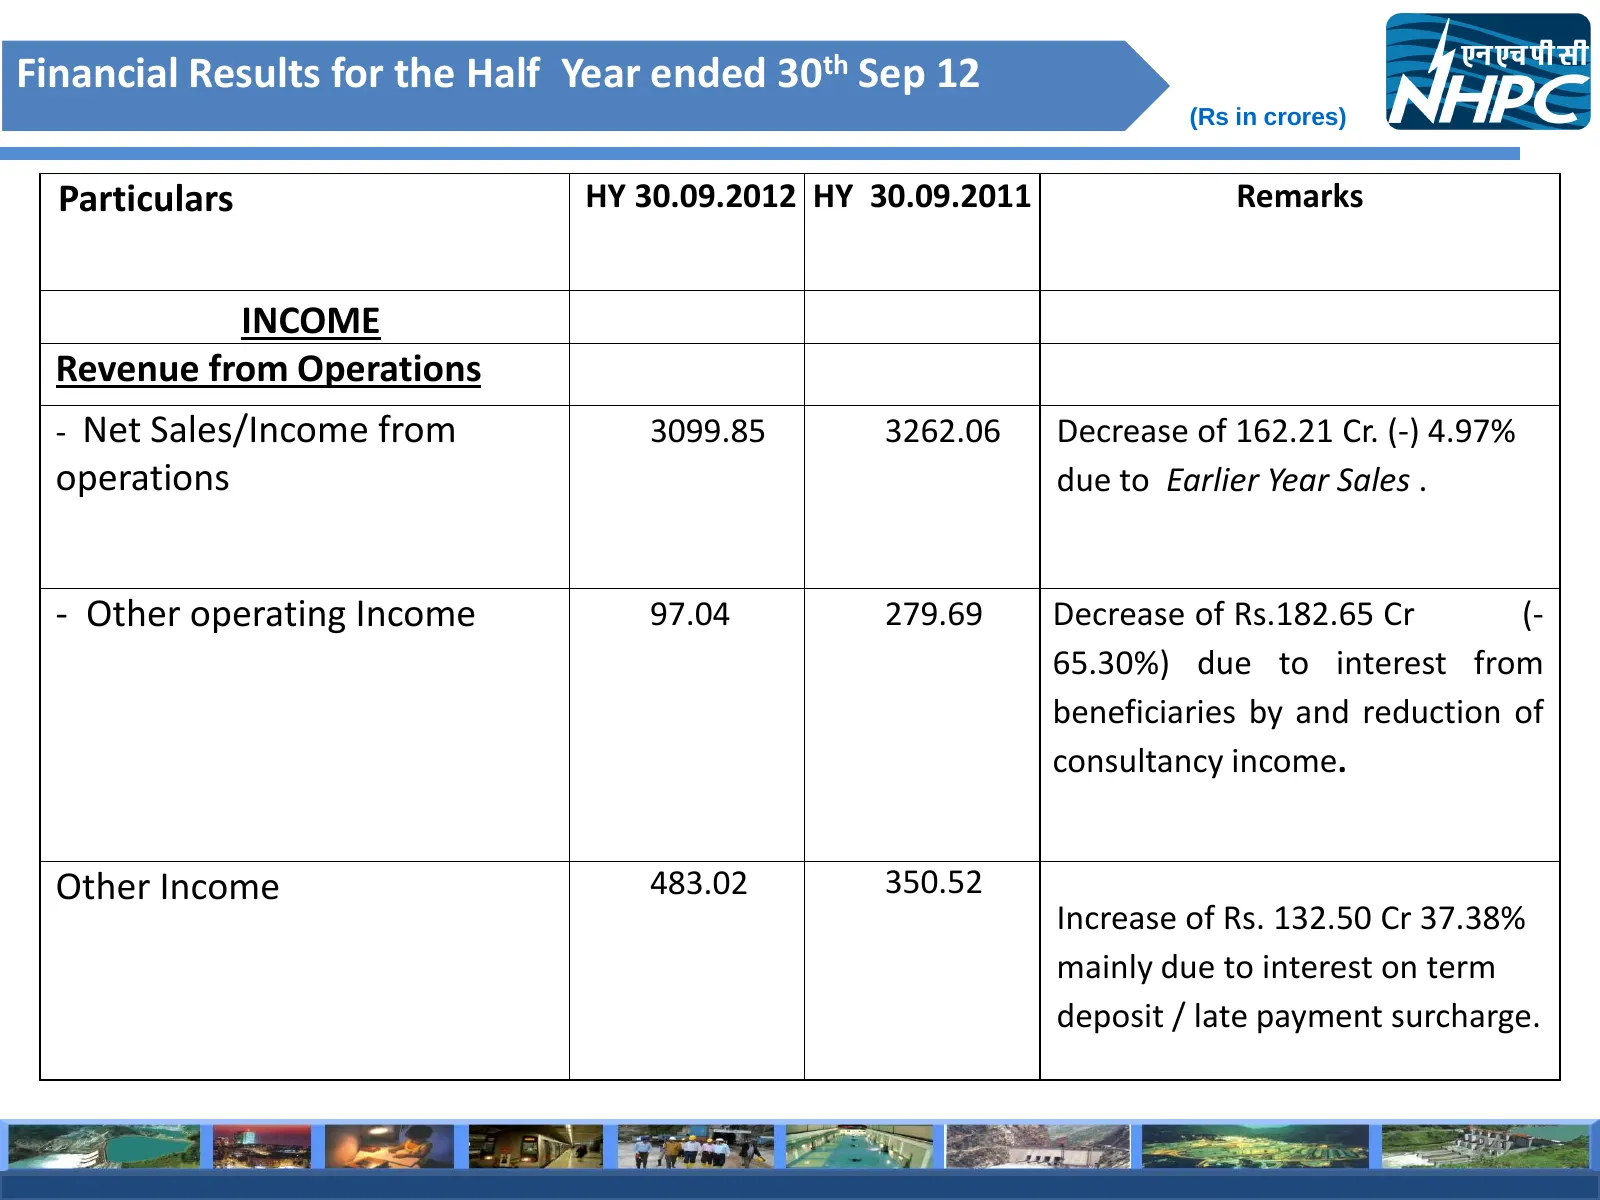
Slide 24: Financial Results for the Half Year ended 30th Sep
Financial Results for the Half Year ended 30th Sep 12 (Rs in crores) Particulars HY 30.09.2012 HY 30.09.2011 Remarks INCOME Revenue from Operations - Net Sales/Income from 3099.85 3262.06 Decrease of 162.21 Cr. (-) 4.97% operations due to Earlier Year Sales . - Other operating Income 97.04 279.69 De
Slide 25: Financial Results for the Half Year ended 30th Sep
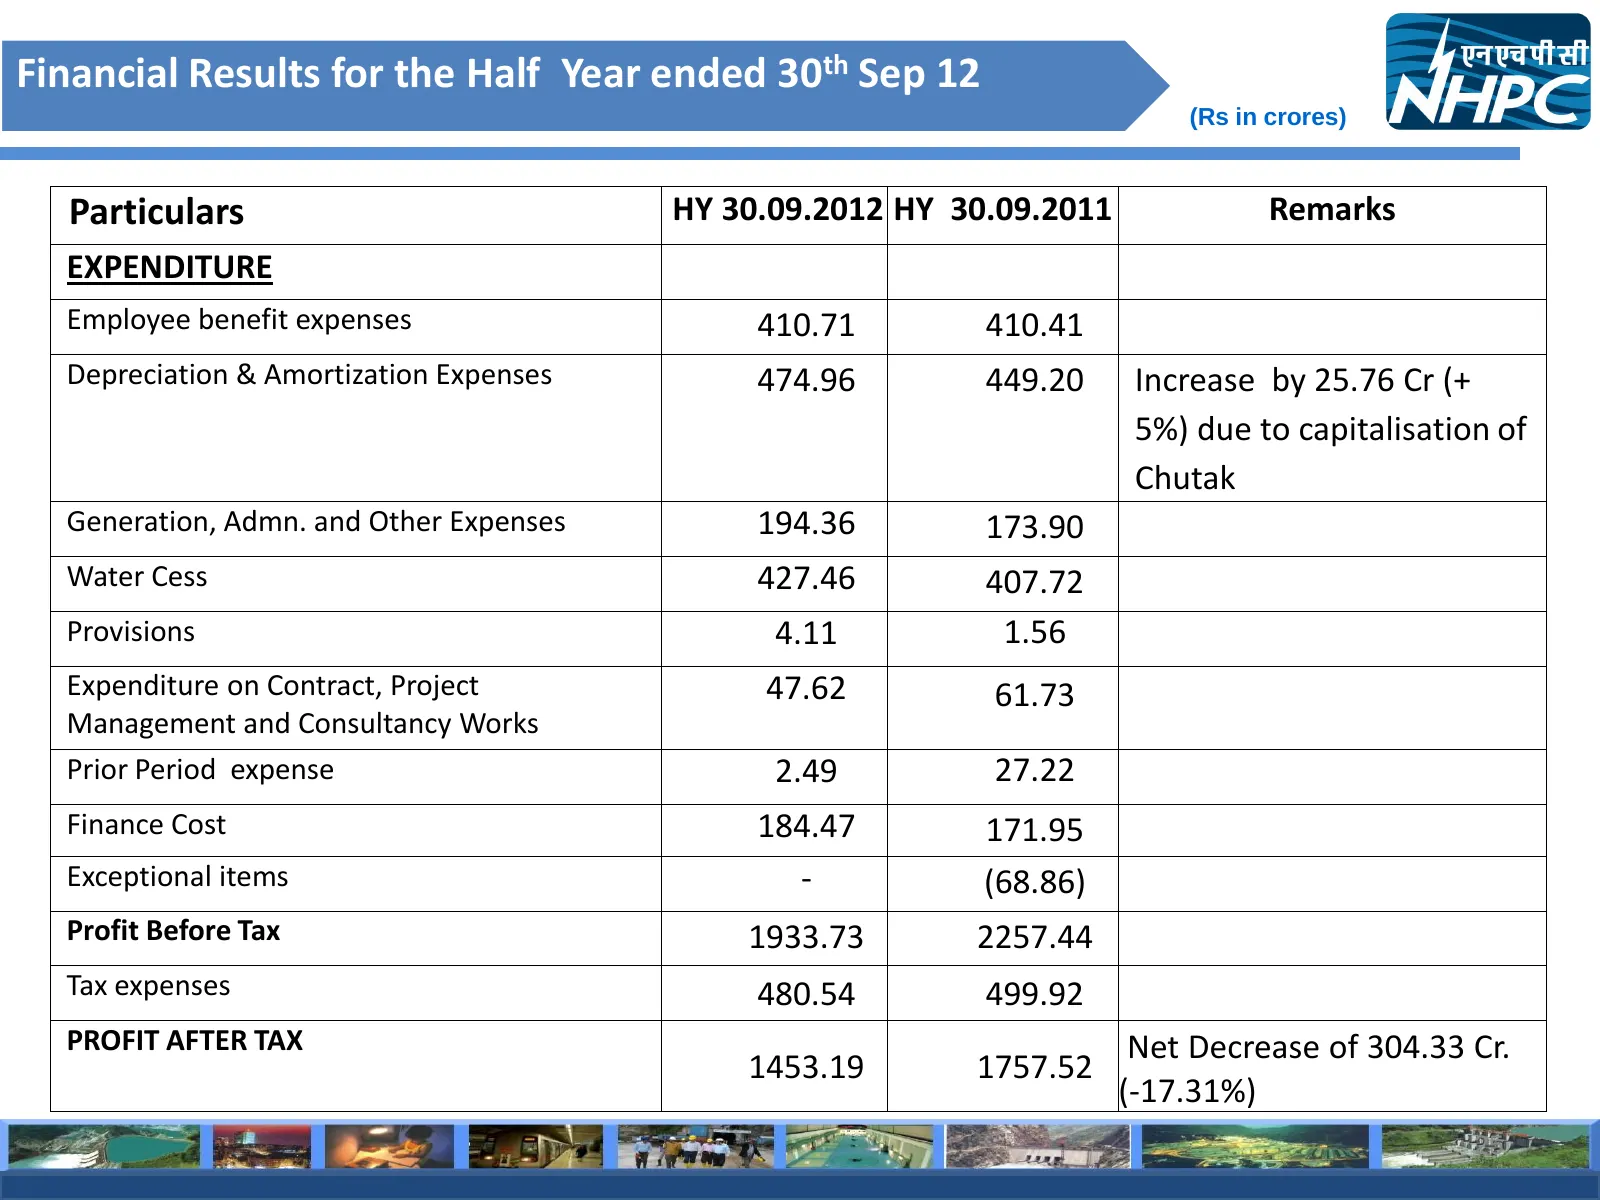
Financial Results for the Half Year ended 30th Sep 12 (Rs in crores) Particulars HY 30.09.2012 HY 30.09.2011 Remarks EXPENDITURE Employee benefit expenses 410.71 410.41 Depreciation & Amortization Expenses 474.96 449.20 Increase by 25.76 Cr (+ 5%) due to capitalisation of Chutak Generation, Admn. an
Slide 26: Adjusted PAT
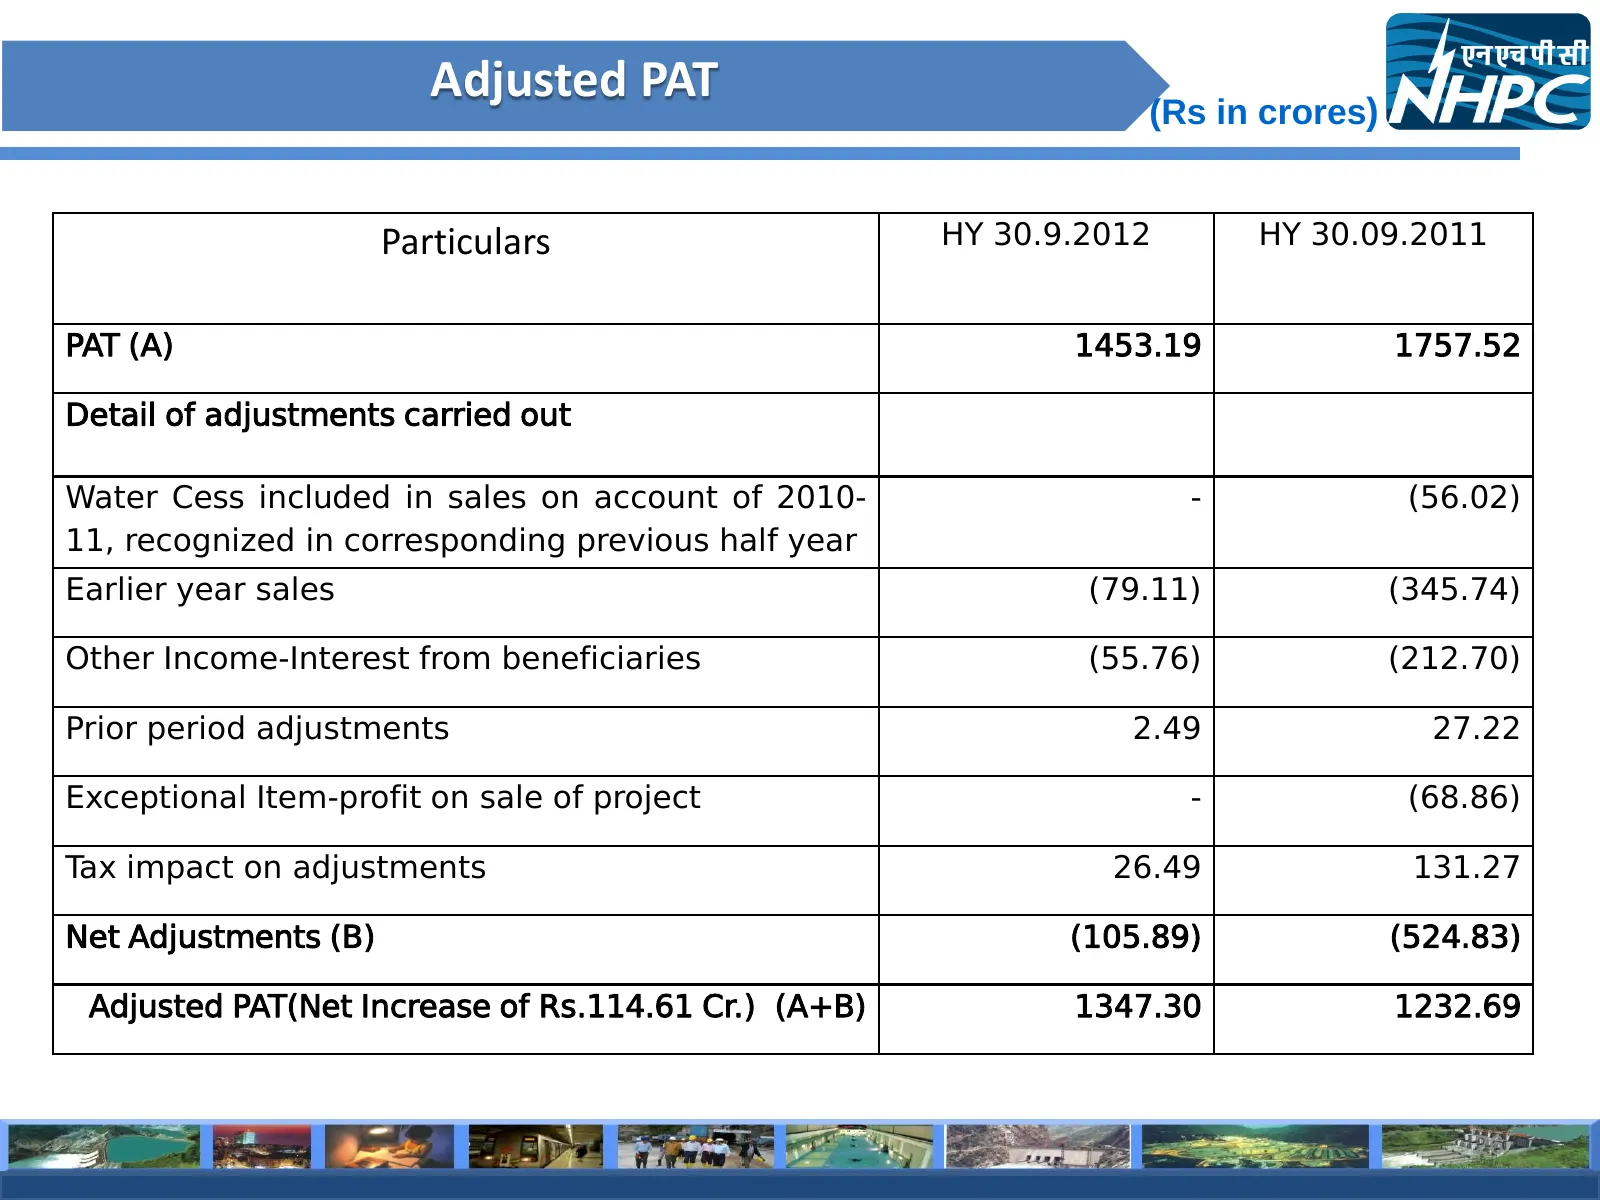
Adjusted PAT (Rs in crores) Particulars HY 30.9.2012 HY 30.09.2011 PAT (A) 1453.19 1757.52 Detail of adjustments carried out Water Cess included in sales on account of 2010- - (56.02) 11, recognized in corresponding previous half year Earlier year sales (79.11) (345.74) Other Income-Interest from be
Slide 27: Borrowings
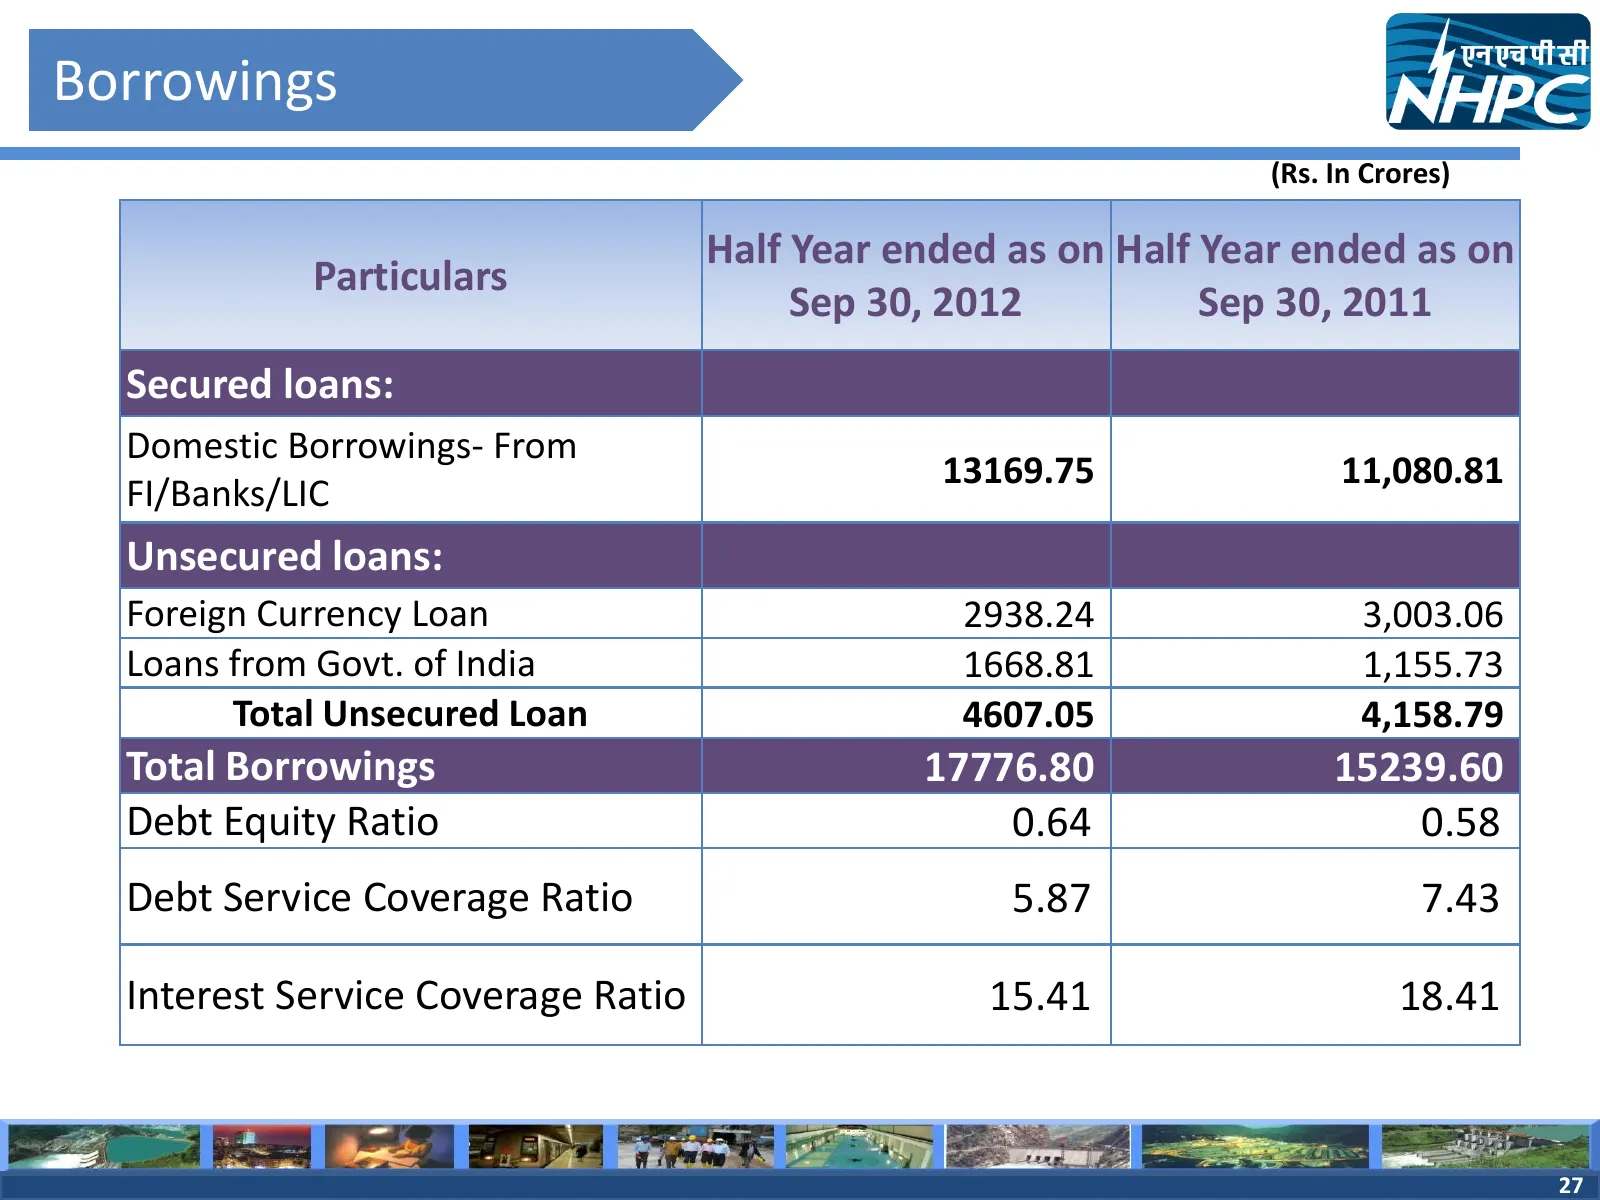
Borrowings (Rs. In Crores) Half Year ended as on Half Year ended as on Particulars Sep 30, 2012 Sep 30, 2011 Secured loans: Domestic Borrowings- From 13169.75 11,080.81 FI/Banks/LIC Unsecured loans: Foreign Currency Loan 2938.24 3,003.06 Loans from Govt. of India 1668.81 1,155.73 Total Unsecured Loa
Slide 28: Details of Incentives, Secondary Energy, UI Charges & PAF
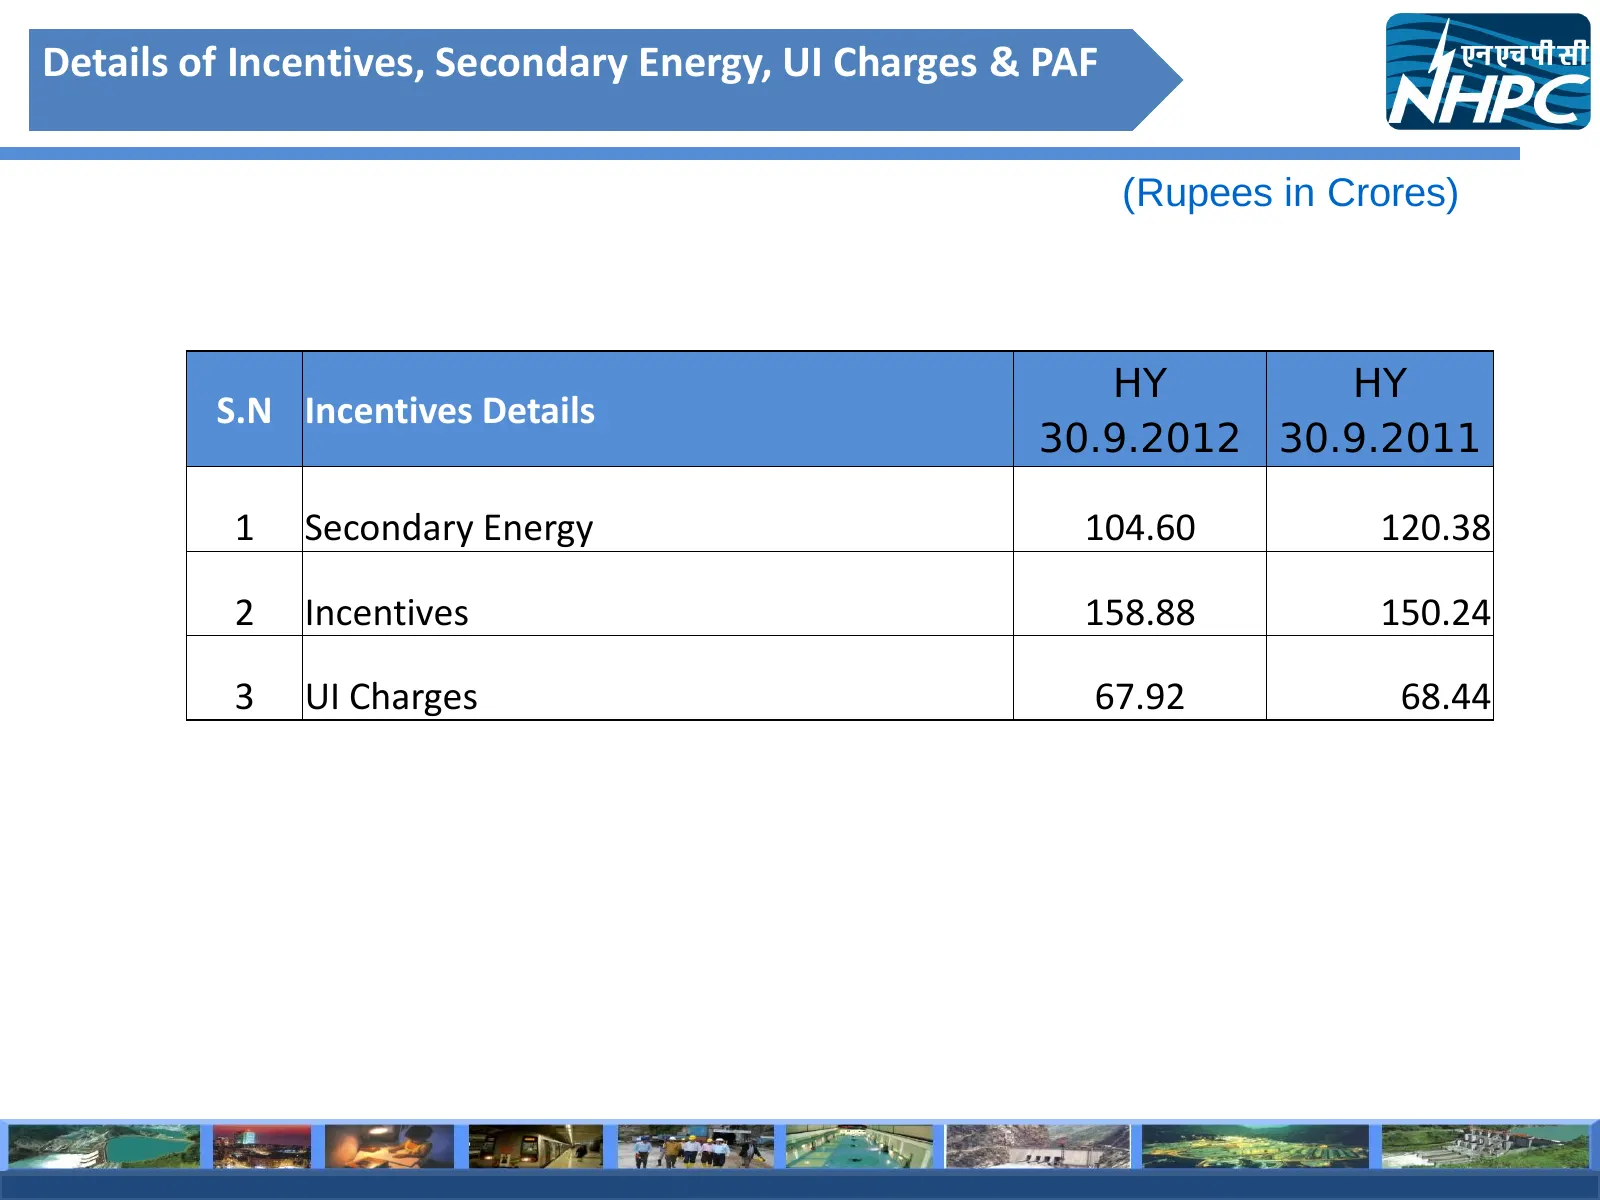
Details of Incentives, Secondary Energy, UI Charges & PAF (Rupees in Crores) HY HY S.N Incentives Details 30.9.2012 30.9.2011 1 Secondary Energy 104.60 120.38 2 Incentives 158.88 150.24 3 UI Charges 67.92 68.44 28
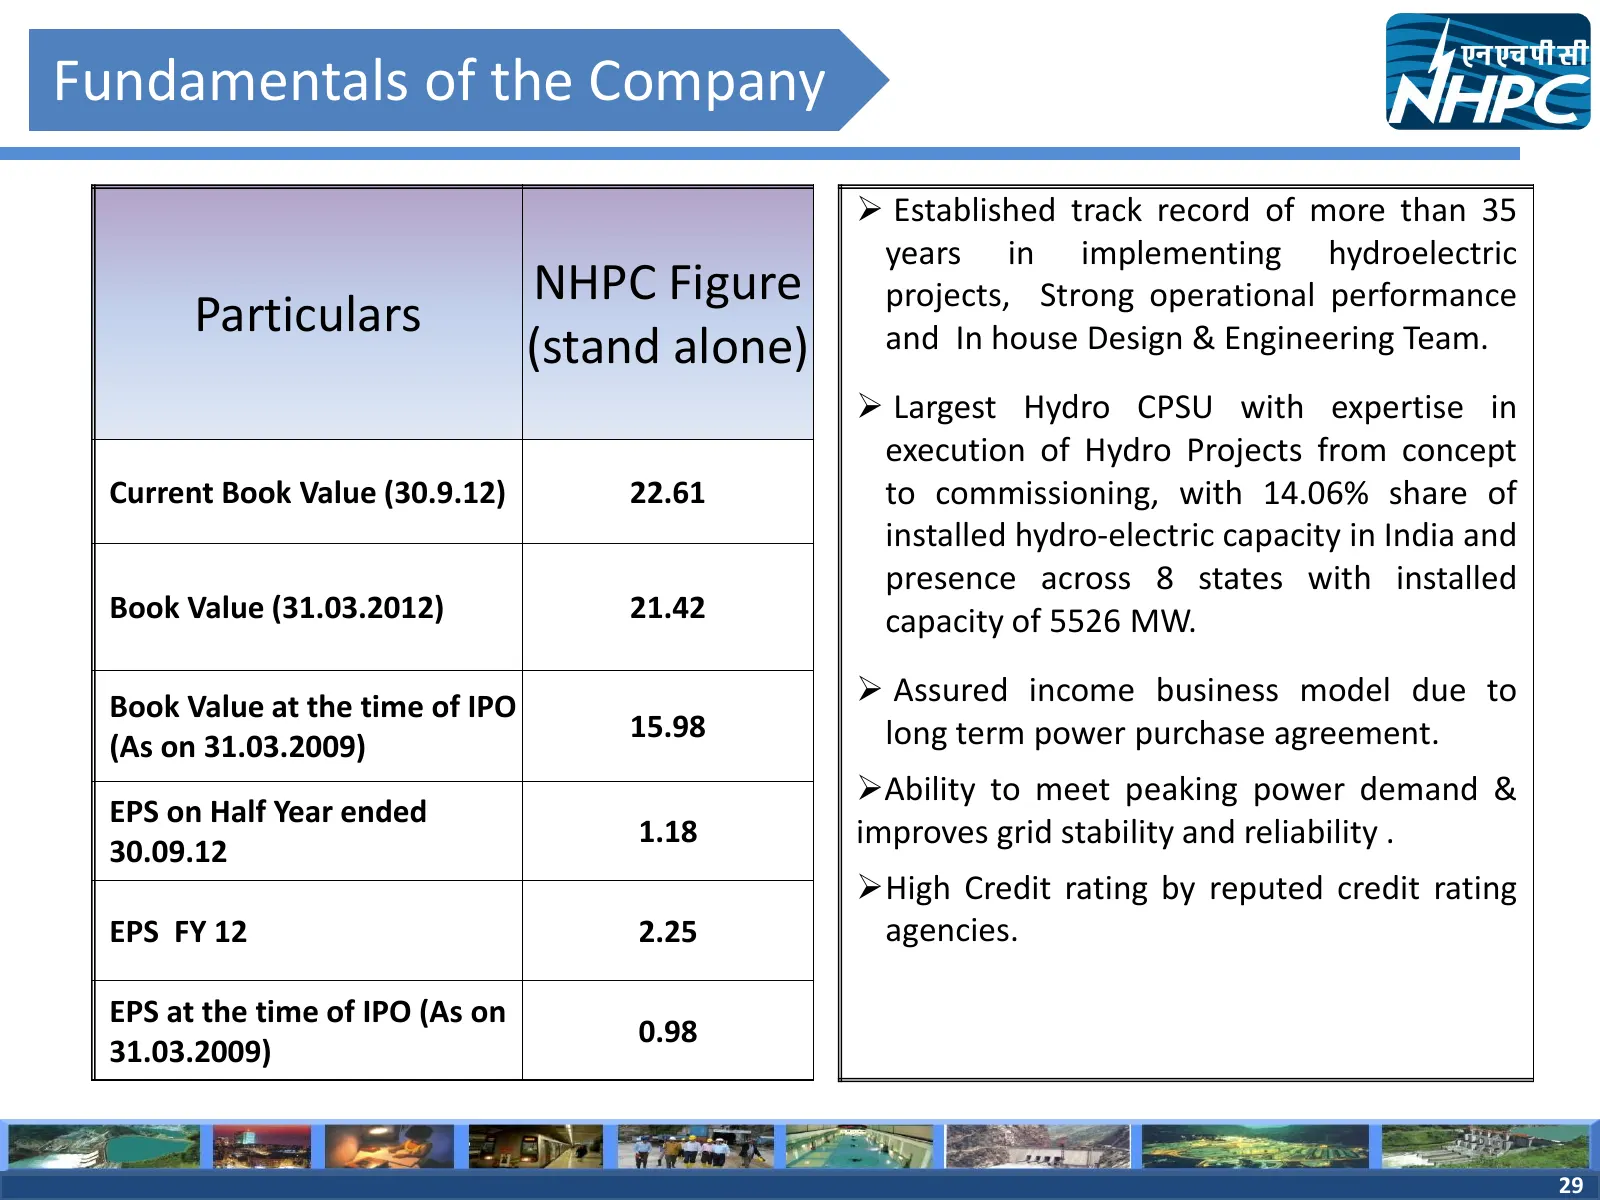
Slide 29: Fundamentals of the Company
Fundamentals of the Company Established track record of more than 35 years in implementing hydroelectric NHPC Figure projects, Strong operational performance Particulars and In house Design & Engineering Team. (stand alone) Largest Hydro CPSU with expertise in execution of Hydro Projects from co
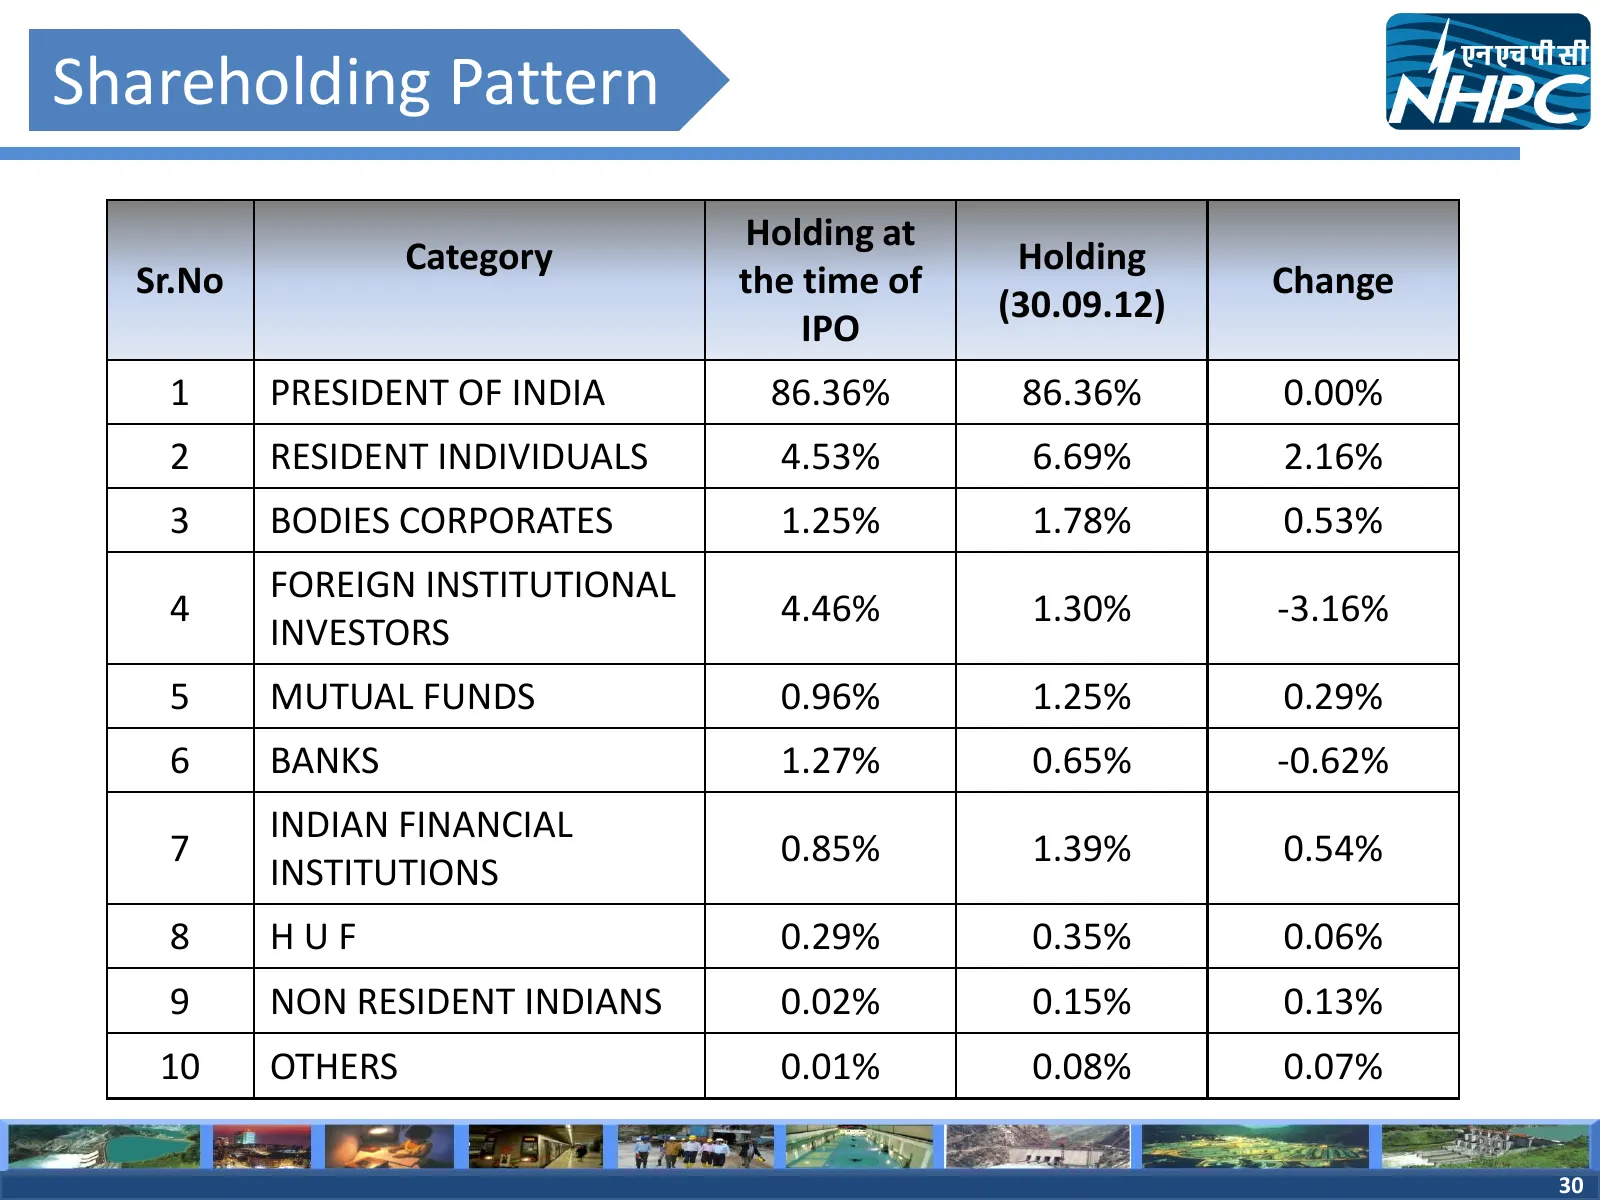
Slide 30: Shareholding Pattern
Shareholding Pattern Holding at Category Holding Sr.No the time of Change (30.09.12) IPO 1 PRESIDENT OF INDIA 86.36% 86.36% 0.00% 2 RESIDENT INDIVIDUALS 4.53% 6.69% 2.16% 3 BODIES CORPORATES 1.25% 1.78% 0.53% FOREIGN INSTITUTIONAL 4 4.46% 1.30% -3.16% INVESTORS 5 MUTUAL FUNDS 0.96% 1.25% 0.29% 6 BAN
Slide 31: Thank You
Thank You 31
Source: Internet Archive copy of nhpcindia.com
More decks from NHPC Limited
 Investor Presentation (June 2026)49 slides · June 2026
 Investor Presentation (March 2026)48 slides · March 2026
 Investor Presentation (December 2025)49 slides · December 2025
 Investor Presentation (September 2025)49 slides · September 2025
 Investor Presentation (June 2025)51 slides · June 2025
 Investor Presentation (May 2025)49 slides · May 2025