Horizon Bancorp, Inc. · NASDAQ:HBNC
Horizon Bancorp — Investor Presentation (July 2019)
48 slides from Horizon Bancorp's investor presentation, Jul 30, 2019
Slide 1: A NASDAQ Traded Company - Symbol HBNC
A NASDAQ Traded Company - Symbol HBNC July 30, 2019
Slide 2: Forward-Looking Statements
This presentation may contain forward-looking statements regarding the financial performance, business prospects, growth and operating strategies of Horizon Bancorp, Inc. and its affiliates (collectively, “Horizon”). For these statements, Horizon claims the protection of the safe harbor for forward-
Slide 3: Presenters: Craig Dwight and Mark Secor
Craig M. DwightChairman & Chief Executive OfficerMark E. SecorExecutive Vice President & Chief Financial Officer *
Slide 4: Dynamic Midwest Market
HORIZON‘ BANK Dynamic Midwest Market
Slide 5: Indiana and Michigan: The Right Side of Chicago
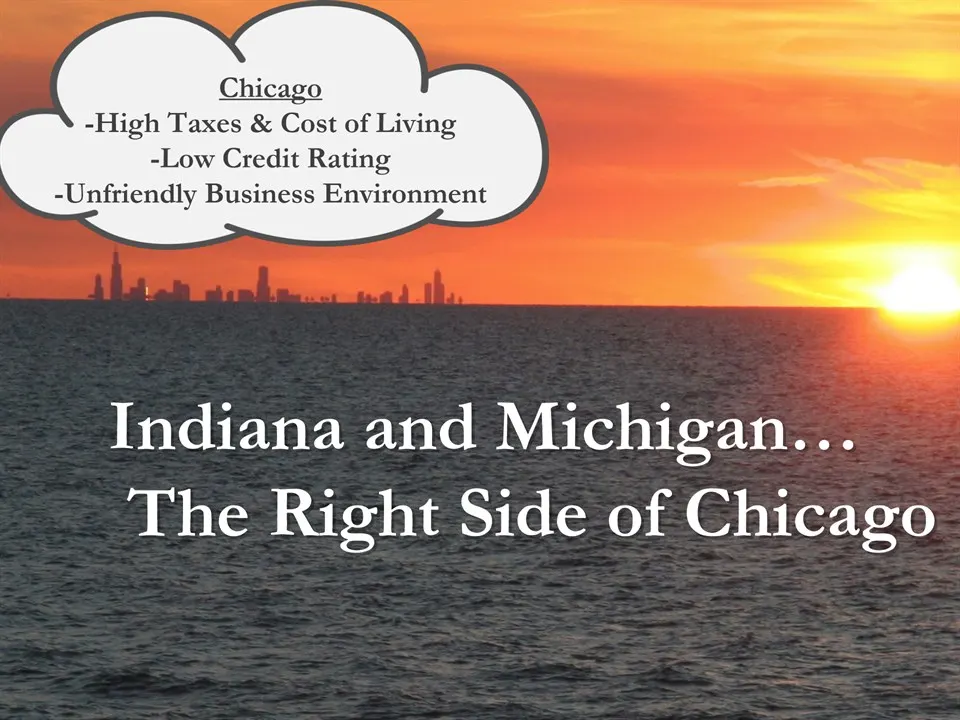
Indiana and Michigan… The Right Side of Chicago Chicago-High Taxes & Cost of Living-Low Credit Rating-Unfriendly Business Environment
Slide 6: Market Place Dynamics
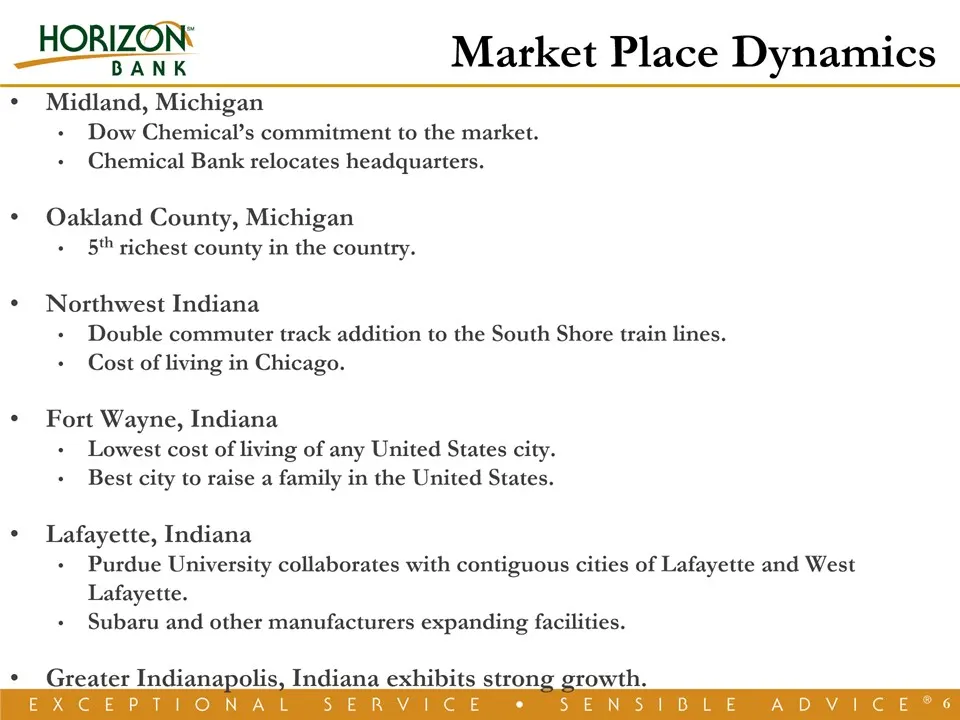
* Market Place Dynamics Midland, MichiganDow Chemical’s commitment to the market.Chemical Bank relocates headquarters.Oakland County, Michigan5th richest county in the country.Northwest IndianaDouble commuter track addition to the South Shore train lines.Cost of living in Chicago.Fort Wayne, Indiana
Slide 7: An Emerging Regional Bank
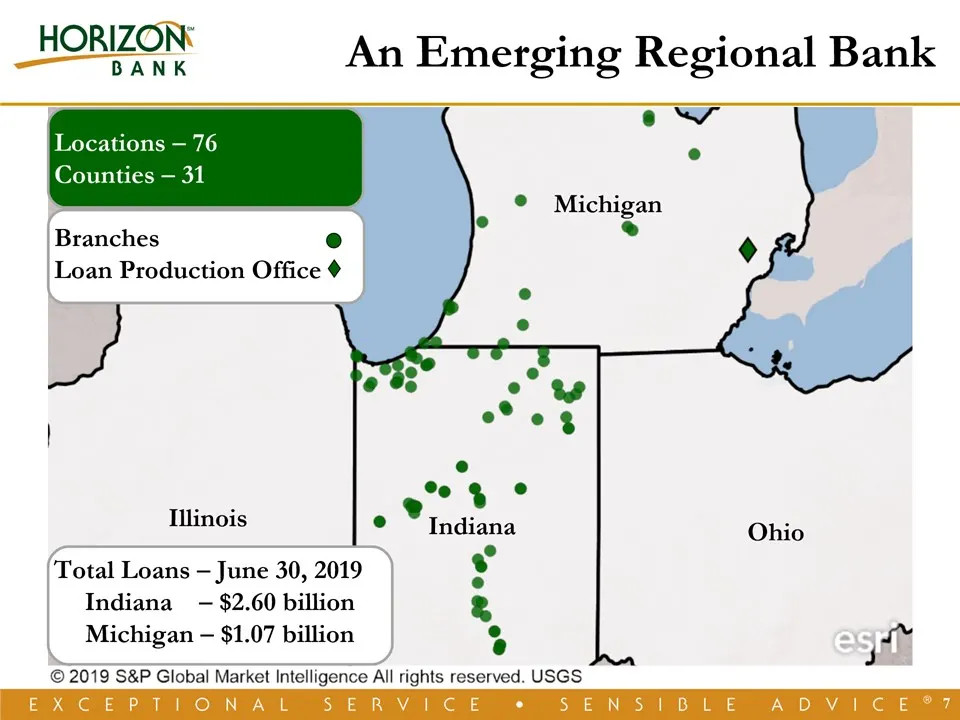
BranchesLoan Production Office * An Emerging Regional Bank Locations – 76Counties – 31 Michigan Indiana Ohio Illinois Total Loans – June 30, 2019Indiana – $2.60 billion Michigan – $1.07 billion
Slide 8: Proven Performance
HORIZON‘ BANK Proven Performance
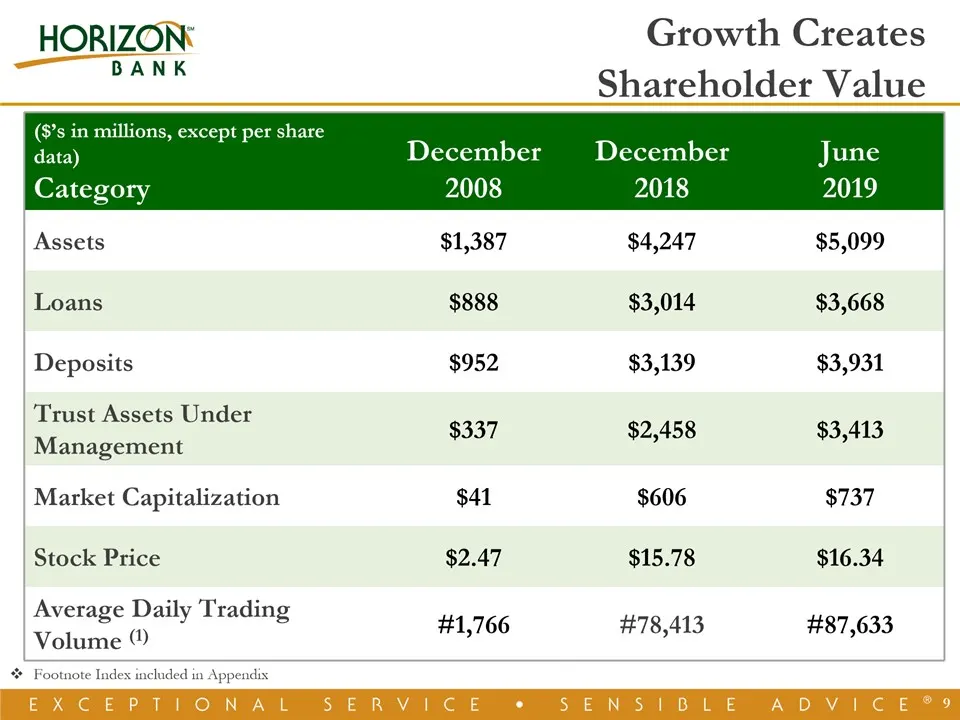
Slide 9: Growth Creates Shareholder Value
($’s in millions, except per share data)Category December2008 December2018 June2019 Assets $1,387 $4,247 $5,099 Loans $888 $3,014 $3,668 Deposits $952 $3,139 $3,931 Trust Assets Under Management $337 $2,458 $3,413 Market Capitalization $41 $606 $737 Stock Price $2.47 $15.78 $16.34 Average Daily Trad
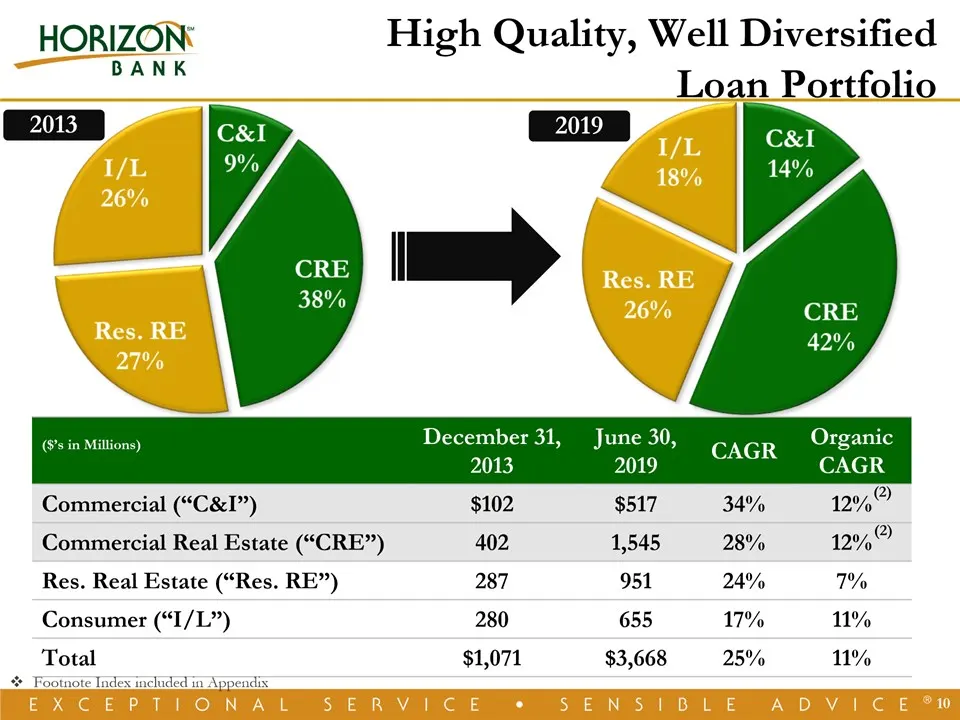
Slide 10: High Quality, Well Diversified Loan Portfolio
($’s in Millions) December 31, 2013 June 30, 2019 CAGR OrganicCAGR Commercial (“C&I”) $102 $517 34% 12% Commercial Real Estate (“CRE”) 402 1,545 28% 12% Res. Real Estate (“Res. RE”) 287 951 24% 7% Consumer (“I/L”) 280 655 17% 11% Total $1,071 $3,668 25% 11% * High Quality, Well Diversified Loan Port
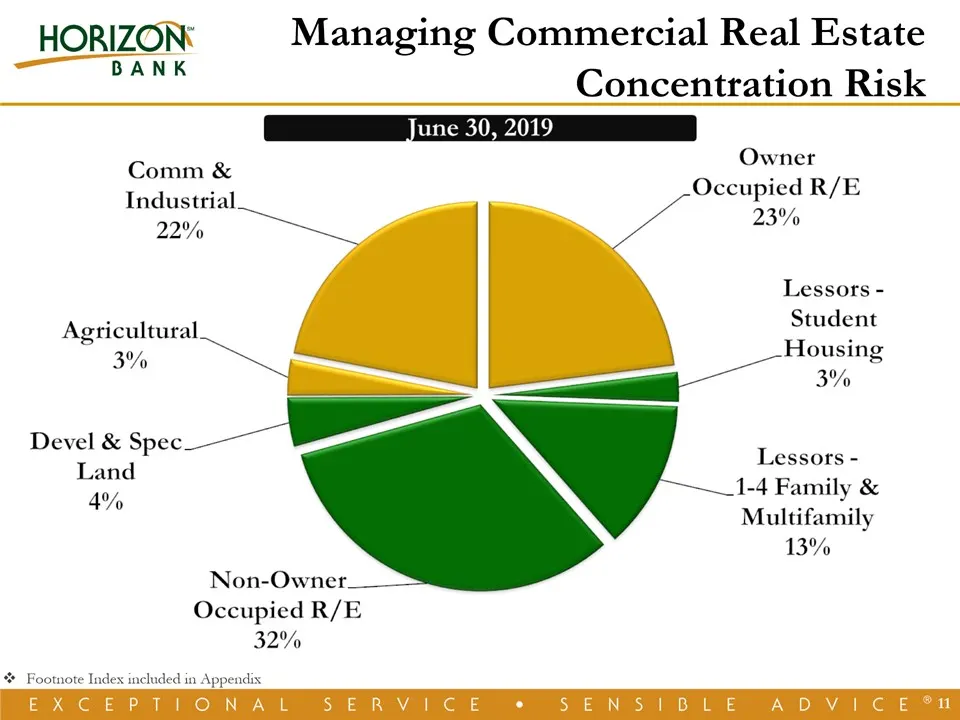
Slide 11: Managing Commercial Real Estate Concentration Risk
Managing Commercial Real Estate Concentration Risk December 31, 2017 * Footnote Index included in Appendix
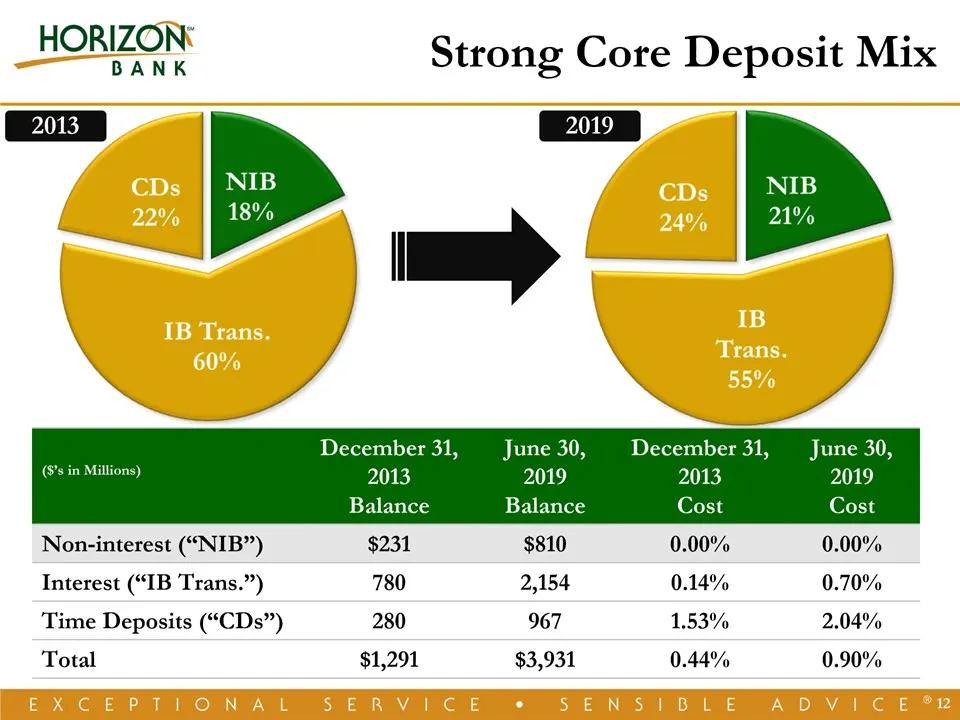
Slide 12: Strong Core Deposit Mix
($’s in Millions) December 31, 2013Balance June 30, 2019Balance December 31, 2013Cost June 30, 2019Cost Non-interest (“NIB”) $231 $810 0.00% 0.00% Interest (“IB Trans.”) 780 2,154 0.14% 0.70% Time Deposits (“CDs”) 280 967 1.53% 2.04% Total $1,291 $3,931 0.44% 0.90% * Strong Core Deposit Mix 2013 201
Slide 13: Low Cost Funding Mix
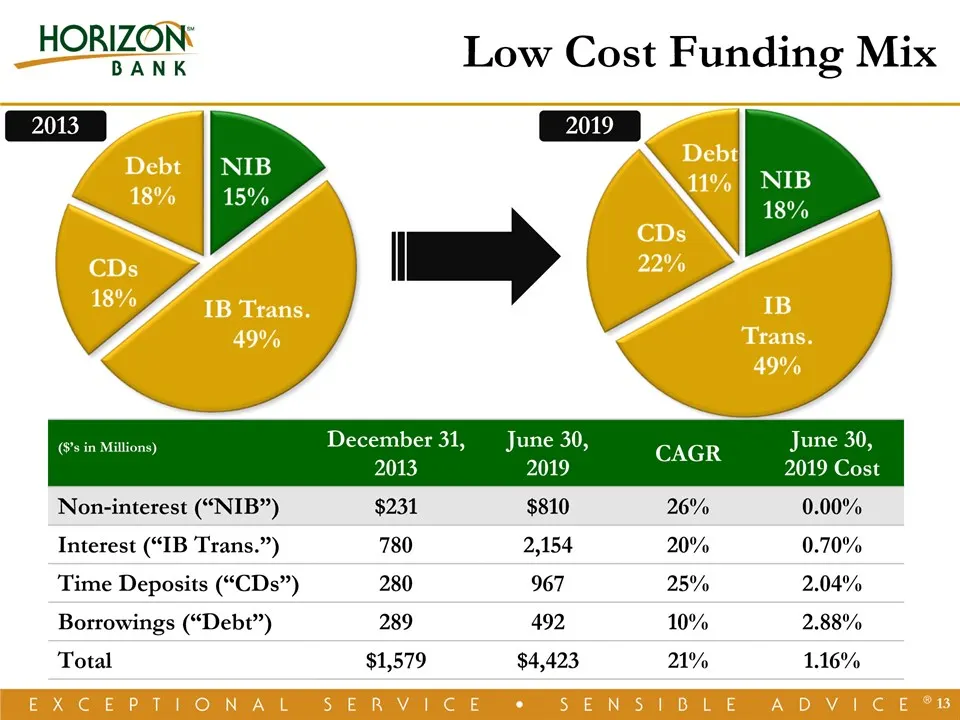
($’s in Millions) December 31, 2013 June 30, 2019 CAGR June 30, 2019 Cost Non-interest (“NIB”) $231 $810 26% 0.00% Interest (“IB Trans.”) 780 2,154 20% 0.70% Time Deposits (“CDs”) 280 967 25% 2.04% Borrowings (“Debt”) 289 492 10% 2.88% Total $1,579 $4,423 21% 1.16% * Low Cost Funding Mix 2013 2019
Slide 14: Stable Net Interest Margin
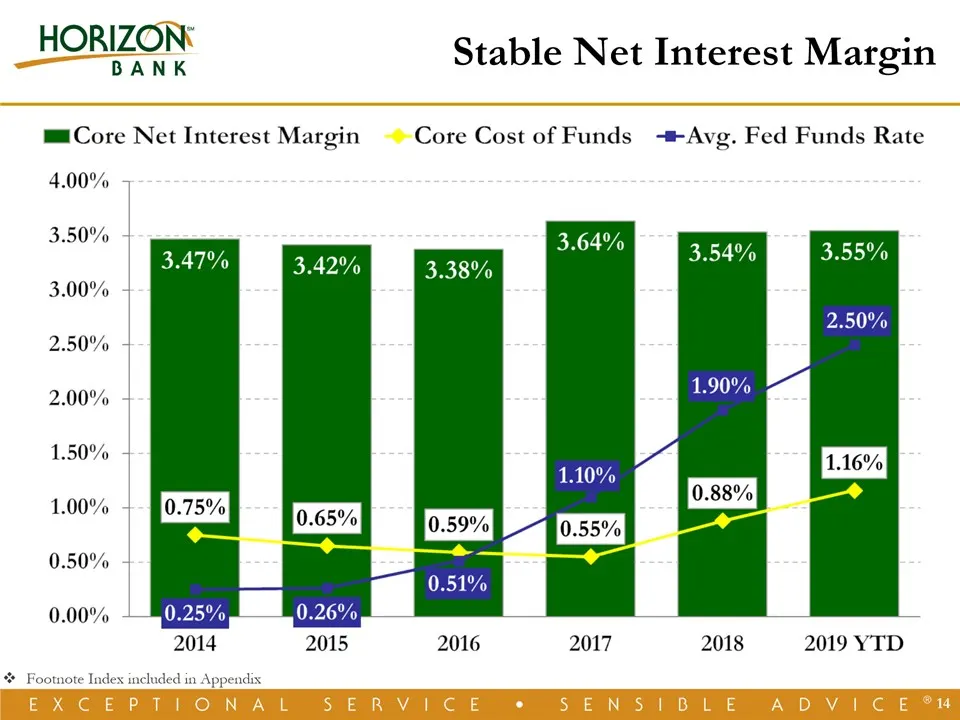
* Stable Net Interest Margin Footnote Index included in Appendix
Slide 15: Historical Earnings Demonstrates Ability to Execute
Historical EarningsDemonstrates Ability to Execute *
Slide 16: Focused & Consistent Revenue Streams
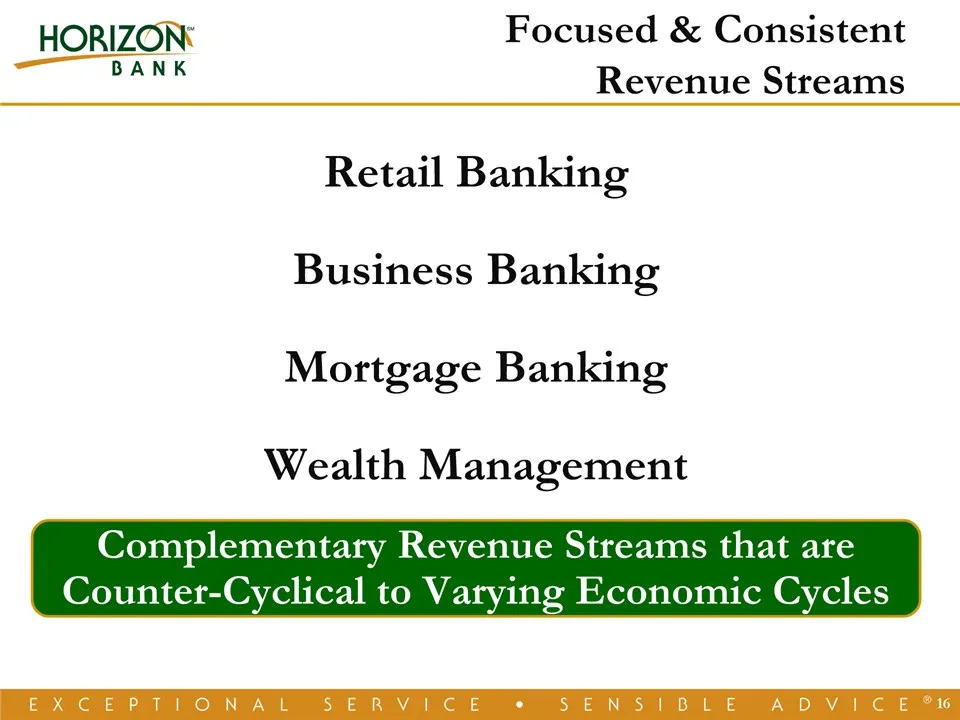
Retail BankingBusiness BankingMortgage BankingWealth Management Complementary Revenue Streams that are Counter-Cyclical to Varying Economic Cycles * Focused & Consistent Revenue Streams
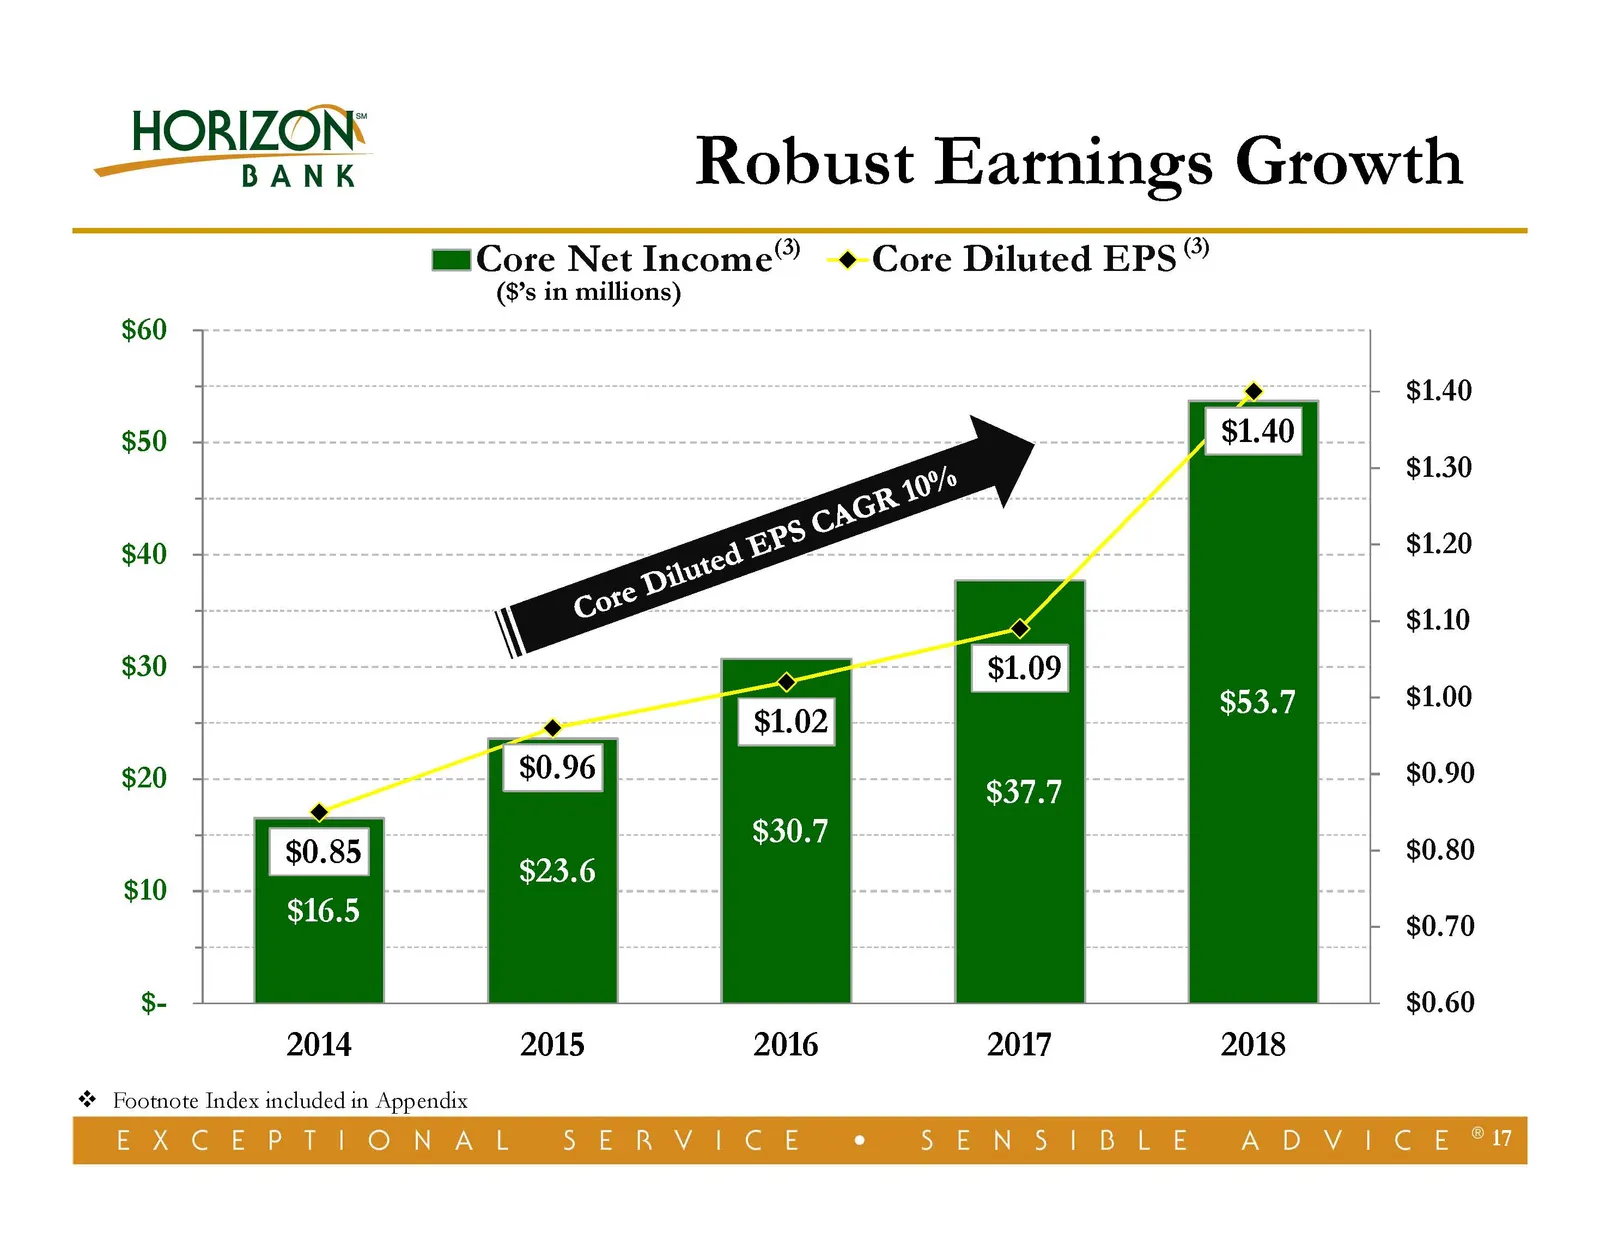
Slide 17: Robust Earnings Growth
HORIZON Robust Earnings Growth mu Core Net Income® -¢ Core Diluted EPS” ($’s in millions) $60 4 $1.40 $50 $1.30 $40 $1.20 $1.10 $30 $1.00 $20 $0.90 $0.80 $10 $0.70 $- $0.60 2014 2015 2016 2017 2018 “* Footnote Index included in Appendix EM (1E 1 yo @ IN A IE SER WEE oO SEM ST LE AN DW Te fe Saw
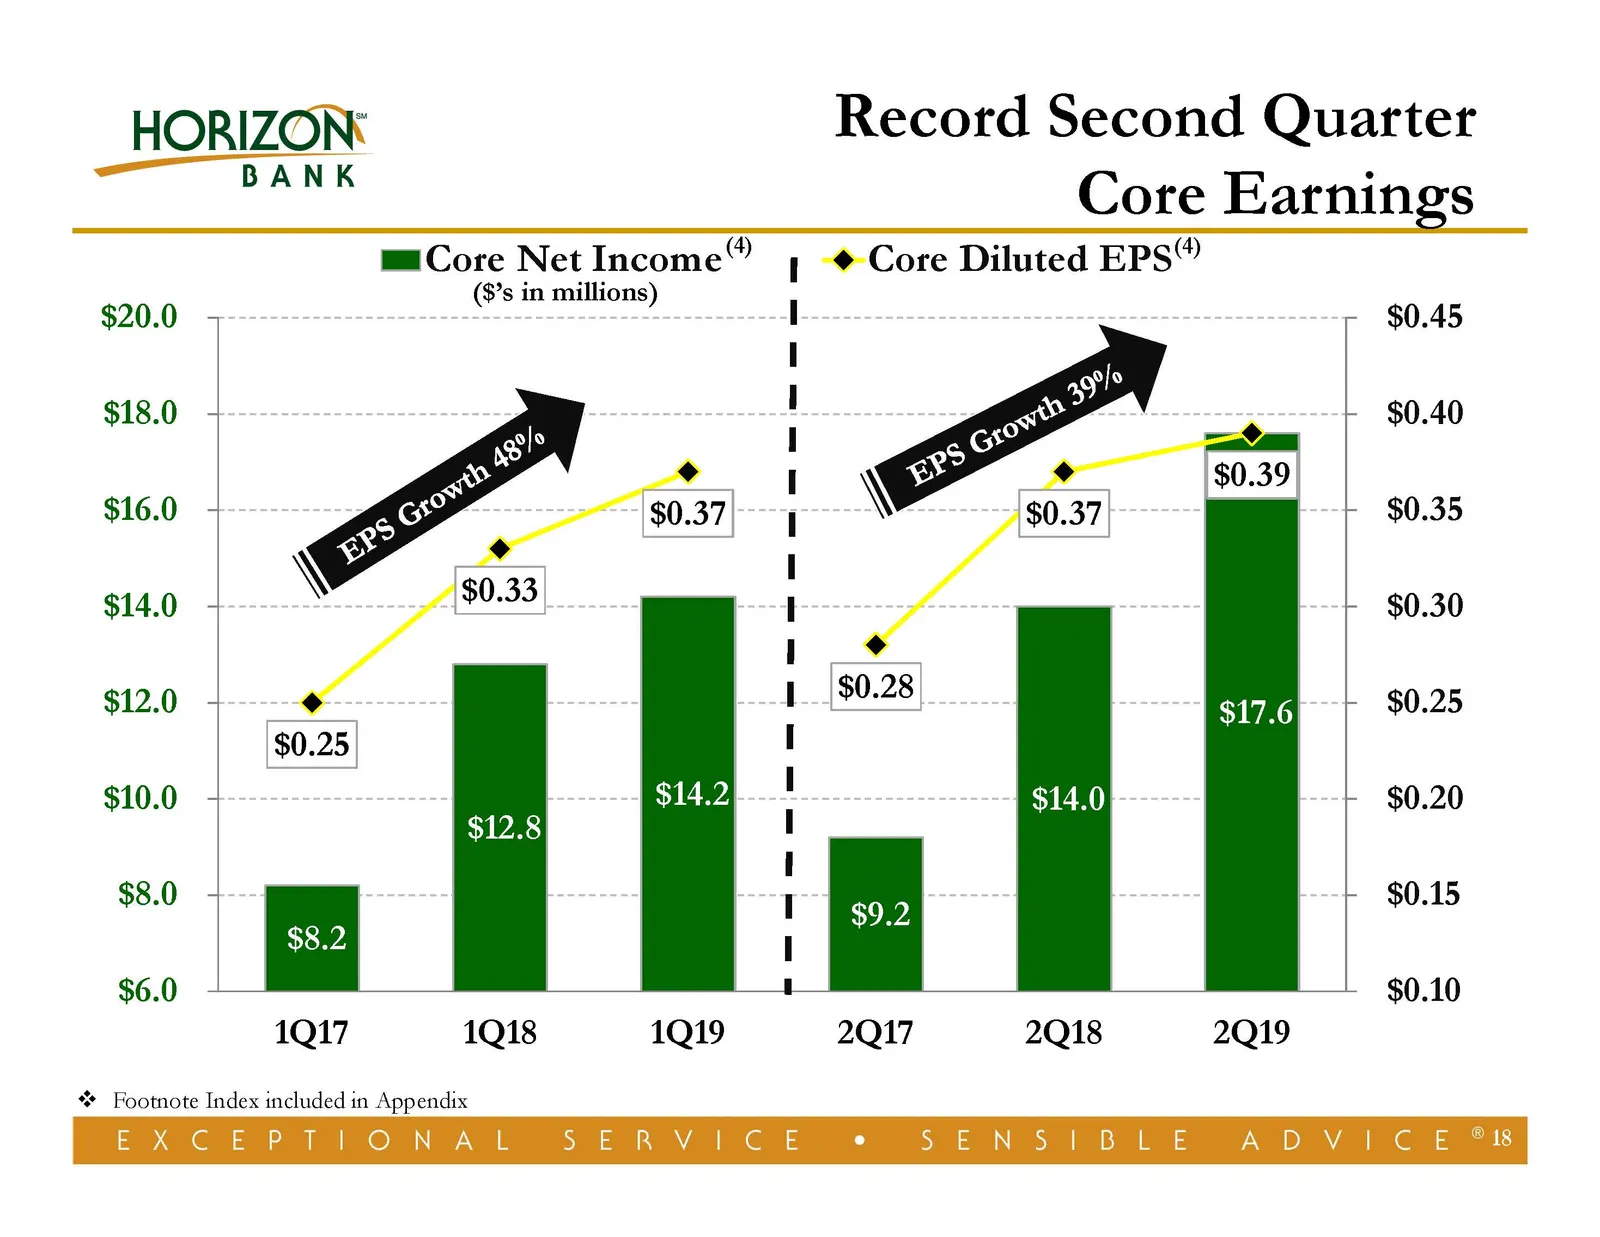
Slide 18: Record Second Quarter Core Earnings
HORIZON Record Second Quarter BANK ° Core Earnings mu Core Net Income” -@ Core Diluted EPS ($’s in millions) I $20.0 - I - $0.45 I $18.0 $0.40 I $16.0 , _ $0.35 I $14.0 I + $0.30 I $12.0 1 $0.28 17.6 I $10.0 $14.0 _ $0.20 | $8.0 902 _ $0.15 I $6.0 - ' | | $0.10 1Q17 1Q18 1Q19 2Q17 2Q18 2Q19 “* Footn
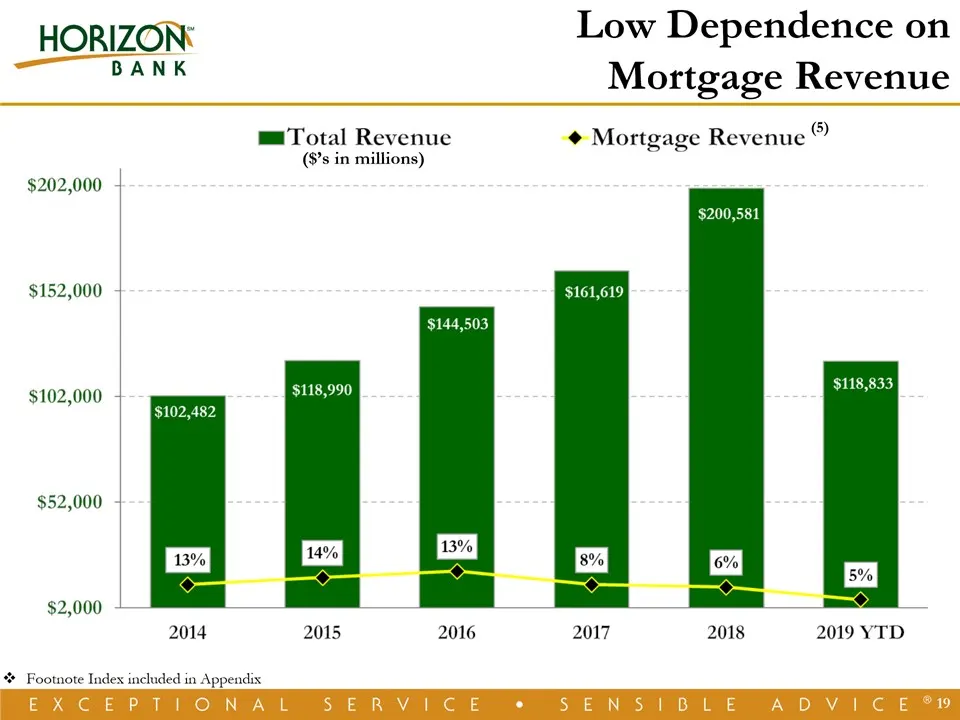
Slide 19: Low Dependence on Mortgage Revenue
* Low Dependence on Mortgage Revenue (5) Footnote Index included in Appendix ($’s in millions)
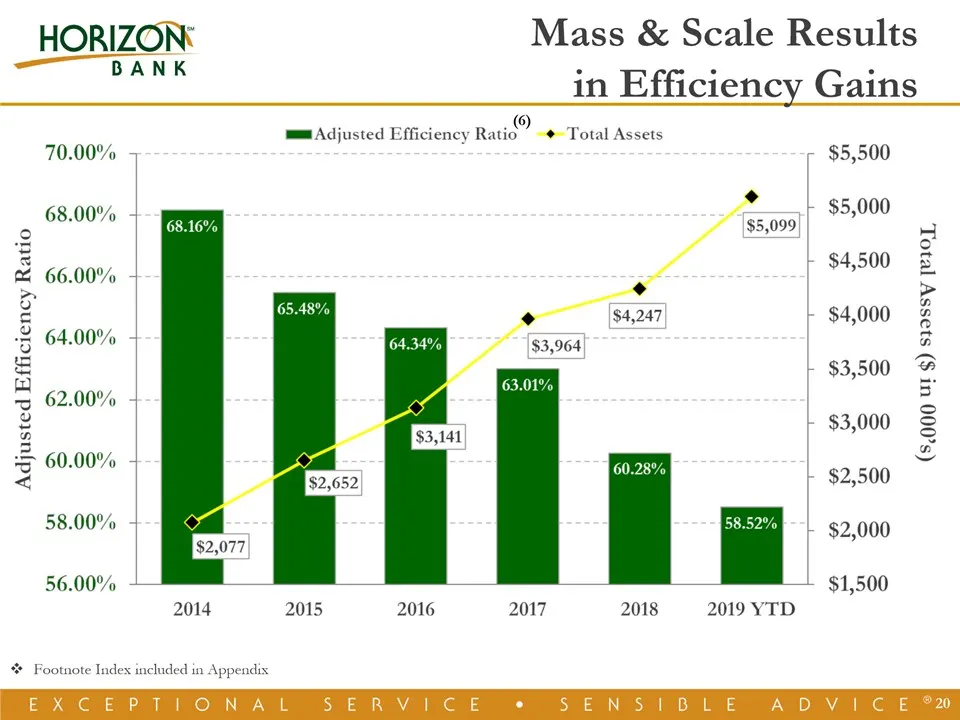
Slide 20: Mass & Scale Results in Efficiency Gains
* Mass & Scale Resultsin Efficiency Gains Footnote Index included in Appendix (6)
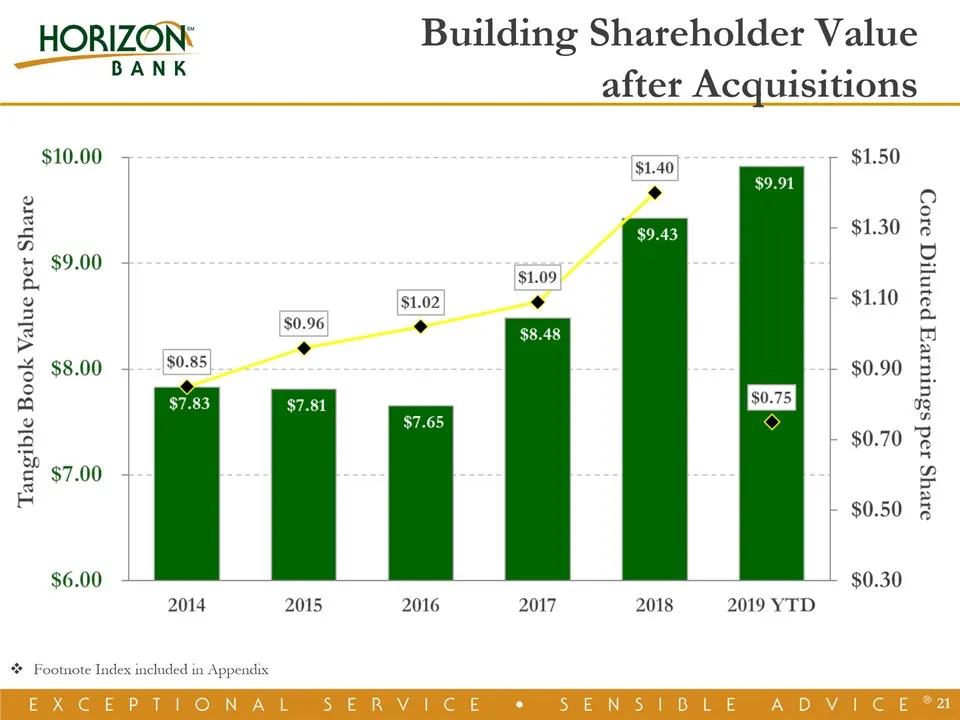
Slide 21: Building Shareholder Value after Acquisitions
* Building Shareholder Value after Acquisitions Footnote Index included in Appendix
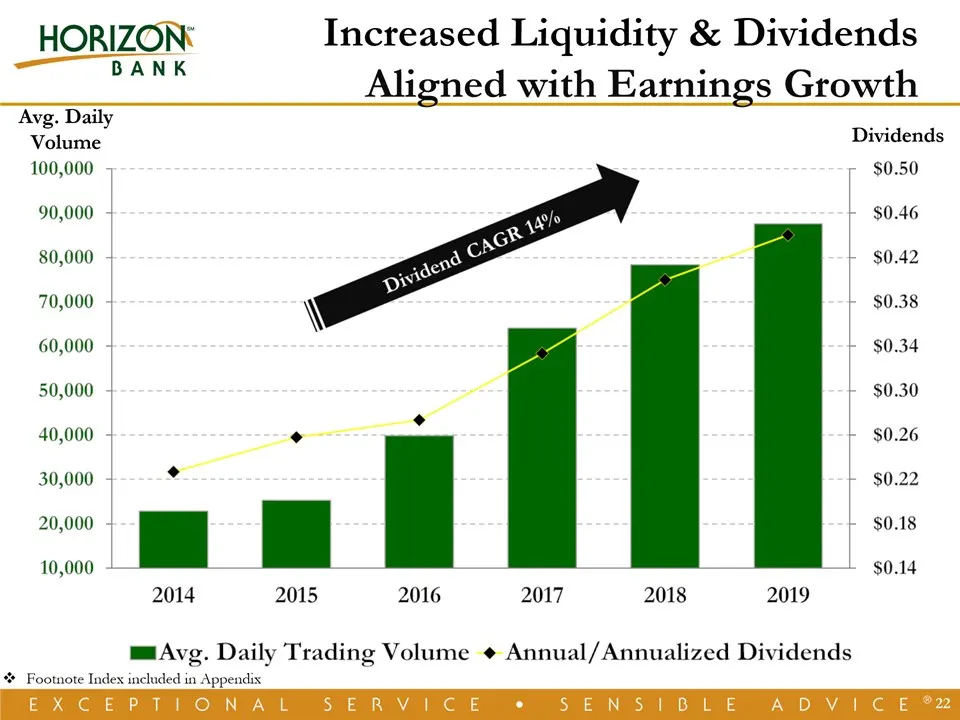
Slide 22: Increased Liquidity & Dividends Aligned with Earnings Growth
* Increased Liquidity & DividendsAligned with Earnings Growth Avg. Daily Volume Dividends Footnote Index included in Appendix
Slide 23: Salin Bancshares Adds Attractive Deposit & Growth Markets
Salin Bancshares, Inc.Adds Attractive Deposit & GrowthMarkets *
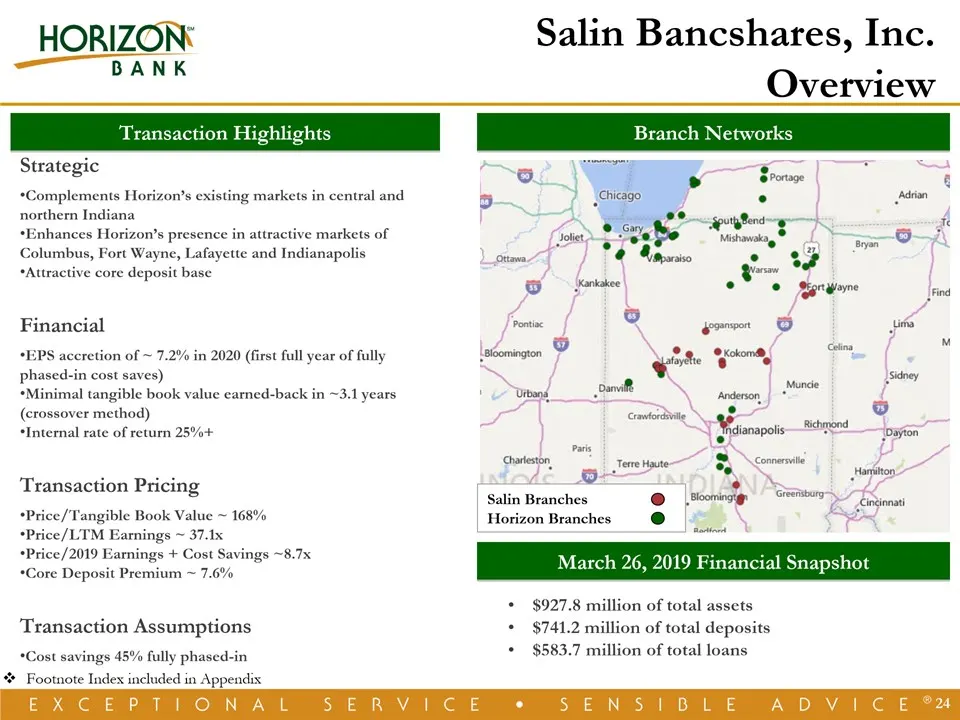
Slide 24: Salin Bancshares, Inc. Overview
* Salin Bancshares, Inc.Overview Branch Networks Salin BranchesHorizon Branches Transaction Highlights StrategicComplements Horizon’s existing markets in central and northern IndianaEnhances Horizon’s presence in attractive markets of Columbus, Fort Wayne, Lafayette and IndianapolisAttractive core d
Slide 25: Building Future Shareholder Value
Building Future Shareholder Value * GrowthOperational LeverageEnterprise Risk Management
Slide 26: Growth Markets and Future Markets
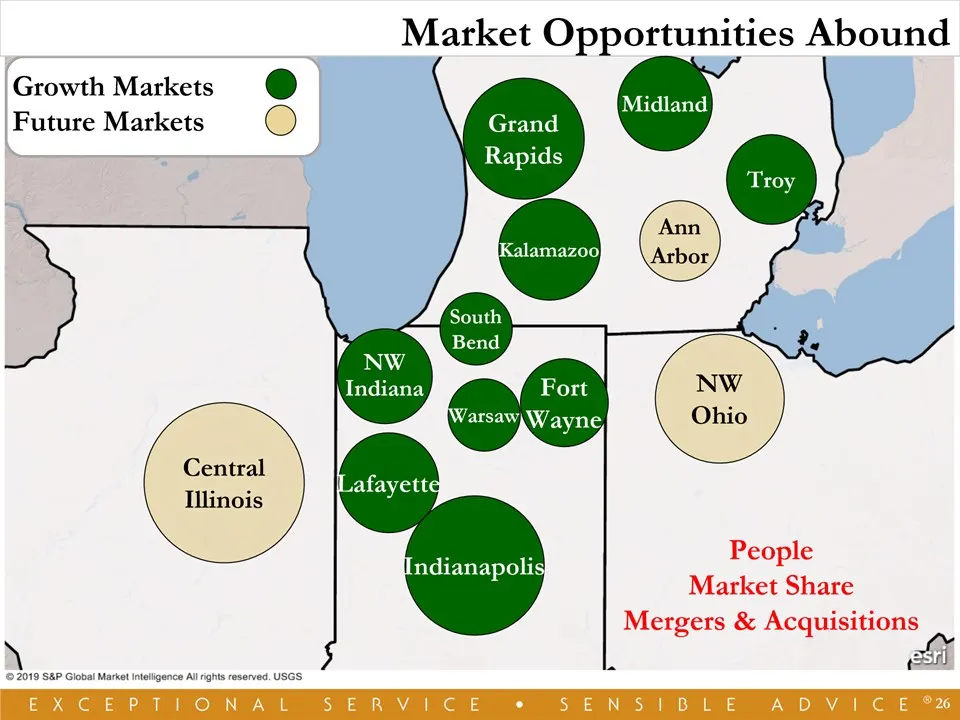
Growth MarketsFuture Markets * GrandRapids AnnArbor NWOhio FortWayne Lafayette Kalamazoo SouthBend Warsaw Indianapolis NWIndiana Market Opportunities Abound Midland Troy CentralIllinois PeopleMarket ShareMergers & Acquisitions
Slide 27: Considerable Opportunities to Gain Market Share
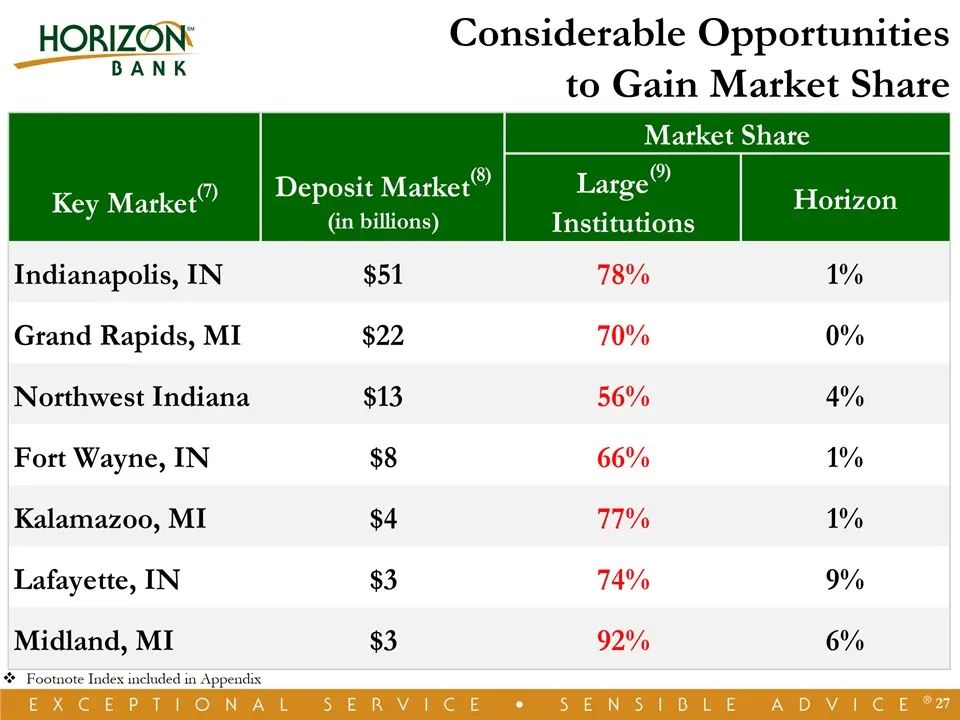
Considerable Opportunitiesto Gain Market Share * Footnote Index included in Appendix
Slide 28: Proven Ability to Capitalize
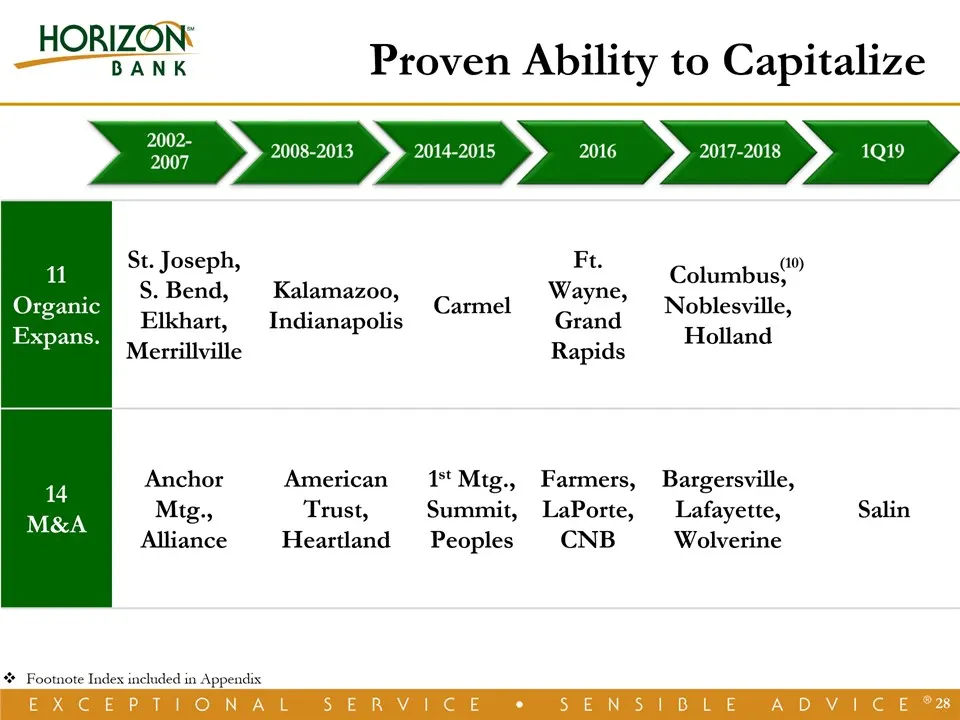
Proven Ability to Capitalize * Footnote Index included in Appendix 11OrganicExpans. St. Joseph,S. Bend,Elkhart,Merrillville Kalamazoo,Indianapolis Carmel Ft. Wayne,Grand Rapids Columbus, Noblesville,Holland 14M&A Anchor Mtg.,Alliance American Trust,Heartland 1st Mtg.,Summit,Peoples Farmers,LaPorte,C
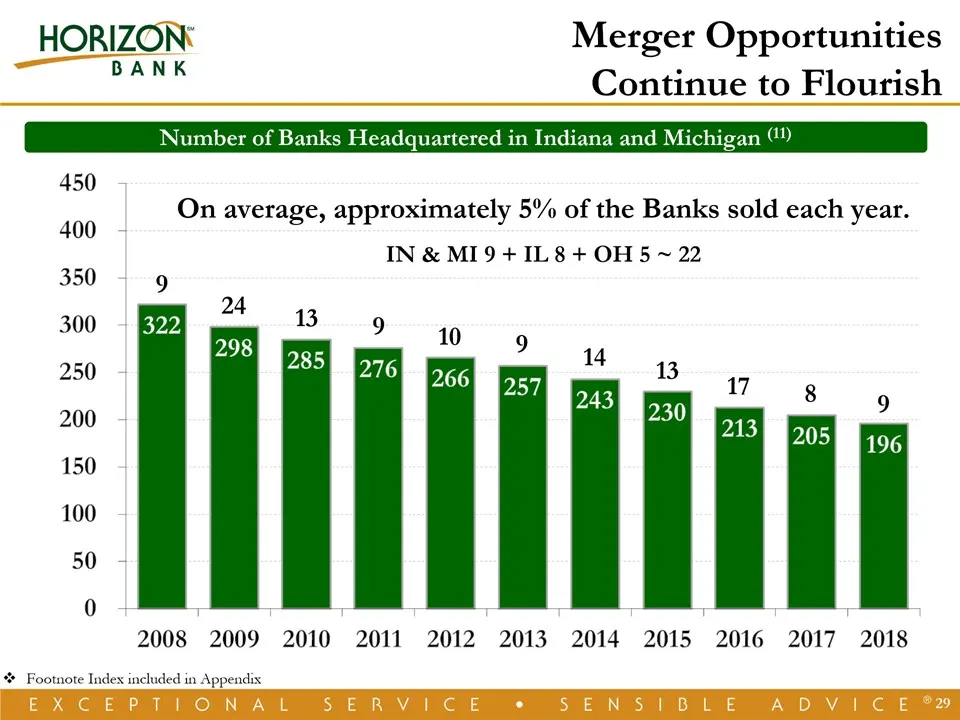
Slide 29: Merger Opportunities Continue to Flourish
* Number of Banks Headquartered in Indiana and Michigan (11) Merger OpportunitiesContinue to Flourish On average, approximately 5% of the Banks sold each year.IN & MI 9 + IL 8 + OH 5 ~ 22 Footnote Index included in Appendix 9 24 13 9 10 9 14 13 17 8 9
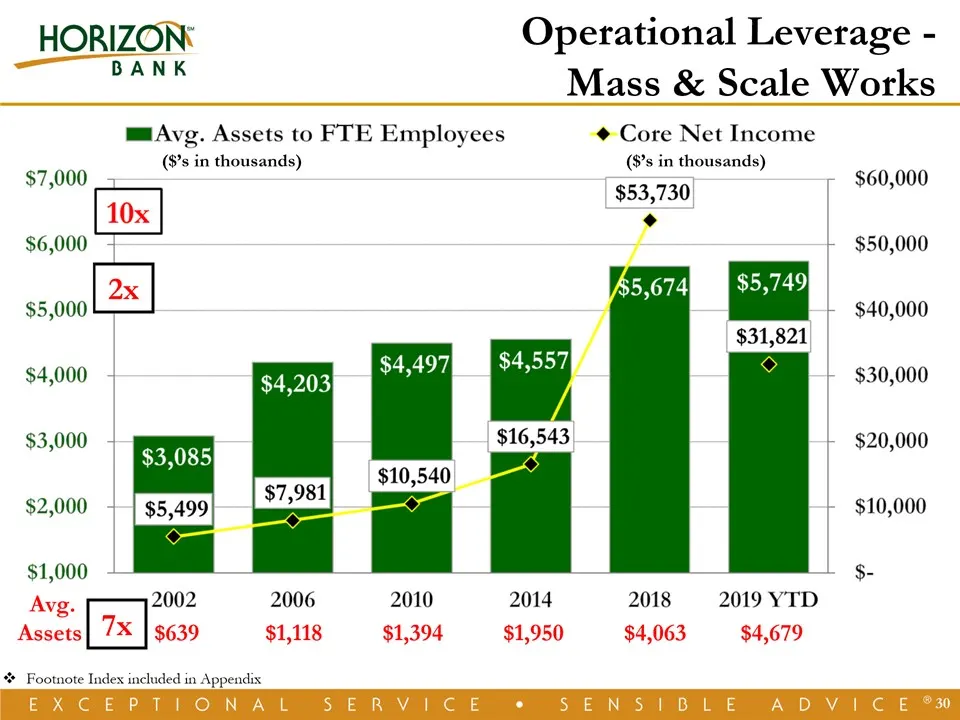
Slide 30: Operational Leverage - Mass & Scale Works
* Operational Leverage -Mass & Scale Works ($’s in thousands) ($’s in thousands) Avg. Assets $639 $1,118 $1,394 $1,950 $4,063 $4,679 7x 2x Footnote Index included in Appendix
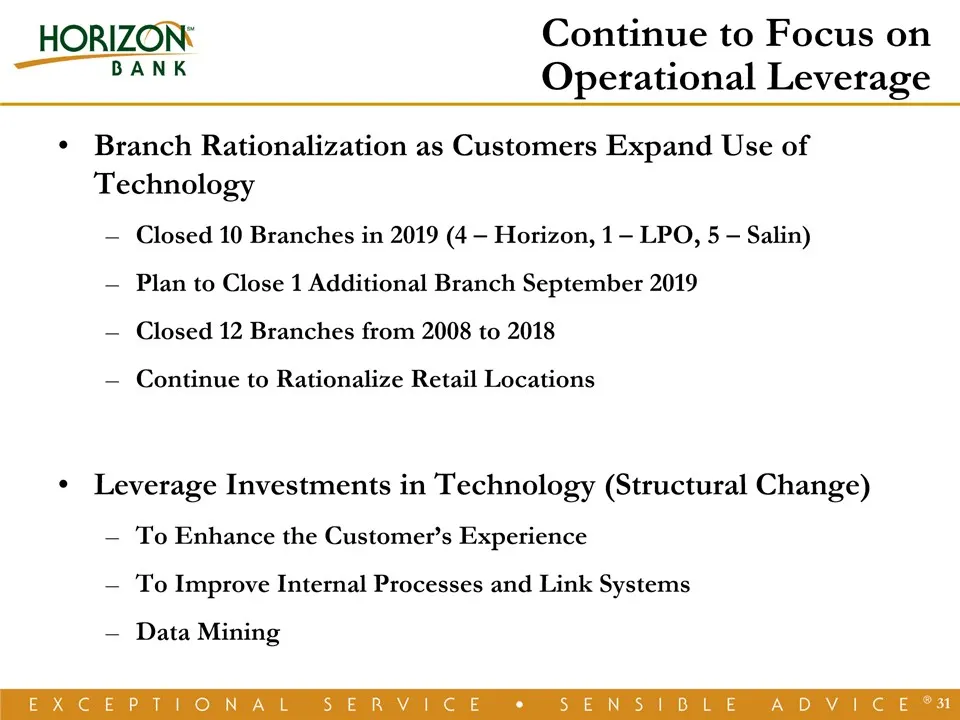
Slide 31: Continue to Focus on Operational Leverage
Branch Rationalization as Customers Expand Use of TechnologyClosed 10 Branches in 2019 (4 – Horizon, 1 – LPO, 5 – Salin)Plan to Close 1 Additional Branch September 2019Closed 12 Branches from 2008 to 2018Continue to Rationalize Retail LocationsLeverage Investments in Technology (Structural Change)To
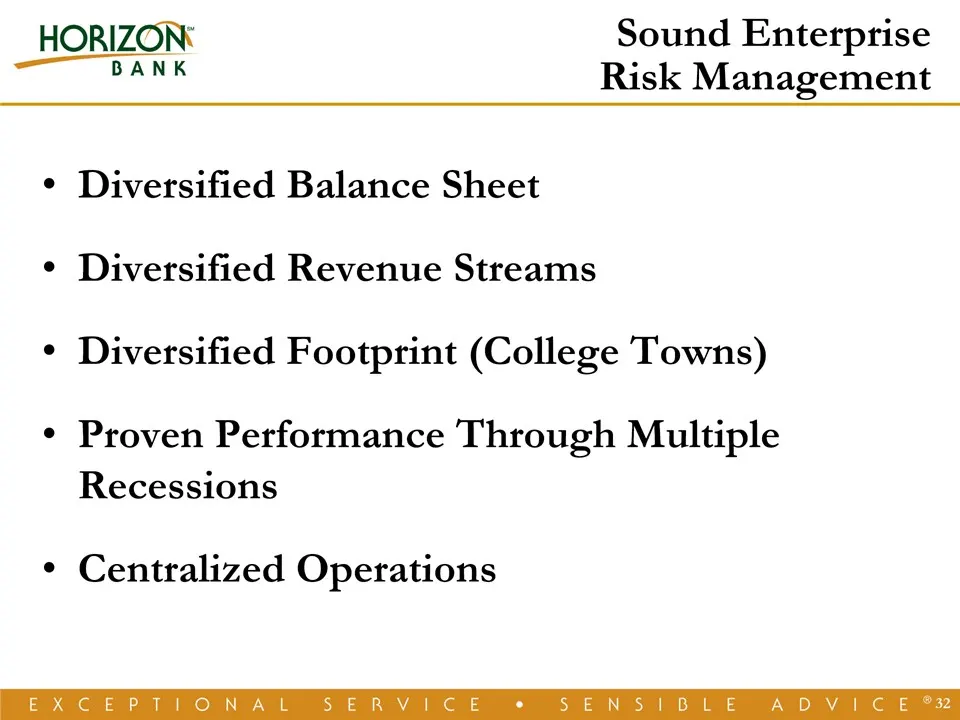
Slide 32: Sound Enterprise Risk Management
Diversified Balance SheetDiversified Revenue StreamsDiversified Footprint (College Towns)Proven Performance Through Multiple RecessionsCentralized Operations * Sound EnterpriseRisk Management
Slide 33: Why Invest in Horizon Bancorp, Inc.
Why Invest inHorizon Bancorp, Inc. *
Slide 34: Value Investment
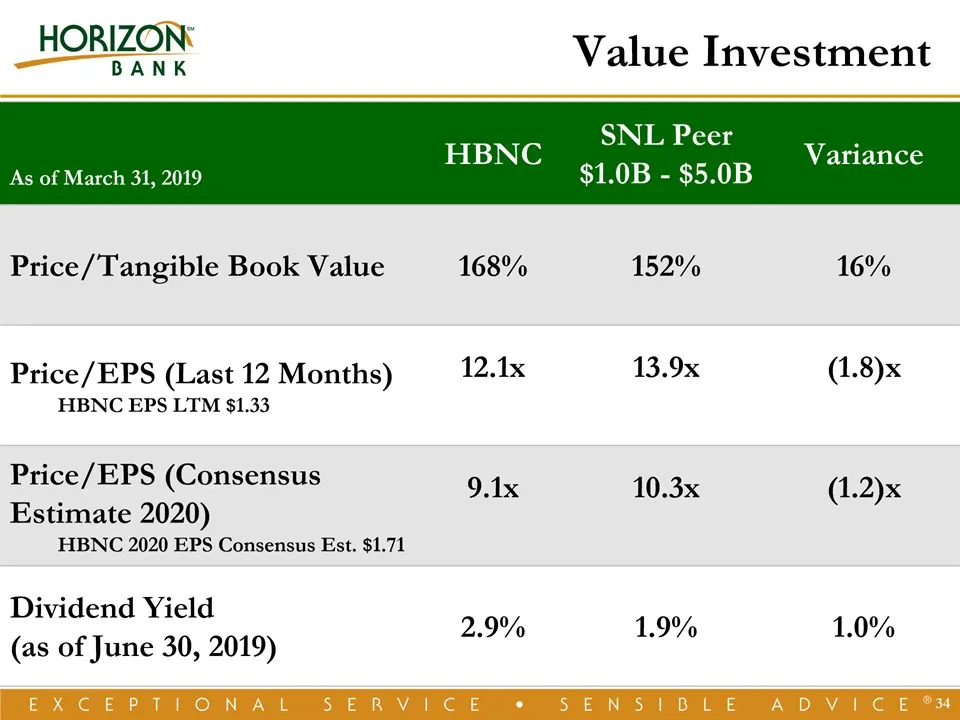
* Value Investment As of March 31, 2019 HBNC SNL Peer$1.0B - $5.0B Variance Price/Tangible Book Value 168% 152% 16% Price/EPS (Last 12 Months)HBNC EPS LTM $1.33 12.1x 13.9x (1.8)x Price/EPS (Consensus Estimate 2020)HBNC 2020 EPS Consensus Est. $1.71 9.1x 10.3x (1.2)x Dividend Yield (as of June 30, 2
Slide 35: Moving Towards the Sweet Spot of Efficiency
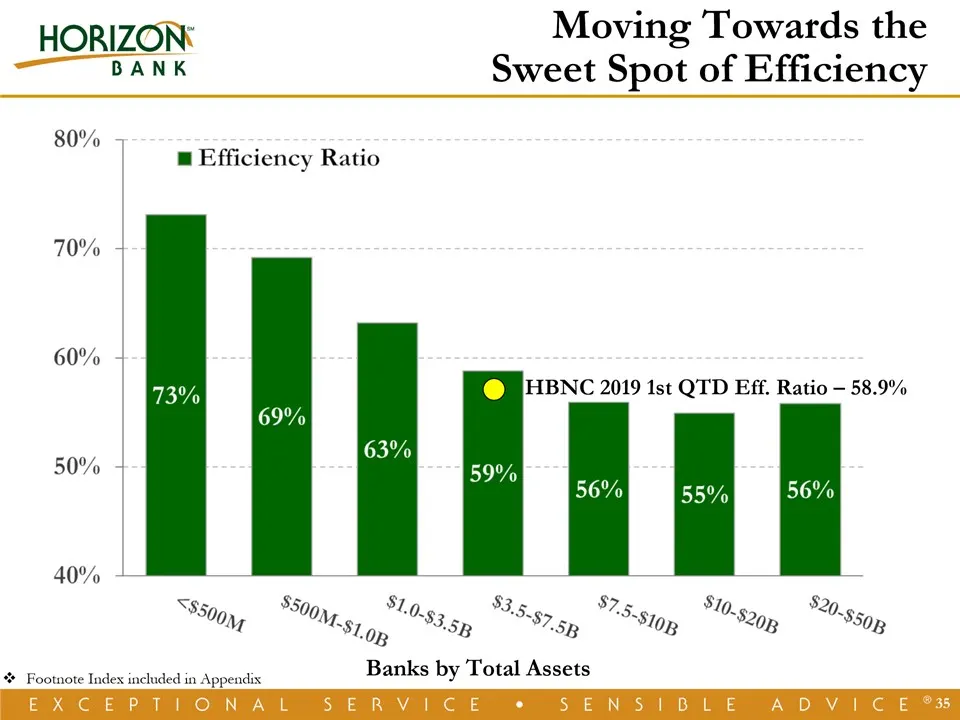
HBNC 2019 1st QTD Eff. Ratio – 58.9% * Moving Towards the Sweet Spot of Efficiency Banks by Total Assets Footnote Index included in Appendix
Slide 36: Value, Growth, Operational Leverage
* ValueGrowthOperational LeverageProven Ability to Execute the PlanSound Enterprise Risk Management
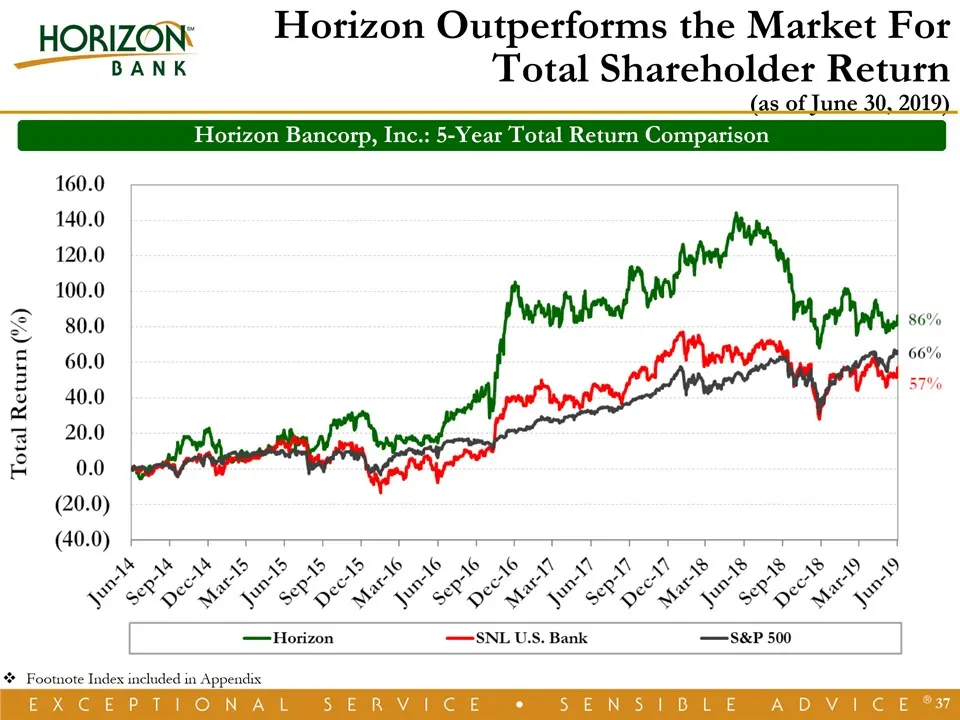
Slide 37: Horizon Outperforms the Market for Total Shareholder Return
Horizon Outperforms the Market For Total Shareholder Return(as of June 30, 2019) * Horizon Bancorp, Inc.: 5-Year Total Return Comparison Footnote Index included in Appendix
Slide 38: A NASDAQ Traded Company - Symbol HBNC
A NASDAQ Traded Company - Symbol HBNC
Slide 39: Appendix
HORIZON‘ _HORIZO! BANK Appendix EX Coe Pt ) O NA
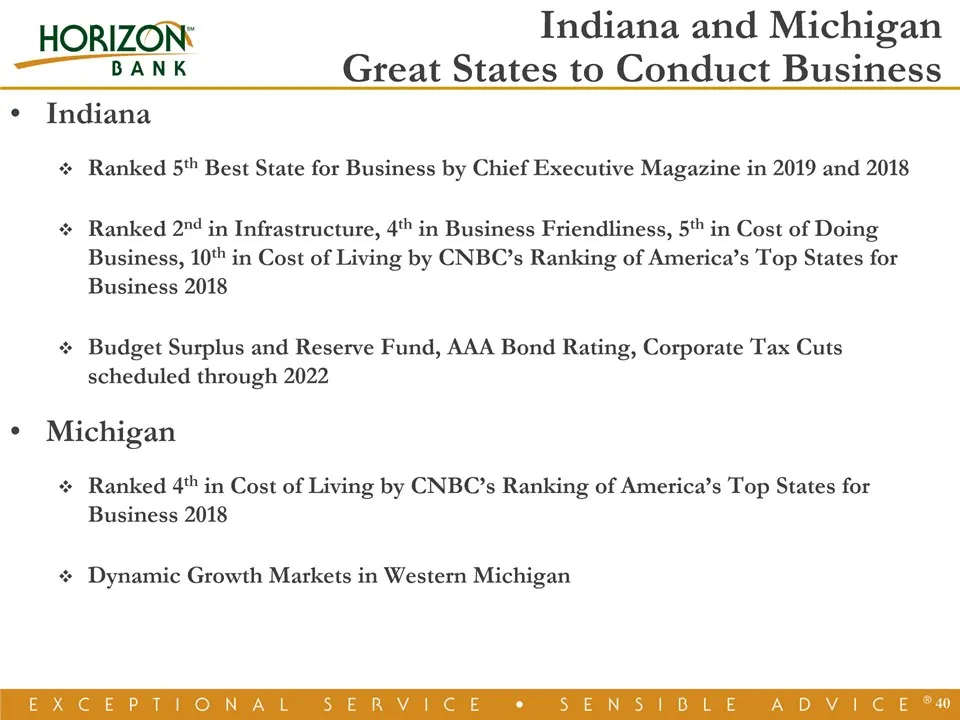
Slide 40: Indiana and Michigan: Great States to Conduct Business
IndianaRanked 5th Best State for Business by Chief Executive Magazine in 2019 and 2018Ranked 2nd in Infrastructure, 4th in Business Friendliness, 5th in Cost of Doing Business, 10th in Cost of Living by CNBC’s Ranking of America’s Top States for Business 2018Budget Surplus and Reserve Fund, AAA Bond
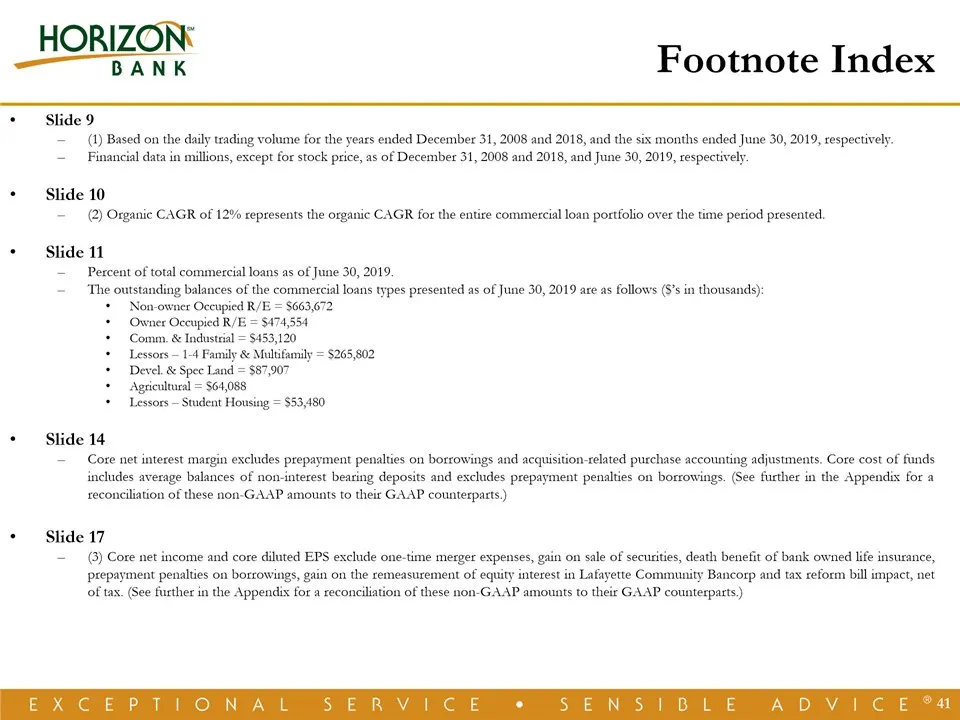
Slide 41: Footnote Index
* Footnote Index Slide 9(1) Based on the daily trading volume for the years ended December 31, 2008 and 2018, and the six months ended June 30, 2019, respectively.Financial data in millions, except for stock price, as of December 31, 2008 and 2018, and June 30, 2019, respectively. Slide 10(2) Organi
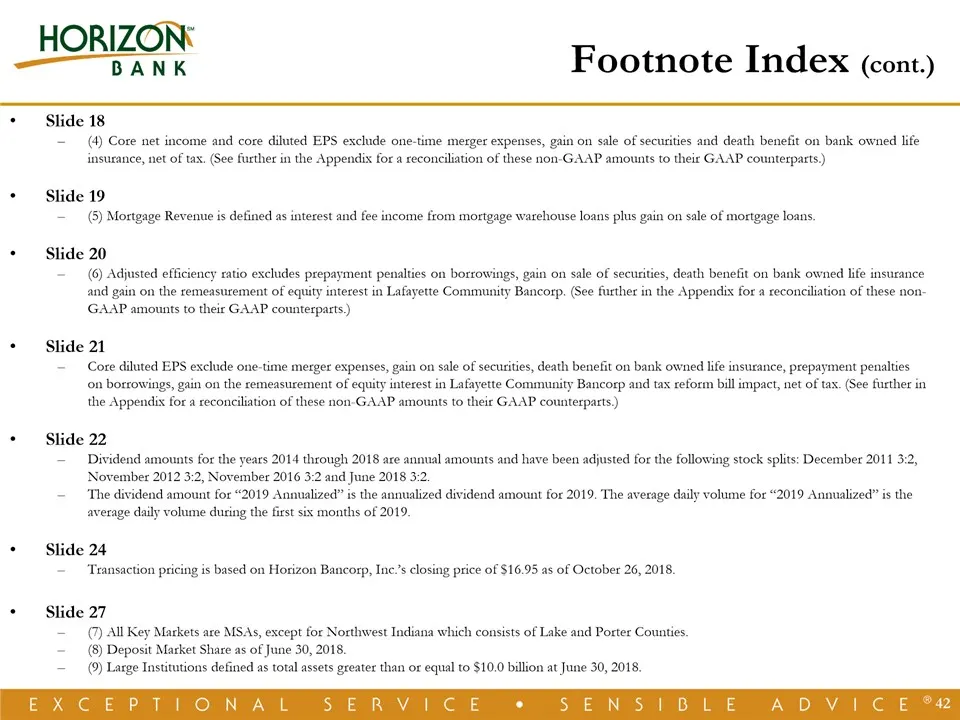
Slide 42: Footnote Index (cont.)
* Footnote Index (cont.) Slide 18(4) Core net income and core diluted EPS exclude one-time merger expenses, gain on sale of securities and death benefit on bank owned life insurance, net of tax. (See further in the Appendix for a reconciliation of these non-GAAP amounts to their GAAP counterparts.)S
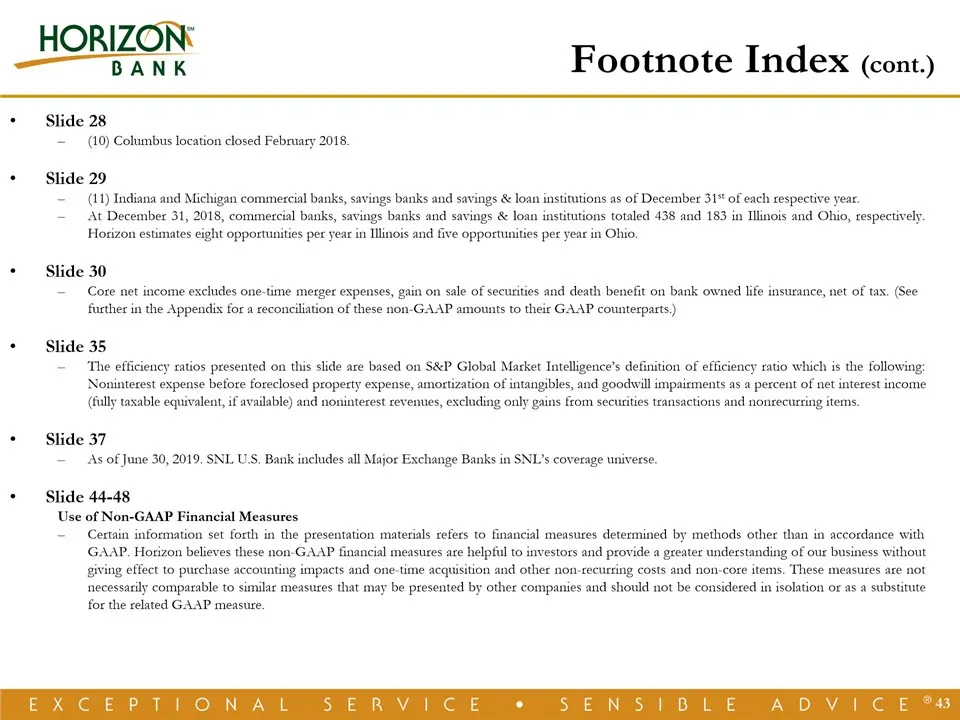
Slide 43: Footnote Index (cont.)
* Footnote Index (cont.) Slide 28(10) Columbus location closed February 2018.Slide 29(11) Indiana and Michigan commercial banks, savings banks and savings & loan institutions as of December 31st of each respective year.At December 31, 2018, commercial banks, savings banks and savings & loan institut
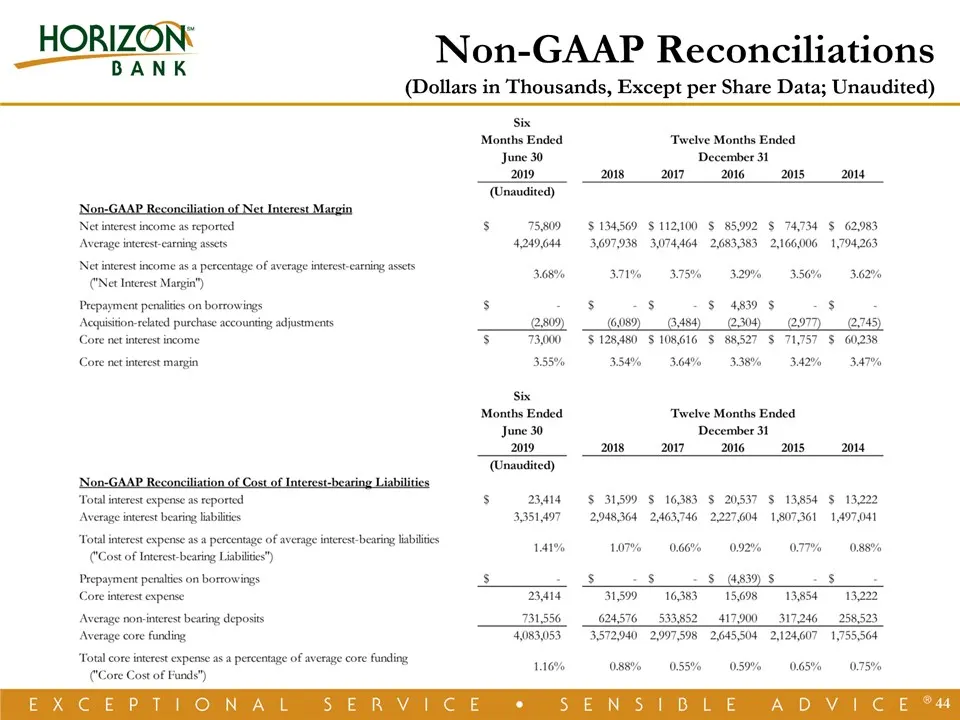
Slide 44: Non-GAAP Reconciliations
* Non-GAAP Reconciliations(Dollars in Thousands, Except per Share Data; Unaudited)
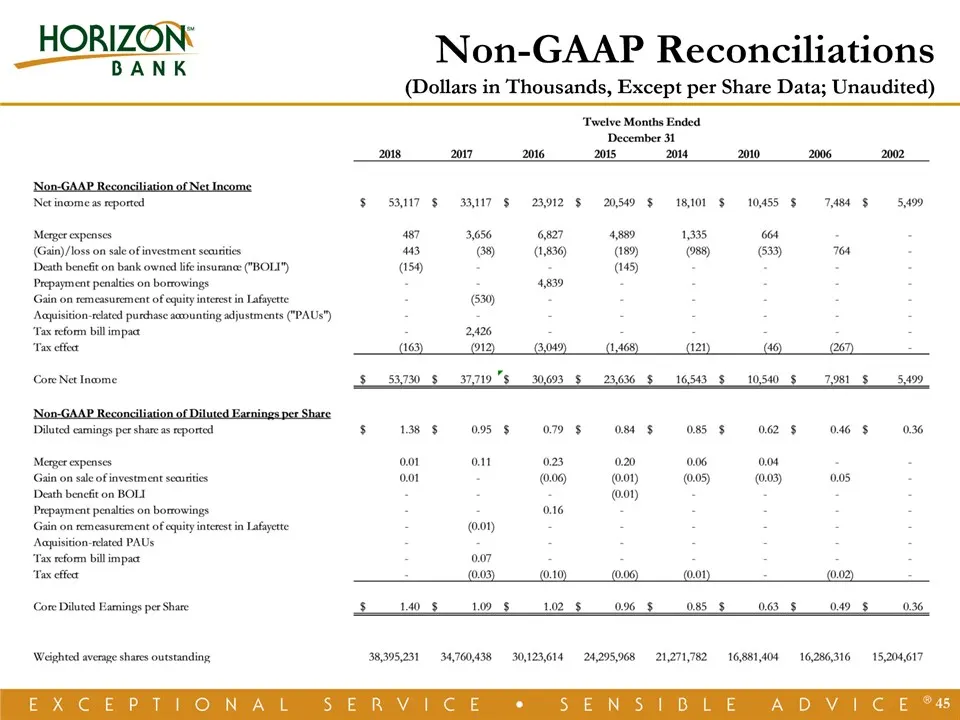
Slide 45: Non-GAAP Reconciliations
* Non-GAAP Reconciliations(Dollars in Thousands, Except per Share Data; Unaudited)
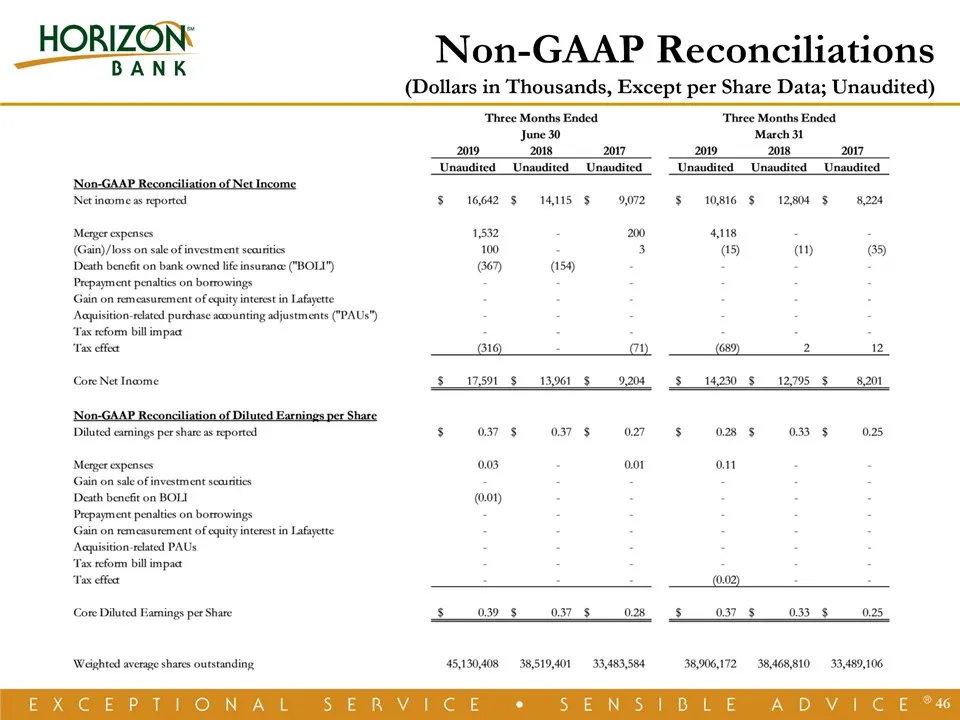
Slide 46: Non-GAAP Reconciliations
* Non-GAAP Reconciliations(Dollars in Thousands, Except per Share Data; Unaudited)
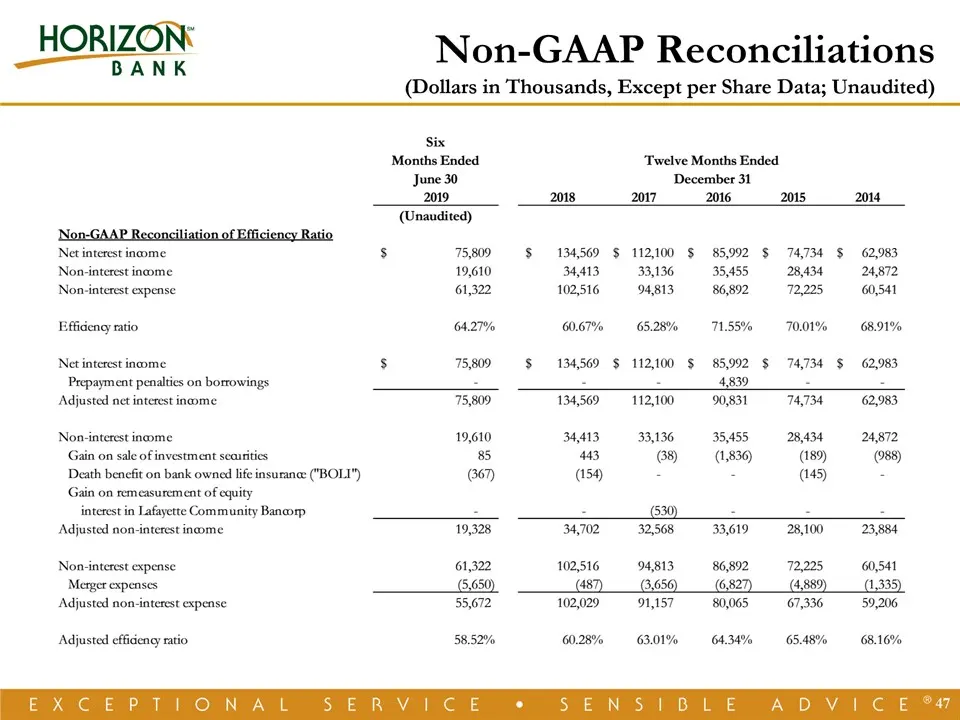
Slide 47: Non-GAAP Reconciliations
* Non-GAAP Reconciliations(Dollars in Thousands, Except per Share Data; Unaudited)
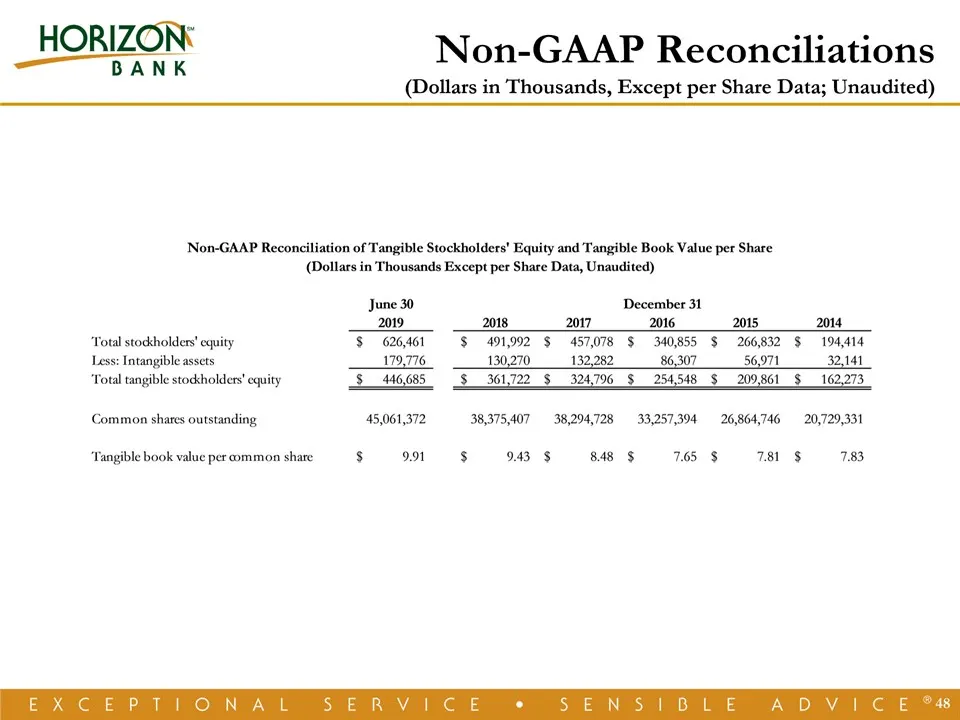
Slide 48: Non-GAAP Reconciliations
* Non-GAAP Reconciliations(Dollars in Thousands, Except per Share Data; Unaudited)
Source: SEC EDGAR · 8-K filed Jul 30, 2019
More decks from Horizon Bancorp, Inc.
 Q3 2026 Earnings Presentation21 slides · Oct 22, 2026
 Q2 2026 Earnings Presentation21 slides · Jul 23, 2026
 Q1 2026 Earnings Presentation21 slides · Apr 23, 2026
 Q4 2025 Earnings Presentation20 slides · Jan 22, 2026
 Q3 2025 Earnings Presentation22 slides · Oct 23, 2025
 IPO Roadshow (August 2025)38 slides · Aug 20, 2025