FS KKR Capital Corp. II — Corporate Update (May 2020)
21 slides from FS KKR Capital Corp. II's corporate update, May 27, 2020
Slide 1: Thank you for joining
Thank you for joining Please submit your questions using the Q&A box. Google Chrome is the optimal browser for viewing this webinar. If you are experiencing difficulties viewing the slides please refresh your browser and ensure that you have enabled Adobe Flash Media Player. If you are experiencing
Slide 2: FS KKR Capital Corp. II Q1 2020 performance update & listing preparations
FS KKR Capital Corp. II Q1 2020 performance update & listing preparations MAY 27, 2020
Slide 3: Agenda
1 Credit market overview 2 Q1 2020 portfolio & performance highlights (FS KKR Capital Corp. & FS KKR Capital Corp. II) 3 Liquidity plan update 4 Next steps & Operational considerations 5 Resources for client conversations Agenda
Slide 4: Q1 was a tale of two markets
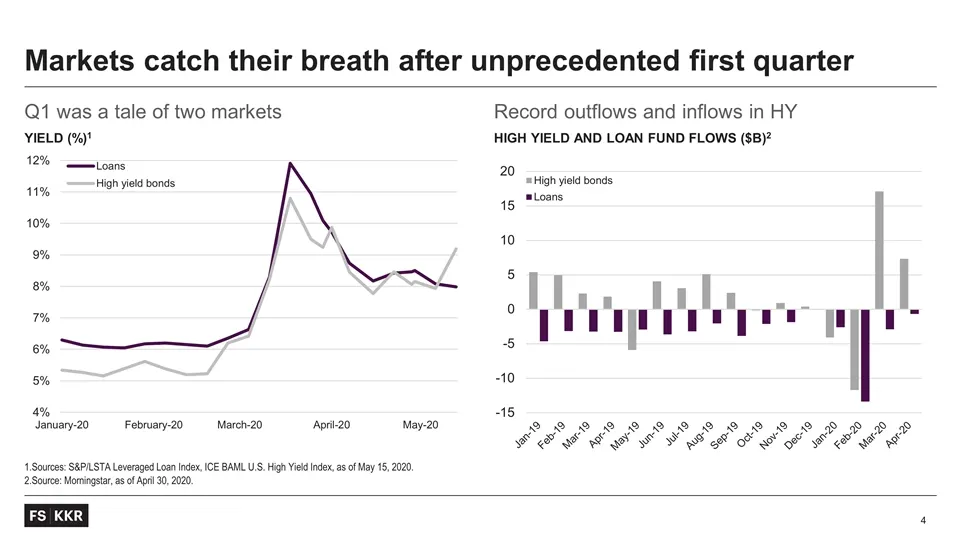
Q1 was a tale of two markets Yield (%)1 Record outflows and inflows in HY High yield and Loan fund flows ($B)2 Sources: S&P/LSTA Leveraged Loan Index, ICE BAML U.S. High Yield Index, as of May 15, 2020. Source: Morningstar, as of April 30, 2020. Markets catch their breath after unprecedented first q
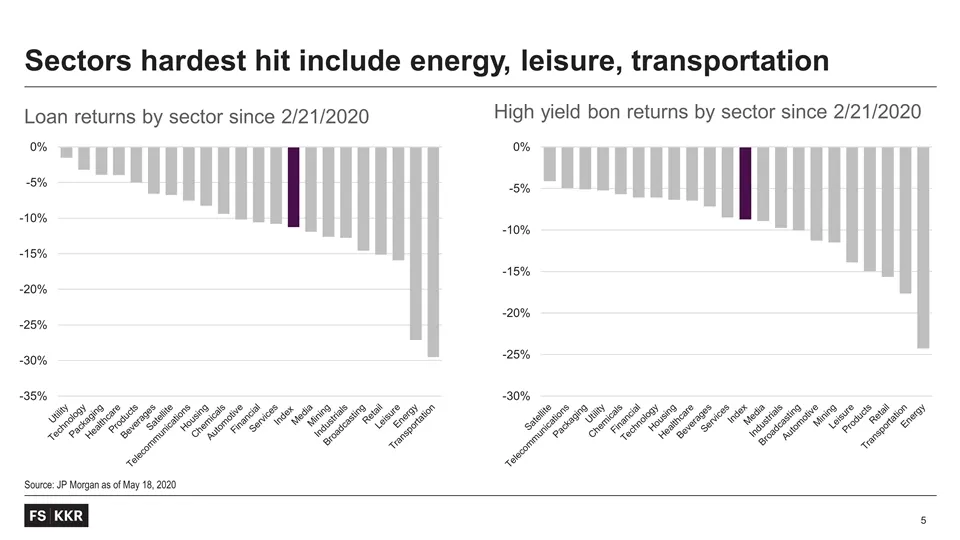
Slide 5: Loan and high yield returns by sector since 2/21/2020
Loan returns by sector since 2/21/2020 High yield bon returns by sector since 2/21/2020 Source: JP Morgan as of May 18, 2020 Sectors hardest hit include energy, leisure, transportation
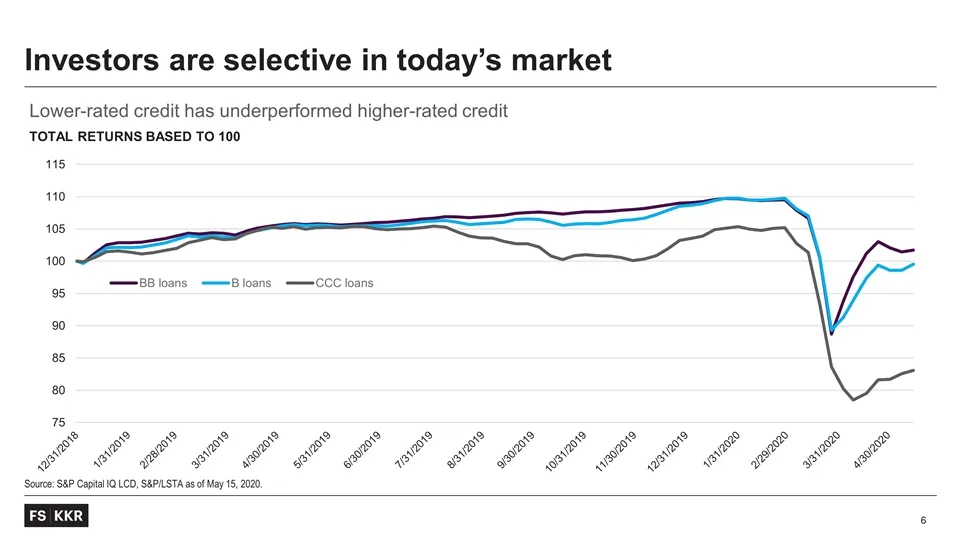
Slide 6: Investors are selective in today's market
Investors are selective in today’s market Source: S&P Capital IQ LCD, S&P/LSTA as of May 15, 2020. Lower-rated credit has underperformed higher-rated credit Total returns based to 100
Slide 7: Q1 2020 Portfolio & Performance Overview
Q1 2020 Portfolio & Performance Overview
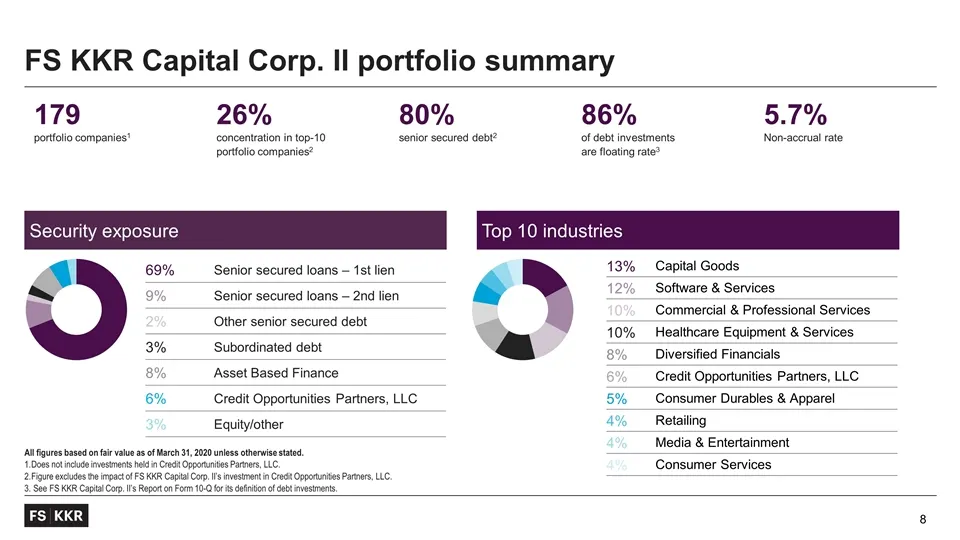
Slide 8: FS KKR Capital Corp. II portfolio summary
FS KKR Capital Corp. II portfolio summary All figures based on fair value as of March 31, 2020 unless otherwise stated. Does not include investments held in Credit Opportunities Partners, LLC. Figure excludes the impact of FS KKR Capital Corp. II’s investment in Credit Opportunities Partners, LLC. S
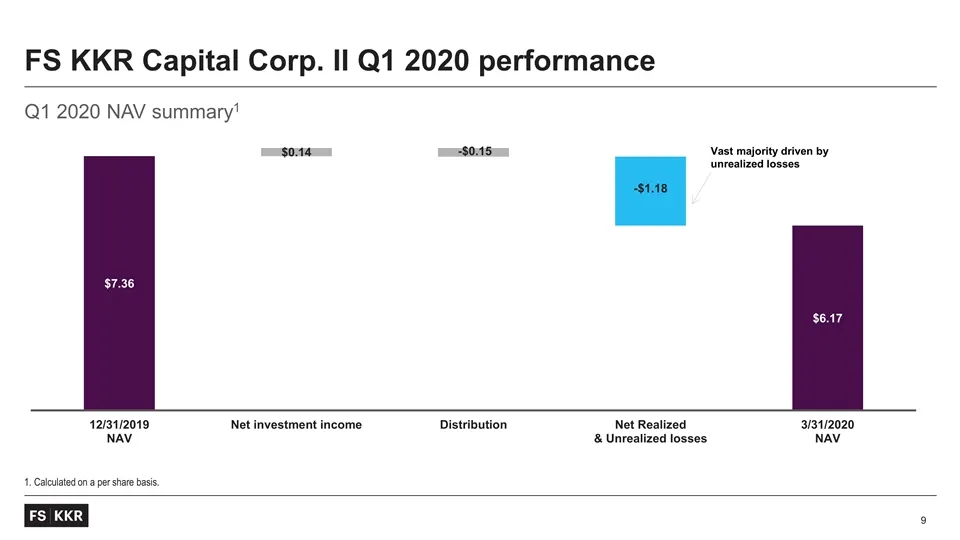
Slide 9: Q1 2020 NAV summary
Q1 2020 NAV summary1 1. Calculated on a per share basis. FS KKR Capital Corp. II Q1 2020 performance Vast majority driven by unrealized losses
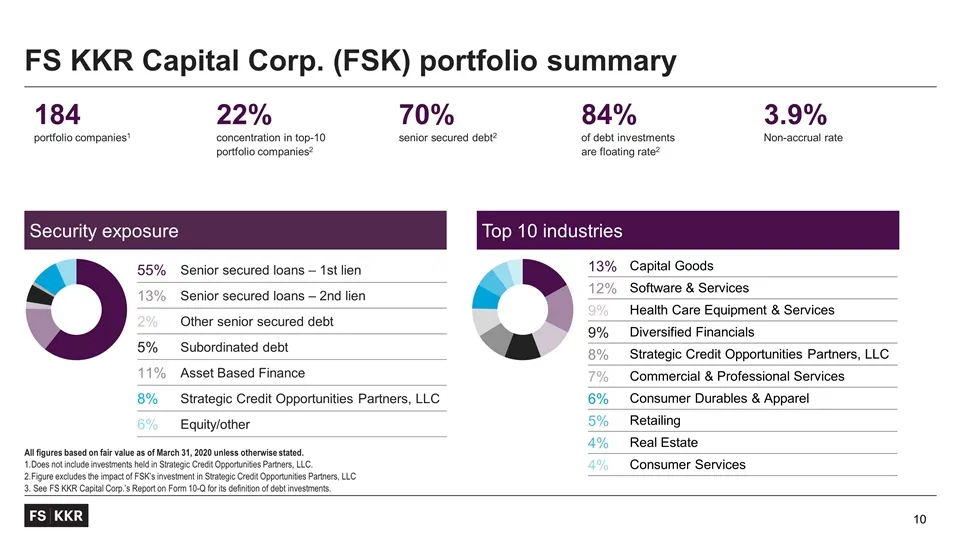
Slide 10: FS KKR Capital Corp. (FSK) portfolio summary
FS KKR Capital Corp. (FSK) portfolio summary All figures based on fair value as of March 31, 2020 unless otherwise stated. Does not include investments held in Strategic Credit Opportunities Partners, LLC. Figure excludes the impact of FSK’s investment in Strategic Credit Opportunities Partners, LLC
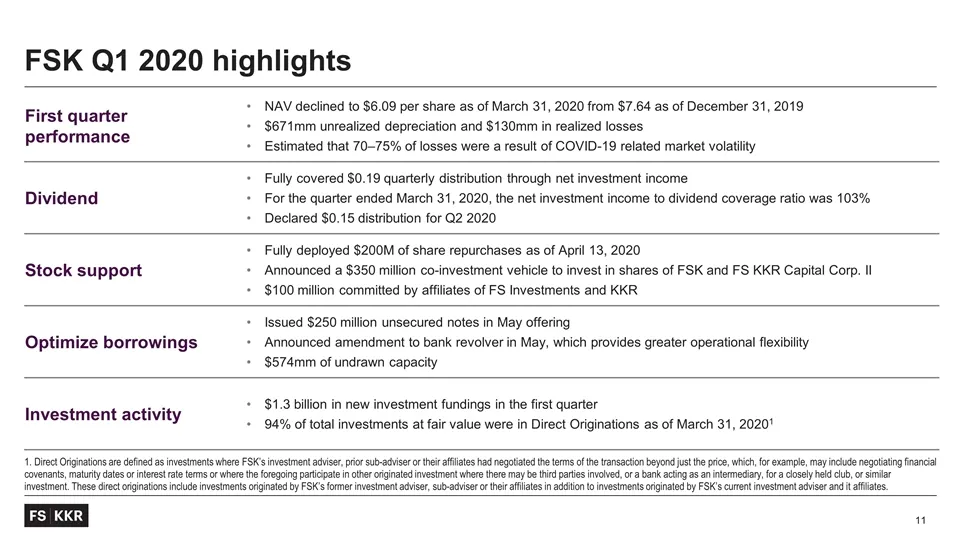
Slide 11: FSK Q1 2020 highlights
FSK Q1 2020 highlights First quarter performance NAV declined to $6.09 per share as of March 31, 2020 from $7.64 as of December 31, 2019 $671mm unrealized depreciation and $130mm in realized losses Estimated that 70–75% of losses were a result of COVID-19 related market volatility Dividend Fully cov
Slide 12: FS KKR Capital Corp. II Listing Overview
FS KKR Capital Corp. II Listing Overview
Slide 13: Listing creates optionality for all stakeholders
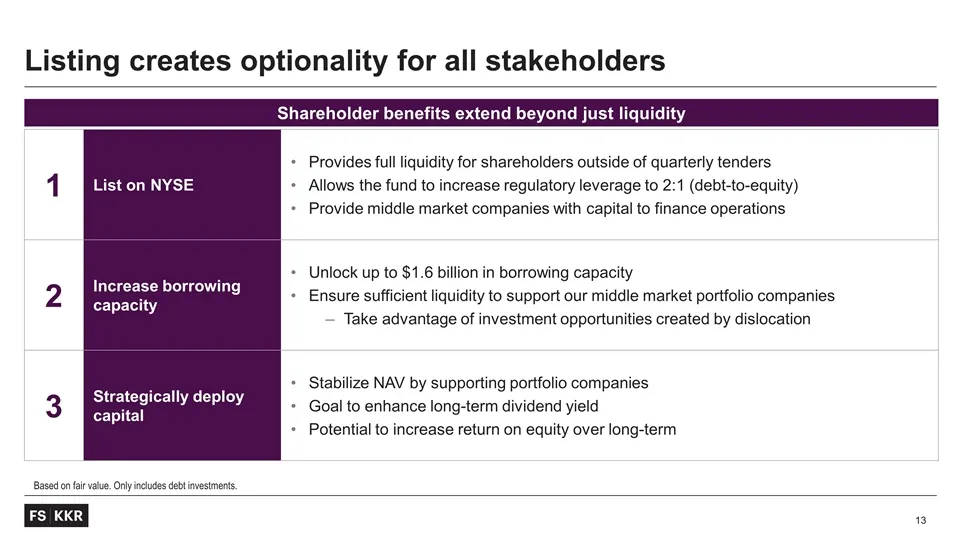
Listing creates optionality for all stakeholders 1 List on NYSE Provides full liquidity for shareholders outside of quarterly tenders Allows the fund to increase regulatory leverage to 2:1 (debt-to-equity) Provide middle market companies with capital to finance operations 2 Increase borrowing capaci
Slide 14: Responding to rising investor demand for liquidity
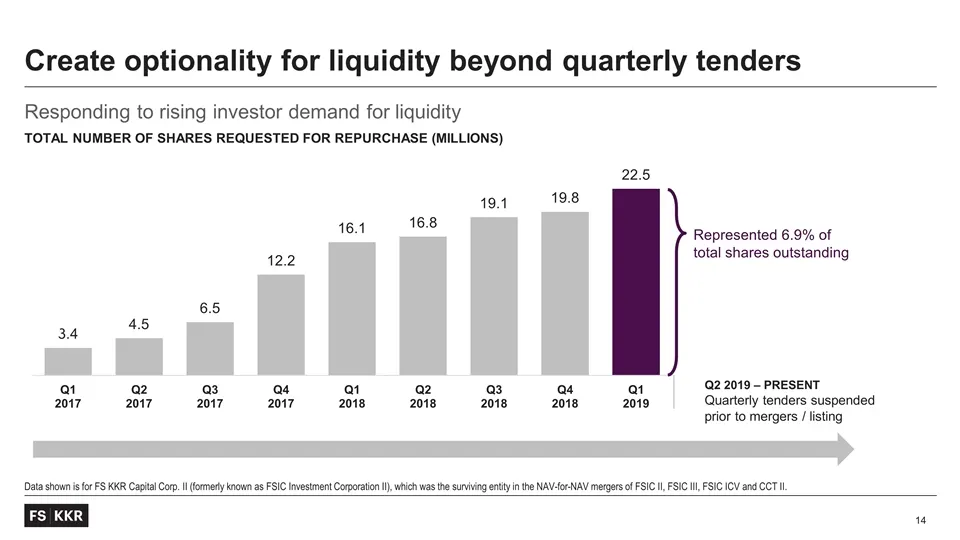
Responding to rising investor demand for liquidity Total Number of shares requested for repurchase (millions) Data shown is for FS KKR Capital Corp. II (formerly known as FSIC Investment Corporation II), which was the surviving entity in the NAV-for-NAV mergers of FSIC II, FSIC III, FSIC ICV and CCT
Slide 15: Potential to unlock over $1 billion in available capacity
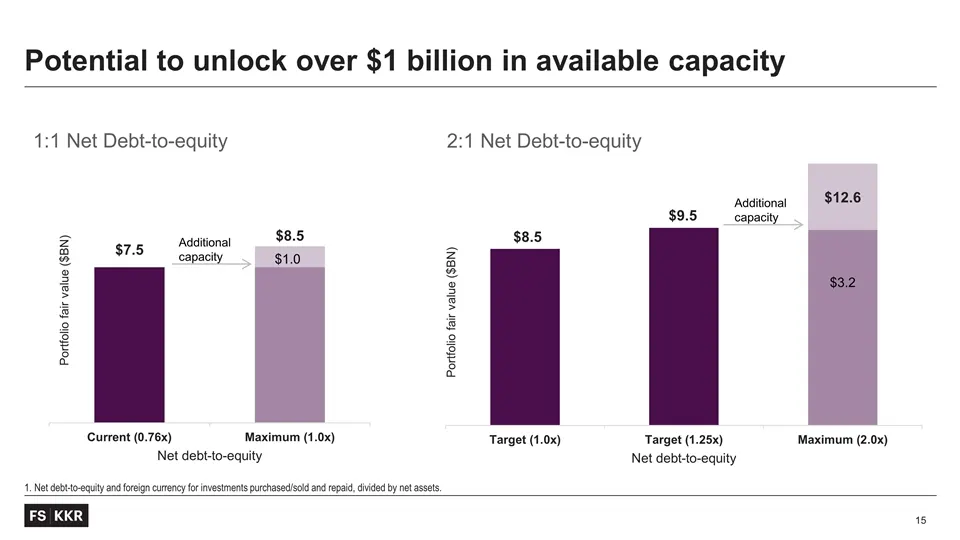
1. Net debt-to-equity and foreign currency for investments purchased/sold and repaid, divided by net assets. Potential to unlock over $1 billion in available capacity 1:1 Net Debt-to-equity 2:1 Net Debt-to-equity $1.0 Additional capacity $3.2 Additional capacity
Slide 16: Fully liquid security with path to grow distribution yield
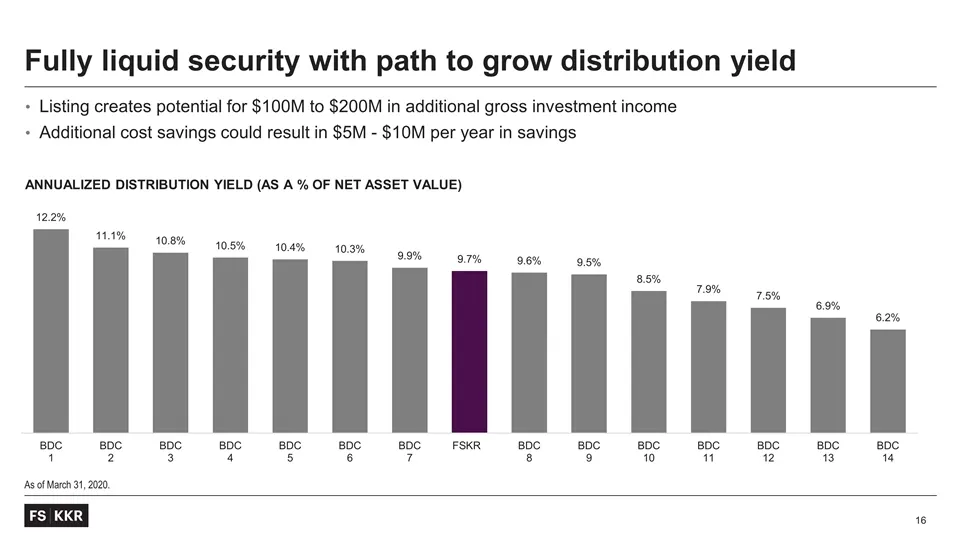
As of March 31, 2020. Fully liquid security with path to grow distribution yield Annualized distribution yield (as a % of net asset value) Listing creates potential for $100M to $200M in additional gross investment income Additional cost savings could result in $5M - $10M per year in savings
Slide 17: Significant secondary market support
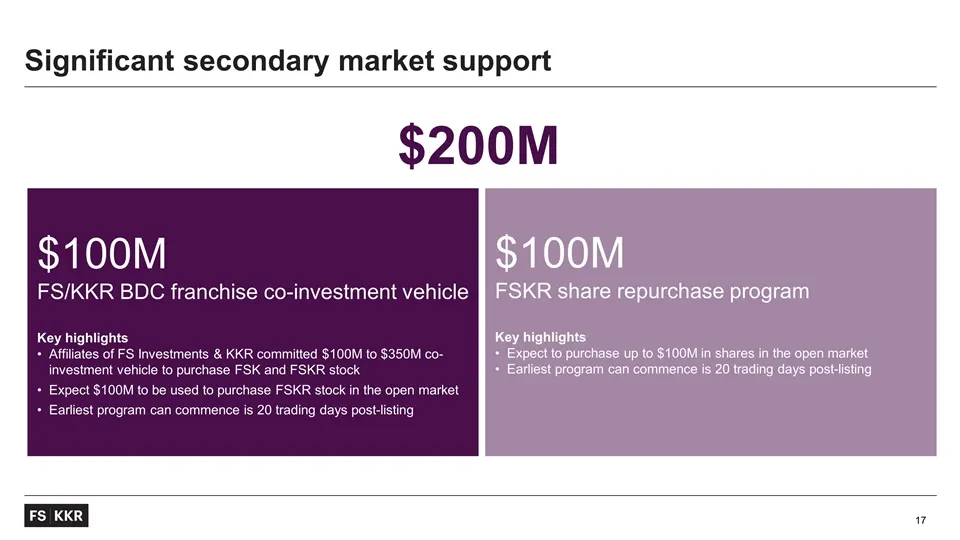
Significant secondary market support $100M FS/KKR BDC franchise co-investment vehicle Key highlights Affiliates of FS Investments & KKR committed $100M to $350M co-investment vehicle to purchase FSK and FSKR stock Expect $100M to be used to purchase FSKR stock in the open market Earliest program can
Slide 18: Next steps & Operational considerations
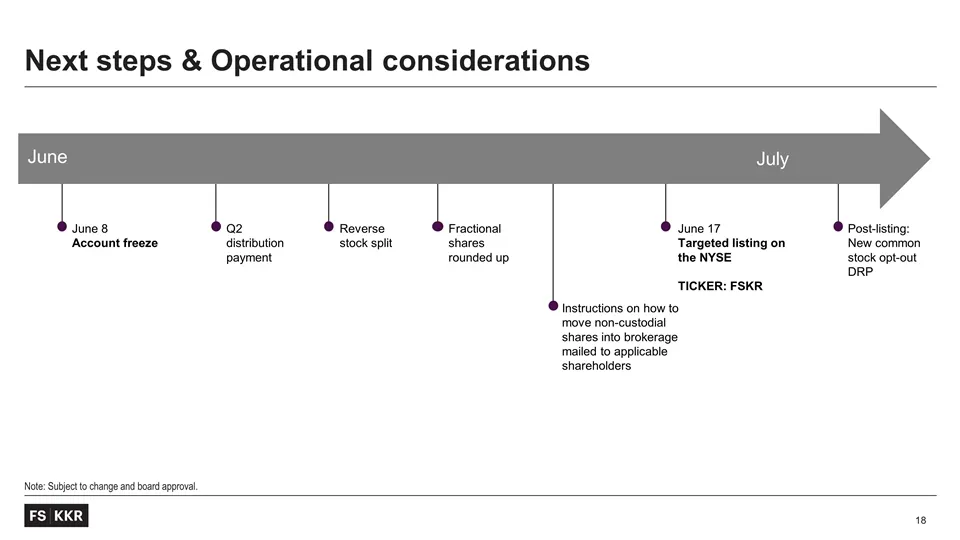
Note: Subject to change and board approval. Next steps & Operational considerations June 8 Account freeze Reverse stock split June July Q2 distribution payment June 17 Targeted listing on the NYSE TICKER: FSKR Instructions on how to move non-custodial shares into brokerage mailed to applicable share
Slide 19: Resources
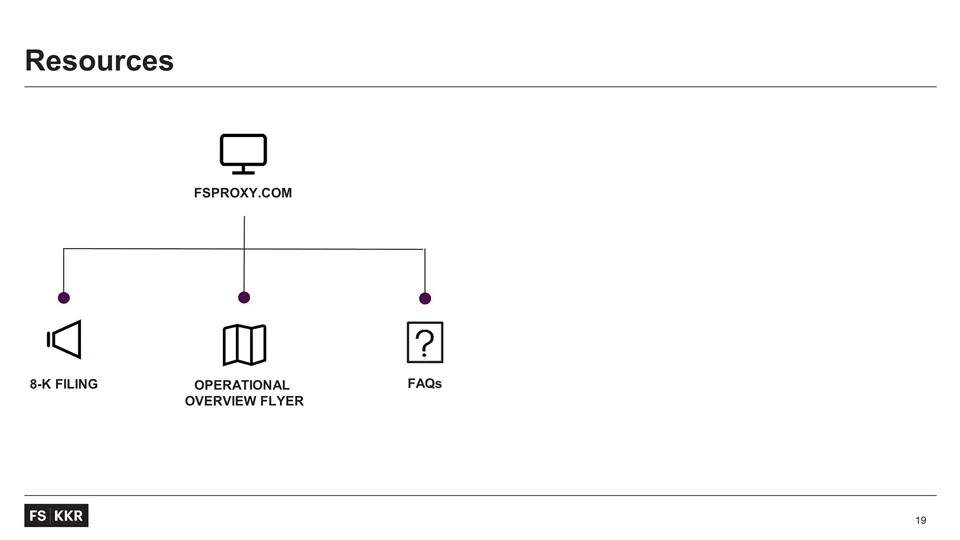
Resources FSPROXY.COM OPERATIONAL OVERVIEW FLYER 8-K FILING FAQs

Slide 20: Questions?
Questions?
Slide 21: Forward-Looking Statements
Forward-Looking Statements Securities offered through FS Investment Solutions, LLC (member FINRA/SIPC). FS Investment Solutions, LLC is an affiliated broker-dealer that serves as the wholesaling distributor of non-traded funds sponsored by FS Investments. An investment in any fund sponsored by FS In
Source: SEC EDGAR · DEFA14A filed May 27, 2020
More decks from FS KKR Capital Corp. II
 Merger or Acquisition (March 2021)59 slides · Mar 9, 2021
 Merger or Acquisition (November 2020)16 slides · Nov 24, 2020
 Investor Presentation (July 2020)19 slides · Jul 1, 2020
 Investor Presentation (June 2020)42 slides · Jun 3, 2020
 FS Investment Corp II — Merger or Acquisition (December 2017)21 slides · Dec 11, 2017