DEX ONE — R.H. Donnelley — UBS Media Conference 2007
47 slides from DEX ONE's conference presentation, Dec 4, 2007
Slide 1: UBS Media Conference December 4, 2007
UBS Media Conference December 4, 2007
Slide 2: Safe Harbor Statement
Safe Harbor Statement Certain statements contained in this presentation regarding RHD's future operating results or performance or business plans or prospects and any other statements not constituting historical fact are "forward-looking statements" subject to the safe harbor created by the Private
Slide 3: The reports of my death have been greatly exaggerated
"The reports of my death have been greatly exaggerated." Mark Twain yellow pages
Slide 4: Key Messages
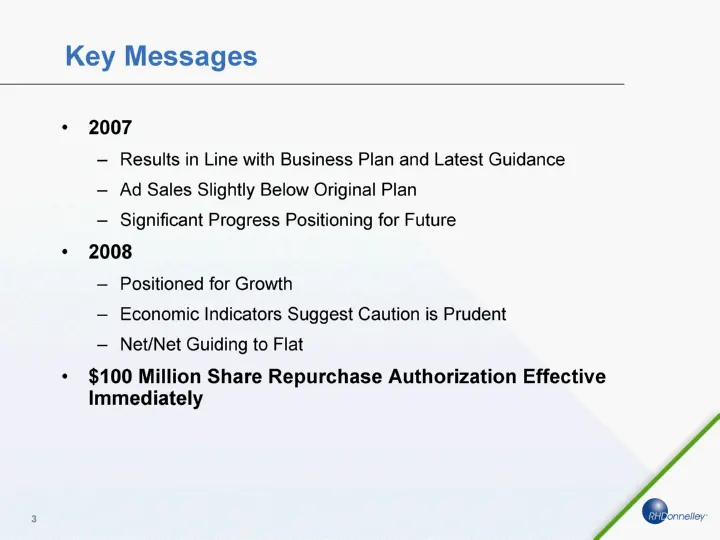
Key Messages 2007 Results in Line with Business Plan and Latest Guidance Ad Sales Slightly Below Original Plan Significant Progress Positioning for Future 2008 Positioned for Growth Economic Indicators Suggest Caution is Prudent Net/Net Guiding to Flat $100 Million Share Repurchase Authorization Eff
Slide 5: R.H. Donnelley Overview
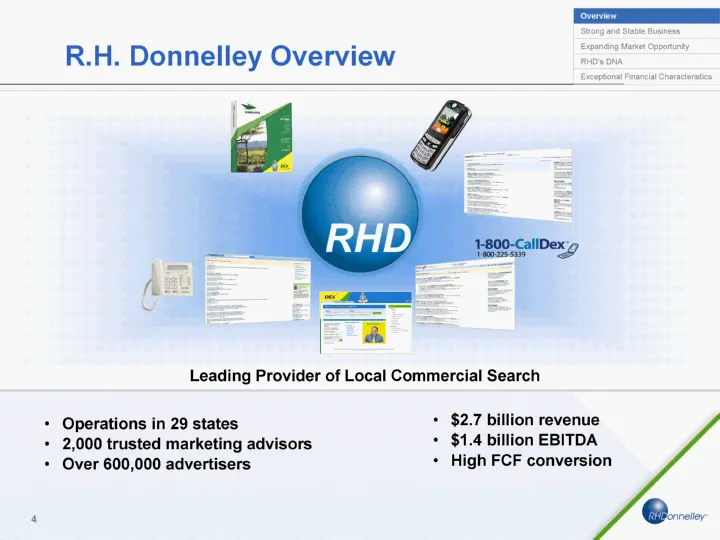
R.H. Donnelley Overview $2.7 billion revenue $1.4 billion EBITDA High FCF conversion Operations in 29 states 2,000 trusted marketing advisors Over 600,000 advertisers Leading Provider of Local Commercial Search Overview Strong and Stable Business Expanding Market Opportunity RHD's DNA Exceptional Fi
Slide 6: Attractive Markets
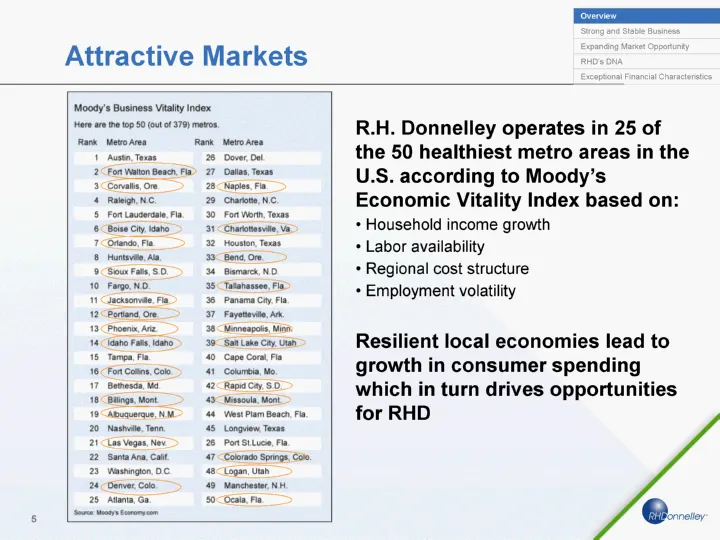
R.H. Donnelley operates in 25 of the 50 healthiest metro areas in the U.S. according to Moody's Economic Vitality Index based on: Household income growth Labor availability Regional cost structure Employment volatility Resilient local economies lead to growth in consumer spending which in turn drive
Slide 7: Then: Our Advertisers and Buyers
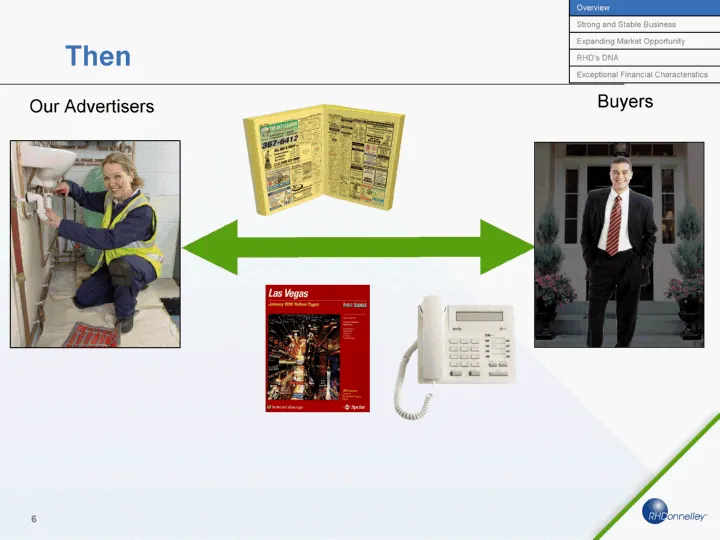
Then Our Advertisers Buyers Overview Strong and Stable Business Expanding Market Opportunity RHD's DNA Exceptional Financial Characteristics
Slide 8: Now: Our Advertisers and Buyers
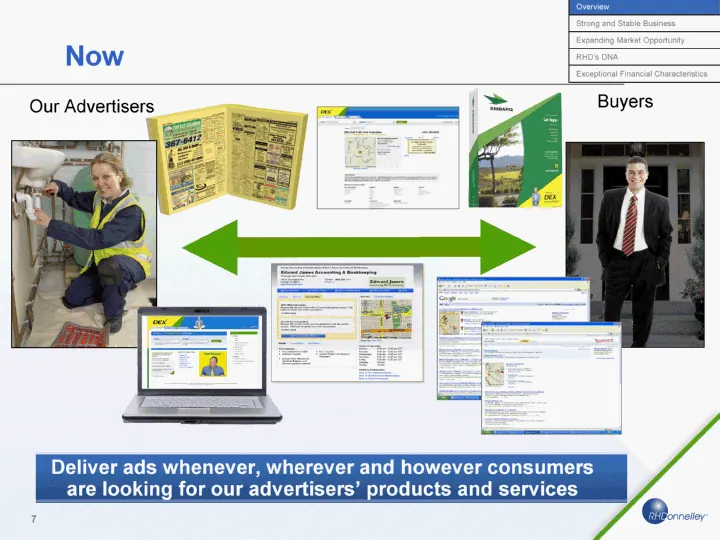
Now Our Advertisers Buyers Overview Strong and Stable Business Expanding Market Opportunity RHD's DNA Exceptional Financial Characteristics Deliver ads whenever, wherever and however consumers are looking for our advertisers' products and services
Slide 9: Triple Play Delivers More Active Buyers
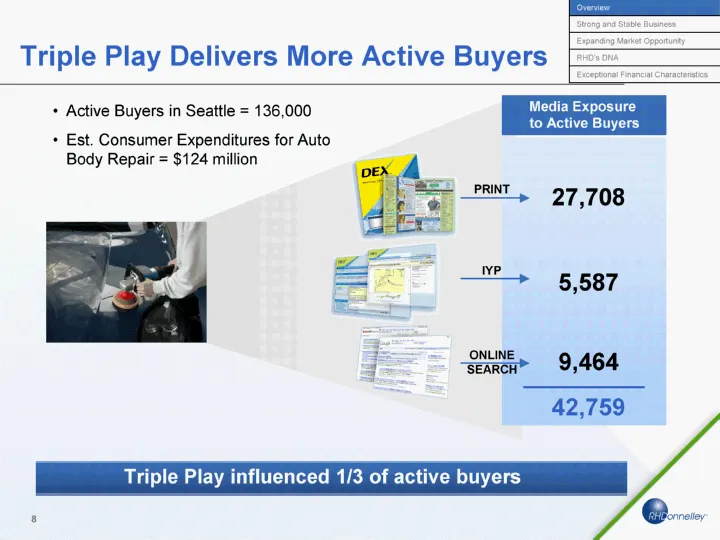
Triple Play Delivers More Active Buyers Active Buyers in Seattle = 136,000 Est. Consumer Expenditures for Auto Body Repair = $124 million 27,708 5,587 9,464 42,759 Media Exposure to Active Buyers PRINT IYP ONLINE SEARCH Overview Strong and Stable Business Expanding Market Opportunity RHD's DNA Excep
Slide 10: Investment Highlights
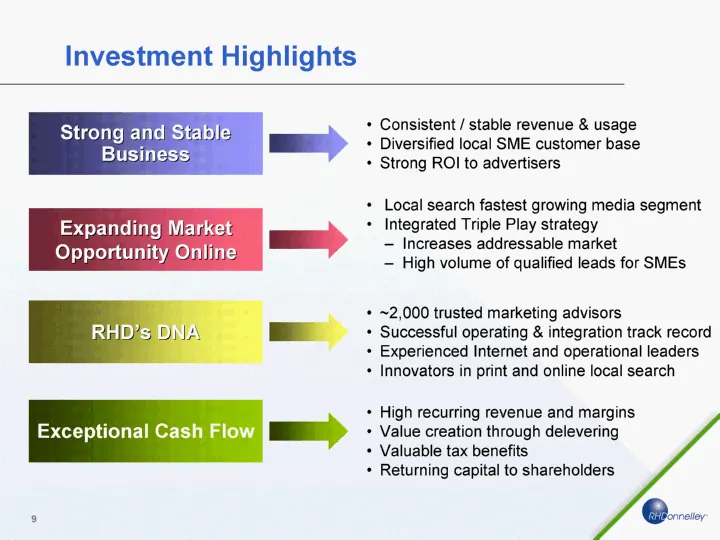
Investment Highlights Strong and Stable Business Consistent / stable revenue & usage Diversified local SME customer base Strong ROI to advertisers RHD's DNA ~2,000 trusted marketing advisors Successful operating & integration track record Experienced Internet and operational leaders Innovators in pr
Slide 11: YP & Total Advertising Growth vs GDP
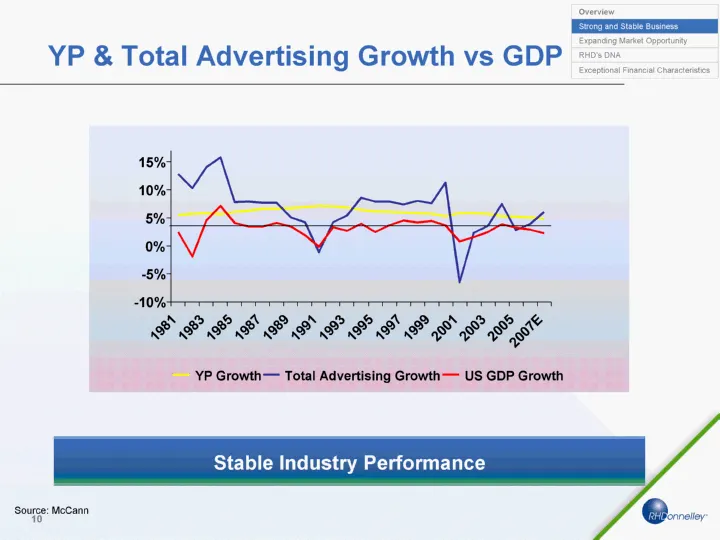
YP & Total Advertising Growth vs GDP Stable Industry Performance Source: McCann Overview Strong and Stable Business Expanding Market Opportunity RHD's DNA Exceptional Financial Characteristics - -10% - -5% 0% 5% 10% 15% 1981 1983 1985 1987 1989 1991 1993 1995 1997 1999 2001 2003 2005 2007E YP Growth
Slide 12: Media Usage Trends
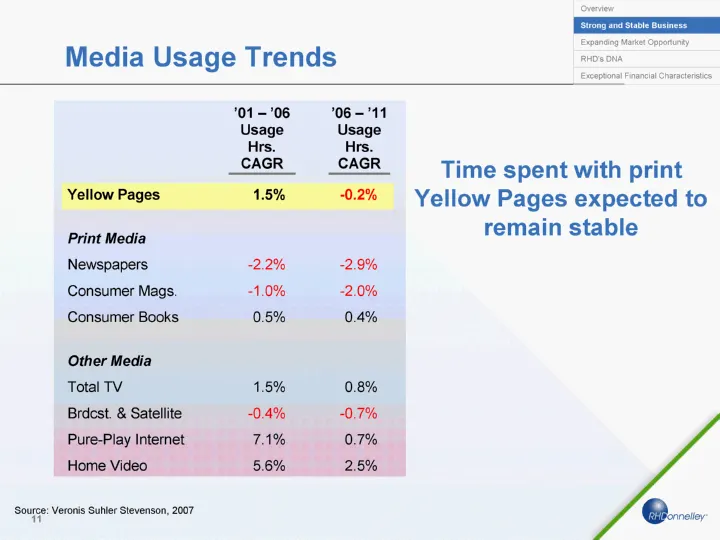
Media Usage Trends Source: Veronis Suhler Stevenson, 2007 Time spent with print Yellow Pages expected to remain stable Overview Strong and Stable Business Expanding Market Opportunity RHD's DNA Exceptional Financial Characteristics
Slide 13: Diversified Advertiser Base
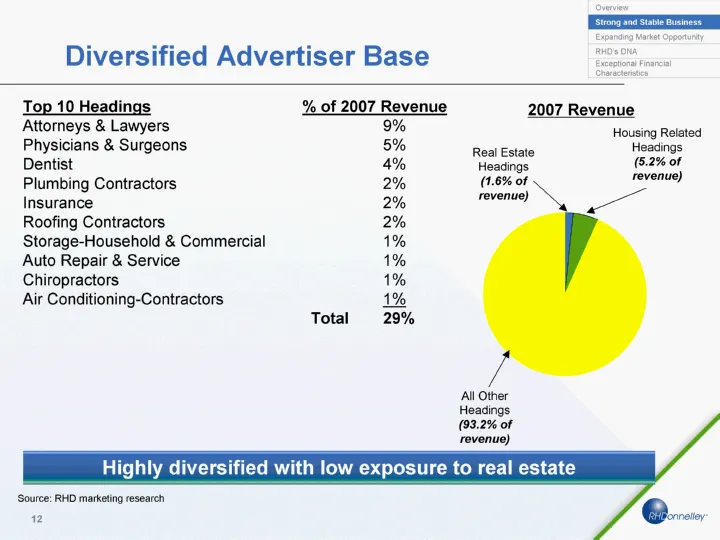
Diversified Advertiser Base Overview Strong and Stable Business Expanding Market Opportunity RHD's DNA Exceptional Financial Characteristics Highly diversified with low exposure to real estate Source: RHD marketing research Top 10 Headings % of 2007 Revenue Attorneys & Lawyers 9% Physicians & Surgeo
Slide 14: Total Ad Sales by Brand
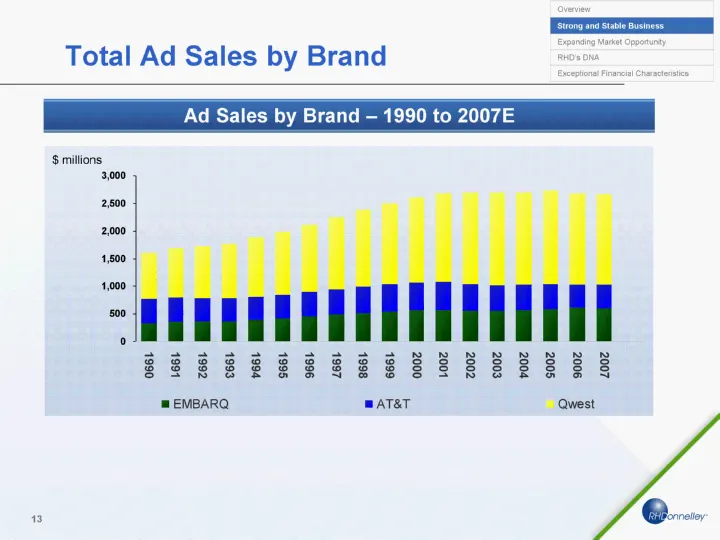
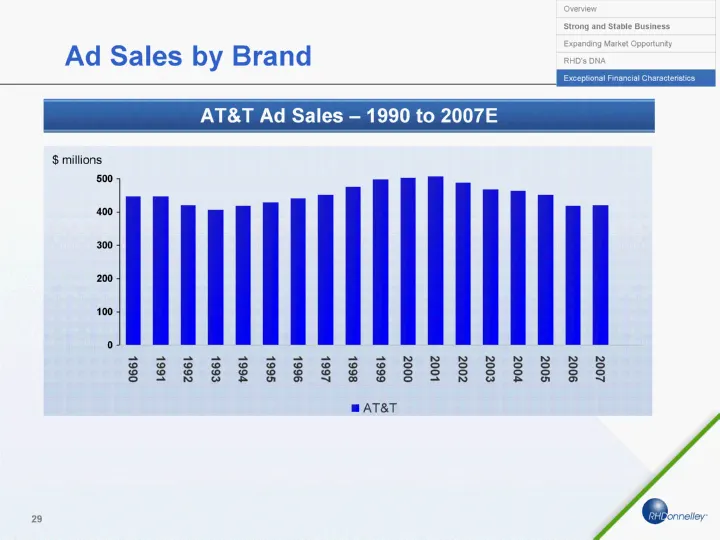
Total Ad Sales by Brand 1990 1991 1992 1993 1994 1995 1996 1997 1998 1999 2000 2001 2002 2003 2004 2005 2006 2007 EMBARQ 329.3 349 362.8 373.2 391.7 421.7 448.4 490.4 519.6 544.1 565.5 567.4 552.2 552.6 567.8 593.5 613.7 604.3 AT&T 446 447 420 406 419 429 441 452 475 497 503 507 487 468 464 452 419
Slide 15: Investment Highlights
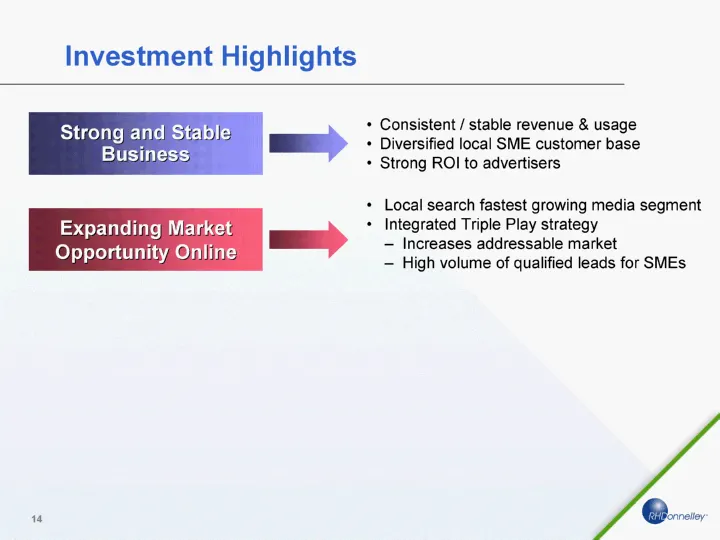
Investment Highlights Strong and Stable Business Consistent / stable revenue & usage Diversified local SME customer base Strong ROI to advertisers Expanding Market Opportunity Online Local search fastest growing media segment Integrated Triple Play strategy Increases addressable market High volume o
Slide 16: RHD's Addressable Market Expected to Grow
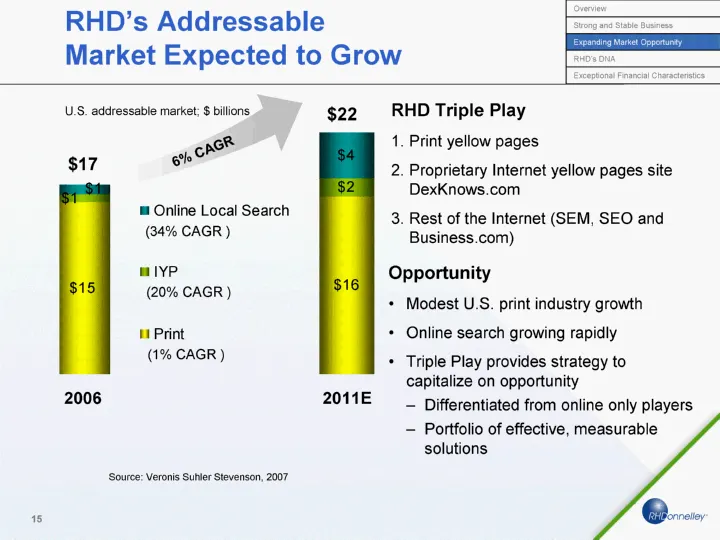
6% CAGR RHD's Addressable Market Expected to Grow Print IYP Online Local Search 2006 15.1 0.7 0.9 2011E 15.6 1.6 4.1 U.S. addressable market; $ billions Source: Veronis Suhler Stevenson, 2007 Opportunity Modest U.S. print industry growth Online search growing rapidly Triple Play provides strategy to
Slide 17: RHD Market Penetration
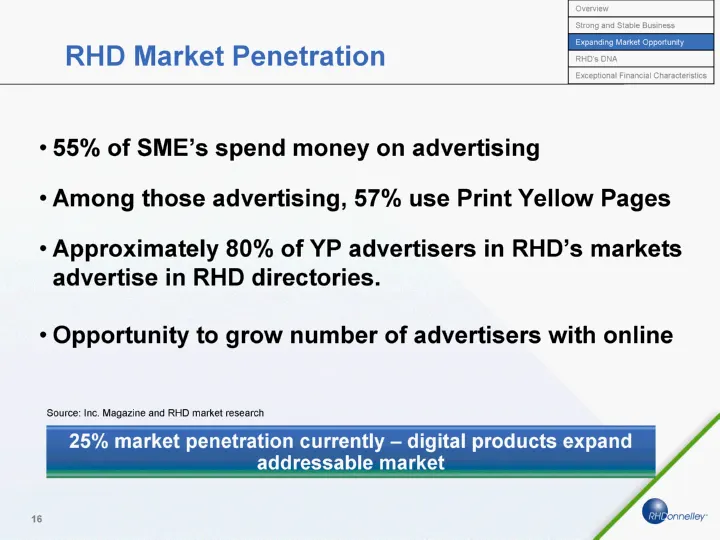
RHD Market Penetration Overview Strong and Stable Business Expanding Market Opportunity RHD's DNA Exceptional Financial Characteristics 55% of SME's spend money on advertising Among those advertising, 57% use Print Yellow Pages Approximately 80% of YP advertisers in RHD's markets advertise in RHD di
Slide 18: Investment Highlights
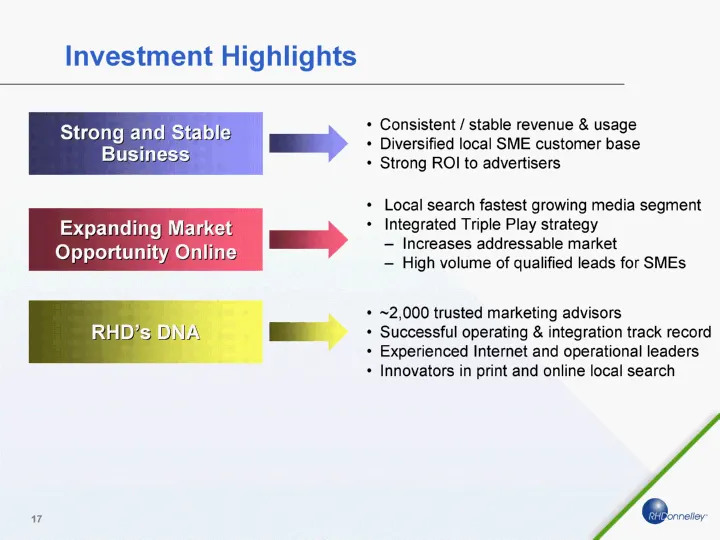
Investment Highlights Strong and Stable Business Consistent / stable revenue & usage Diversified local SME customer base Strong ROI to advertisers RHD's DNA ~2,000 trusted marketing advisors Successful operating & integration track record Experienced Internet and operational leaders Innovators in pr
Slide 19: Digital Products Gaining Traction: Illinois Case Study
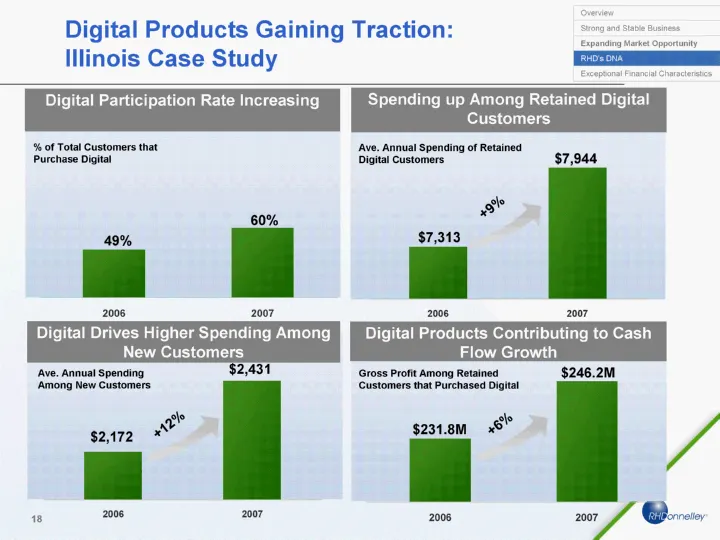
2006 2007 Revenues 0.49 0.6 2006 2007 Revenues 7313 7944 Digital Products Gaining Traction: Illinois Case Study 2006 2007 Gross Profit 1932 2052 Digital Participation Rate Increasing Digital Drives Higher Spending Among New Customers Spending up Among Retained Digital Customers Digital Products Cont
Slide 20: Path to Sustainable Growth
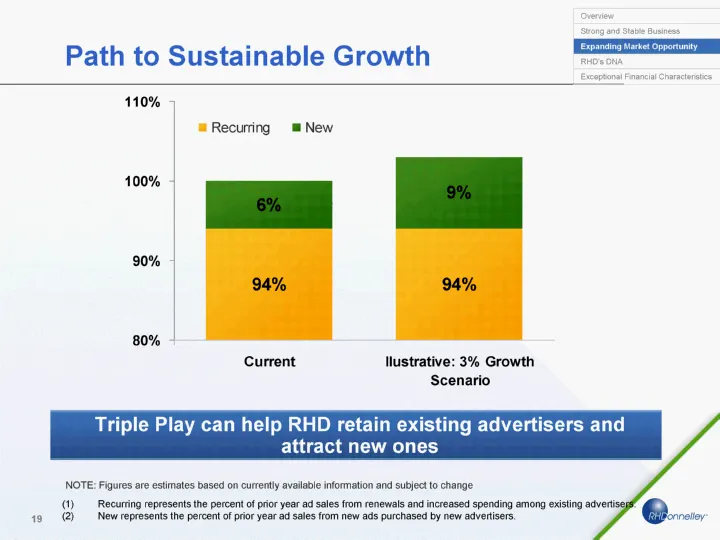
Path to Sustainable Growth Recurring represents the percent of prior year ad sales from renewals and increased spending among existing advertisers. New represents the percent of prior year ad sales from new ads purchased by new advertisers. NOTE: Figures are estimates based on currently available in
Slide 21: Trusted Marketing Advisor
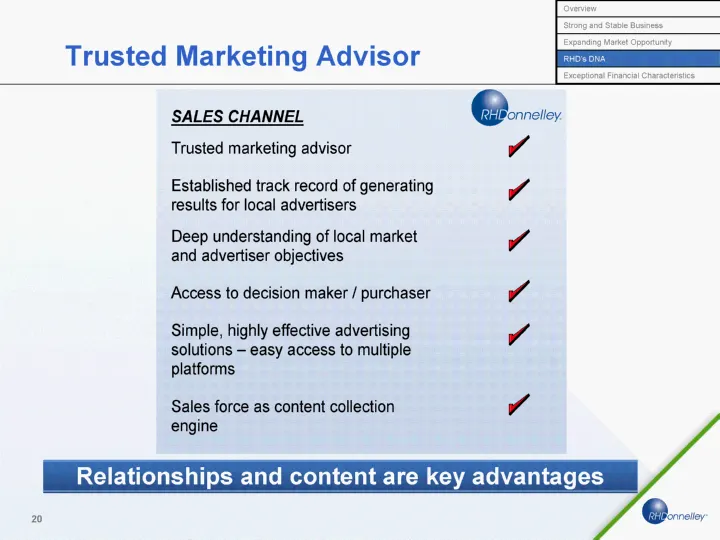
Trusted Marketing Advisor Relationships and content are key advantages Overview Strong and Stable Business Expanding Market Opportunity RHD's DNA Exceptional Financial Characteristics
Slide 22: Financial Overview
Financial Overview Steve Blondy Executive Vice President & CFO
Slide 23: RHD's Transformation
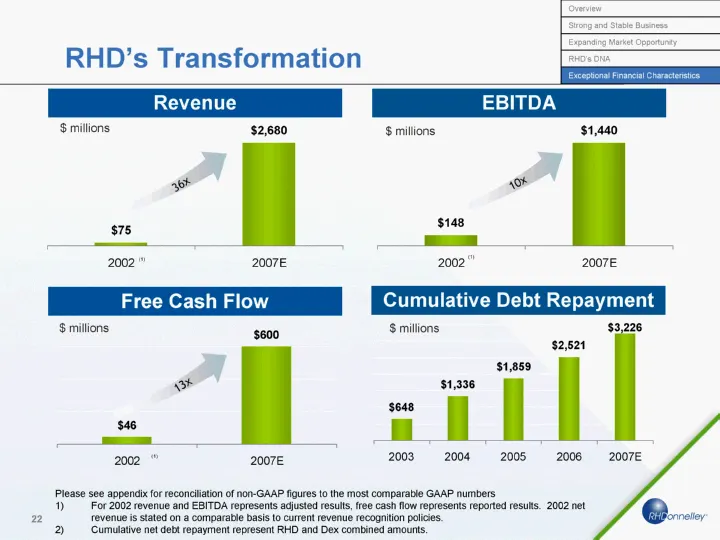
RHD's Transformation 2002 2007E Revenues 75 2680 2002 2007E Revenues 148 1440 2002 2007E Revenues 46 600 Revenue Free Cash Flow EBITDA Please see appendix for reconciliation of non-GAAP figures to the most comparable GAAP numbers For 2002 revenue and EBITDA represents adjusted results, free cash flo
Slide 24: 2007 Financial Highlights
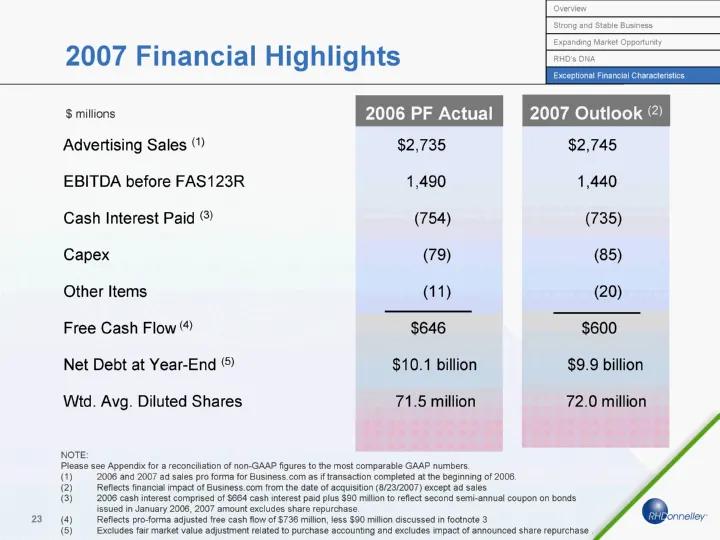
2007 Financial Highlights $ millions Advertising Sales (1) $2,735 $2,745 EBITDA before FAS123R 1,490 1,440 Cash Interest Paid (3) (754) (735) Capex (79) (85) Other Items (11) (20) Free Cash Flow (4) $646 $600 Net Debt at Year-End (5) $10.1 billion $9.9 billion Wtd. Avg. Diluted Shares 71.5 million 7
Slide 25: Refinancing Objectives Accomplished
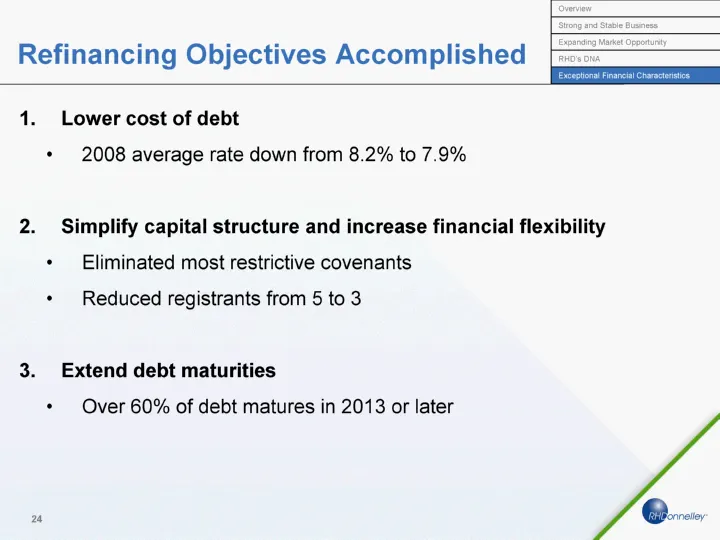
Lower cost of debt 2008 average rate down from 8.2% to 7.9% Simplify capital structure and increase financial flexibility Eliminated most restrictive covenants Reduced registrants from 5 to 3 Extend debt maturities Over 60% of debt matures in 2013 or later Overview Strong and Stable Business Expandi
Slide 26: Capital Structure Overview: Maturity / Amortization Schedule
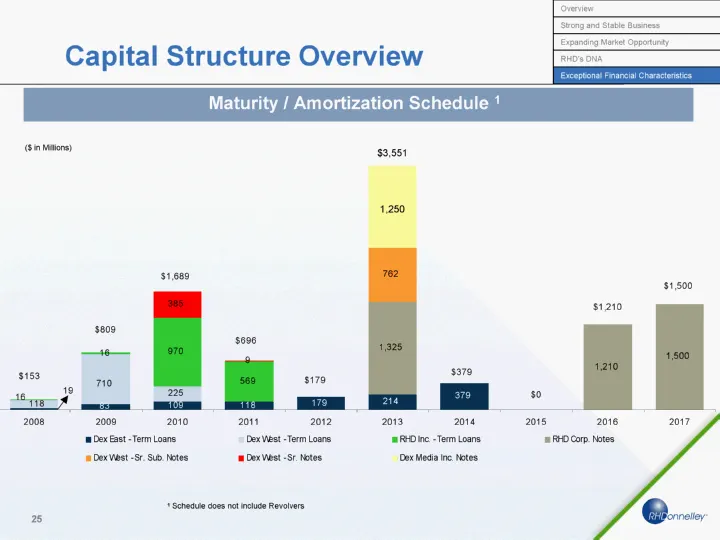
Capital Structure Overview Maturity / Amortization Schedule 1 1 Schedule does not include Revolvers Overview Strong and Stable Business Expanding Market Opportunity RHD's DNA Exceptional Financial Characteristics ($ in Millions) 1,250 $3,551
Slide 27: Ad Sales by Brand 1990 to 2007E
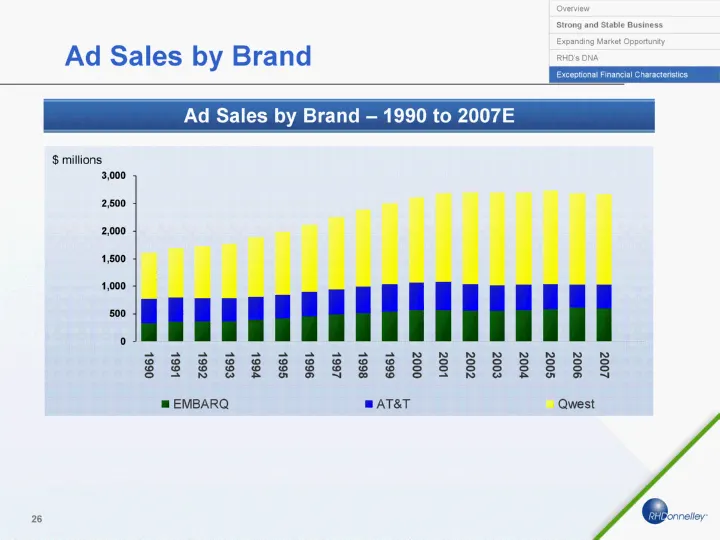
Ad Sales by Brand 1990 1991 1992 1993 1994 1995 1996 1997 1998 1999 2000 2001 2002 2003 2004 2005 2006 2007 EMBARQ 329.3 349 362.8 373.2 391.7 421.7 448.4 490.4 519.6 544.1 565.5 567.4 552.2 552.6 567.8 593.5 613.7 604.3 AT&T 446 447 420 406 419 429 441 452 475 497 503 507 487 468 464 452 419 420 Qw
Slide 28: Qwest Ad Sales 1990 to 2007E
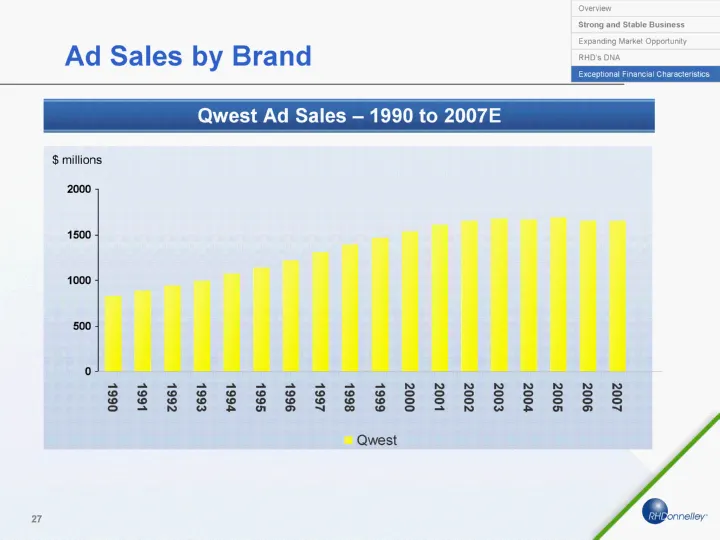
Ad Sales by Brand 1990 1991 1992 1993 1994 1995 1996 1997 1998 1999 2000 2001 2002 2003 2004 2005 2006 2007 Qwest 832 889 941 990 1070 1136 1221 1310 1390 1462 1538 1607 1651 1671 1668 1689 1654 1649 $ millions Qwest Ad Sales - 1990 to 2007E Overview Strong and Stable Business Expanding Market Oppor
Slide 29: Embarq Ad Sales 1990 to 2007E
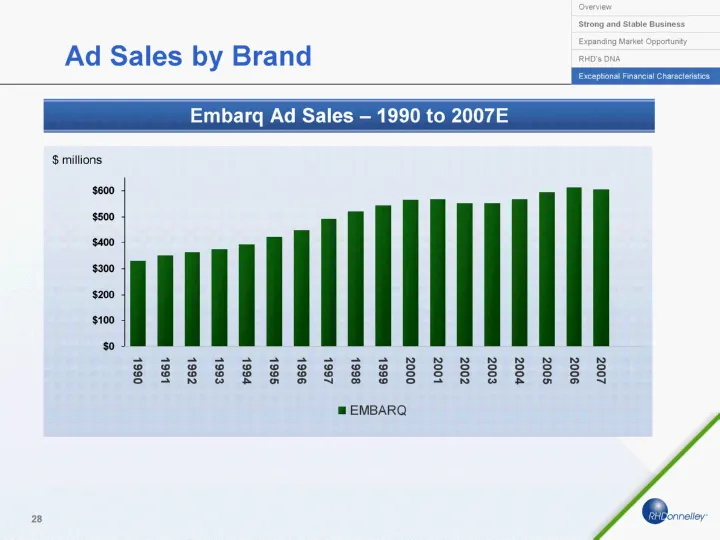
Ad Sales by Brand 1990 1991 1992 1993 1994 1995 1996 1997 1998 1999 2000 2001 2002 2003 2004 2005 2006 2007 EMBARQ 329.3 349 362.8 373.2 391.7 421.7 448.4 490.4 519.6 544.1 565.5 567.4 552.2 552.6 567.8 593.5 613.7 604.3 $ millions Embarq Ad Sales - 1990 to 2007E Overview Strong and Stable Business
Slide 30: AT&T Ad Sales 1990 to 2007E
Ad Sales by Brand 1990 1991 1992 1993 1994 1995 1996 1997 1998 1999 2000 2001 2002 2003 2004 2005 2006 2007 $ millions AT&T Ad Sales - 1990 to 2007E Overview Strong and Stable Business Expanding Market Opportunity RHD's DNA Exceptional Financial Characteristics
Slide 31: Guidance
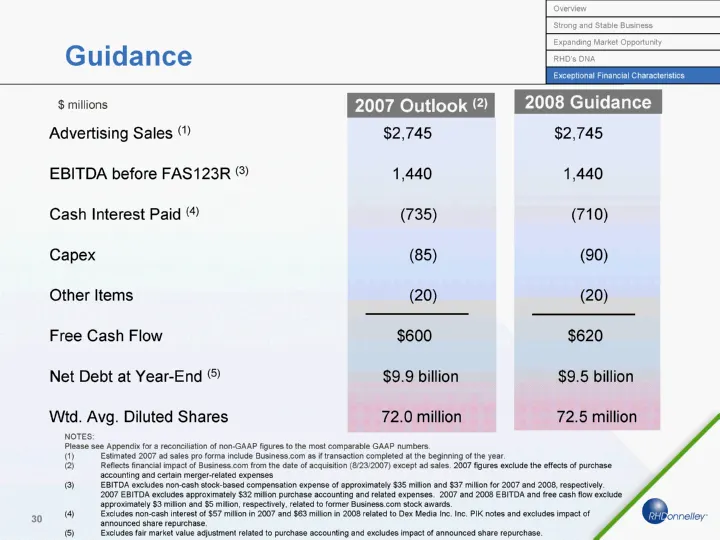
Guidance $ millions Advertising Sales (1) $2,745 $2,745 EBITDA before FAS123R (3) 1,440 1,440 Cash Interest Paid (4) (735) (710) Capex (85) (90) Other Items (20) (20) Free Cash Flow $600 $620 Net Debt at Year-End (5) $9.9 billion $9.5 billion Wtd. Avg. Diluted Shares 72.0 million 72.5 million 2007 O
Slide 32: Dex Synergies
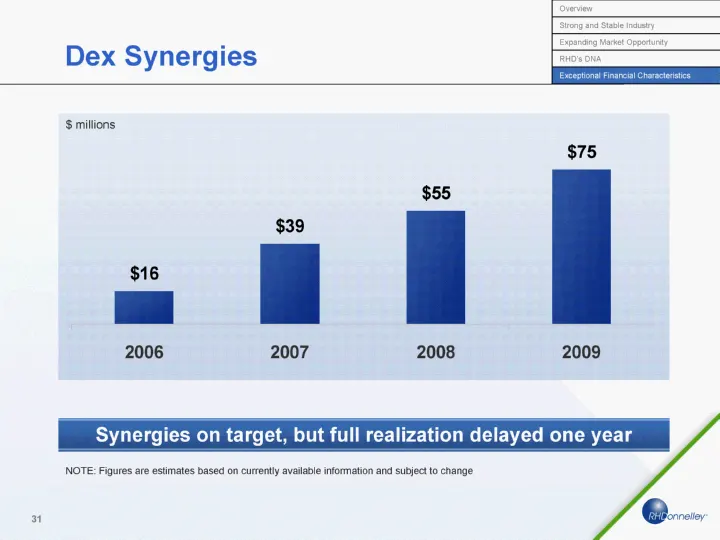
2006 2007 2008 2009 Cumulative Synergies - Revised Estimate 16 39 55 75 Dex Synergies Synergies on target, but full realization delayed one year NOTE: Figures are estimates based on currently available information and subject to change $ millions Overview Strong and Stable Industry Expanding Market
Slide 33: Dex Integration Costs
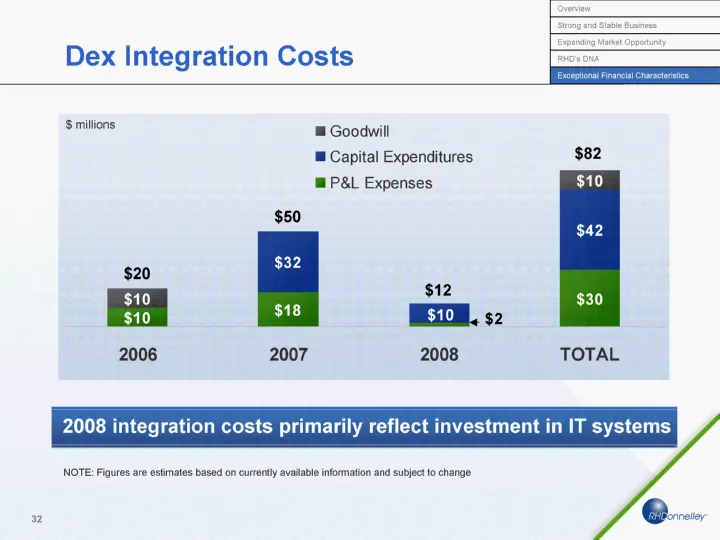
Dex Integration Costs $ millions 2006 2007 2008 TOTAL P&L Expenses 10 18 2 30 Capital Expenditures 0 32 10 42 Goodwill 10 10 $82 NOTE: Figures are estimates based on currently available information and subject to change $20 $50 $12 Overview Strong and Stable Business Expanding Market Opportunity RHD
Slide 34: Valuable Tax Benefits
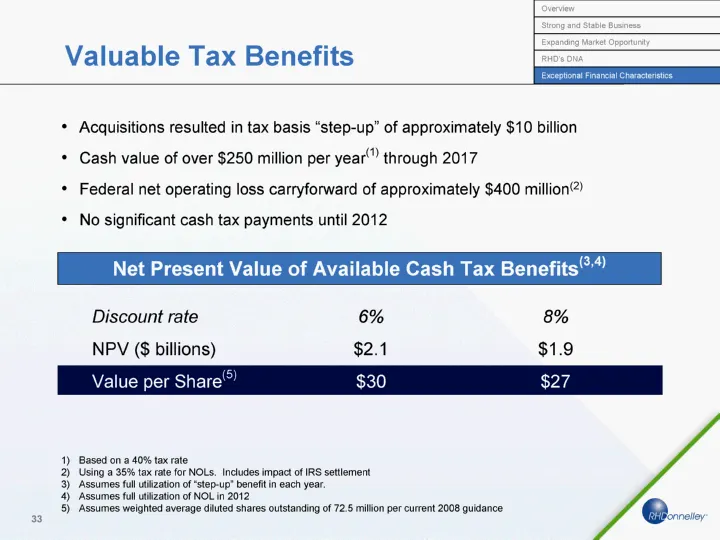
Based on a 40% tax rate Using a 35% tax rate for NOLs. Includes impact of IRS settlement Assumes full utilization of "step-up" benefit in each year. Assumes full utilization of NOL in 2012 Assumes weighted average diluted shares outstanding of 72.5 million per current 2008 guidance Valuable Tax Bene
Slide 35: Use of Free Cash Flow
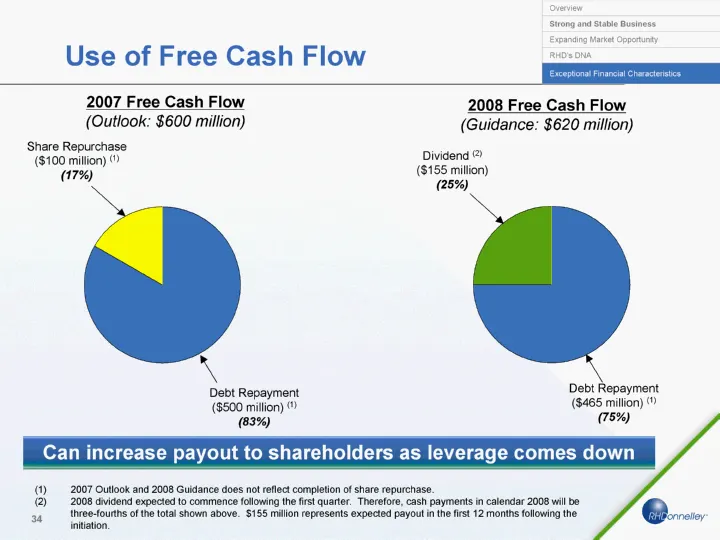
Use of Free Cash Flow Overview Strong and Stable Business Expanding Market Opportunity RHD's DNA Exceptional Financial Characteristics Debt Repayment Share Repurchase Free Cash Flow 0.833333333 0.166666666666666 Can increase payout to shareholders as leverage comes down 2007 Outlook and 2008 Guidanc
Slide 36: Investment Highlights
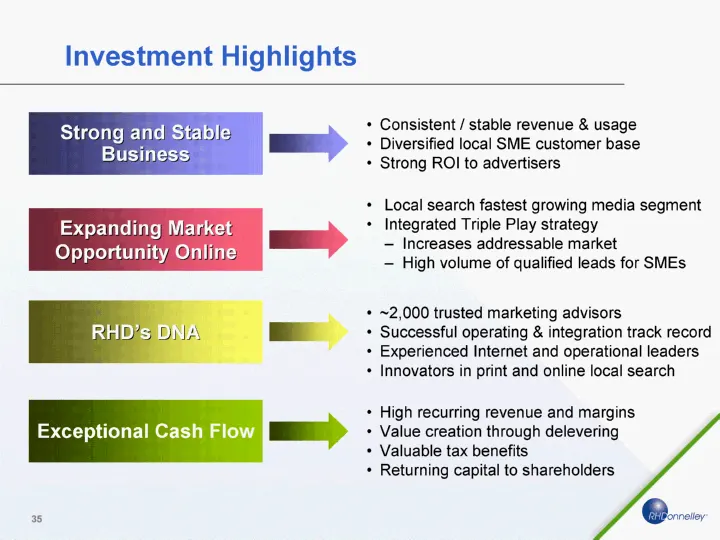
Investment Highlights Strong and Stable Business Consistent / stable revenue & usage Diversified local SME customer base Strong ROI to advertisers RHD's DNA ~2,000 trusted marketing advisors Successful operating & integration track record Experienced Internet and operational leaders Innovators in pr
Slide 37: Appendix
Appendix
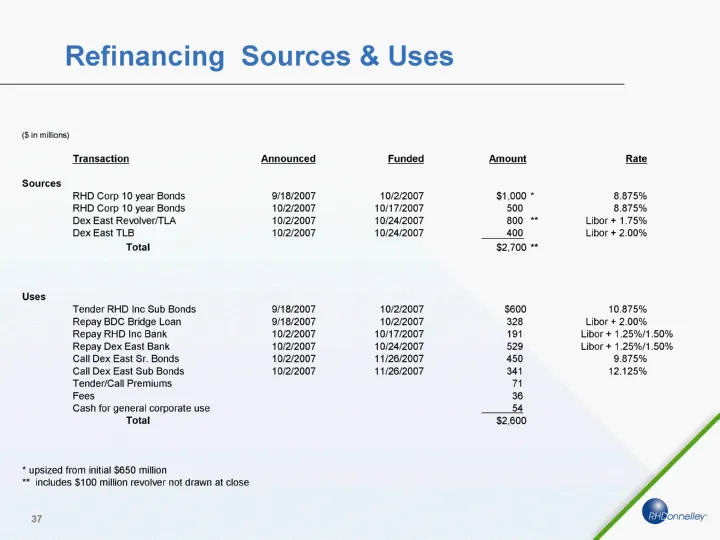
Slide 38: Refinancing Sources & Uses
Refinancing Sources & Uses (siamitors ‘Transaction RHD Corp 10 year Bonds RHD Corp 10 year Bonds Dex East RevowverTLA Dex East TLS Total ‘Tender RHO ine Sub Bonds Repay 8C Bridge Loan Repay RHD Ine Bank Repay Dex East Bank Call Dex East Sr. Bonds Cal Dex East Sub Bonds TenderiCal Premiums Fees Cash
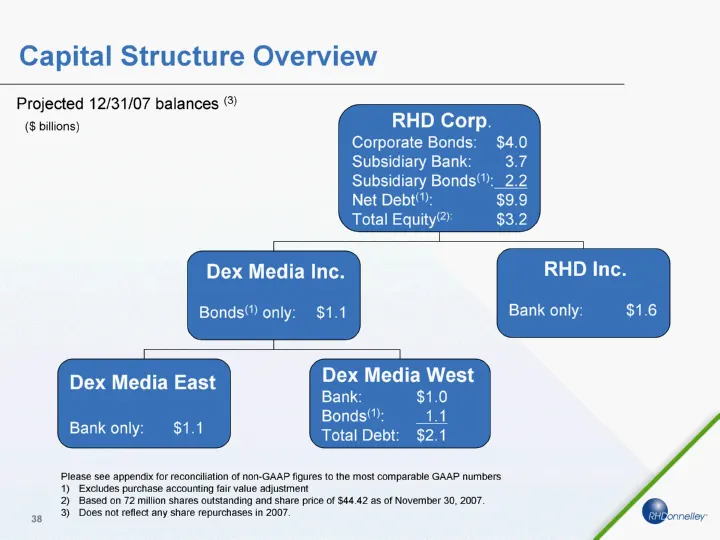
Slide 39: Capital Structure Overview
Capital Structure Overview RHD Corp. Corporate Bonds: $4.0 Subsidiary Bank: 3.7 Subsidiary Bonds(1): 2.2 Net Debt(1): $9.9 Total Equity(2): $3.2 Dex Media Inc. Bonds(1) only: $1.1 RHD Inc. Bank only: $1.6 Dex Media East Bank only: $1.1 Dex Media West Bank: $1.0 Bonds(1): 1.1 Total Debt: $2.1 ($ bill
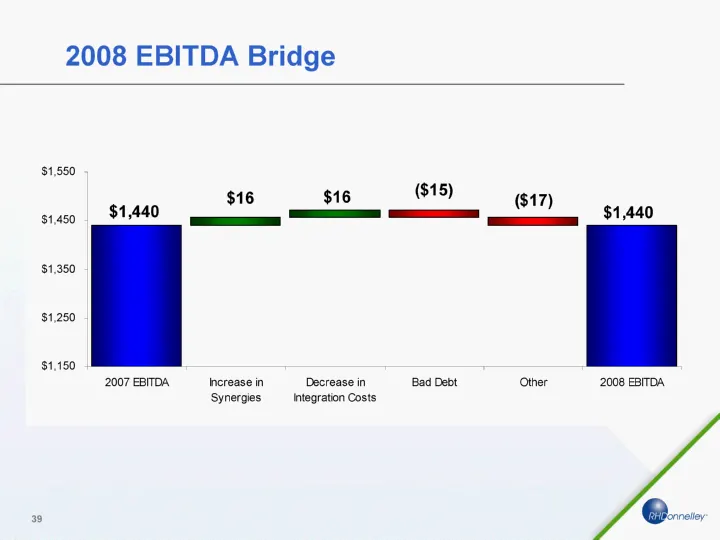
Slide 40: 2008 EBITDA Bridge
2008 EBITDA Bridge $1,550 $1,450 $1,950 $1,250 $1,150 $1,440 2007 EBITDA, bncrease in ‘Synergies Decrease in Integration Costs Bad Debt ($17) Other 2008 EBITDA,
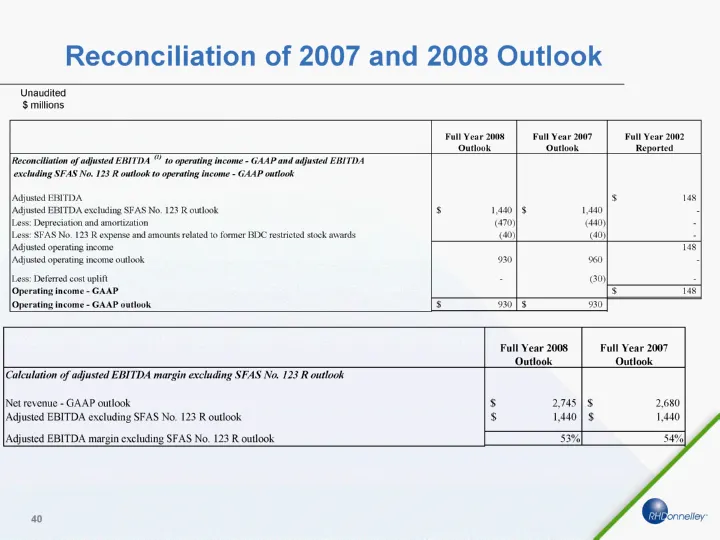
Slide 41: Reconciliation of 2007 and 2008 Outlook
Reconciliation of 2007 and 2008 Outlook Unaudited $ millions
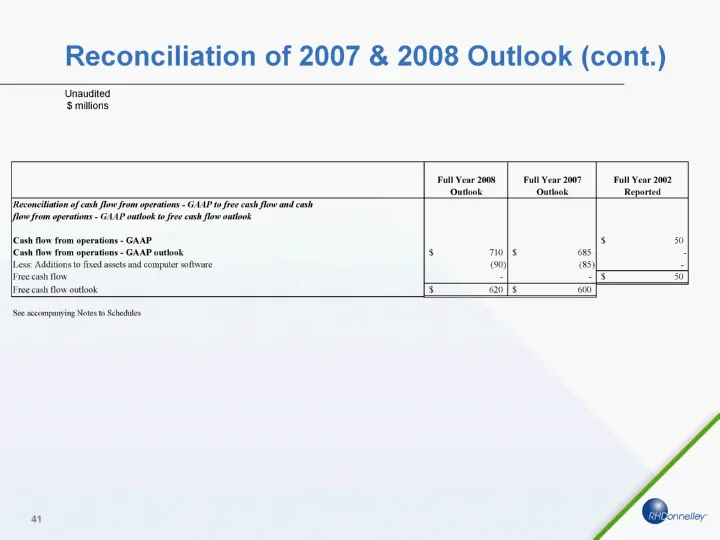
Slide 42: Reconciliation of 2007 & 2008 Outlook (cont.)
Reconciliation of 2007 & 2008 Outlook (cont.) Unaudited $ millions
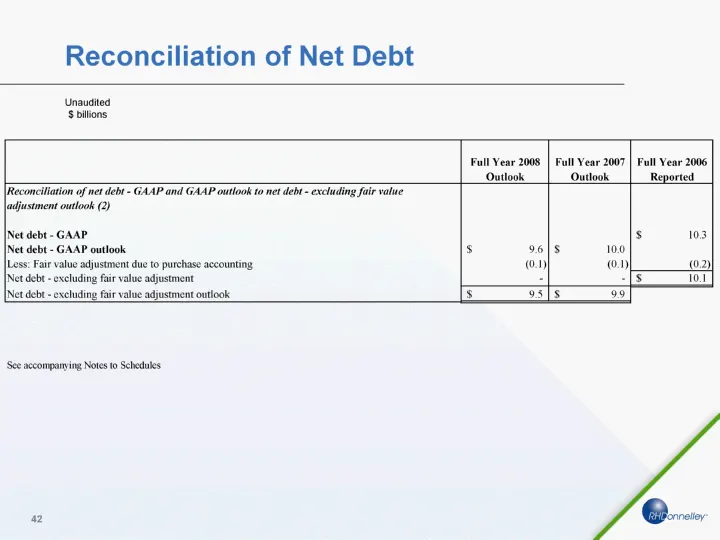
Slide 43: Reconciliation of Net Debt
Reconciliation of Net Debt Unaudited $ billions
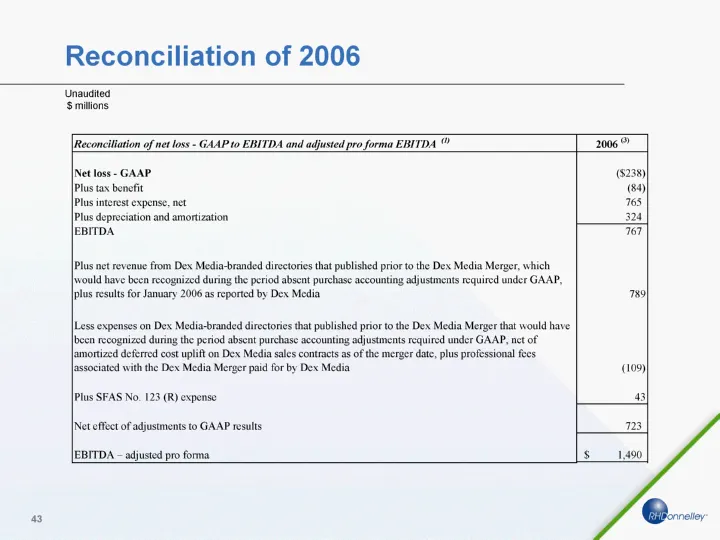
Slide 44: Reconciliation of 2006
Reconciliation of 2006 Unaudited $ millions
Slide 45: Reconciliation of 2006 (cont.)
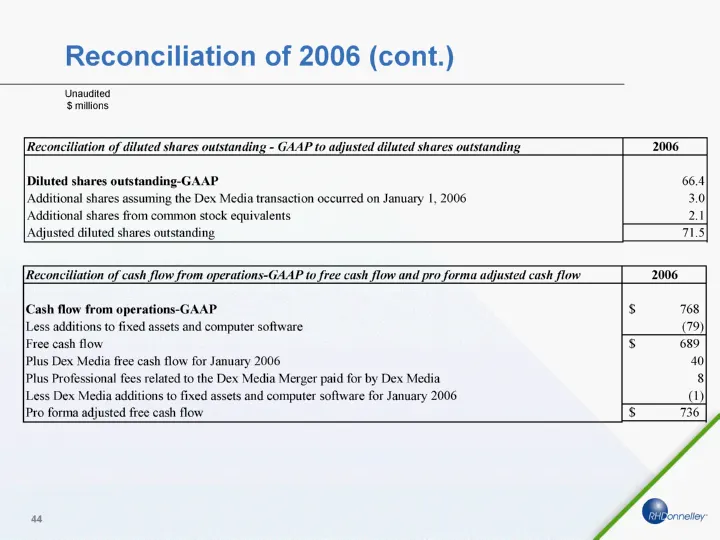
Reconciliation of 2006 (cont.) Unaudited $ millions
Slide 46: Notes to Schedules
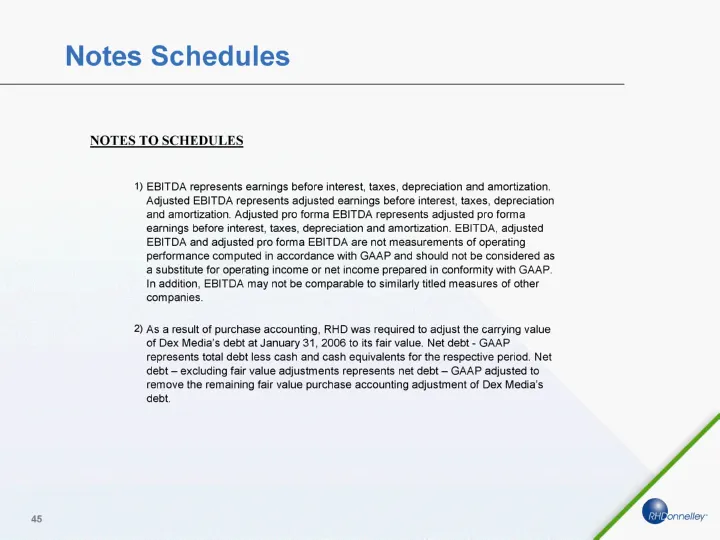
Notes Schedules 4s NOTES TO SCHEDULES 1) EBITDA represents earnings before interest, taxes, depreciation and amortization. Adjusted EBITDA represents adjusted earnings before interest, taxes, depreciation ‘and amortization. Adjusted pro forma EBITDA represents adjusted pro forma samings before inter
Slide 47: Notes to Schedules (cont.)
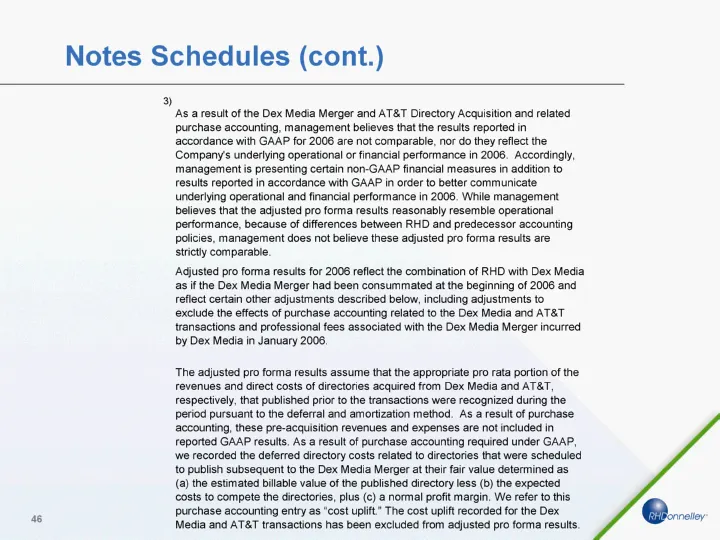
Notes Schedules (cont.) re oy ‘As a result of the Dex Media Merger and AT&T Directory Acquisition and related purchase accounting, management believes thatthe results reported in ‘accordance with GAAP for 2008 are not comparable, nor do they reflect the Company/s underiying operational or financial
Source: SEC EDGAR · 8-K filed Dec 4, 2007
More decks from DEX ONE Corp
 Q4 2012 Earnings Presentation17 slides · Mar 18, 2013
 Merger or Acquisition (December 2012)42 slides · Dec 6, 2012
 Merger or Acquisition (September 2012)51 slides · Sep 18, 2012
 Merger or Acquisition (August 2012)15 slides · Aug 21, 2012
 Q2 2012 Earnings Presentation16 slides · Jul 25, 2012
 Q1 2012 Earnings Presentation17 slides · Apr 26, 2012