Consumers Energy Company · NYSE:CMS/PB
Consumers Energy — Mitsubishi UFJ Securities 2012 Utility Day
37 slides from Consumers Energy's conference presentation, Sep 10, 2012
Slide 1: Mitsubishi UFJ Securities 2012 Utility Day
Mitsubishi UFJ Securities 2012 Utility Day September 11, 2012
Slide 2: Forward-looking statements
This presentation is made as of the date hereof and contains “forward-looking statements” as defined in Rule 3b-6 of the Securities Exchange Act of 1934, as amended, Rule 175 of the Securities Act of 1933, as amended, and relevant legal decisions. The forward-looking statements are subject to risks
Slide 3: Business Model Strong (5% to 7% growth)
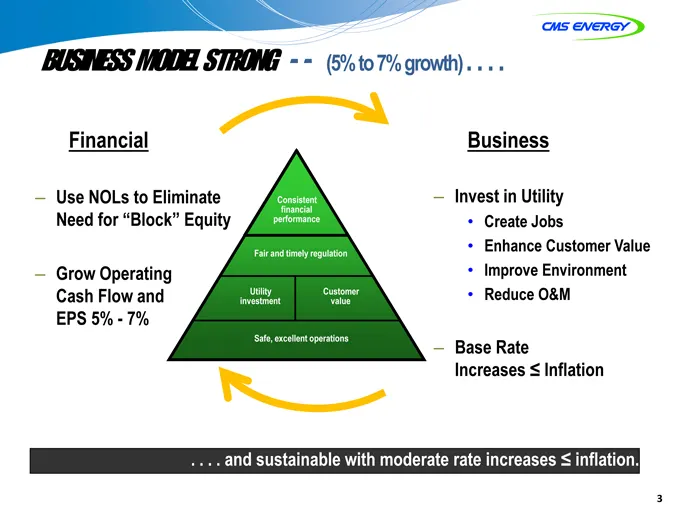
BUSINESS MODEL STRONG—- (5% to 7% growth) . . . . 3 Financial Use NOLs to Eliminate Need for “Block” Equity Grow Operating Cash Flow and EPS 5%—7% Business Invest in Utility Create Jobs Enhance Customer Value Improve Environment Reduce O&M Base Rate Increases ^ Inflation Consistent financial perform
Slide 4: Model: Enablers, Self-Imposed Limits, Risk Mitigation
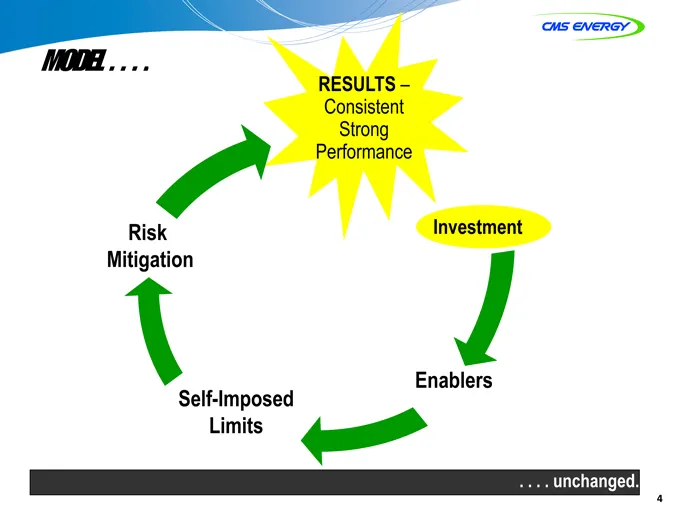
MODEL . . .. . 4 Investment Enablers Self-Imposed Limits Risk Mitigation RESULTS – Consistent Strong Performance . . . . unchanged.
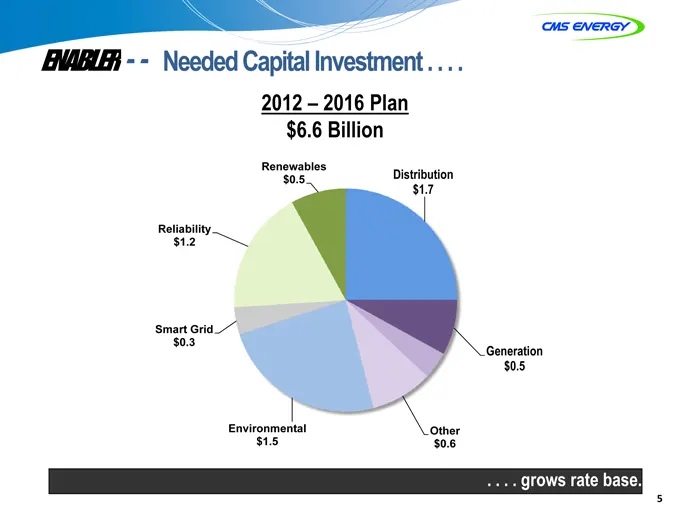
Slide 5: Enabler: Needed Capital Investment grows rate base
ENABLER—- Needed Capital Investment . . . . (CHART) 5 . . . . grows rate base. 2012 – 2016 Plan $6.6 Billion
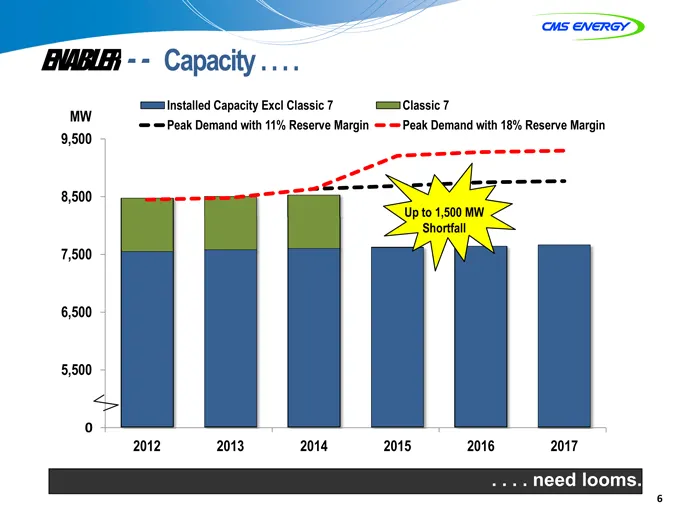
Slide 6: Enabler: Capacity
6 (CHART) Up to 1,500 MW Shortfall 0 . . . . need looms. ENABLER—- Capacity . . . .
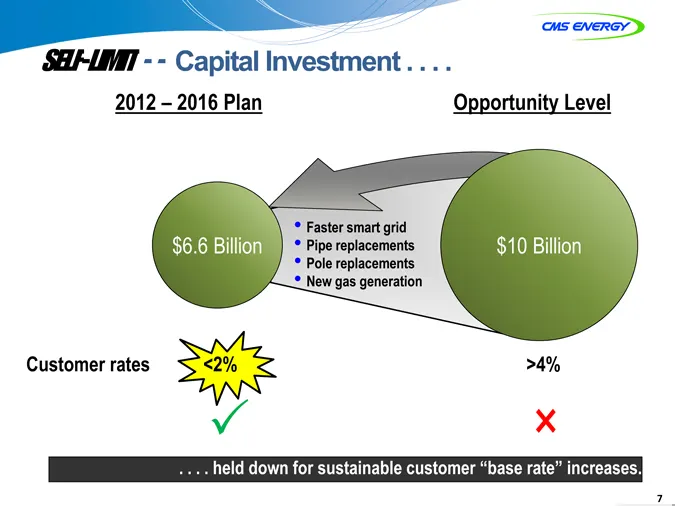
Slide 7: Self-Limit: Capital investment held down for sustainable rates
SELF-LIMIT—- Capital Investment . . . . 7 . . . . held down for sustainable customer “base rate” increases. 2012 – 2016 Plan Customer rates <2% >4% Opportunity Level $6.6 Billion Faster smart grid Pipe replacements Pole replacements New gas generation × $10 Billion
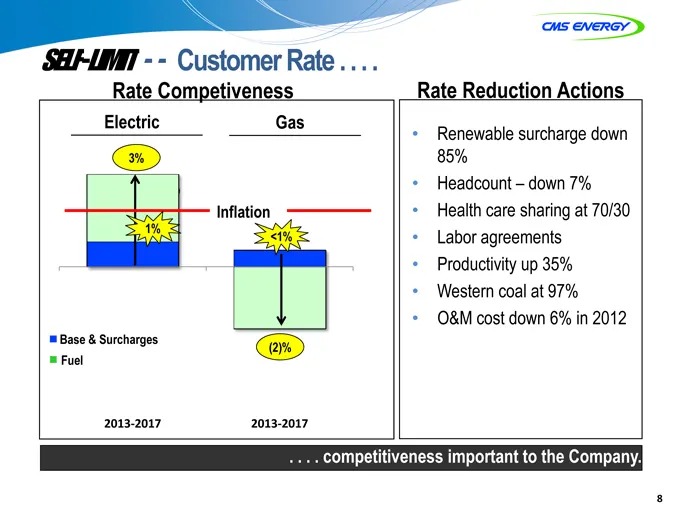
Slide 8: Self-Limit: Customer Rate
SELF-LIMIT—- Customer Rate . . . . Renewable surcharge down 85% Headcount – down 7% Health care sharing at 70/30 Labor agreements Productivity up 35% Western coal at 97% O&M cost down 6% in 2012 8 . . . . competitiveness important to the Company. Rate Competiveness Electric (CHART) Base & Surcharges
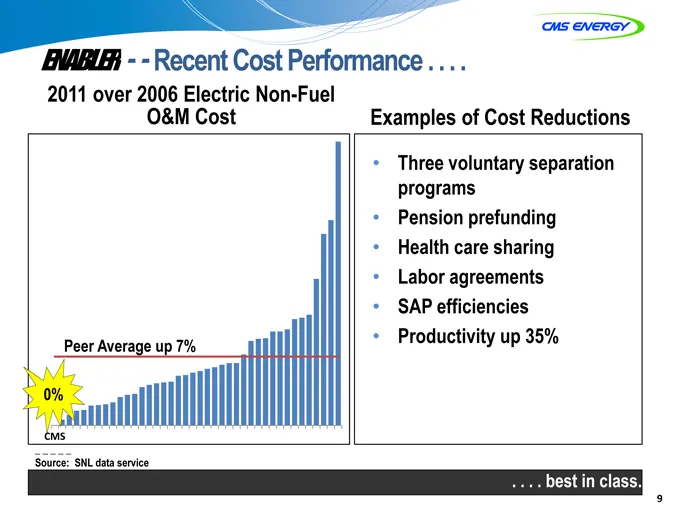
Slide 9: Enabler: Recent Cost Performance
2011 over 2006 Electric Non-Fuel O&M Cost ENABLER—- Recent Cost Performance . . . . Three voluntary separation programs Pension prefunding Health care sharing Labor agreements SAP efficiencies Productivity up 35% 9 . . . . best in class. 0% Peer Average up 7% Examples of Cost Reductions Source: SNL
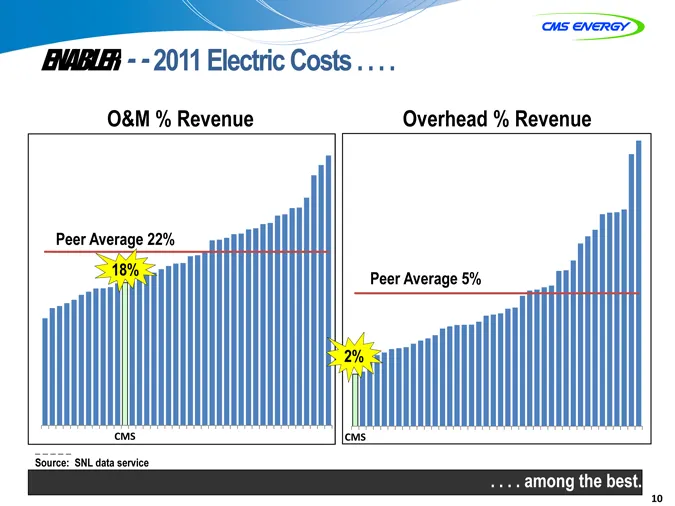
Slide 10: Enabler: 2011 Electric Costs among the best
ENABLER—- 2011 Electric Costs . . . . 10 . . . . among the best. 18% Peer Average 22% Source: SNL data service O&M % Revenue 2% Peer Average 5% Overhead % Revenue
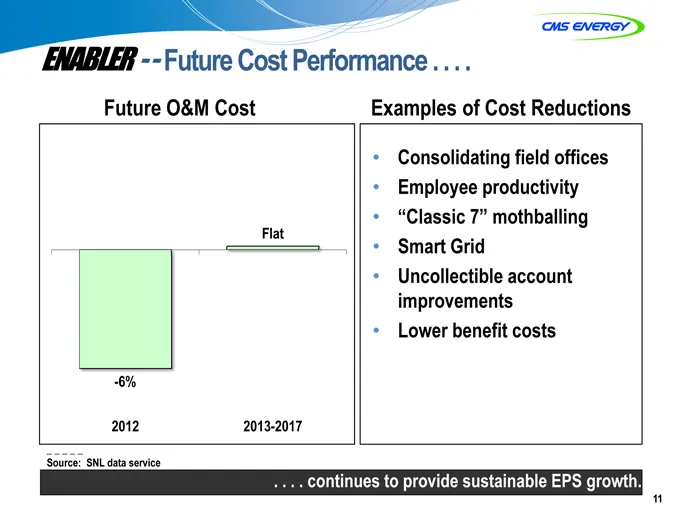
Slide 11: Enabler: Future Cost Performance
ENABLER—- Future Cost Performance . . . . Consolidating field offices Employee productivity “Classic 7” mothballing Smart Grid Uncollectible account improvements Lower benefit costs 11 . . . . continues to provide sustainable EPS growth. Future O&M Cost Examples of Cost Reductions Source: SNL data s
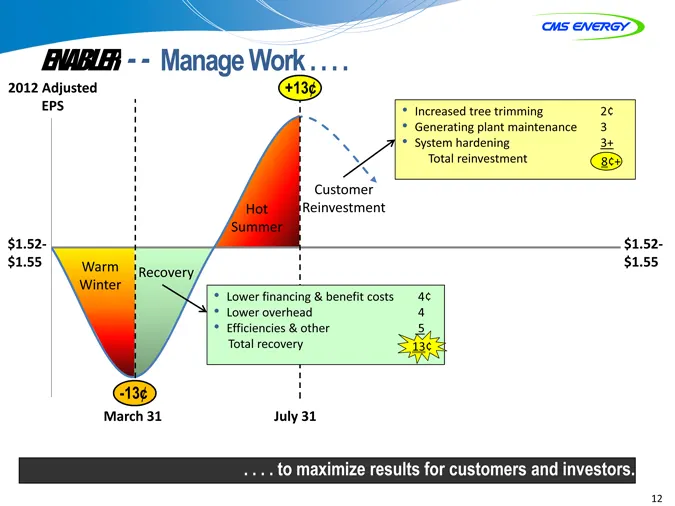
Slide 12: Enabler: Manage Work
ENABLER—- Manage Work . . . . (CHART) . . . . to maximize results for customers and investors. 2012 Adjusted EPS $1.52- $1.55 Warm Winter Recovery $1.52- $1.55 Hot Summer -13¢ -13¢ Customer Reinvestment 12 +13¢ Increased tree trimming 2¢ Generating plant maintenance 3 System hardening 3+ Total reinv
Slide 13: Enabler: Regulatory Strategy
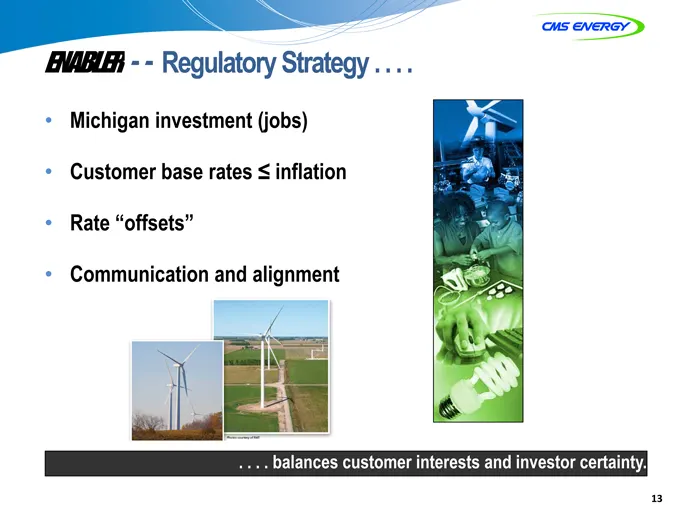
ENABLER—- Regulatory Strategy . . . . Michigan investment (jobs) Customer base rates ^ inflation Rate “offsets” Communication and alignment . . . . balances customer interests and investor certainty. 13
Slide 14: Michigan Public Service Commission
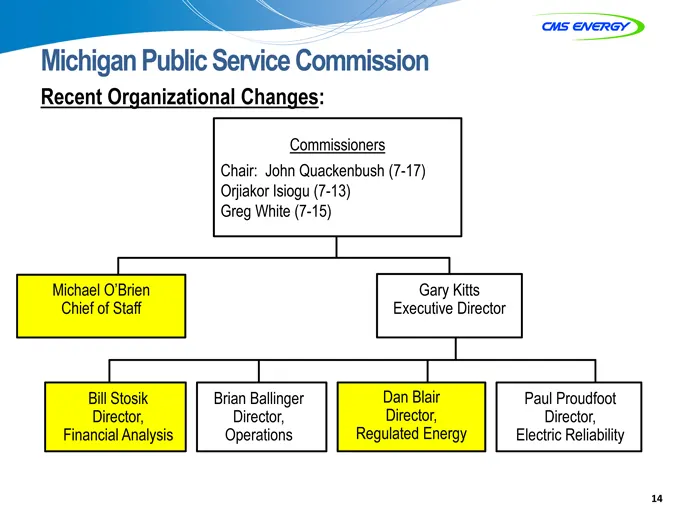
Michigan Public Service Commission 14 Recent Organizational Changes: Commissioners Chair: John Quackenbush (7-17) Orjiakor Isiogu (7-13) Greg White (7-15) Michael O’Brien Chief of Staff Gary Kitts Executive Director Bill Stosik Director, Financial Analysis Brian Ballinger Director, Operations Dan Bl
Slide 15: Enabler: Sales Recovery
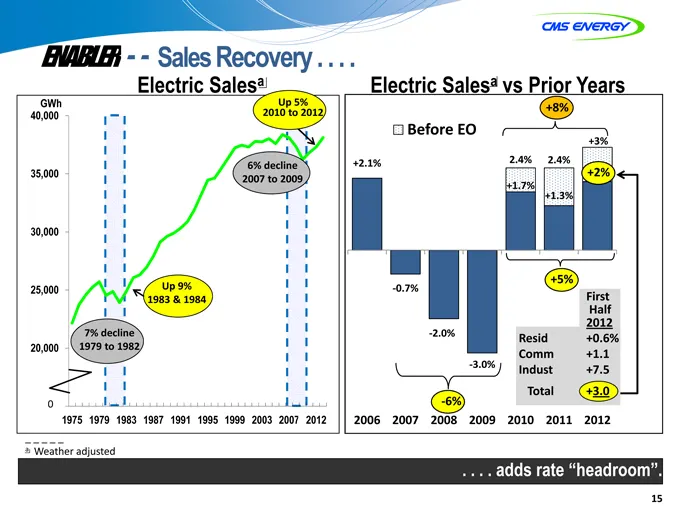
ENABLER—- Sales Recovery . . . . 15 Electric Salesa Electric Salesa vs Prior Years . . . . adds rate “headroom”. (CHART) 0 7% decline 1979 to 1982 6% decline 2007 to 2009 Up 9% 1983 & 1984 Up 5% 2010 to 2012 2012 (CHART) a Weather adjusted -6% +8% +2% +5% First Half 2012 Resid +0.6% Comm +1.1 Indust
Slide 16: Model: Results
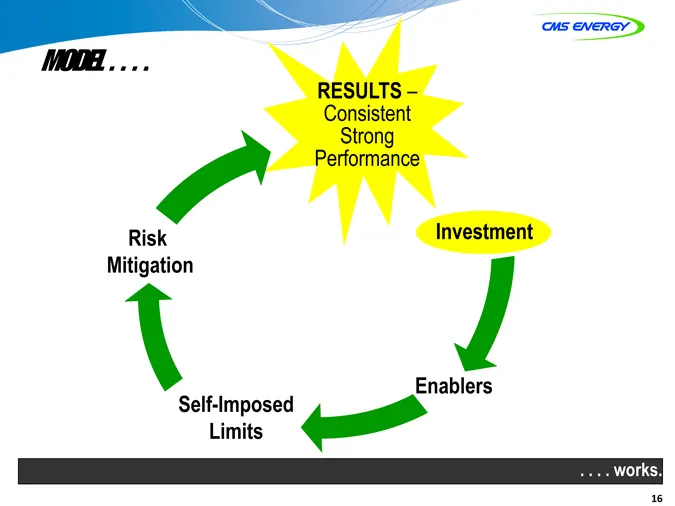
16 MODEL . .. . . Investment Enablers Self-Imposed Limits Risk Mitigation RESULTS – Consistent Strong Performance . . . . works.
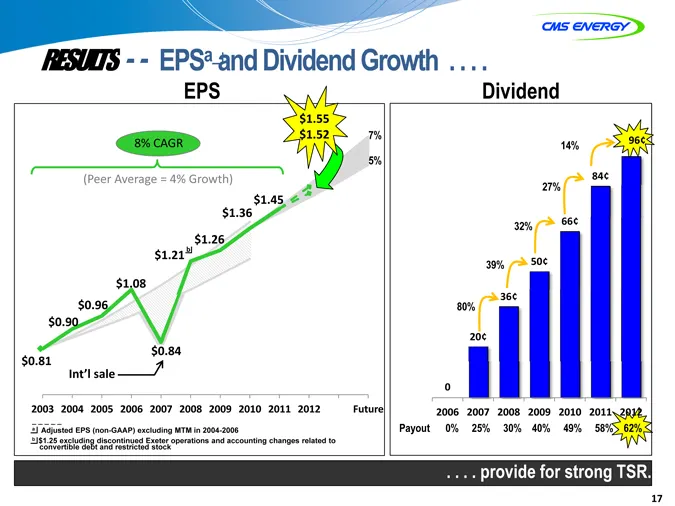
Slide 17: Results: EPS and Dividend Growth
RESULTS—- EPSa and Dividend Growth . . . . 17 . . . . provide for strong TSR. (CHART) $0.81 b a Adjusted EPS (non-GAAP) excluding MTM in 2004-2006 b $1.25 excluding discontinued Exeter operations and accounting changes related to convertible debt and restricted stock $1.55 $1.52 7% 5% (CHART) Payout
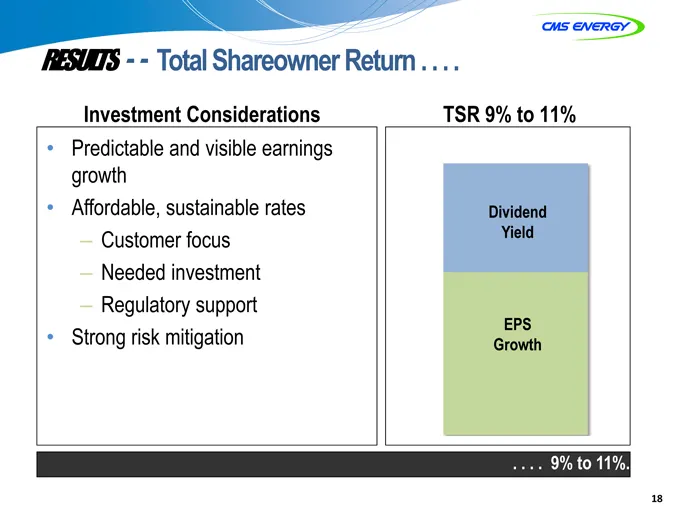
Slide 18: Results: Total Shareowner Return
RESULTS—- Total Shareowner Return . . . . Predictable and visible earnings growth Affordable, sustainable rates Customer focus Needed investment Regulatory support Strong risk mitigation Strong risk mitigation Strong risk mitigation Strong risk mitigation Strong risk mitigation Strong risk mitigatio
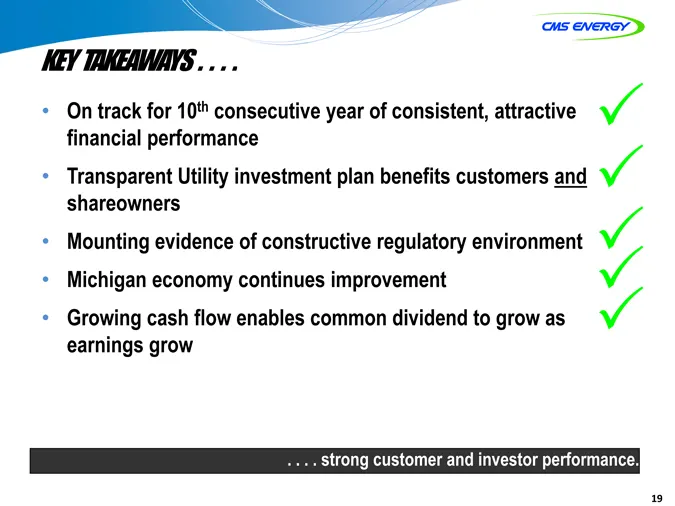
Slide 19: Key Takeaways
Key Takeaways . . . . On track for 10th consecutive year of consistent, attractive financial performance Transparent Utility investment plan benefits customers and shareowners Mounting evidence of constructive regulatory environment Michigan economy continues improvement Growing cash flow enables co
Slide 20: Appendix
APPENDIX
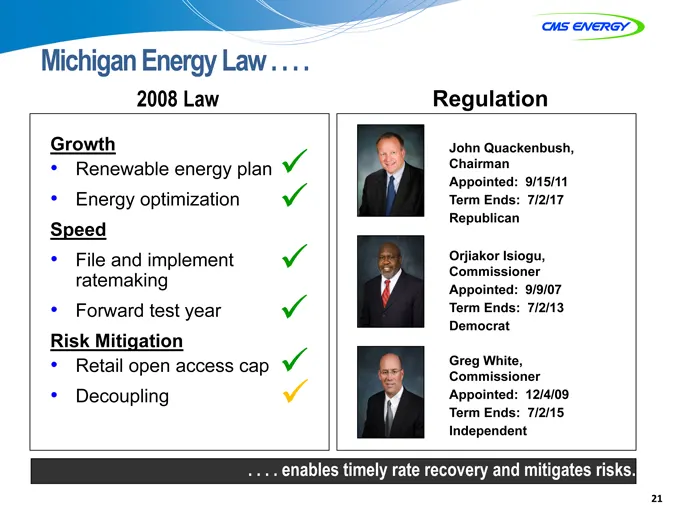
Slide 21: Michigan Energy Law
Michigan Energy Law . . . . 21 Growth Renewable energy plan Energy optimization Speed File and implement ratemaking Forward test year Risk Mitigation Retail open access cap Decoupling . . . . enables timely rate recovery and mitigates risks. Regulation John Quackenbush, Chairman Appointed: 9/15/11 T
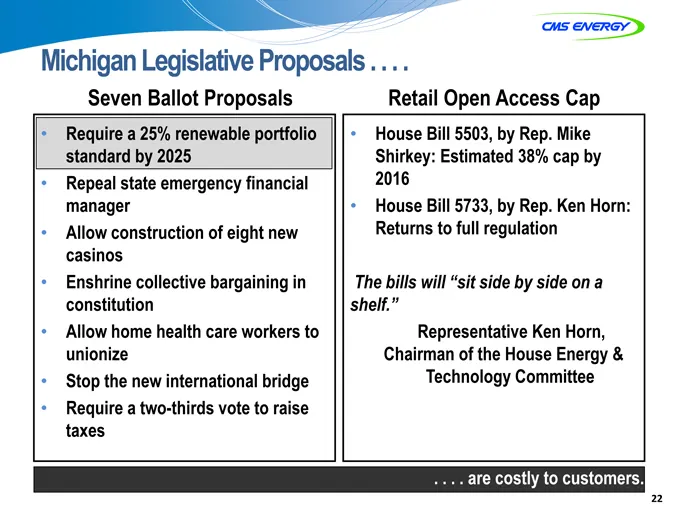
Slide 22: Michigan Legislative Proposals
Michigan Legislative Proposals . . . . Require a 25% renewable portfolio standard by 2025 Repeal state emergency financial manager Allow construction of eight new casinos Enshrine collective bargaining in constitution Allow home health care workers to unionize Stop the new international bridge Requi
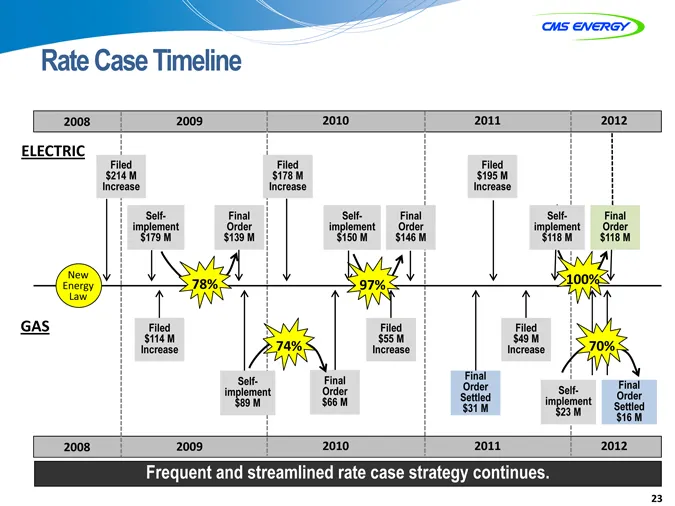
Slide 23: Rate Case Timeline
Rate Case Timeline 23 2008 2009 Frequent and streamlined rate case strategy continues. 2010 2011 2012 2008 2009 2010 2011 2012 Filed $214 M Increase Final Order $139 M Self- implement $179 M ELECTRIC GAS Filed $178 M Increase Self- implement $150 M Final Order $146 M Filed $195 M Increase Self- impl
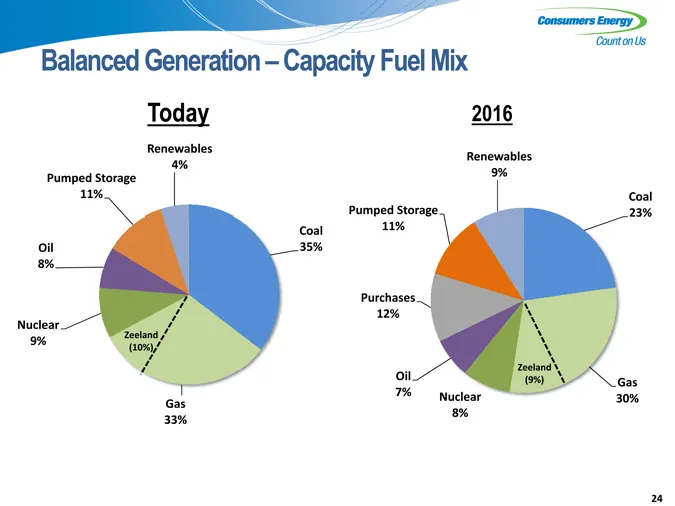
Slide 24: Balanced Generation Capacity and Fuel Mix
Balanced Generation – Capacity Fuel Mix 24 (CHART) (CHART) Present 2016 (CHART) (CHART) (CHART) Today
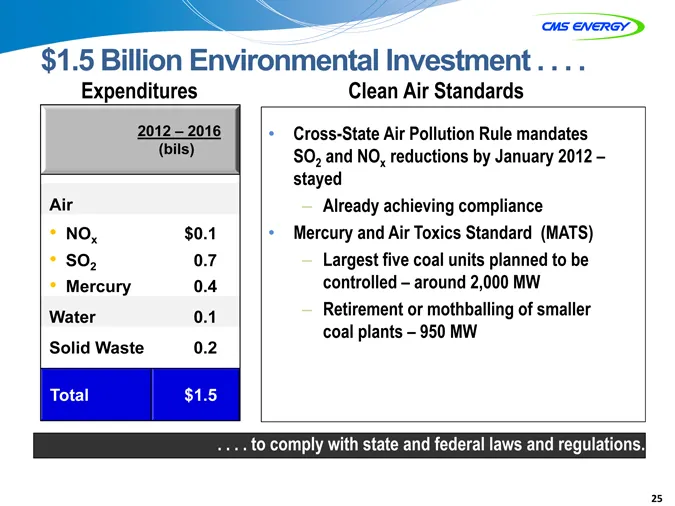
Slide 25: Environmental Investment $1.5 Billion
$1.5 Billion Environmental Investment . . . . 25 . . . . to comply with state and federal laws and regulations. 2012 – 2016 (bils) 2012 – 2016 (bils) Air NOx $0.1 SO2 0.7 Mercury 0.4 Water 0.1 Solid Waste 0.2 Total $1.5 Expenditures Clean Air Standards Cross-State Air Pollution Rule mandates SO2 and
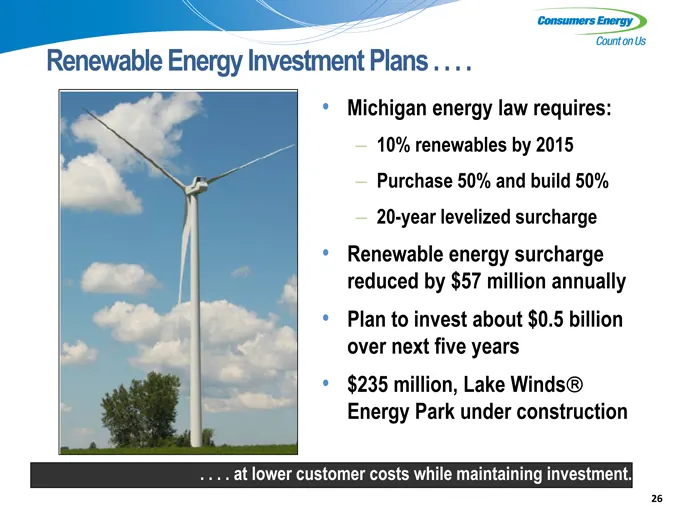
Slide 26: Renewable Energy Investment Plans
Renewable Energy Investment Plans . . . . 26 Michigan energy law requires: 10% renewables by 2015 Purchase 50% and build 50% 20-year levelized surcharge Renewable energy surcharge reduced by $57 million annually Plan to invest about $0.5 billion over next five years $235 million, Lake Winds Energy P
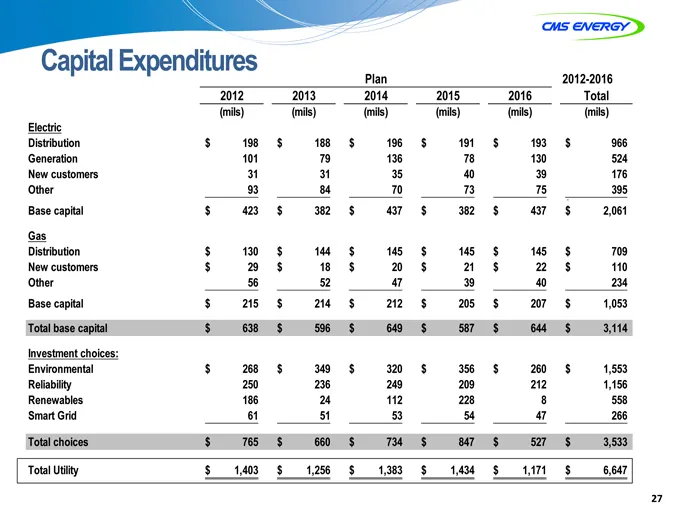
Slide 27: Capital Expenditures Plan 2012-2016
Capital Expenditures Plan 2012-2016 2012 2013 2014 2015 2016 Total (mils) (mils) (mils) (mils) (mils) (mils) Electric Distribution $ 198 $ 188 $ 196 $ 191 $ 193 $ 966 Generation 101 79 136 78 130 524 New customers 31 31 35 40 39 176 Other 93 84 70 73 75 $ 395 Base capital $ 423 $ 382 $ 437 $ 382 $ 4
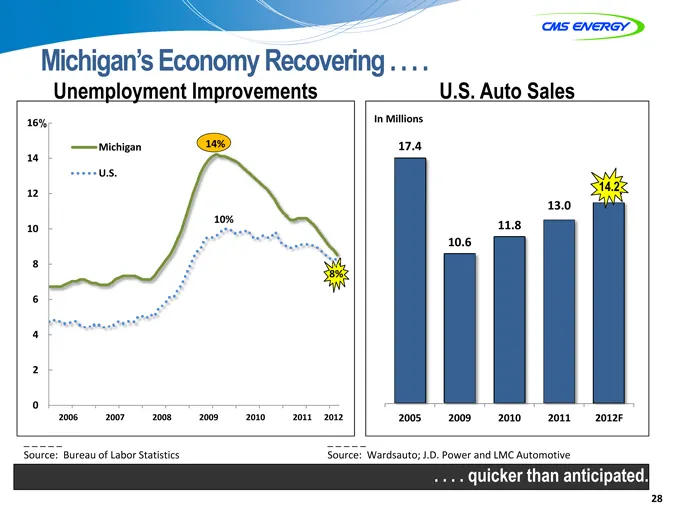
Slide 28: Michigan's Economy
Michigan’s Economy Recovering . . . . 28 . . . . quicker than anticipated. U.S. Auto Sales Source: Wardsauto; J.D. Power and LMC Automotive Source: Wardsauto; J.D. Power and LMC Automotive Source: Wardsauto; J.D. Power and LMC Automotive Unemployment Improvements Source: Bureau of Labor Statistics %
Slide 29: Federal Tax Benefits
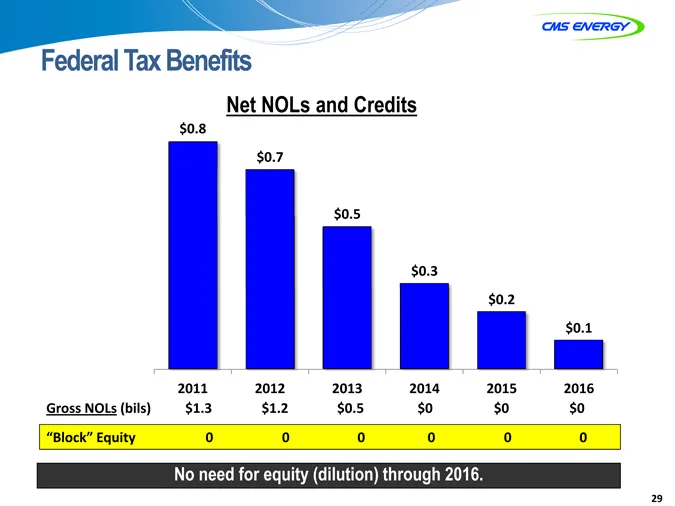
Federal Tax Benefits 29 No need for equity (dilution) through 2016. (CHART) Gross NOLs (bils) $1.3 $1.2 $0.5 $0 $0 $0 “Block” Equity 0 0 0 0 0 0 Net NOLs and Credits
Slide 30: Liquidity
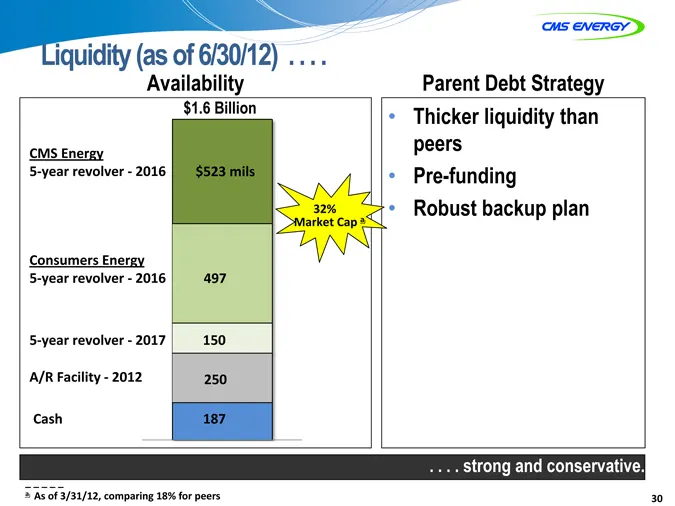
Liquidity (as of 6/30/12) . . . . 30 . . . . strong and conservative. Thicker liquidity than peers Pre-funding Robust backup plan Availability Parent Debt Strategy (CHART) CMS Energy 5-year revolver—2016 Consumers Energy 5-year revolver—2016 5-year revolver—2017 A/R Facility—2012 Cash $523 mils 497
Slide 31: Sensitivities
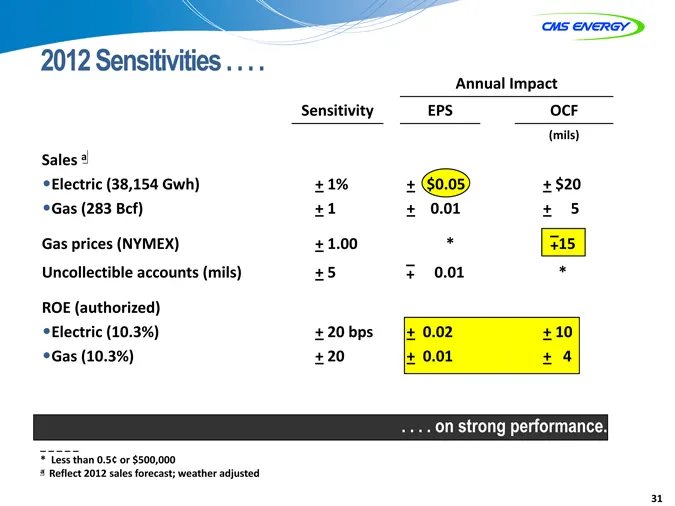
2012 Sensitivities . . . . 31 * Less than 0.5¢ or $500,000 a Reflect 2012 sales forecast; weather adjusted Annual Impact Annual Impact Annual Impact Sensitivity EPS OCF (mils) Sales aElectric (38,154 Gwh)Gas (283 Bcf) + 1% + 1 + $0.05+ 0.01 + $20 + 5 Gas prices (NYMEX) + 1.00 * 15 Uncollectible acco
Slide 32: Maturity Schedule of Long-Term Debt and Preferred Securities
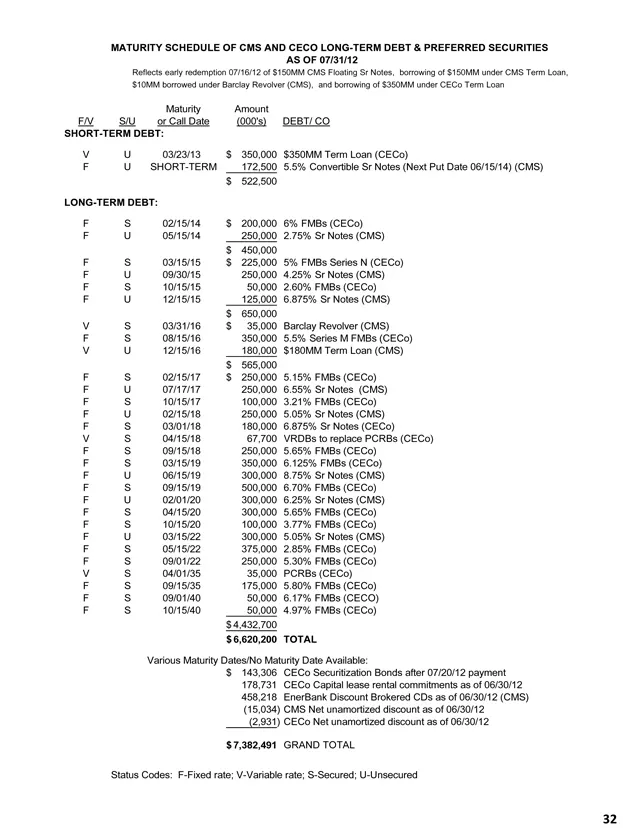
MATURITY SCHEDULE OF CMS AND CECO LONG-TERM DEBT & PREFERRED SECURITIES AS OF 07/31/12 Reflects early redemption 07/16/12 of $150MM CMS Floating Sr Notes, borrowing of $150MM under CMS Term Loan, $10MM borrowed under Barclay Revolver (CMS), and borrowing of $350MM under CECo Term Loan Maturity Amoun
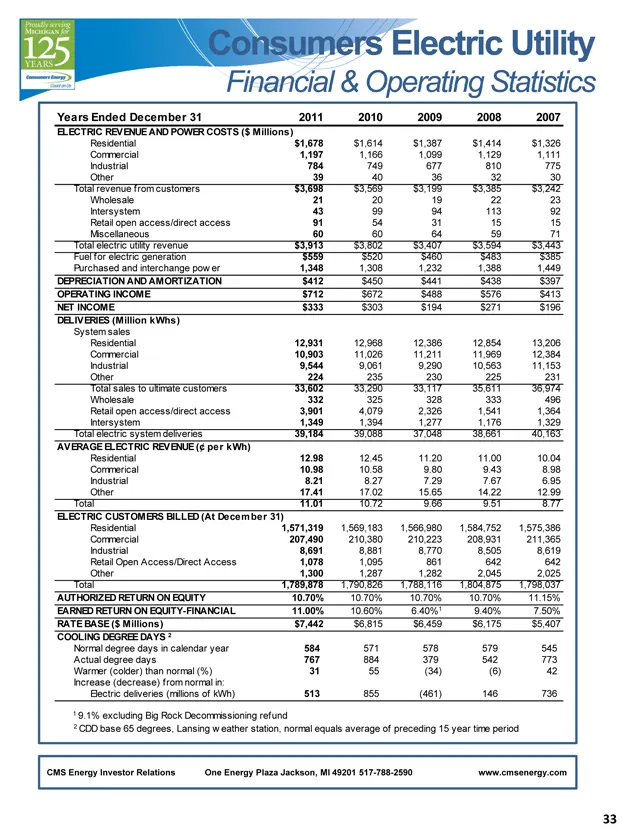
Slide 33: Consumers Electric Utility Financial & Operating Statistics
Consumers Electric Utility Financial & Operating Statistics Years Ended December 31 2011 2010 2009 2008 2007 ELECTRIC REVENUE AND POWER COSTS ($ Millions) Residential $1,678 $1,614 $1,387 $1,414 $1,326 Commercial 1,197 1,166 1,099 1,129 1,111 Industrial 784 749 677 810 775 Other 39 40 36 32 30 Total
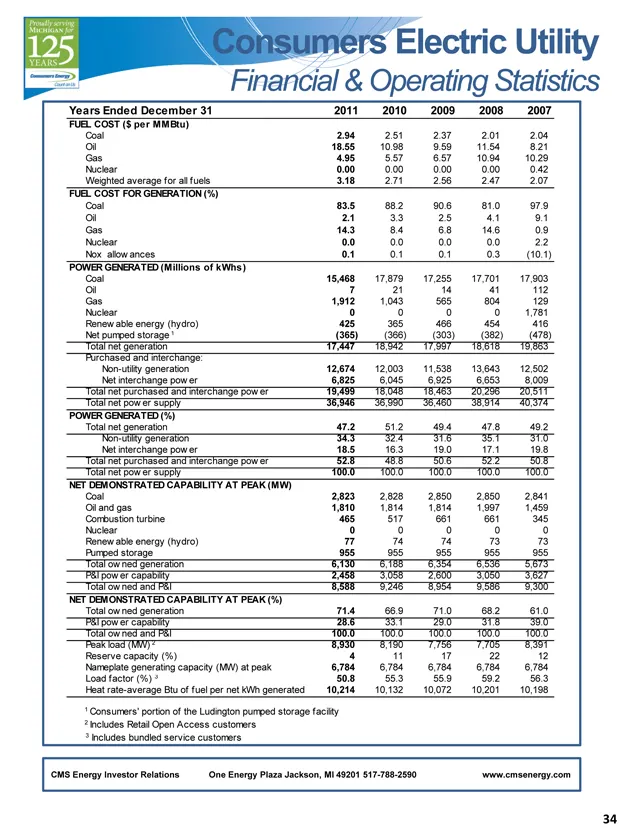
Slide 34: Consumers Electric Utility Financial & Operating Statistics
Consumers Electric Utility Financial & Operating Statistics Years Ended December 31 2011 2010 2009 2008 2007 FUEL COST ($ per MMBtu) Coal 2.94 2.51 2.37 2.01 2.04 Oil 18.55 10.98 9.59 11.54 8.21 Gas 4.95 5.57 6.57 10.94 10.29 Nuclear 0.00 0.00 0.00 0.00 0.42 Weighted average for all fuels 3.18 2.71
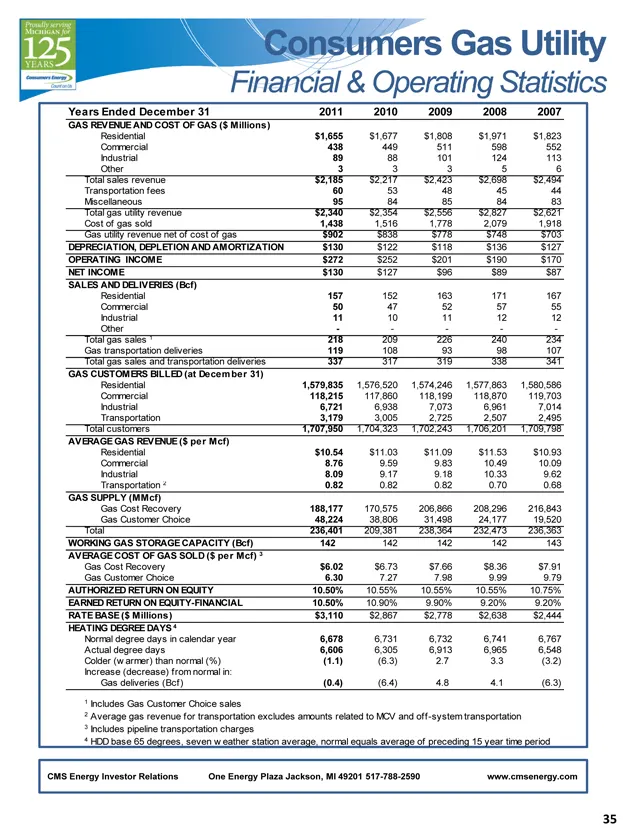
Slide 35: Consumers Gas Utility Financial & Operating Statistics
Consumers Gas Utility Financial & Operating Statistics Years Ended December 31 2011 2010 2009 2008 2007 GAS REVENUE AND COST OF GAS ($ Millions) Residential $1,655 $1,677 $1,808 $1,971 $1,823 Commercial 438 449 511 598 552 Industrial 89 88 101 124 113 Other 3 3 3 5 6 Total sales revenue $2,185 $2,21
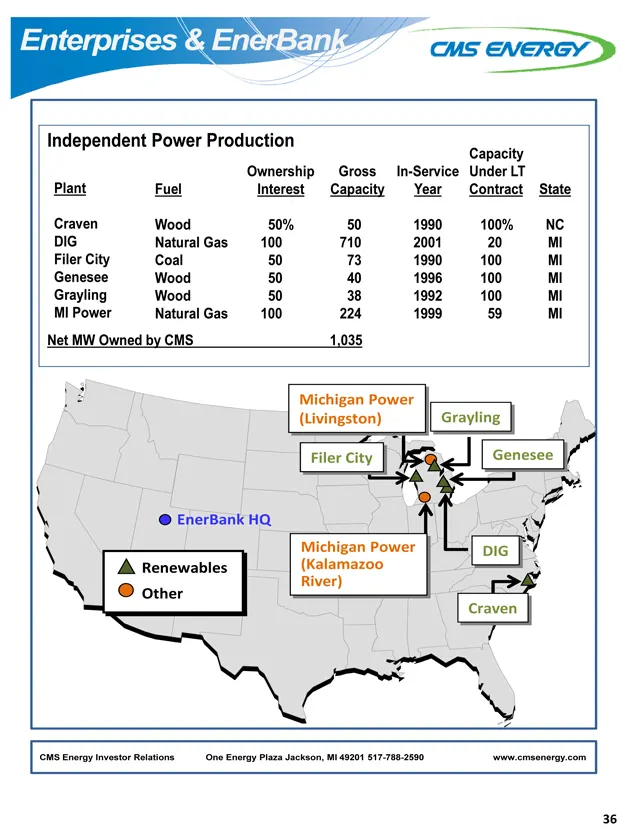
Slide 36: Enterprises & EnerBank
Enterprises & EnerBank Independent Power Production Capacity Ownership Gross In-Service Under LT Plant Fuel Interest Capacity Year Contract State Craven Wood 50% 50 1990 100% NC DIG Natural Gas 100 710 2001 20 MI Filer City Coal 50 73 1990 100 MI Genesee Wood 50 40 1996 100 MI Grayling Wood 50 38 19

Slide 37: GAAP Reconciliation
GAAP RECONCILIATION CMS ENERGY CORPORATION Earnings Per Share By Year GAAP Reconciliation (Unaudited) 2003 2004 2005 2006 2007 2008 2009 2010 2011 Reported earnings (loss) per share - GAAP ($ 0.30 ) $ 0.64 ($ 0.44 ) ($ 0.41 ) ($ 1.02 ) $ 1.20 $ 0.91 $ 1.28 $ 1.58 After-tax items: Electric and gas ut
Source: SEC EDGAR · 8-K filed Sep 10, 2012
More decks from Consumers Energy Company
 FY2024 Earnings Presentation33 slides · Feb 6, 2025
 Technical Presentation (August 2024)8 slides · August 2024
 Technical Presentation (August 2024)8 slides · August 2024
 Corporate Update (August 2024)8 slides · August 2024
 Corporate Update (August 2024)8 slides · August 2024
 Corporate Update (September 2023)22 slides · Sep 28, 2023