NuStar Energy LP — 2019 RBC Capital Markets Midstream Conference
32 slides from NuStar Energy LP's conference presentation, Nov 20, 2019
Slide 1: 2019 RBC Capital Markets Midstream Conference
2019 RBC Capital Markets Midstream Conference November 20, 2019
Slide 2: Forward-Looking Statements
Forward-Looking Statements Statements contained in this presentation other than statements of historical fact are forward-looking statements. While these forward-looking statements, and any assumptions upon which they are based, are made in good faith and reflect our current judgment regarding the d
Slide 3: Building on the Strong Foundation We Established in 2018
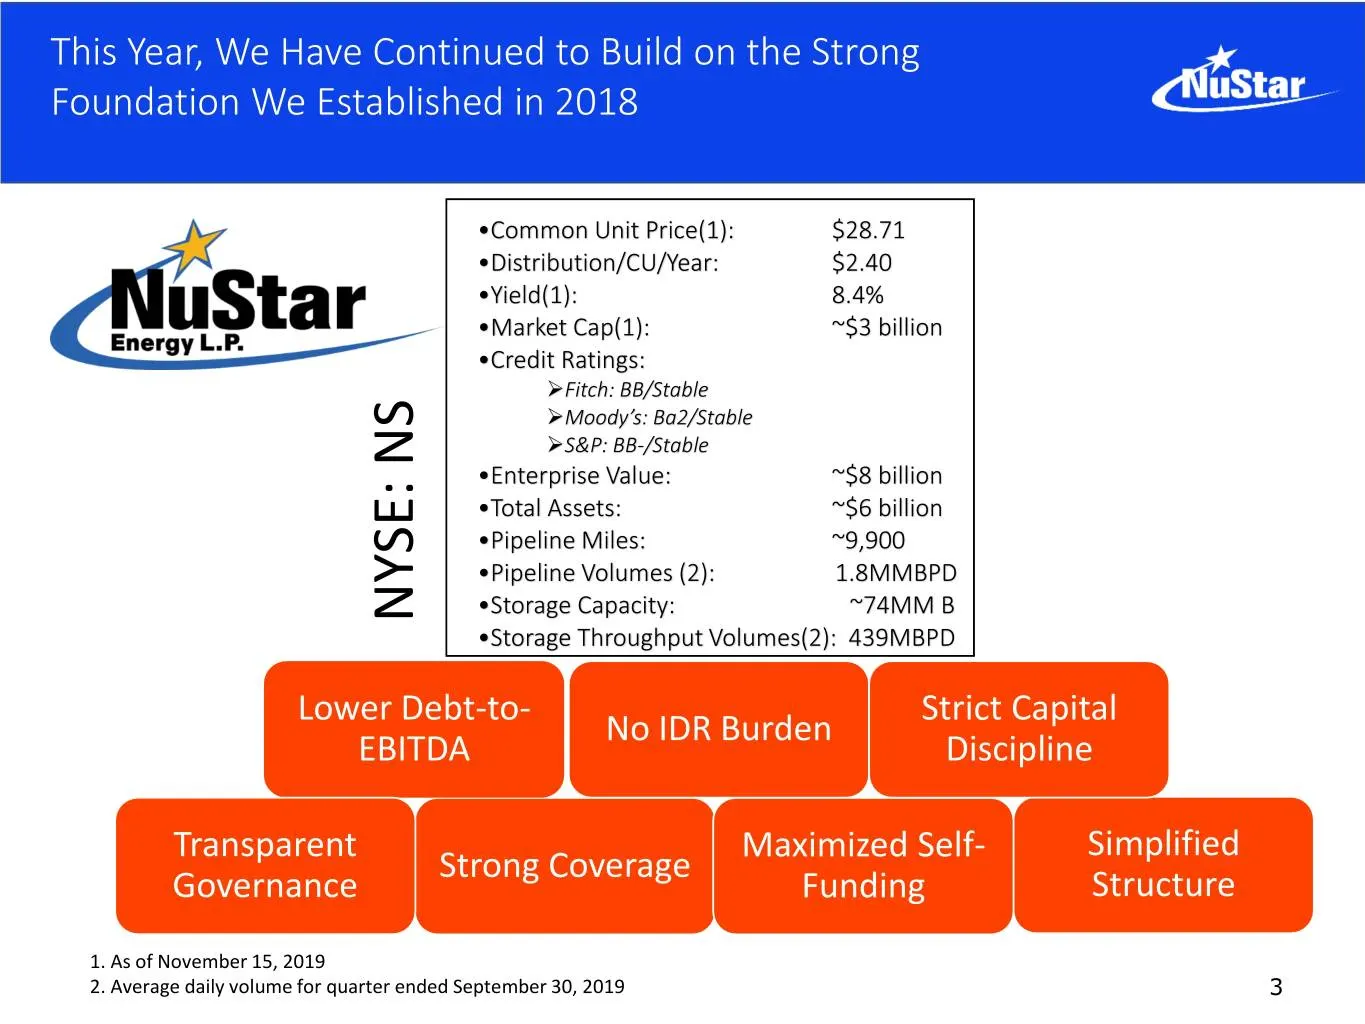
FoundationWe Established in2018 This Year,We Have Continued toon theStrongBuild 2. Average2. daily volume quarterfor ended September 2019 30, As 1. of November 2019 15, Governance Transparent Lower Debt EBITDA NYSE: NS Strong Coverage - • • • • • • • • • • • to Storage Throughput Volumes(2): 439MBPD
Slide 4: Third Quarter 2019 Results Demonstrate Our Progress and Growth
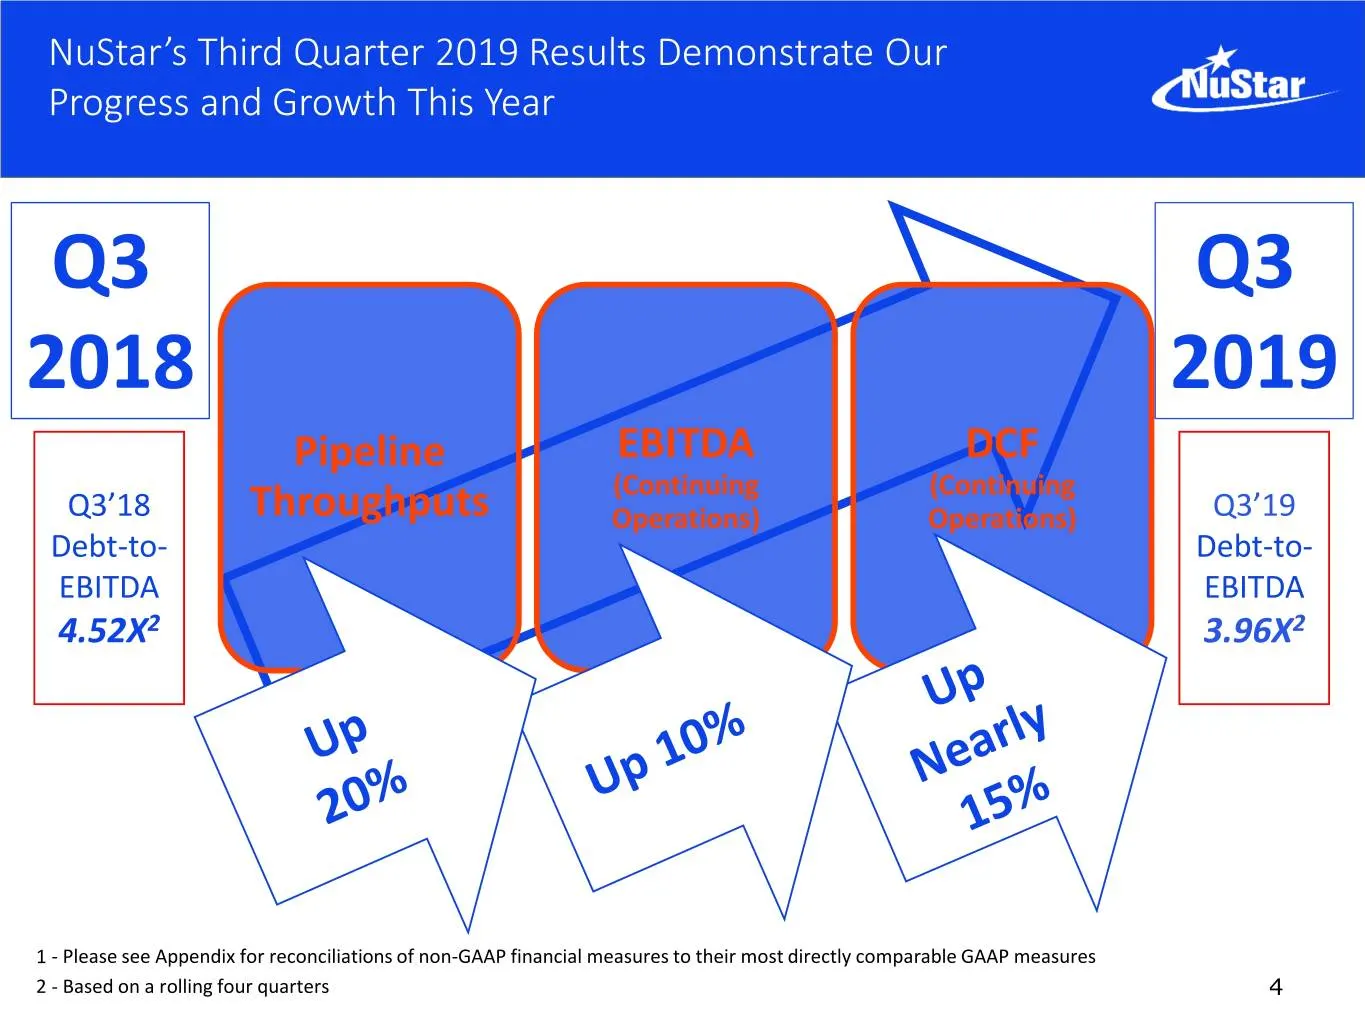
NuStar’s Third Quarter 2019 Results Demonstrate Our Progress and Growth This Year Q3 Q3 2018 2019 Pipeline EBITDA DCF (Continuing (Continuing Q3’18 Throughputs Operations) Operations) Q3’19 Debt-to- Debt-to- EBITDA EBITDA 4.52X2 3.96X2 1 - Please see Appendix for reconciliations of non-GAAP financia
Slide 5: Recent Divestitures Allowed NuStar to Lower Leverage
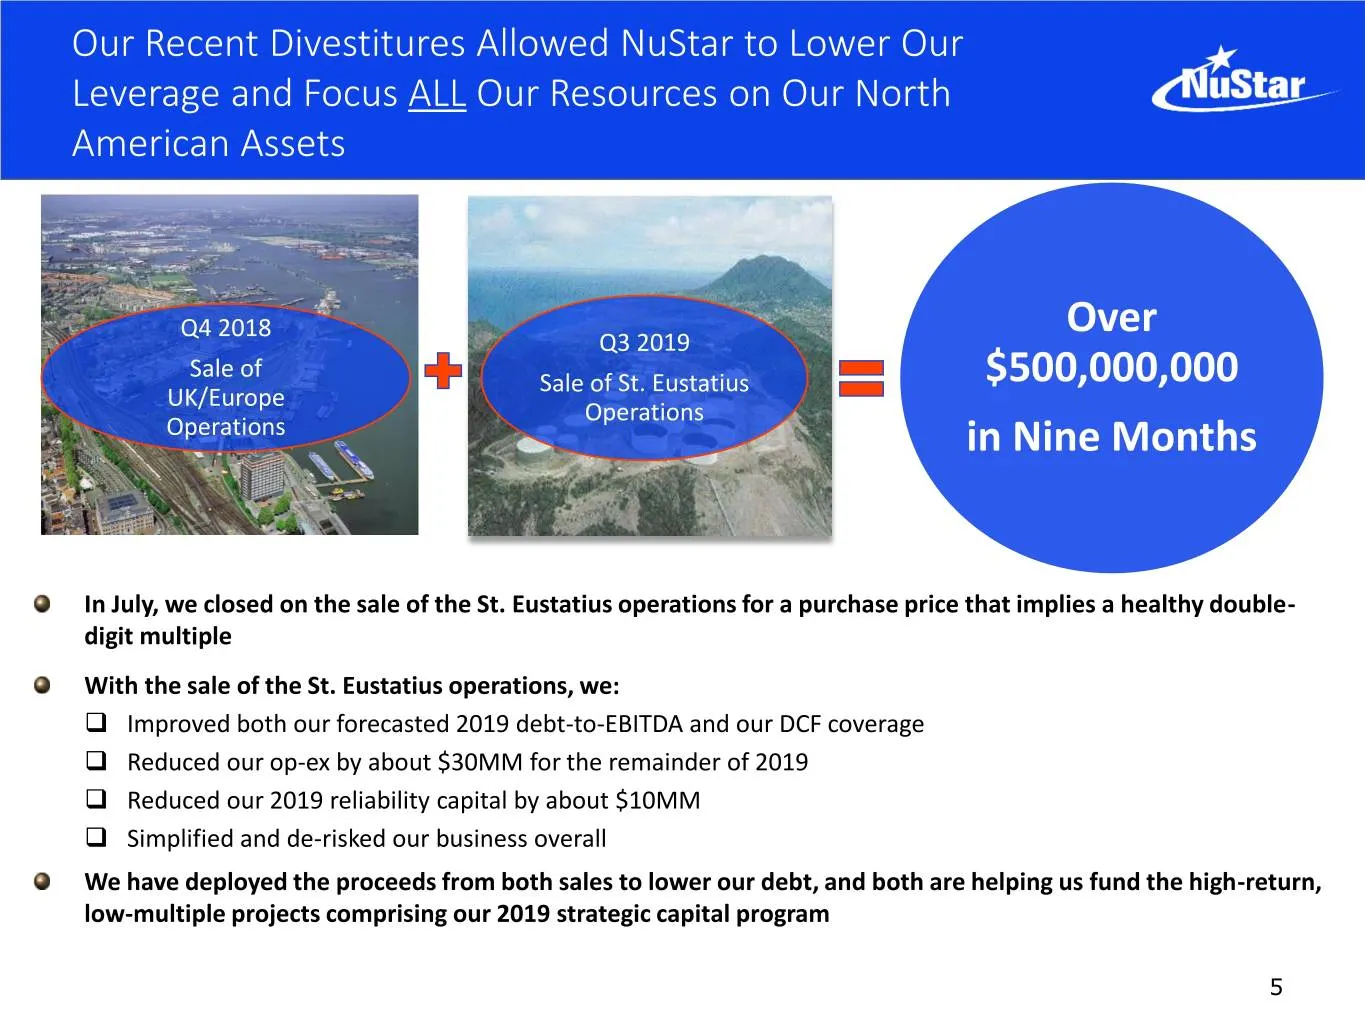
Our Recent Divestitures Allowed NuStar to Lower Our Leverage and Focus ALL Our Resources on Our North American Assets Q4 2018 Over Q3 2019 Sale of Sale of St. Eustatius $500,000,000 UK/Europe Operations Operations in Nine Months In July, we closed on the sale of the St. Eustatius operations for a pu
Slide 6: 2019 Capital Spending Program of $485-515MM
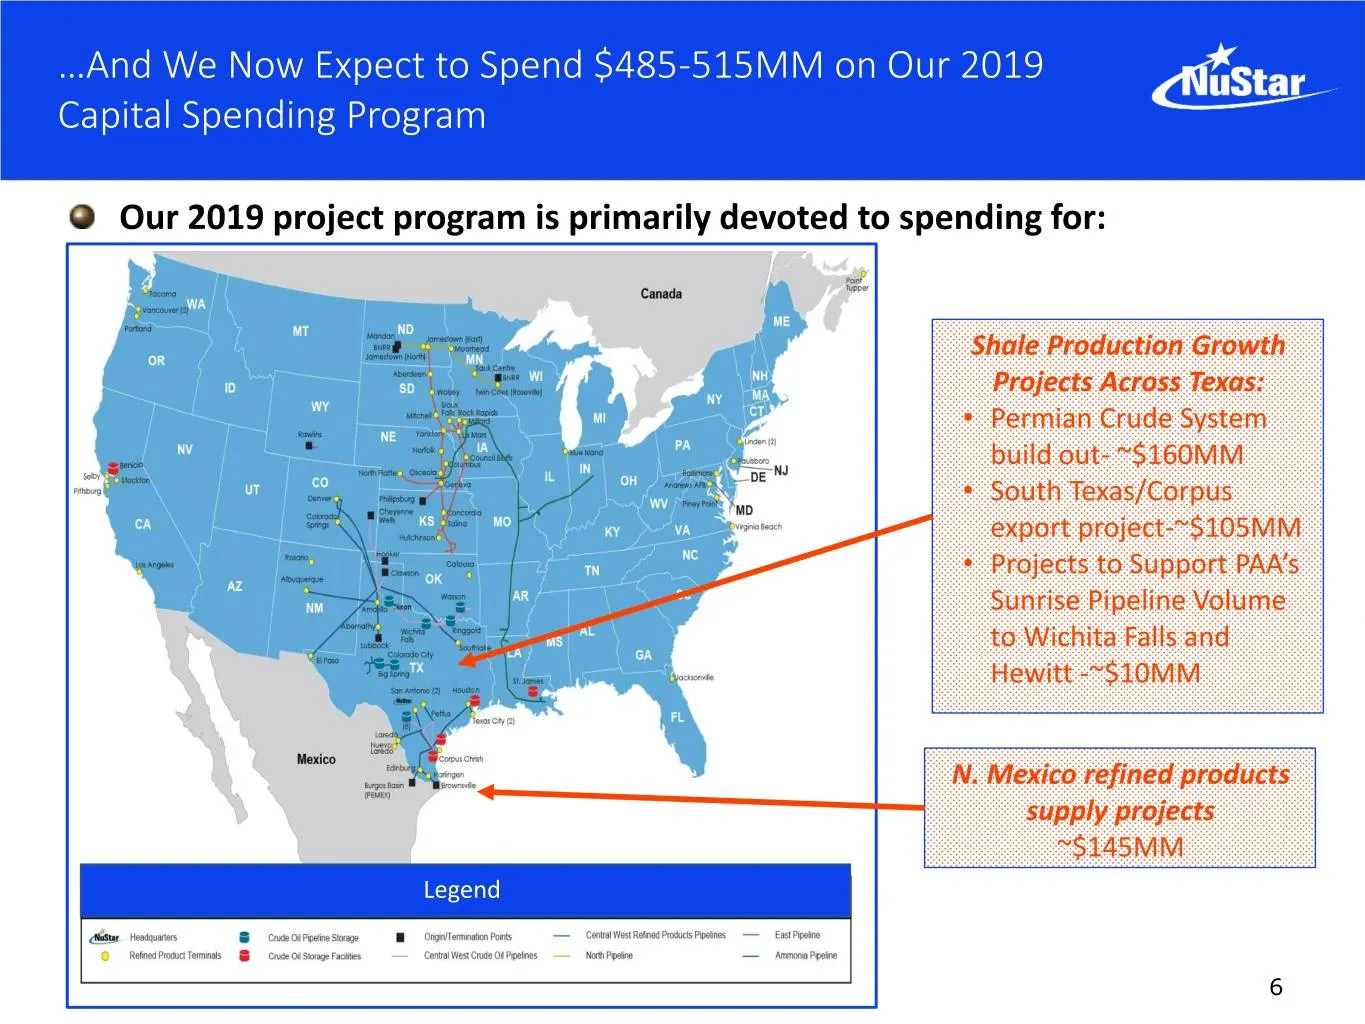
…And We Now Expect to Spend $485-515MM on Our 2019 Capital Spending Program Our 2019 project program is primarily devoted to spending for: Shale Production Growth Projects Across Texas: • Permian Crude System build out- ~$160MM • South Texas/Corpus export project-~$105MM • Projects to Support PAA’s
Slide 7: Growth in Shale Production Continues to Drive Growth and Opportunities
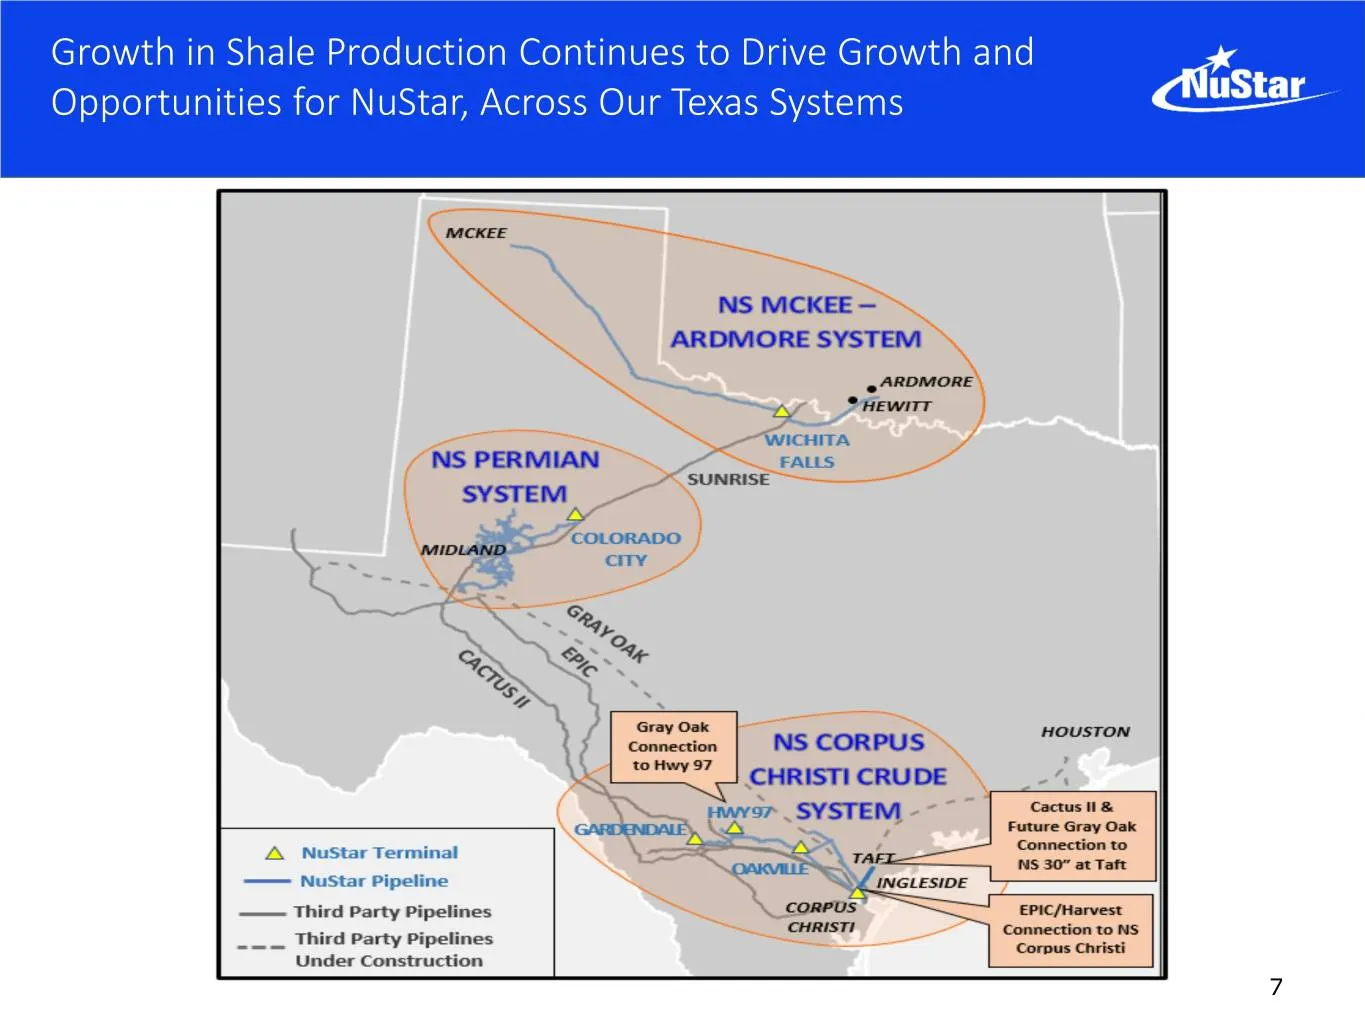
Growth in Shale Production Continues to Drive Growth and Opportunities for NuStar, Across Our Texas Systems 7
Slide 8: Permian Crude System: Expanding and Connecting
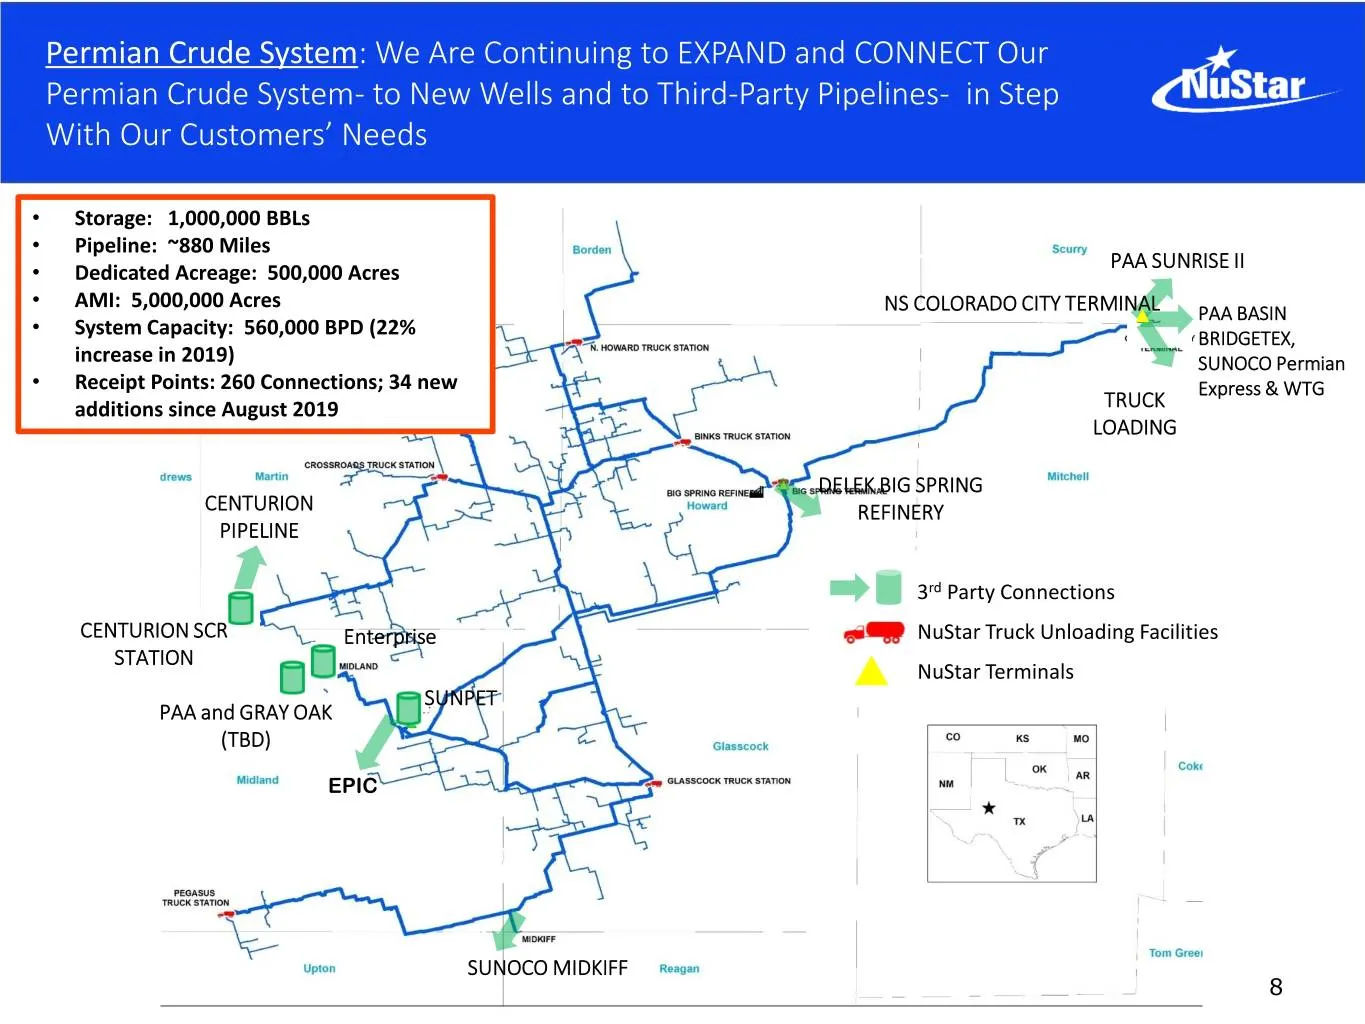
Permian Crude System: We Are Continuing to EXPAND and CONNECT Our Permian Crude System- to New Wells and to Third-Party Pipelines- in Step With Our Customers’ Needs • Storage: 1,000,000 BBLs • Pipeline: ~880 Miles PAA SUNRISE II • Dedicated Acreage: 500,000 Acres • AMI: 5,000,000 Acres NS COLORADO C
Slide 9: Permian Crude System: Receipts and EBITDA Continue to Grow
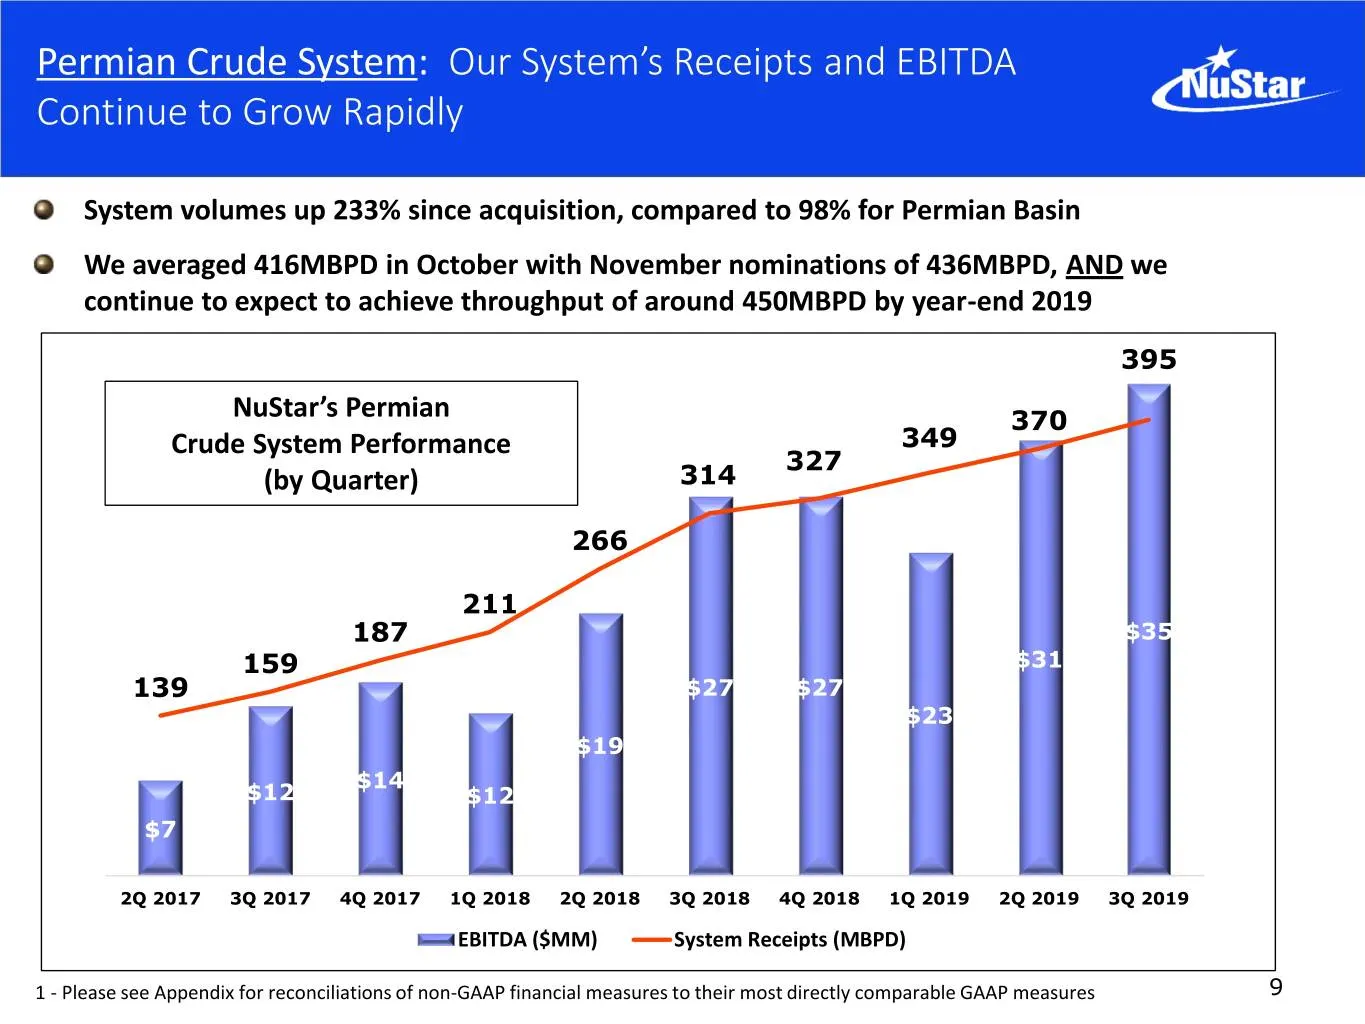
Permian Crude System: Our System’s Receipts and EBITDA Continue to Grow Rapidly System volumes up 233% since acquisition, compared to 98% for Permian Basin We averaged 416MBPD in October with November nominations of 436MBPD, AND we continue to expect to achieve throughput of around 450MBPD by year-e
Slide 10: Corpus Christi Crude System: Utilization Has Increased
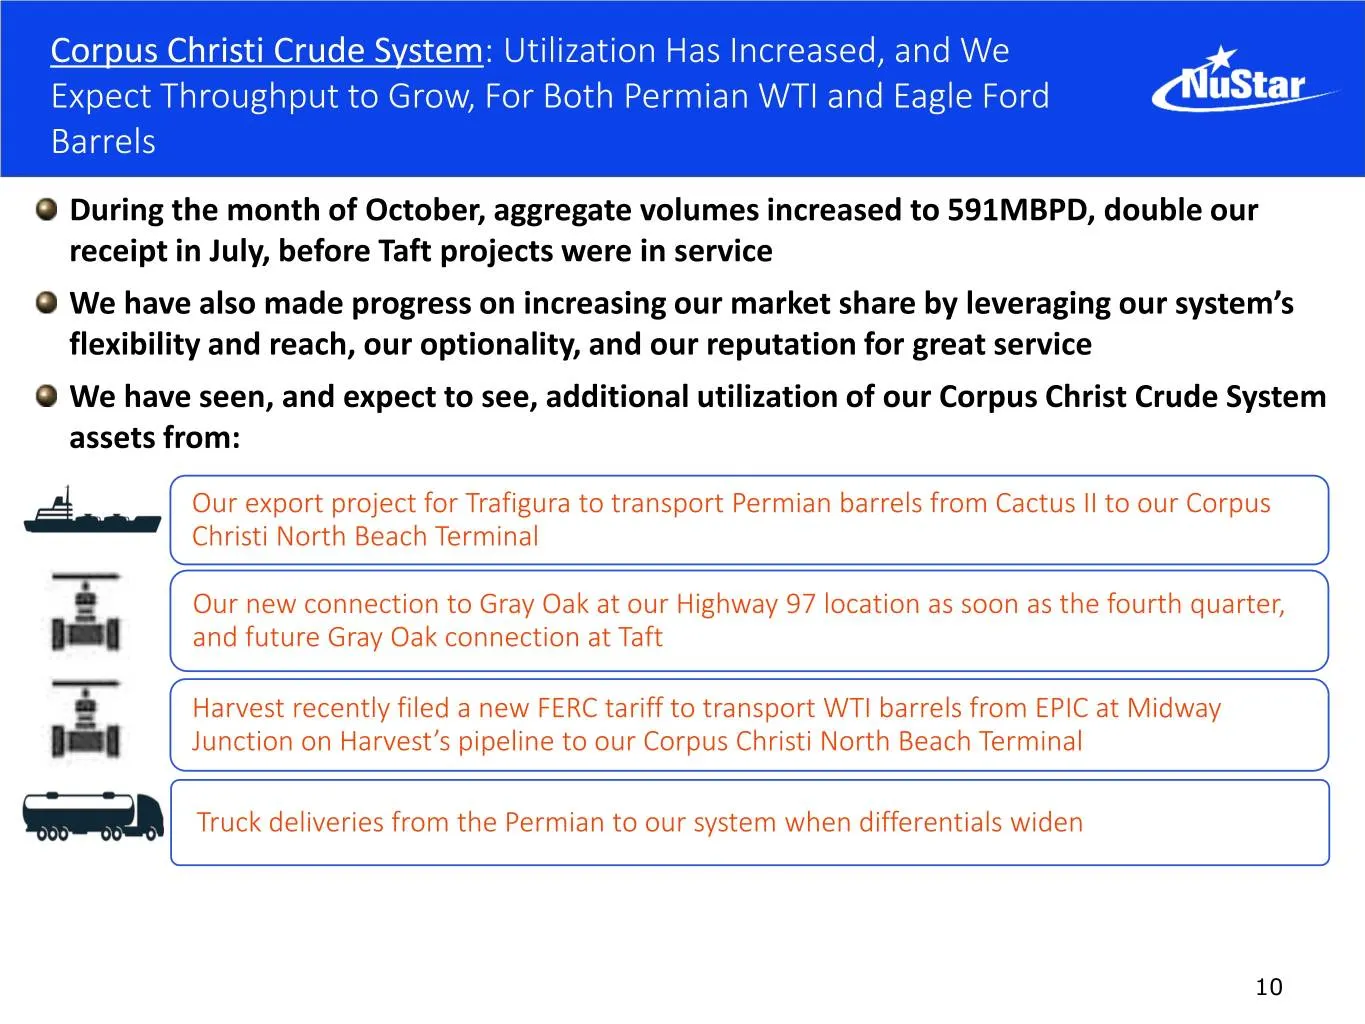
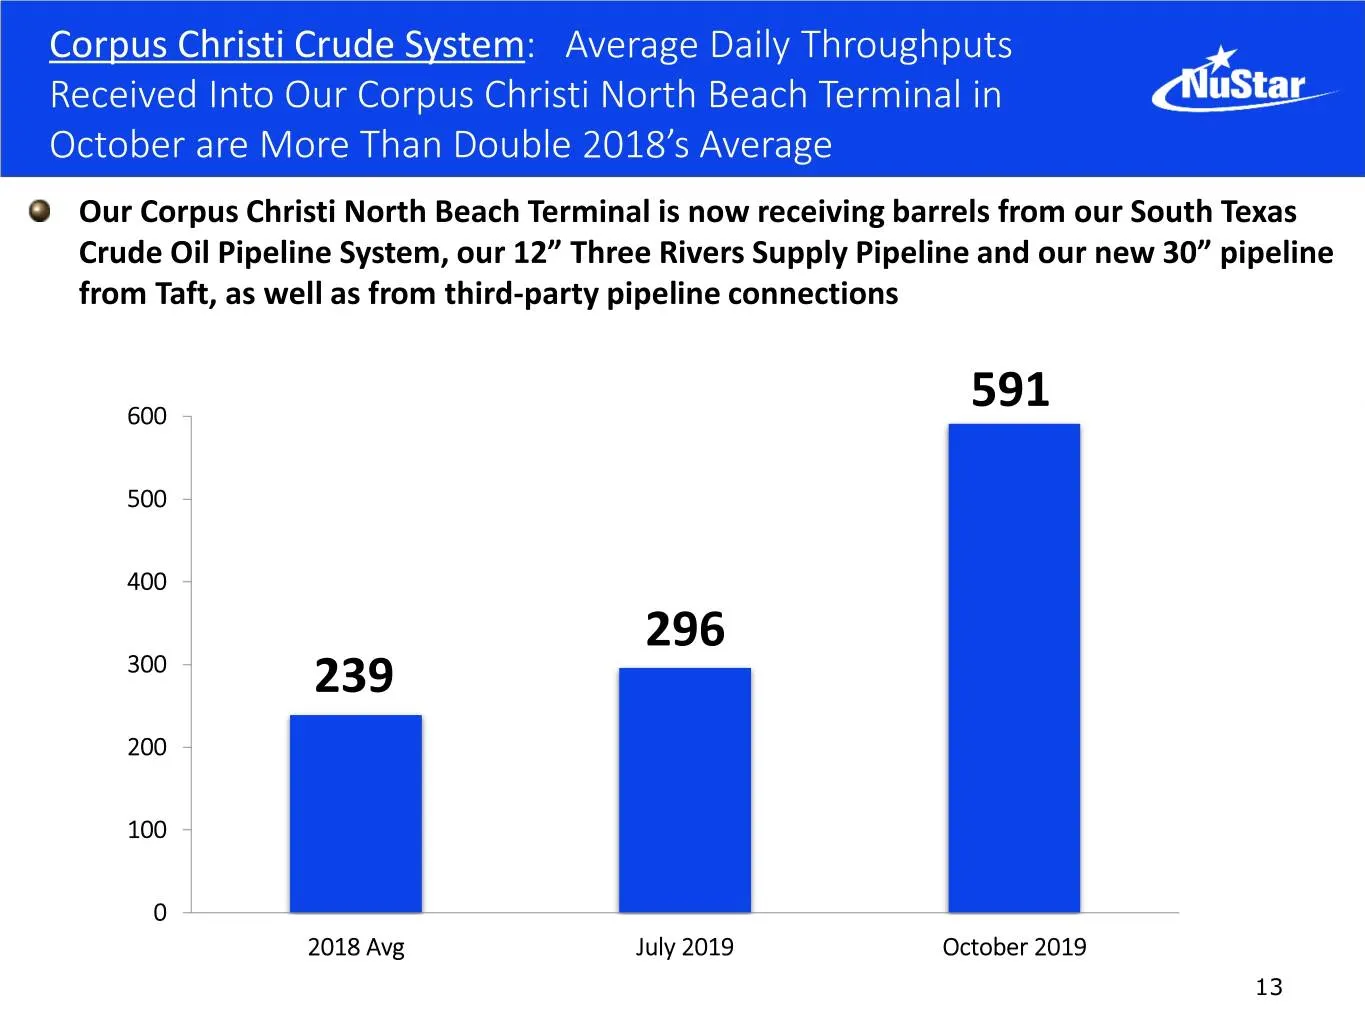
Corpus Christi Crude System: Utilization Has Increased, and We Expect Throughput to Grow, For Both Permian WTI and Eagle Ford Barrels During the month of October, aggregate volumes increased to 591MBPD, double our receipt in July, before Taft projects were in service We have also made progress on in
Slide 11: Corpus Christi North Beach Terminal Now Exporting Permian Barrels
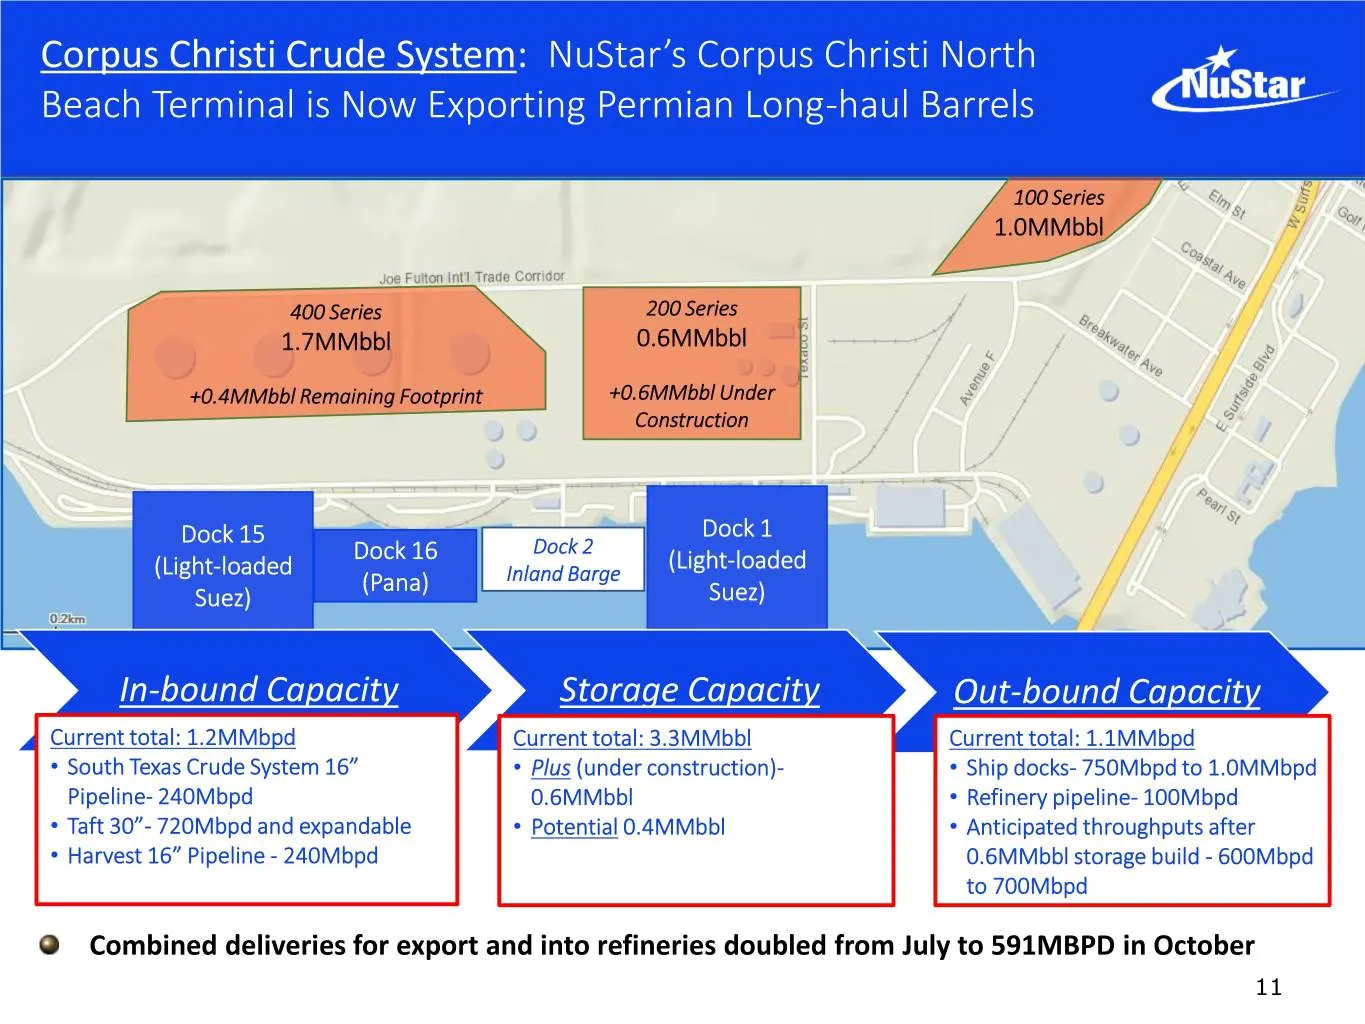
Corpus Christi Crude System: NuStar’s Corpus Christi North Beach Terminal is Now Exporting Permian Long-haul Barrels 100 Series 1.0MMbbl 400 Series 200 Series 1.7MMbbl 0.6MMbbl +0.4MMbbl Remaining Footprint +0.6MMbbl Under Construction Dock 15 Dock 1 Dock 16 Dock 2 (Light-loaded (Light-loaded (Pana)
Slide 12: Corpus Christi Crude System: Project for Trafigura
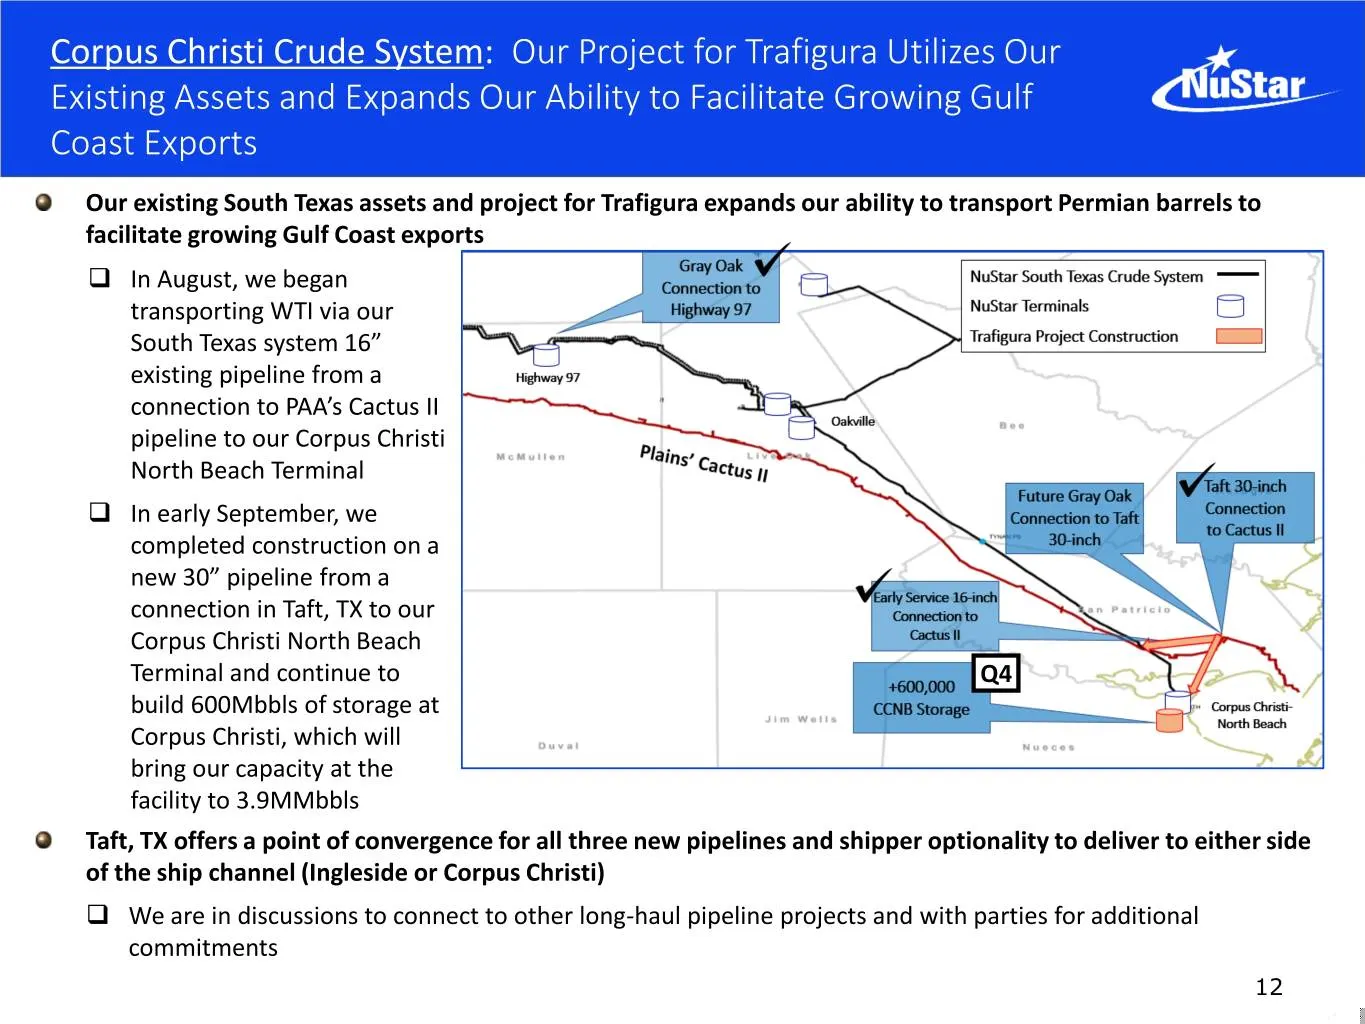
Corpus Christi Crude System: Our Project for Trafigura Utilizes Our Existing Assets and Expands Our Ability to Facilitate Growing Gulf Coast Exports Our existing South Texas assets and project for Trafigura expands our ability to transport Permian barrels to facilitate growing Gulf Coast exports I
Slide 13: Corpus Christi: Average Daily Throughputs Received at North Beach
Corpus Christi Crude System: Average Daily Throughputs Received Into Our Corpus Christi North Beach Terminal in October are More Than Double 2018’s Average Our Corpus Christi North Beach Terminal is now receiving barrels from our South Texas Crude Oil Pipeline System, our 12” Three Rivers Supply Pip
Slide 14: South Texas Crude Oil Pipeline System Throughput Exceeds Minimums
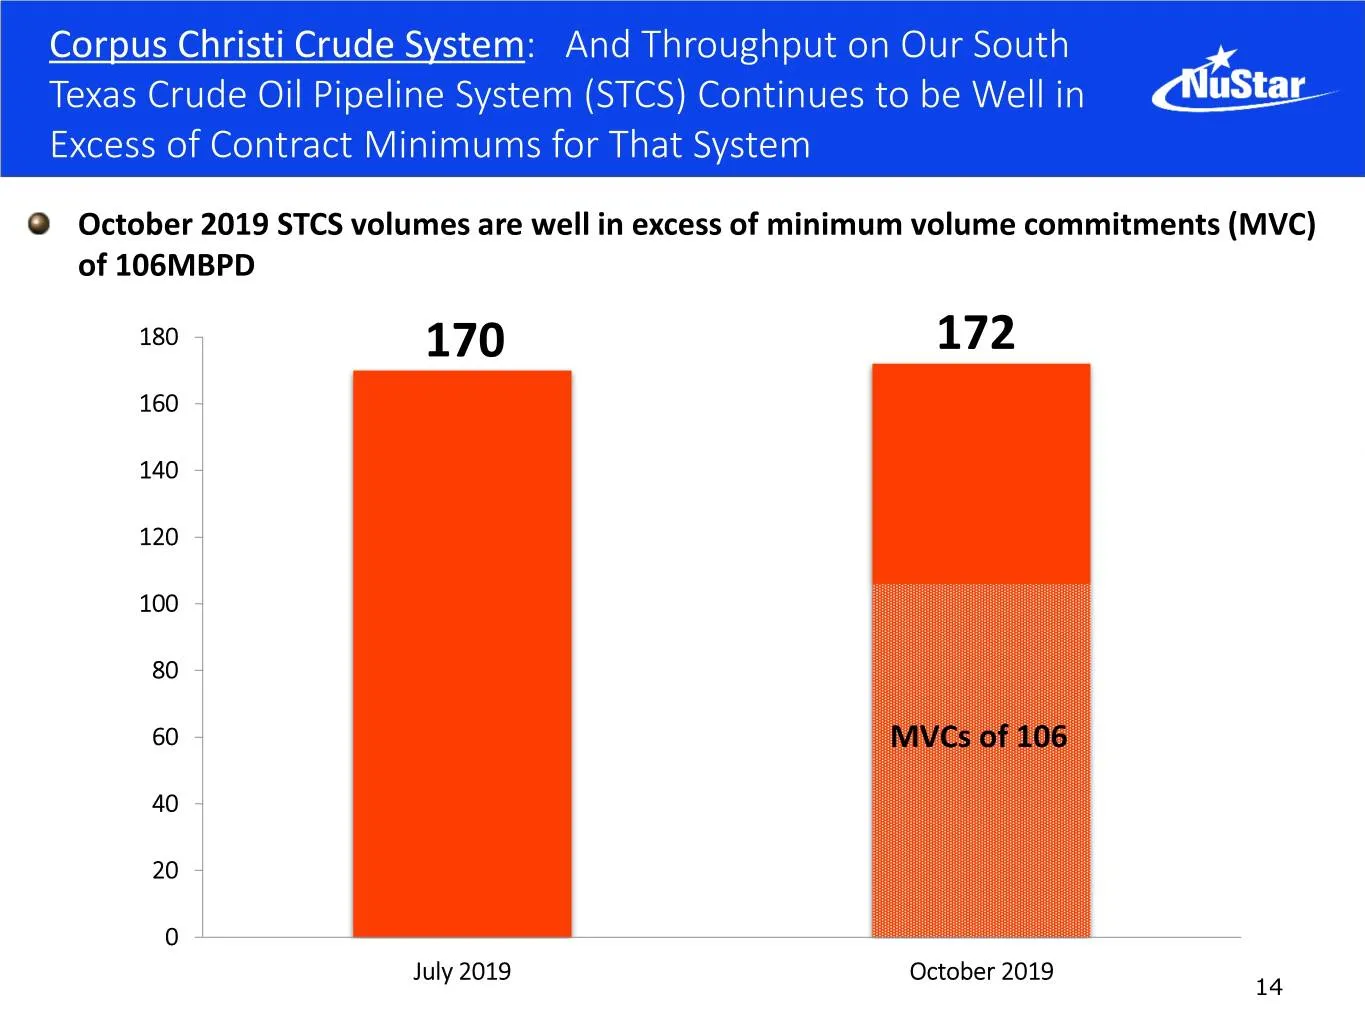
Corpus Christi Crude System: And Throughput on Our South Texas Crude Oil Pipeline System (STCS) Continues to be Well in Excess of Contract Minimums for That System October 2019 STCS volumes are well in excess of minimum volume commitments (MVC) of 106MBPD 180 170 172 160 140 120 100 80 60 MVCs of 10
Slide 15: McKee-Ardmore Crude Systems: Transporting Permian Barrels
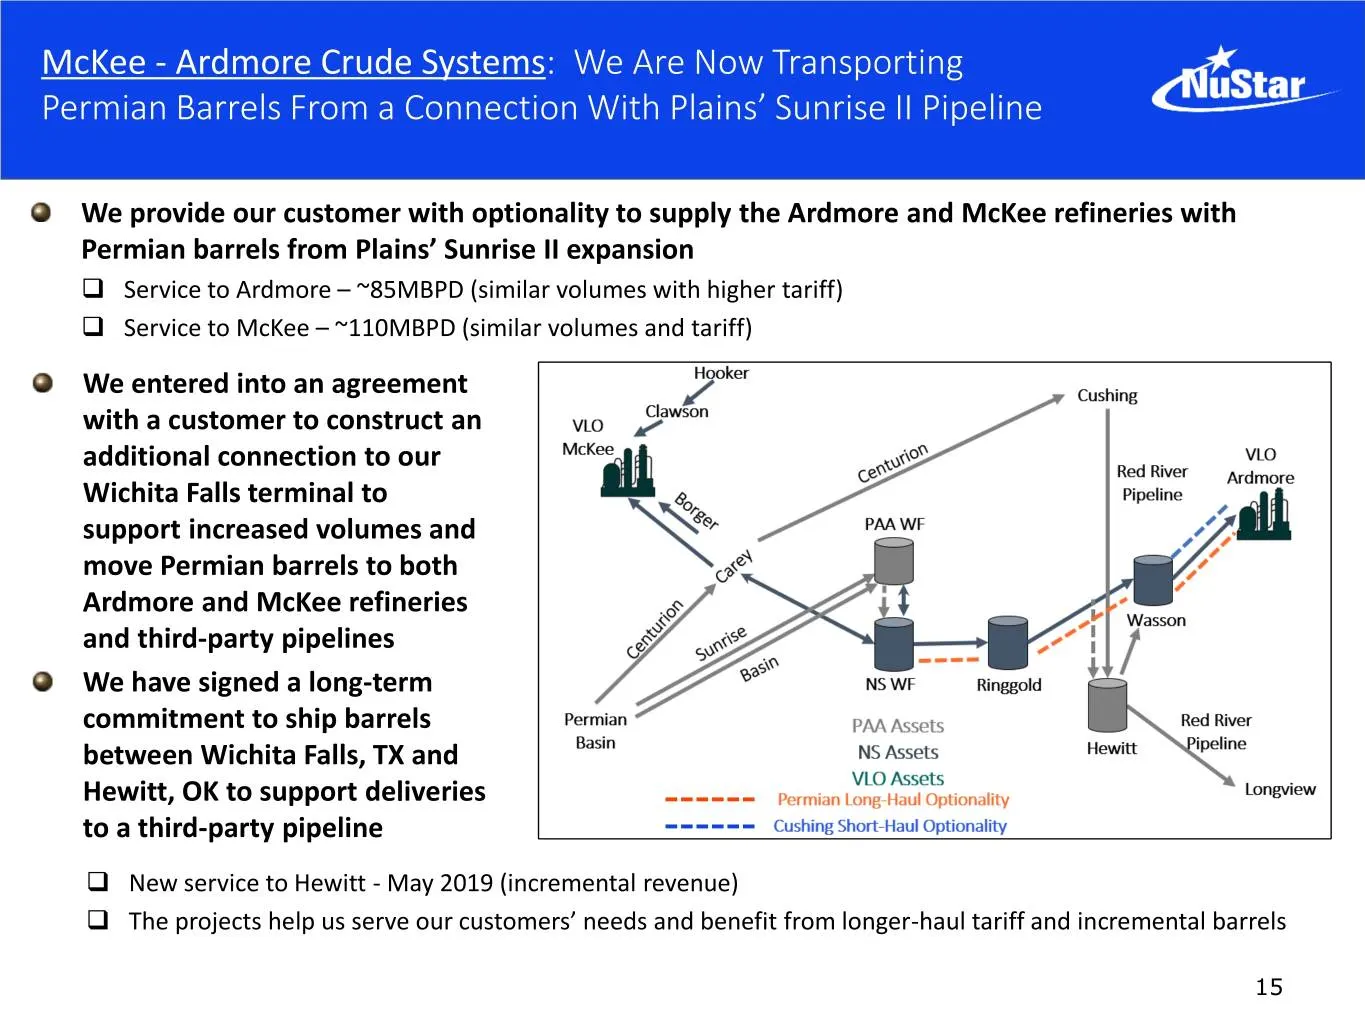
McKee - Ardmore Crude Systems: We Are Now Transporting Permian Barrels From a Connection With Plains’ Sunrise II Pipeline We provide our customer with optionality to supply the Ardmore and McKee refineries with Permian barrels from Plains’ Sunrise II expansion Service to Ardmore – ~85MBPD (similar
Slide 16: Northern Mexico Refined Products Supply
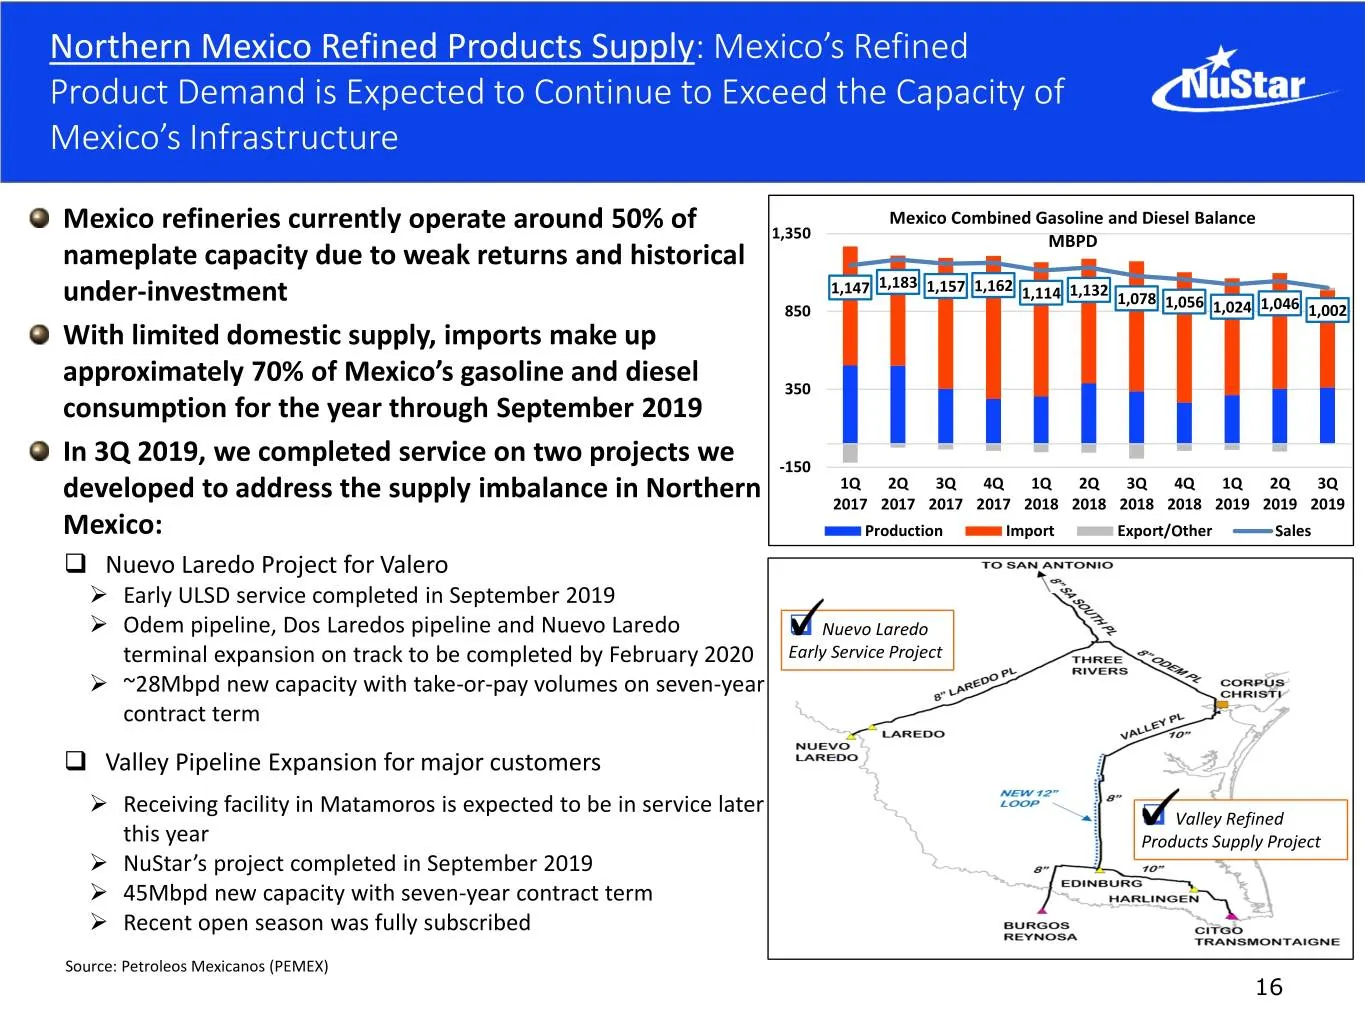
Northern Mexico Refined Products Supply: Mexico’s Refined Product Demand is Expected to Continue to Exceed the Capacity of Mexico’s Infrastructure Mexico Combined Gasoline and Diesel Balance Mexico refineries currently operate around 50% of 1,350 nameplate capacity due to weak returns and historical
Slide 17: Completing Our 2019 Project Program
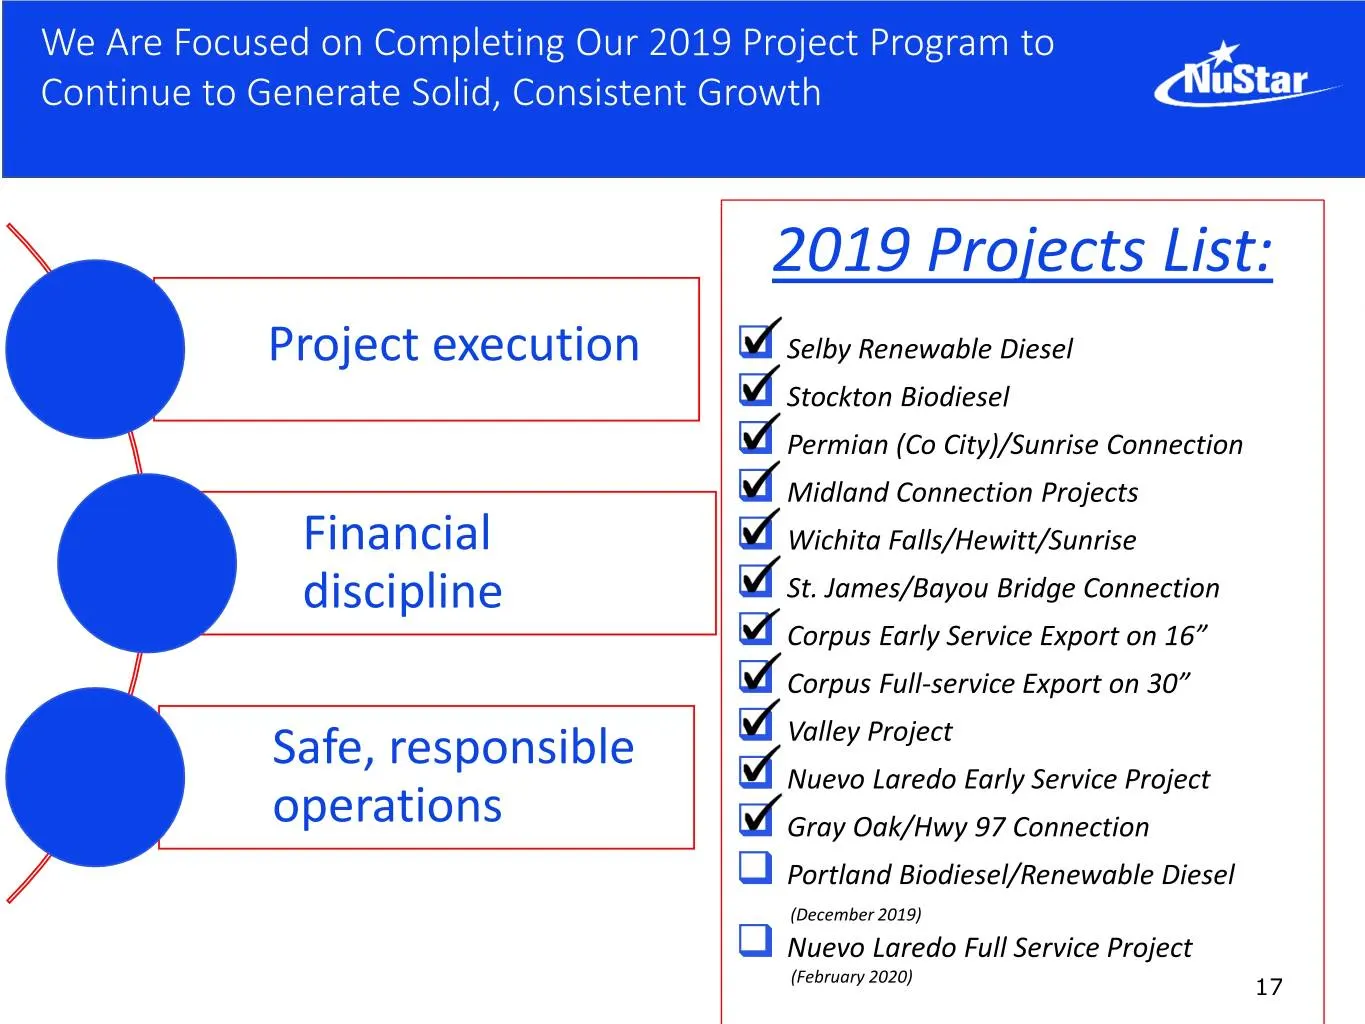
We Are Focused on Completing Our 2019 Project Program to Continue to Generate Solid, Consistent Growth 2019 Projects List: Project execution Selby Renewable Diesel Stockton Biodiesel Permian (Co City)/Sunrise Connection Midland Connection Projects Financial Wichita Falls/Hewitt/Sunrise dis
Slide 18: 2020 Capital Spending Expected at $300-350MM
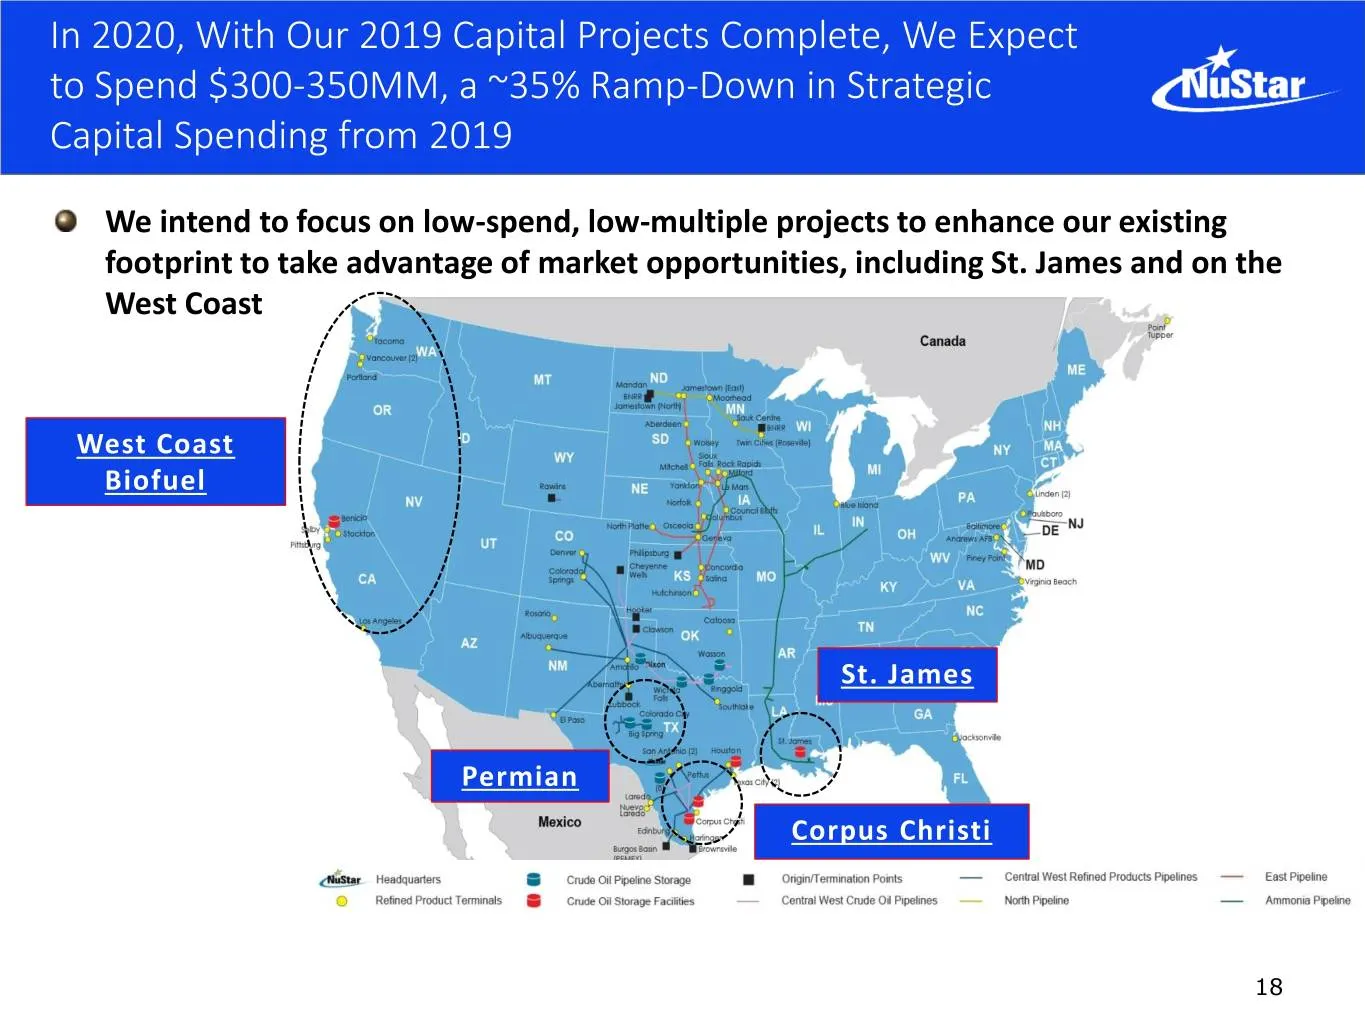
In 2020, With Our 2019 Capital Projects Complete, We Expect to Spend $300-350MM, a ~35% Ramp-Down in Strategic Capital Spending from 2019 We intend to focus on low-spend, low-multiple projects to enhance our existing footprint to take advantage of market opportunities, including St. James and on the
Slide 19: St. James: Shale Growth Has Reversed Crude Flows
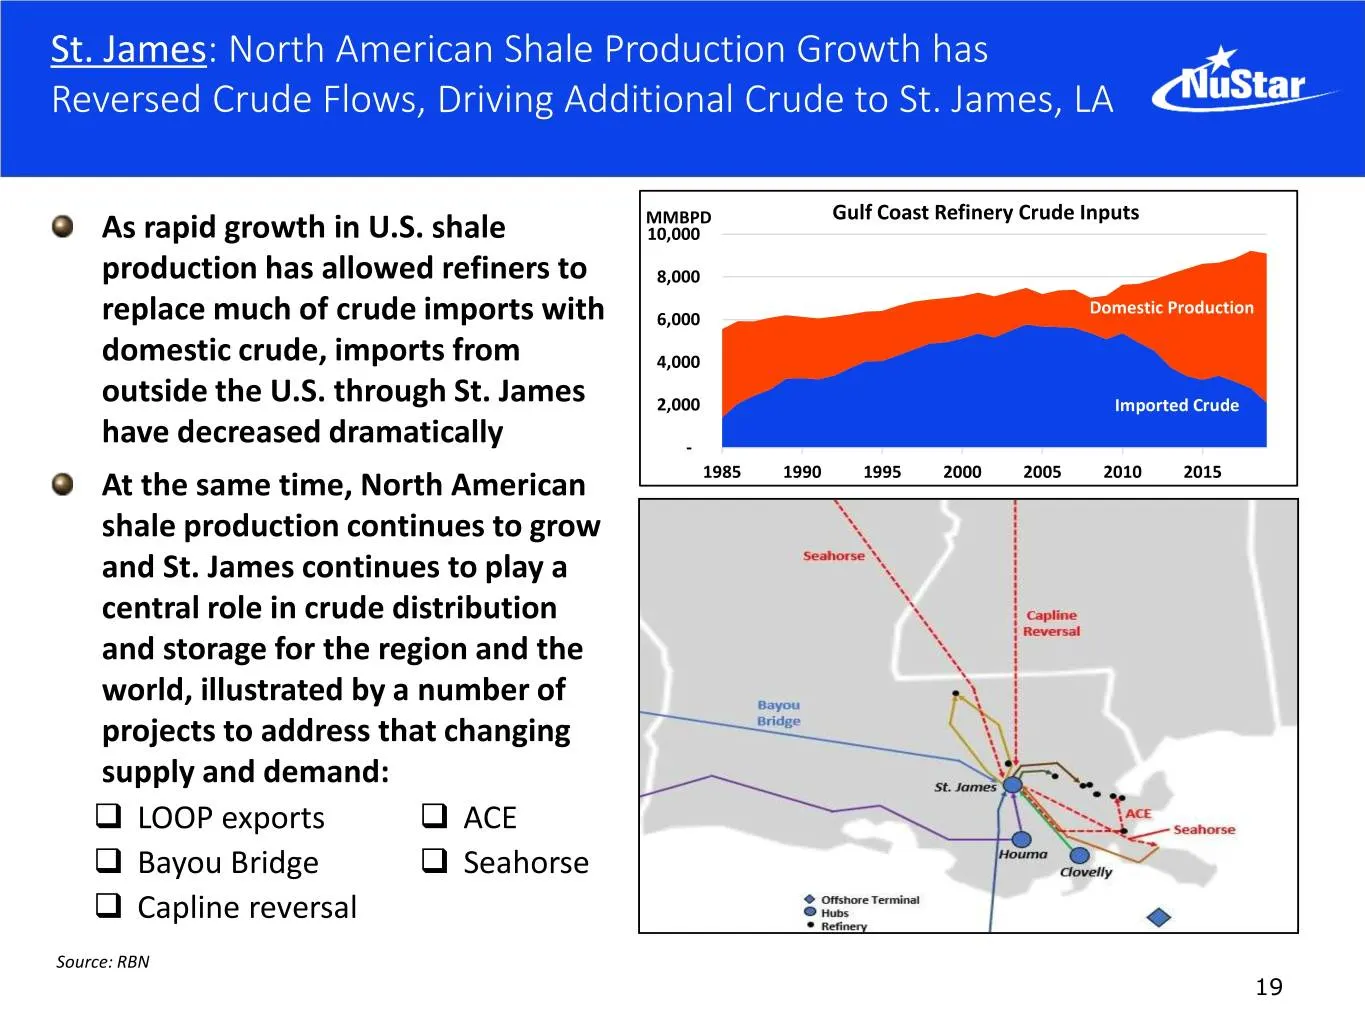
St. James: North American Shale Production Growth has Reversed Crude Flows, Driving Additional Crude to St. James, LA MMBPD Gulf Coast Refinery Crude Inputs As rapid growth in U.S. shale 10,000 production has allowed refiners to 8,000 Domestic Production replace much of crude imports with 6,000 dome
Slide 20: St. James: Capacity, Connectivity and Expandability
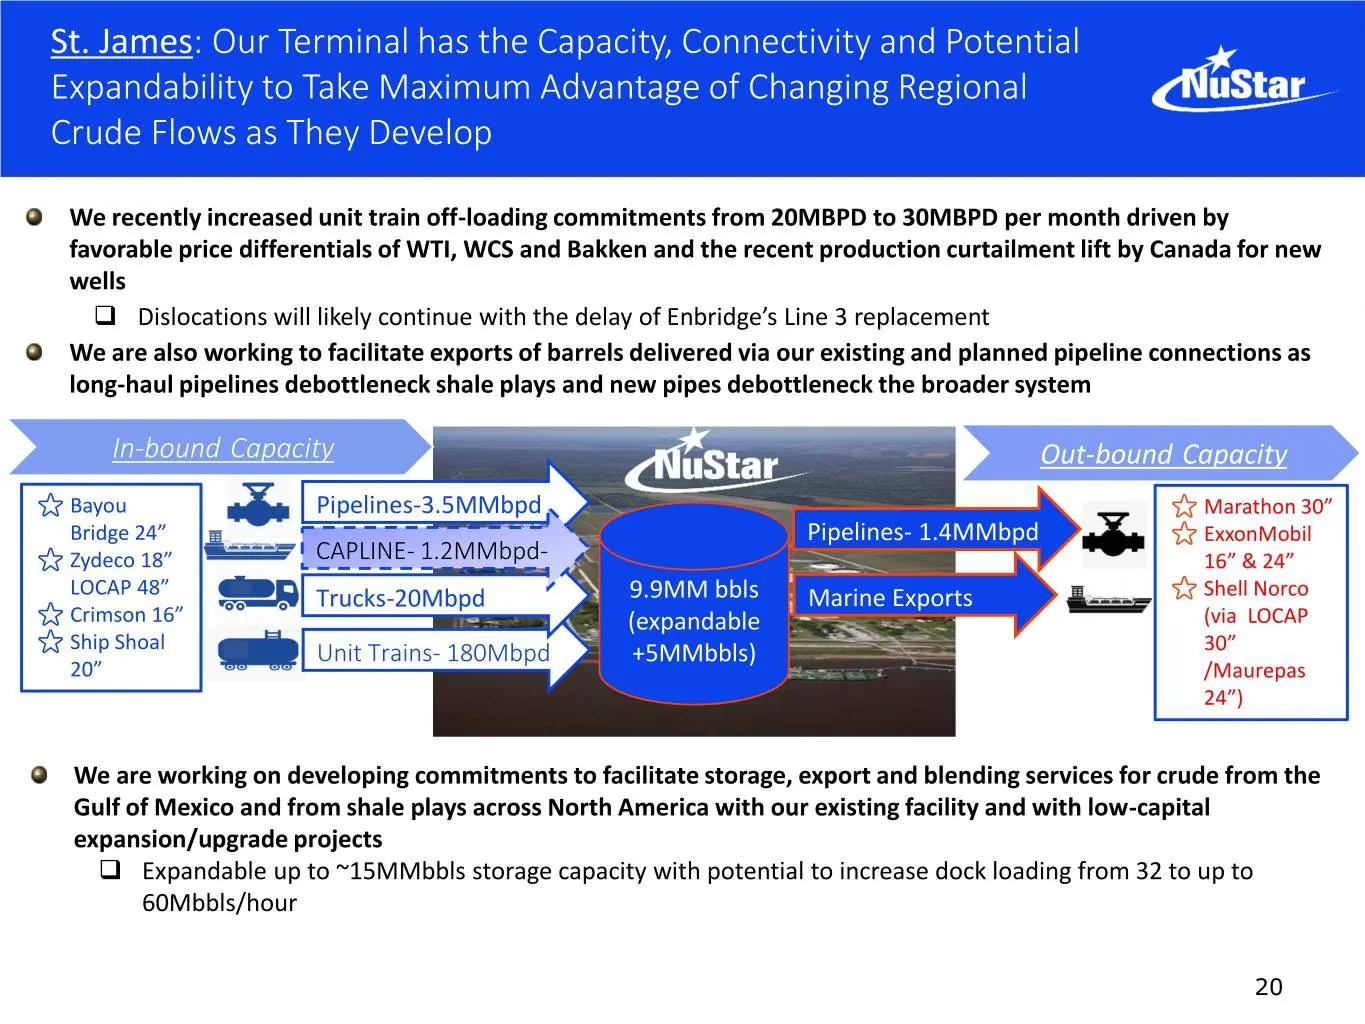
St. James: Our Terminal has the Capacity, Connectivity and Potential Expandability to Take Maximum Advantage of Changing Regional Crude Flows as They Develop We recently increased unit train off-loading commitments from 20MBPD to 30MBPD per month driven by favorable price differentials of WTI, WCS a
Slide 21: West Coast Bio-Fuels Logistics
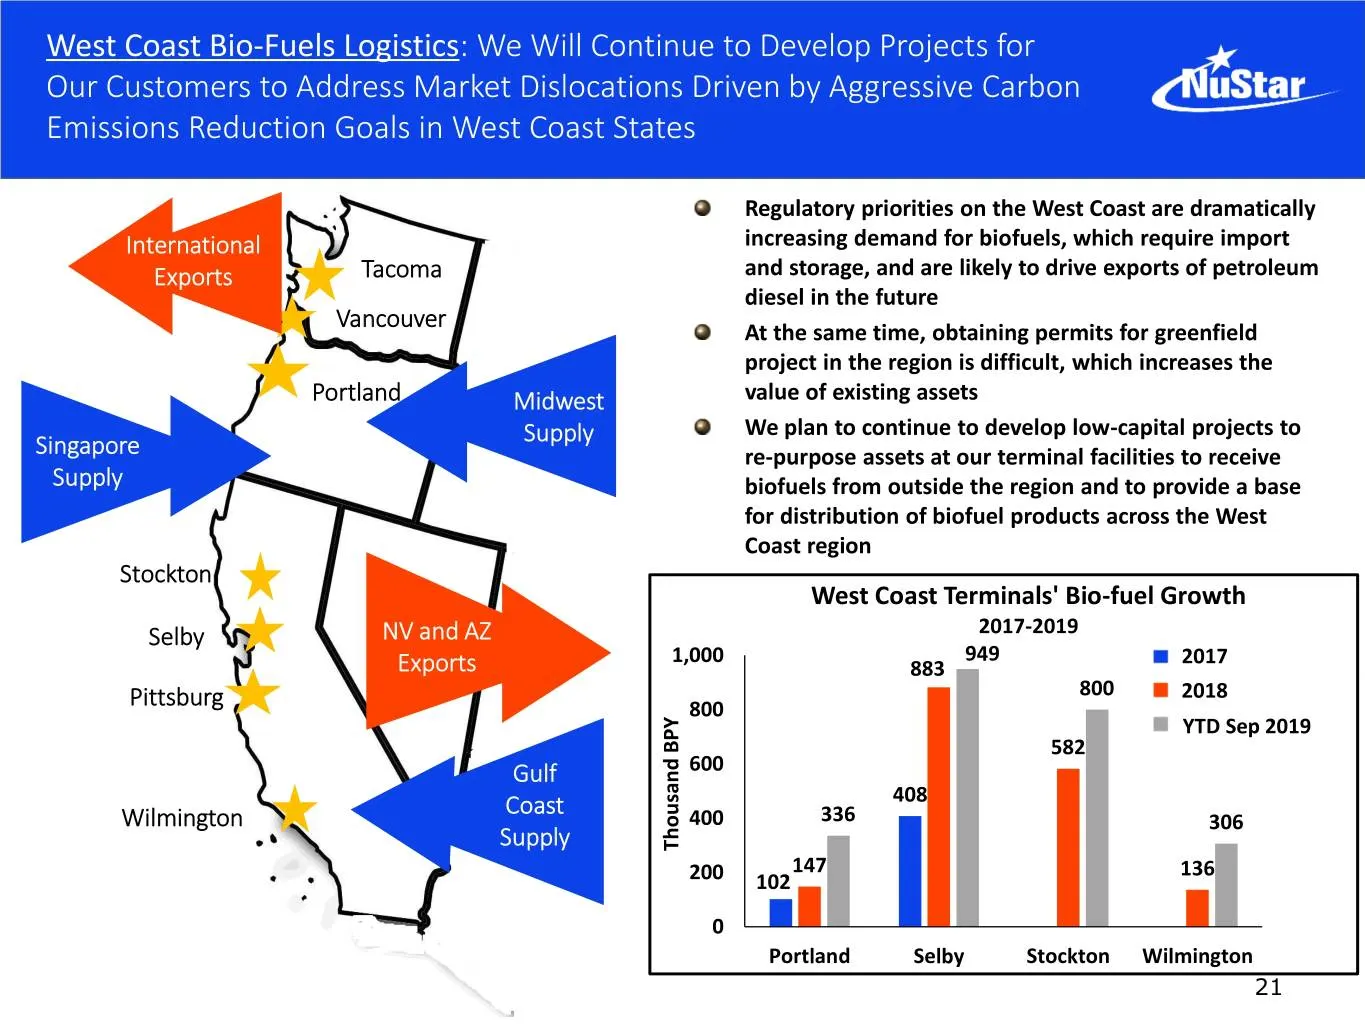
West Coast Bio-Fuels Logistics: We Will Continue to Develop Projects for Our Customers to Address Market Dislocations Driven by Aggressive Carbon Emissions Reduction Goals in West Coast States Regulatory priorities on the West Coast are dramatically International increasing demand for biofuels, whic
Slide 22: Safe, Responsible and Efficient Operations
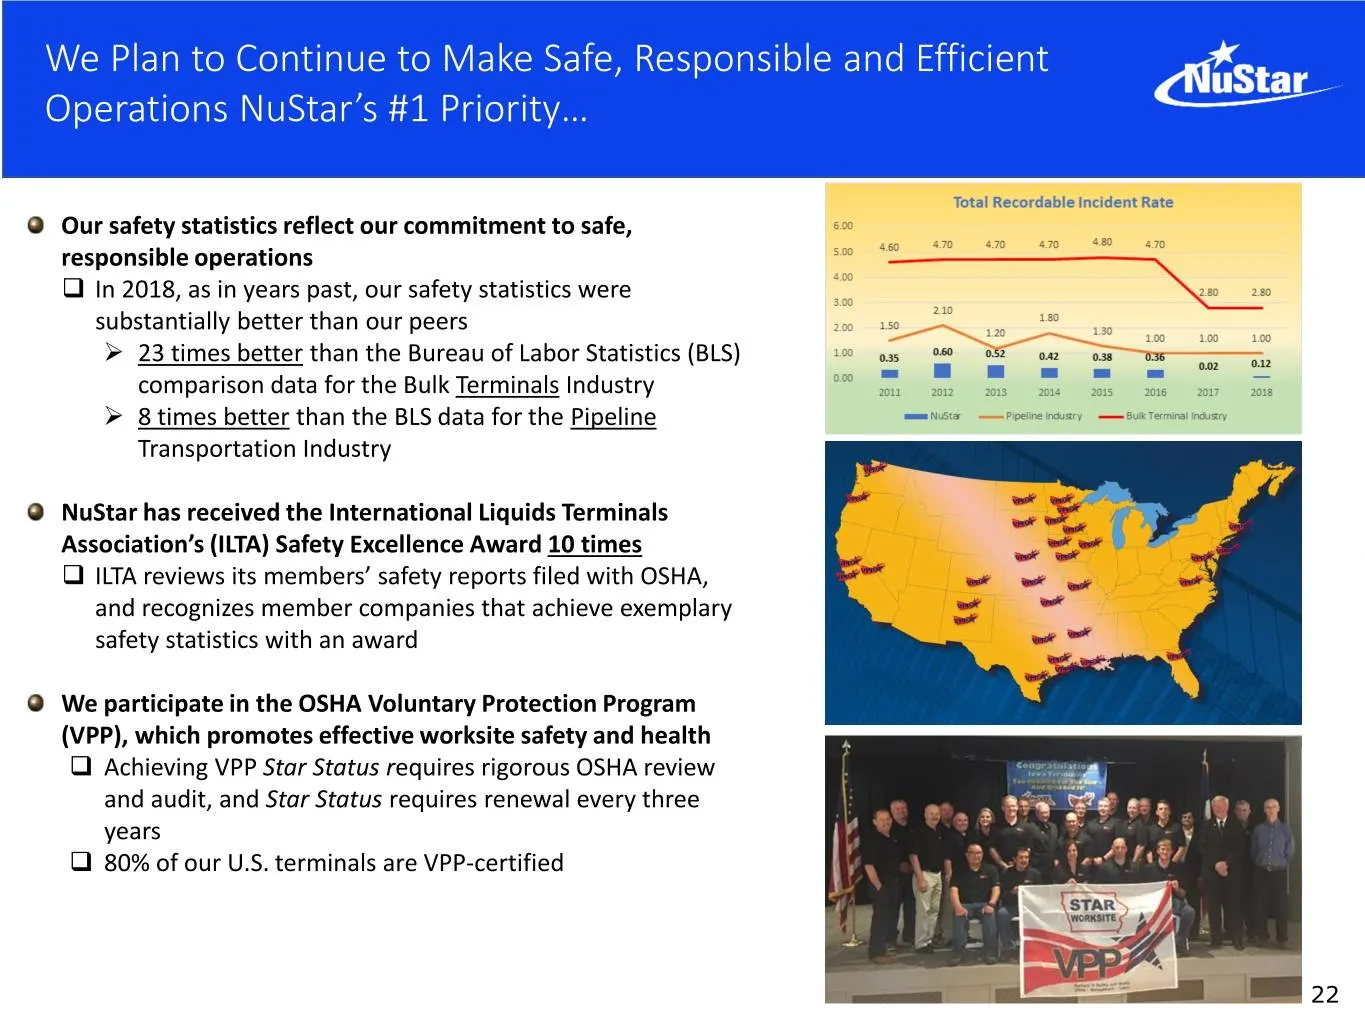
We Plan to Continue to Make Safe, Responsible and Efficient Operations NuStar’s #1 Priority… Our safety statistics reflect our commitment to safe, responsible operations In 2018, as in years past, our safety statistics were substantially better than our peers ➢ 23 times better than the Bureau of L
Slide 23: Committed to Our Employees and Communities
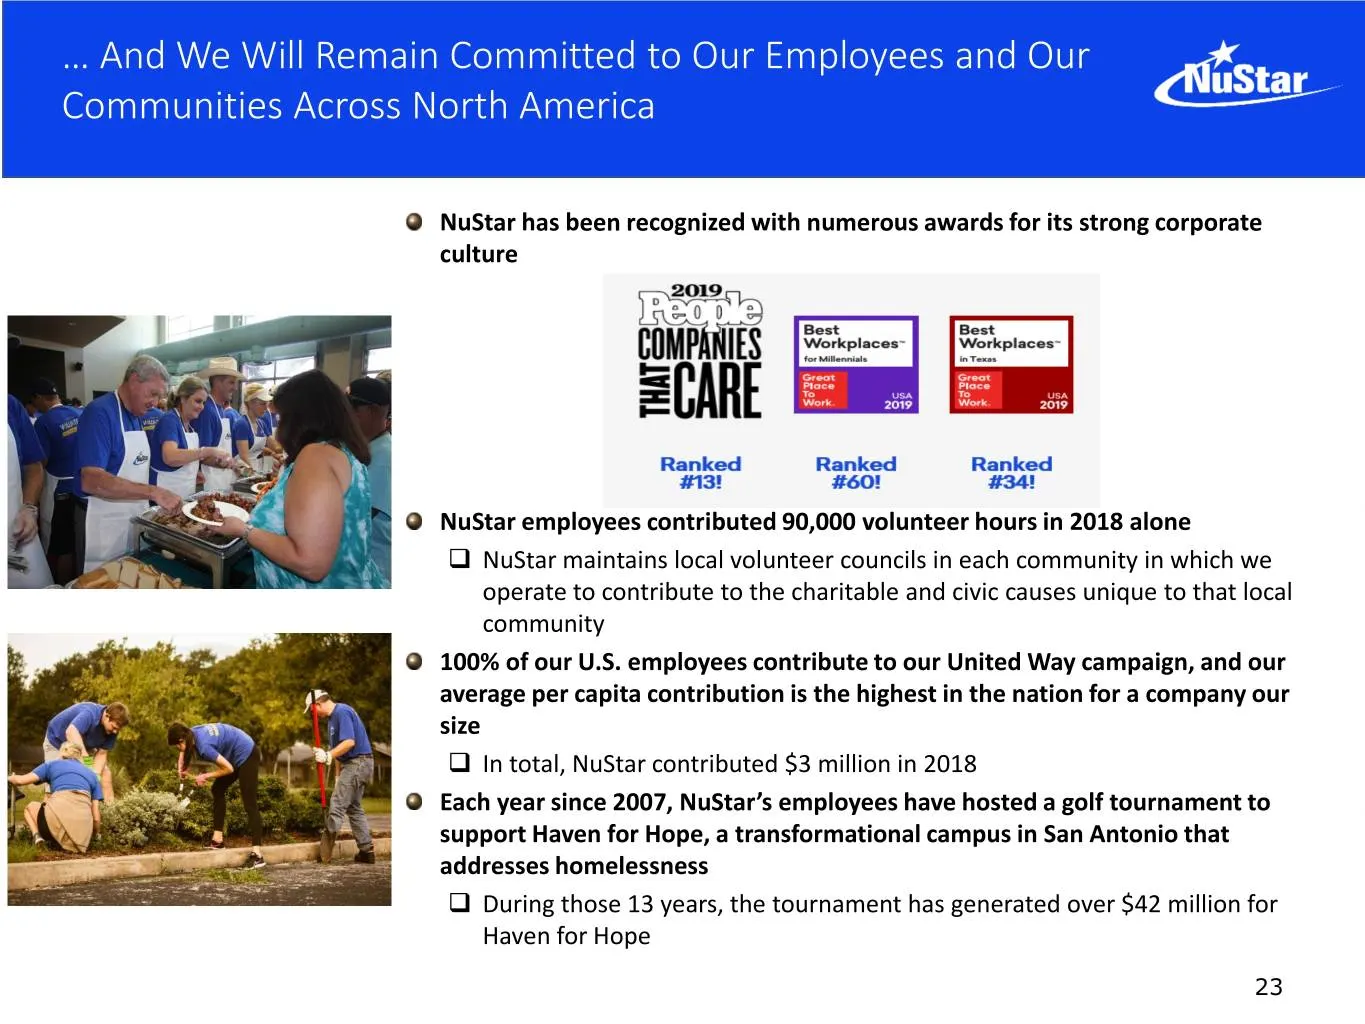
… And We Will Remain Committed to Our Employees and Our Communities Across North America NuStar has been recognized with numerous awards for its strong corporate culture NuStar employees contributed 90,000 volunteer hours in 2018 alone NuStar maintains local volunteer councils in each community in
Slide 24: 2019 Hard Work to Reap Rewards in 2020 and Beyond
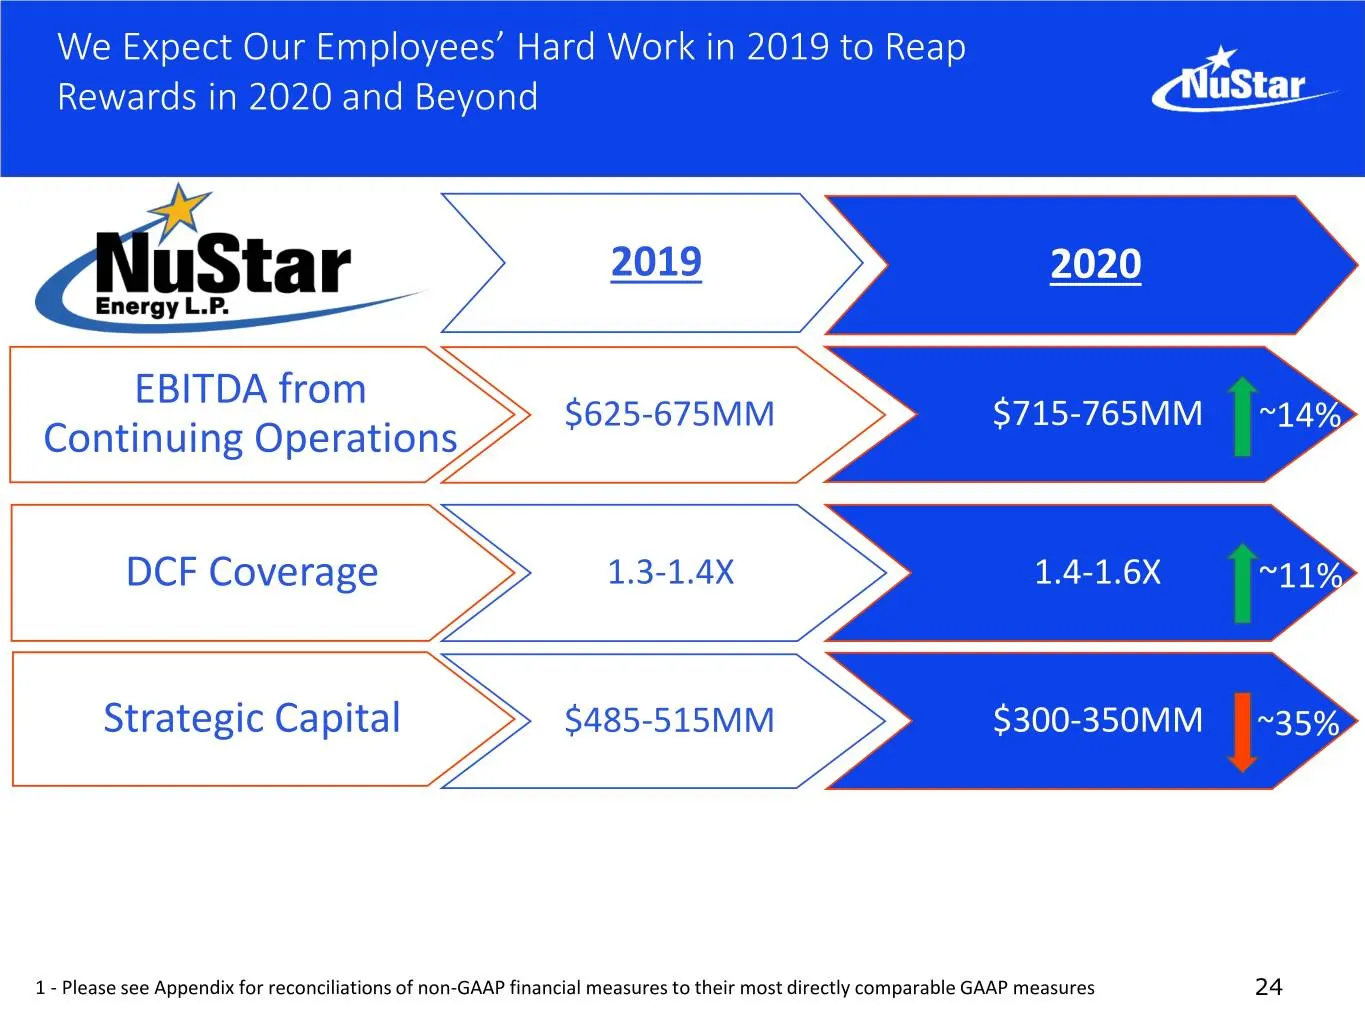
We Expect Our Employees’ Hard Work in 2019 to Reap Rewards in 2020 and Beyond 2019 2020 EBITDA from $625-675MM $715-765MM ~14% Continuing Operations DCF Coverage 1.3-1.4X 1.4-1.6X ~11% Strategic Capital $485-515MM $300-350MM ~35% 1 - Please see Appendix for reconciliations of non-GAAP financial meas
Slide 25: Historic and 2019/2020 Estimated Capital Spending
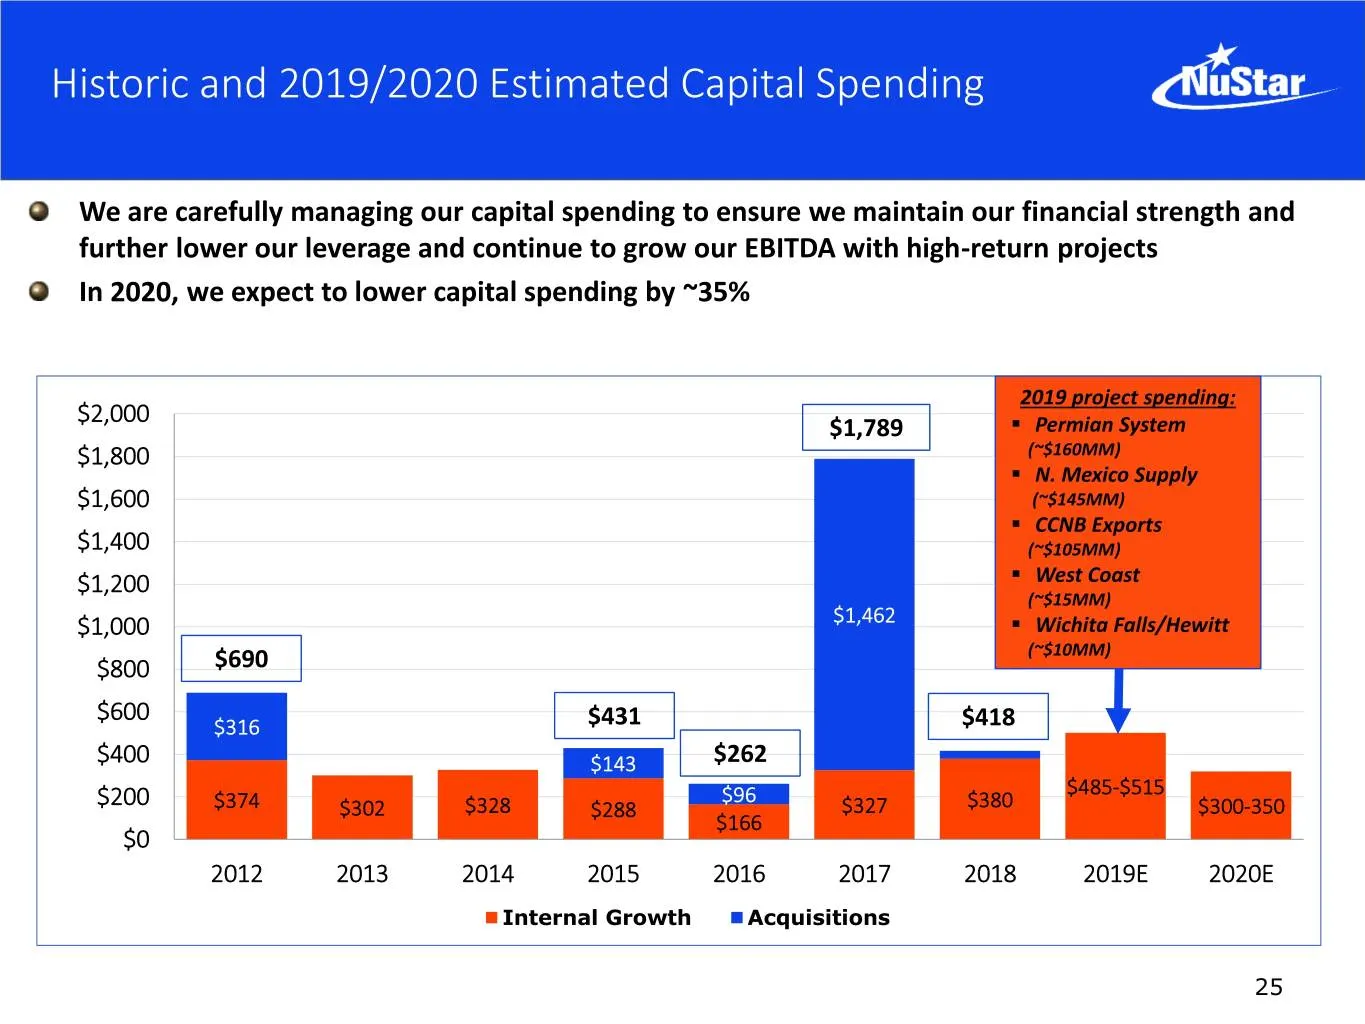
Historic and 2019/2020 Estimated Capital Spending We are carefully managing our capital spending to ensure we maintain our financial strength and further lower our leverage and continue to grow our EBITDA with high-return projects In 2020, we expect to lower capital spending by ~35% 2019 project spe
Slide 26: Debt Maturity Schedule
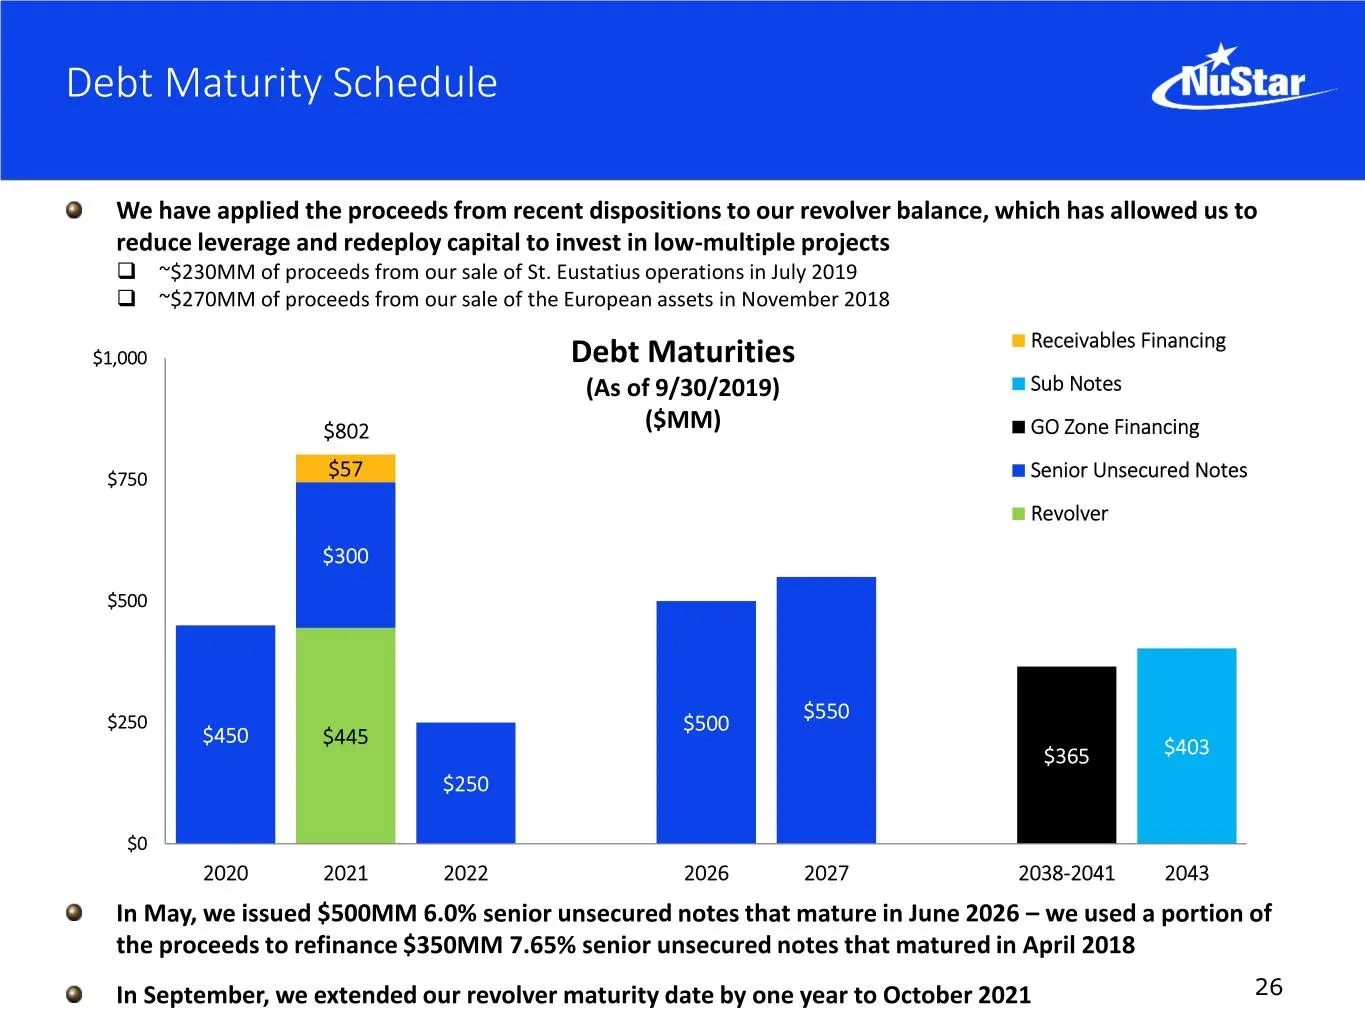
Debt Maturity Schedule We have applied the proceeds from recent dispositions to our revolver balance, which has allowed us to reduce leverage and redeploy capital to invest in low-multiple projects ~$230MM of proceeds from our sale of St. Eustatius operations in July 2019 ~$270MM of proceeds fro
Slide 27: Capital Structure as of September 30, 2019
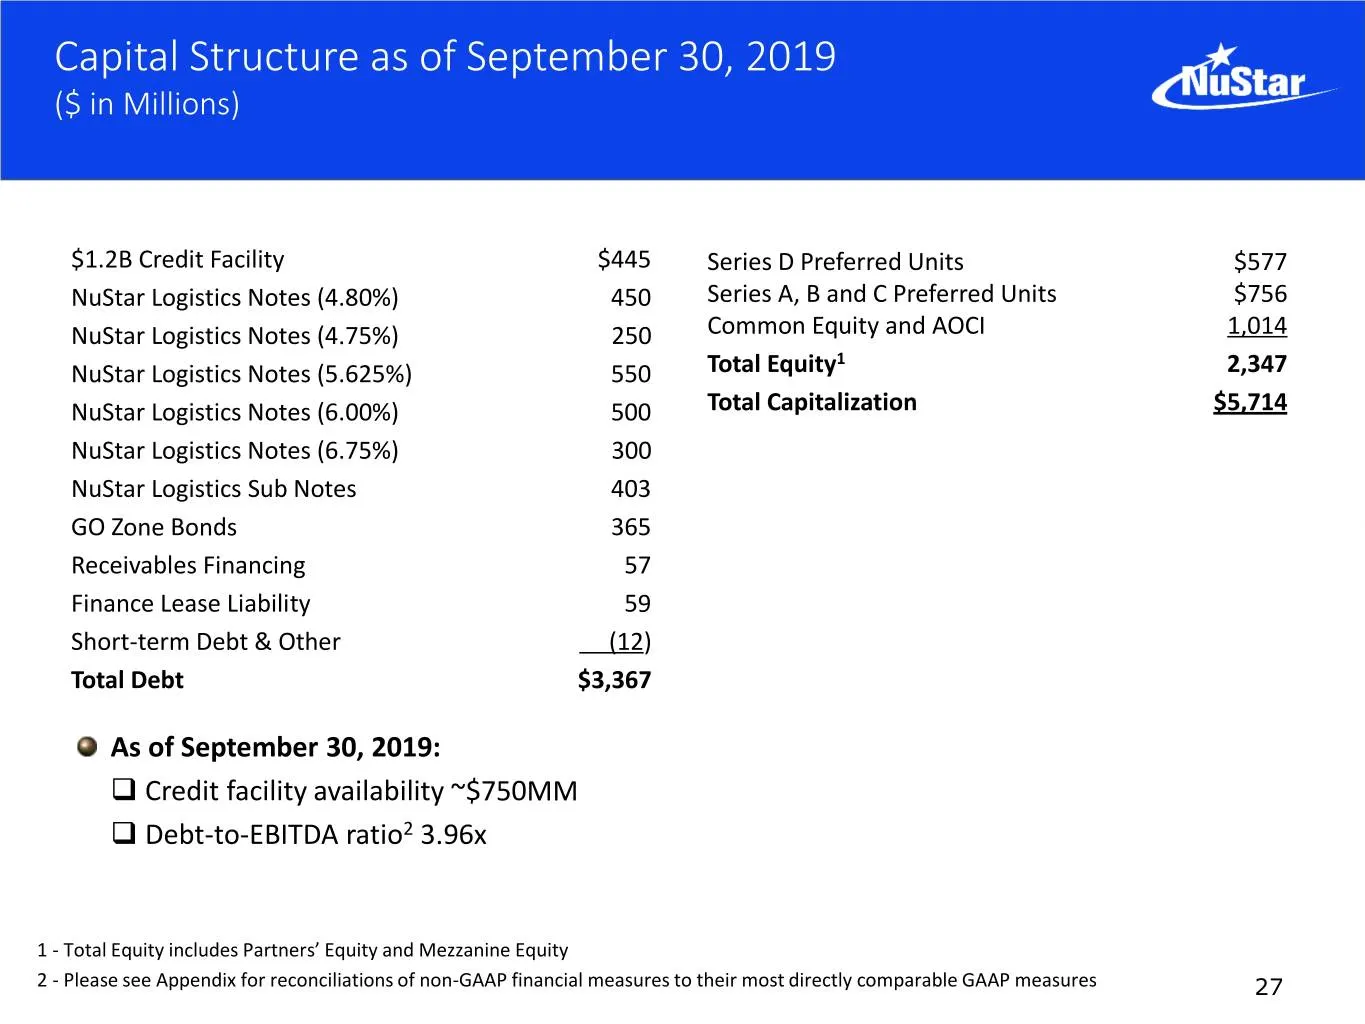
Capital Structure as of September 30, 2019 ($ in Millions) $1.2B Credit Facility $445 Series D Preferred Units $577 NuStar Logistics Notes (4.80%) 450 Series A, B and C Preferred Units $756 NuStar Logistics Notes (4.75%) 250 Common Equity and AOCI 1,014 1 NuStar Logistics Notes (5.625%) 550 Total Eq
Slide 28: Reconciliation of Non-GAAP Financial Information
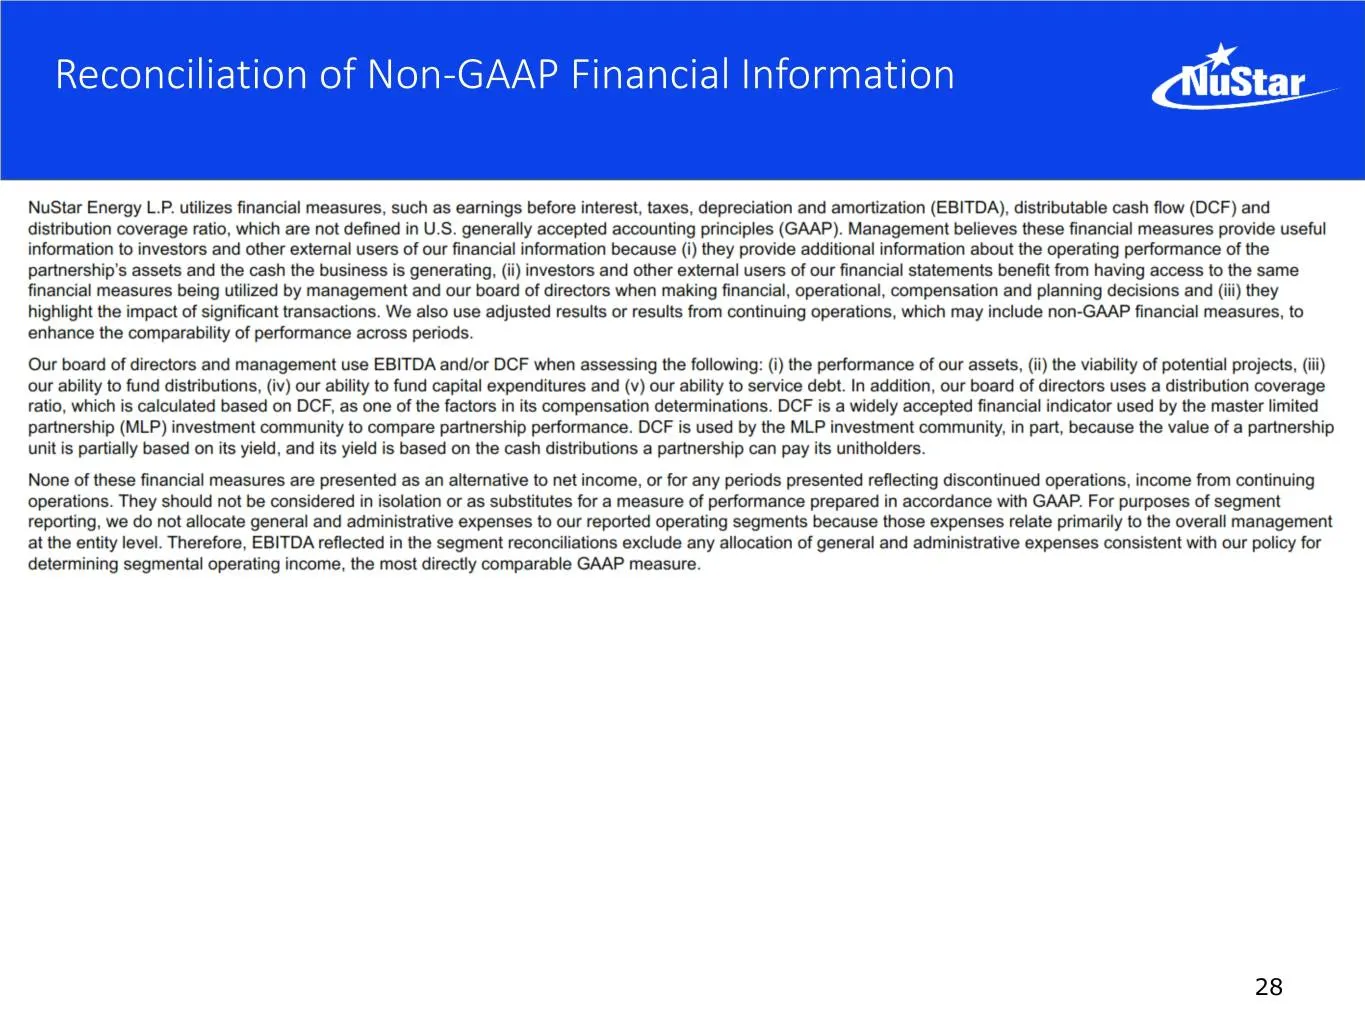
Reconciliation of Non-GAAP Financial Information 28
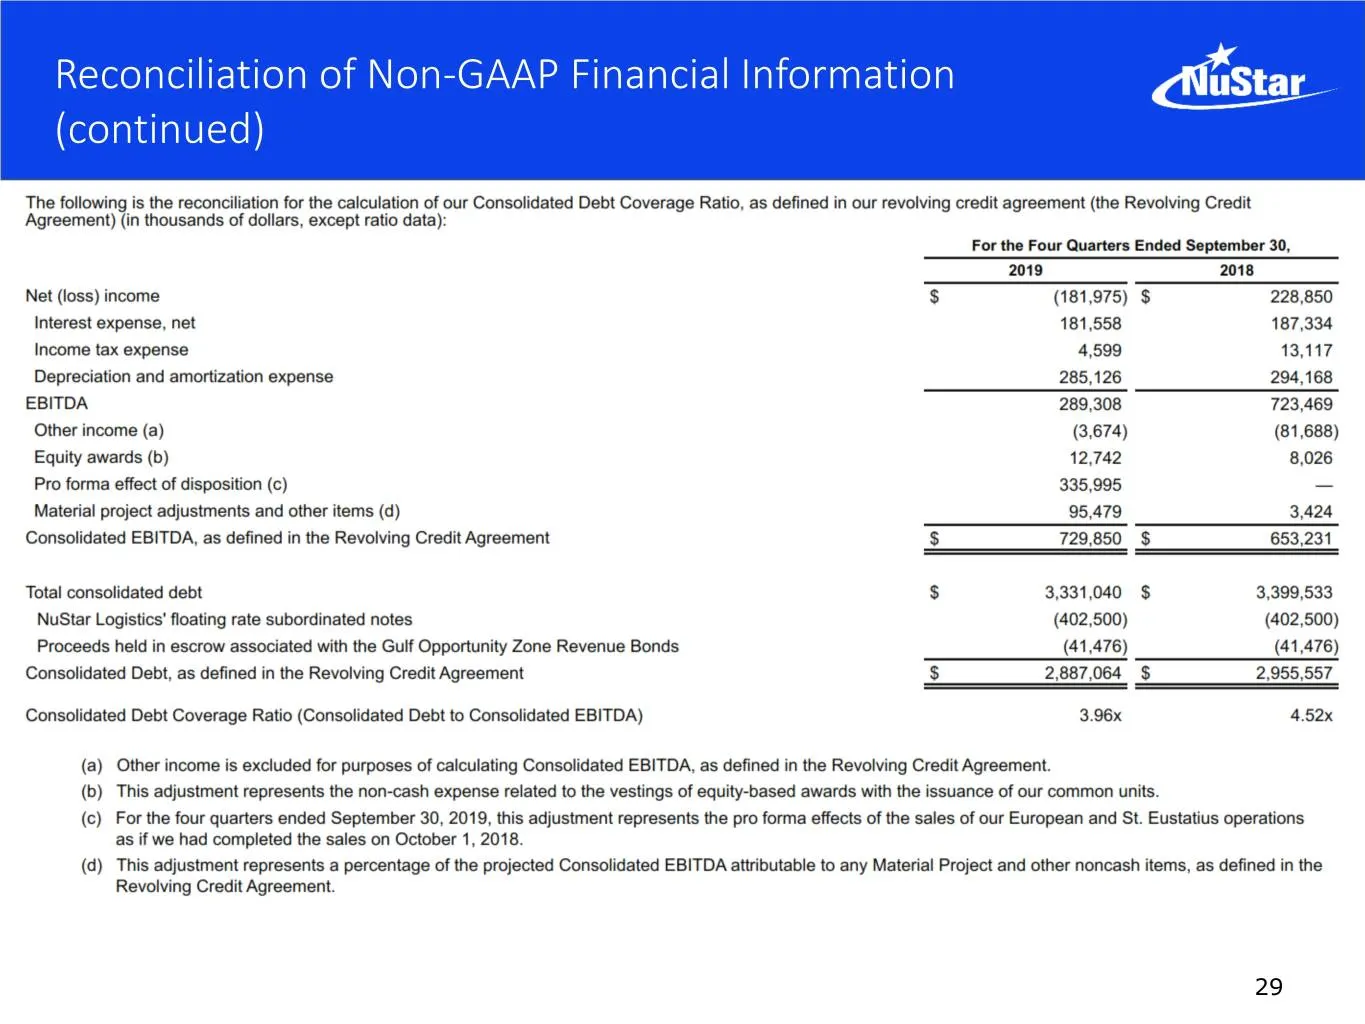
Slide 29: Reconciliation of Non-GAAP Financial Information (continued)
Reconciliation of Non-GAAP Financial Information (continued) 29
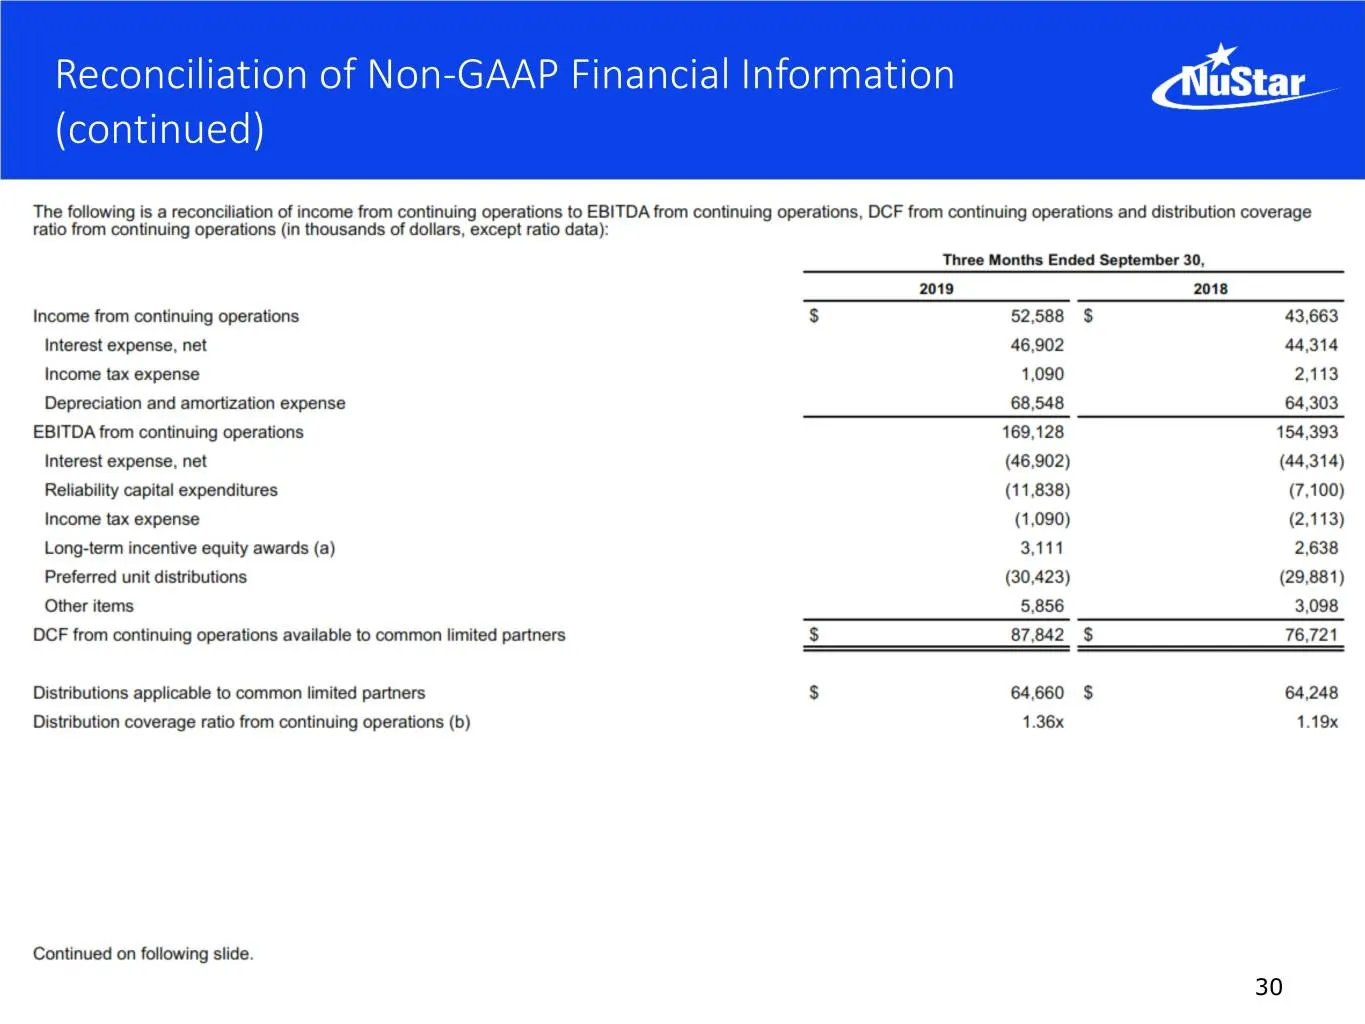
Slide 30: Reconciliation of Non-GAAP Financial Information (continued)
Reconciliation of Non-GAAP Financial Information (continued) 30
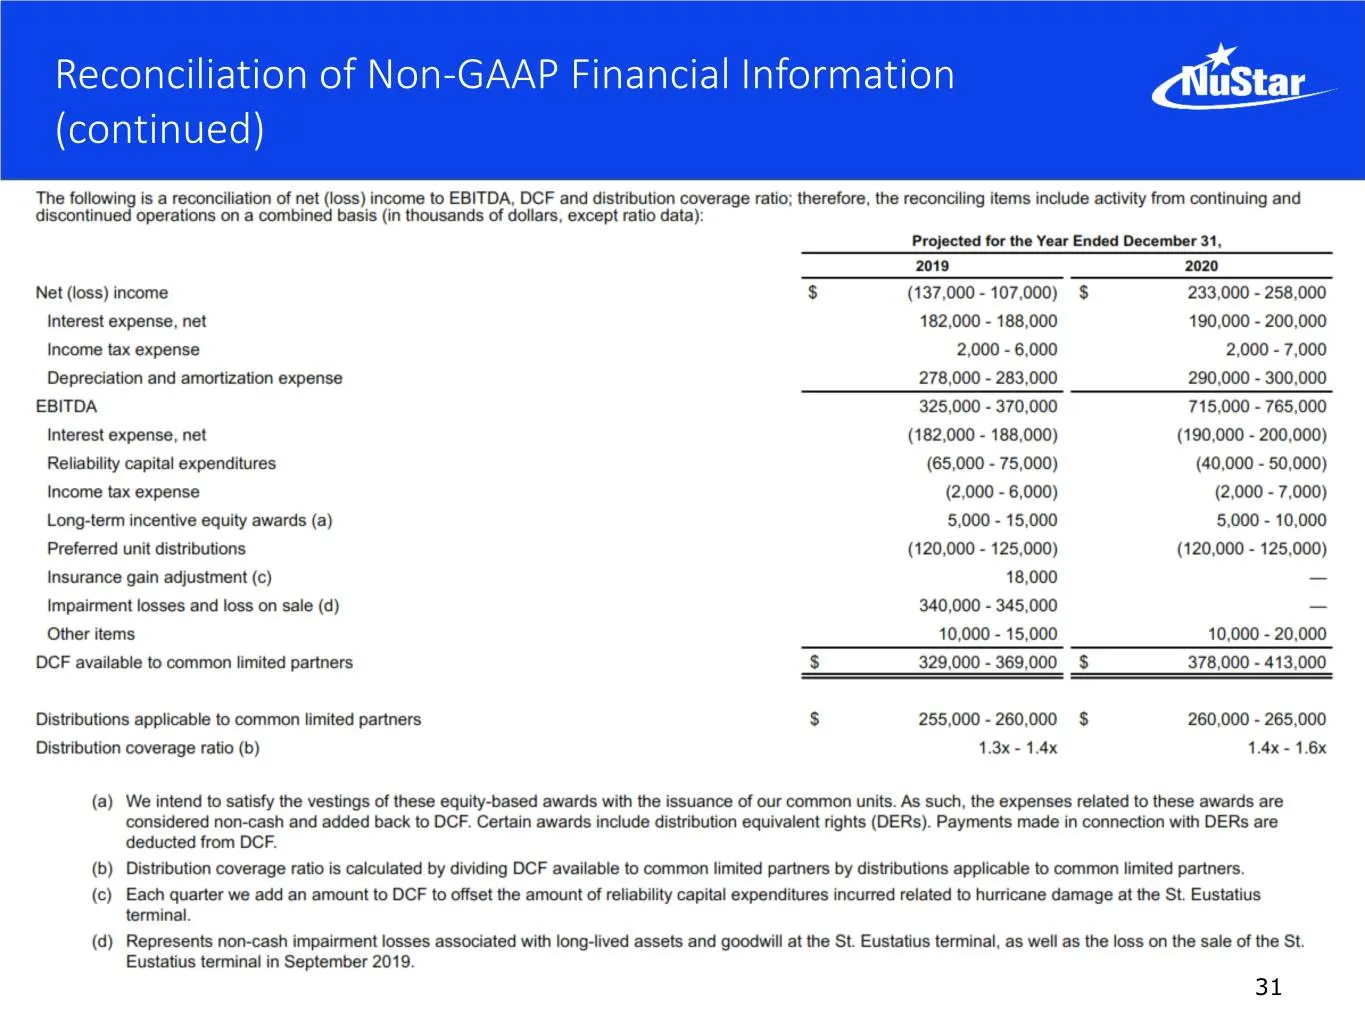
Slide 31: Reconciliation of Non-GAAP Financial Information (continued)
Reconciliation of Non-GAAP Financial Information (continued) 31
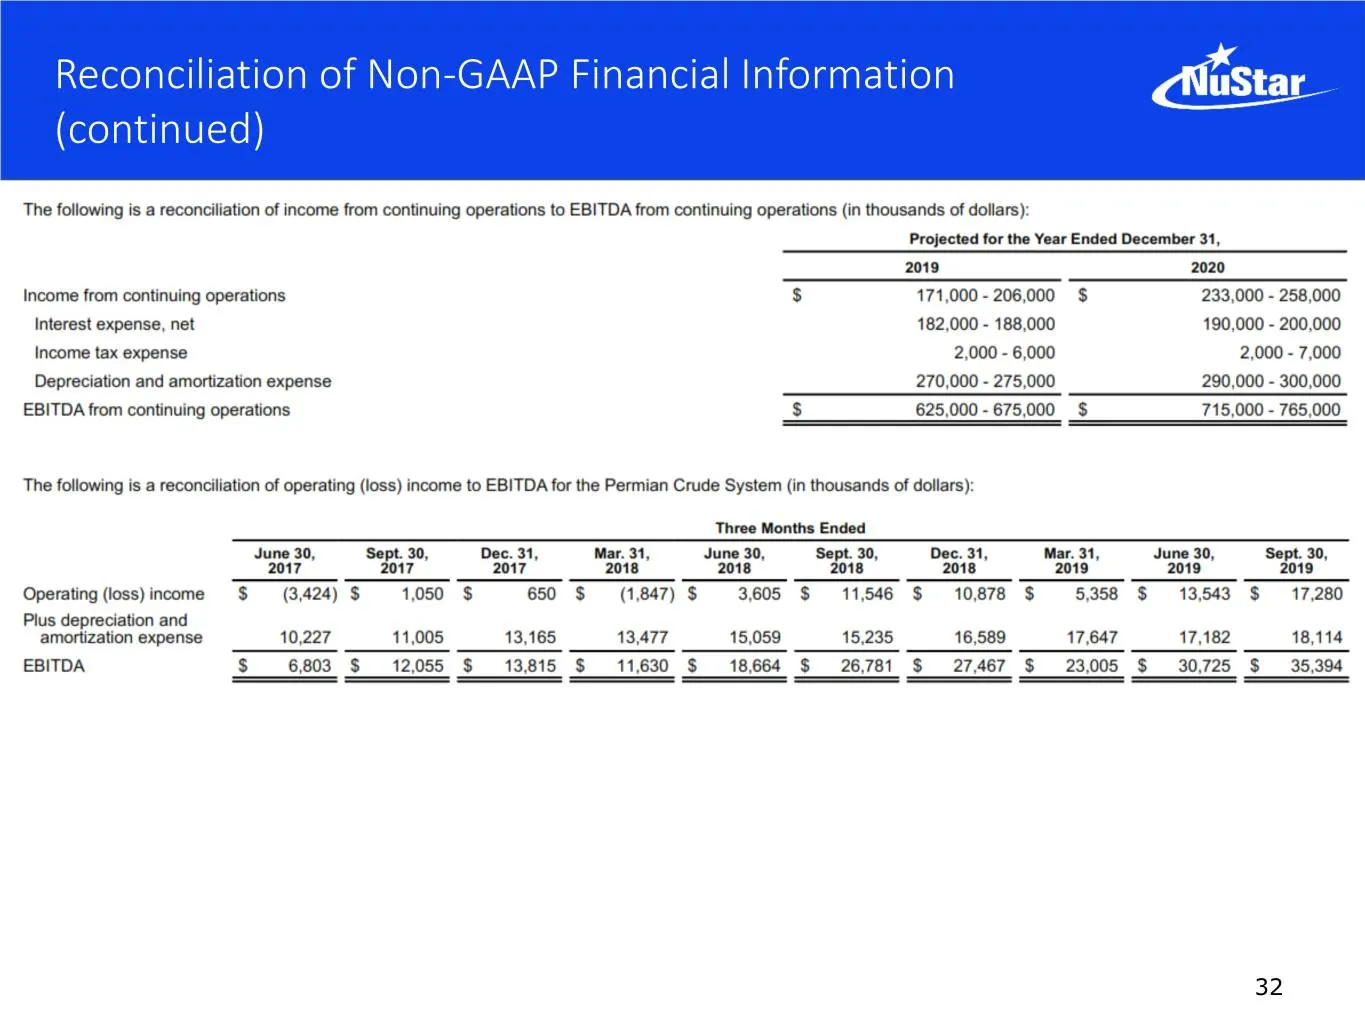
Slide 32: Reconciliation of Non-GAAP Financial Information (continued)
Reconciliation of Non-GAAP Financial Information (continued) 32
Source: SEC EDGAR · 8-K filed Nov 20, 2019
More decks from NuStar Energy LP
 Merger or Acquisition (January 2024)14 slides · Jan 22, 2024
 Investor Presentation (December 2023)35 slides · Dec 5, 2023
 Raymond James Virtual Energy Supply Chain Conference 2023; Pickering Energy Partners TE&MF36 slides · Sep 19, 2023
 Barclays CEO Energy-Power Conference 202336 slides · Sep 6, 2023
 Citi One-on-One Midstream/Energy Infrastructure Conference 202336 slides · Aug 22, 2023
 8th Annual J.P. Morgan Energy, Power & Renewables Conference 202336 slides · Jun 21, 2023