PT Bank Negara Indonesia (Persero) Tbk Class B · IDX:BBNI
PT Bank Negara Indonesia (Persero) Tbk Class B — FY2014 Earnings Presentation
76 slides from PT Bank Negara Indonesia (Persero) Tbk Class B's earnings presentation, Mar 11, 2015
Slide 1: Corporate Presentation FY-2014
Corporate Presentation FY-2014 11 Maret 2015 PT Bank Negara Indonesia (Persero) Tbk < BBNI.IJ >
Slide 2: Agenda
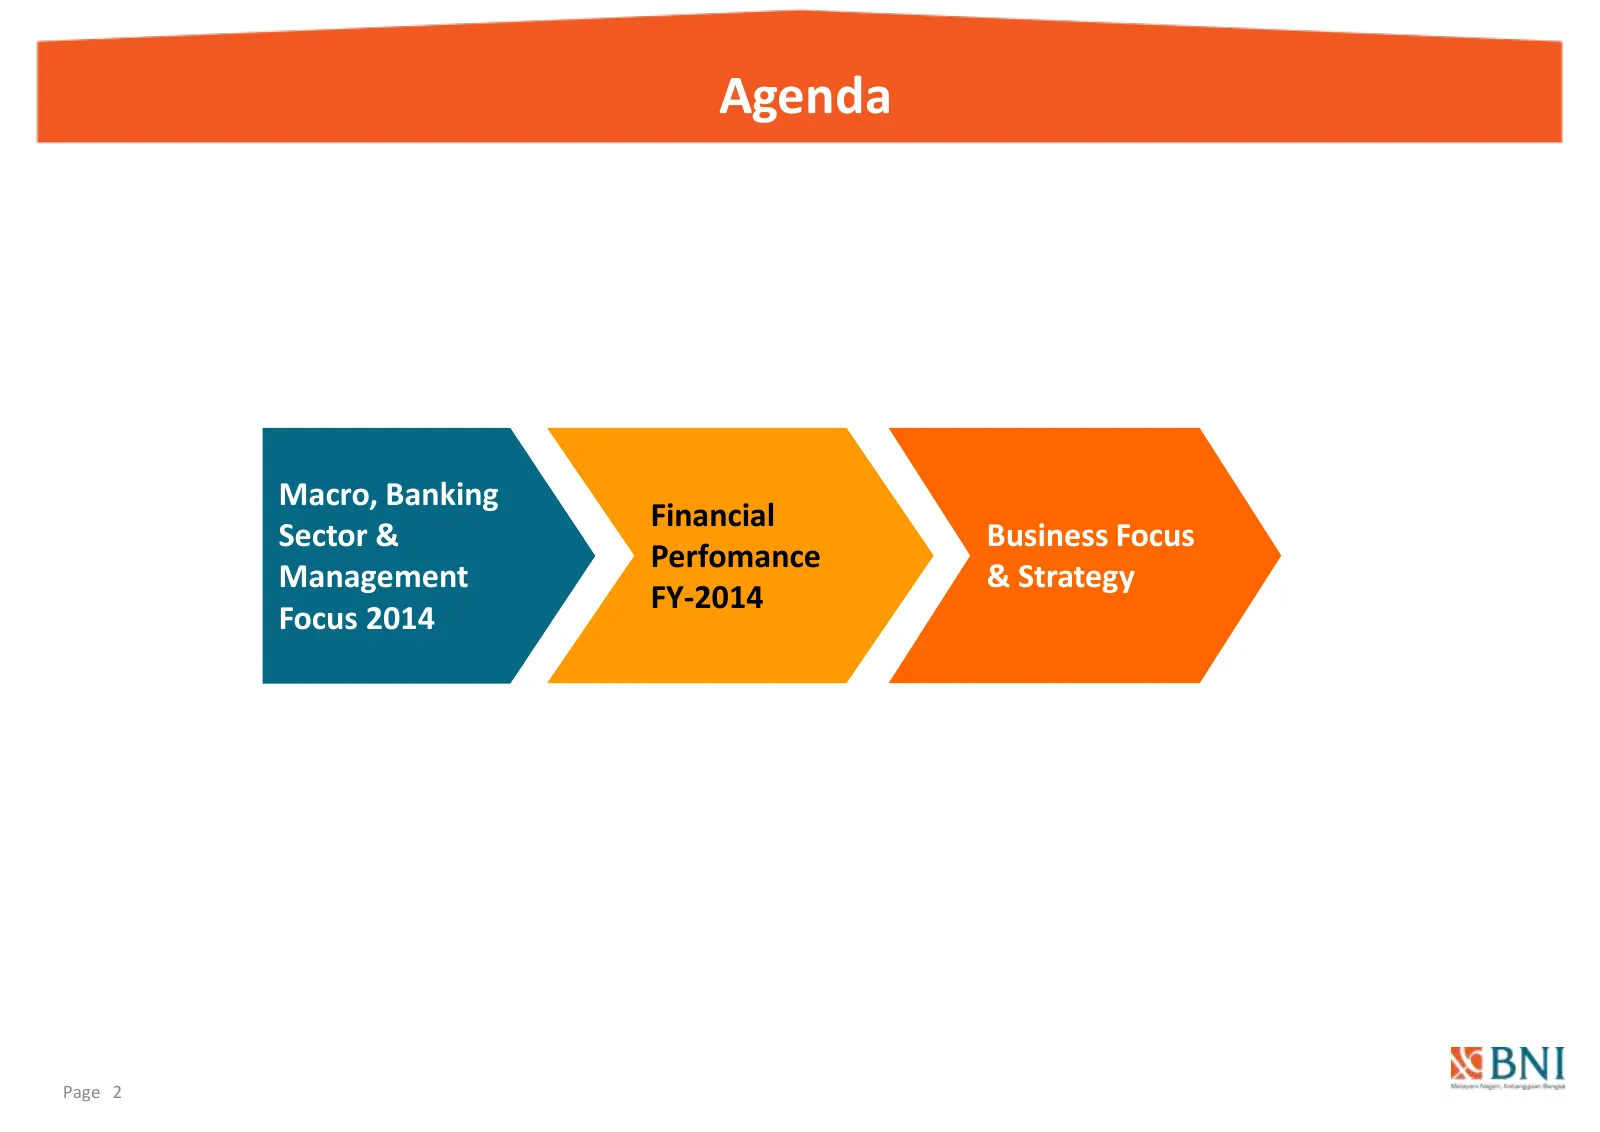
Agenda Macro, Banking Financial Sector & Business Focus Perfomance Management & Strategy FY-2014 Focus 2014 Page 2
Slide 3: Macro, Banking Sector & Management Focus
Macro, Banking Sector & Management Focus
Slide 4: Macro & Banking Sector
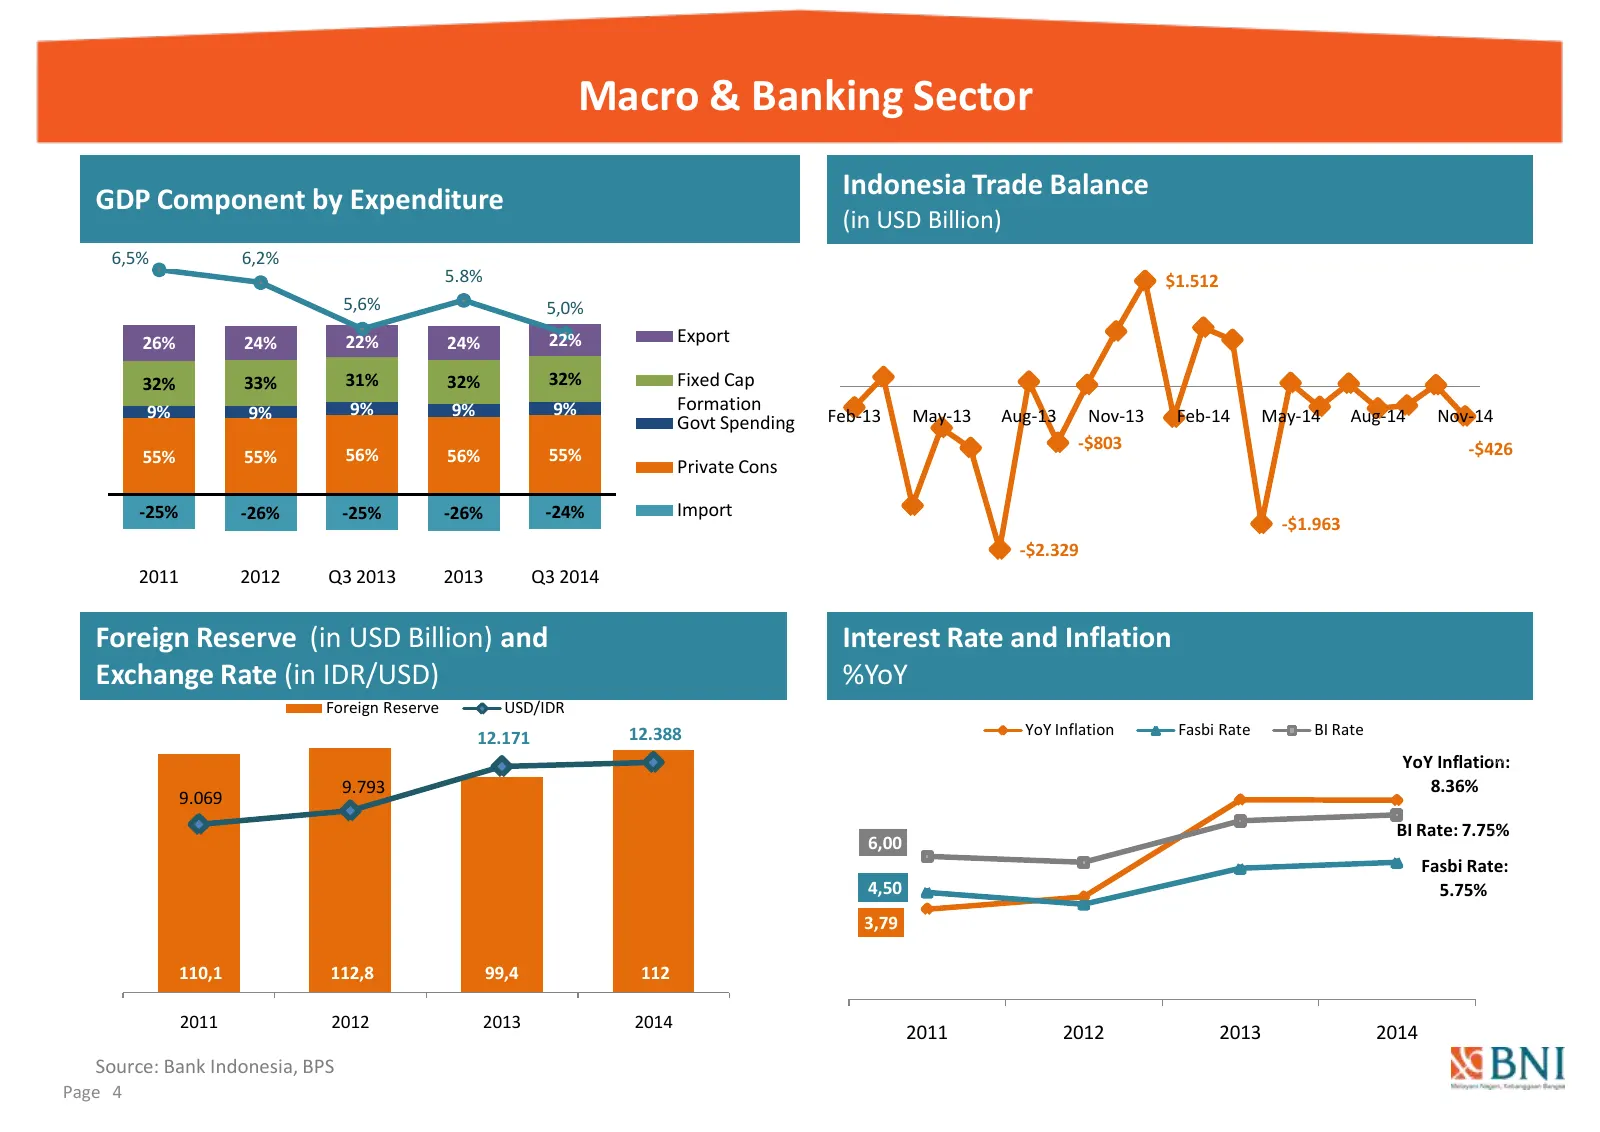
Macro & Banking Sector GDP Component by Expenditure Indonesia Trade Balance (in USD Billion) 6,5% 6,2% 5.8% 6,0% $1.512 95% 5,6% 5,0% 75% 26% 24% 22% 24% 22% 5,0% Export 55% 32% 33% 31% 32% 32% 4,0% Fixed Cap 9% 9% 9% 9% 9% Formation 35% 3,0% Govt Spending Feb-13 May-13 Aug-13 Nov-13 Feb-14 May-14 A
Slide 5: Banking Sector Highlights
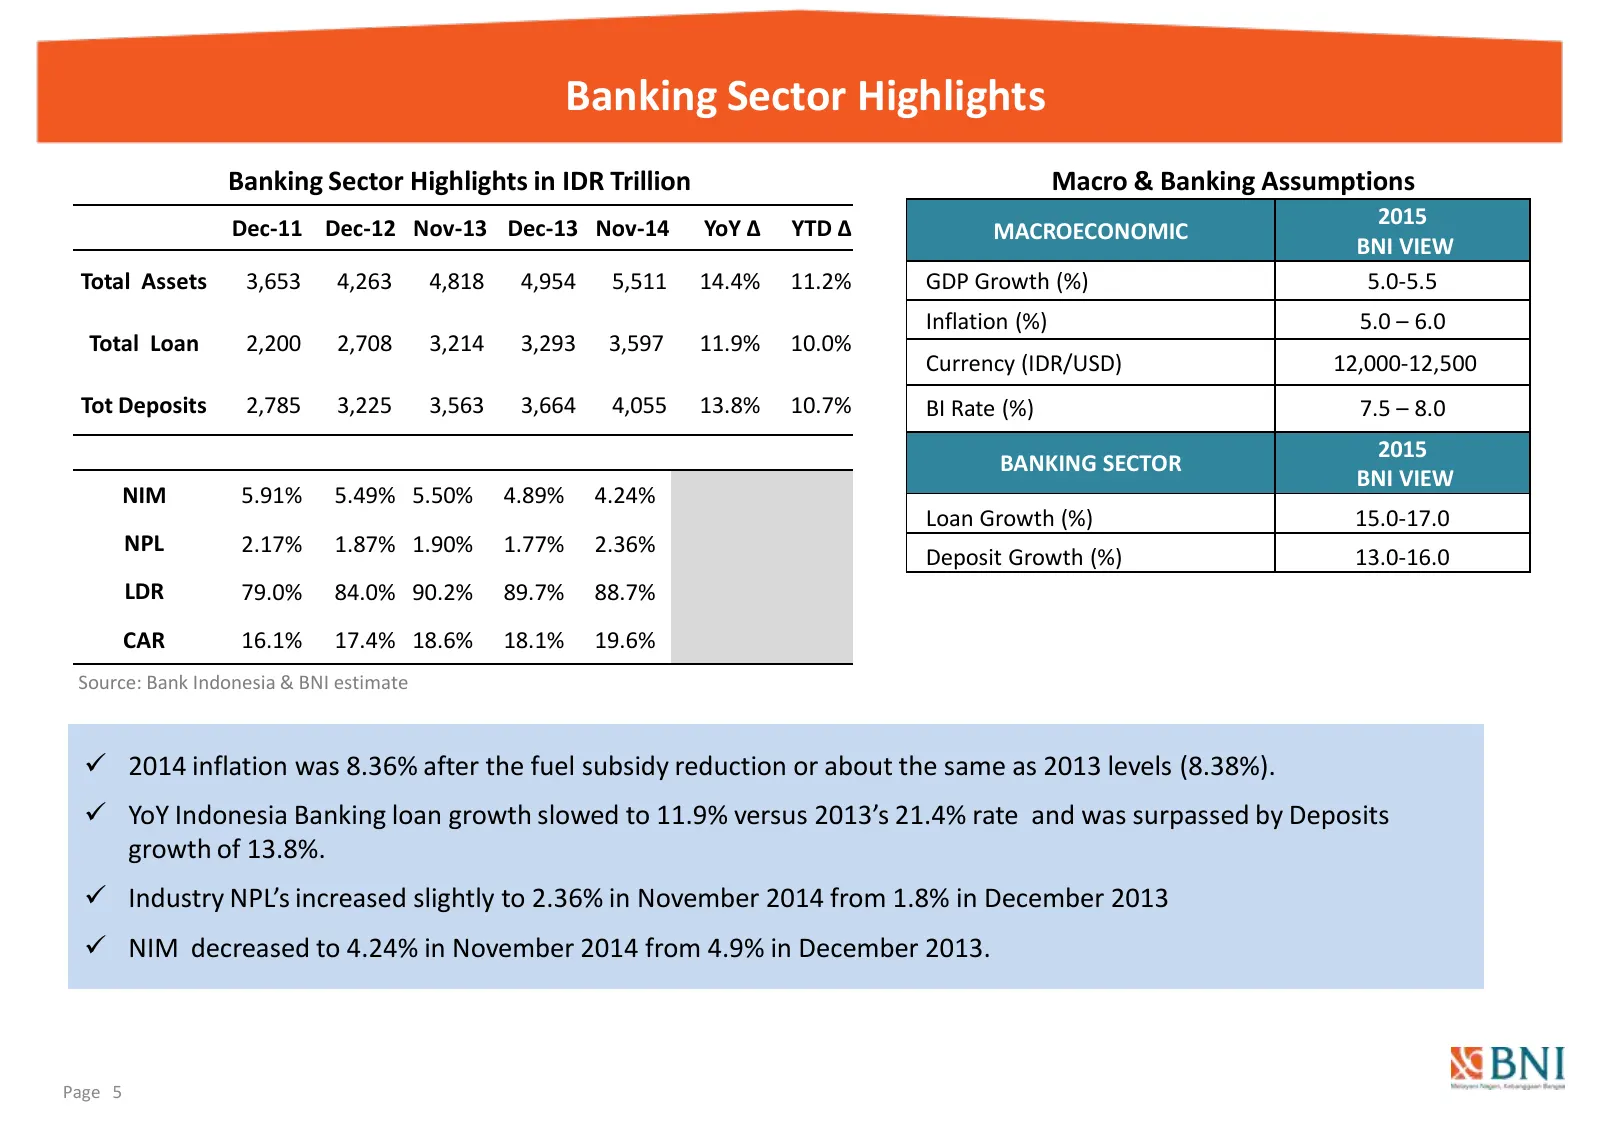
Banking Sector Highlights Banking Sector Highlights in IDR Trillion Macro & Banking Assumptions 2015 Dec-11 Dec-12 Nov-13 Dec-13 Nov-14 YoY ∆ YTD ∆ MACROECONOMIC BNI VIEW Total Assets 3,653 4,263 4,818 4,954 5,511 14.4% 11.2% GDP Growth (%) 5.0-5.5 Inflation (%) 5.0 – 6.0 Total Loan 2,200 2,708 3,21
Slide 6: Management Focus 2014
Management Focus 2014
Slide 7: Sustainable Financial Growth
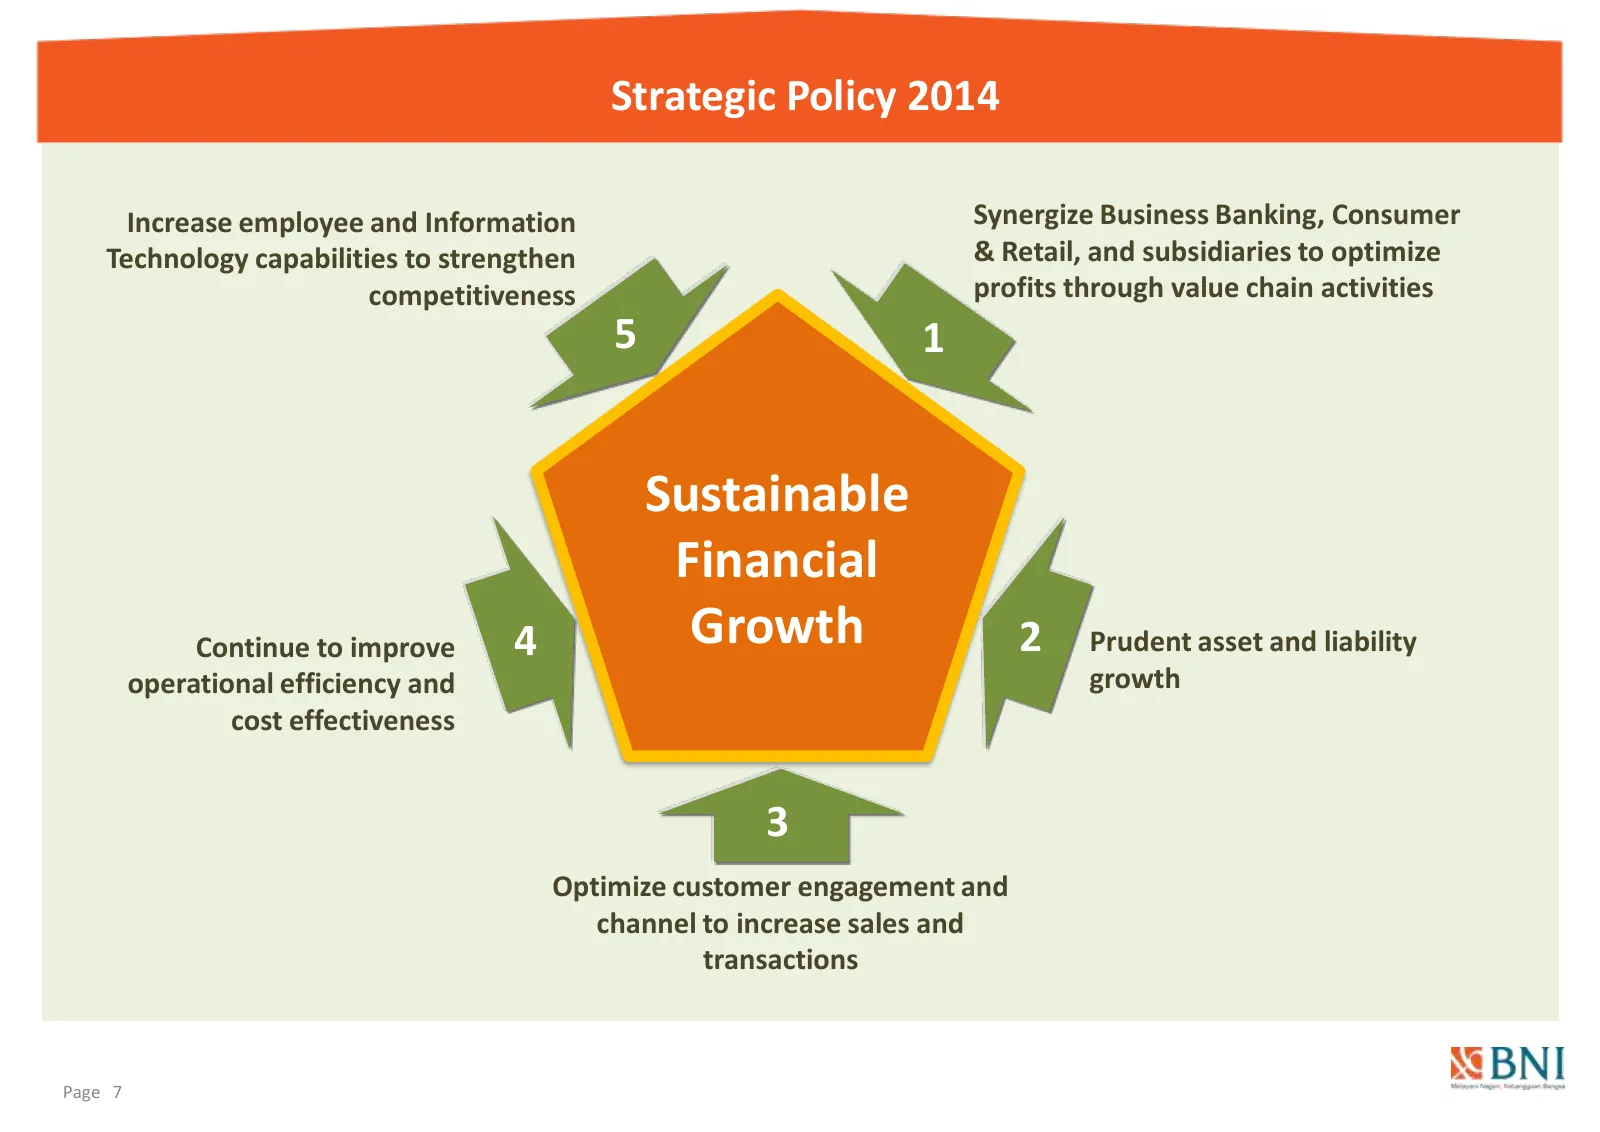
Strategic Policy 2014 Increase employee and Information Synergize Business Banking, Consumer Technology capabilities to strengthen & Retail, and subsidiaries to optimize competitiveness profits through value chain activities 5 1 Sustainable Financial Continue to improve 4 Growth 2 Prudent asset and
Slide 8: Initiatives & Target 2014
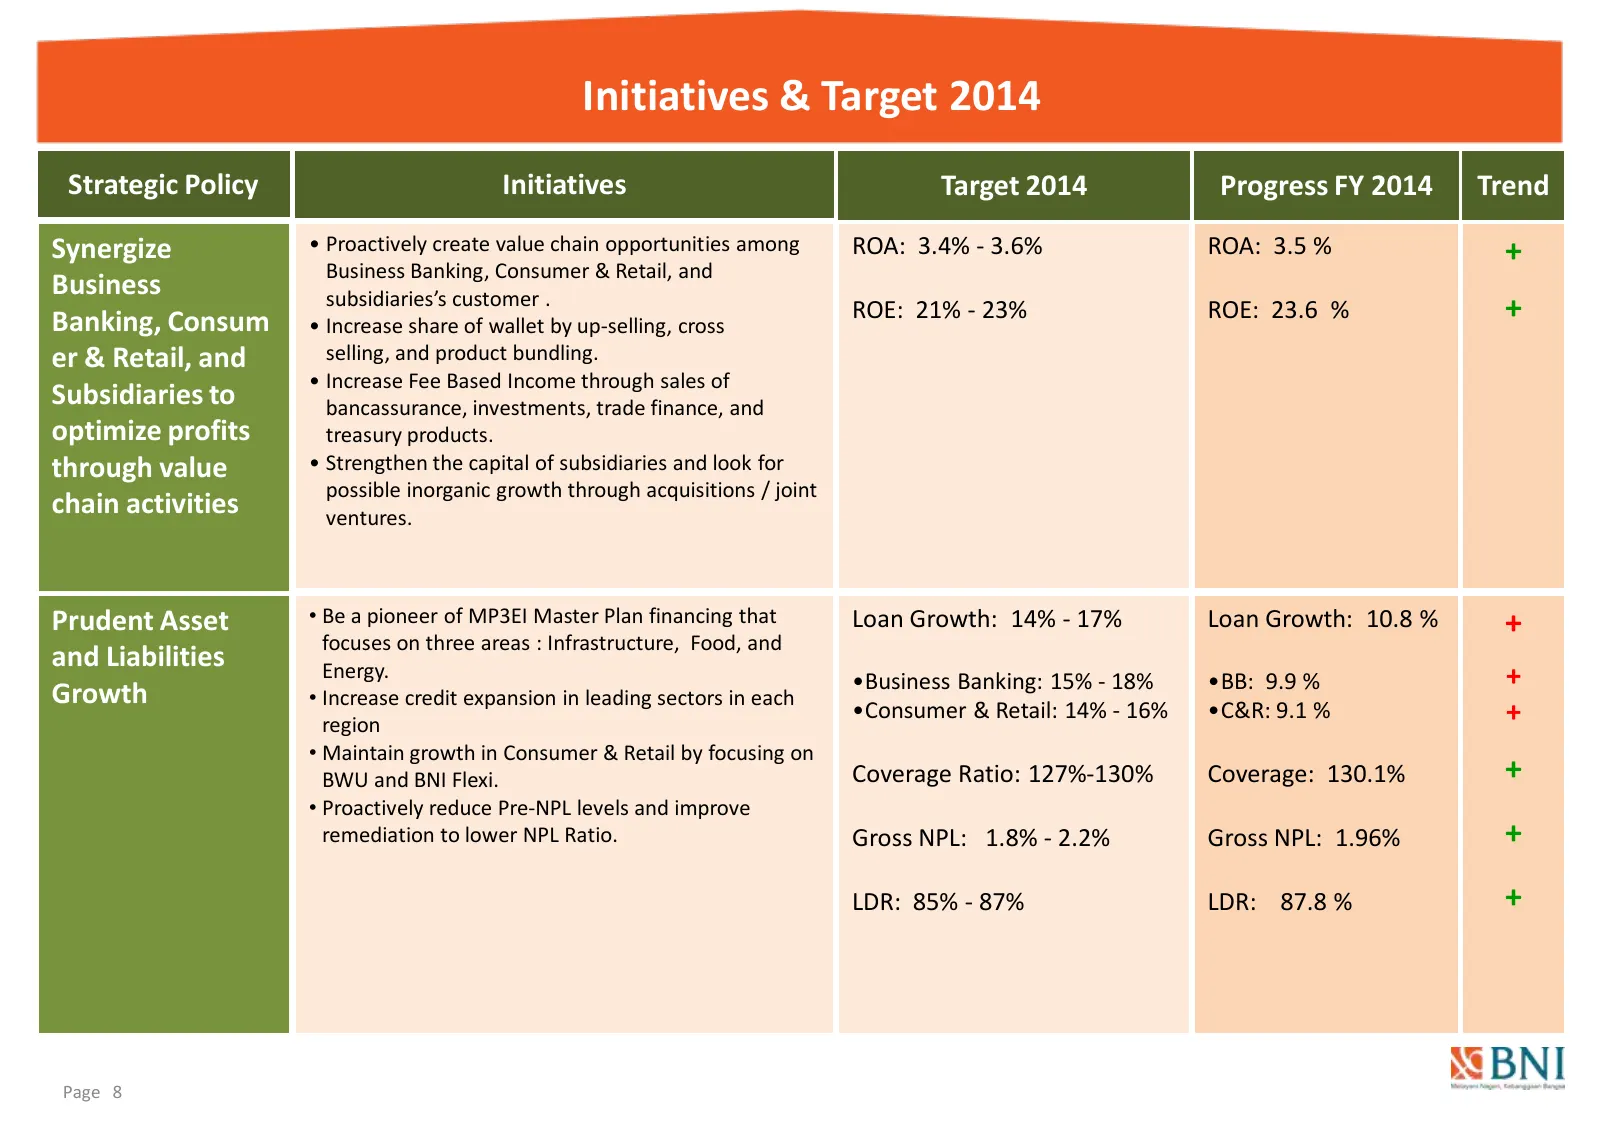
Initiatives & Target 2014 Strategic Policy Initiatives Target 2014 Progress FY 2014 Trend Synergize • Proactively create value chain opportunities among ROA: 3.4% - 3.6% ROA: 3.5 % + Business Banking, Consumer & Retail, and Business subsidiaries’s customer . Banking, Consum • Increase share of walle
Slide 9: Initiatives & Target 2014
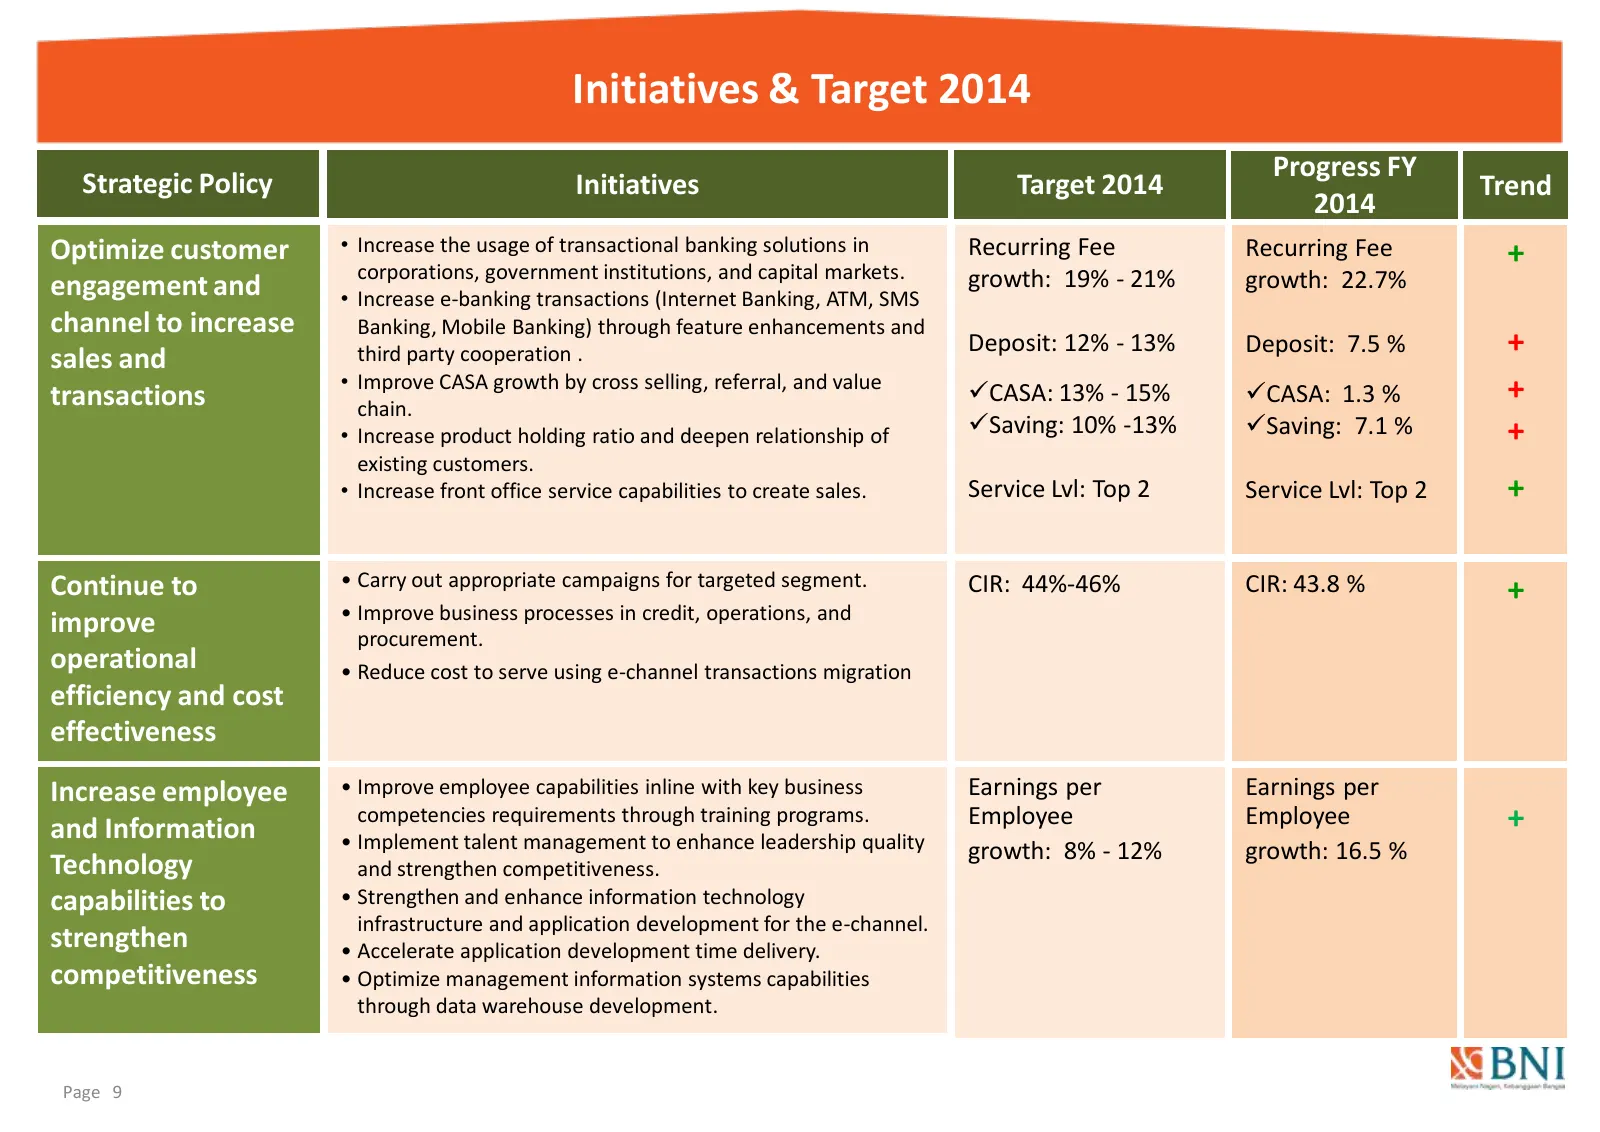
Initiatives & Target 2014 Progress FY Strategic Policy Initiatives Target 2014 Trend 2014 Optimize customer • Increase the usage of transactional banking solutions in Recurring Fee Recurring Fee + corporations, government institutions, and capital markets. growth: 19% - 21% growth: 22.7% engagement
Slide 10: Financial Performance FY-2014
Financial Performance FY- 2014 I. Balance Sheet II. Profit & Loss III. Financial Ratio
Slide 11: Balance Sheet Highlight
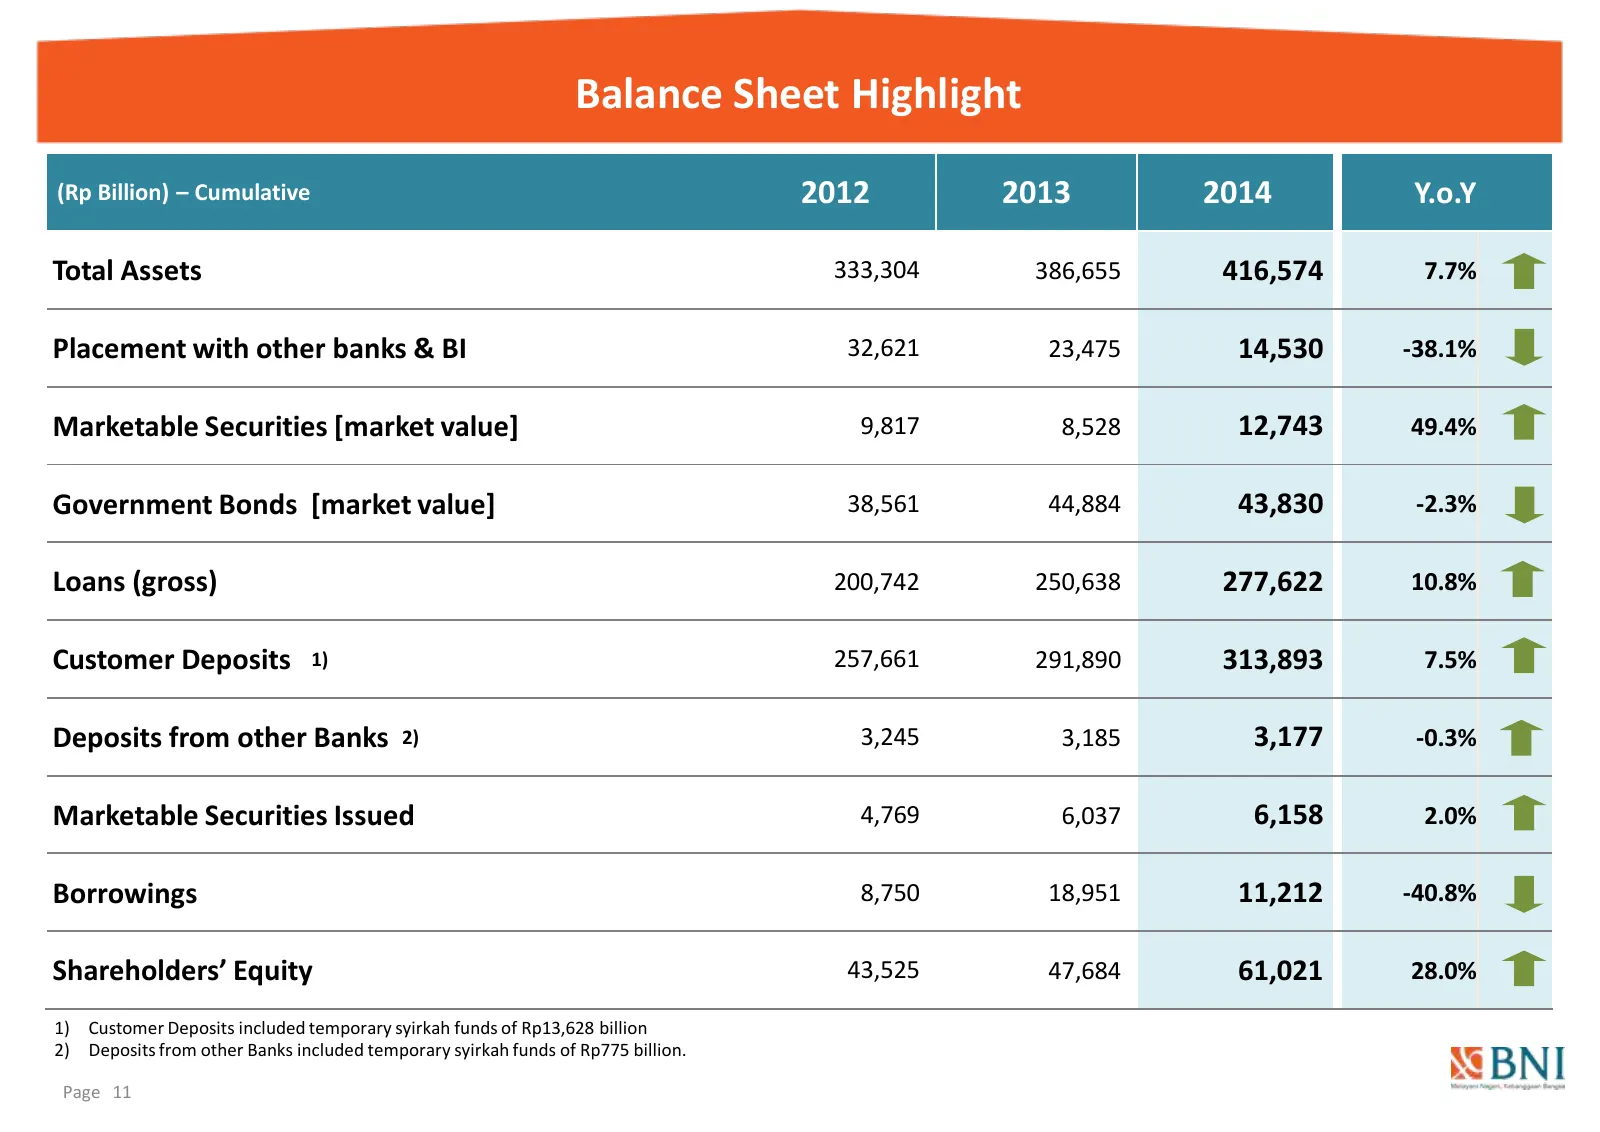
Balance Sheet Highlight (Rp Billion) – Cumulative 2012 2013 2014 Y.o.Y Total Assets 333,304 386,655 416,574 7.7% Placement with other banks & BI 32,621 23,475 14,530 -38.1% Marketable Securities [market value] 9,817 8,528 12,743 49.4% Government Bonds [market value] 38,561 44,884 43,830 -2.3% Loans
Slide 12: Loan Composition
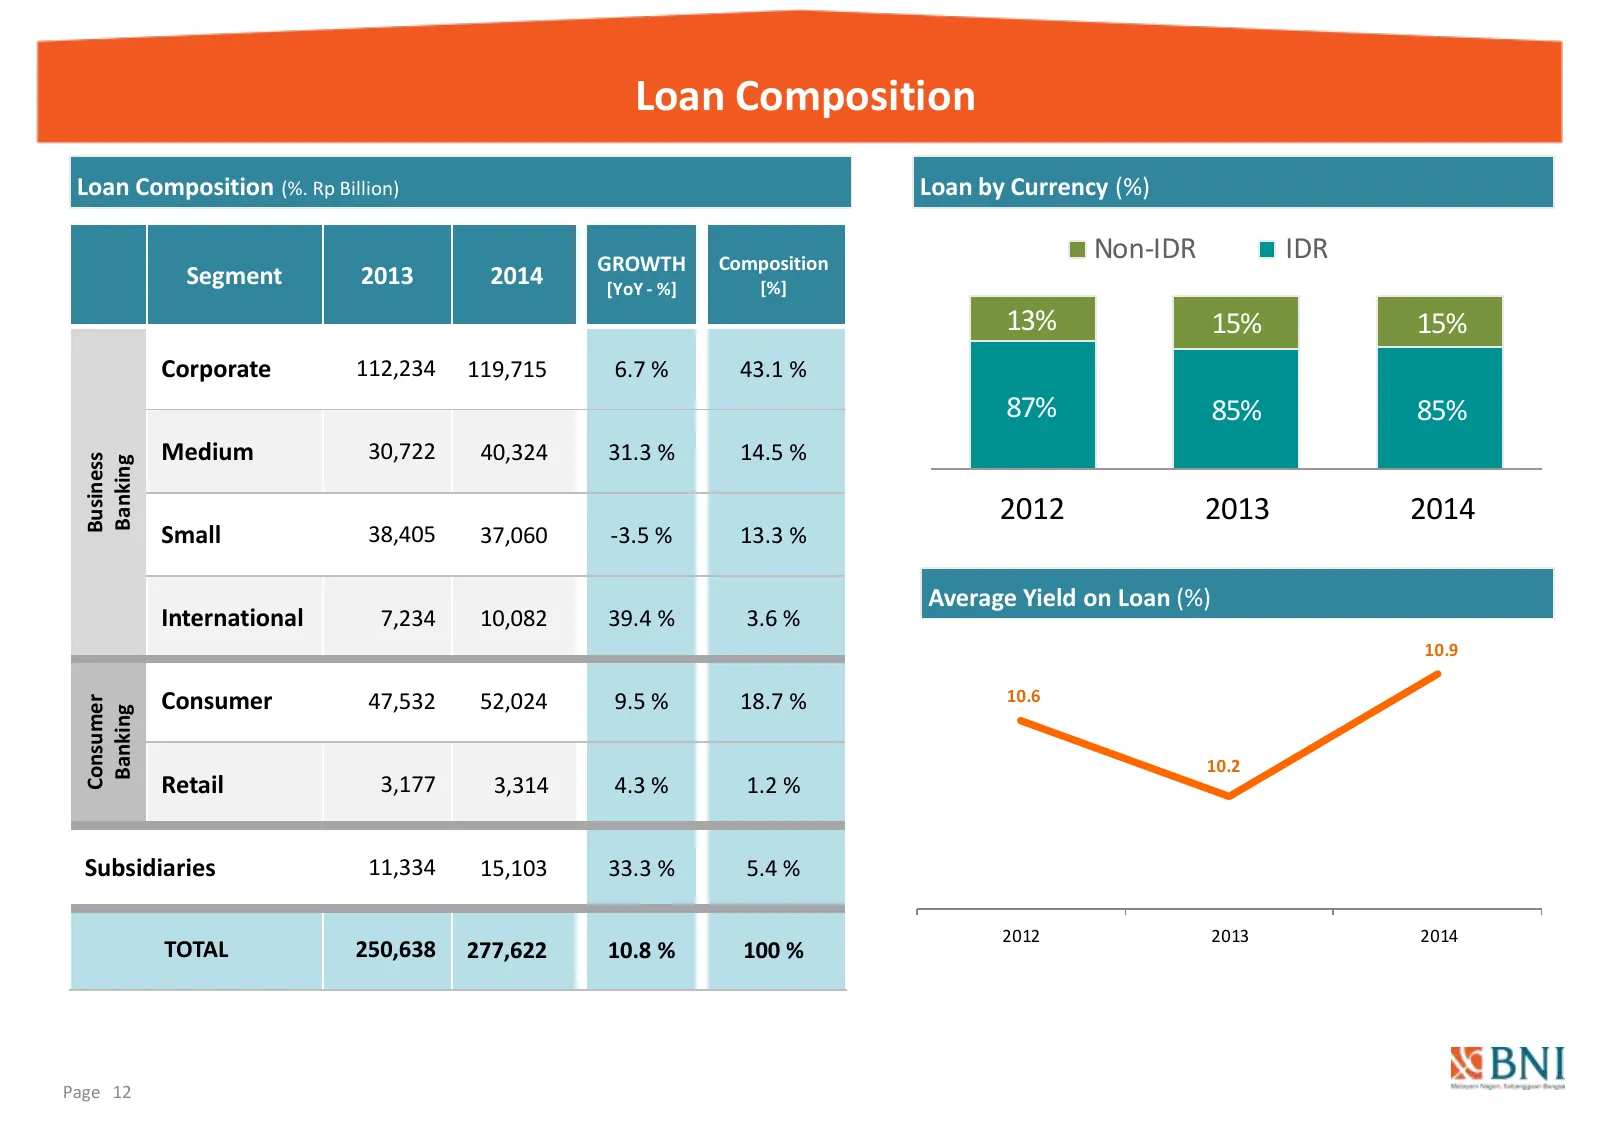
Loan Composition Loan Composition (%. Rp Billion) Loan by Currency (%) GROWTH Composition Non-IDR IDR Segment 2013 2014 [YoY - %] [%] 13% 15% 15% Corporate 112,234 119,715 6.7 % 43.1 % 87% 85% 85% Medium 30,722 40,324 31.3 % 14.5 % Business Banking 2012 2013 2014 Small 38,405 37,060 -3.5 % 13.3 % Av
Slide 13: Breakdown Business Banking & Breakdown Consumer Loans
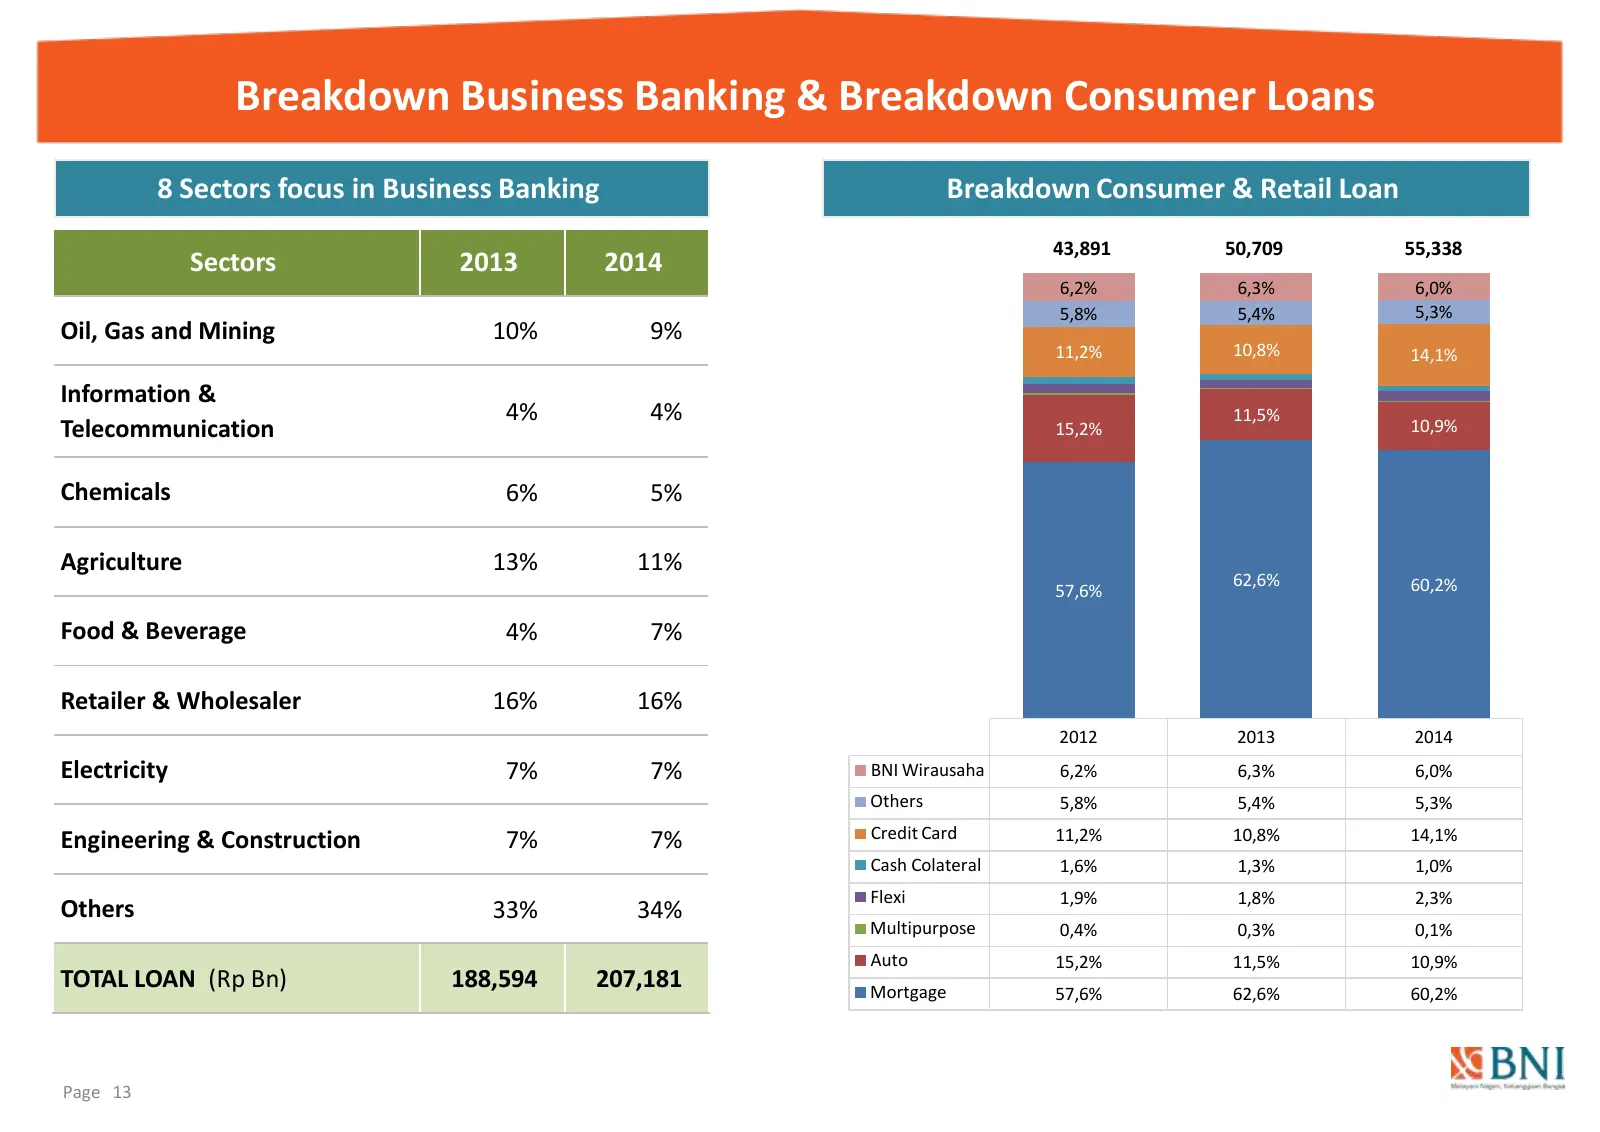
Breakdown Business Banking & Breakdown Consumer Loans 8 Sectors focus in Business Banking Breakdown Consumer & Retail Loan 43,891 50,709 55,338 Sectors 2013 2014 6,2% 6,3% 6,0% 5,8% 5,4% 5,3% Oil, Gas and Mining 10% 9% 11,2% 10,8% 14,1% Information & 4% 4% 11,5% Telecommunication 15,2% 10,9% Chemica
Slide 14: Marketable Securities
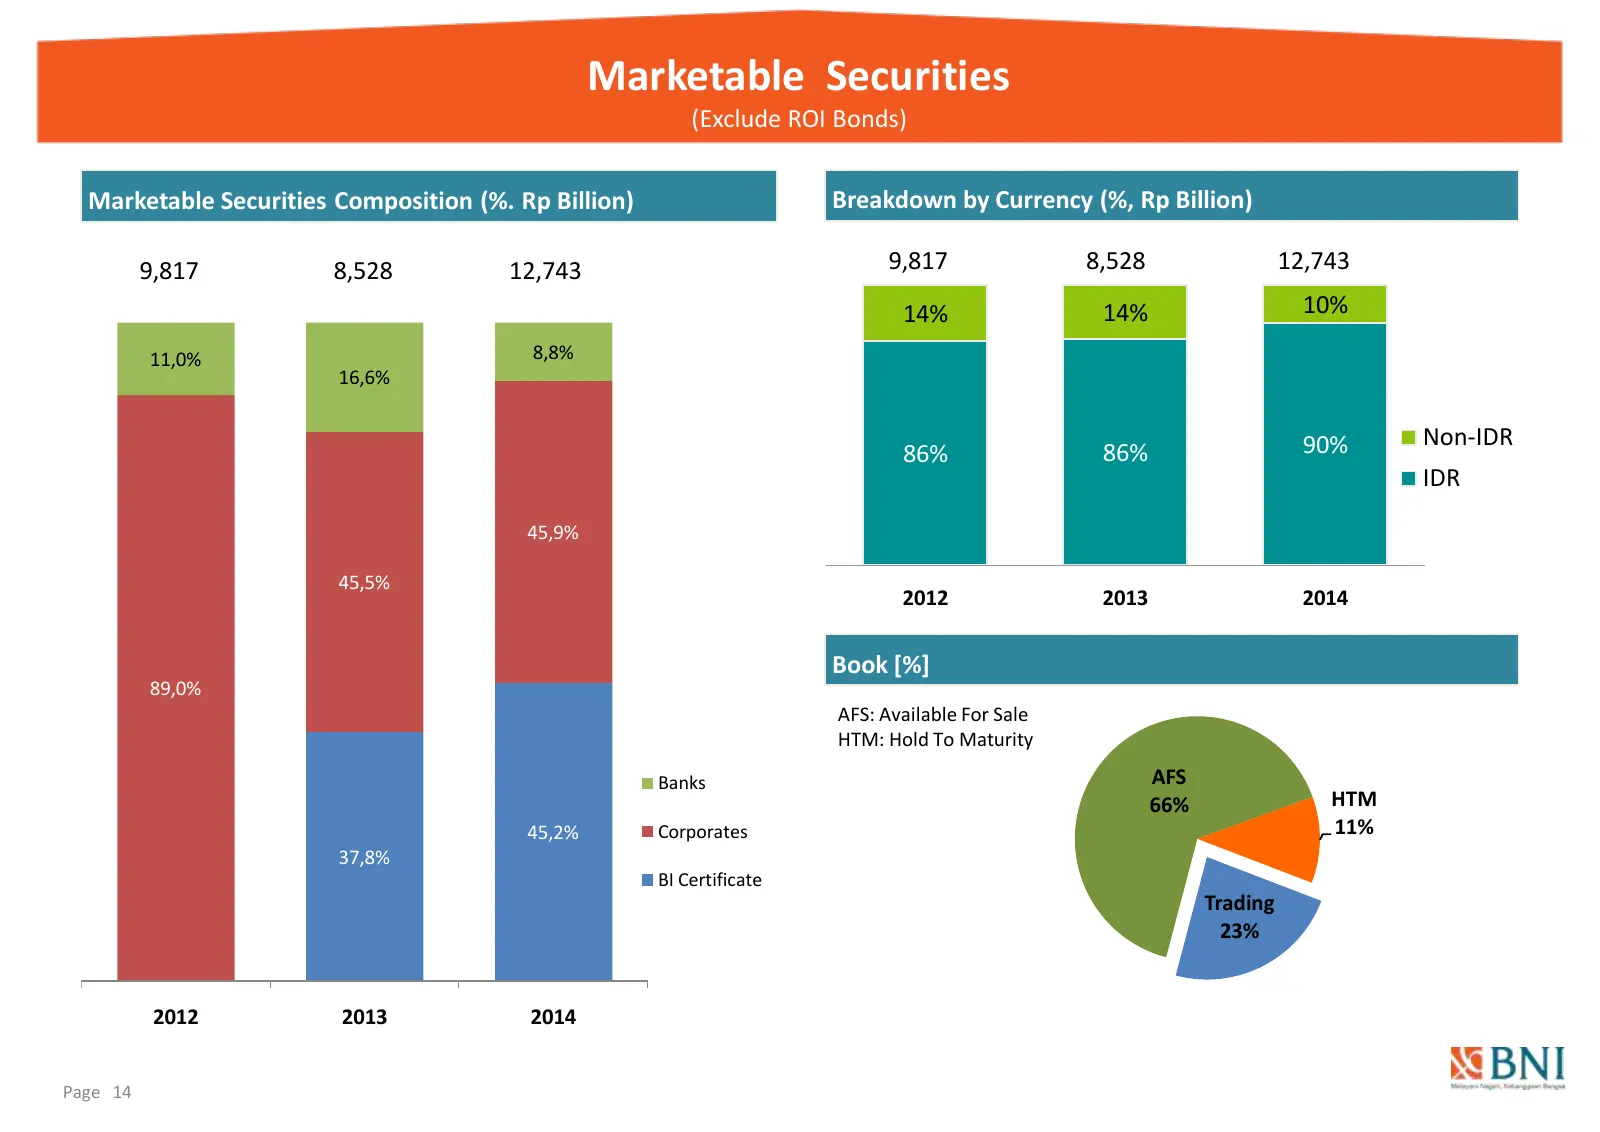
Marketable Securities (Exclude ROI Bonds) Marketable Securities Composition (%. Rp Billion) Breakdown by Currency (%, Rp Billion) 9,817 8,528 12,743 9,817 8,528 12,743 14% 14% 10% 11,0% 8,8% 16,6% 90% Non-IDR 86% 86% IDR 45,9% 45,5% 2012 2013 2014 Book [%] 89,0% AFS: Available For Sale HTM: Hold To
Slide 15: ROI Bonds
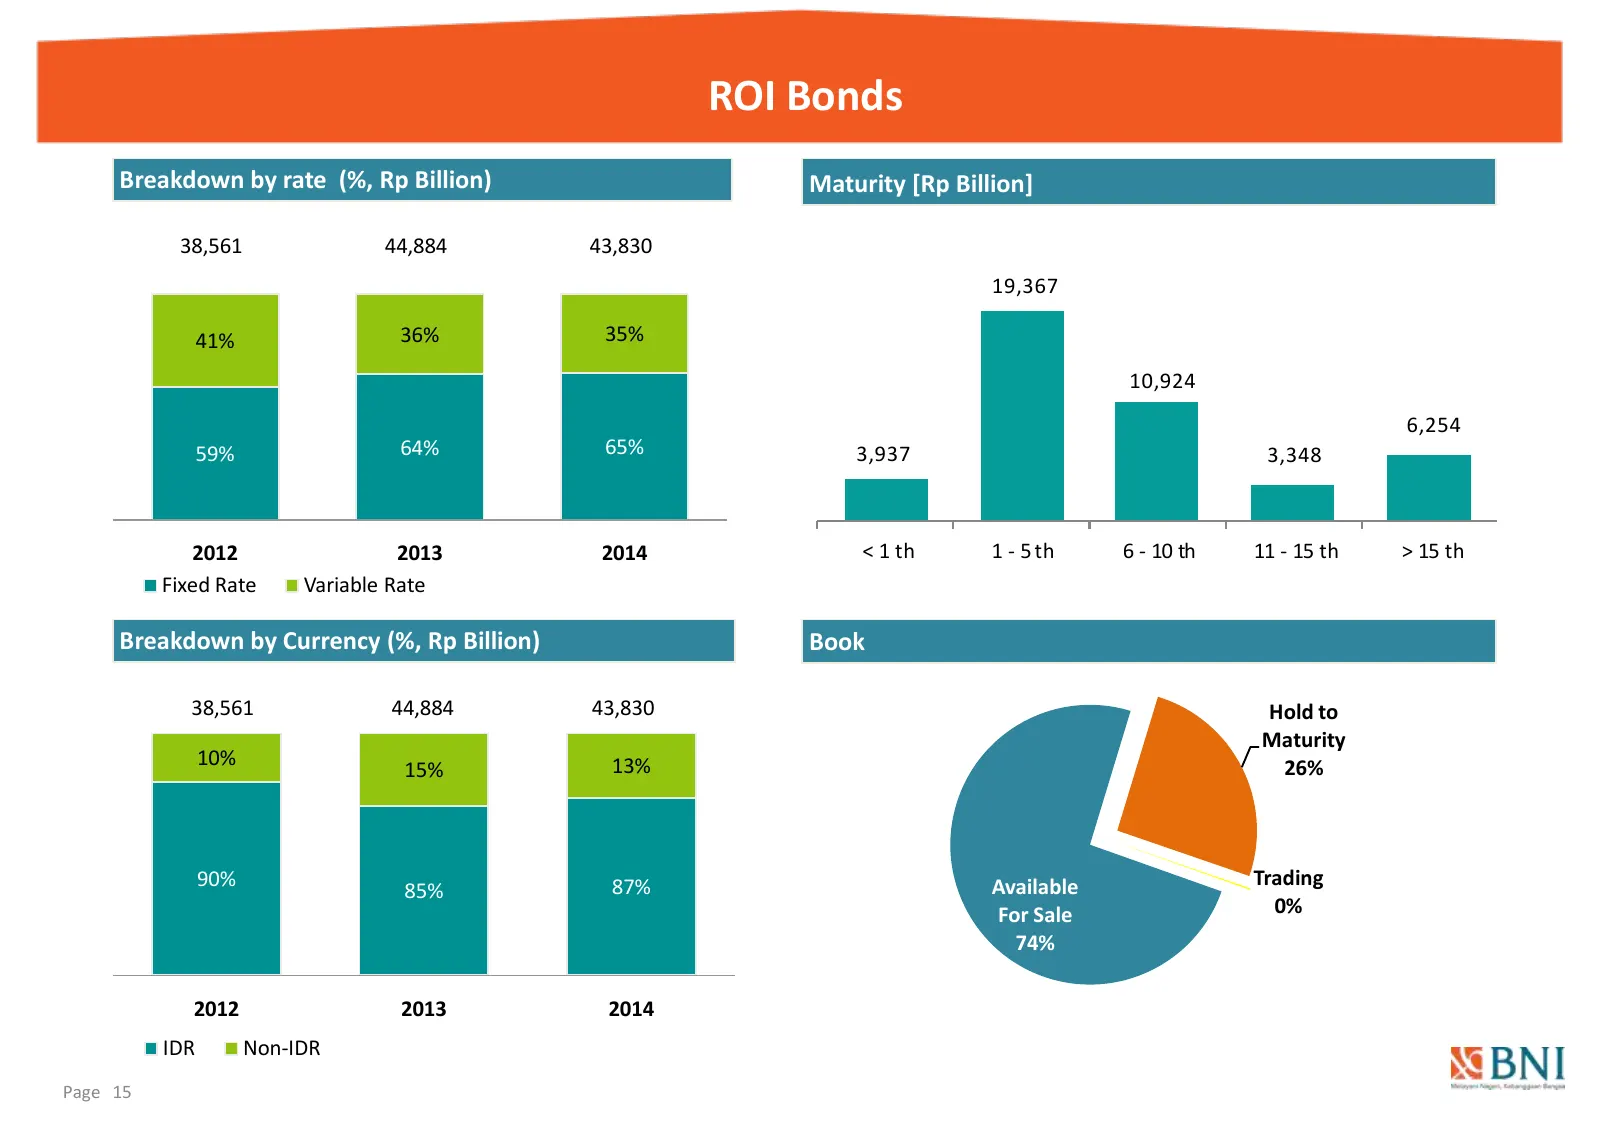
ROI Bonds Breakdown by rate (%, Rp Billion) Maturity [Rp Billion] 38,561 44,884 43,830 19,367 41% 36% 35% 10,924 6,254 59% 64% 65% 3,937 3,348 2012 2013 2014 < 1 th 1 - 5 th 6 - 10 th 11 - 15 th > 15 th Fixed Rate Variable Rate Breakdown by Currency (%, Rp Billion) Book 38,561 44,884 43,830 Hold to
Slide 16: Customer Deposit
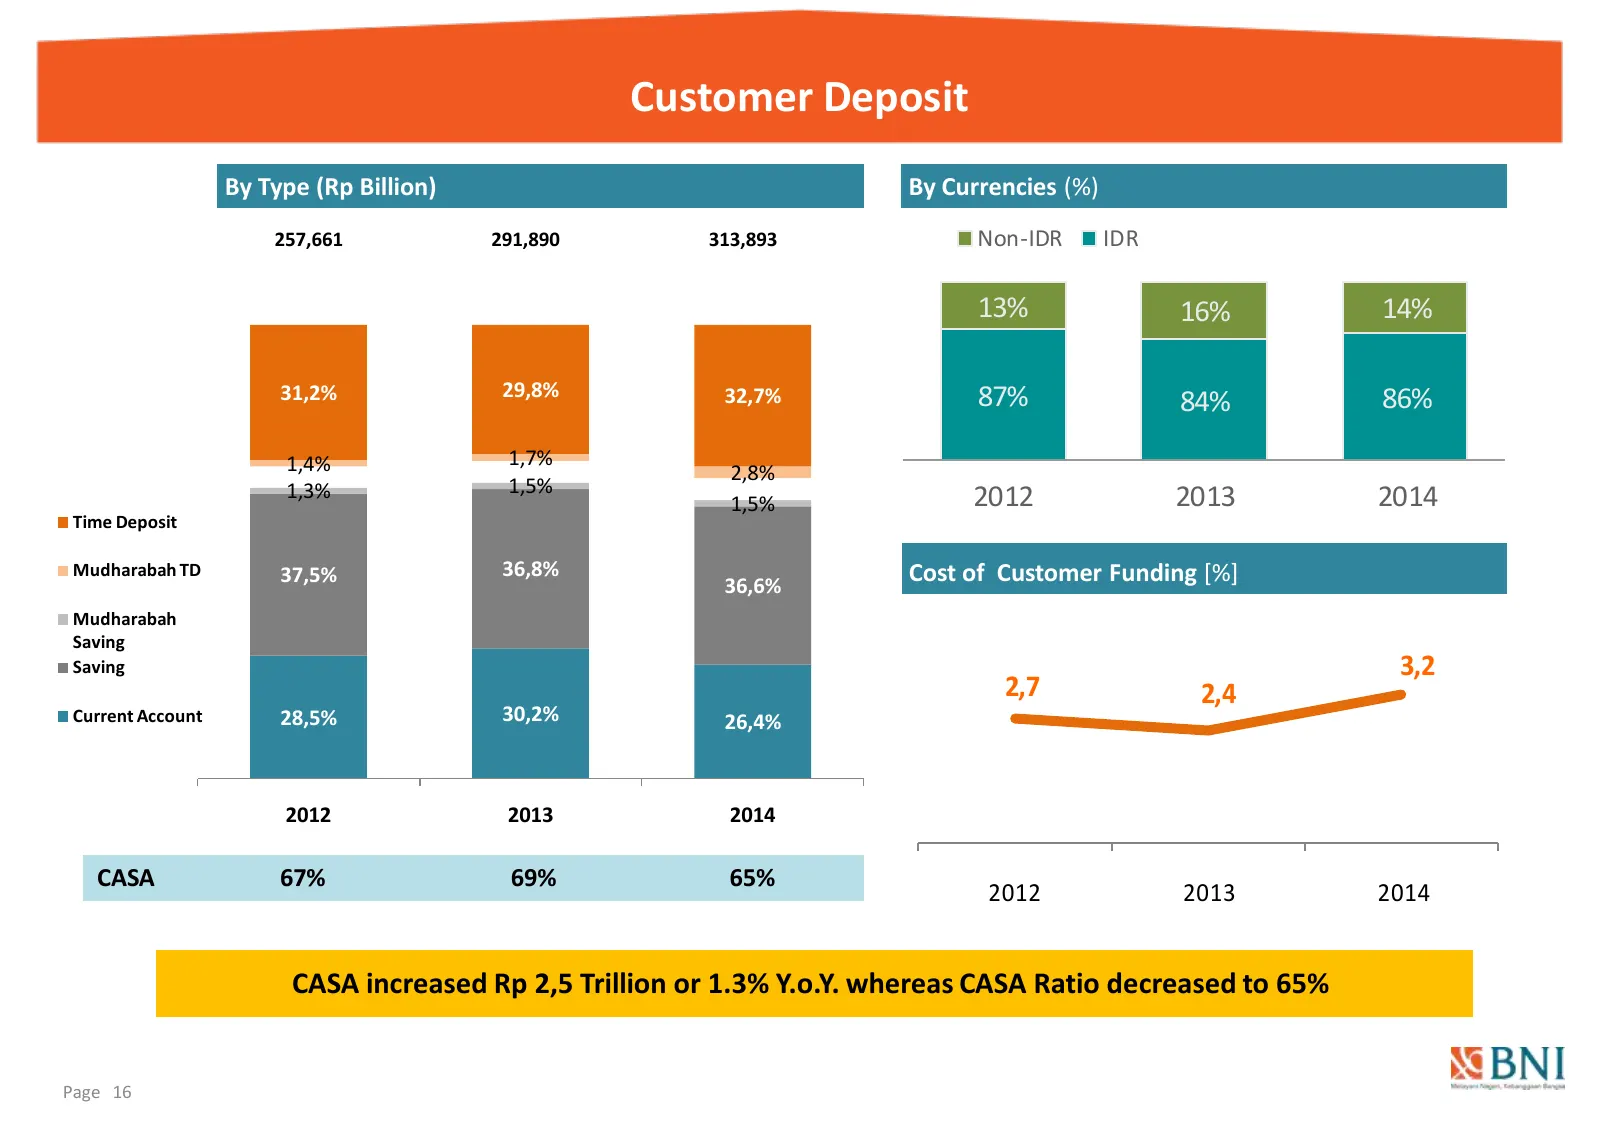
Customer Deposit By Type (Rp Billion) By Currencies (%) 257,661 291,890 313,893 Non-IDR IDR 13% 16% 14% 31,2% 29,8% 38% 31% 32,7% 87% 84% 86% 33% 1,7% 1,4% 2,8% 1,3% 1,5% 1,5% 2012 2013 2014 Time Deposit Mudharabah TD 37,5% 36,8% Cost of Customer Funding [%] 36,6% Mudharabah Saving Saving 30% 3,2 28
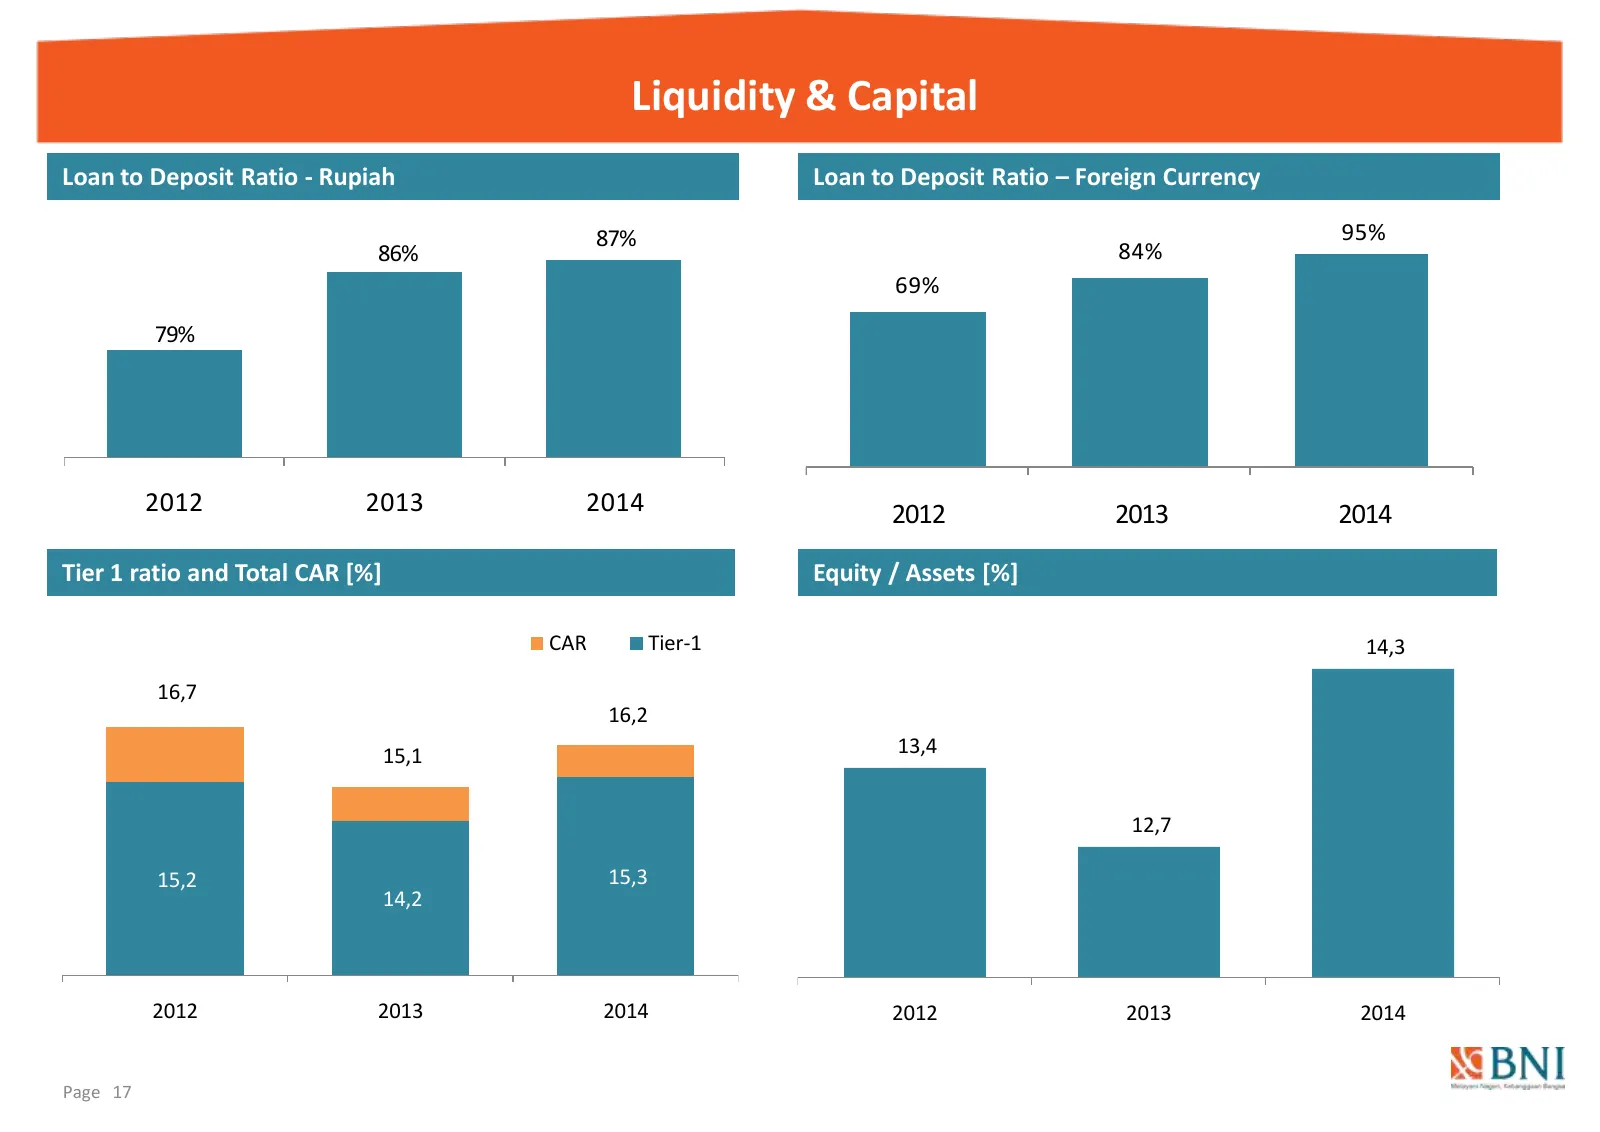
Slide 17: Liquidity & Capital
Liquidity & Capital Loan to Deposit Ratio - Rupiah Loan to Deposit Ratio – Foreign Currency 87% 95% 86% 84% 69% 79% 2012 2013 2014 2012 2013 2014 Tier 1 ratio and Total CAR [%] Equity / Assets [%] CAR Tier-1 14,3 16,7 16,2 15,1 13,4 12,7 15,2 15,3 14,2 2012 2013 2014 2012 2013 2014 Page 17
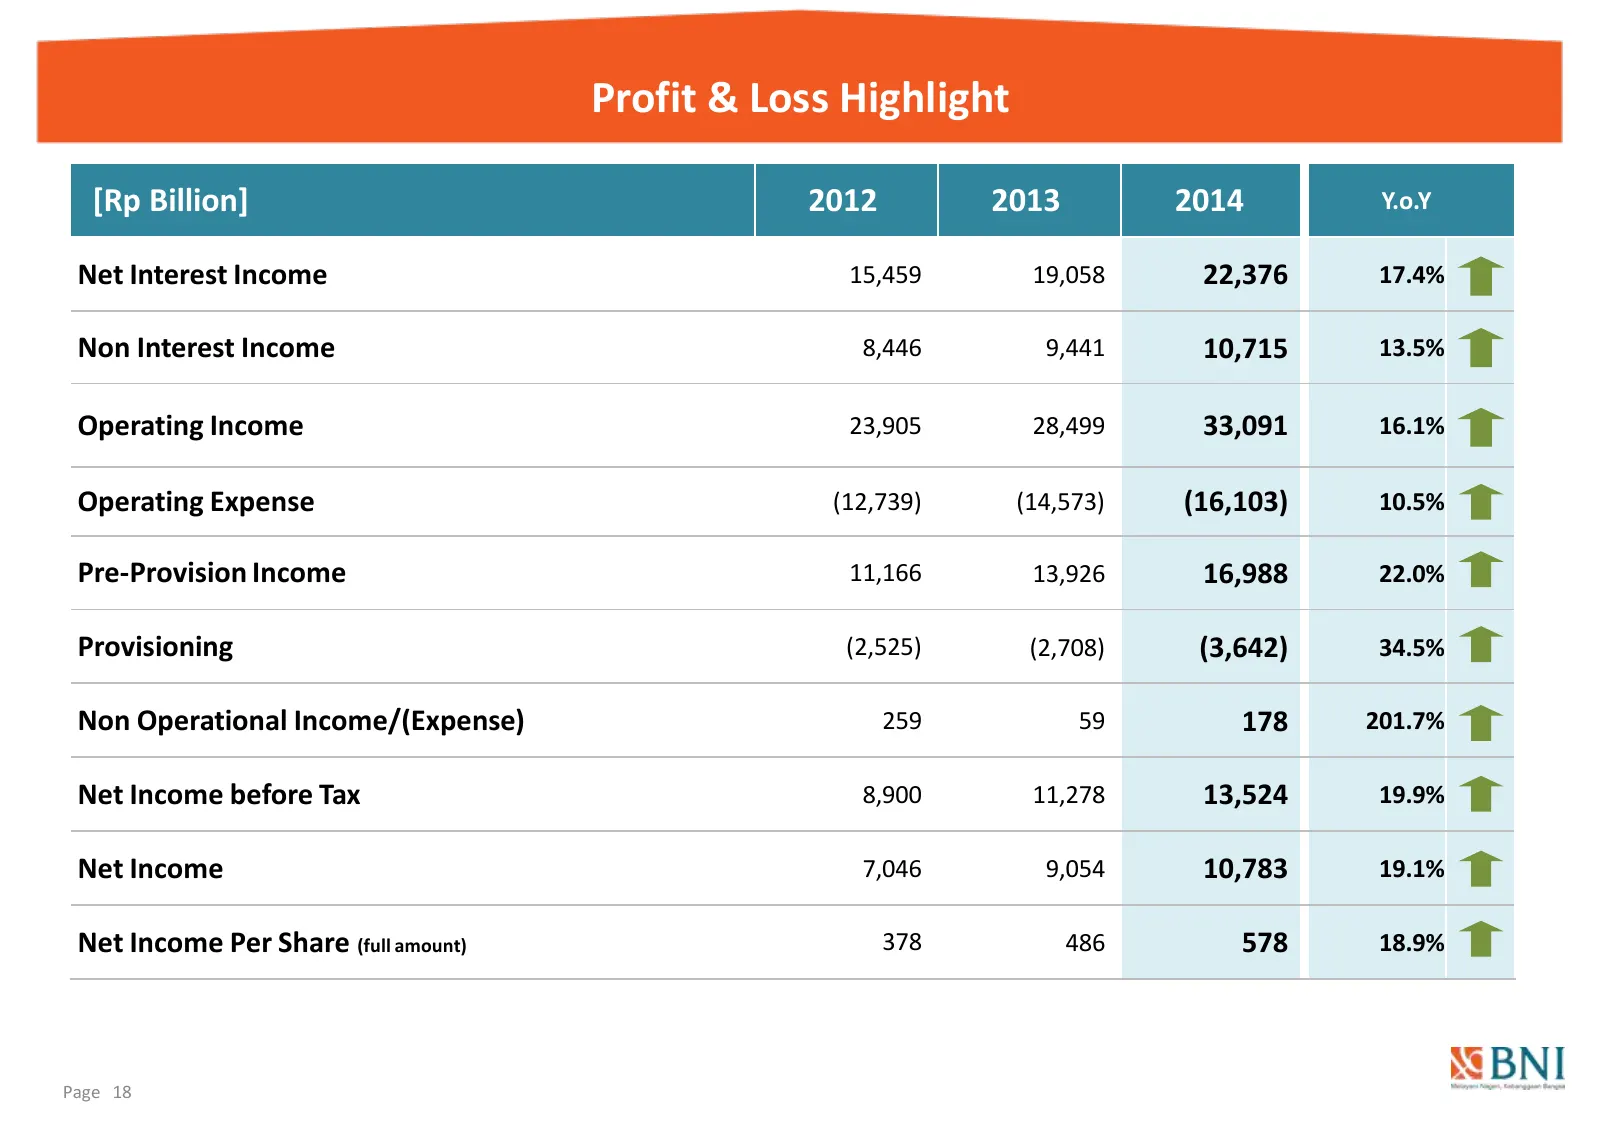
Slide 18: Profit & Loss Highlight
Profit & Loss Highlight [Rp Billion] 2012 2013 2014 Y.o.Y Net Interest Income 15,459 19,058 22,376 17.4% Non Interest Income 8,446 9,441 10,715 13.5% Operating Income 23,905 28,499 33,091 16.1% Operating Expense (12,739) (14,573) (16,103) 10.5% Pre-Provision Income 11,166 13,926 16,988 22.0% Provisi
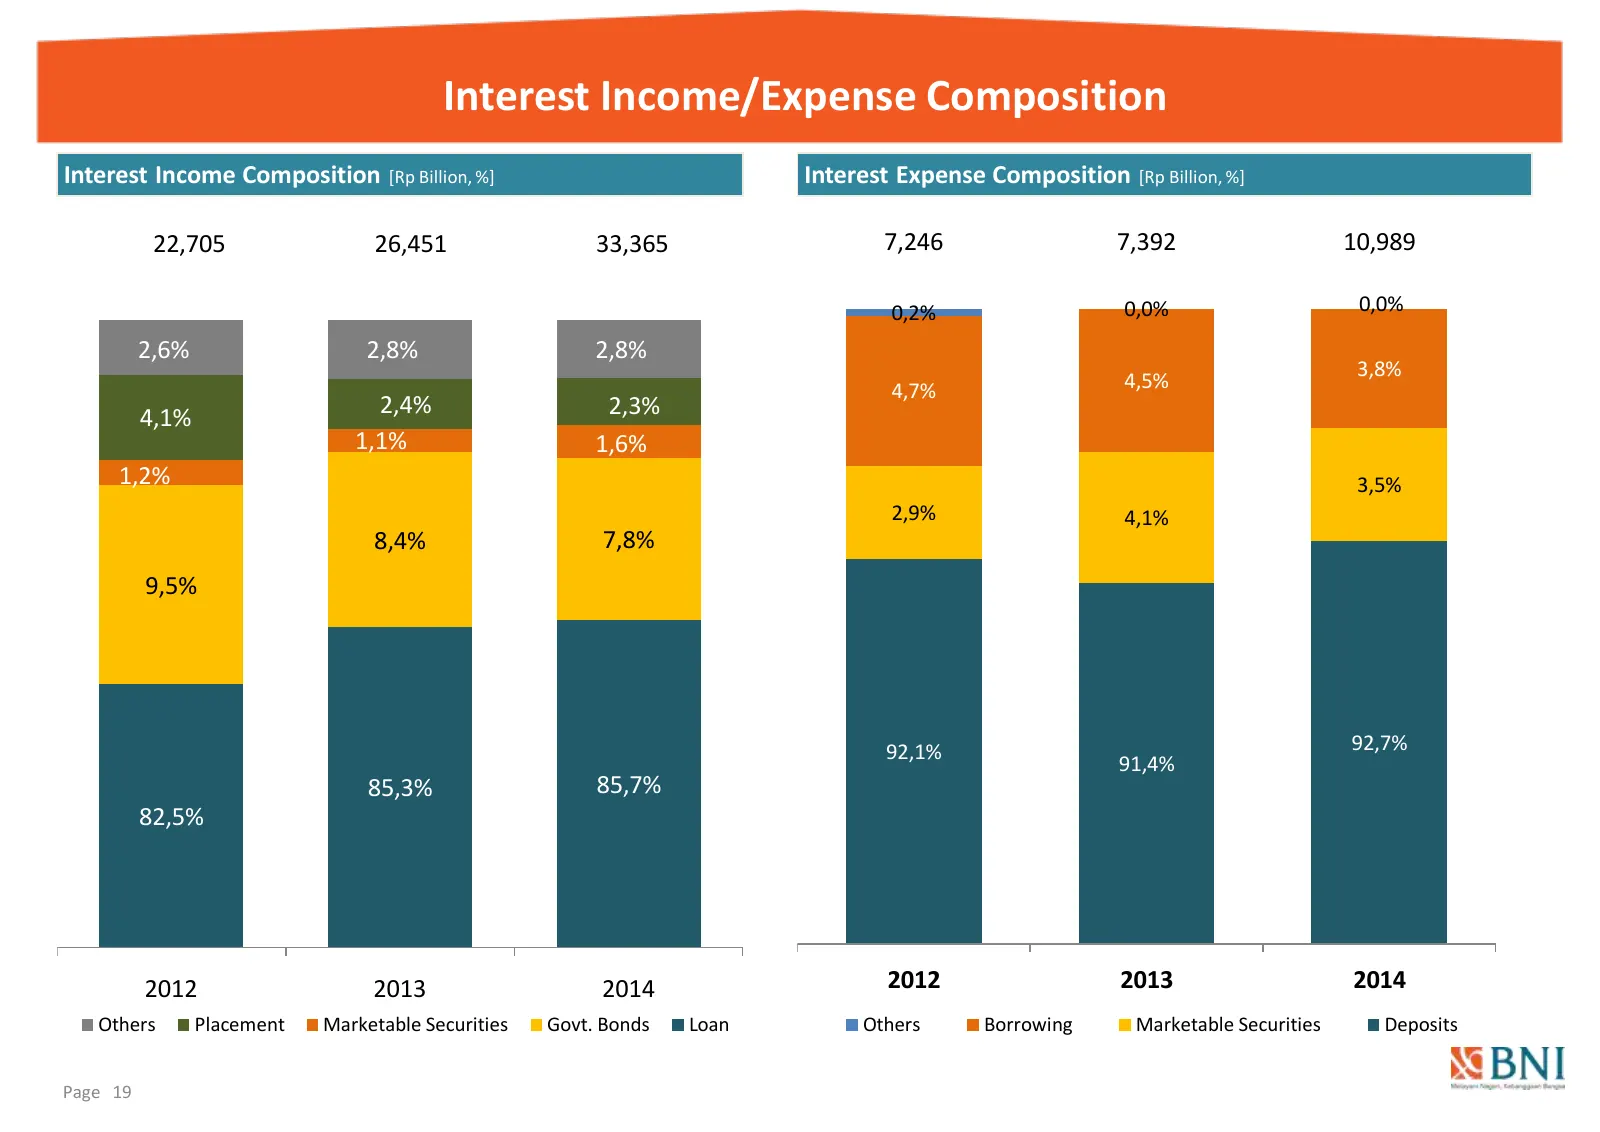
Slide 19: Interest Income/Expense Composition
Interest Income/Expense Composition Interest Income Composition [Rp Billion, %] Interest Expense Composition [Rp Billion, %] 22,705 26,451 33,365 7,246 7,392 10,989 0,2% 0,0% 0,0% 2,6% 2,8% 2,8% 3,8% 4,7% 4,5% 2,4% 2,3% 4,1% 1,1% 1,6% 1,2% 3,5% 2,9% 4,1% 8,4% 7,8% 9,5% 92,1% 92,7% 91,4% 85,3% 85,7%
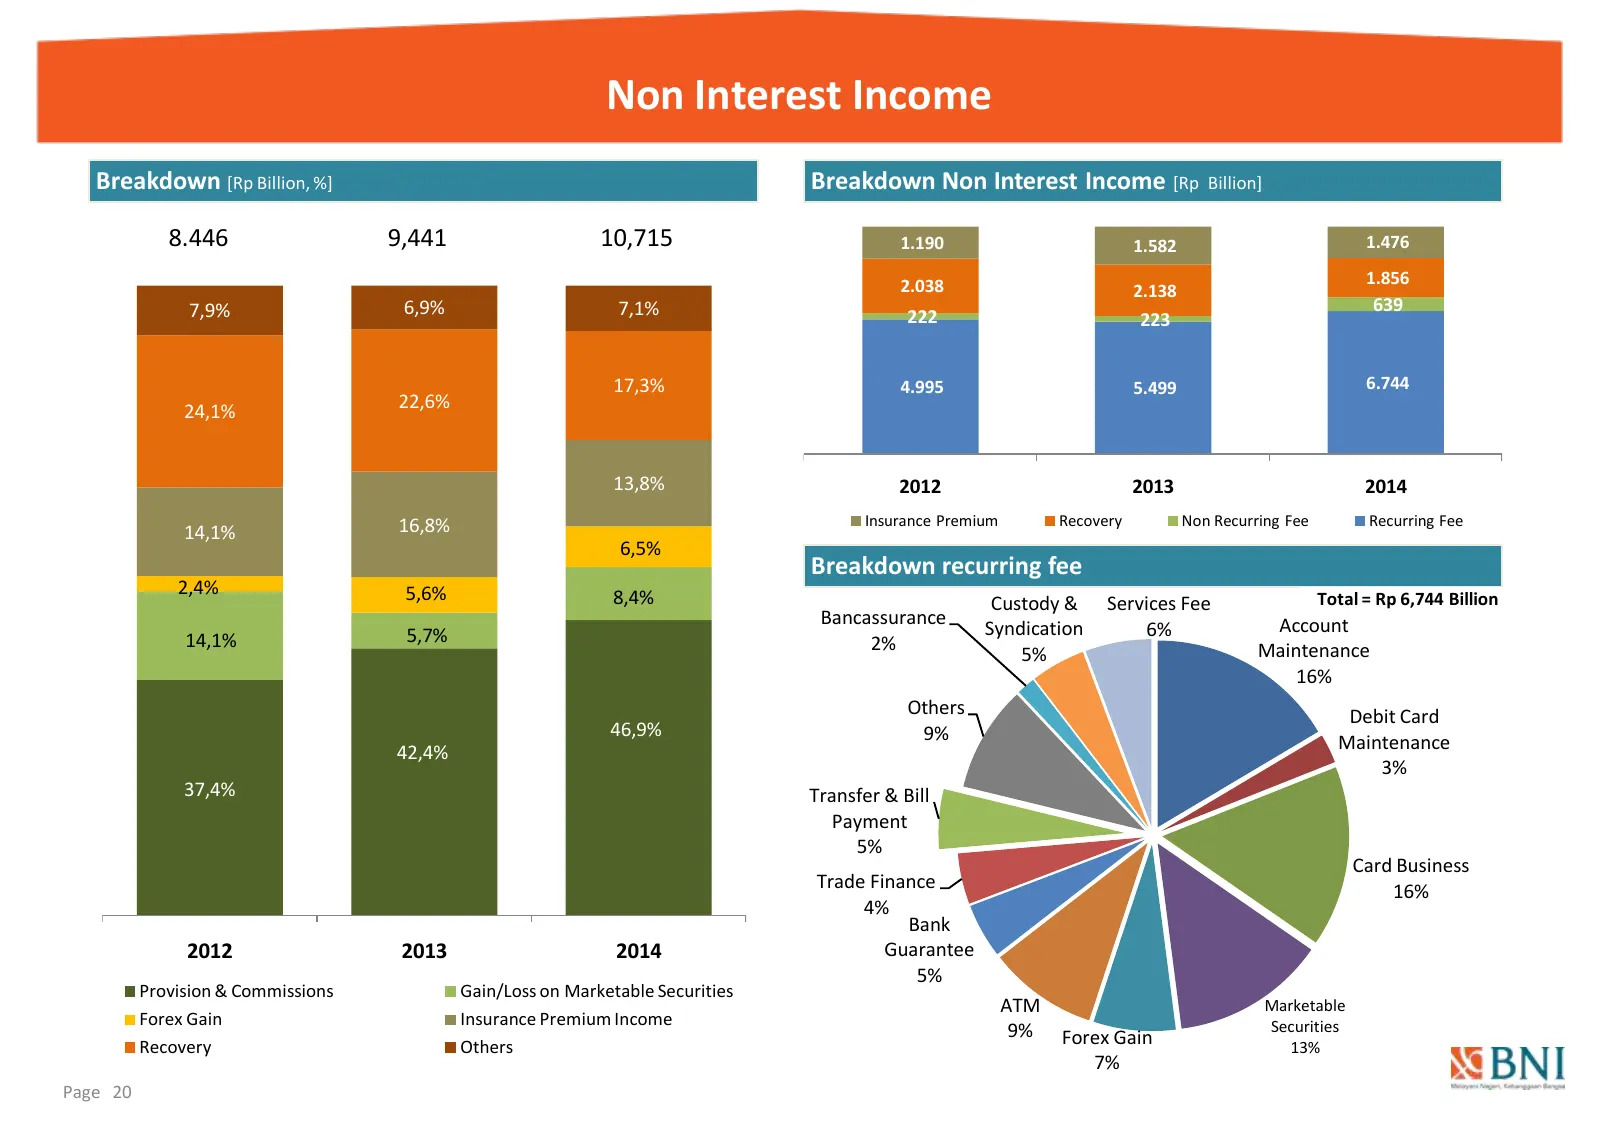
Slide 20: Non Interest Income
Non Interest Income Breakdown [Rp Billion, %] Breakdown Non Interest Income [Rp Billion] 8.446 9,441 10,715 1.190 1.582 1.476 2.038 1.856 2.138 7,9% 6,9% 7,1% 639 222 223 17,3% 4.995 5.499 6.744 22,6% 24,1% 13,8% 2012 2013 2014 16,8% Insurance Premium Recovery Non Recurring Fee Recurring Fee 14,1% 6
Slide 21: Operating Expense
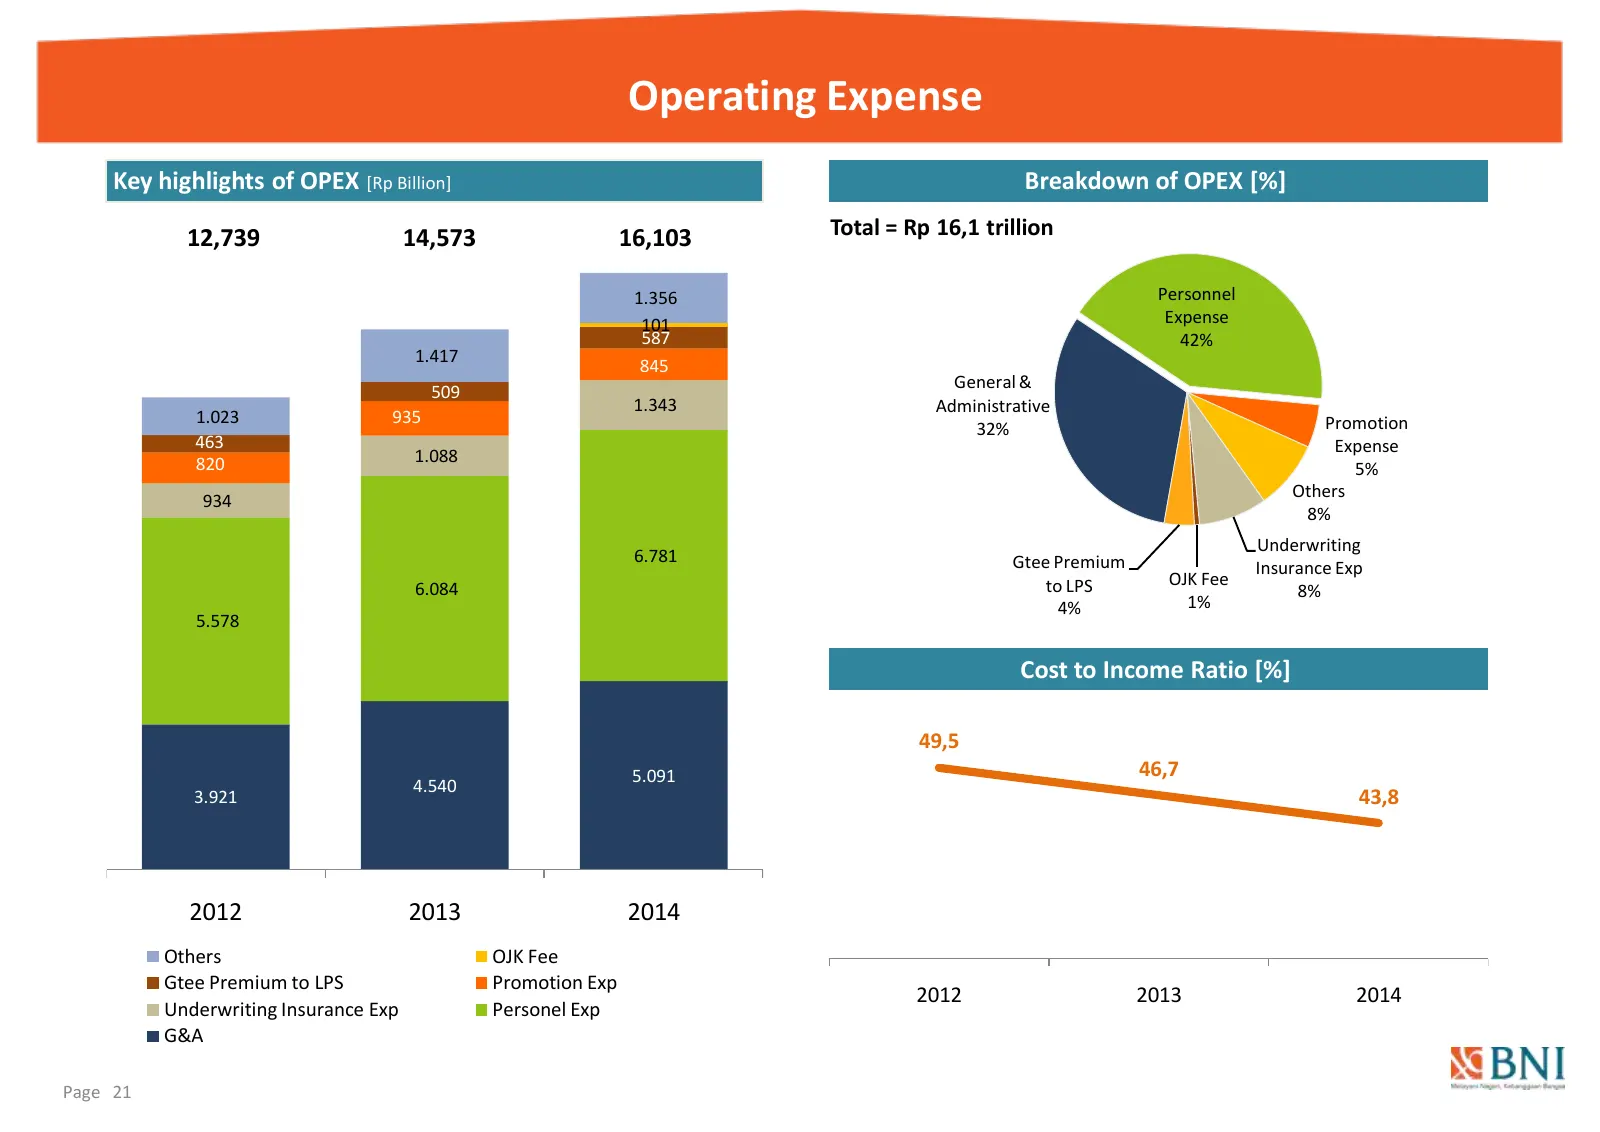
Operating Expense Key highlights of OPEX [Rp Billion] Breakdown of OPEX [%] 12,739 14,573 16,103 Total = Rp 16,1 trillion 1.356 Personnel 101 Expense 587 42% 1.417 845 General & 509 1.343 Administrative 1.023 935 Promotion 32% 463 Expense 820 1.088 5% Others 934 8% Underwriting 6.781 Gtee Premium In
Slide 22: Financial Ratios
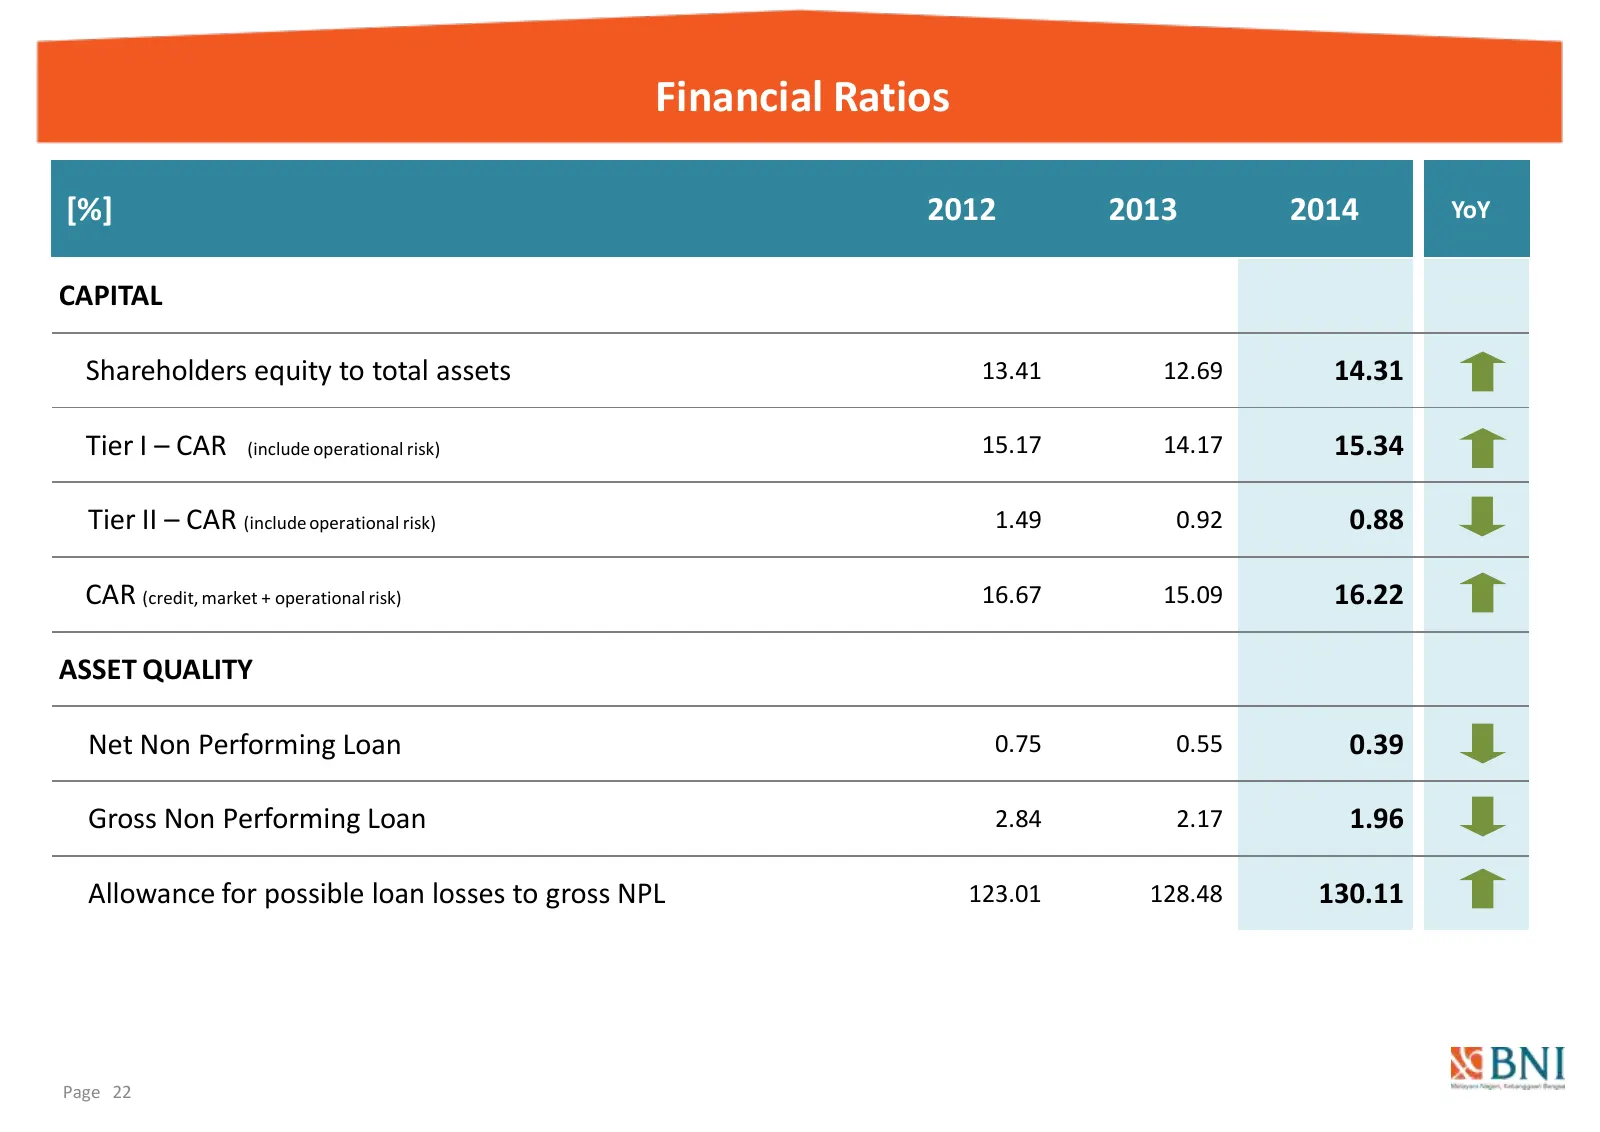
Financial Ratios [%] 2012 2013 2014 YoY CAPITAL Shareholders equity to total assets 13.41 12.69 14.31 Tier I – CAR (include operational risk) 15.17 14.17 15.34 Tier II – CAR (include operational risk) 1.49 0.92 0.88 CAR (credit, market + operational risk) 16.67 15.09 16.22 ASSET QUALITY Net Non Perf
Slide 23: Financial Ratios
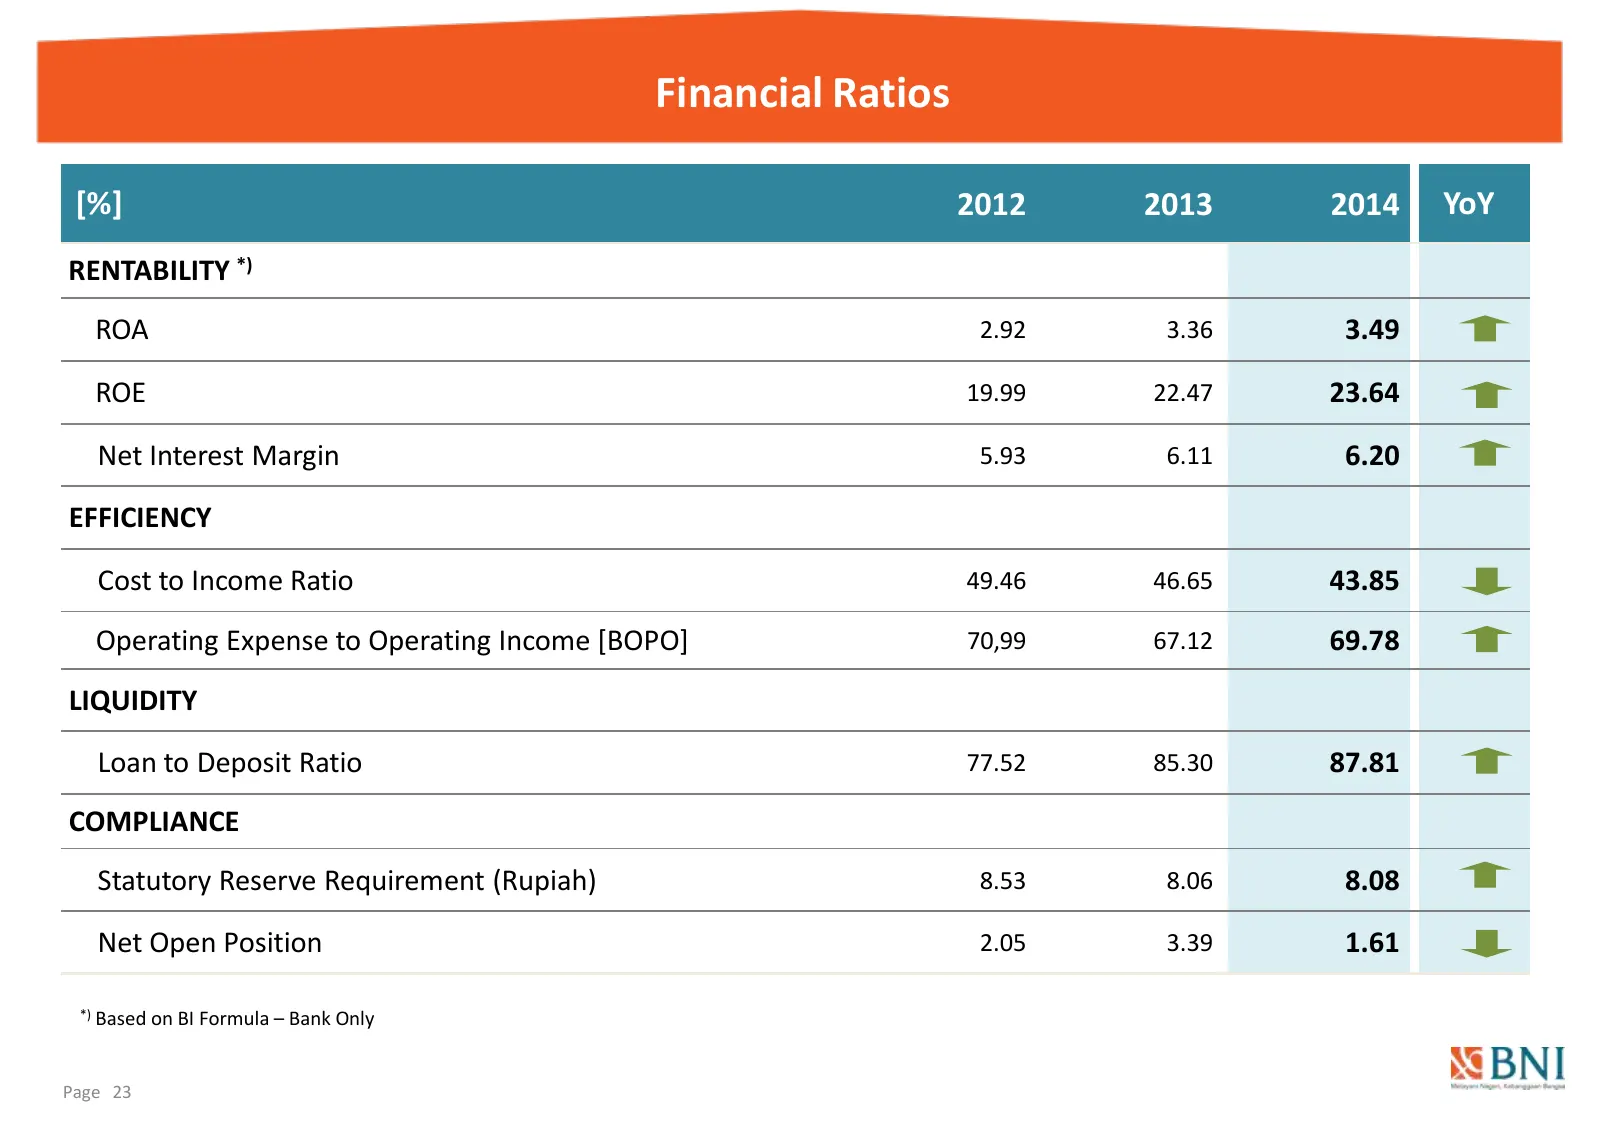
Financial Ratios [%] 2012 2013 2014 YoY RENTABILITY *) ROA 2.92 3.36 3.49 ROE 19.99 22.47 23.64 Net Interest Margin 5.93 6.11 6.20 EFFICIENCY Cost to Income Ratio 49.46 46.65 43.85 Operating Expense to Operating Income [BOPO] 70,99 67.12 69.78 LIQUIDITY Loan to Deposit Ratio 77.52 85.30 87.81 COMPLI
Slide 24: Asset Quality
Asset Quality
Slide 25: PRE NPL
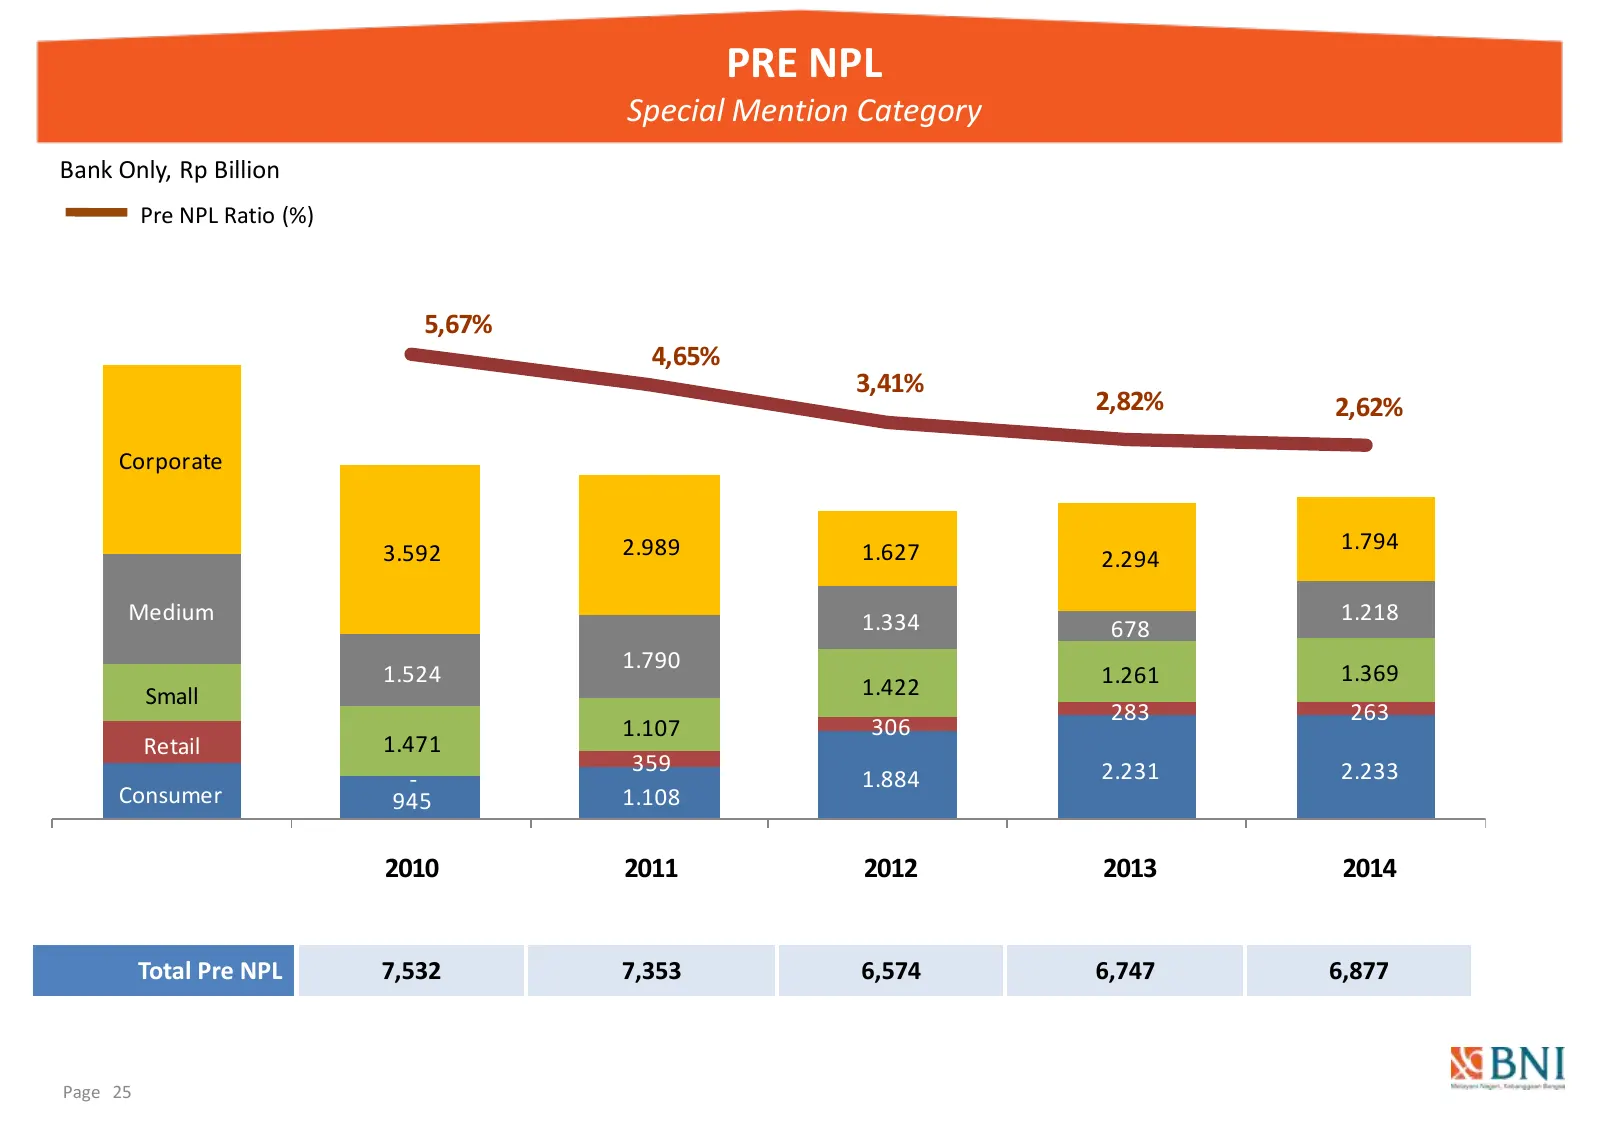
PRE NPL Special Mention Category Bank Only, Rp Billion Pre NPL Ratio (%) 5,67% 4,65% 3,41% 2,82% 2,62% Corporate 3.592 2.989 1.627 1.794 2.294 Medium 1.334 1.218 678 1.790 1.524 1.261 1.369 Small 1.422 283 263 1.107 306 Retail 1.471 359 2.231 2.233 - 1.884 Consumer 945 1.108 2010 2011 2012 2013 2014
Slide 26: NPL Trend
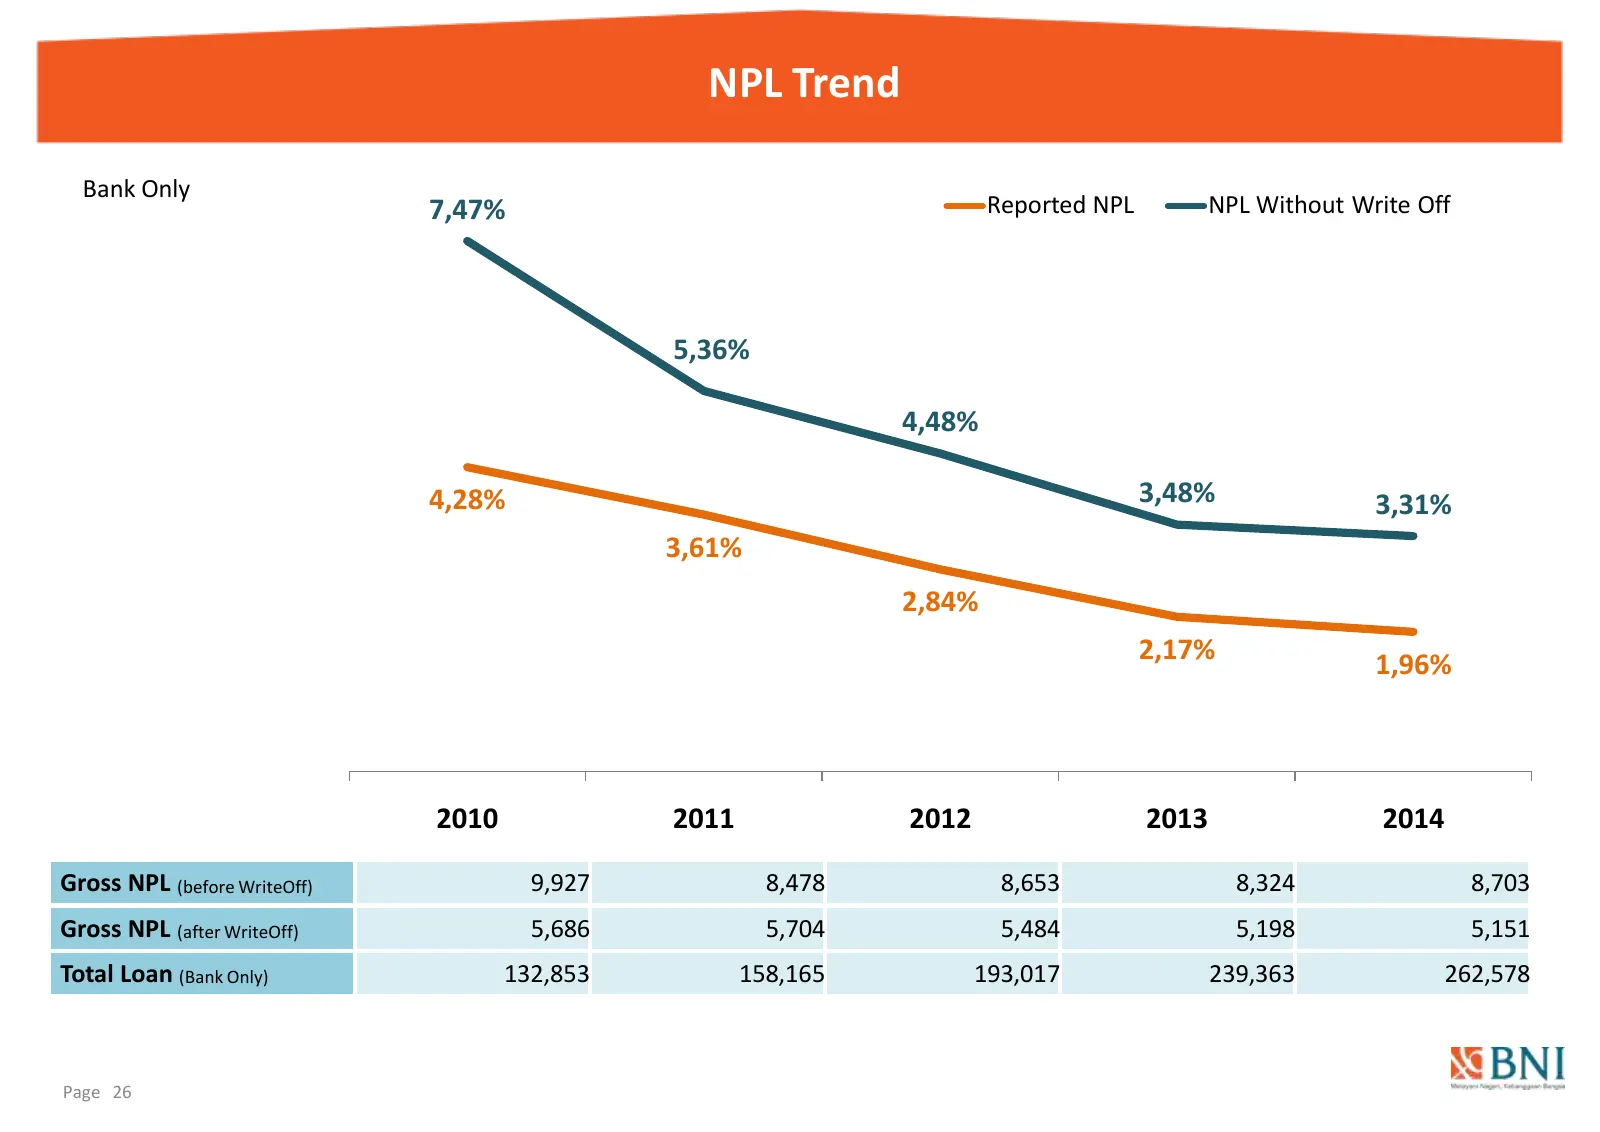
NPL Trend Bank Only 7,47% Reported NPL NPL Without Write Off 5,36% 4,48% 4,28% 3,48% 3,31% 3,61% 2,84% 2,17% 1,96% 2010 2011 2012 2013 2014 Gross NPL (before WriteOff) 9,927 8,478 8,653 8,324 8,703 Gross NPL (after WriteOff) 5,686 5,704 5,484 5,198 5,151 Total Loan (Bank Only) 132,853 158,165 193,01
Slide 27: NPL by Segment
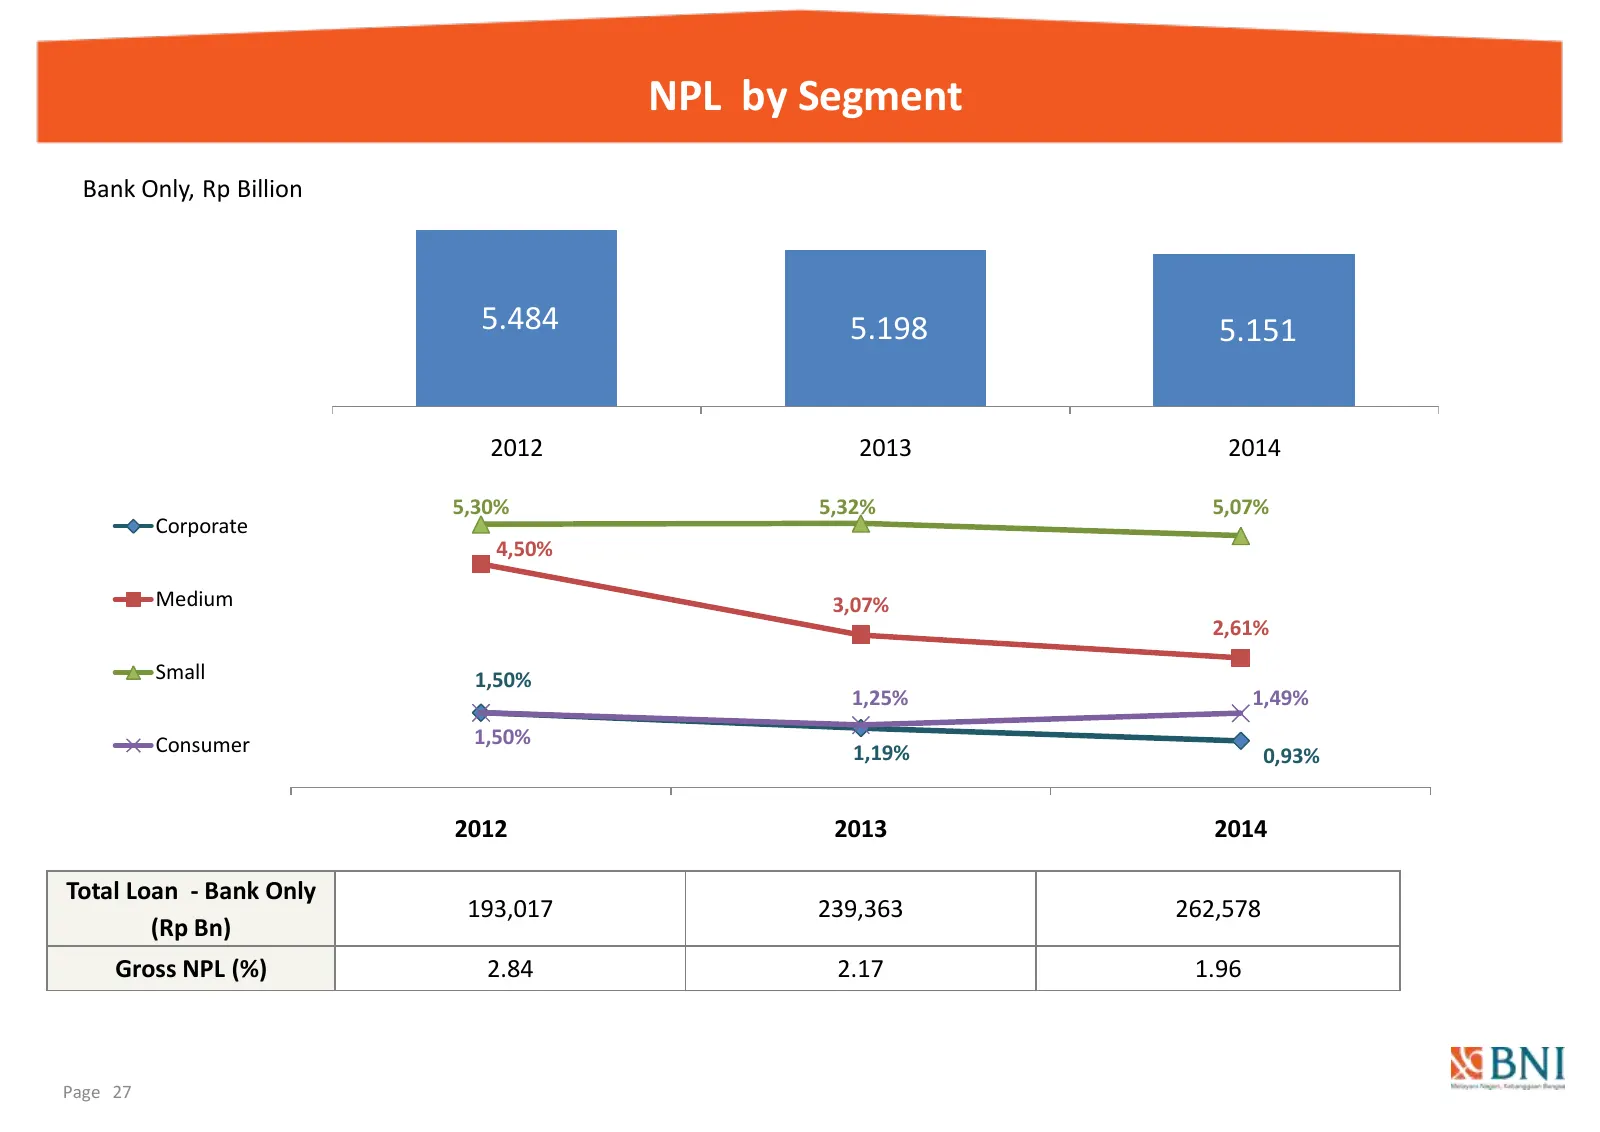
NPL by Segment Bank Only, Rp Billion 5.484 5.198 5.151 2012 2013 2014 5,30% 5,32% 5,07% Corporate 4,50% Medium 3,07% 2,61% Small 1,50% 1,25% 1,49% Consumer 1,50% 1,19% 0,93% 2012 2013 2014 Total Loan - Bank Only 193,017 239,363 262,578 (Rp Bn) Gross NPL (%) 2.84 2.17 1.96 Page 27
Slide 28: Movement NPL
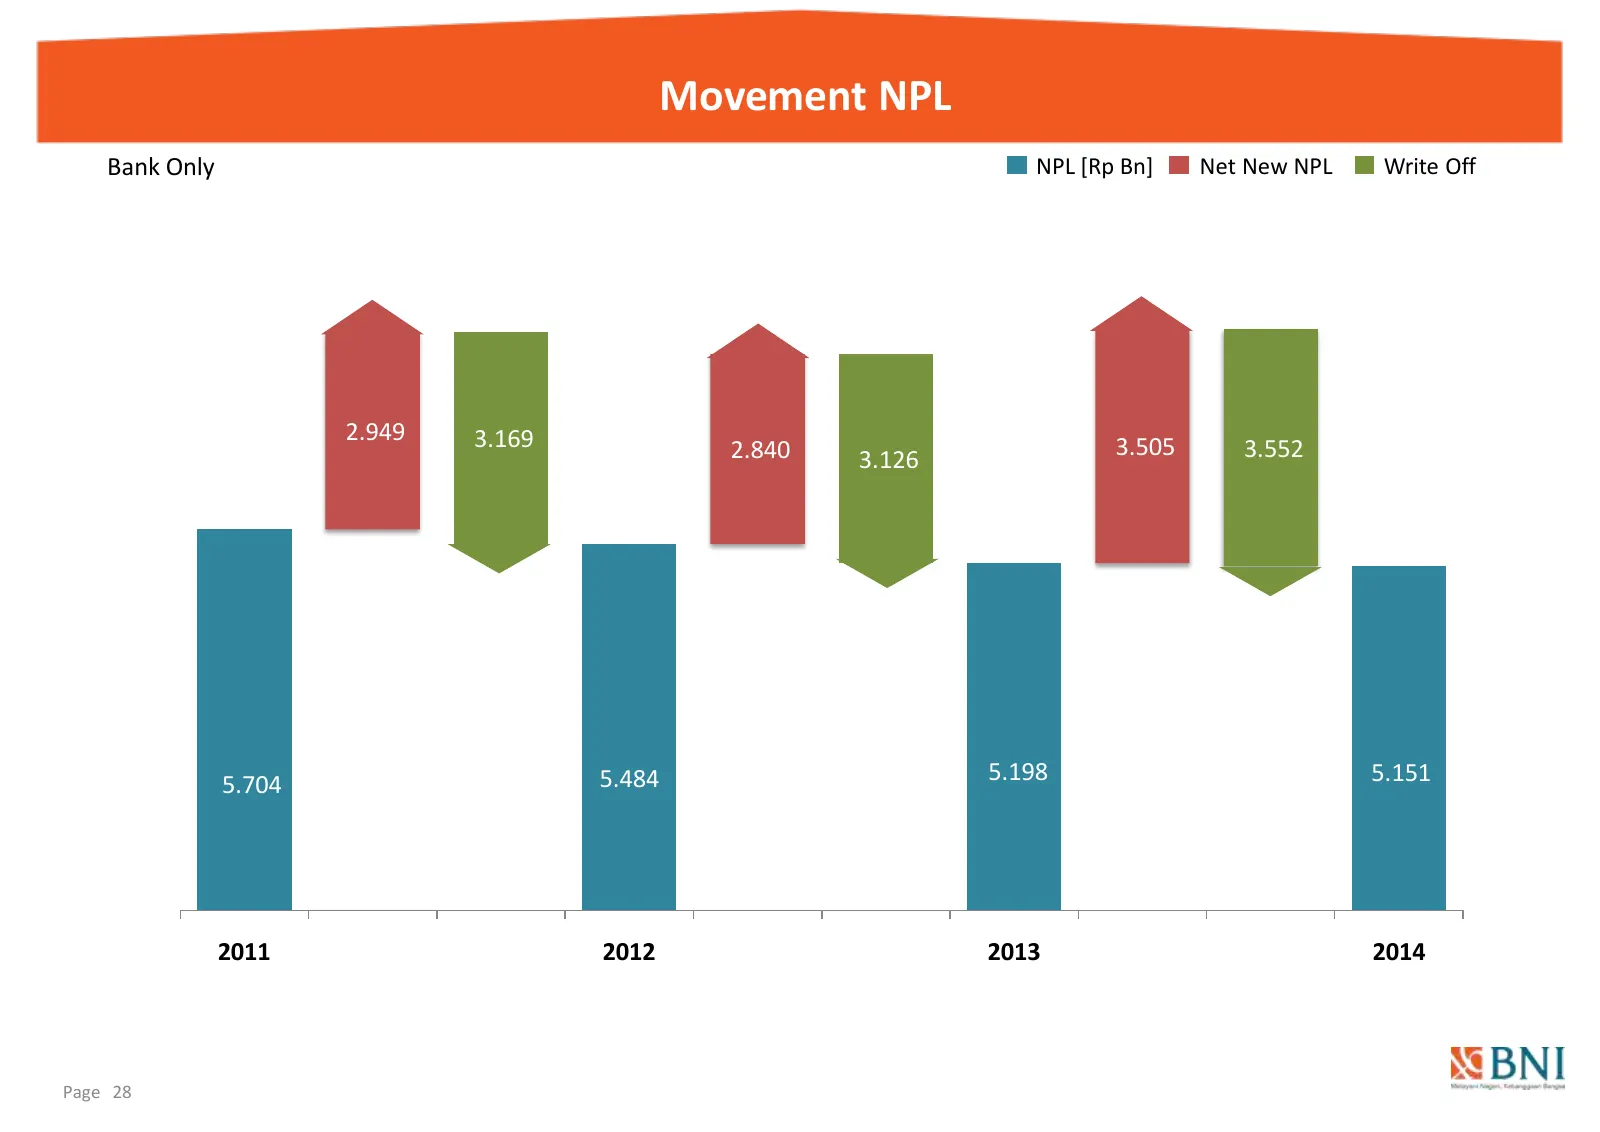
Movement NPL Bank Only NPL [Rp Bn] Net New NPL Write Off 2.949 3.169 2.840 3.126 3.505 3.552 5.198 5.704 5.484 5.198 5.151 5.151 2011 2012 2013 2014 Page 28
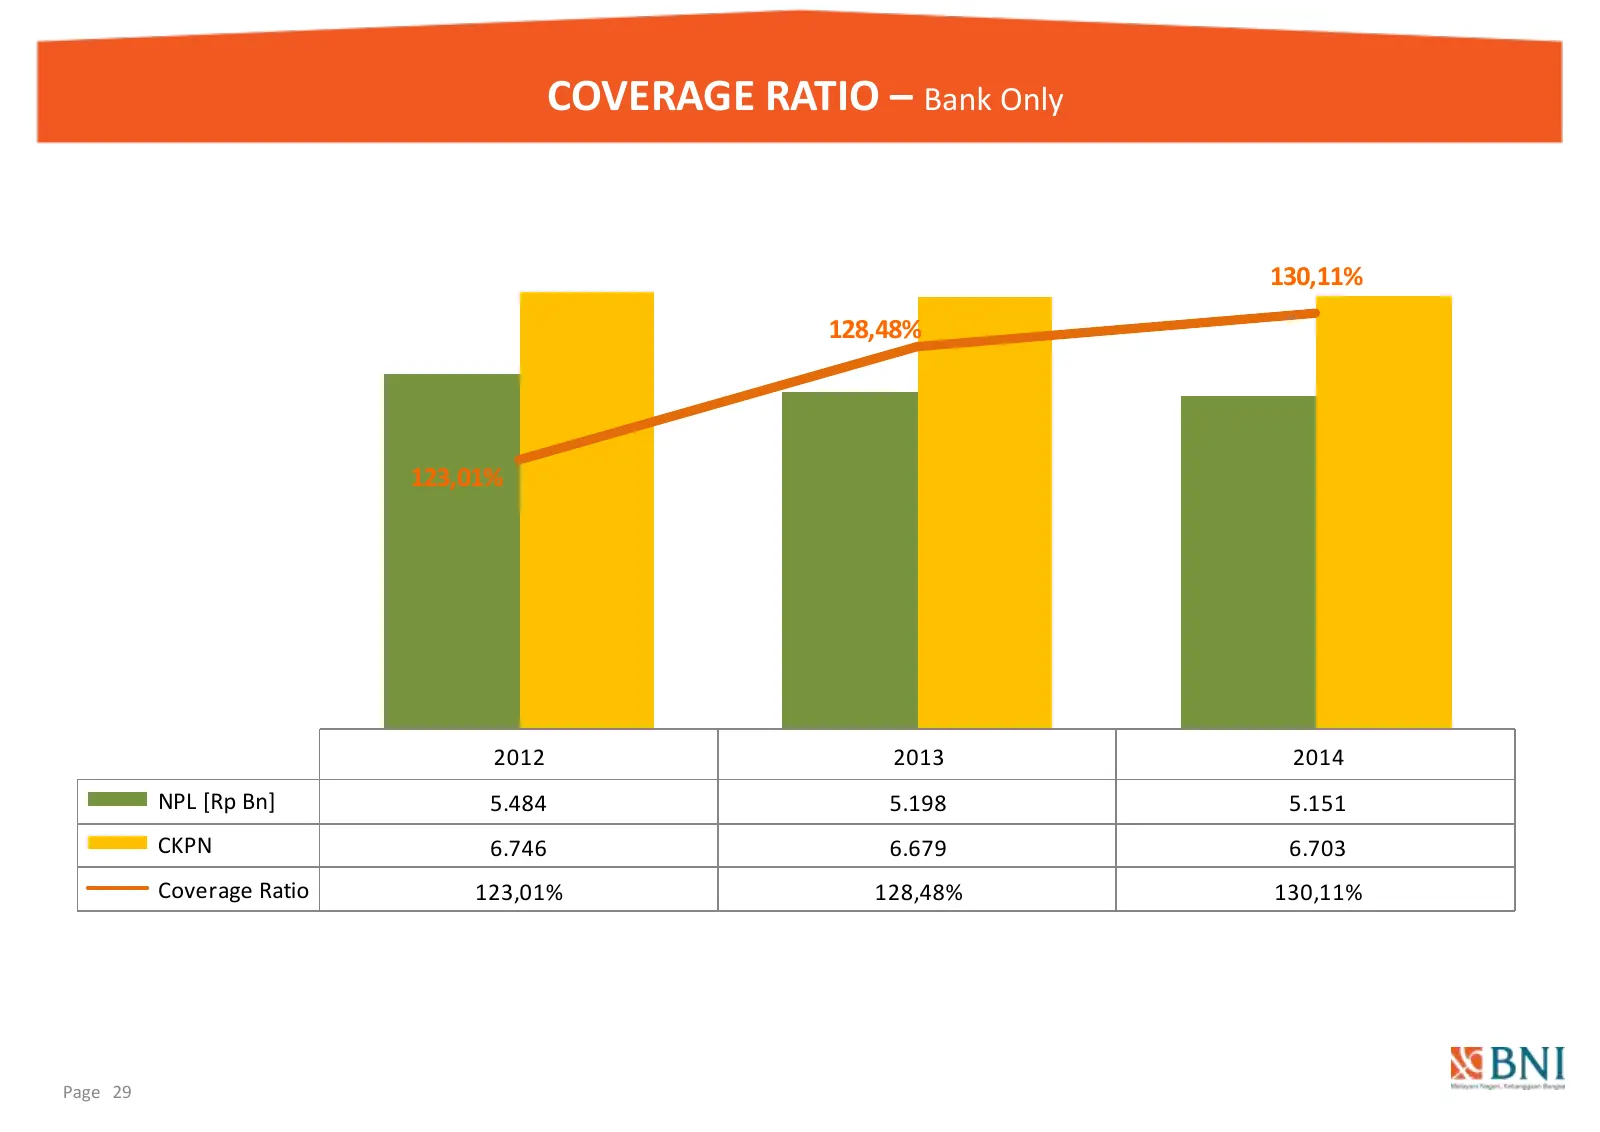
Slide 29: Coverage Ratio – Bank Only
COVERAGE RATIO – Bank Only 130,11% 128,48% 123,01% 2012 2013 2014 NPL [Rp Bn] 5.484 5.198 5.151 CKPN 6.746 6.679 6.703 Coverage Ratio 123,01% 128,48% 130,11% Page 29
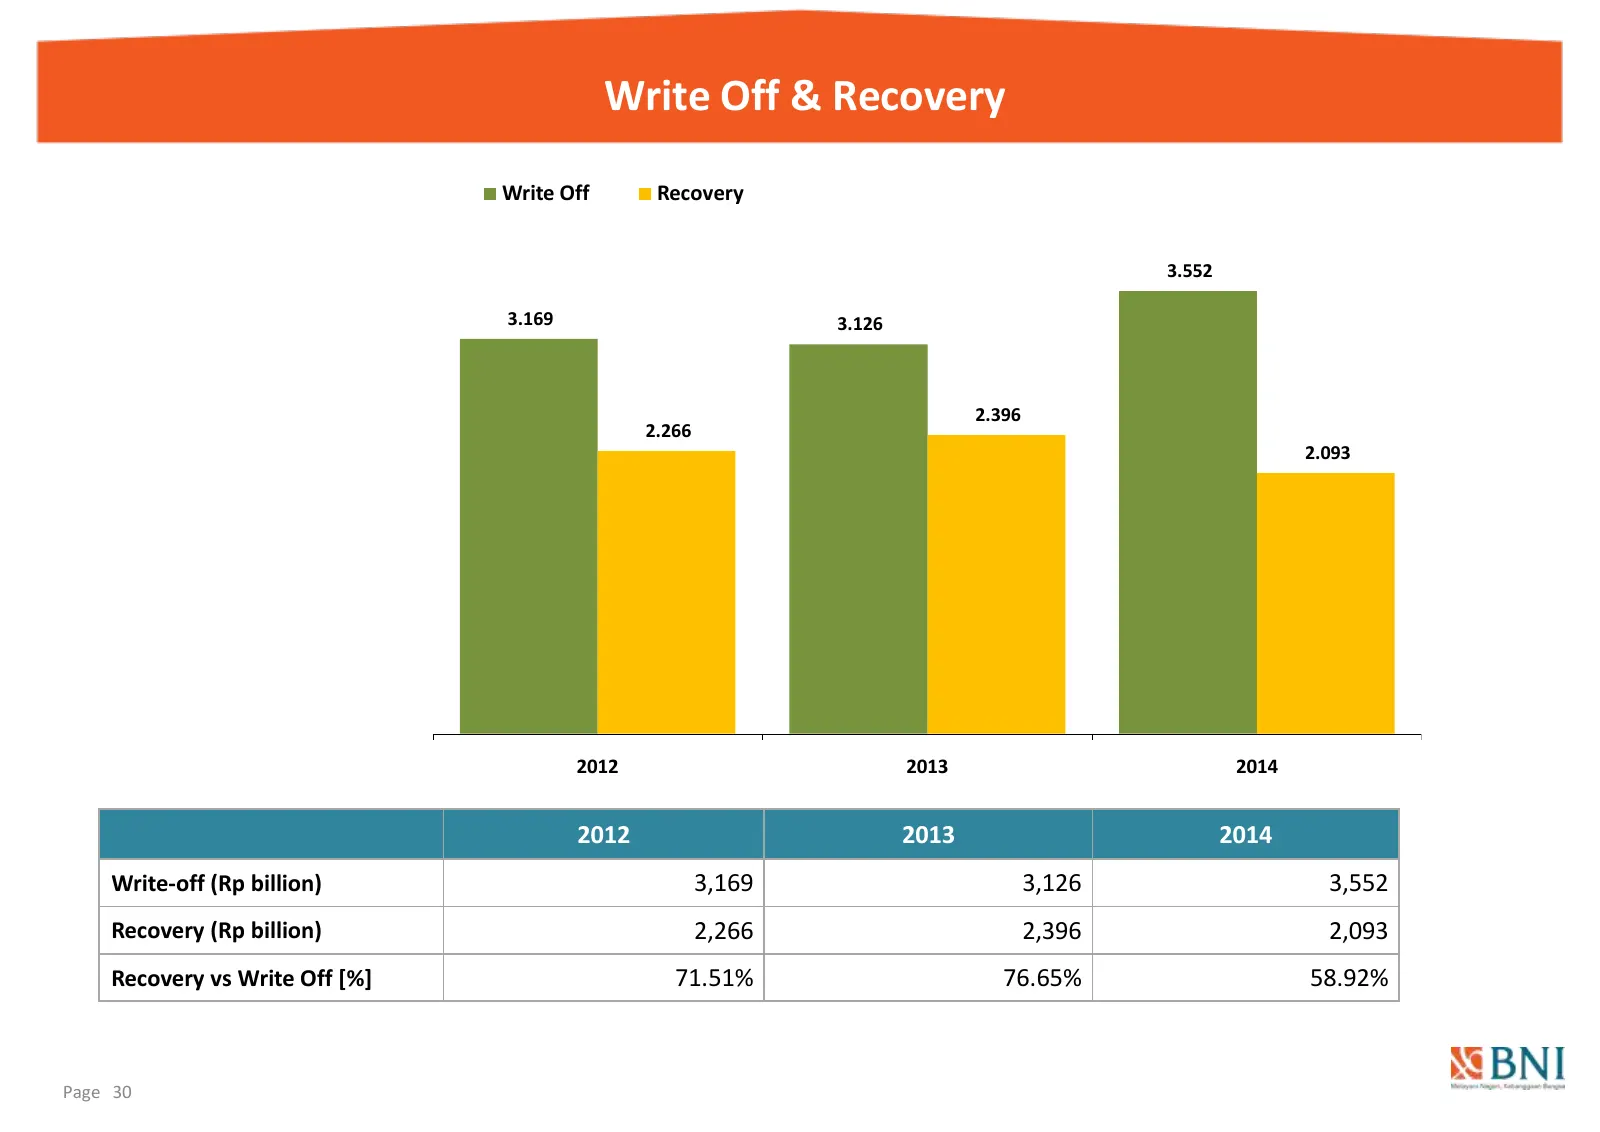
Slide 30: Write Off & Recovery
Write Off & Recovery Write Off Recovery 3.552 3.169 3.126 2.396 2.266 2.093 2012 2013 2014 2012 2013 2014 Write-off (Rp billion) 3,169 3,126 3,552 Recovery (Rp billion) 2,266 2,396 2,093 Recovery vs Write Off [%] 71.51% 76.65% 58.92% Page 30
Slide 31: Management Focus 2015
Management Focus 2015
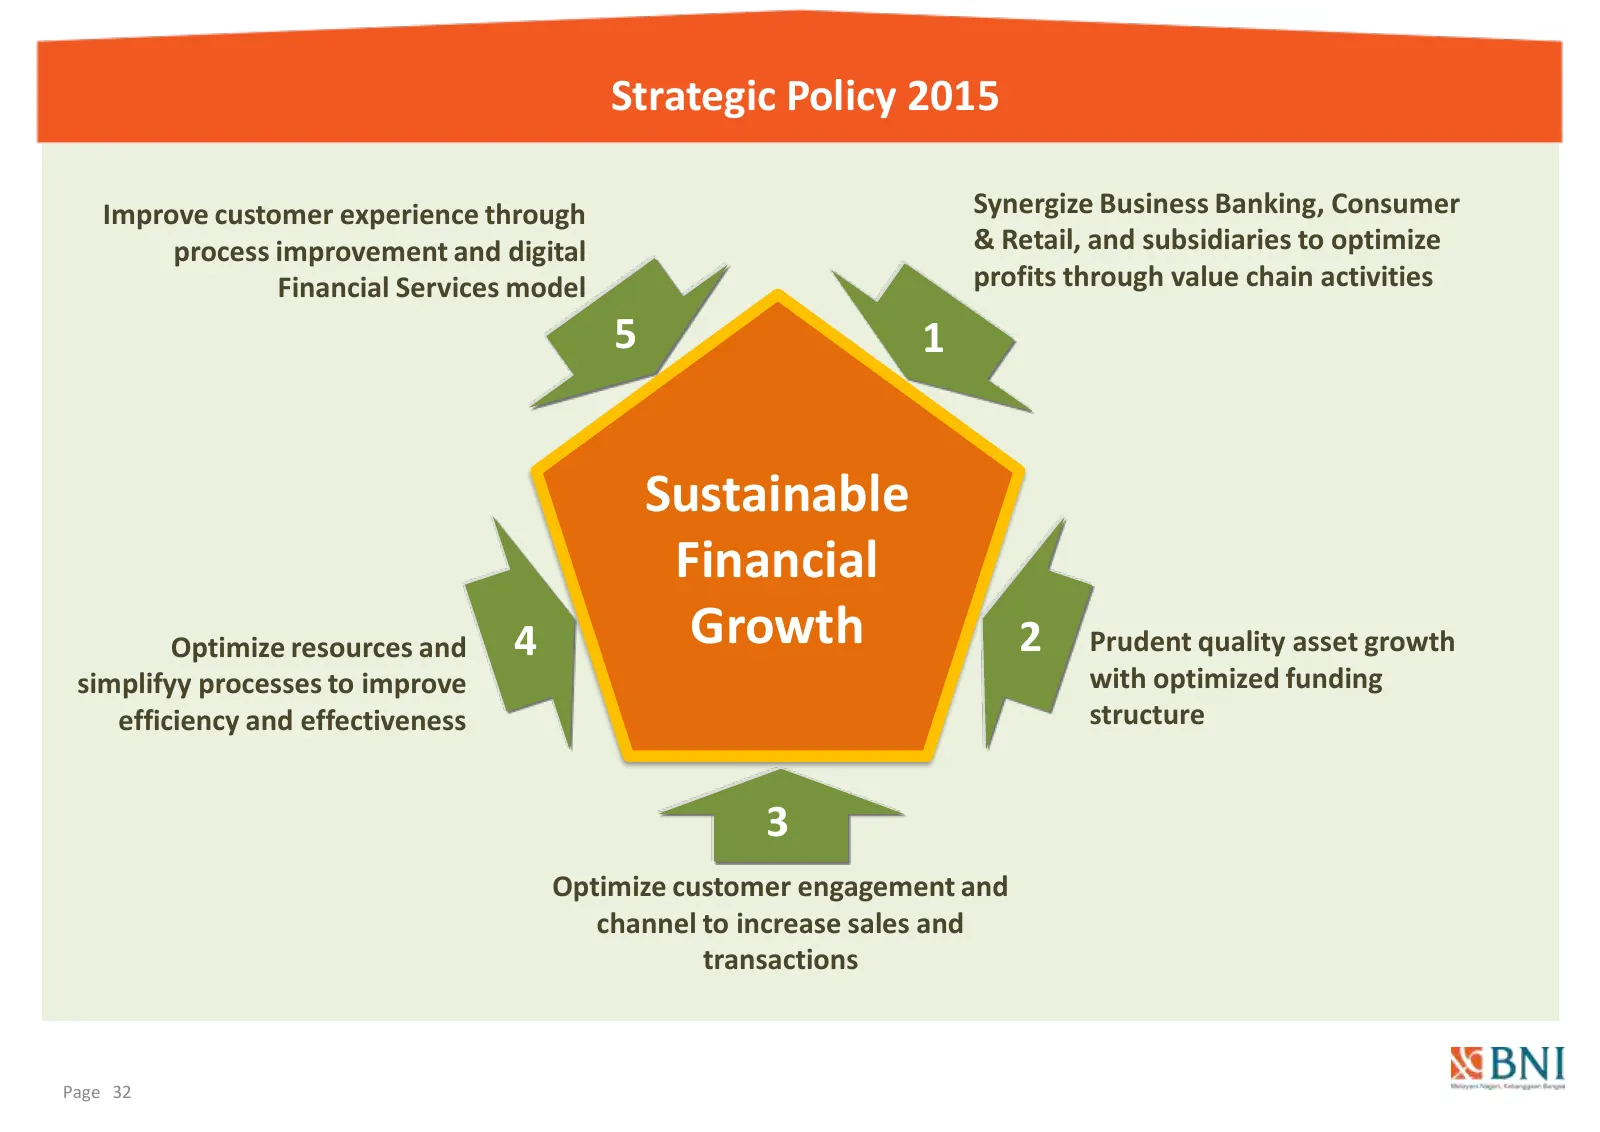
Slide 32: Sustainable Financial Growth
Strategic Policy 2015 Improve customer experience through Synergize Business Banking, Consumer process improvement and digital & Retail, and subsidiaries to optimize Financial Services model profits through value chain activities 5 1 Sustainable Financial Optimize resources and 4 Growth 2 Prudent qu
Slide 33: Initiatives & Target 2015
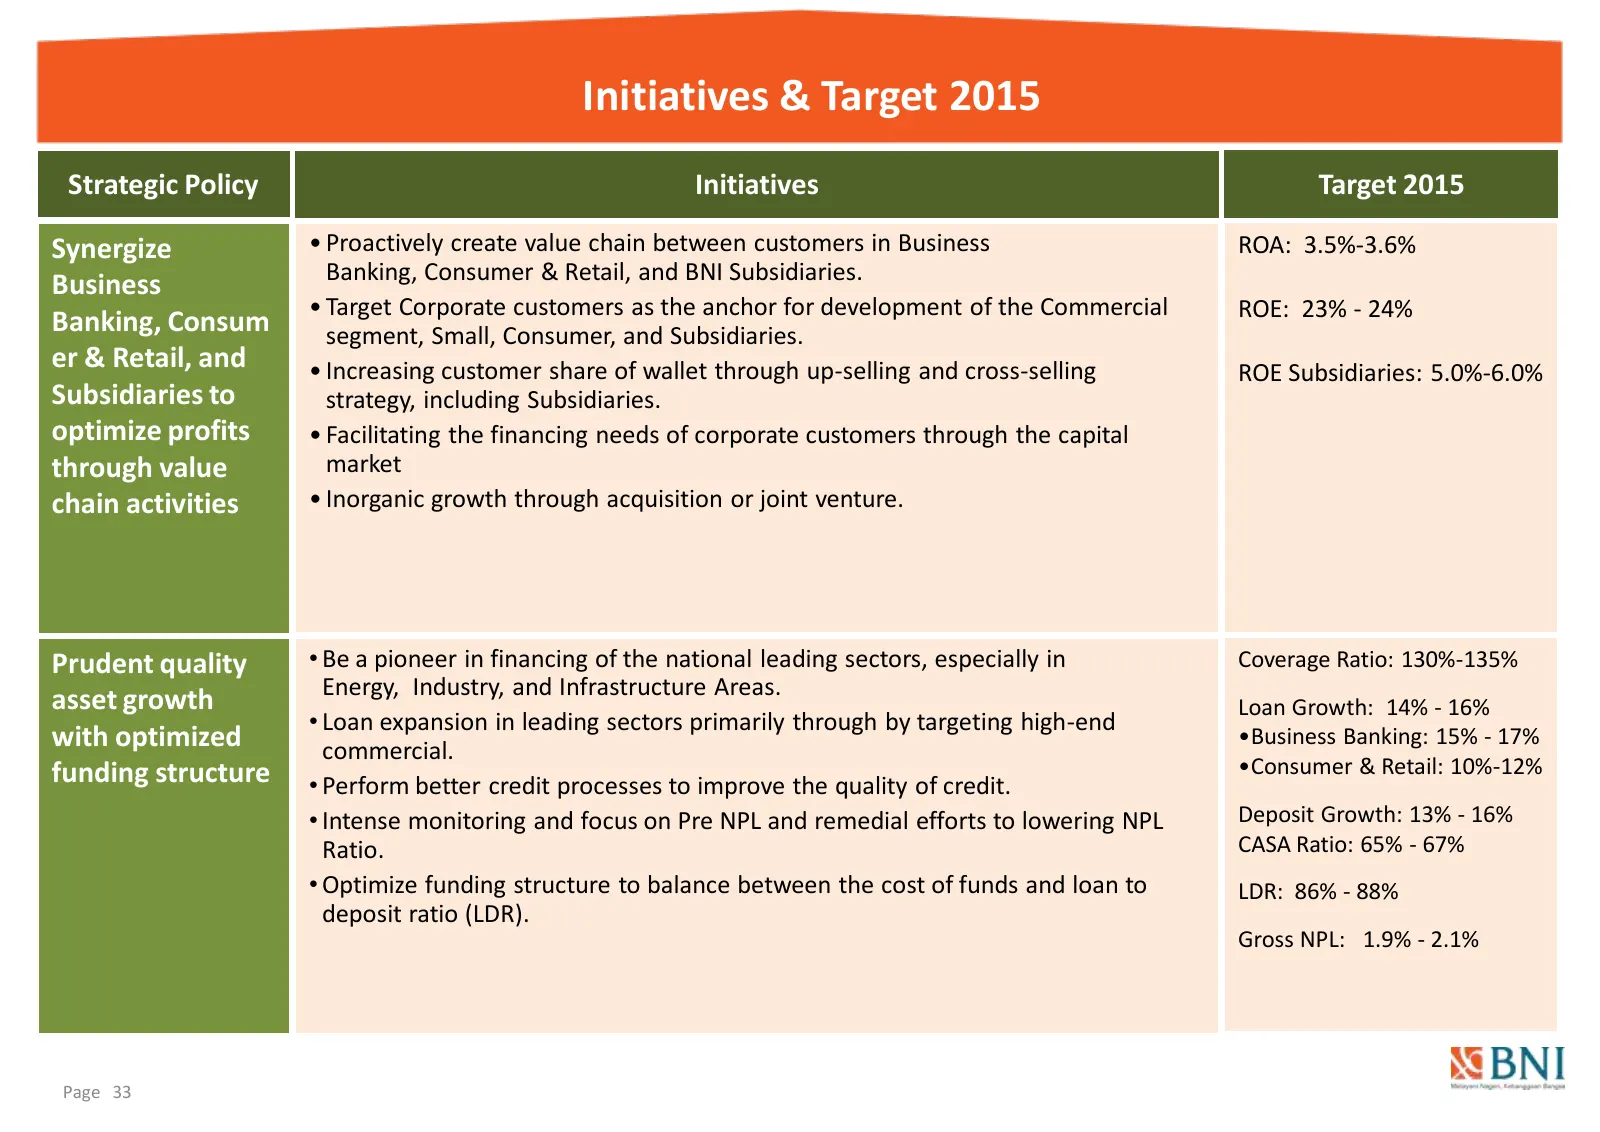
Initiatives & Target 2015 Strategic Policy Initiatives Target 2015 Synergize • Proactively create value chain between customers in Business ROA: 3.5%-3.6% Banking, Consumer & Retail, and BNI Subsidiaries. Business • Target Corporate customers as the anchor for development of the Commercial ROE: 23%
Slide 34: Initiatives & Target 2015
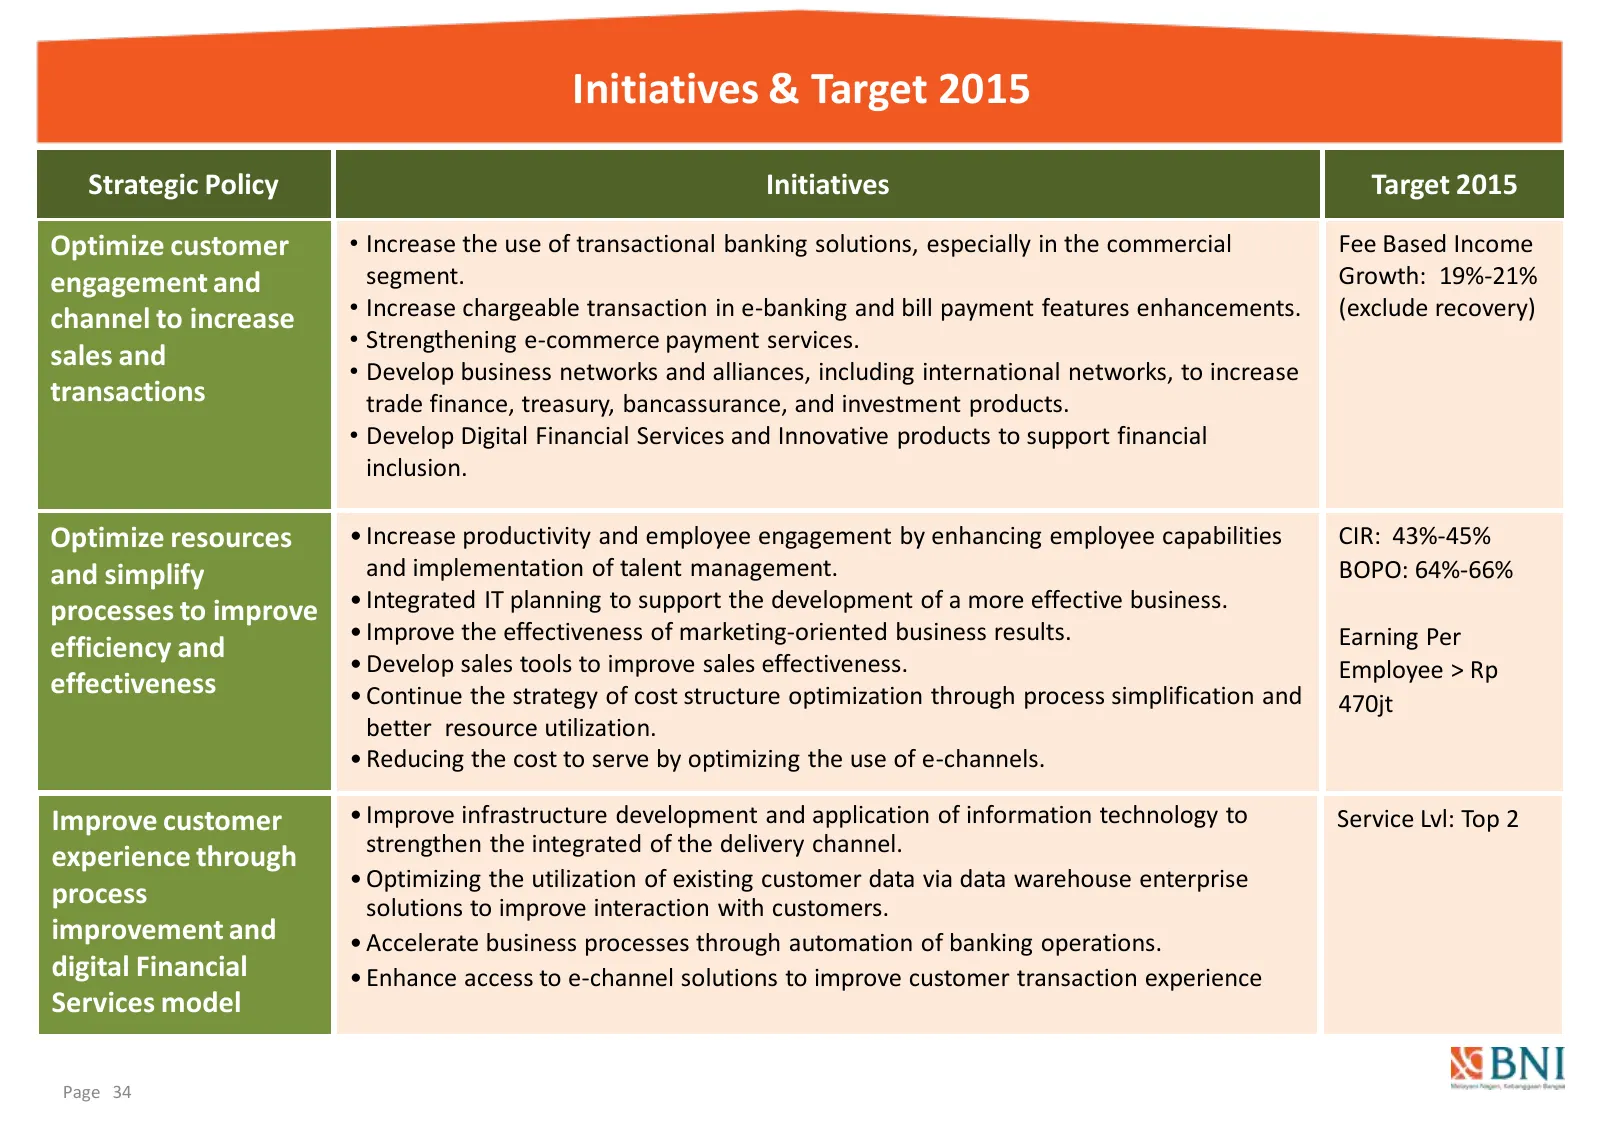
Initiatives & Target 2015 Strategic Policy Initiatives Target 2015 Optimize customer • Increase the use of transactional banking solutions, especially in the commercial Fee Based Income engagement and segment. Growth: 19%-21% channel to increase • Increase chargeable transaction in e-banking and bil
Slide 35: BNI position in Industry for the last 7 years
BNI position in Industry for the last 7 years...
Slide 36: Industry Position
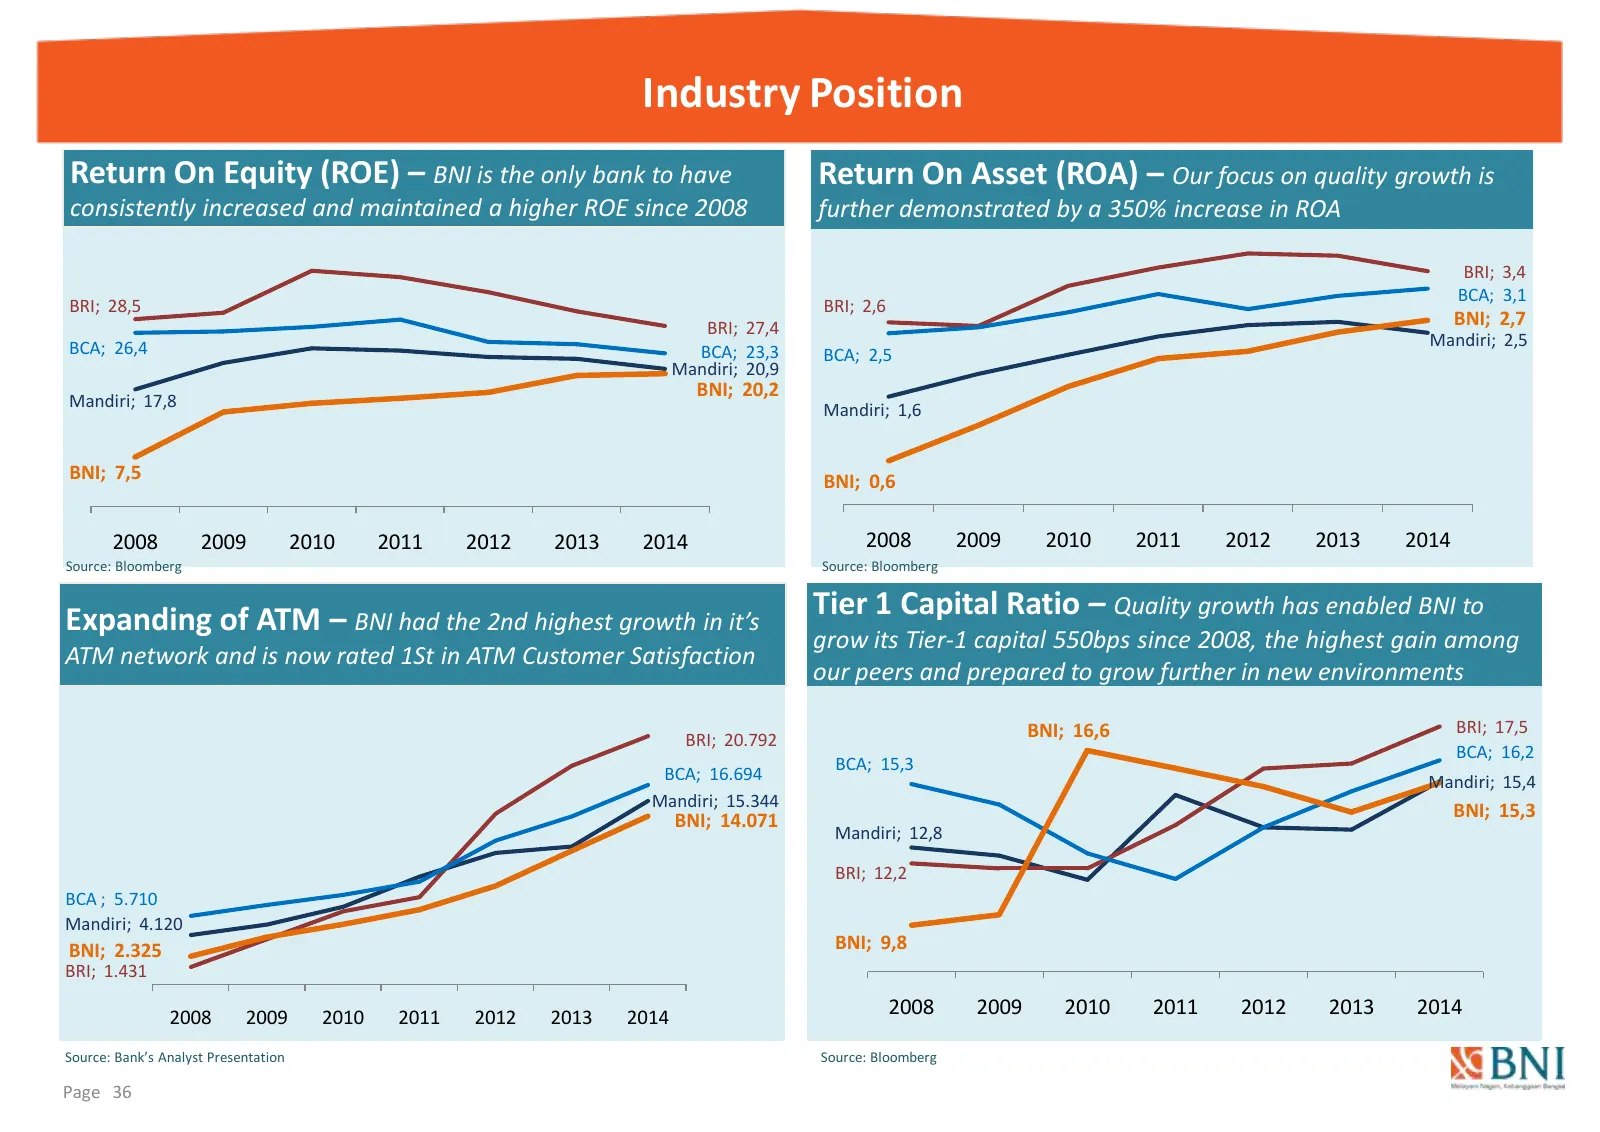
Industry Position Return On Equity (ROE) – BNI is the only bank to have Return On Asset (ROA) – Our focus on quality growth is consistently increased and maintained a higher ROE since 2008 further demonstrated by a 350% increase in ROA BRI; 3,4 BCA; 3,1 BRI; 28,5 BRI; 2,6 BRI; 27,4 BNI; 2,7 BCA; 26,
Slide 37: Industry Position
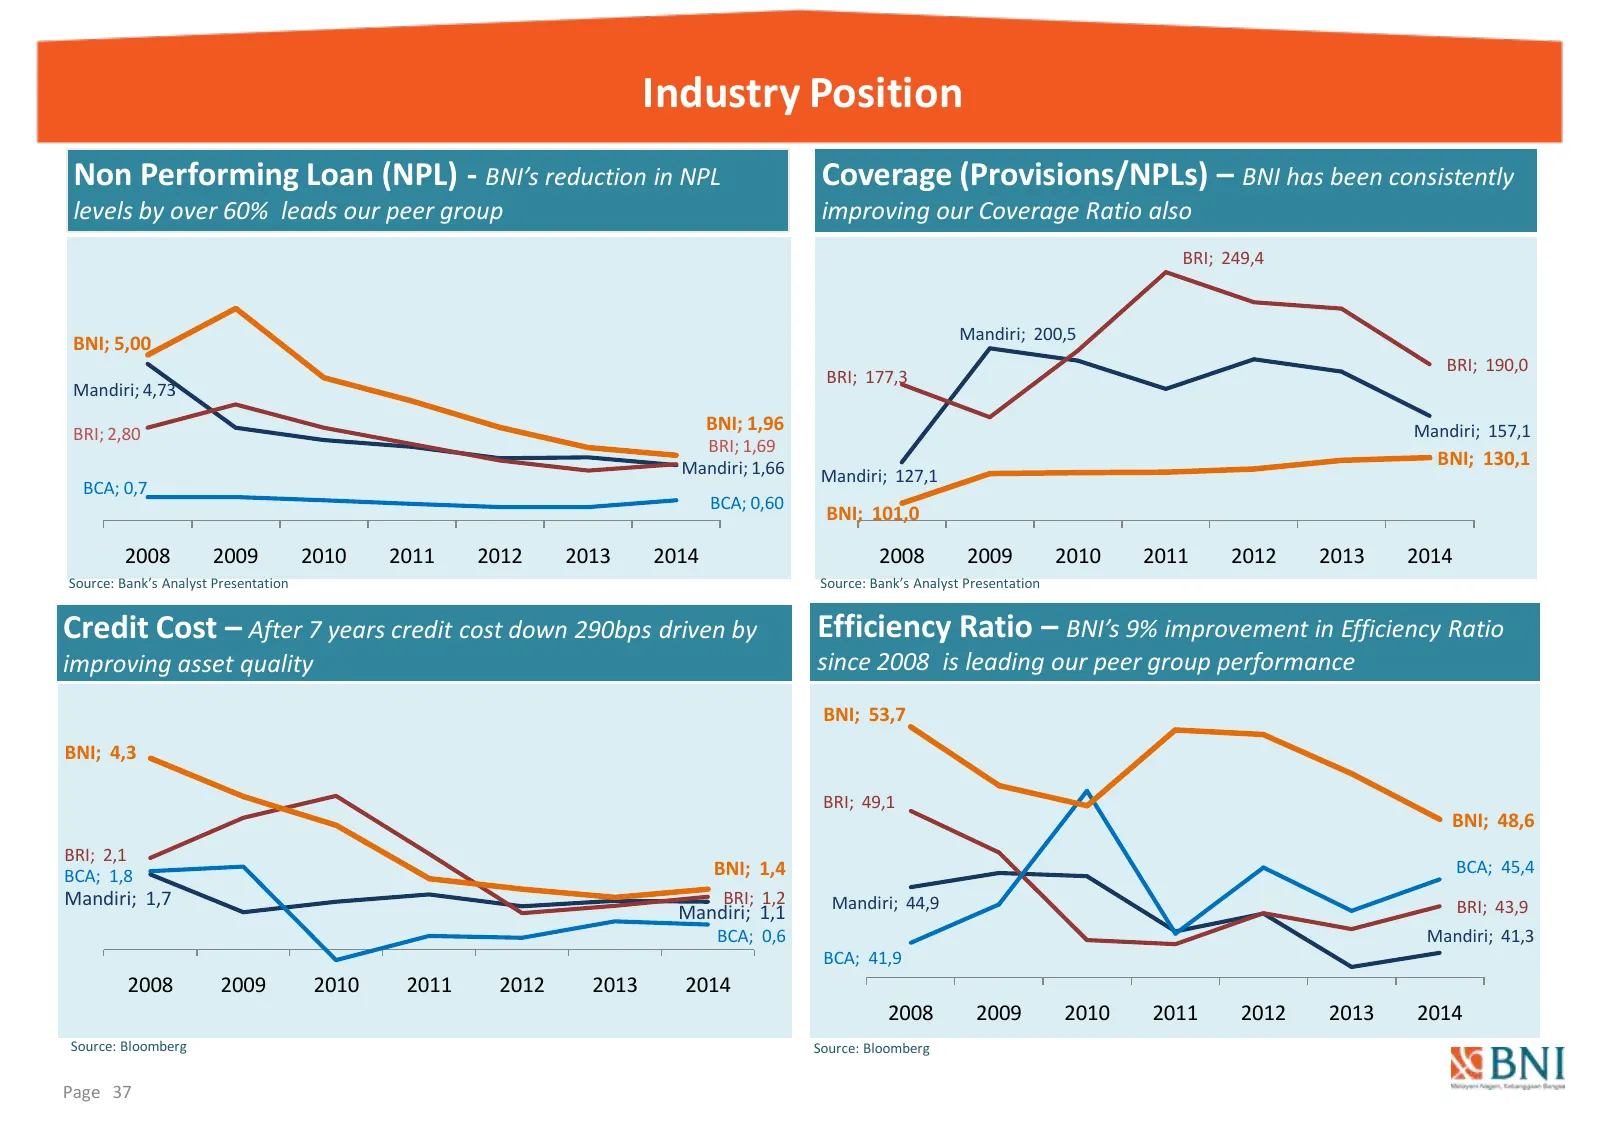
Industry Position Non Performing Loan (NPL) - BNI’s reduction in NPL Coverage (Provisions/NPLs) – BNI has been consistently levels by over 60% leads our peer group improving our Coverage Ratio also BRI; 249,4 Mandiri; 200,5 BNI; 5,00 BRI; 190,0 BRI; 177,3 Mandiri; 4,73 BRI; 2,80 BNI; 1,96 Mandiri; 1
Slide 38: Growth Market Capitalization
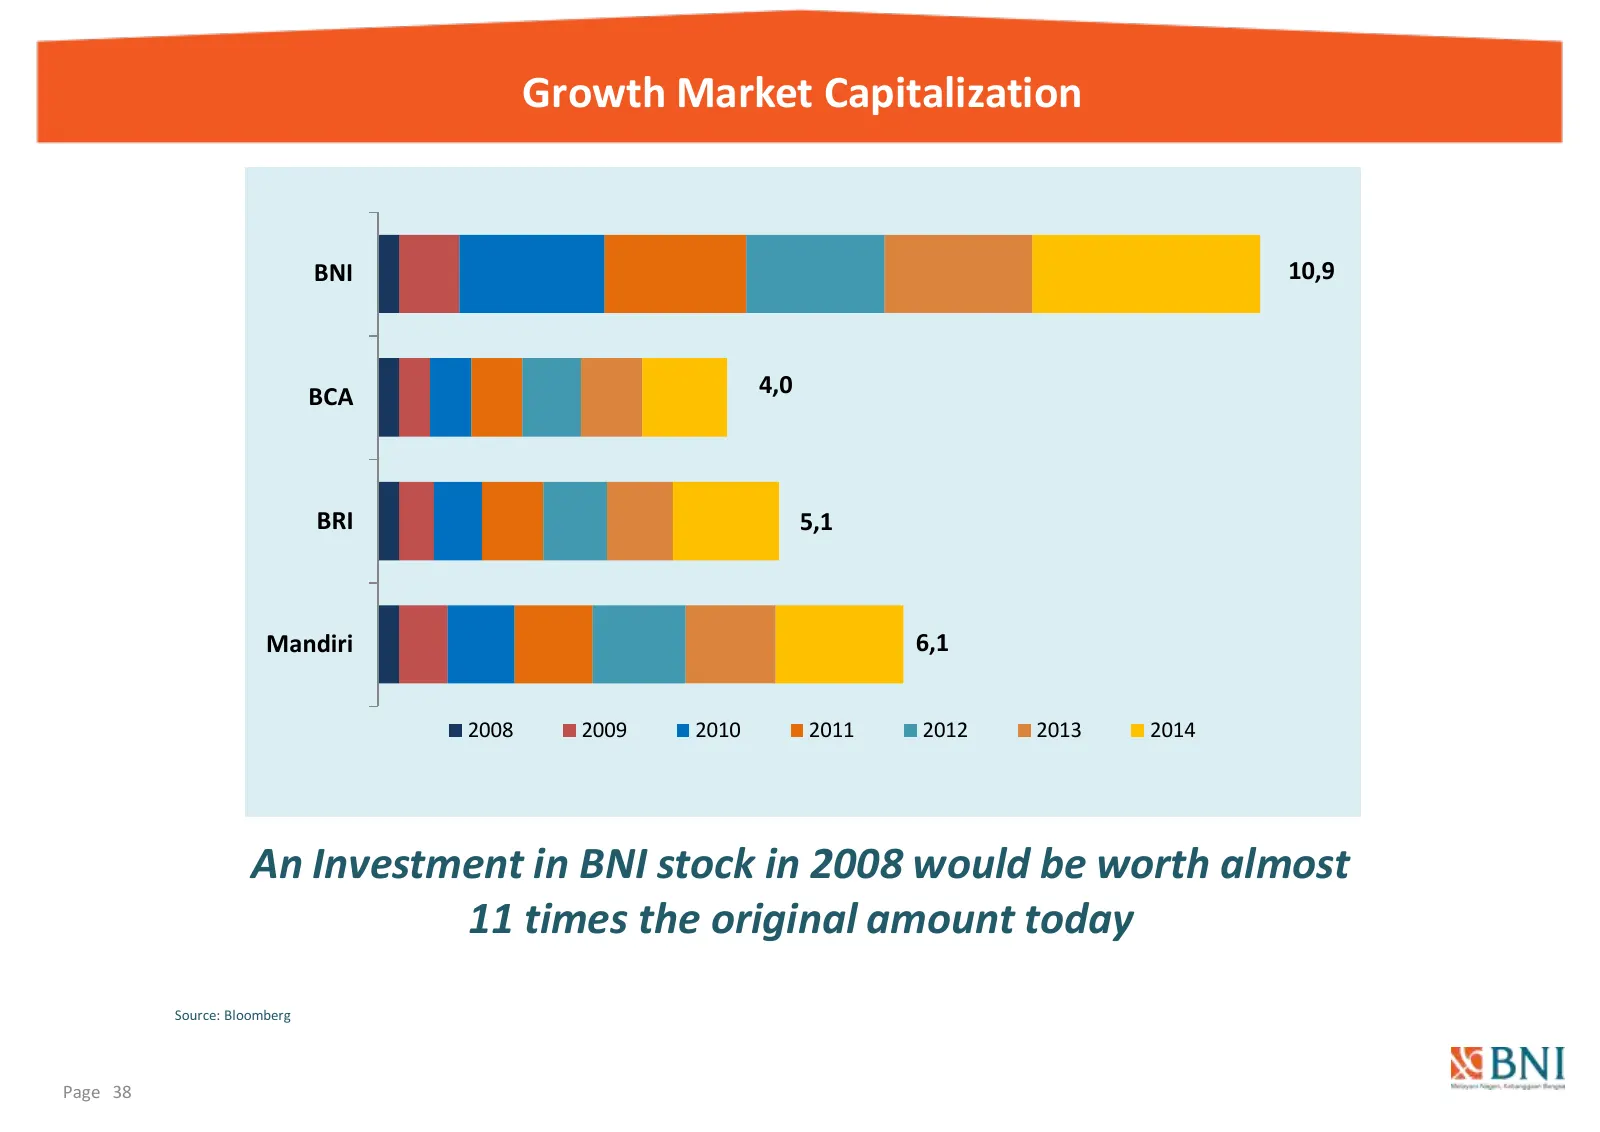
Growth Market Capitalization BNI 10,9 BCA 4,0 BRI 5,1 Mandiri 6,1 2008 2009 2010 2011 2012 2013 2014 An Investment in BNI stock in 2008 would be worth almost 11 times the original amount today Source: Bloomberg Page 38
Slide 39: Value Creation – Done! 88 T in value created
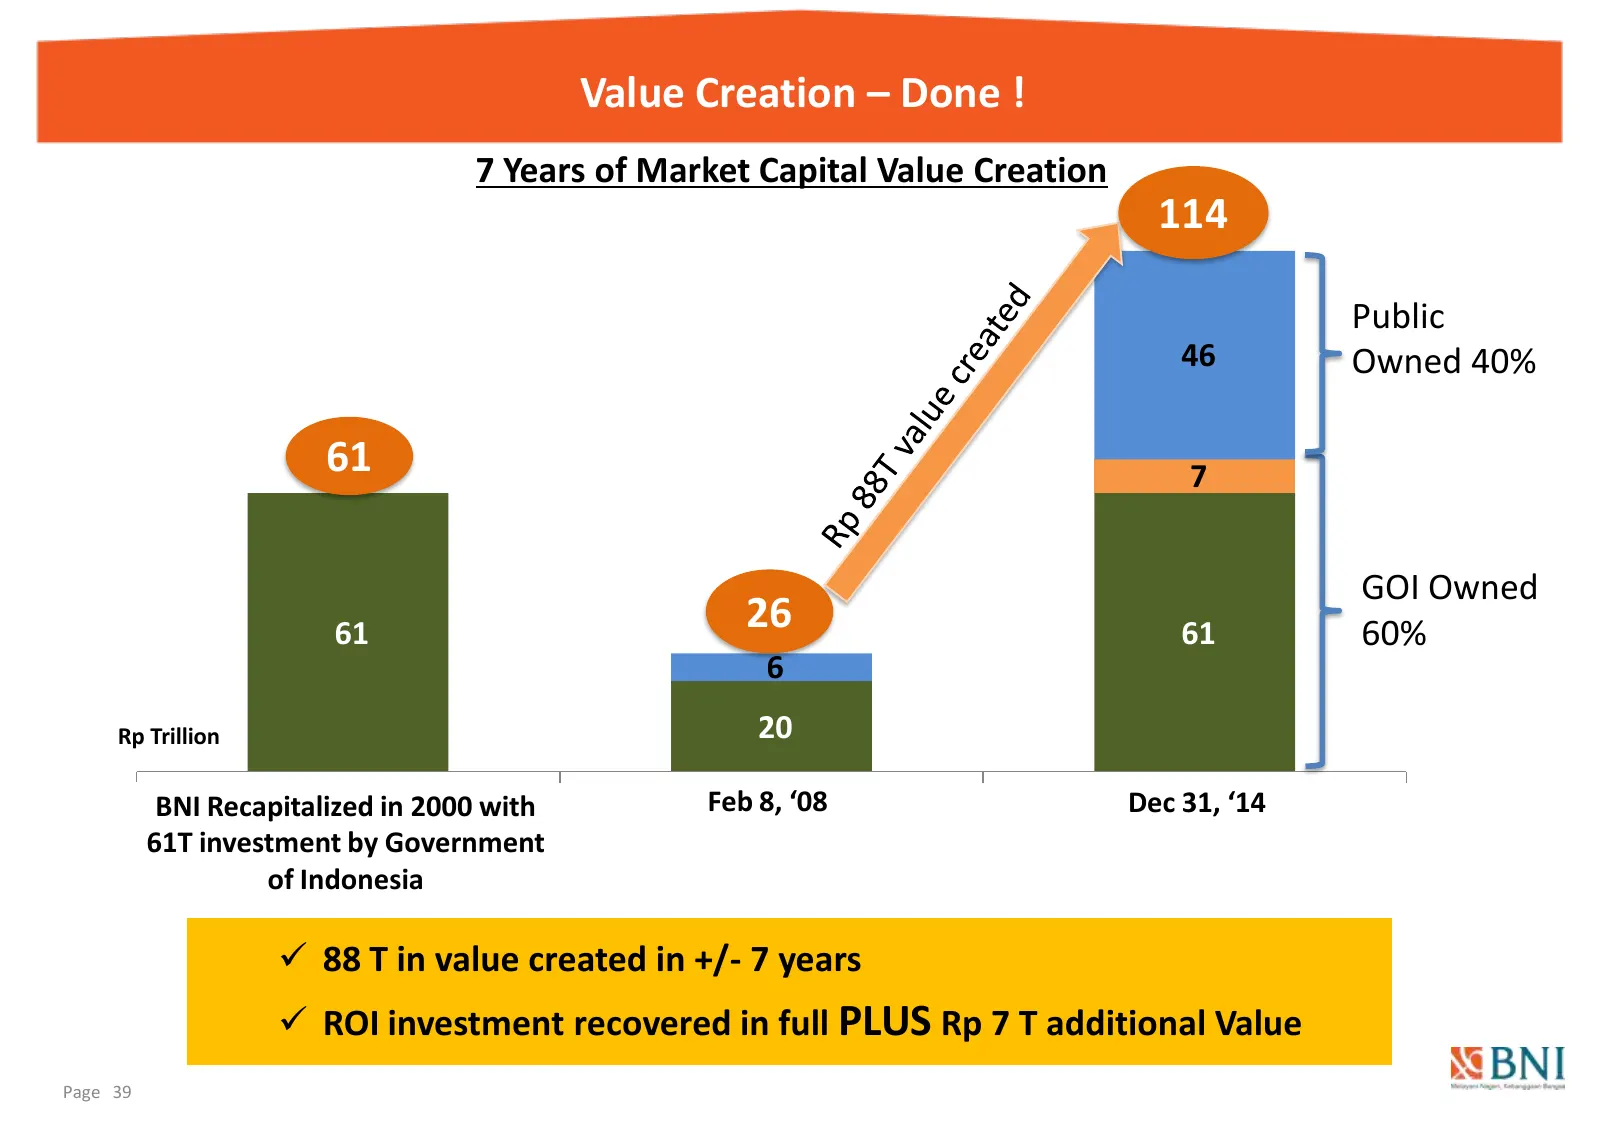
Value Creation – Done ! 7 Years of Market Capital Value Creation 114 Public 46 Owned 40% 61 7 GOI Owned 61 26 61 60% 6 Rp Trillion 20 BNI Recapitalized in 2000 with Feb 8, ‘08 Dec 31, ‘14 2000 61T investment by Government 2008 2014 of Indonesia 88 T in value created in +/- 7 years ROI investment
Slide 40: About BNI
2 faa) _ > ie) ae} <x
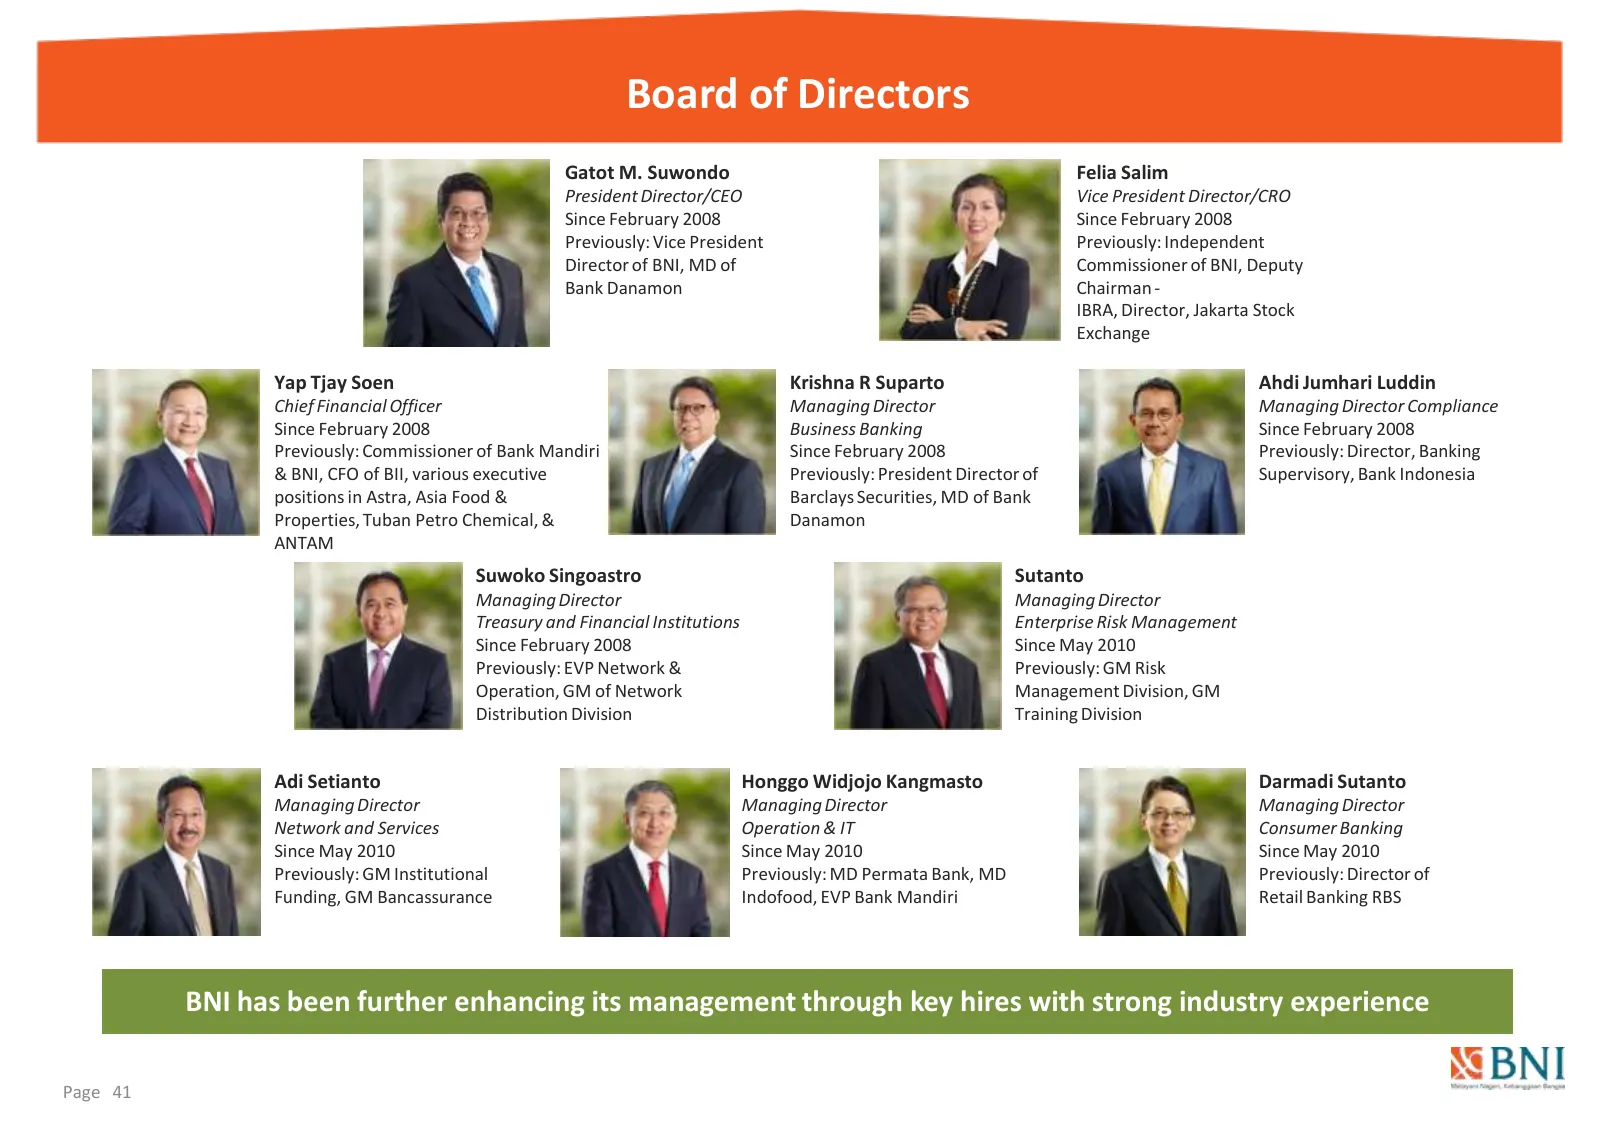
Slide 41: Board of Directors
Board of Directors Gatot M. Suwondo Felia Salim President Director/CEO Vice President Director/CRO Since February 2008 Since February 2008 Previously: Vice President Previously: Independent Director of BNI, MD of Commissioner of BNI, Deputy Bank Danamon Chairman ‐ IBRA, Director, Jakarta Stock Excha
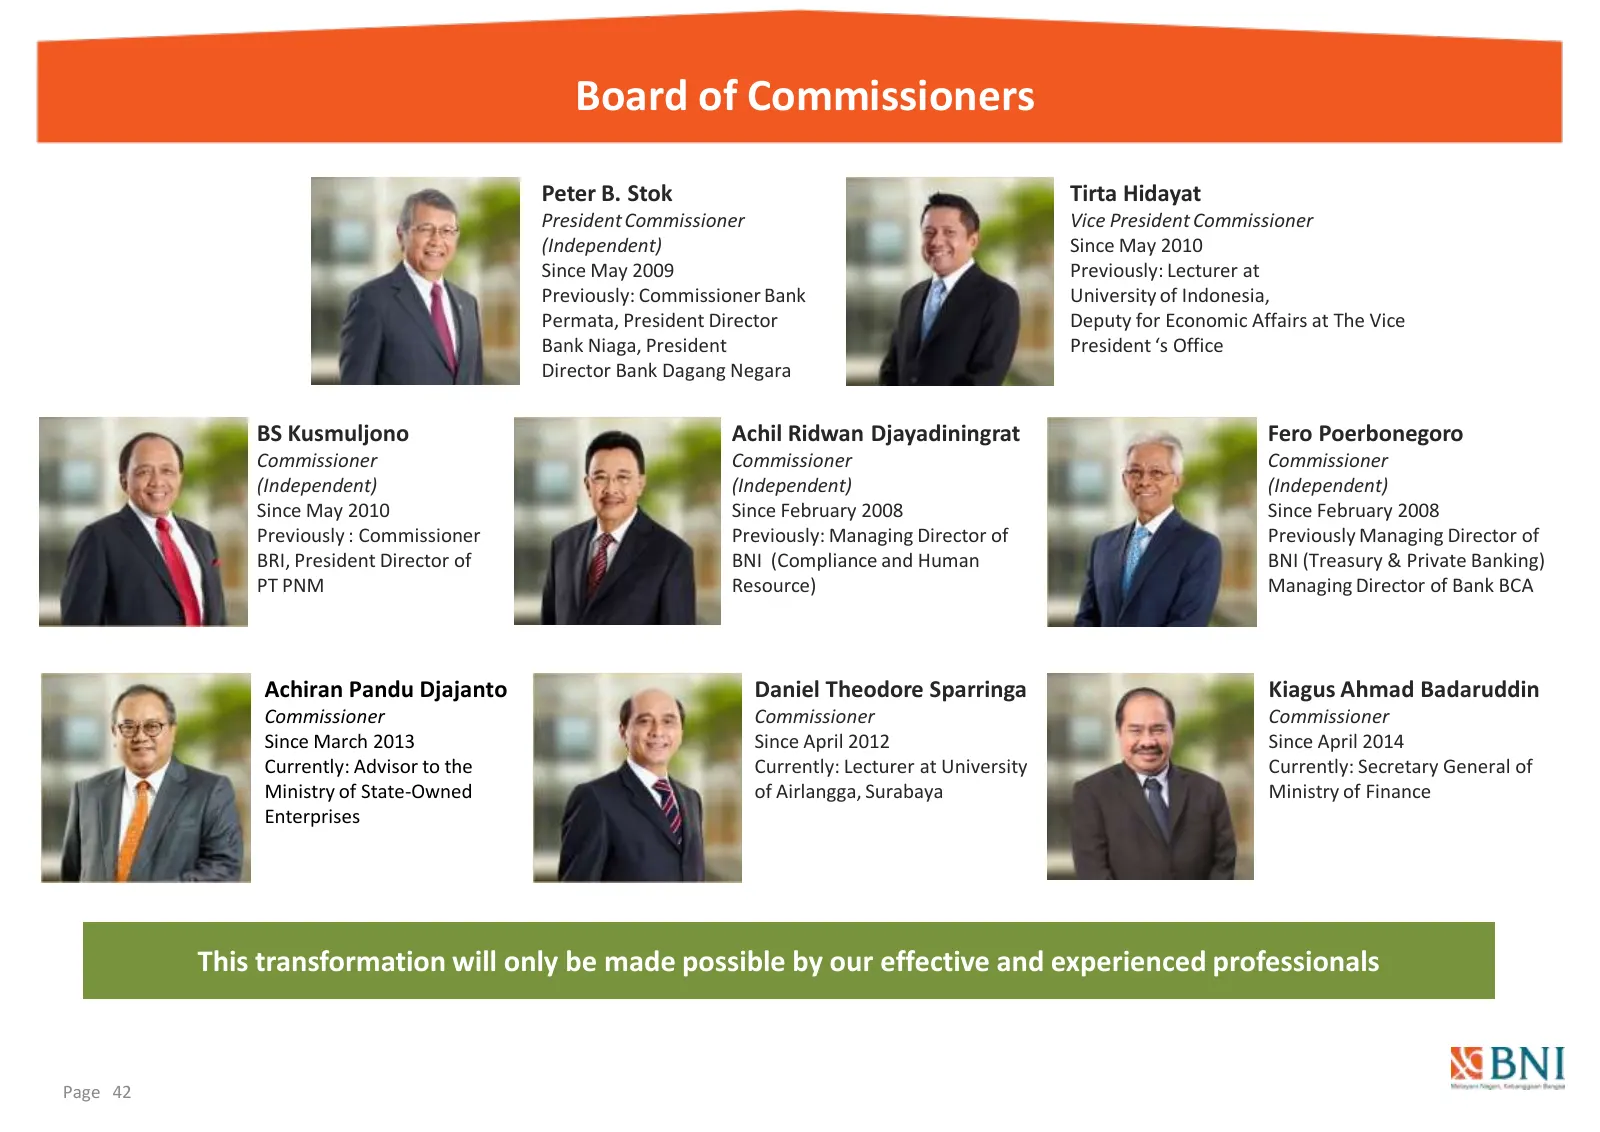
Slide 42: Board of Commissioners
Board of Commissioners Peter B. Stok Tirta Hidayat President Commissioner Vice President Commissioner (Independent) Since May 2010 Since May 2009 Previously: Lecturer at Previously: Commissioner Bank University of Indonesia, Permata, President Director Deputy for Economic Affairs at The Vice Bank Ni
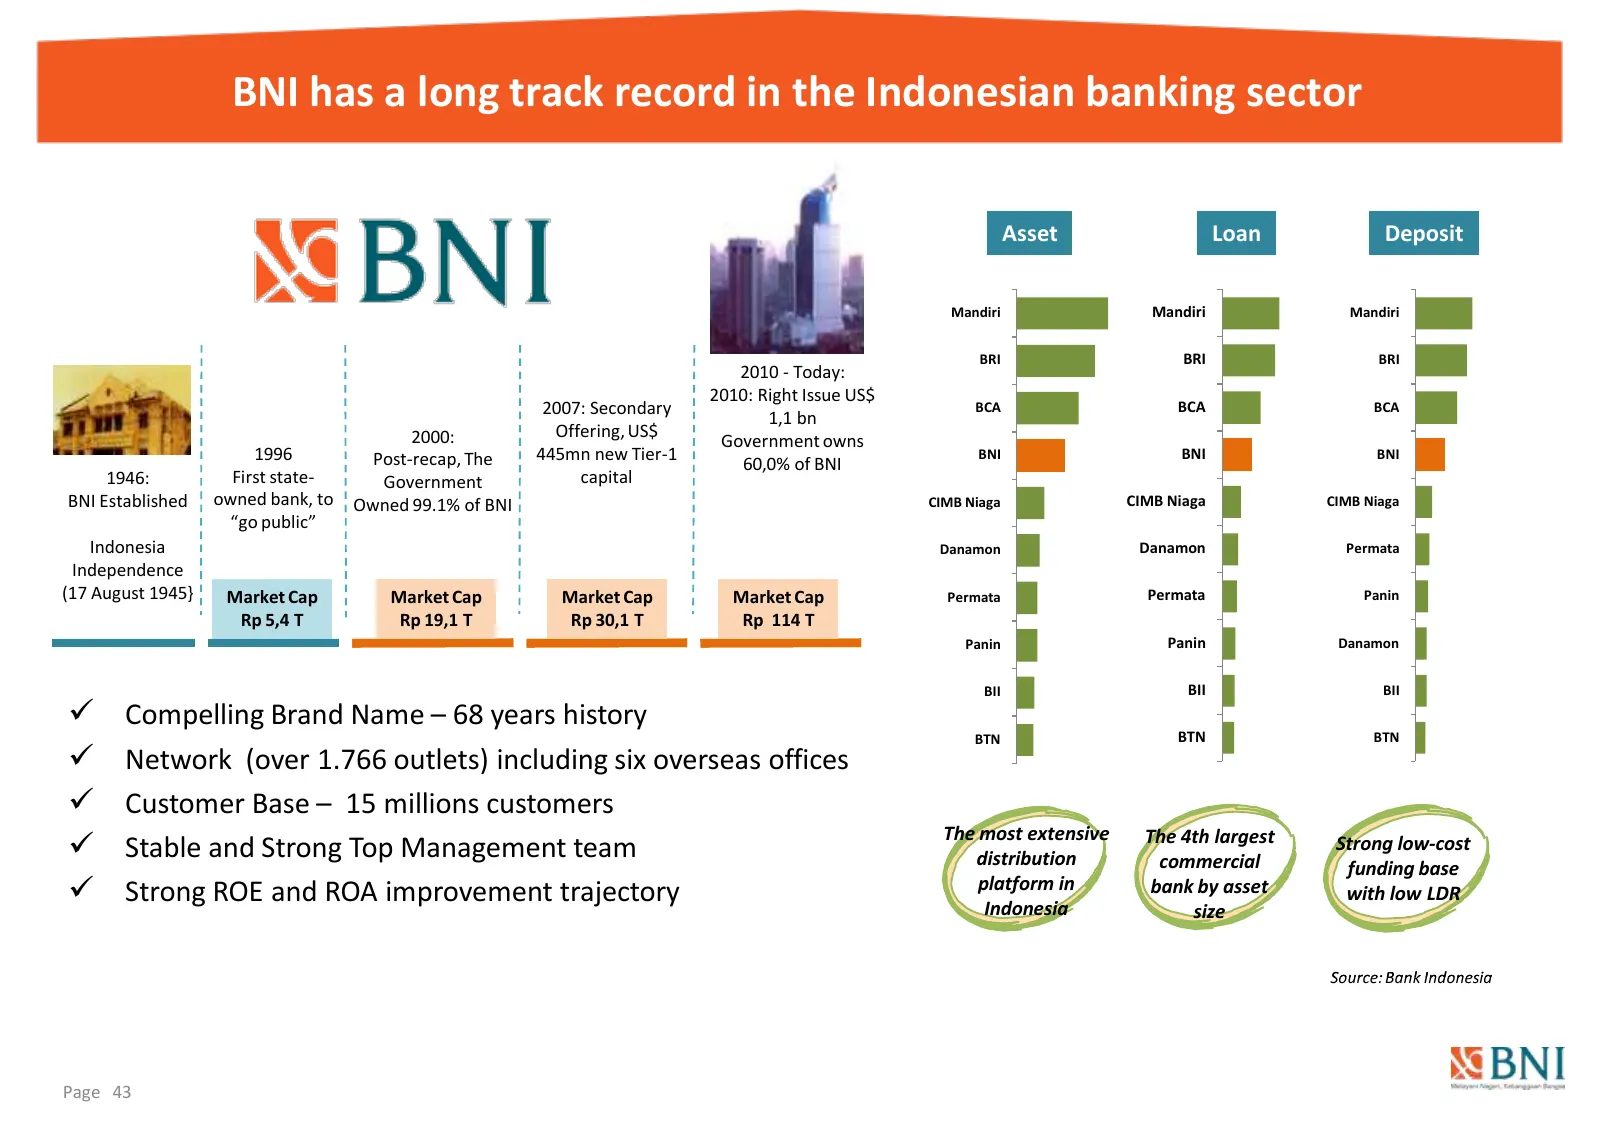
Slide 43: BNI has a long track record in the Indonesian banking sector
BNI has a long track record in the Indonesian banking sector Asset Loan Deposit Mandiri Mandiri Mandiri BRI BRI BRI 2010 - Today: 2010: Right Issue US$ 2007: Secondary BCA BCA BCA 1,1 bn 2000: Offering, US$ Government owns 1996 Post-recap, The 445mn new Tier-1 BNI BNI BNI 60,0% of BNI 1946: First st
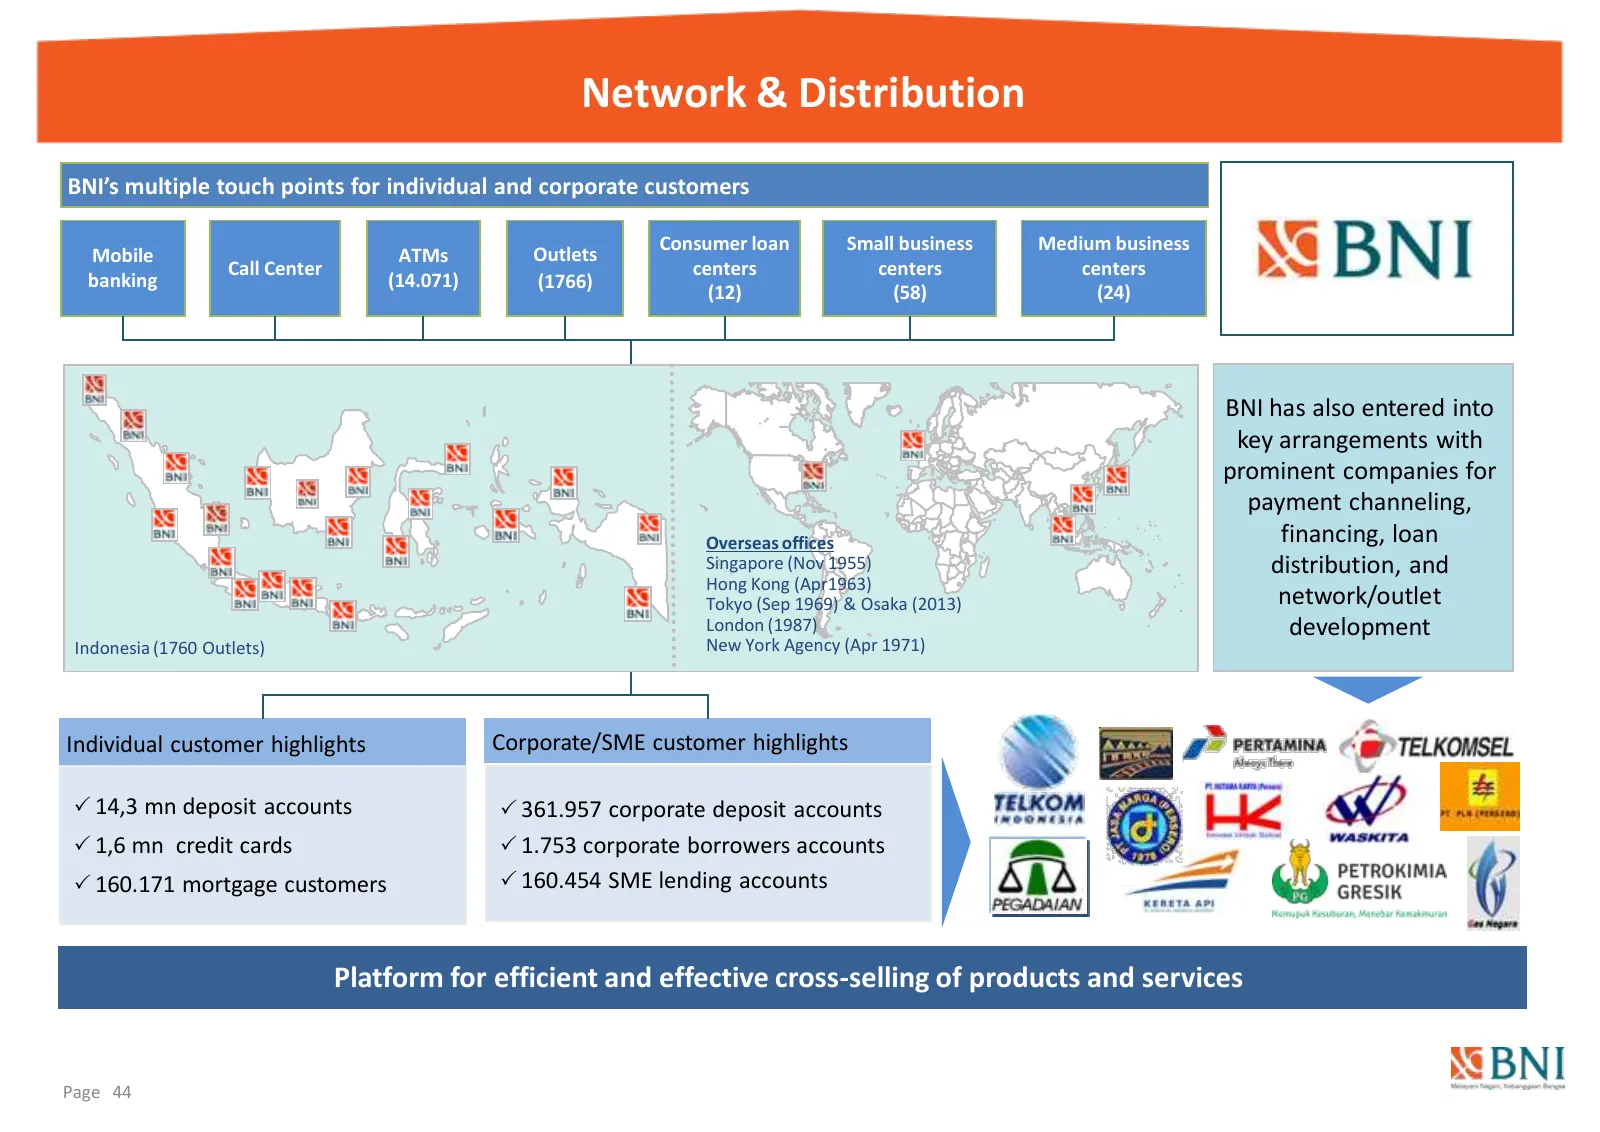
Slide 44: Network & Distribution
Network & Distribution BNI’s multiple touch points for individual and corporate customers Consumer loan Small business Medium business Mobile ATMs Outlets Call Center centers centers centers banking (14.071) (1766) (12) (58) (24) BNI has also entered into key arrangements with prominent companies fo
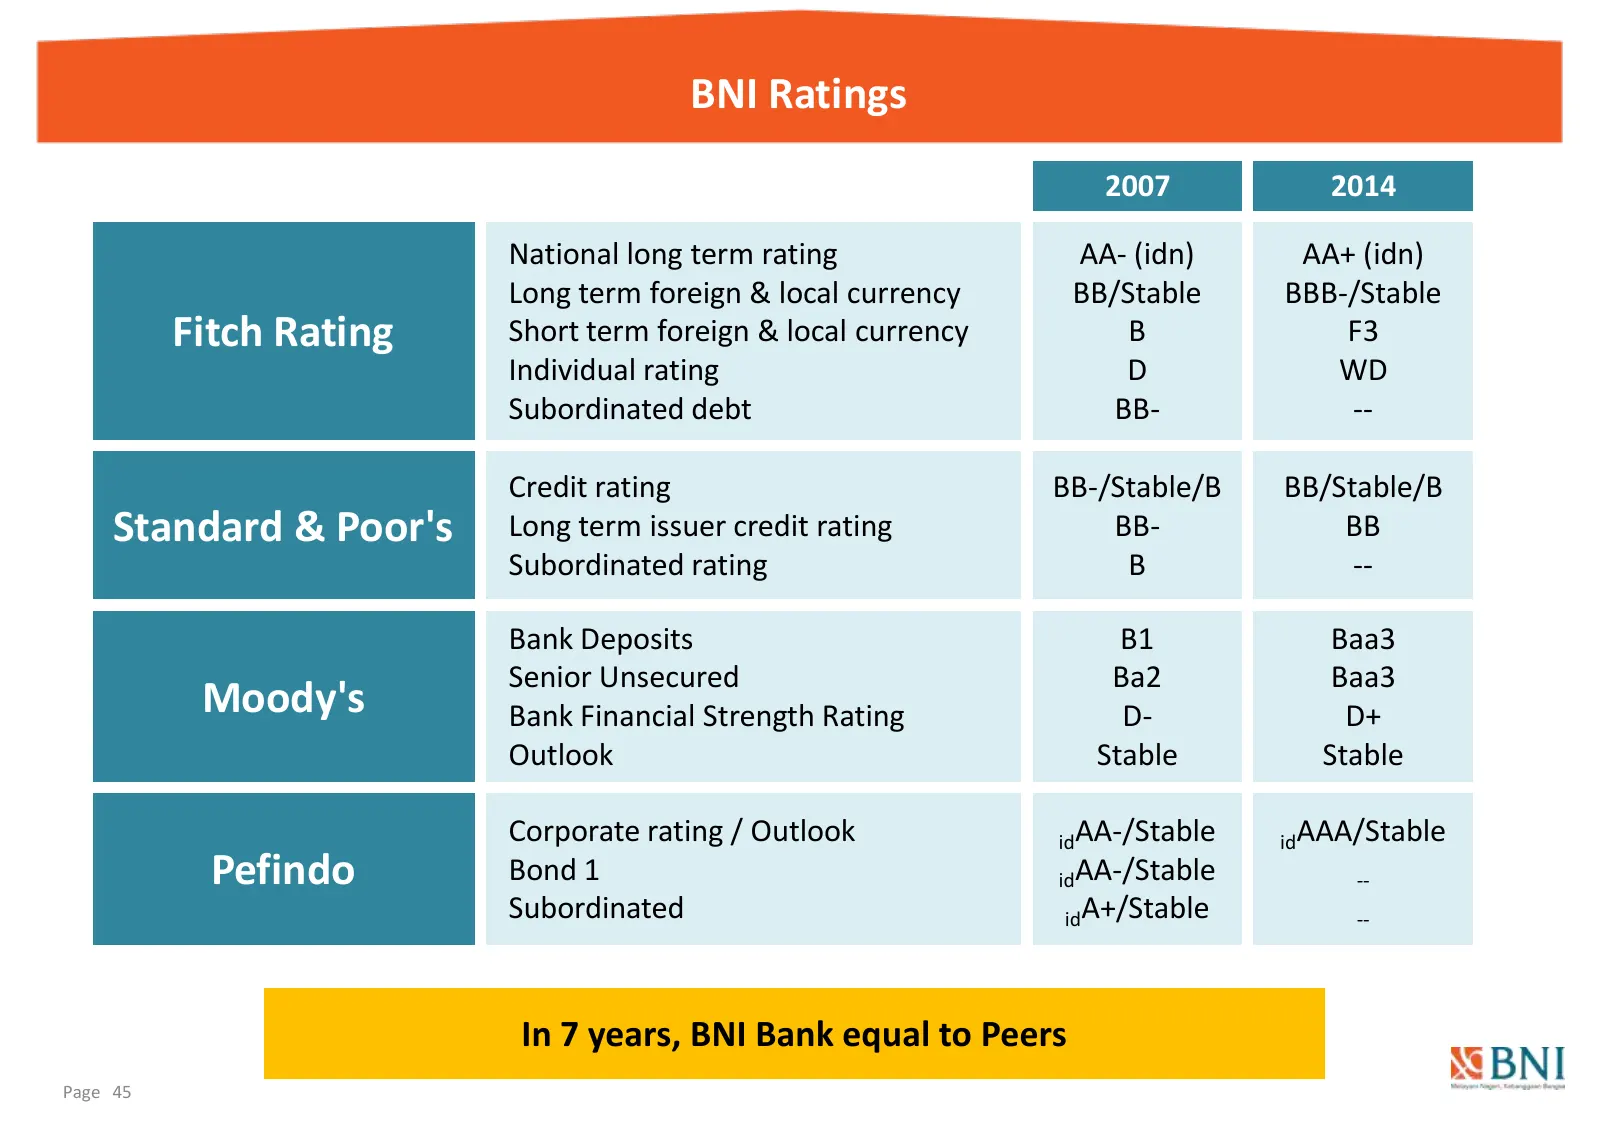
Slide 45: BNI Ratings
BNI Ratings 2007 2014 National long term rating AA- (idn) AA+ (idn) Long term foreign & local currency BB/Stable BBB-/Stable Fitch Rating Short term foreign & local currency B F3 Individual rating D WD Subordinated debt BB- -- Credit rating BB-/Stable/B BB/Stable/B Standard & Poor's Long term issuer
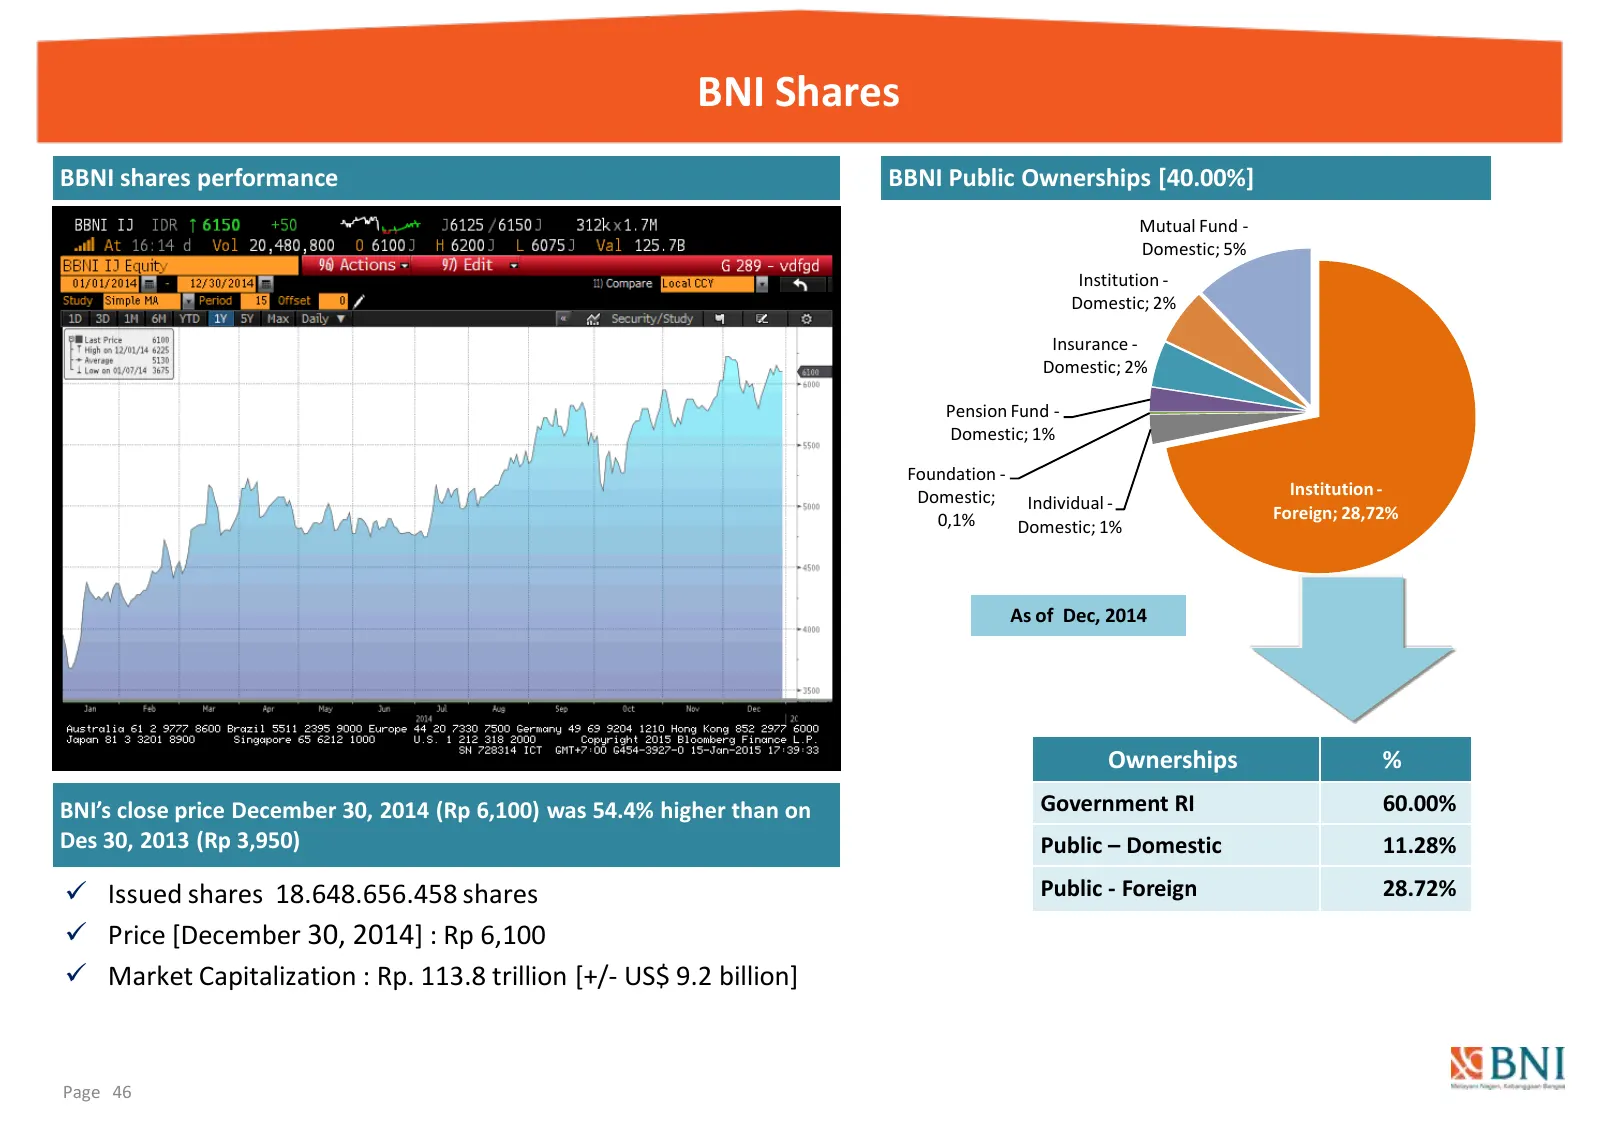
Slide 46: BNI Shares
BNI Shares BBNI shares performance BBNI Public Ownerships [40.00%] Mutual Fund - Domestic; 5% Institution - Domestic; 2% Insurance - Domestic; 2% Pension Fund - Domestic; 1% Foundation - Domestic; Institution - Individual - Foreign; 28,72% 0,1% Domestic; 1% As of Dec, 2014 Ownerships % BNI’s close p
Slide 47: Business Banking
Business Banking Focus and Strategy
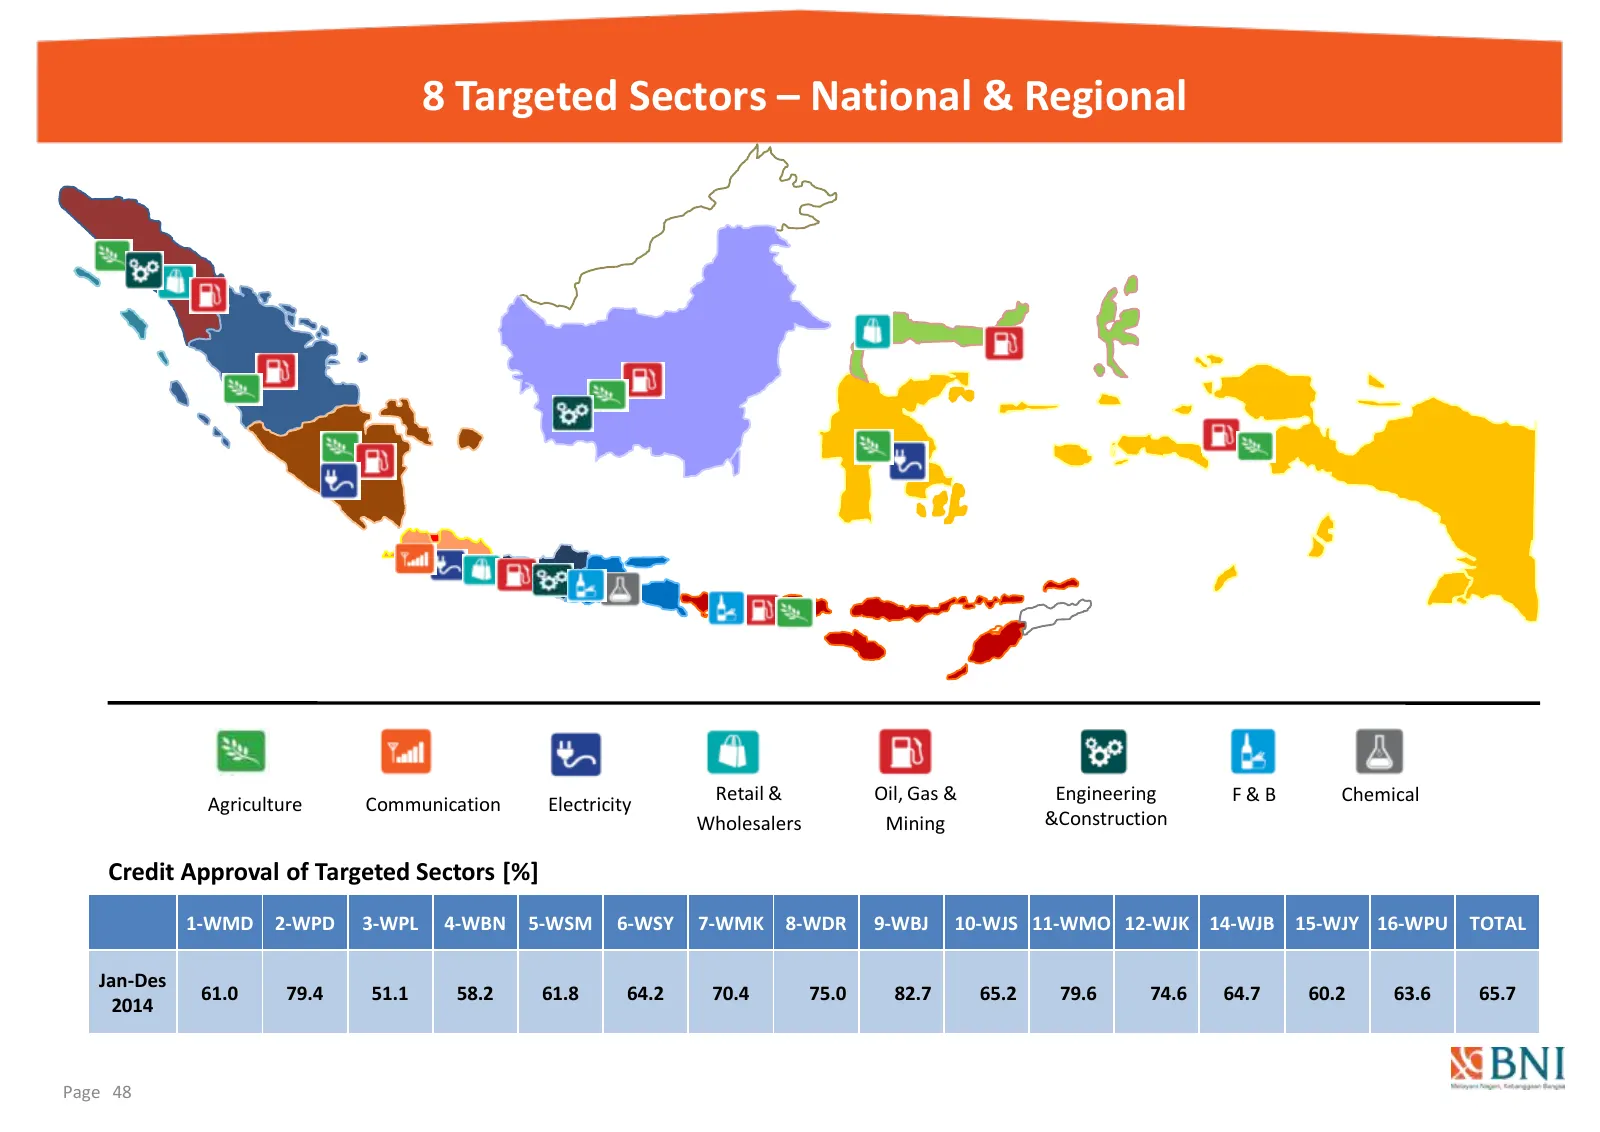
Slide 48: 8 Targeted Sectors – National & Regional
8 Targeted Sectors – National & Regional Retail & Oil, Gas & Engineering F&B Chemical Agriculture Communication Electricity Wholesalers Mining &Construction Credit Approval of Targeted Sectors [%] 1-WMD 2-WPD 3-WPL 4-WBN 5-WSM 6-WSY 7-WMK 8-WDR 9-WBJ 10-WJS 11-WMO 12-WJK 14-WJB 15-WJY 16-WPU TOTAL J
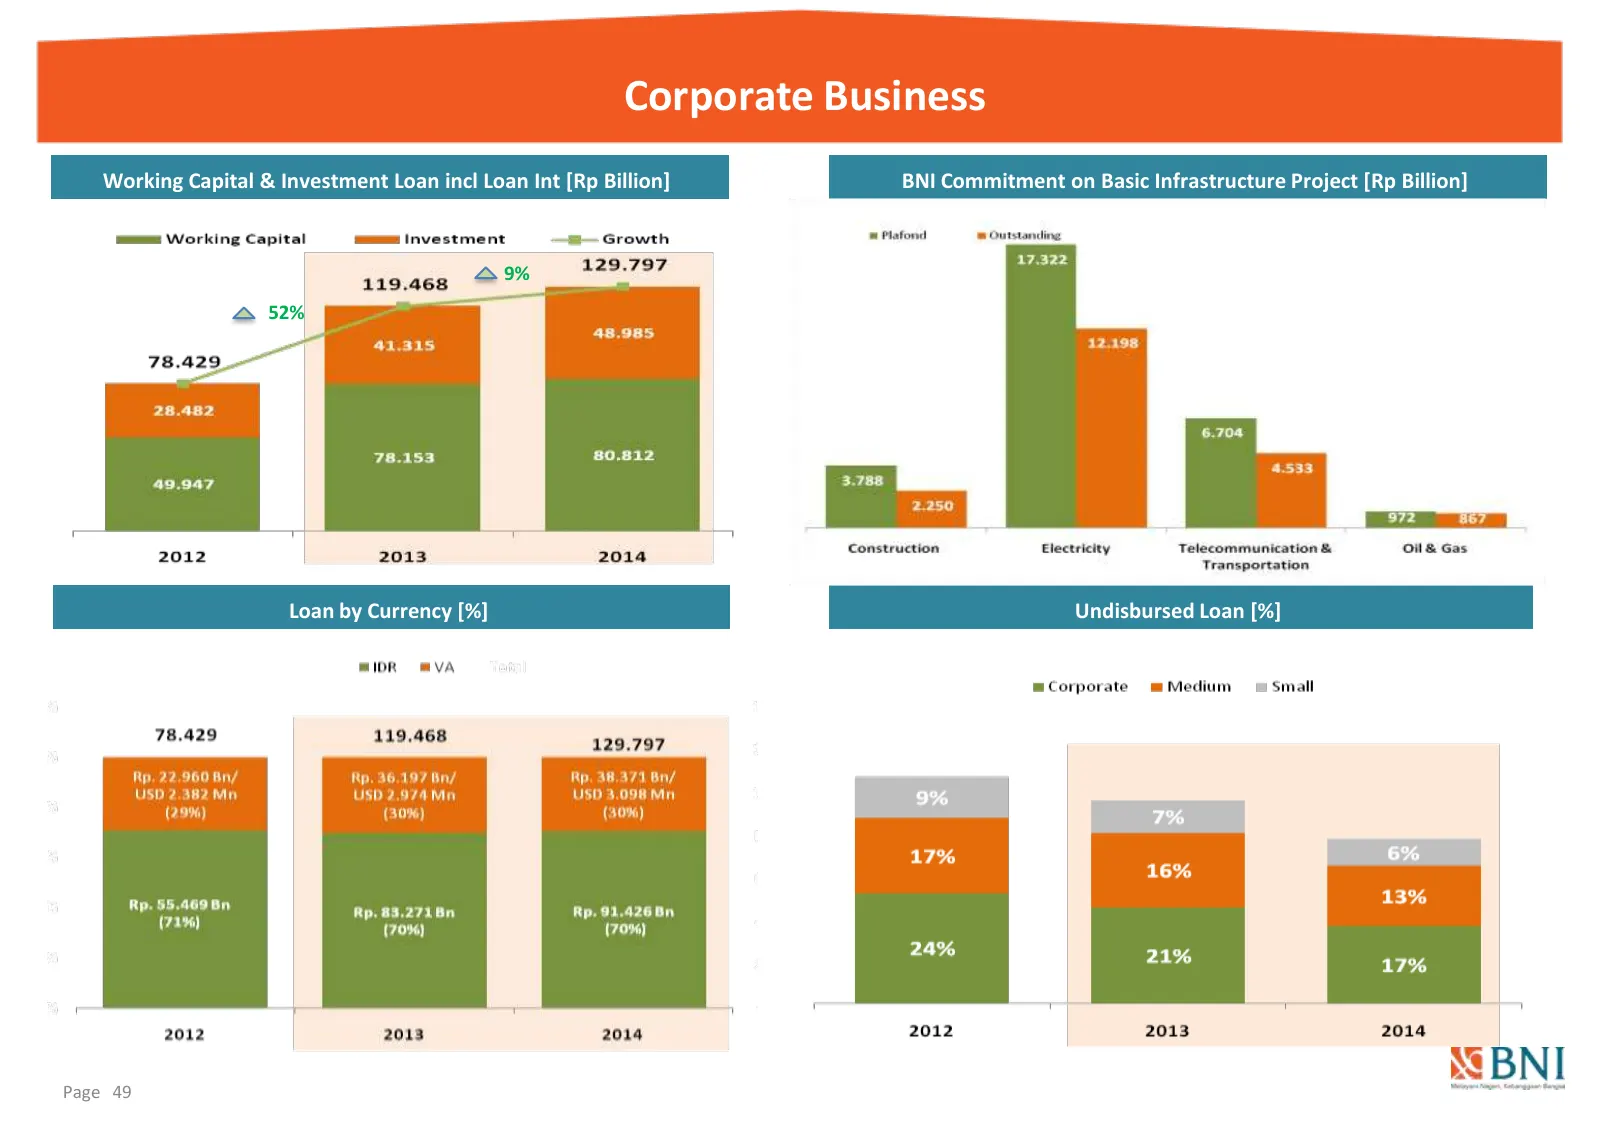
Slide 49: Corporate Business
Corporate Business Working Capital & Investment Loan incl Loan Int [Rp Billion] BNI Commitment on Basic Infrastructure Project [Rp Billion] 9% 52% Loan by Currency [%] Undisbursed Loan [%] Page 49
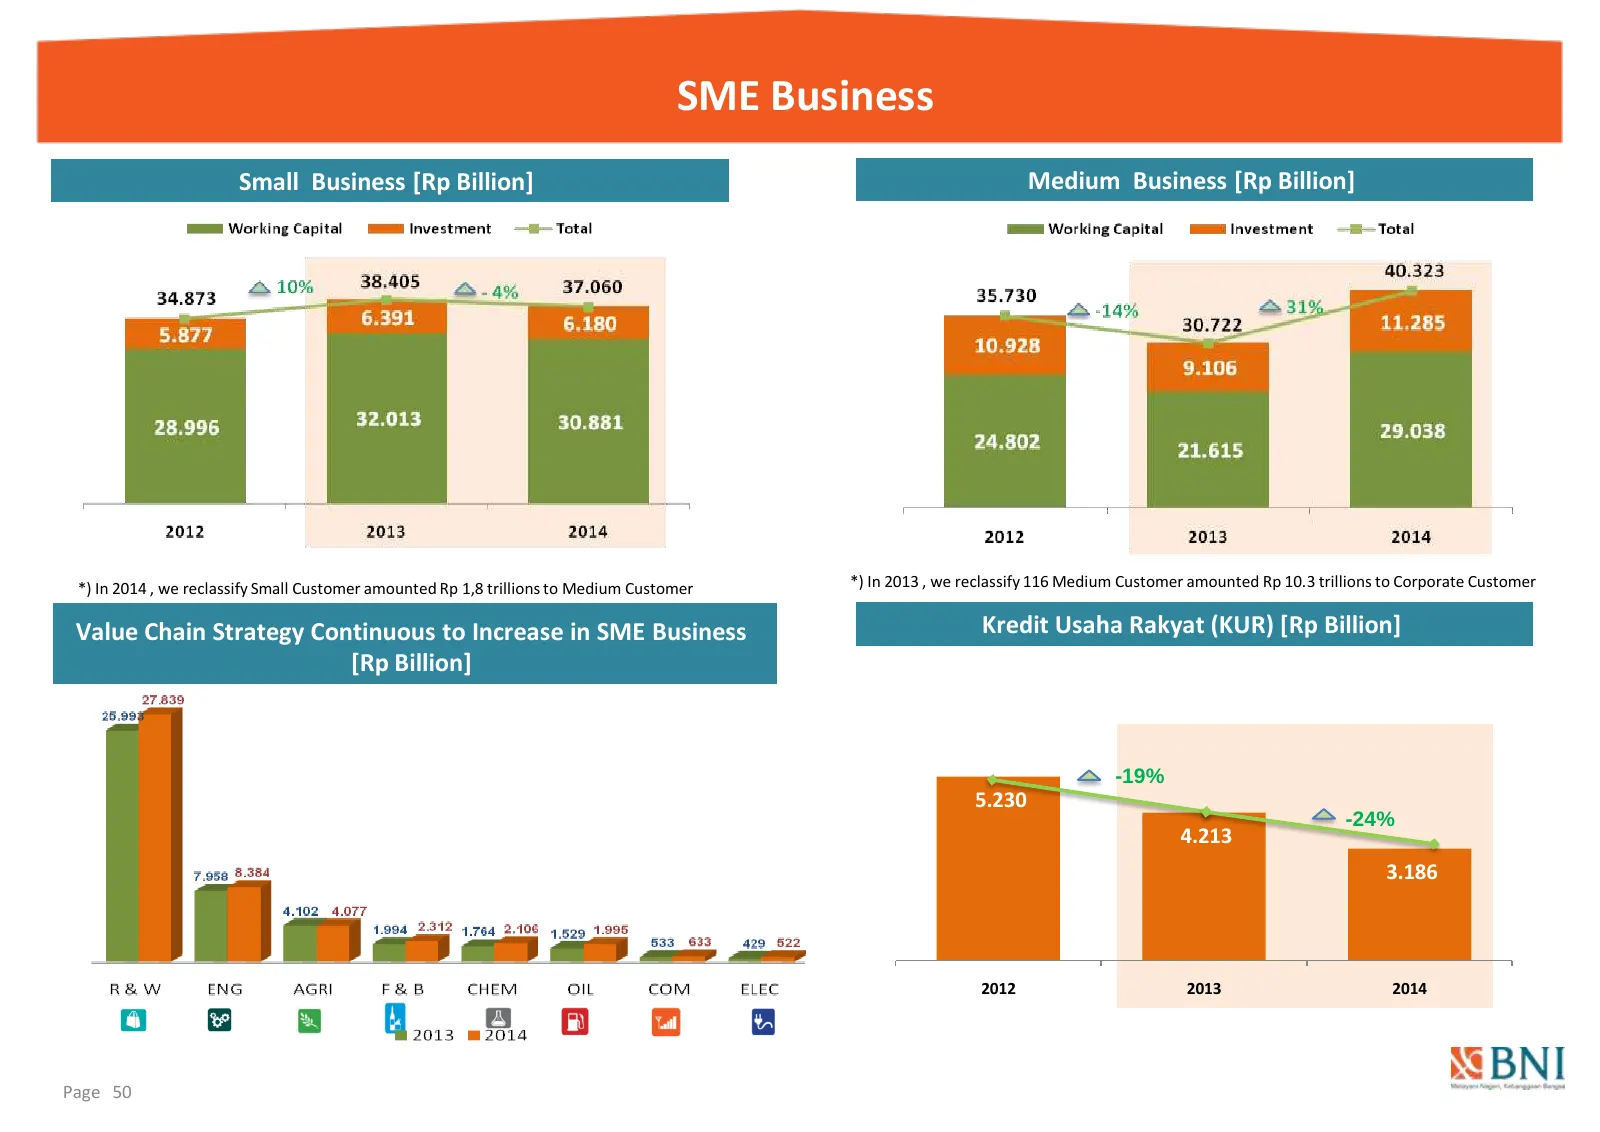
Slide 50: SME Business
SME Business Small Business [Rp Billion] Medium Business [Rp Billion] *) In 2014 , we reclassify Small Customer amounted Rp 1,8 trillions to Medium Customer *) In 2013 , we reclassify 116 Medium Customer amounted Rp 10.3 trillions to Corporate Customer Value Chain Strategy Continuous to Increase in
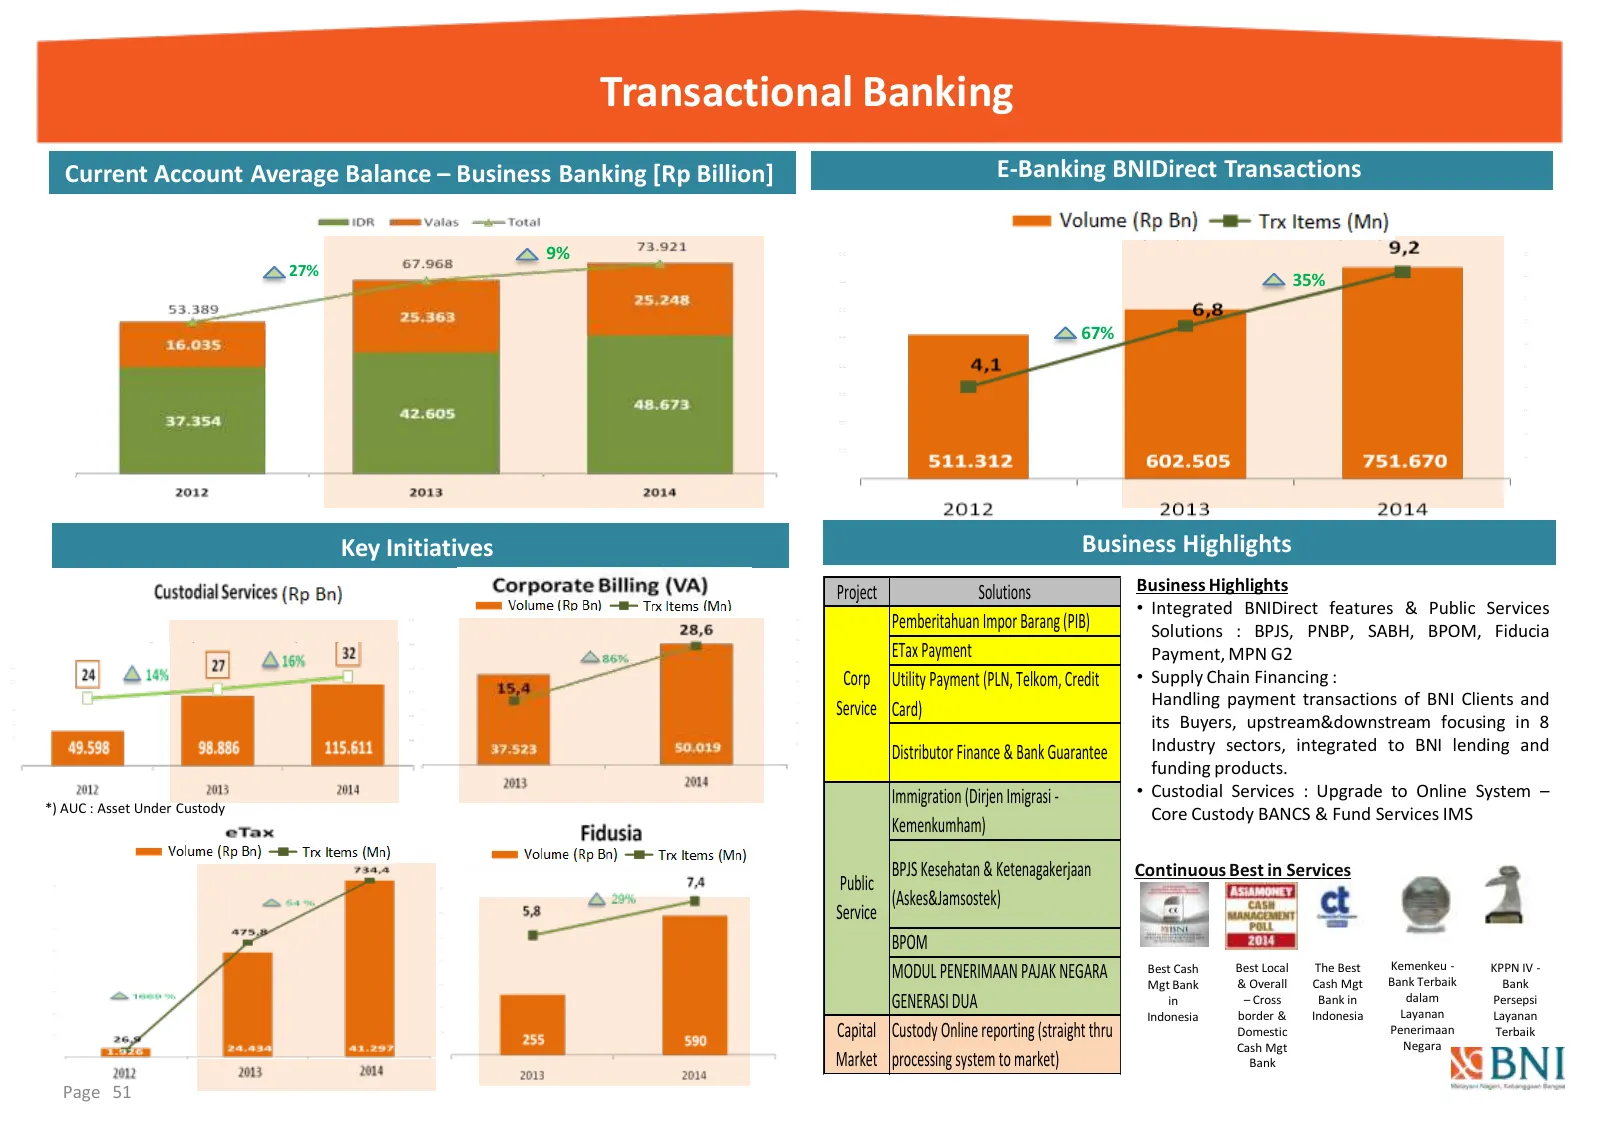
Slide 51: Transactional Banking
Transactional Banking Current Account Average Balance – Business Banking [Rp Billion] E-Banking BNIDirect Transactions 9% 27% 35% 67% Key Initiatives Business Highlights Project Solutions Business Highlights • Integrated BNIDirect features & Public Services Pemberitahuan Impor Barang (PIB) Solutions
Slide 52: Consumer & Retail
Consumer & Retail focus & strategy
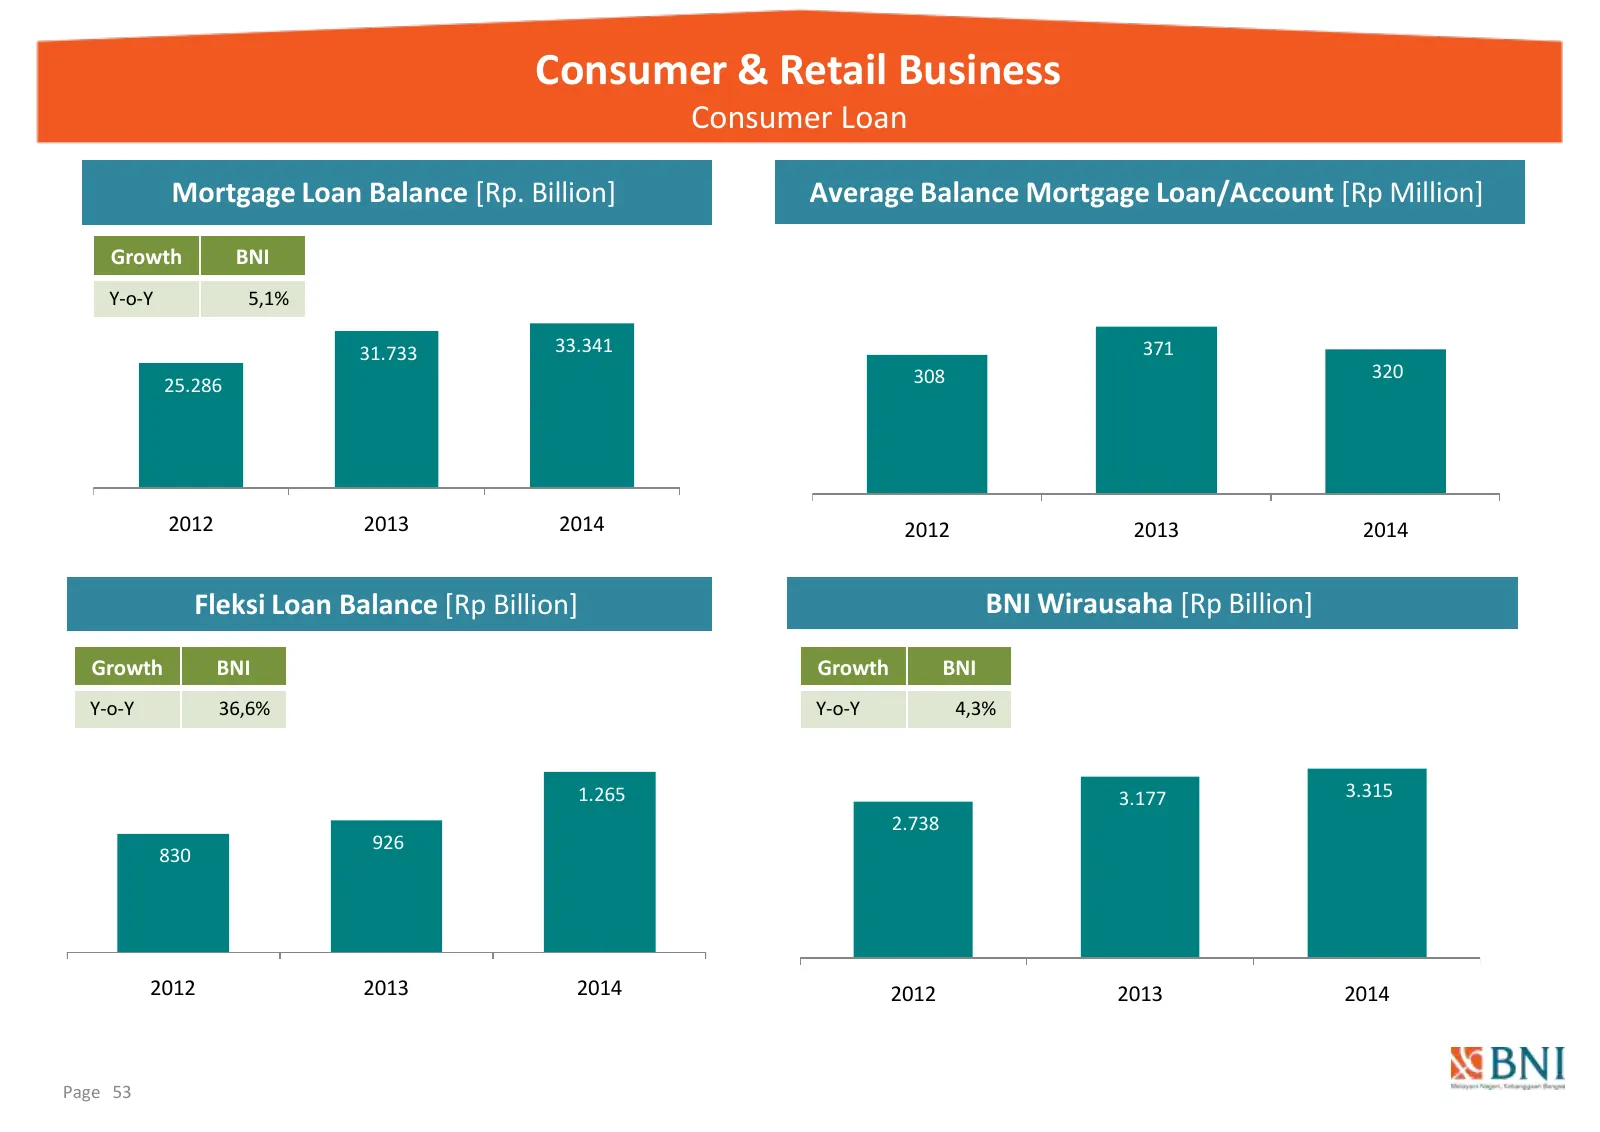
Slide 53: Consumer & Retail Business: Consumer Loan
Consumer & Retail Business Consumer Loan Mortgage Loan Balance [Rp. Billion] Average Balance Mortgage Loan/Account [Rp Million] Growth BNI Y-o-Y 5,1% 31.733 33.341 371 308 320 25.286 2012 2013 2014 2012 2013 2014 Fleksi Loan Balance [Rp Billion] BNI Wirausaha [Rp Billion] Growth BNI Growth BNI Y-o-Y
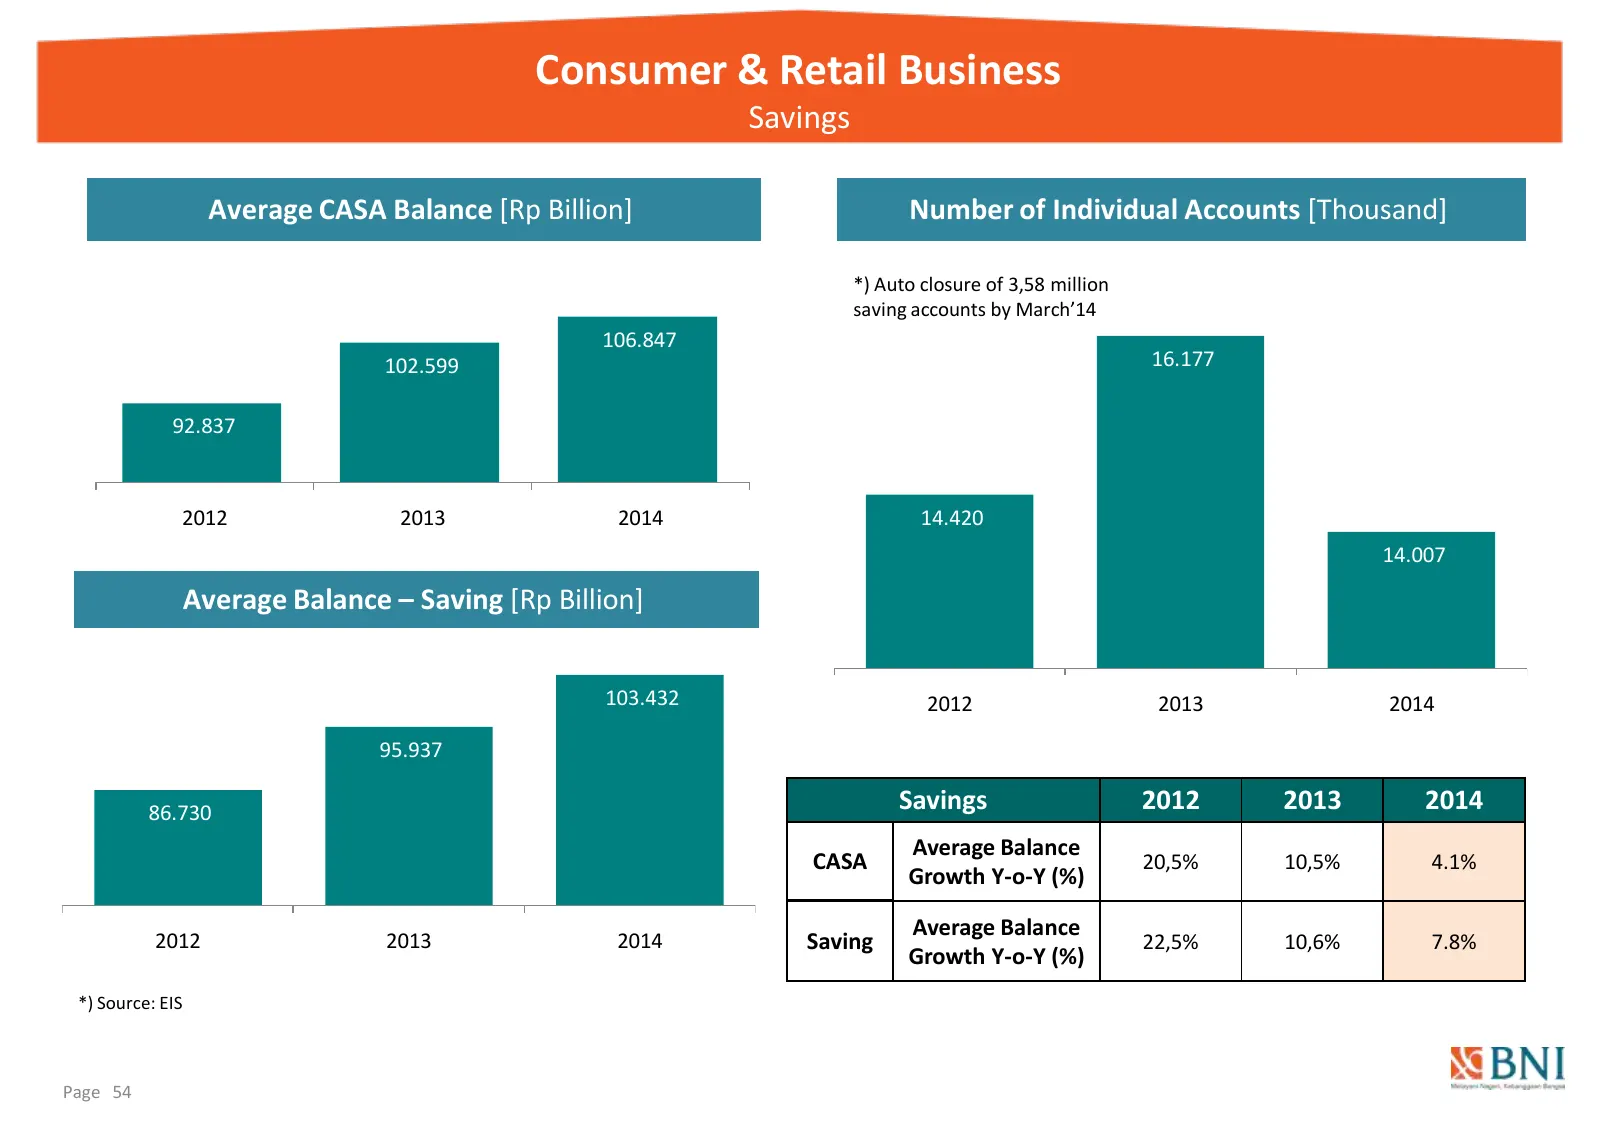
Slide 54: Consumer & Retail Business: Savings
Consumer & Retail Business Savings Average CASA Balance [Rp Billion] Number of Individual Accounts [Thousand] *) Auto closure of 3,58 million saving accounts by March’14 106.847 102.599 16.177 92.837 2012 2013 2014 14.420 14.007 Average Balance – Saving [Rp Billion] 103.432 2012 2013 2014 95.937 86.
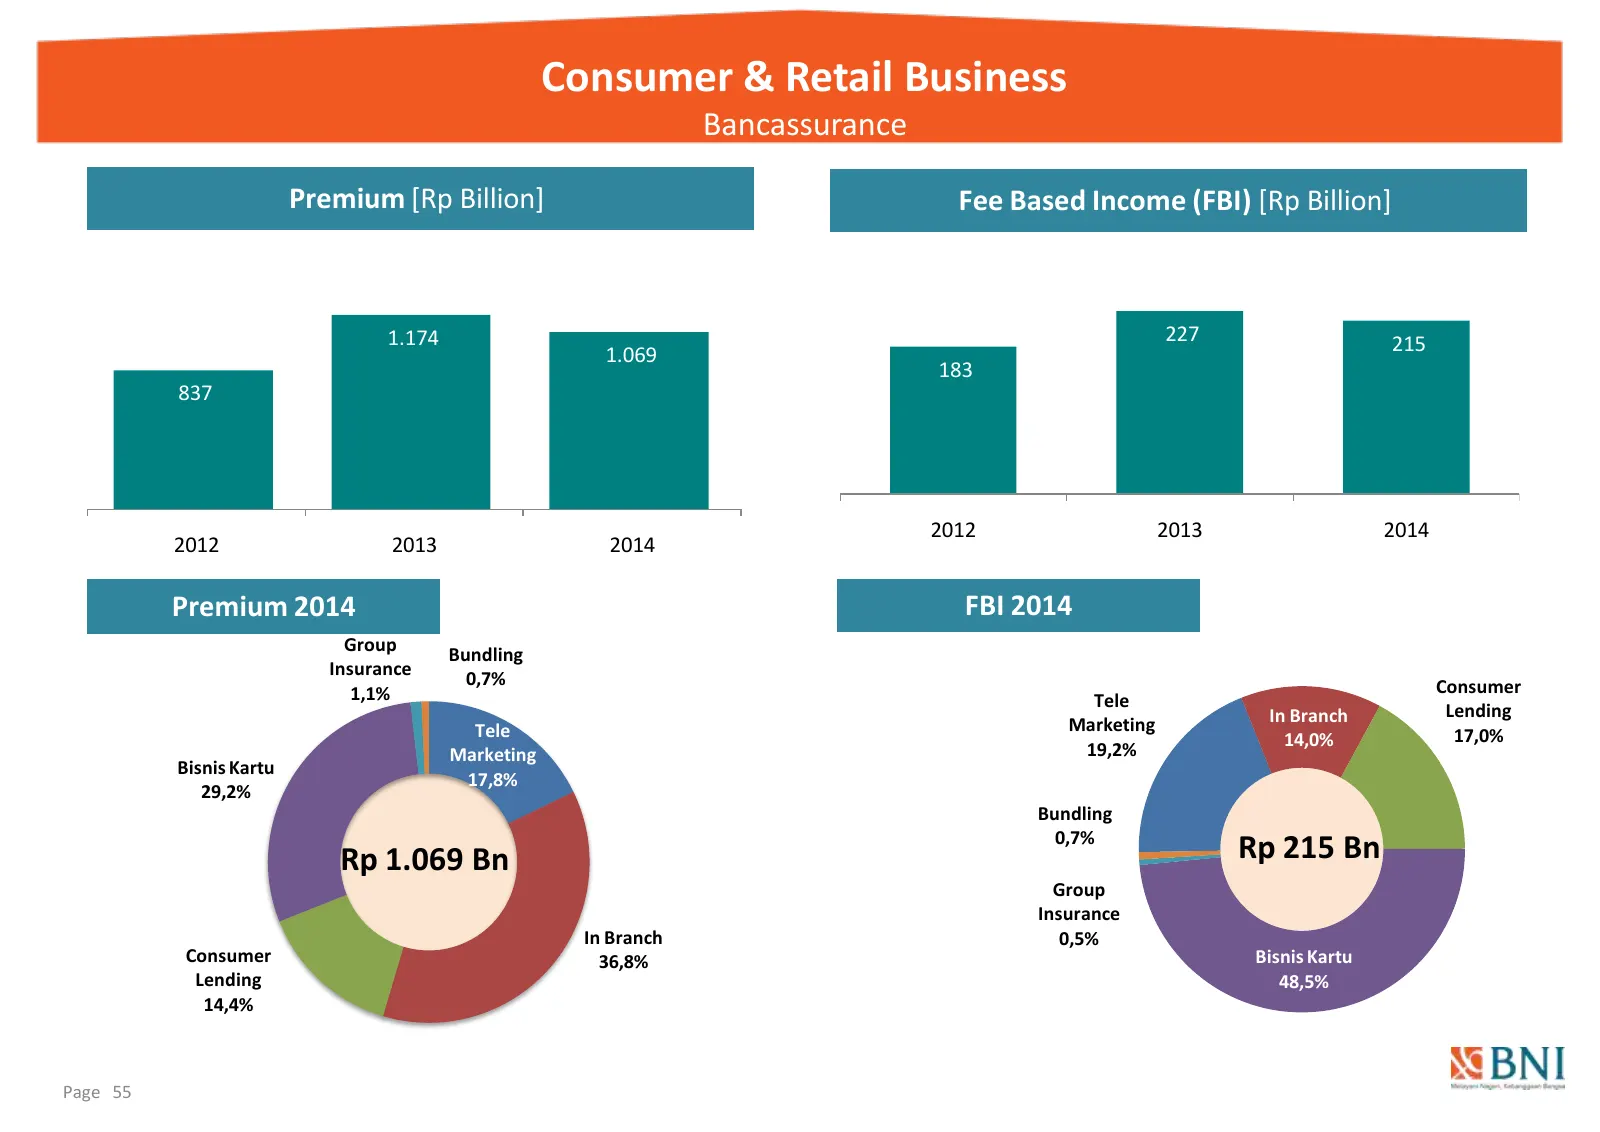
Slide 55: Consumer & Retail Business: Bancassurance
Consumer & Retail Business Bancassurance Premium [Rp Billion] Fee Based Income (FBI) [Rp Billion] 1.174 227 215 1.069 183 837 2012 2013 2014 2012 2013 2014 Premium 2014 FBI 2014 Group Bundling Insurance 0,7% 1,1% Consumer Tele In Branch Lending Tele Marketing 14,0% 17,0% Marketing 19,2% Bisnis Kartu
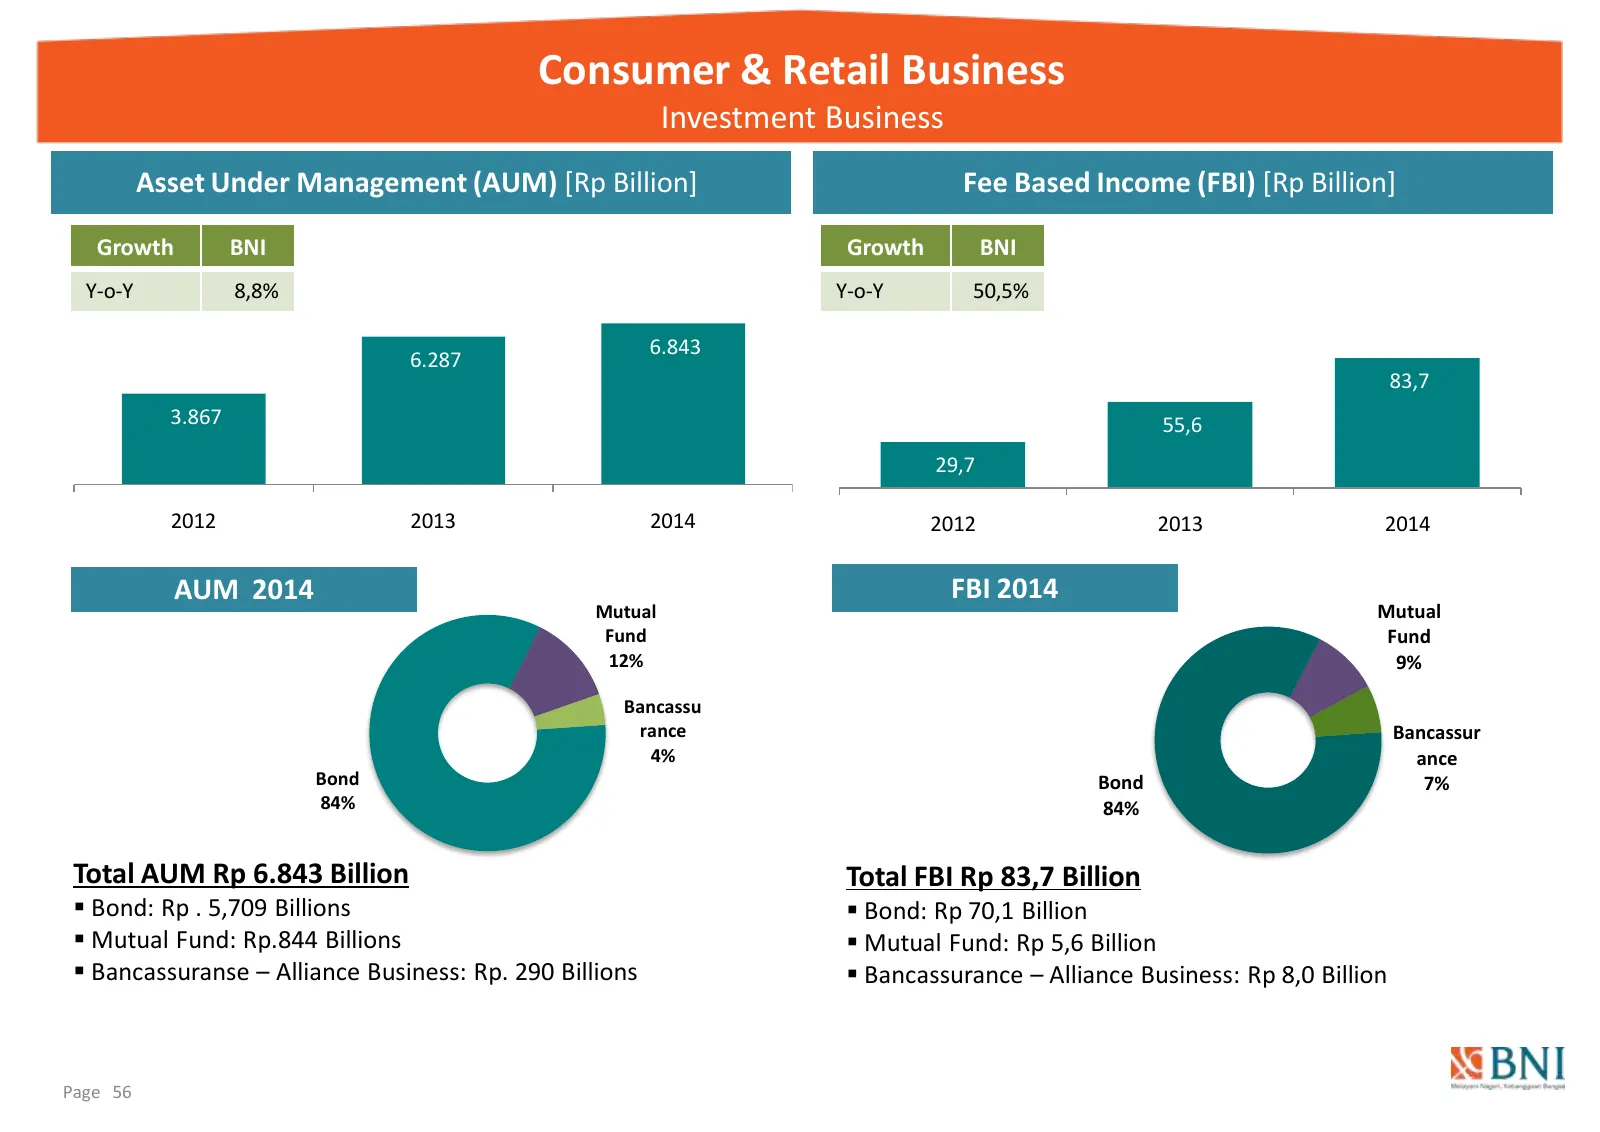
Slide 56: Consumer & Retail Business: Investment Business
Consumer & Retail Business Investment Business Asset Under Management (AUM) [Rp Billion] Fee Based Income (FBI) [Rp Billion] Growth BNI Growth BNI Y-o-Y 8,8% Y-o-Y 50,5% 6.843 6.287 83,7 3.867 55,6 29,7 2012 2013 2014 2012 2013 2014 AUM 2014 FBI 2014 Mutual Mutual Fund Fund 12% 9% Bancassu rance Ban
Slide 57: Consumer & Retail Business: Credit Card Business
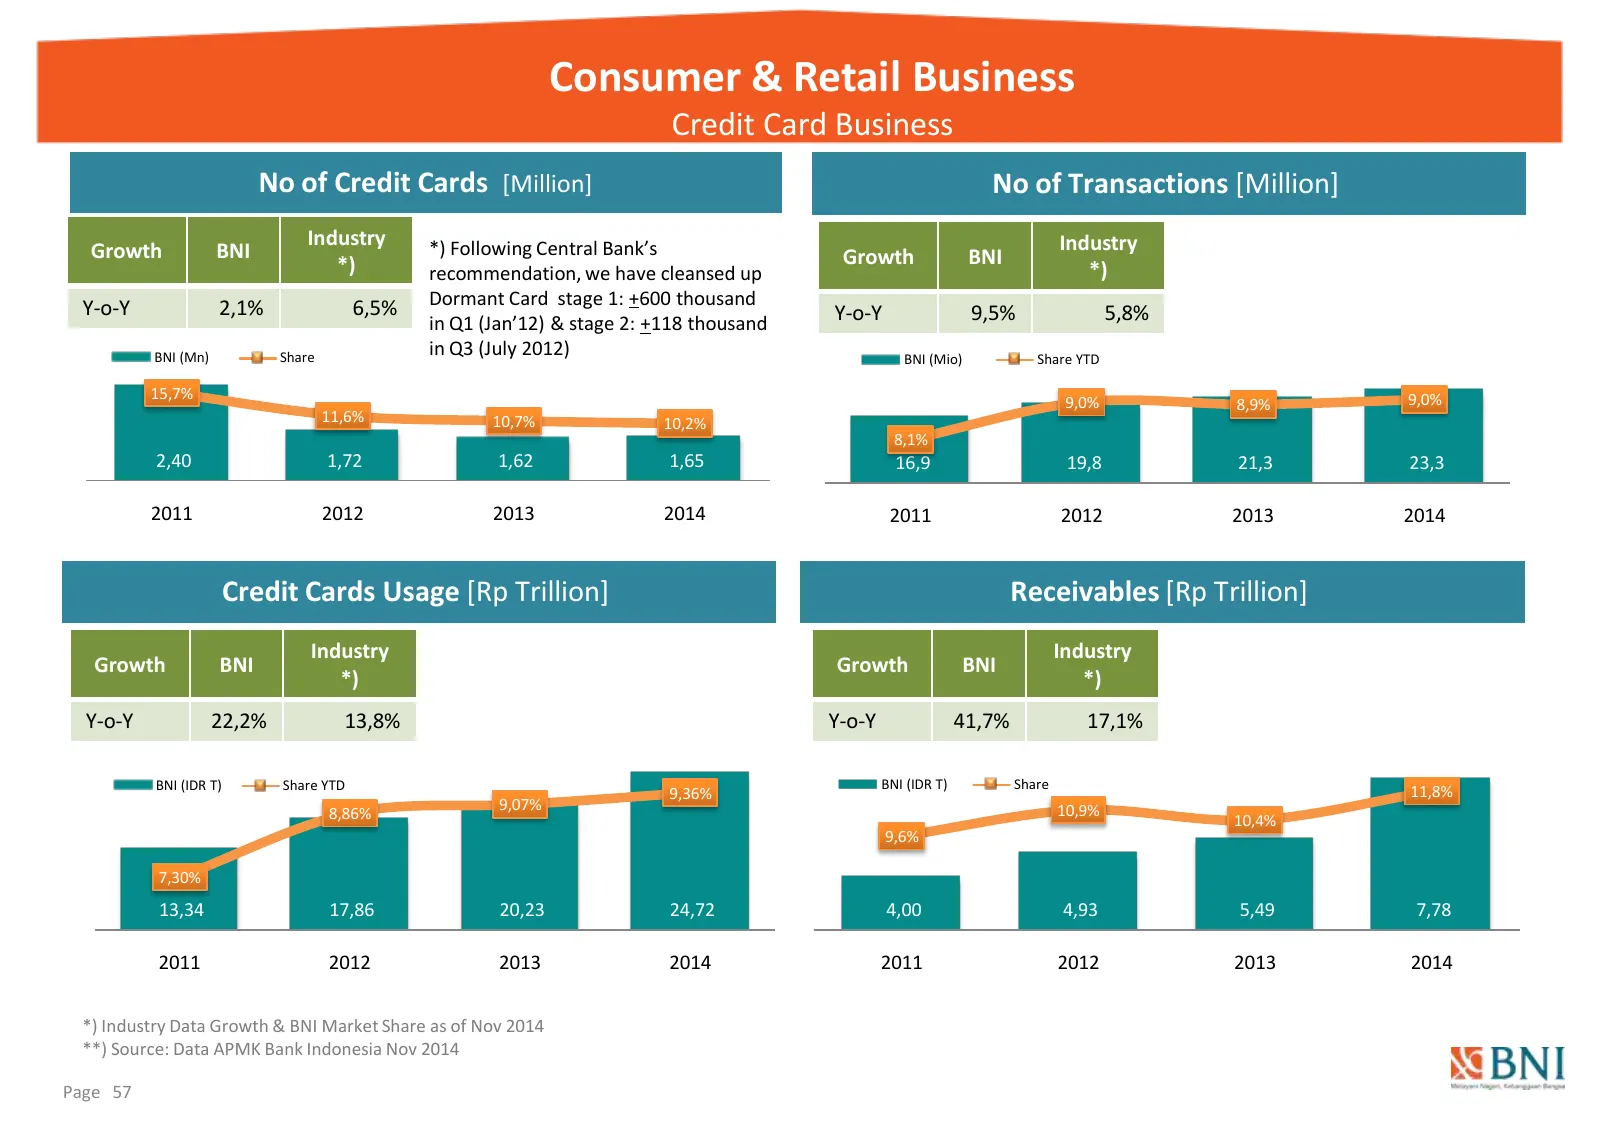
Consumer & Retail Business Credit Card Business No of Credit Cards [Million] No of Transactions [Million] Industry *) Following Central Bank’s Industry Growth BNI Growth BNI *) recommendation, we have cleansed up *) Y-o-Y 2,1% 6,5% Dormant Card stage 1: +600 thousand in Q1 (Jan’12) & stage 2: +118 t
Slide 58: Consumer & Retail Business: Debit Card Business
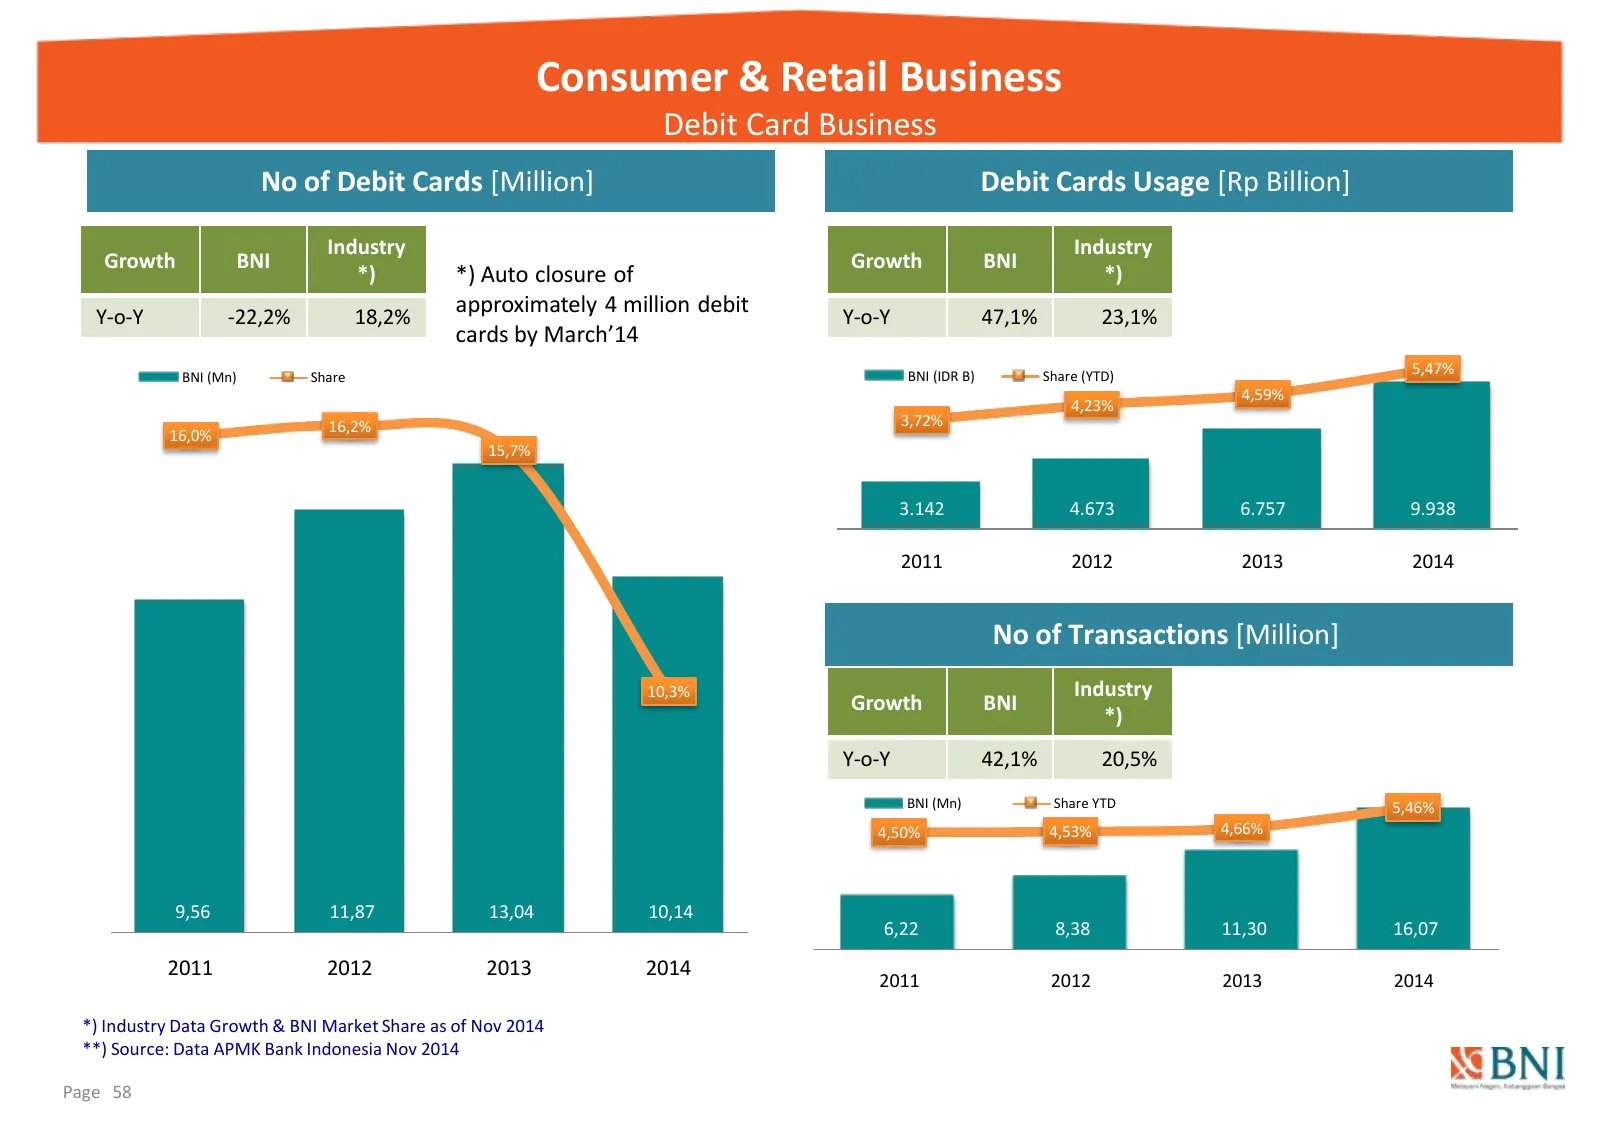
Consumer & Retail Business Debit Card Business No of Debit Cards [Million] Debit Cards Usage [Rp Billion] Industry Industry Growth BNI Growth BNI *) *) Auto closure of *) Y-o-Y -22,2% 18,2% approximately 4 million debit Y-o-Y 47,1% 23,1% cards by March’14 BNI (Mn) Share BNI (IDR B) Share (YTD) 5,47%
Slide 59: E-banking transactions
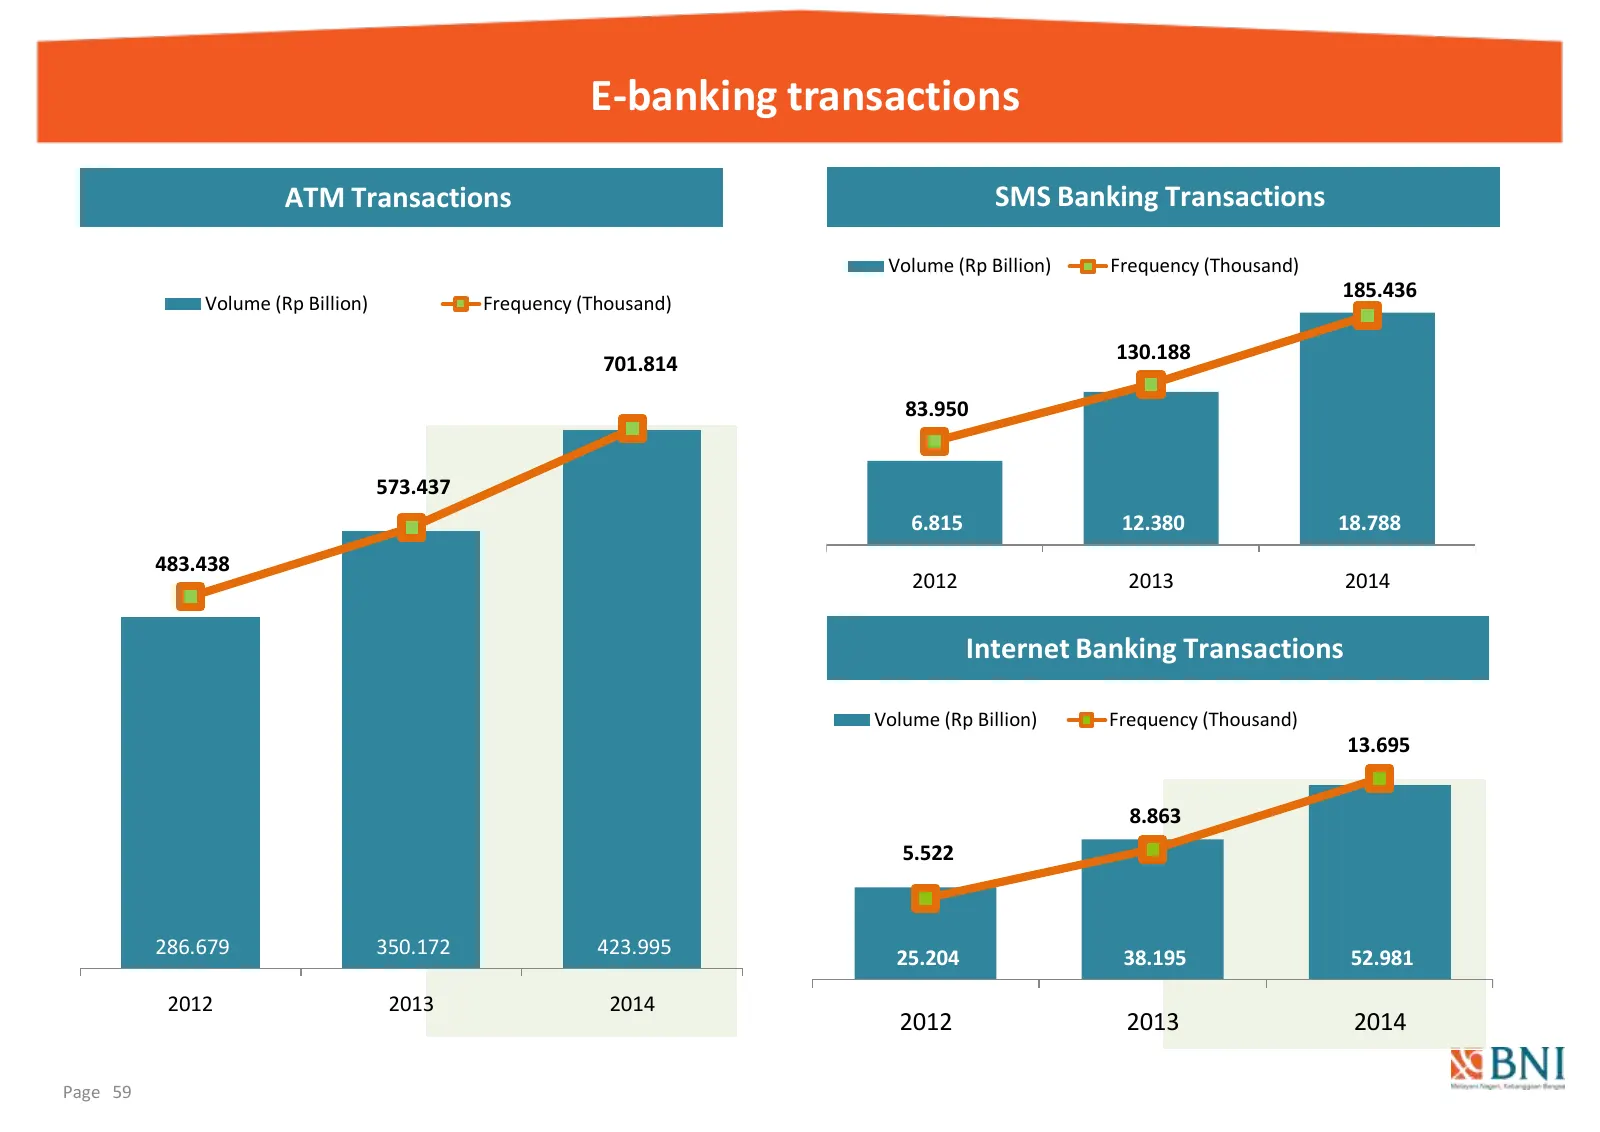
E-banking transactions ATM Transactions SMS Banking Transactions Volume (Rp Billion) Frequency (Thousand) 185.436 Volume (Rp Billion) Frequency (Thousand) 130.188 701.814 83.950 573.437 6.815 12.380 18.788 483.438 2012 2013 2014 Internet Banking Transactions Volume (Rp Billion) Frequency (Thousand)
Slide 60: Network & Services
Network & Services
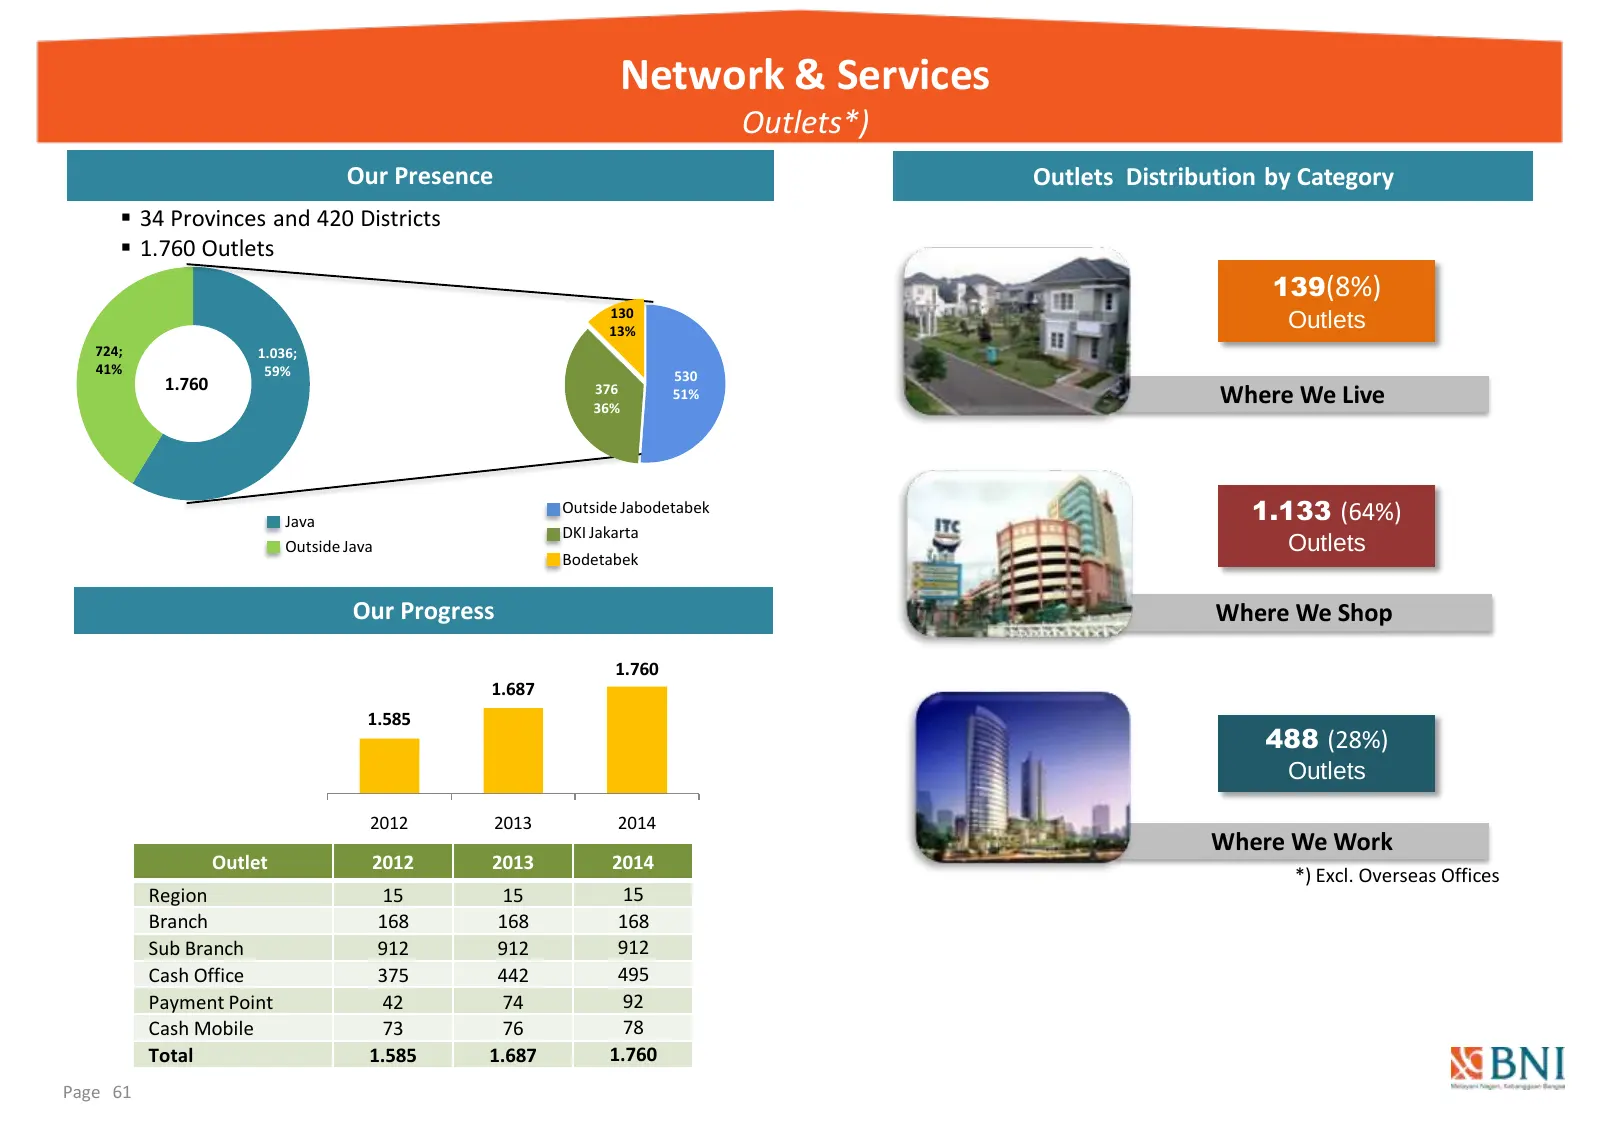
Slide 61: Network & Services: Outlets
Network & Services Outlets*) Our Presence Outlets Distribution by Category 34 Provinces and 420 Districts 1.760 Outlets 139(8%) 130 13% Outlets 724; 1.036; 41% 59% 530 1.760 376 36% 51% Where We Live Java Outside Jabodetabek 1.133 (64%) DKI Jakarta Outside Java Outlets Bodetabek Our Progress Whe
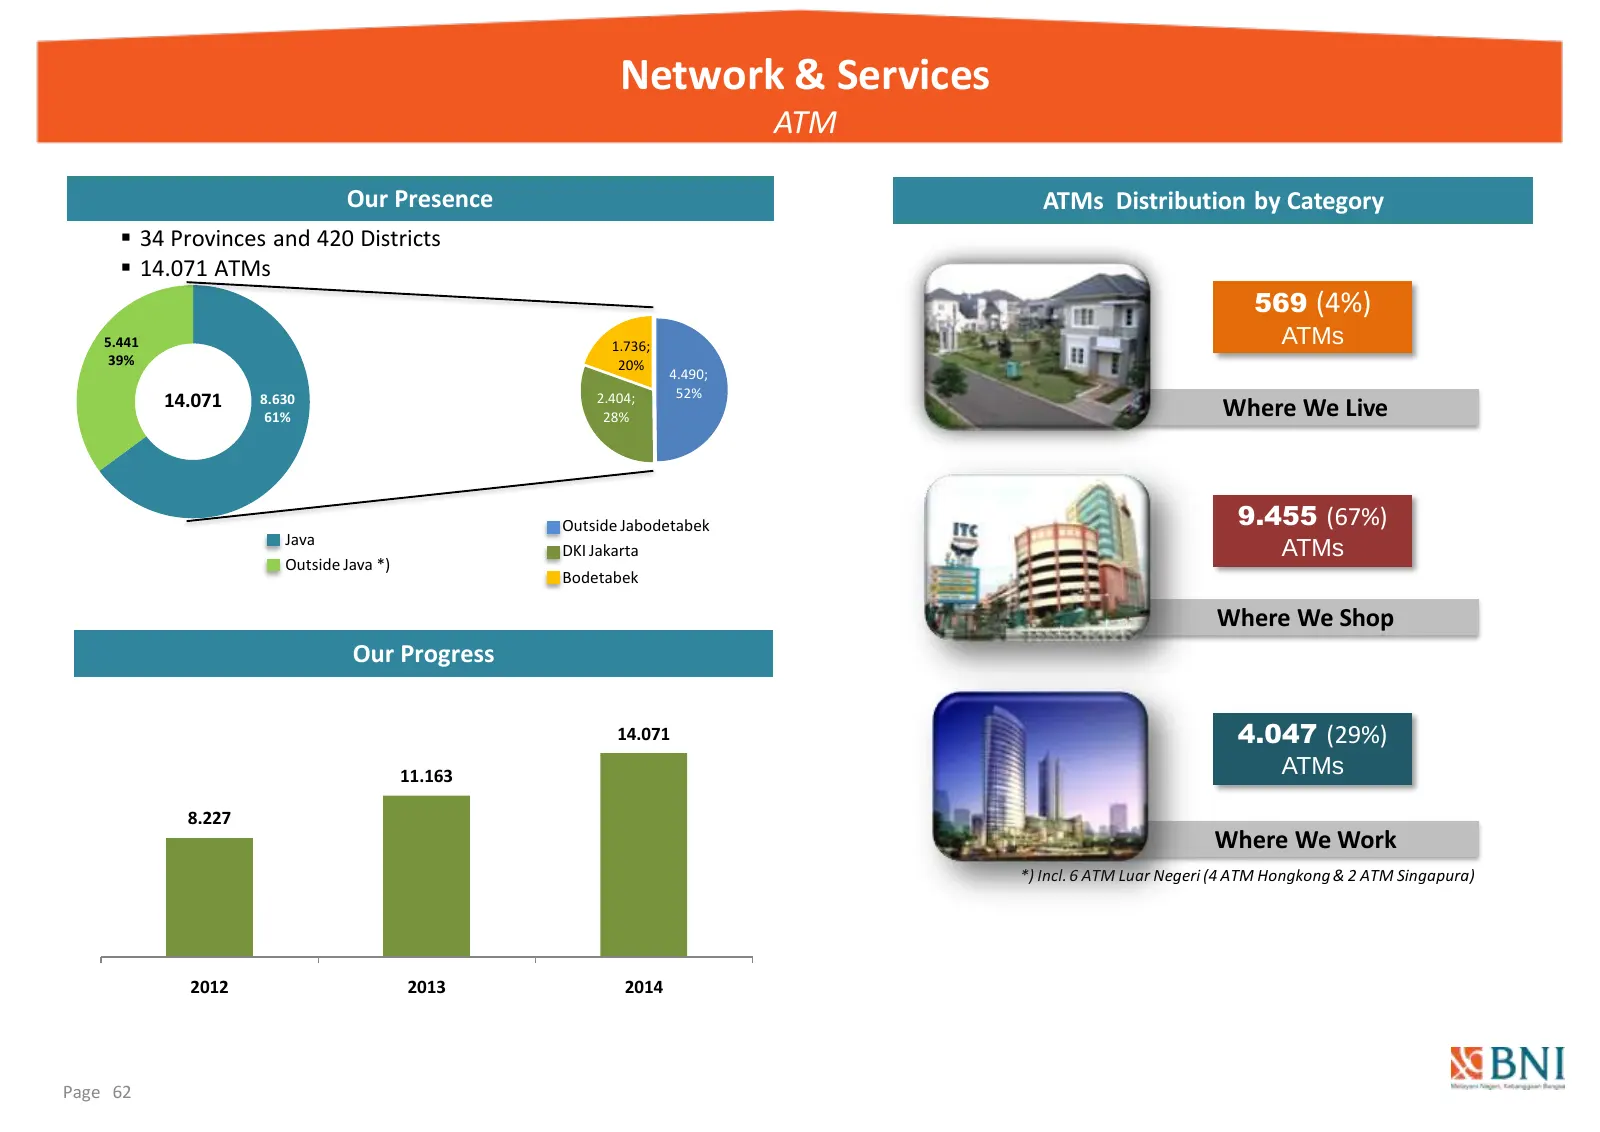
Slide 62: Network & Services: ATM
Network & Services ATM Our Presence ATMs Distribution by Category 34 Provinces and 420 Districts 14.071 ATMs 569 (4%) 5.441 1.736; ATMs 39% 20% 4.490; 52% 14.071 8.630 2.404; Where We Live 61% 28% Outside Jabodetabek 9.455 (67%) Java DKI Jakarta ATMs Outside Java *) Bodetabek Where We Shop Our P
Slide 63: Treasury & FI
Treasury & FI
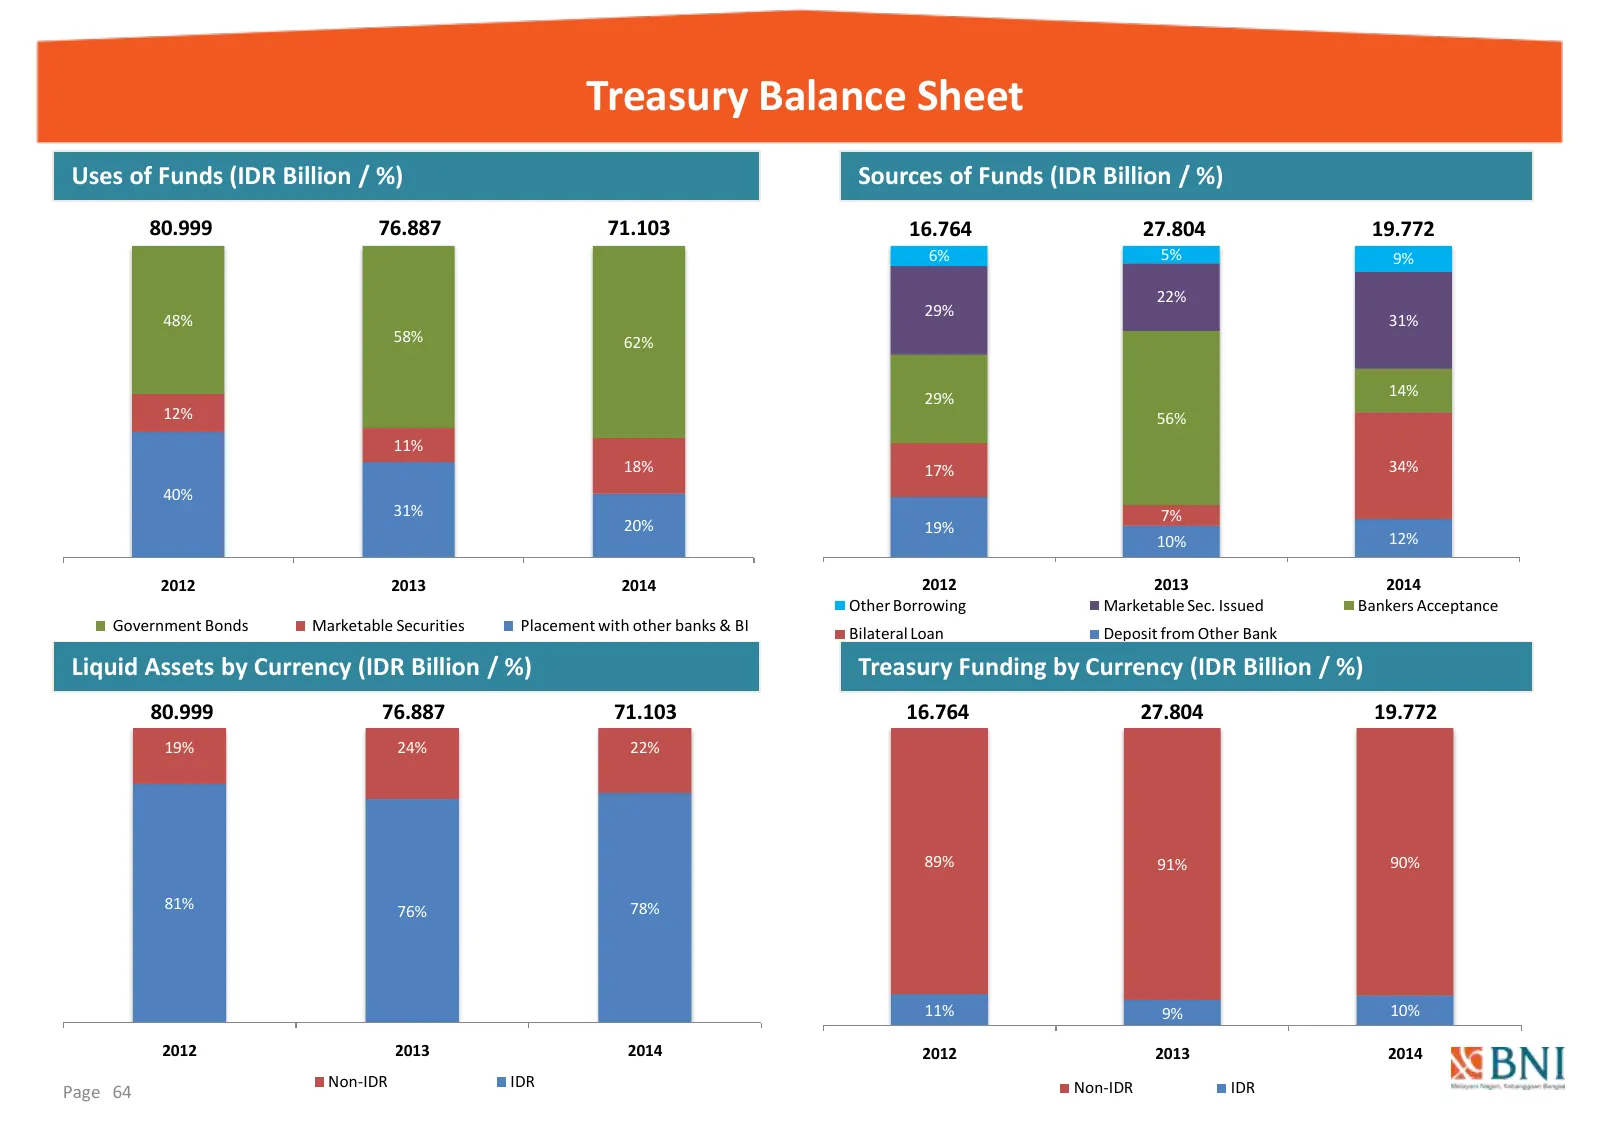
Slide 64: Treasury Balance Sheet
Treasury Balance Sheet Uses of Funds (IDR Billion / %) Sources of Funds (IDR Billion / %) 80.999 76.887 71.103 16.764 27.804 19.772 6% 5% 9% 22% 29% 48% 31% 58% 62% 29% 14% 12% 56% 11% 18% 17% 34% 40% 31% 7% 20% 19% 10% 12% 2012 2013 2014 2012 2013 2014 Other Borrowing Marketable Sec. Issued Bankers
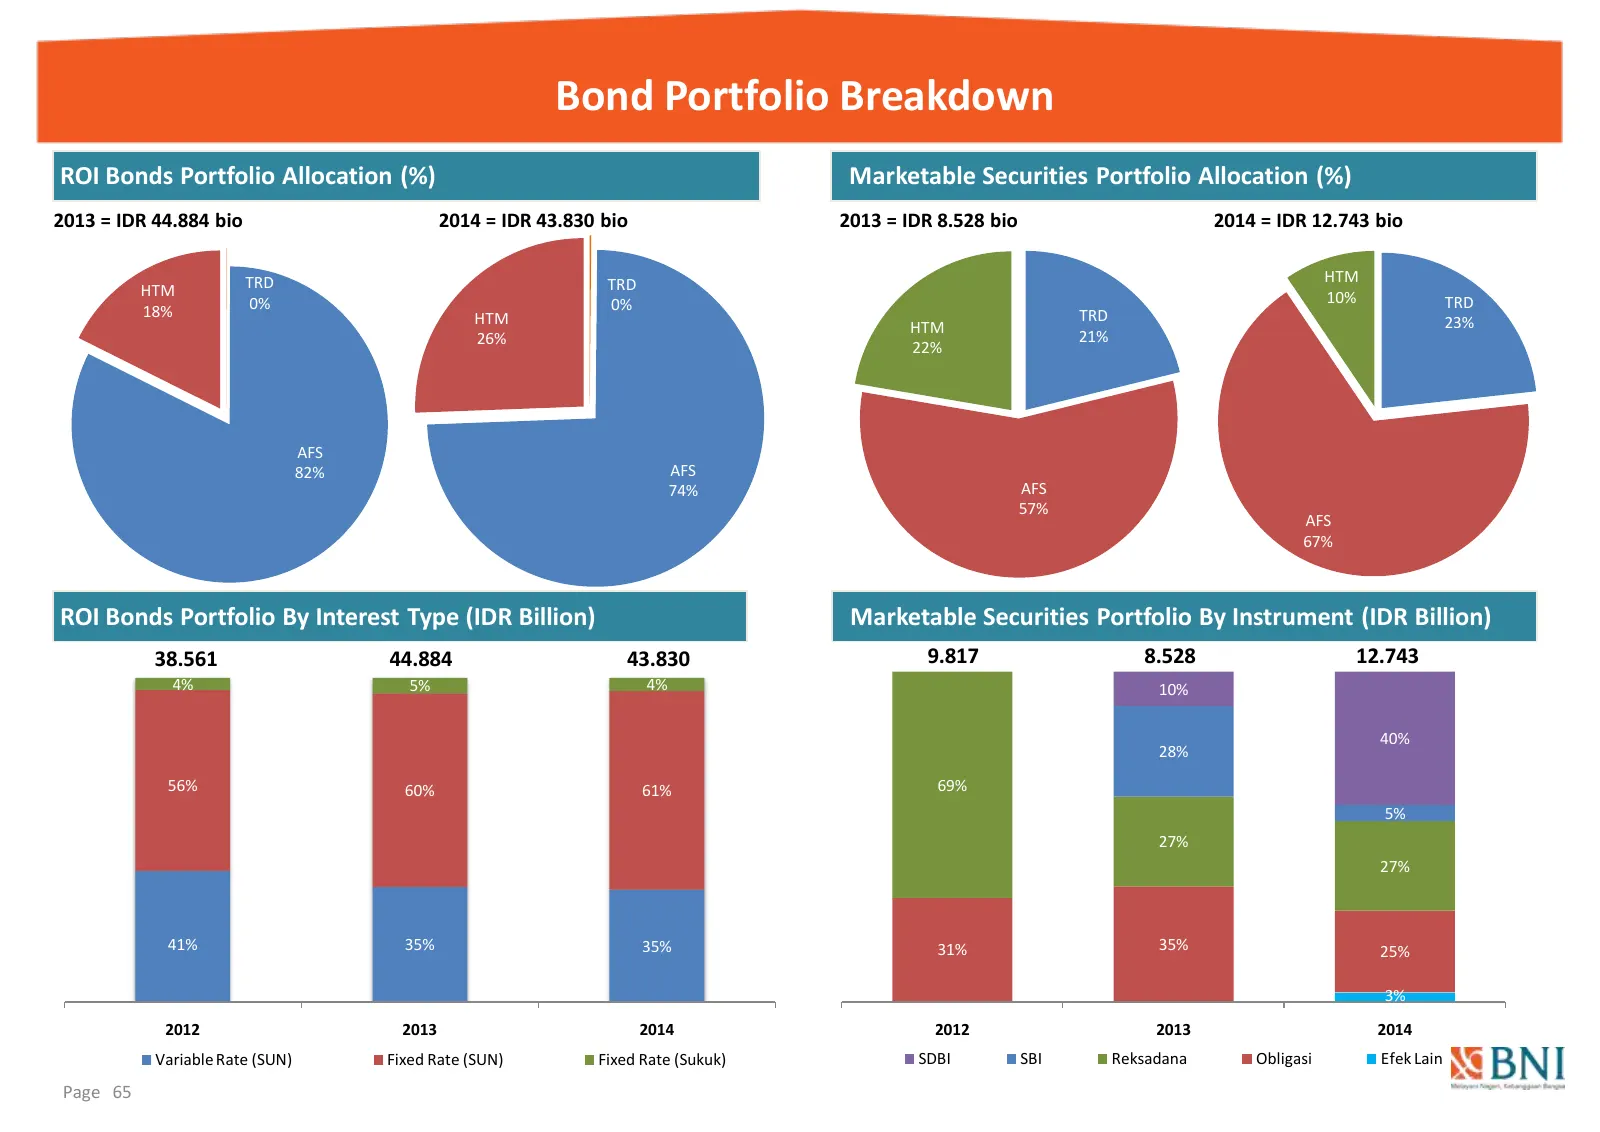
Slide 65: Bond Portfolio Breakdown
Bond Portfolio Breakdown ROI Bonds Portfolio Allocation (%) Marketable Securities Portfolio Allocation (%) 2013 = IDR 44.884 bio 2014 = IDR 43.830 bio 2013 = IDR 8.528 bio 2014 = IDR 12.743 bio TRD TRD HTM HTM 10% 0% 0% TRD 18% HTM TRD HTM 23% 26% 21% 22% AFS 82% AFS 74% AFS 57% AFS 67% ROI Bonds Po
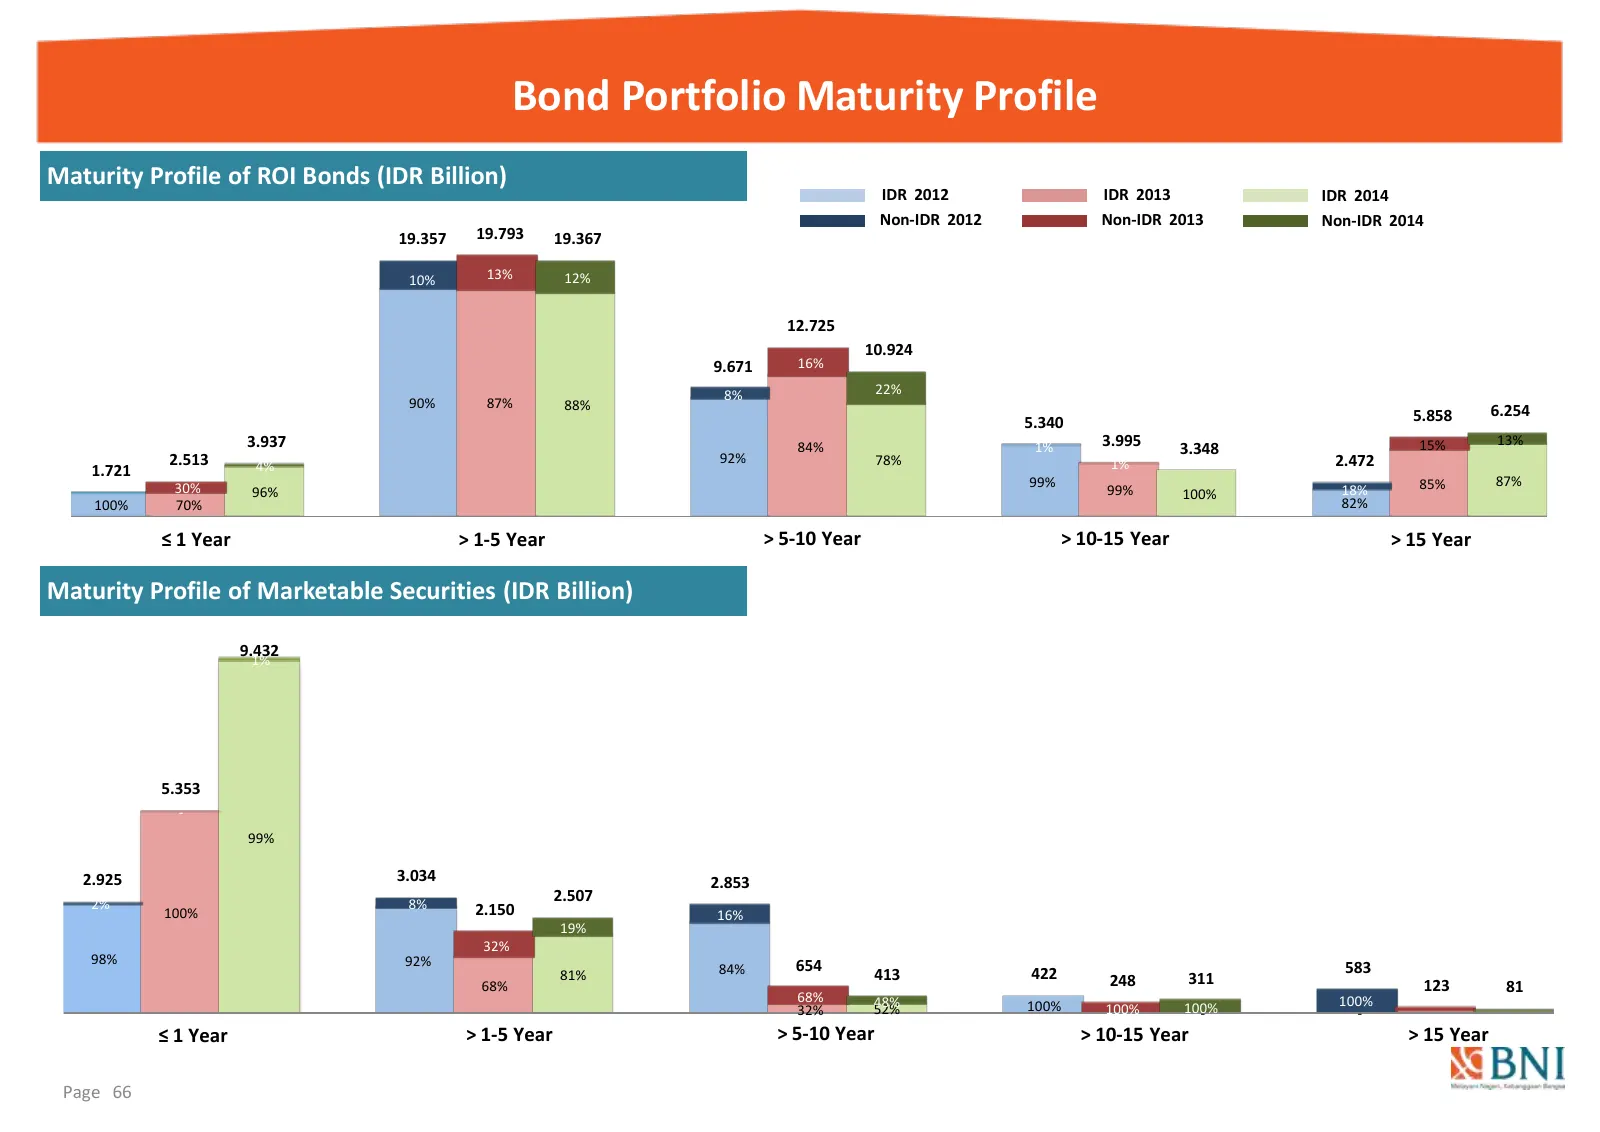
Slide 66: Bond Portfolio Maturity Profile
Bond Portfolio Maturity Profile Maturity Profile of ROI Bonds (IDR Billion) IDR 2012 IDR 2013 IDR 2014 Non-IDR 2012 Non-IDR 2013 Non-IDR 2014 19.357 19.793 19.367 10% 13% 12% 12.725 10.924 9.671 16% 8% 22% 90% 87% 88% 5.858 6.254 5.340 3.937 84% 1% 3.995 3.348 15% 13% 2.513 92% 78% 1% 2.472 1.721 4%
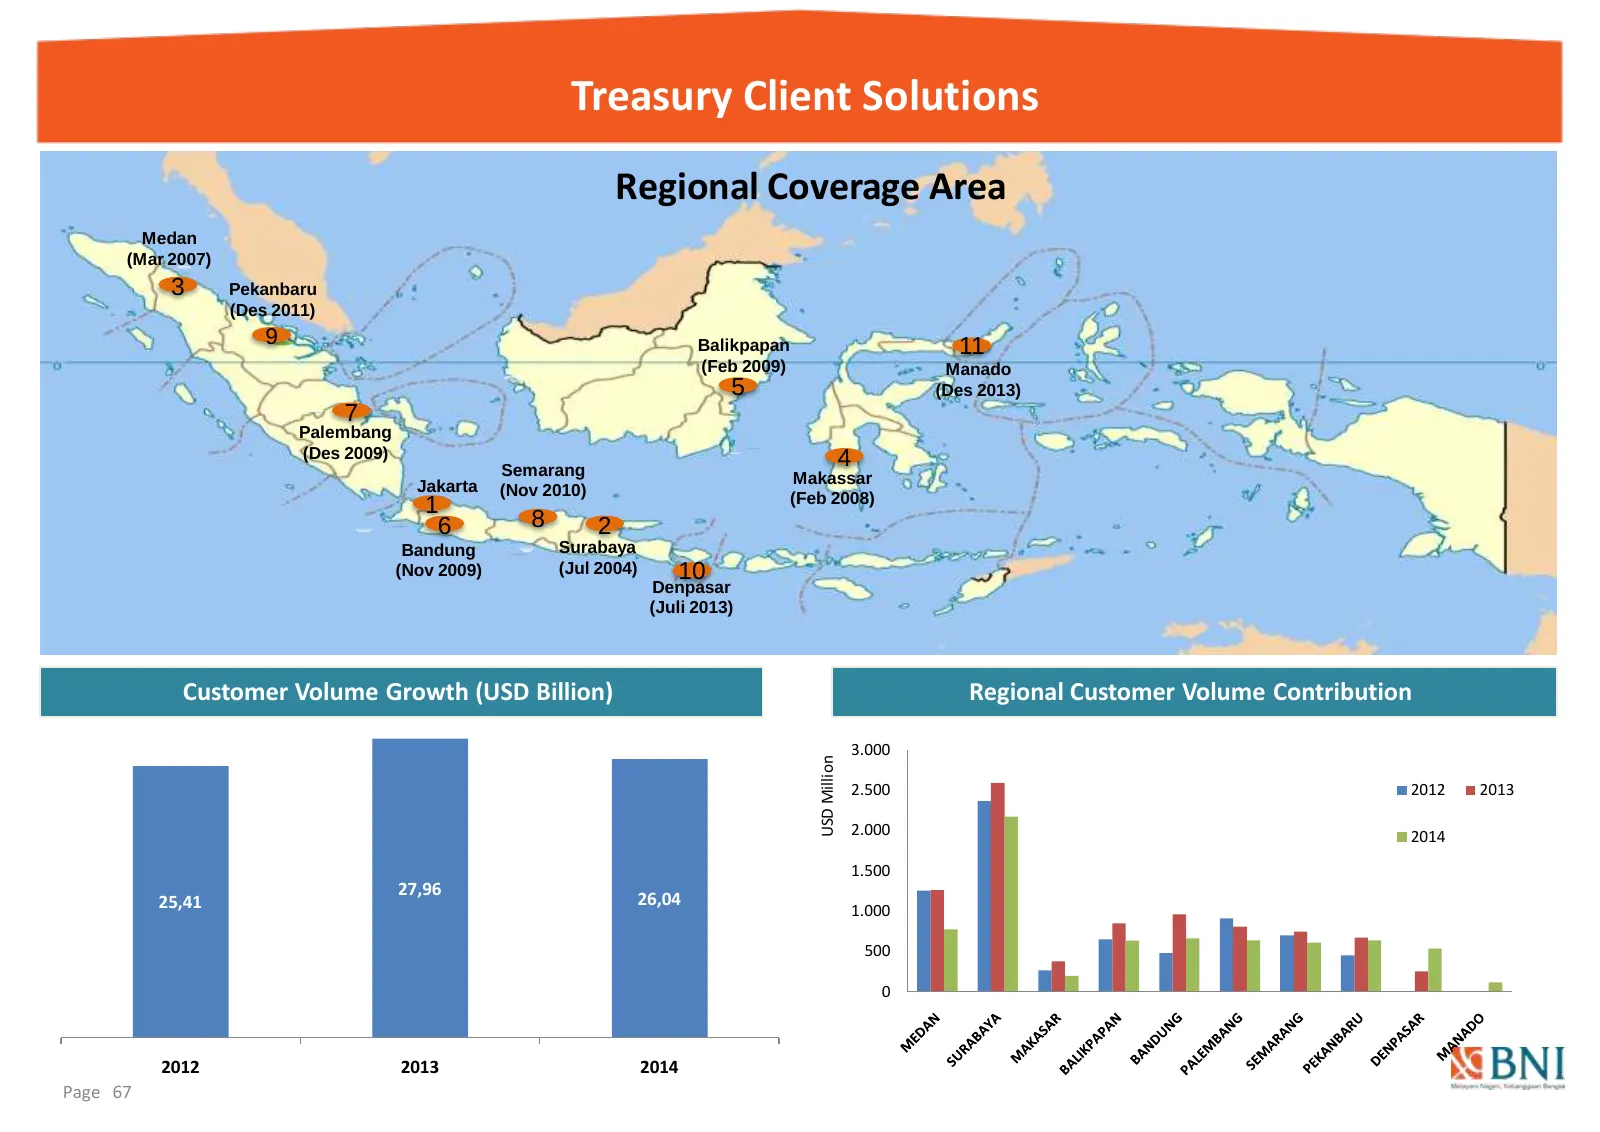
Slide 67: Treasury Client Solutions
Treasury Client Solutions Regional Coverage Area Medan Rp Mn (Mar 2007) 3 Pekanbaru (Des 2011) 9 Balikpapan 11 (Feb 2009) Manado 5 (Des 2013) 7 Palembang (Des 2009) 4 Semarang Makassar Jakarta (Nov 2010) (Feb 2008) 1 6 8 2 Bandung Surabaya (Nov 2009) (Jul 2004) 10 Denpasar (Juli 2013) Customer Volum
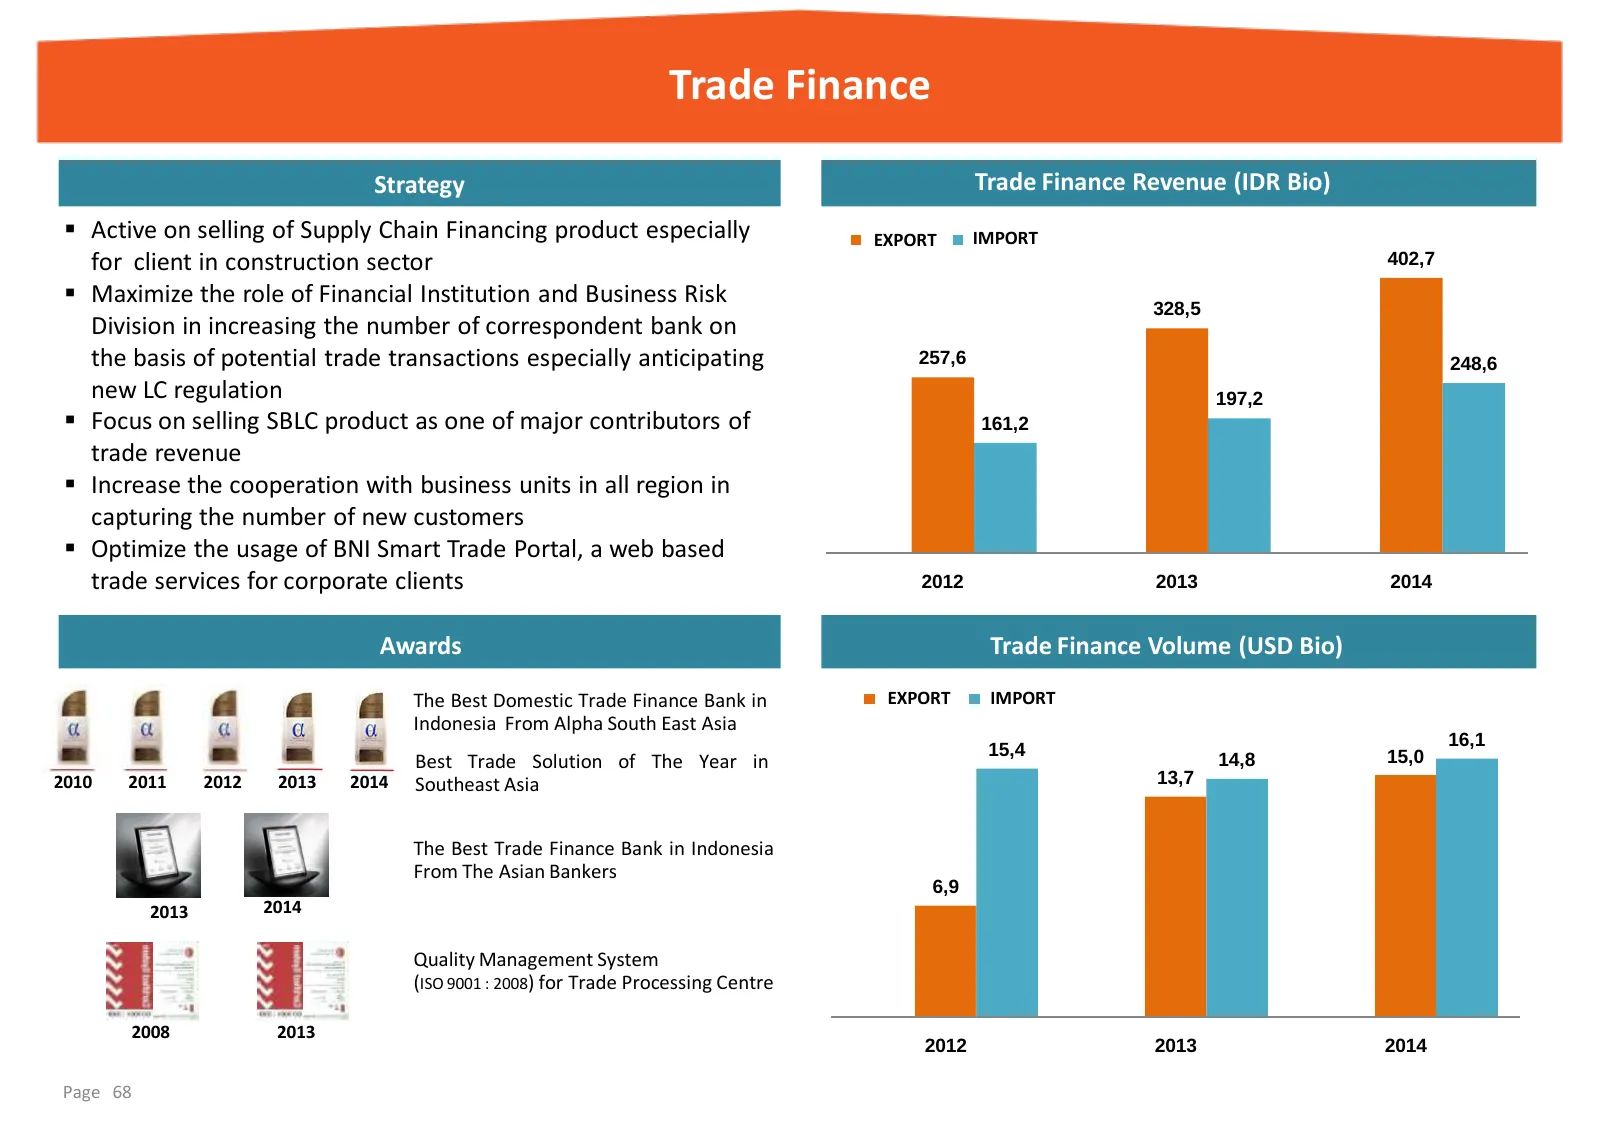
Slide 68: Trade Finance
Trade Finance Strategy Trade Finance Revenue (IDR Bio) Active on selling of Supply Chain Financing product especially EKSPOR EXPORT IMPORT IMPOR for client in construction sector 402,7 Maximize the role of Financial Institution and Business Risk 328,5 Division in increasing the number of corresp
Slide 69: Remittance
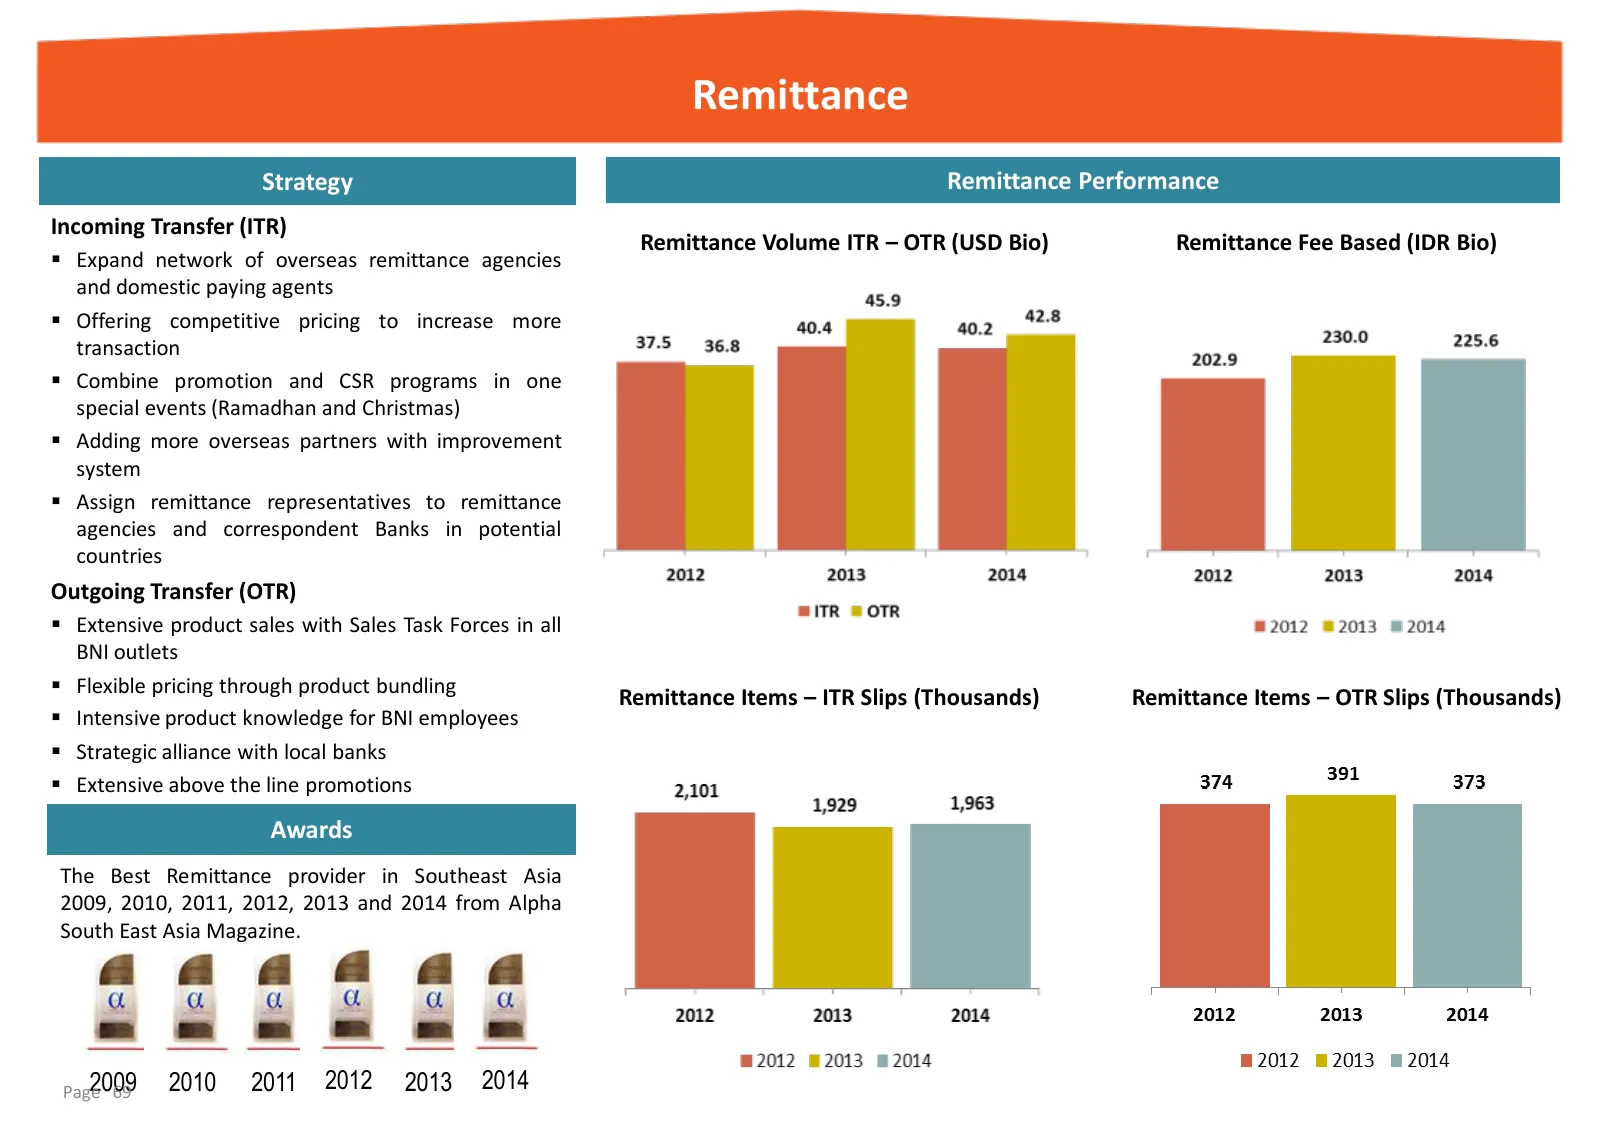
Remittance Strategy Remittance Performance Incoming Transfer (ITR) Remittance Volume ITR – OTR (USD Bio) Remittance Fee Based (IDR Bio) Expand network of overseas remittance agencies and domestic paying agents Offering competitive pricing to increase more transaction Combine promotion and CSR
Slide 70: Overseas Branches
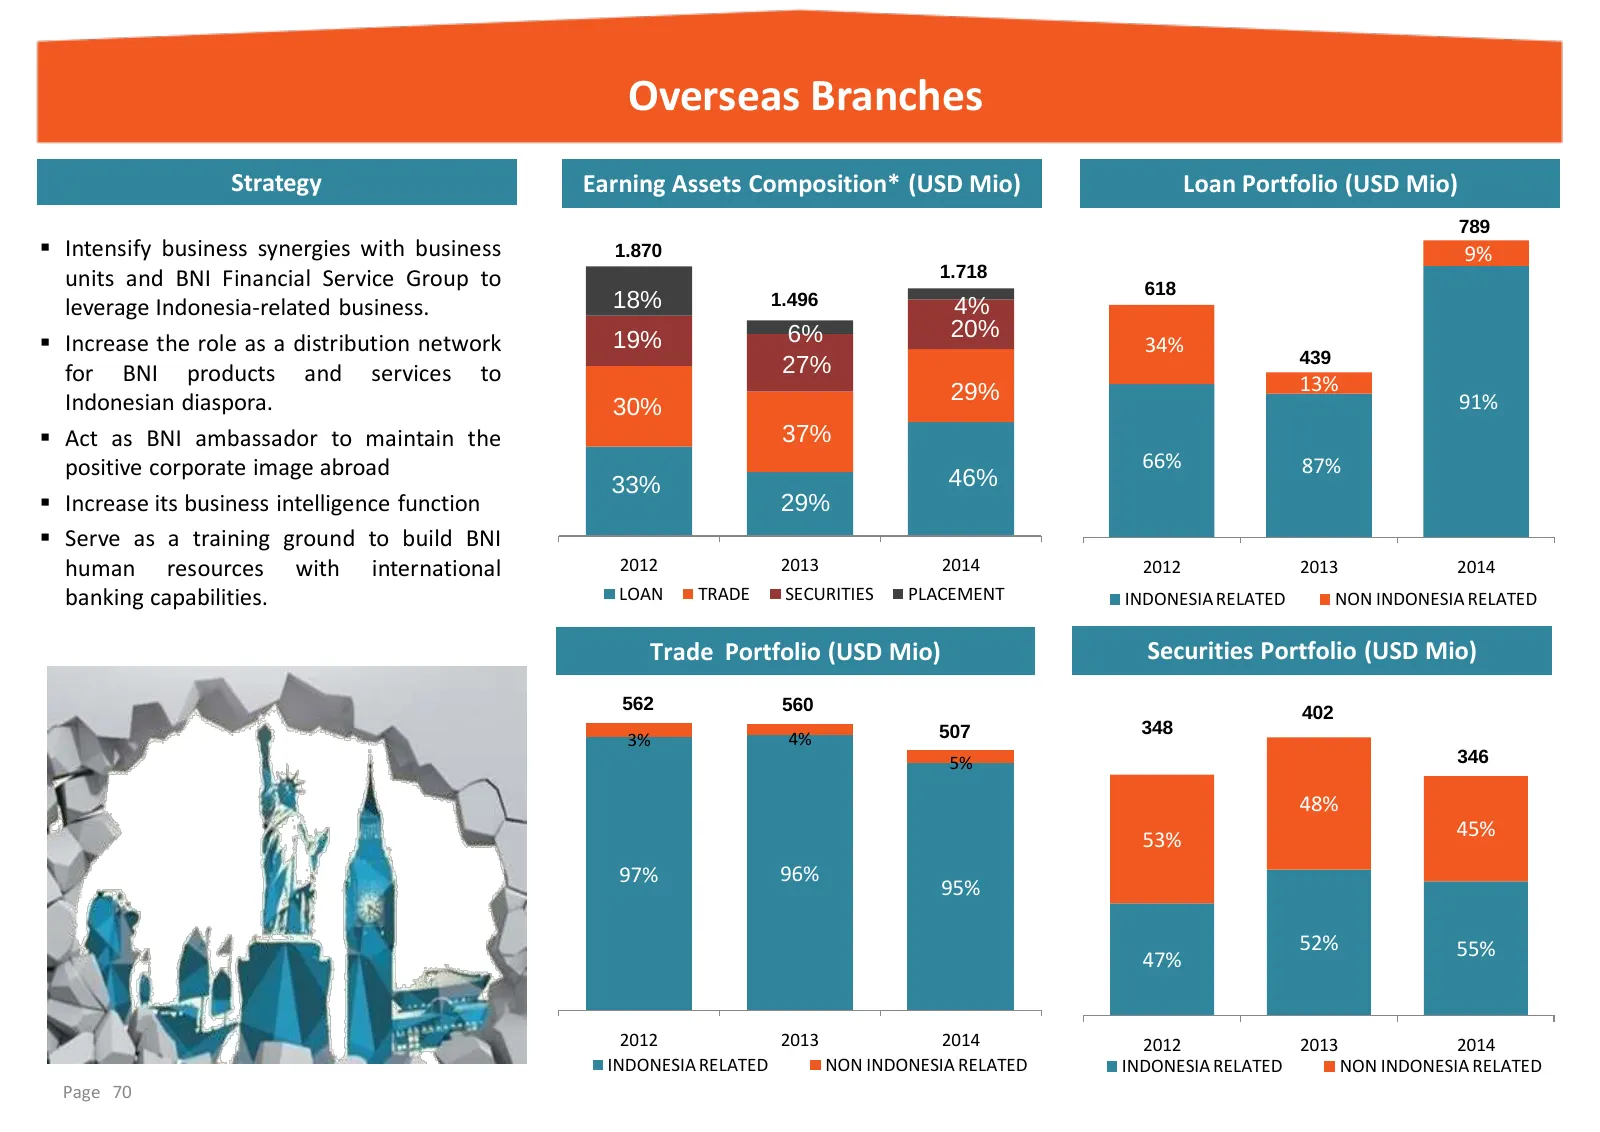
Overseas Branches Strategy Earning Assets Composition* (USD Mio) Loan Portfolio (USD Mio) 789 Intensify business synergies with business 1.870 9% units and BNI Financial Service Group to 1.718 618 leverage Indonesia-related business. 18% 1.496 4% 6% 20% Increase the role as a distribution networ
Slide 71: Financial Institutions
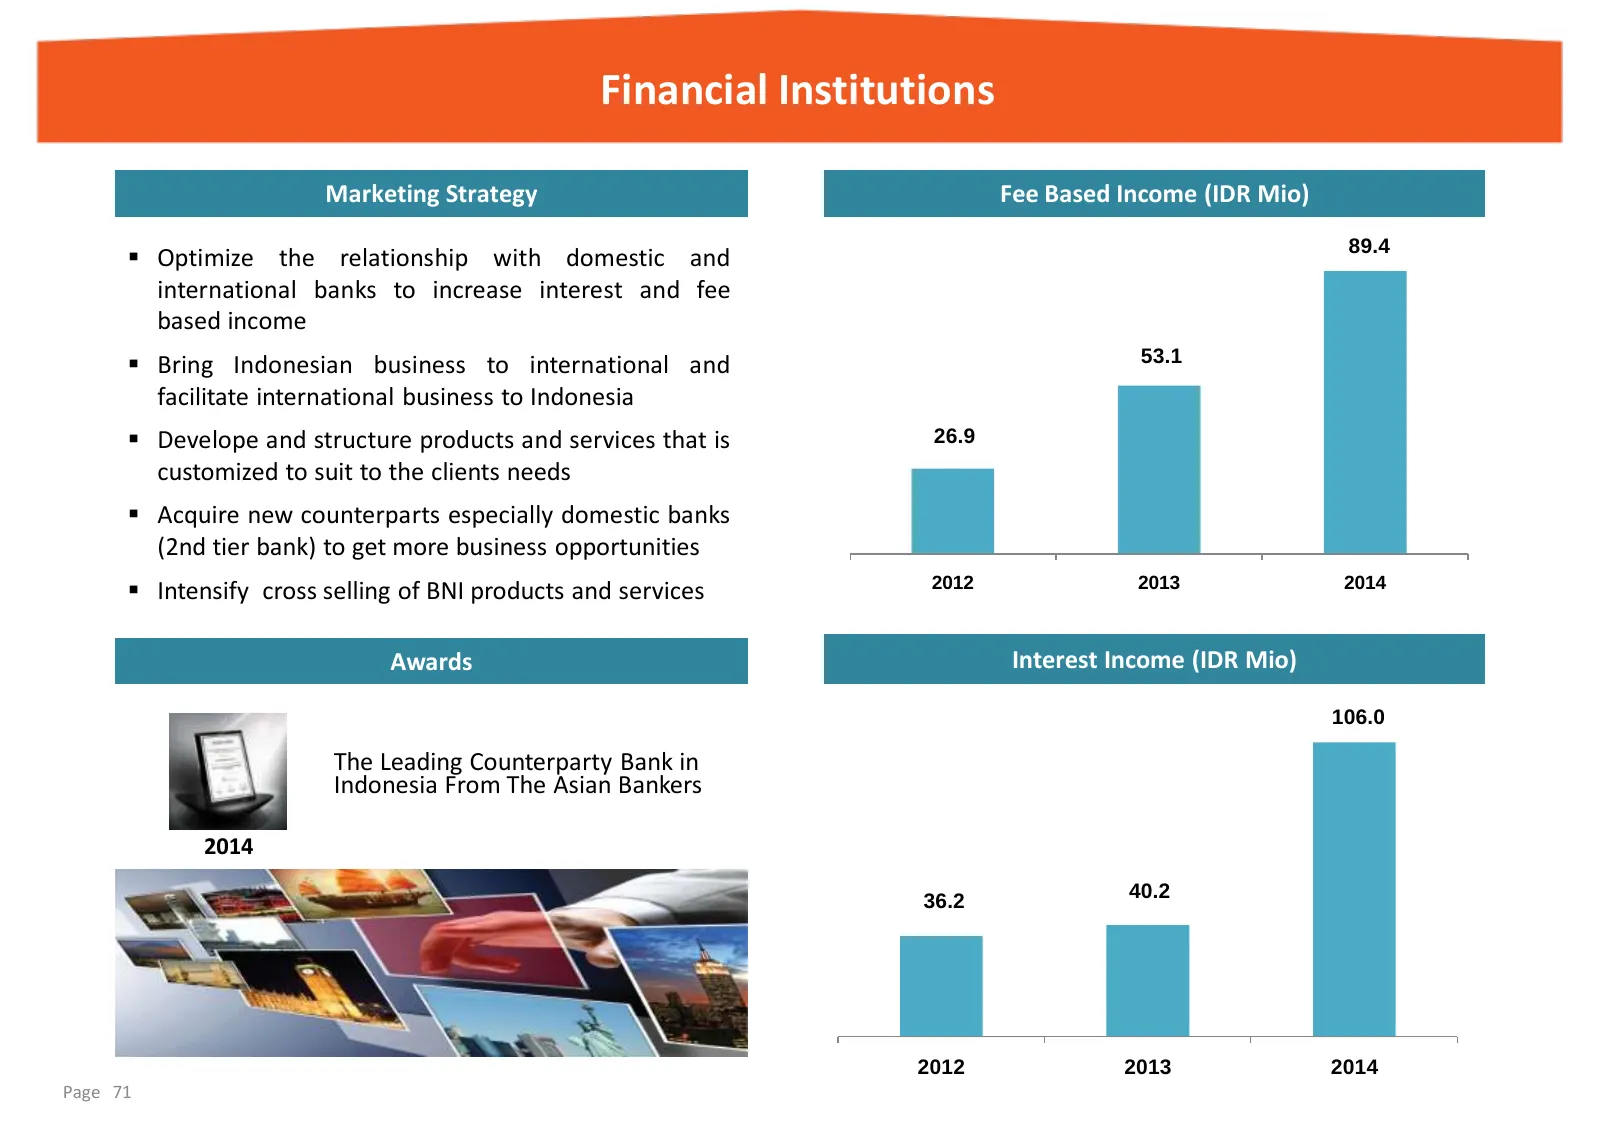
Financial Institutions Marketing Strategy Fee Based Income (IDR Mio) 89.4 Optimize the relationship with domestic and international banks to increase interest and fee based income Bring Indonesian business to international and 53.1 facilitate international business to Indonesia Develope and st
Slide 72: Subsidiaries
Subsidiaries
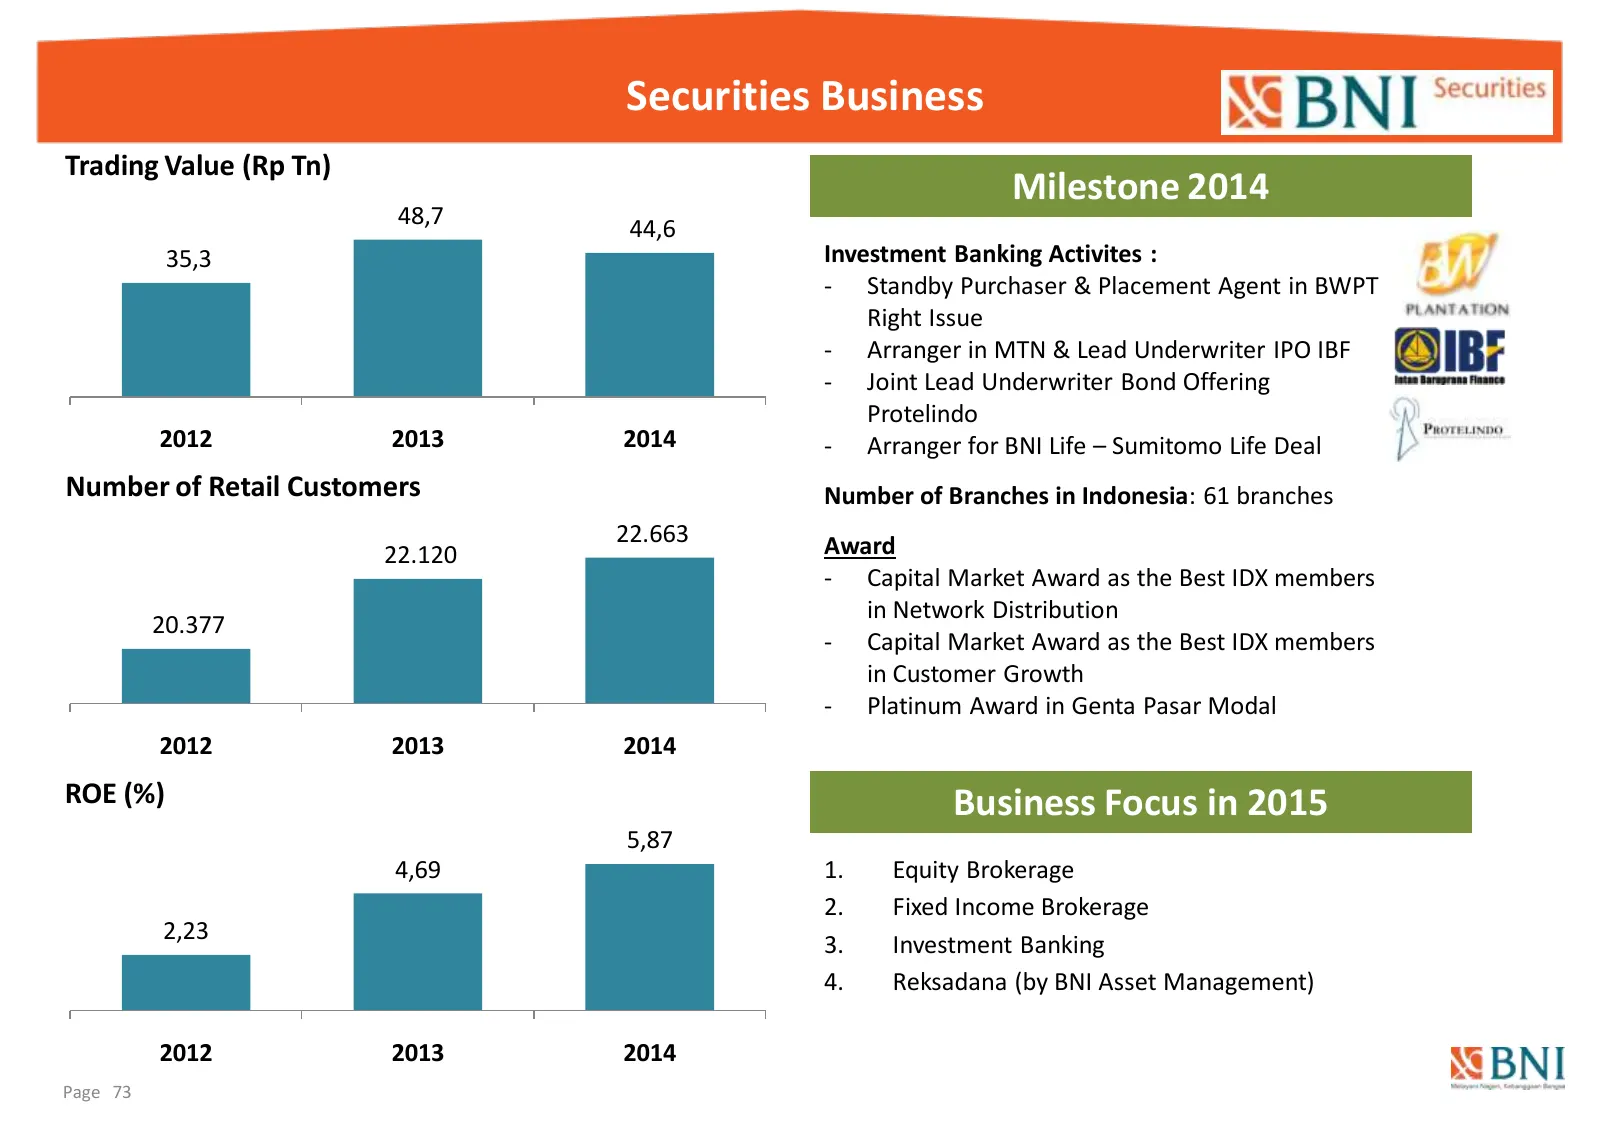
Slide 73: Securities Business
Securities Business Trading Value (Rp Tn) Milestone 2014 48,7 44,6 35,3 Investment Banking Activites : - Standby Purchaser & Placement Agent in BWPT Right Issue - Arranger in MTN & Lead Underwriter IPO IBF - Joint Lead Underwriter Bond Offering Protelindo 2012 2013 2014 - Arranger for BNI Life – Sum
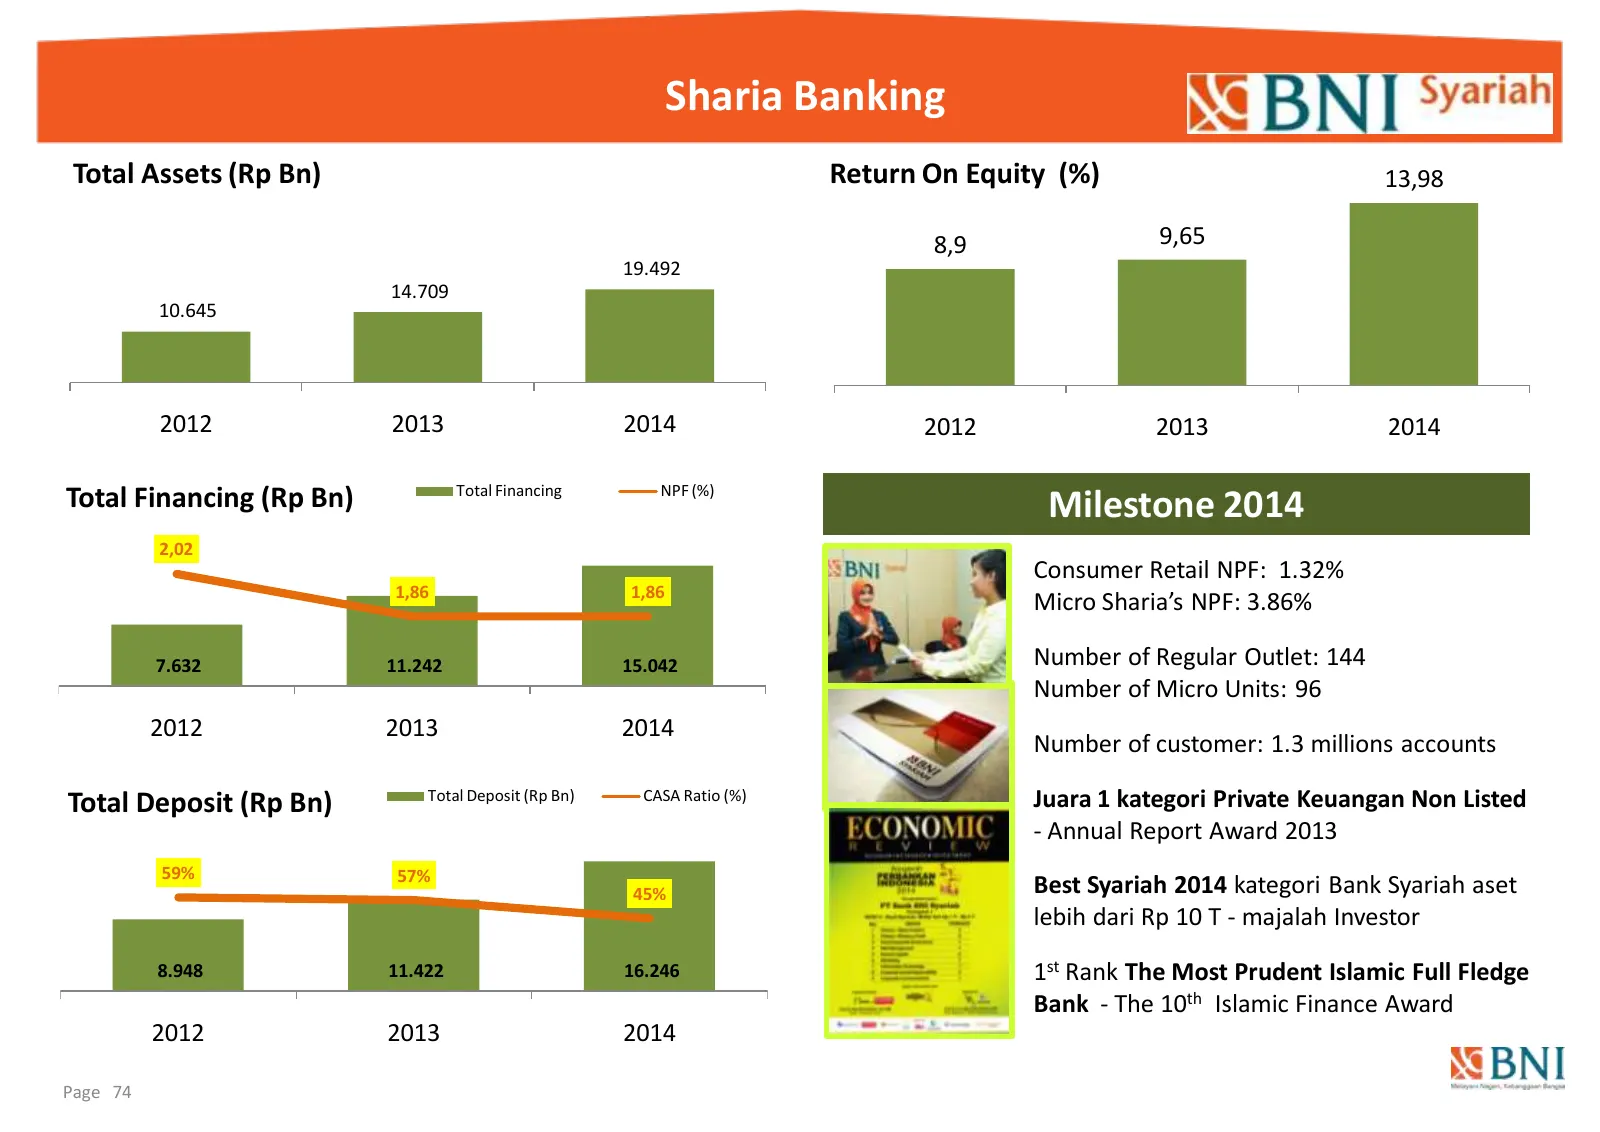
Slide 74: Sharia Banking
Sharia Banking Total Assets (Rp Bn) Return On Equity (%) 13,98 8,9 9,65 19.492 14.709 10.645 2012 2013 2014 2012 2013 2014 Total Financing NPF (%) Total Financing (Rp Bn) Milestone 2014 2,02 Consumer Retail NPF: 1.32% 1,86 1,86 Micro Sharia’s NPF: 3.86% 7.632 11.242 15.042 Number of Regular Ou
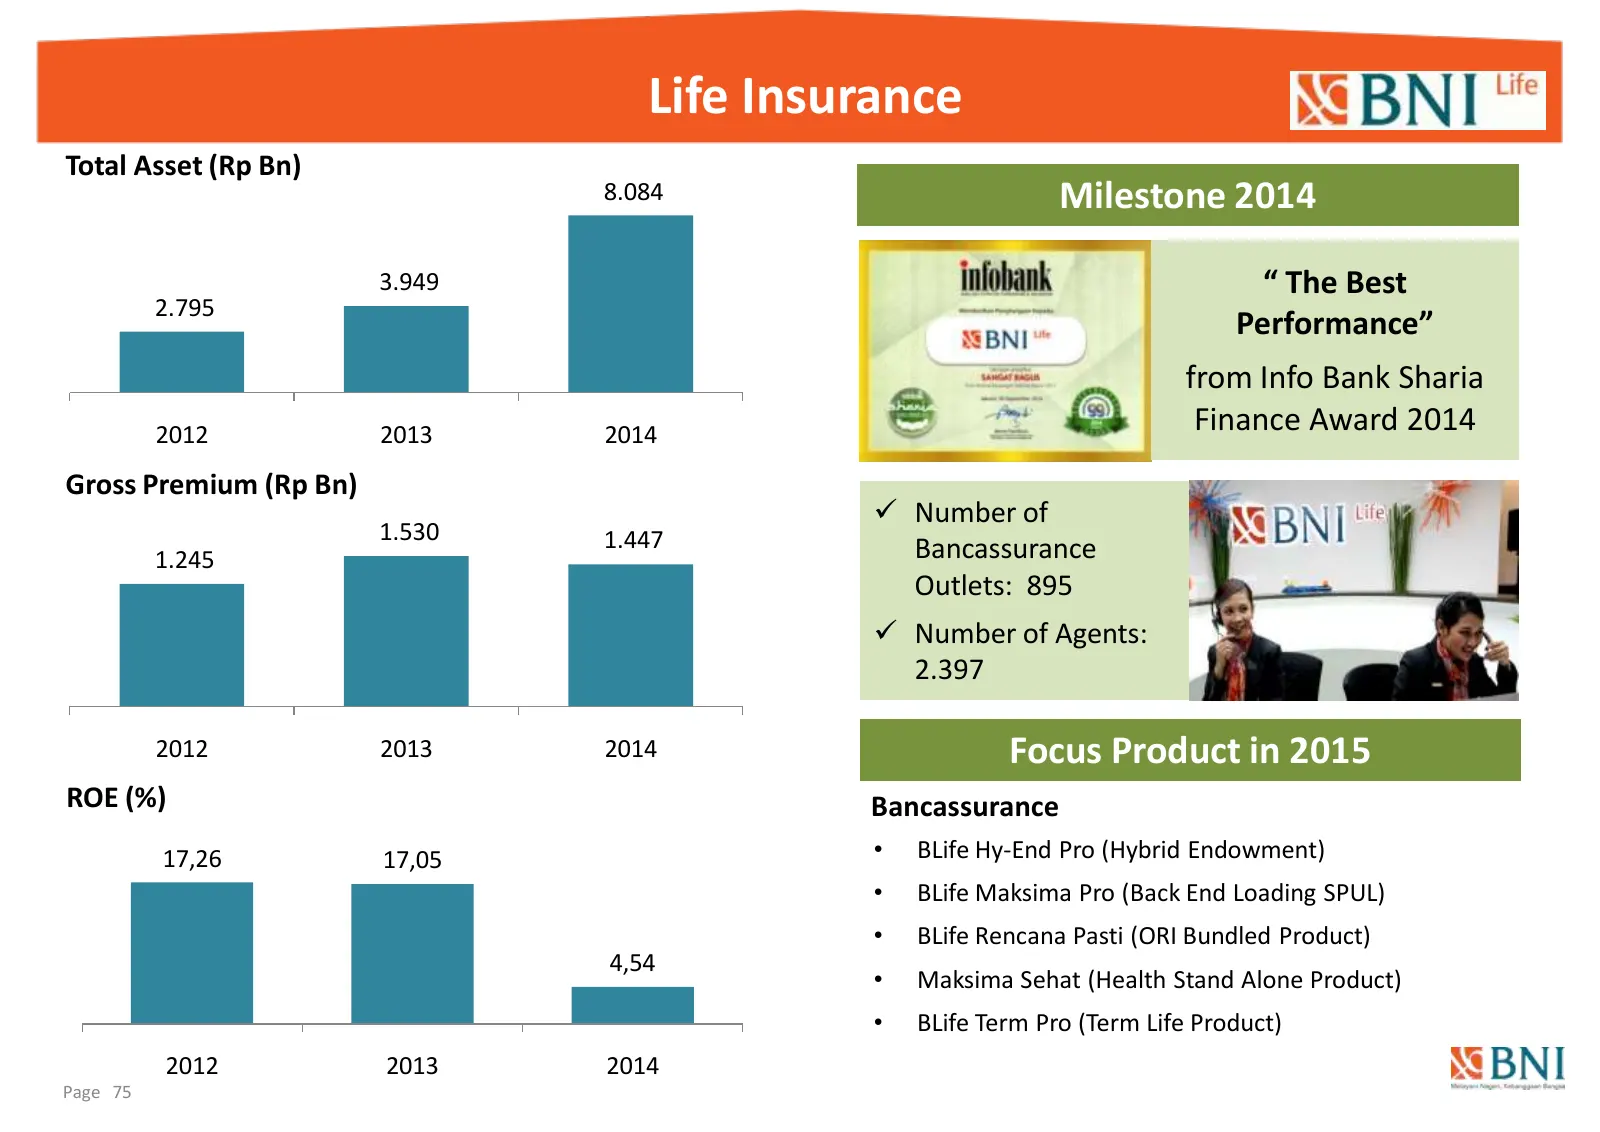
Slide 75: Life Insurance
Life Insurance Total Asset (Rp Bn) 8.084 Milestone 2014 3.949 “ The Best 2.795 Performance” from Info Bank Sharia 2012 2013 2014 Finance Award 2014 Gross Premium (Rp Bn) Number of 1.530 1.447 1.245 Bancassurance Outlets: 895 Number of Agents: 2.397 2012 2013 2014 Focus Product in 2015 ROE (%) Ba
Slide 76: Thank you
Thank you Disclaimer: This report has been prepared by PT Bank Negara Indonesia (Persero) Tbk (Bank BNI) independently and is circulated for the purpose of general information only, It is not intended to the specific person who may receive this report, The information in this report has been obtaine
Source: Internet Archive copy of bni.co.id
More decks from PT Bank Negara Indonesia (Persero) Tbk Class B
 Q1 2025 Earnings Presentation68 slides · Apr 28, 2025
 FY2024 Earnings Presentation71 slides · Jan 22, 2025
 Q1 2024 Earnings Presentation72 slides · Apr 29, 2024
 Q3 2023 Earnings Presentation74 slides · Oct 31, 2023
 Q1 2023 Earnings Presentation69 slides · May 18, 2023
 FY2022 Earnings Presentation69 slides · Jan 24, 2023