Sundance Energy — Sundance Energy Australia — Investor Presentation (March 2017)
22 slides from Sundance Energy's investor presentation, Mar 23, 2017
Slide 1: Disclaimers
Disclaimers This presentation has been prepared by Sundance Energy Australia Limited (ABN 76 112 202 883). Summary information This presentation contains summary information about Sundance and its activities current as at 8 March 2017 ("Information"). The Information in this presentation is subject
Slide 2: Executive summary: Company Overview
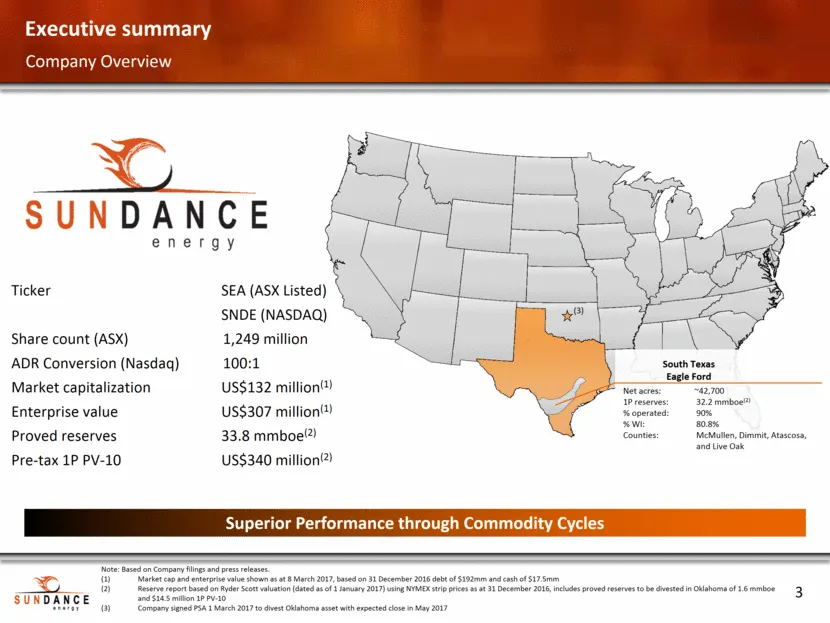
(3) Executive summary Superior Performance through Commodity Cycles Net acres: ~42,700 1P reserves: 32.2 mmboe(2) % operated: 90% % WI: 80.8% Counties: McMullen, Dimmit, Atascosa, and Live Oak South Texas Eagle Ford Ticker SEA (ASX Listed) SNDE (NASDAQ) Share count (ASX) 1,249 million ADR Conversion
Slide 3: Key investment highlights
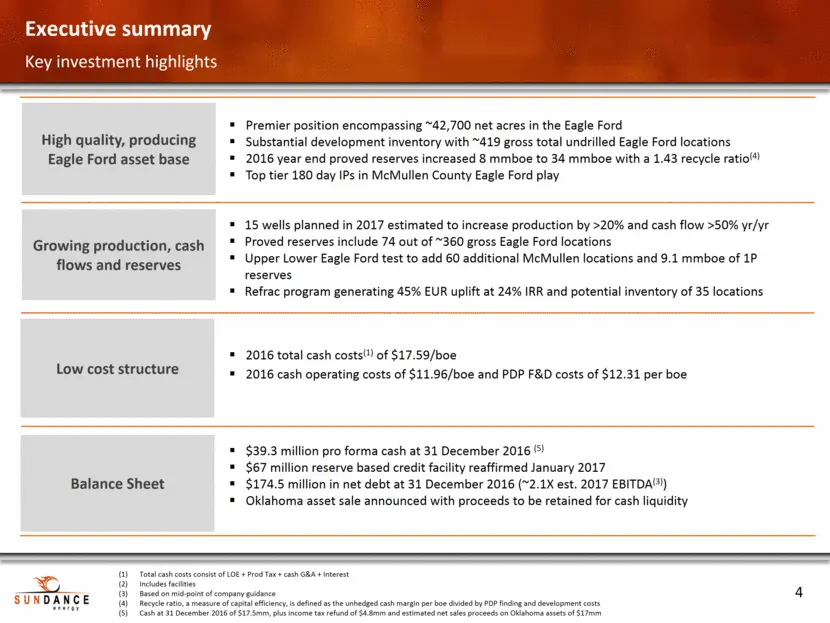
Key investment highlights Executive summary Total cash costs consist of LOE + Prod Tax + cash G&A + Interest Includes facilities Based on mid-point of company guidance Recycle ratio, a measure of capital efficiency, is defined as the unhedged cash margin per boe divided by PDP finding and developmen
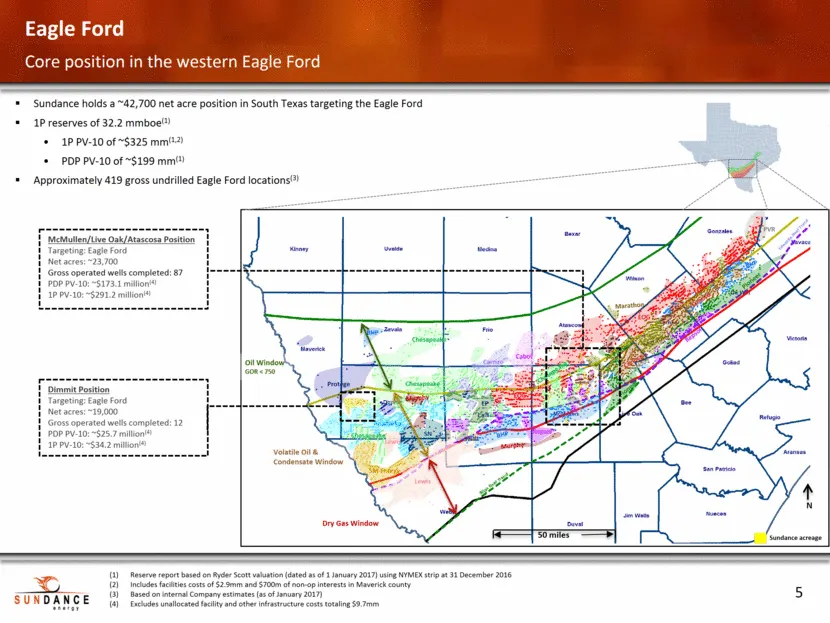
Slide 4: Sundance holds ~42,700 net acre position in South Texas Eagle Ford
EOG EOG EOG Protege Chesapeake Murphy Anadarko SM-Energy Pioneer Pioneer Pioneer Conoco Conoco Cabot Chesapeake Chesapeake Repsol Repsol Marathon BHP BHP Chesapeake Marathon N Murphy Swift 50 miles Oil Window GOR < 750 Volatile Oil & Condensate Window Dry Gas Window Carrizo PVR Sundance acreage Lewi
Slide 5: Eagle Ford Inventory Analysis
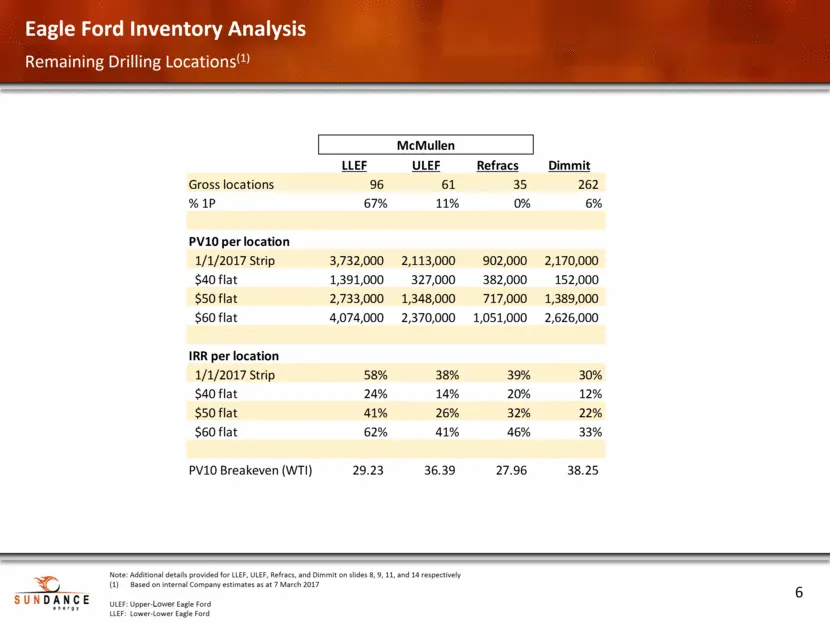
Eagle Ford Inventory Analysis Remaining Drilling Locations(1) Note: Additional details provided for LLEF, ULEF, Refracs, and Dimmit on slides 8, 9, 11, and 14 respectively Based on internal Company estimates as at 7 March 2017 ULEF: Upper-Lower Eagle Ford LLEF: Lower-Lower Eagle Ford LLEF ULEF Refra
Slide 6: Asset Overview: Premier Western Eagle Ford Position
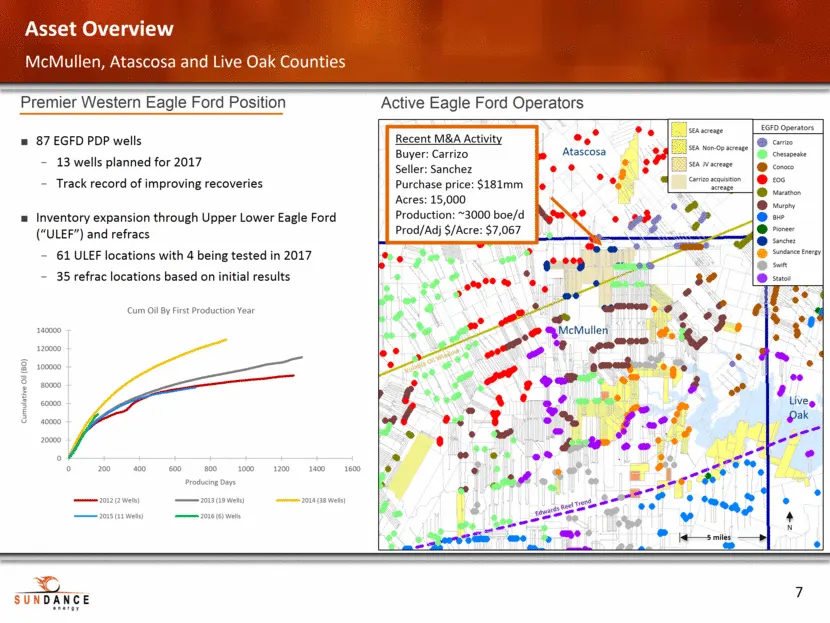
87 EGFD PDP wells 13 wells planned for 2017 Track record of improving recoveries Inventory expansion through Upper Lower Eagle Ford (“ULEF”) and refracs 61 ULEF locations with 4 being tested in 2017 35 refrac locations based on initial results McMullen, Atascosa and Live Oak Counties Asset Overview
Slide 7: Lower Lower Eagle Ford Type Curve
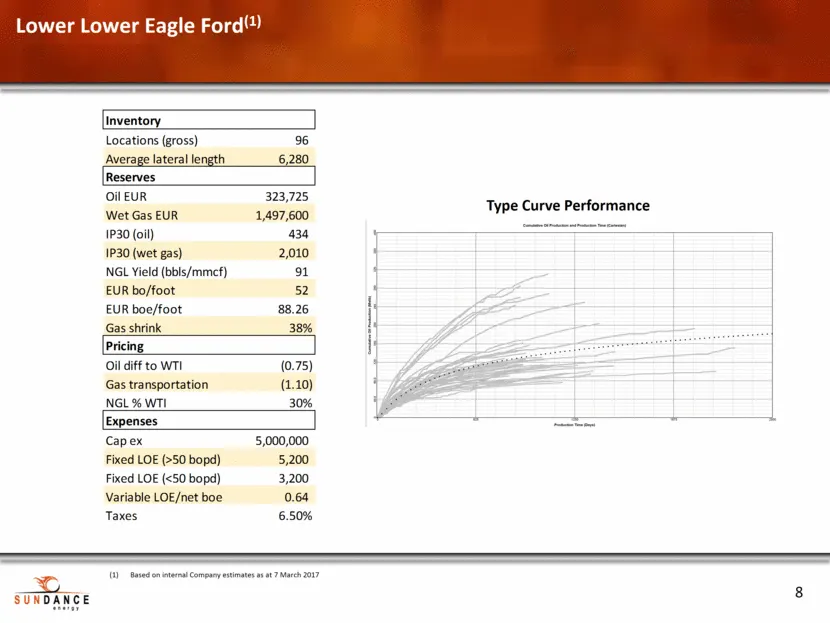
Lower Lower Eagle Ford(1) Type Curve Performance Based on internal Company estimates as at 7 March 2017 Locations (gross) 96 Average lateral length 6,280 Oil EUR 323,725 Wet Gas EUR 1,497,600 IP30 (oil) 434 IP30 (wet gas) 2,010 NGL Yield (bbls/mmcf) 91 EUR bo/foot 52 EUR boe/foot 88.26 Gas shrink 38
Slide 8: Upper Lower Eagle Ford
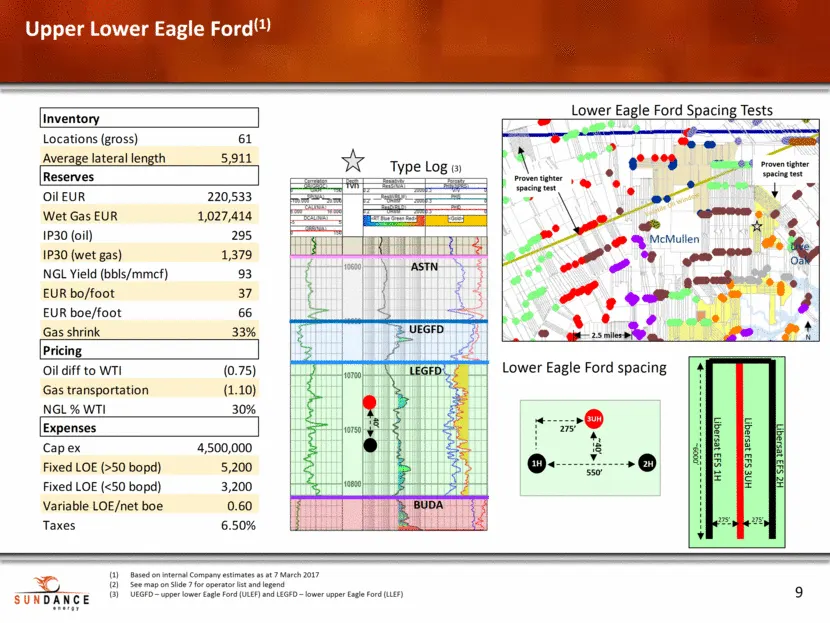
Upper Lower Eagle Ford(1) Based on internal Company estimates as at 7 March 2017 See map on Slide 7 for operator list and legend UEGFD – upper lower Eagle Ford (ULEF) and LEGFD – lower upper Eagle Ford (LLEF) Lower Eagle Ford spacing BUDA LEGFD UEGFD ASTN 40’ Type Log (3) N 2.5 miles McMullen Live O
Slide 9: McMullen 2016 Re-Frac Program Results
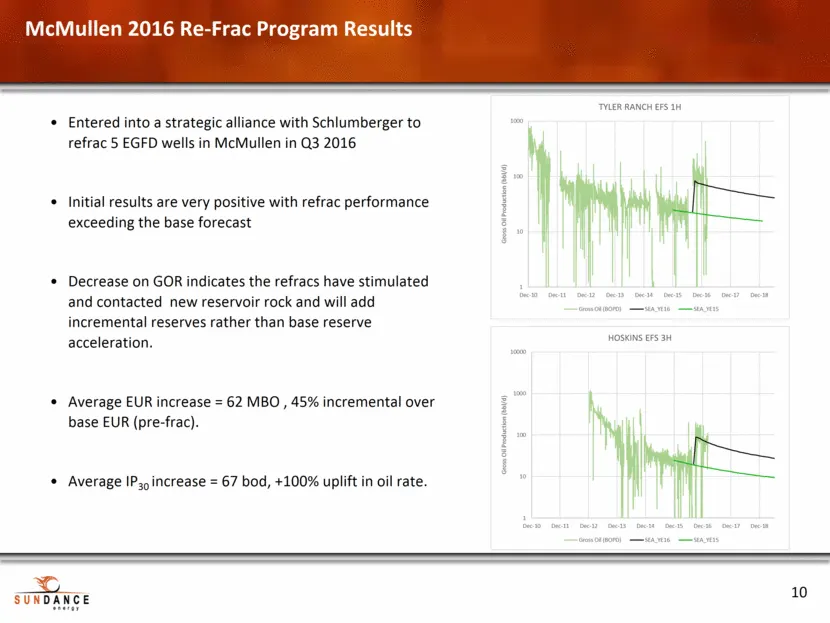
McMullen 2016 Re-Frac Program Results Entered into a strategic alliance with Schlumberger to refrac 5 EGFD wells in McMullen in Q3 2016 Initial results are very positive with refrac performance exceeding the base forecast Decrease on GOR indicates the refracs have stimulated and contacted new reserv
Slide 10: Refracs McMullen/Atascosa/Live Oak
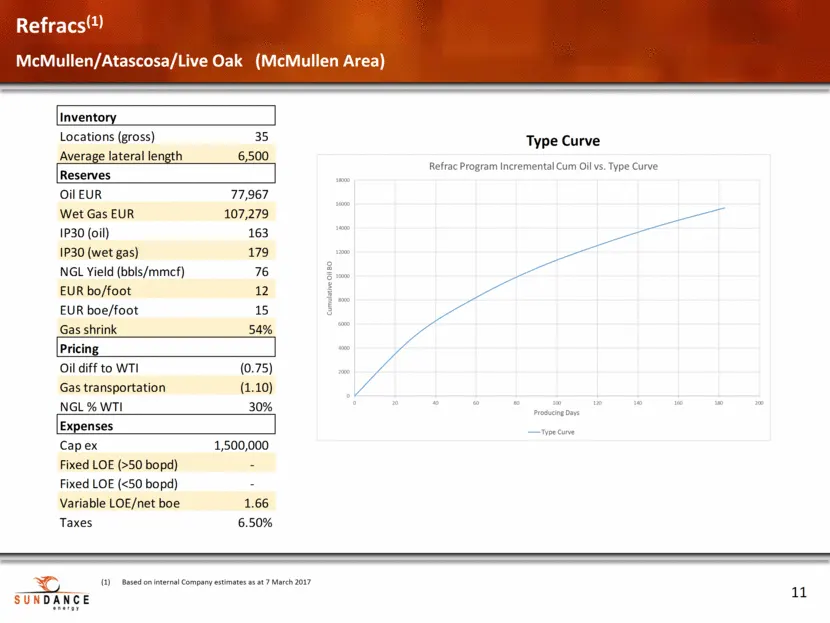
Refracs(1) McMullen/Atascosa/Live Oak (McMullen Area) Based on internal Company estimates as at 7 March 2017 Type Curve Inventory Locations (gross) 35 Average lateral length 6,500 Reserves Oil EUR 77,967 Wet Gas EUR 107,279 IP30 (oil) 163 IP30 (wet gas) 179 NGL Yield (bbls/mmcf) 76 EUR bo/foot 12 EU
Slide 11: Dimmit County Asset Overview
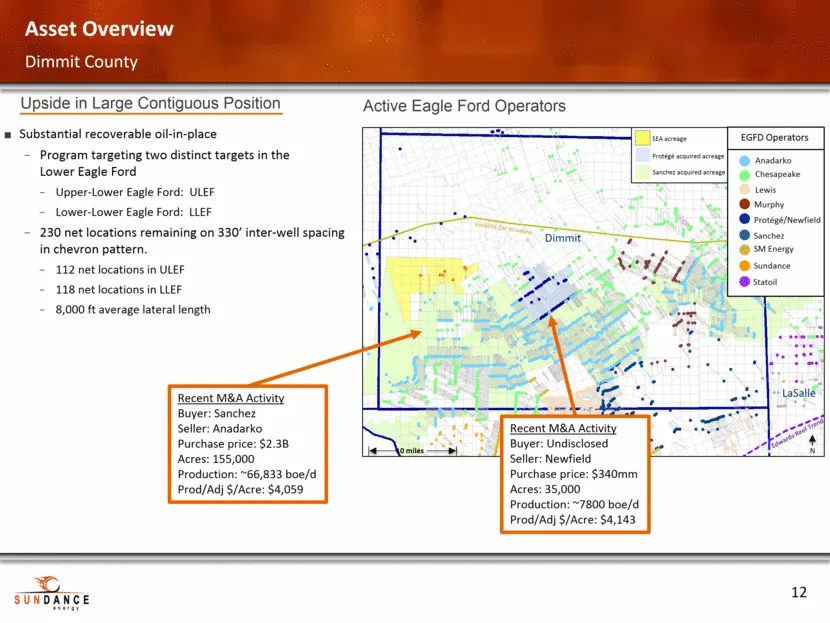
Substantial recoverable oil-in-place Program targeting two distinct targets in the Lower Eagle Ford Upper-Lower Eagle Ford: ULEF Lower-Lower Eagle Ford: LLEF 230 net locations remaining on 330’ inter-well spacing in chevron pattern. 112 net locations in ULEF 118 net locations in LLEF 8,000 ft averag
Slide 12: Asset Overview & Optimization Plan
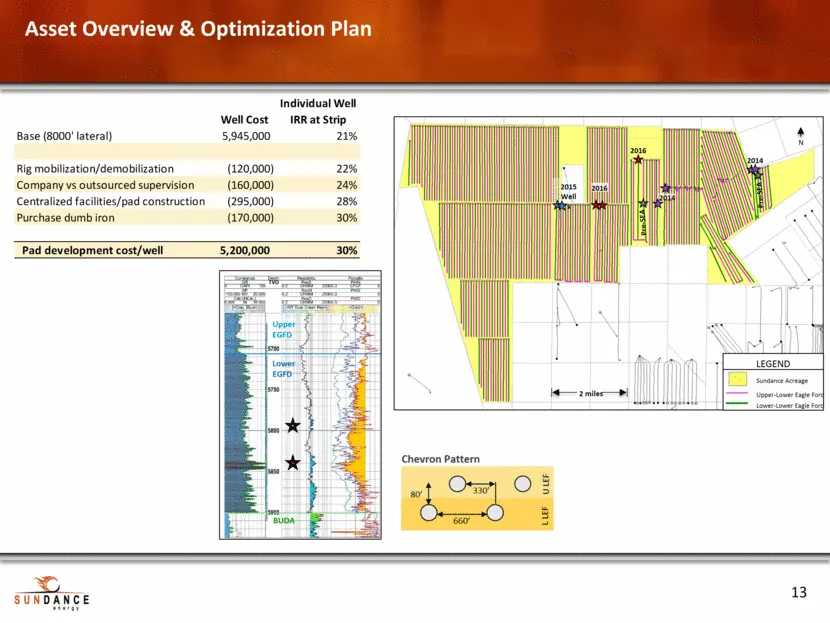
Asset Overview & Optimization Plan Lower EGFD Upper EGFD BUDA Chevron Pattern 2016 2 miles N Upper-Lower Eagle Ford LEGEND Lower-Lower Eagle Ford Sundance Acreage 2015 Wells 2016 Pre-SEA 2014 2014 Pre-SEA Well Cost Individual Well IRR at Strip Base (8000' lateral) 5,945,000 21% Rig mobilization/demo
Slide 13: Dimmit Economics
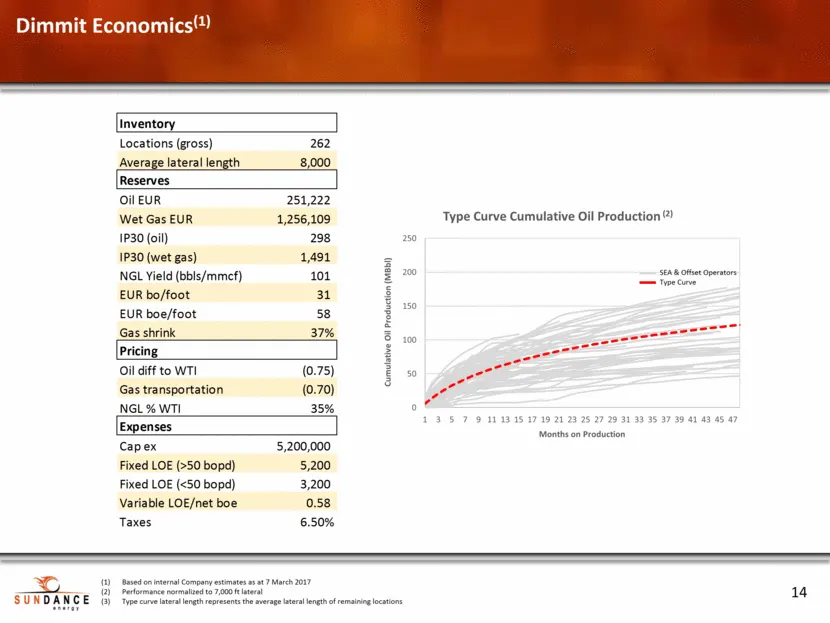
Dimmit Economics(1) Based on internal Company estimates as at 7 March 2017 Performance normalized to 7,000 ft lateral Type curve lateral length represents the average lateral length of remaining locations SEA & Offset Operators Type Curve 0 50 100 150 200 250 1 3 5 7 9 11 13 15 17 19 21 23 25 27 29
Slide 14: Production, Capital Expenditures & Development Plan
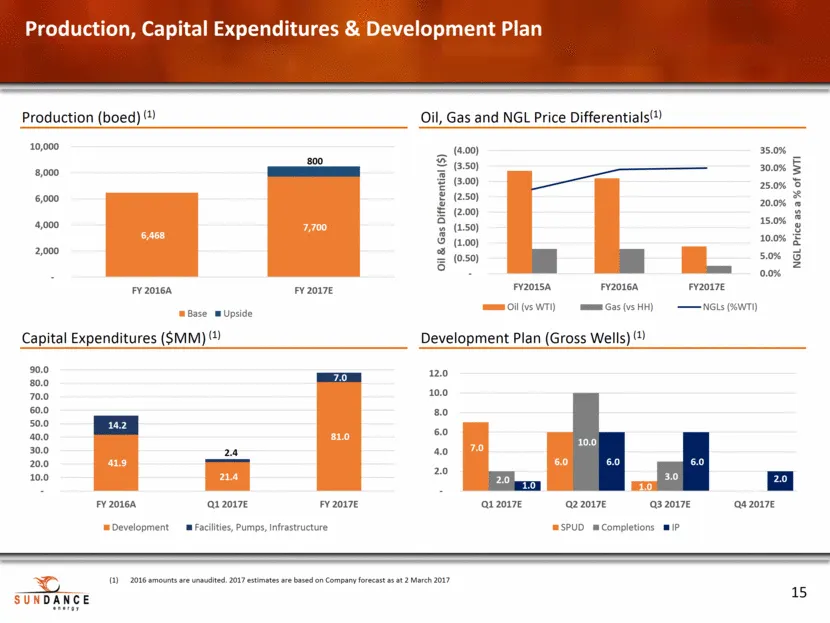
Production, Capital Expenditures & Development Plan 2016 amounts are unaudited. 2017 estimates are based on Company forecast as at 2 March 2017 Production (boed) (1) Oil, Gas and NGL Price Differentials(1) Capital Expenditures ($MM) (1) Development Plan (Gross Wells) (1) 0.0% 5.0% 10.0% 15.0% 20.0%
Slide 15: Operations Status
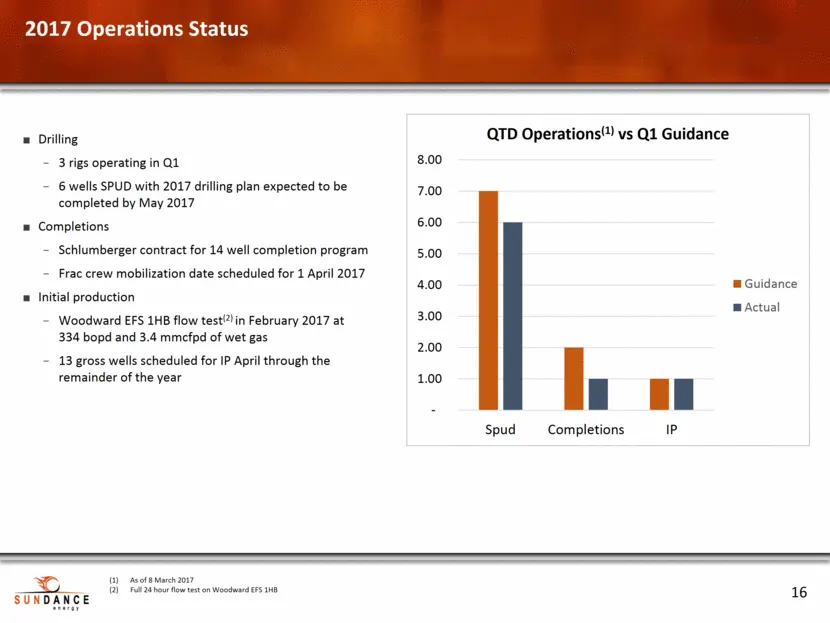
Drilling 3 rigs operating in Q1 6 wells SPUD with 2017 drilling plan expected to be completed by May 2017 Completions Schlumberger contract for 14 well completion program Frac crew mobilization date scheduled for 1 April 2017 Initial production Woodward EFS 1HB flow test(2) in February 2017 at 334 b
Slide 16: Debt & Hedges
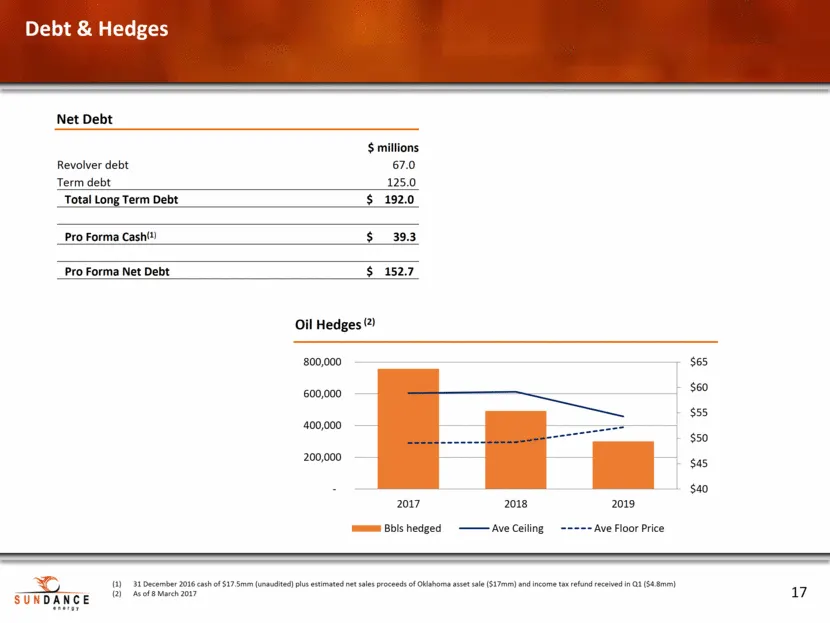
Debt & Hedges Net Debt 31 December 2016 cash of $17.5mm (unaudited) plus estimated net sales proceeds of Oklahoma asset sale ($17mm) and income tax refund received in Q1 ($4.8mm) As of 8 March 2017 Oil Hedges (2) $ millions Revolver debt 67.0 Term debt 125.0 Total Long Term Debt $ 192.0 Pro Forma Ca
Slide 17: Summary
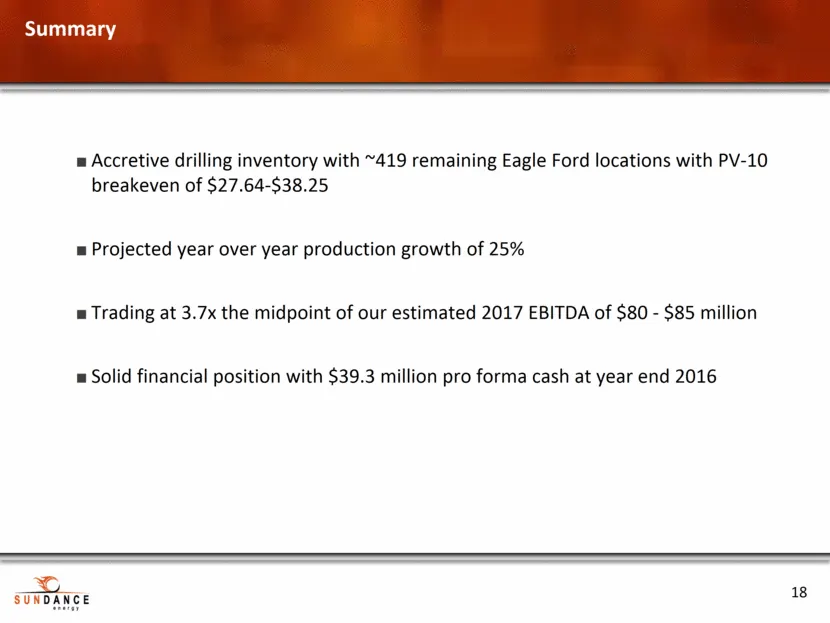
Accretive drilling inventory with ~419 remaining Eagle Ford locations with PV-10 breakeven of $27.64-$38.25 Projected year over year production growth of 25% Trading at 3.7x the midpoint of our estimated 2017 EBITDA of $80 - $85 million Solid financial position with $39.3 million pro forma cash at y
Slide 18: Executive summary: Management team
Executive summary Management team Eric McCrady, Managing Director & CEO Eric was appointed CEO in April 2011 and Managing Director of the Board in November 2011. He served as CFO from June 2010 until becoming CEO. Eric has over 15 years of entrepreneurial experience with an extensive track record in
Slide 19: Executive summary: Management team
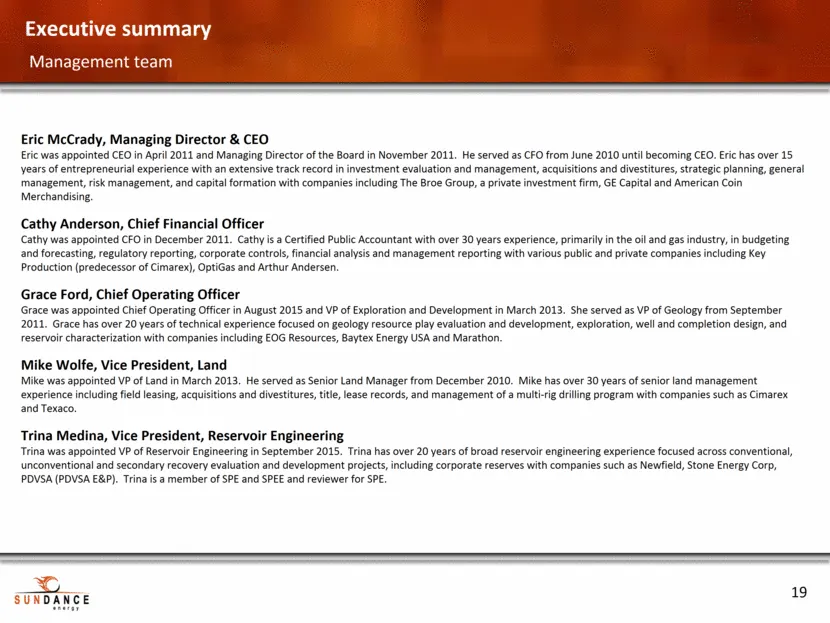
Executive summary Management team Eric McCrady, Managing Director & CEO Eric was appointed CEO in April 2011 and Managing Director of the Board in November 2011. He served as CFO from June 2010 until becoming CEO. Eric has over 15 years of entrepreneurial experience with an extensive track record in
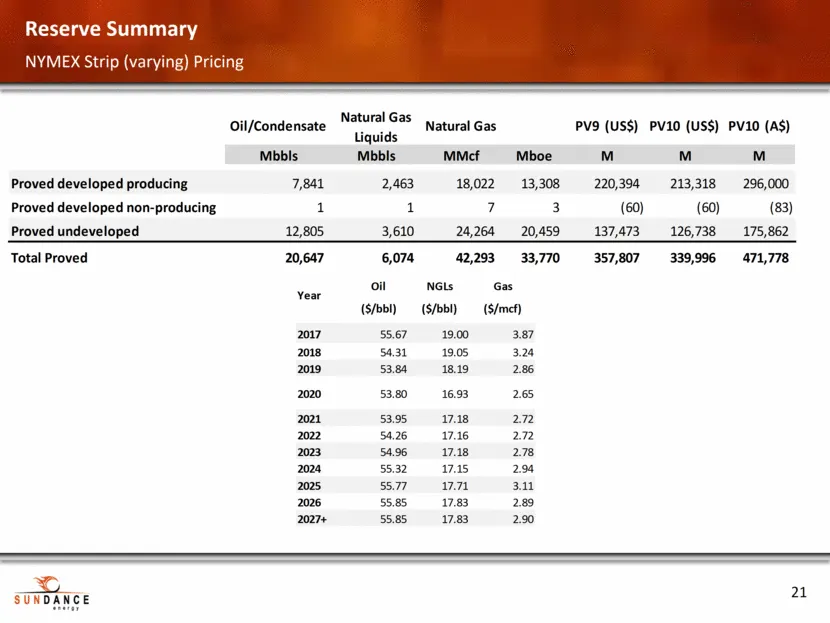
Slide 20: Reserve Summary
Reserve Summary NYMEX Strip (varying) Pricing Oil NGLs Gas ($/bbl) ($/bbl) ($/mcf) 2017 55.67 19.00 3.87 2018 54.31 19.05 3.24 2019 53.84 18.19 2.86 2020 53.80 16.93 2.65 2021 53.95 17.18 2.72 2022 54.26 17.16 2.72 2023 54.96 17.18 2.78 2024 55.32 17.15 2.94 2025 55.77 17.71 3.11 2026 55.85 17.83 2.
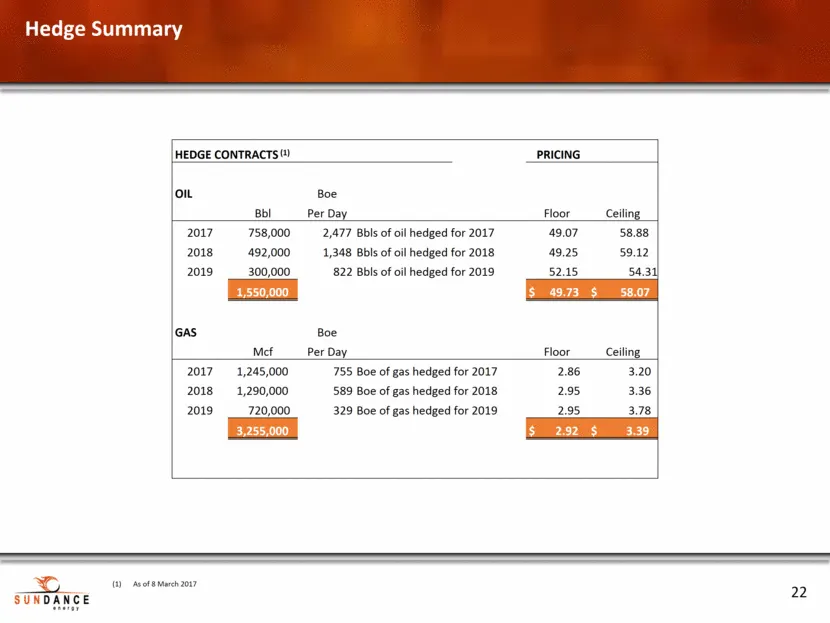
Slide 21: Hedge Summary
Hedge Summary As of 8 March 2017 HEDGE CONTRACTS (1) PRICING OIL Boe Bbl Per Day Floor Ceiling 2017 758,000 2,477 Bbls of oil hedged for 2017 49.07 58.88 2018 492,000 1,348 Bbls of oil hedged for 2018 49.25 59.12 2019 300,000 822 Bbls of oil hedged for 2019 52.15 54.31 1,550,000 $ 49.73 $ 58.07 GAS
Slide 22: Hedge Summary
Hedge Summary eoge contacts PRICING on toe per Day Foor __ceting_| 2017 2,477 Bbls of oil hedged for 2017 49.07 58.88 2018 1,348 Bbls of oil hedged for 2018 49.25, 59.12 2019 22 Bbisofcilhedgedfor 2019 S215 543 cas toe Mct__Per Day for celing_| 2017 1,245,000 ‘755 Boe of gas hedged for 2017 2.86 3.2
Source: SEC EDGAR · 6-K filed Mar 23, 2017
More decks from Sundance Energy Inc
 Investor Presentation (February 2020)25 slides · Feb 10, 2020
 Sundance Energy Australia — Q3 2019 Earnings Presentation24 slides · Nov 18, 2019
 Sundance Energy Australia — Q2 2019 Earnings Presentation25 slides · Aug 16, 2019
 Sundance Energy Australia — Investor Presentation (July 2019)19 slides · Jul 24, 2019
 Sundance Energy Australia — Investor Presentation (June 2019)16 slides · Jun 3, 2019
 Sundance Energy Australia — Q1 2019 Earnings Presentation17 slides · May 21, 2019