Republic Property Trust — NAREIT Annual Convention 2006
29 slides from Republic Property Trust's conference presentation, Nov 8, 2006
Slide 1: NAREIT Annual Convention November 2006
NAREIT Annual Convention November 2006
Slide 2: Forward Looking Information
Forward Looking Information Various statements in this presentation constitute forward-looking statements within the meaning of the Private Securities Litigation Reform Act of 1995. When used in this presentation, the words "strategy", "plan", "project", "believe", "anticipate", "intend", "should",

Slide 3: Company Overview / Capital Focus
Company Overview Capital Focus
Slide 4: Company Overview
Company Overview Class A Office Properties 24 office buildings, comprising 2.4 million square feet Focused in DC Metro Area Strong economy with high barriers to entry for new development Strong Rent Roll with Creditworthy Tenants 47.2% of portfolio SF leased to nationally recognized corporations 21.
Slide 5: Key Corporate Statistics
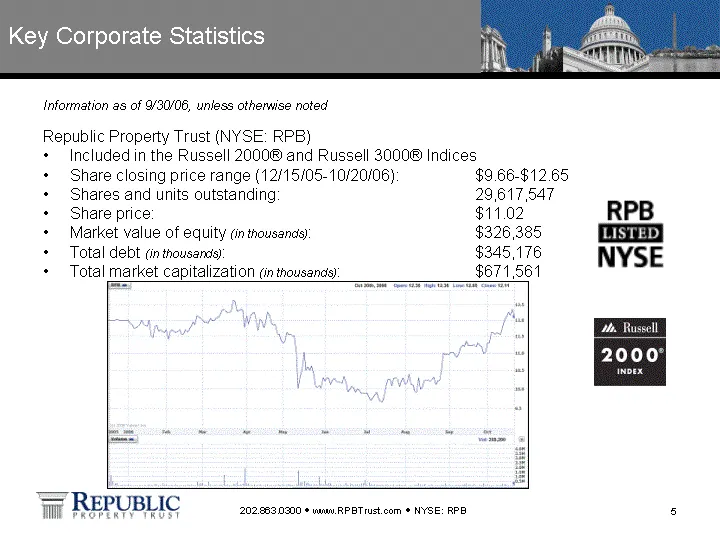
Key Corporate Statistics Republic Property Trust (NYSE: RPB) Included in the Russell 2000(r) and Russell 3000(r) Indices Share closing price range (12/15/05-10/20/06): $9.66-$12.65 Shares and units outstanding: 29,617,547 Share price: $11.02 Market value of equity (in thousands): $326,385 Total debt
Slide 6: Operational and Strategic Update / Capital Strategy
Operational and Strategic Update Capital Strategy
Slide 7: Corporate Strategy
Corporate Strategy Maximize cash flow at our properties Leverage leasing expertise to increase performance of our portfolio Selectively pursue opportunities to acquire institutional quality office properties Target development opportunities that we believe will produce attractive returns Upgrade por
Slide 8: 2006 YTD Highlights
2006 YTD Highlights Completed $114 million in acquisitions WillowWood I & II - 245,000 square feet in Fairfax, VA Republic Park 8 - 181,000 square feet in Herndon, VA Signed new/renewal leases for approx. 100,000 SF Honeywell - 31,500 SF renewal/expansion at Republic Park Active Health - 23,000 SF r
Slide 9: 2.4 Million SF of Existing Portfolio, 1.1 Million SF of Trophy Option Properties
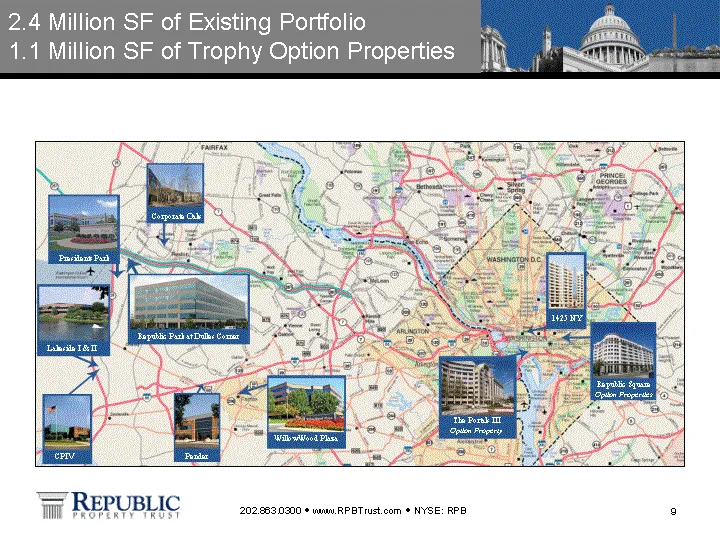
2.4 Million SF of Existing Portfolio 1.1 Million SF of Trophy Option Properties CPIV Corporate Oaks Pender Presidents Park Lakeside I & II 1425 NY WillowWood Plaza Republic Park at Dulles Corner Republic Square Option Properties The Portals III Option Property
Slide 10: Strong Rent Roll of Creditworthy Tenants
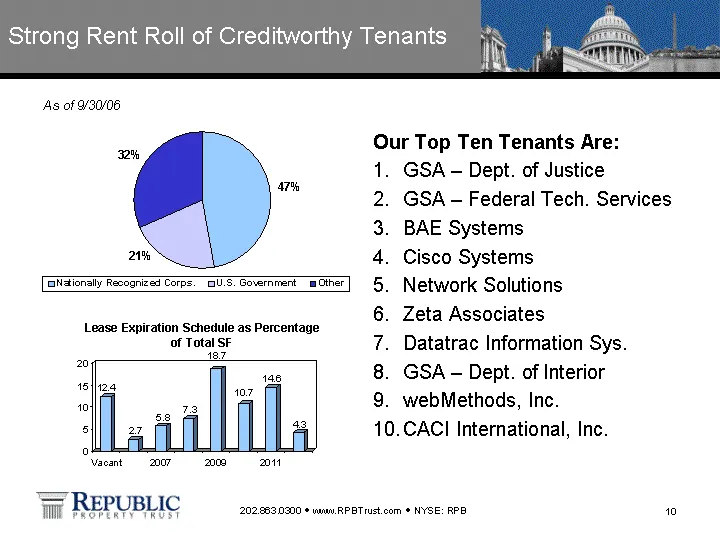
Strong Rent Roll of Creditworthy Tenants Nationally Recognized Corps. U.S. Government Other 47.2 21.1 31.7 Vacant 2006 2007 2008 2009 2010 2011 2012 SF 12.4 2.7 5.8 7.3 18.7 10.7 14.6 4.3 Our Top Ten Tenants Are: GSA - Dept. of Justice GSA - Federal Tech. Services BAE Systems Cisco Systems Network S
Slide 11: Acquisition: WillowWood Plaza I & II
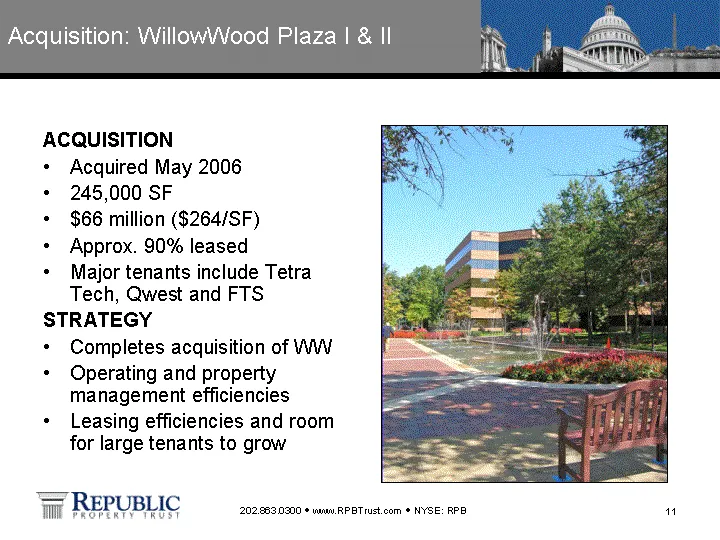
Acquisition: WillowWood Plaza I & II ACQUISITION Acquired May 2006 245,000 SF $66 million ($264/SF) Approx. 90% leased Major tenants include Tetra Tech, Qwest and FTS STRATEGY Completes acquisition of WW Operating and property management efficiencies Leasing efficiencies and room for large tenants t
Slide 12: Acquisition: Republic Park
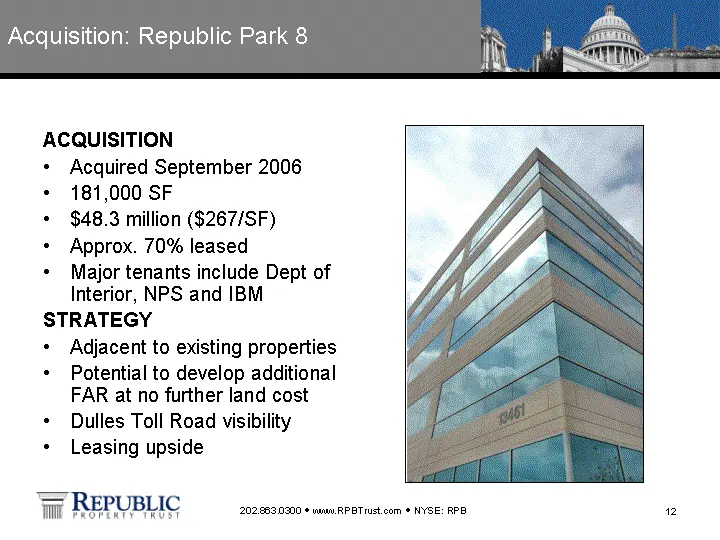
Acquisition: Republic Park 8 ACQUISITION Acquired September 2006 181,000 SF $48.3 million ($267/SF) Approx. 70% leased Major tenants include Dept of Interior, NPS and IBM STRATEGY Adjacent to existing properties Potential to develop additional FAR at no further land cost Dulles Toll Road visibility
Slide 13: Development Opportunity: Republic Park
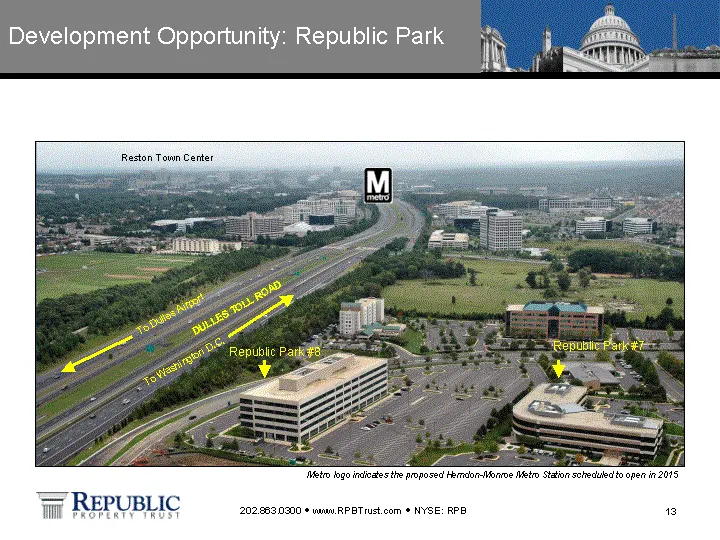
Development Opportunity: Republic Park Reston Town Center DULLES TOLL ROAD To Washington D.C. To Dulles Airport Republic Park #8 Republic Park #7 Metro logo indicates the proposed Herndon-Monroe Metro Station scheduled to open in 2015
Slide 14: Development Opportunity: Republic Park
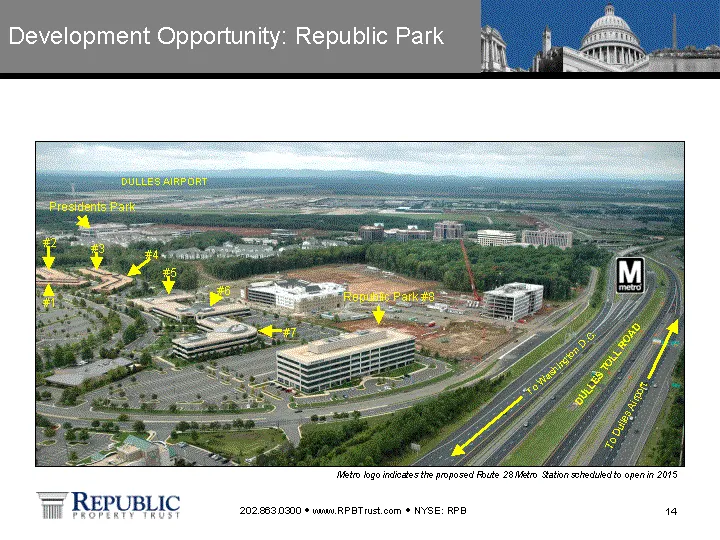
Development Opportunity: Republic Park DULLES TOLL ROAD To Washington D.C. To Dulles Airport Republic Park #8 #7 #6 DULLES AIRPORT #5 #4 #3 #2 #1 Presidents Park Metro logo indicates the proposed Route 28 Metro Station scheduled to open in 2015
Slide 15: Strong Internal Growth: Option Properties
Strong Internal Growth: Option Properties RPB has options to purchase 1.1 million SF of downtown trophy office space at a 6.5% cap rate The Option Each property may be purchased after it is 85% leased Purchase Price Lower of annualized NOI divided by a 6.5% cap rate or annualized NOI divided by mark
Slide 16: Option Property: Republic Square I
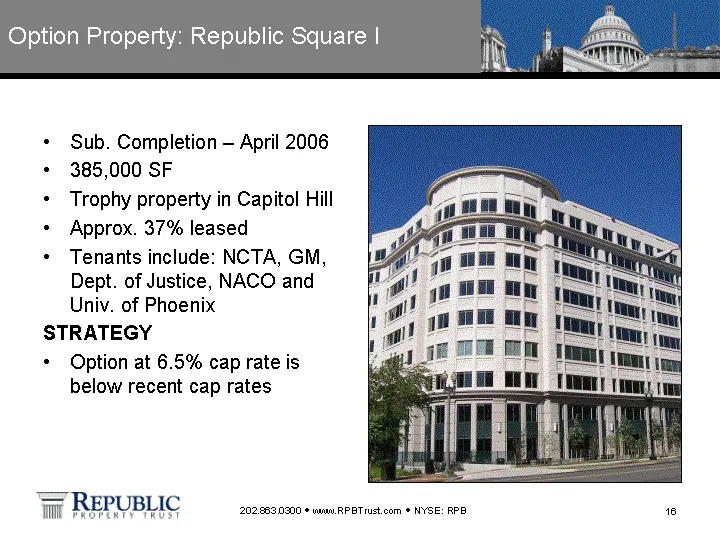
Option Property: Republic Square I Sub. Completion - April 2006 385,000 SF Trophy property in Capitol Hill Approx. 37% leased Tenants include: NCTA, GM, Dept. of Justice, NACO and Univ. of Phoenix STRATEGY Option at 6.5% cap rate is below recent cap rates below recent cap rates below recent cap rate
Slide 17: Option Property: The Portals III
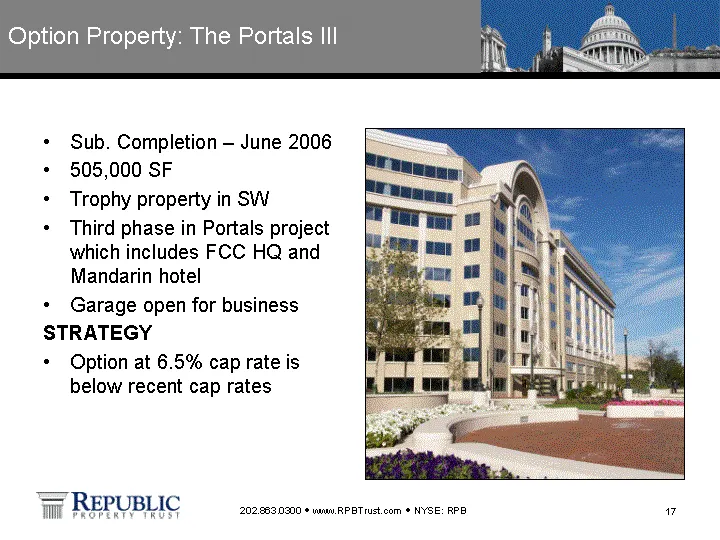
Option Property: The Portals III Sub. Completion - June 2006 505,000 SF Trophy property in SW Third phase in Portals project which includes FCC HQ and Mandarin hotel Garage open for business STRATEGY Option at 6.5% cap rate is below recent cap rates below recent cap rates below recent cap rates belo
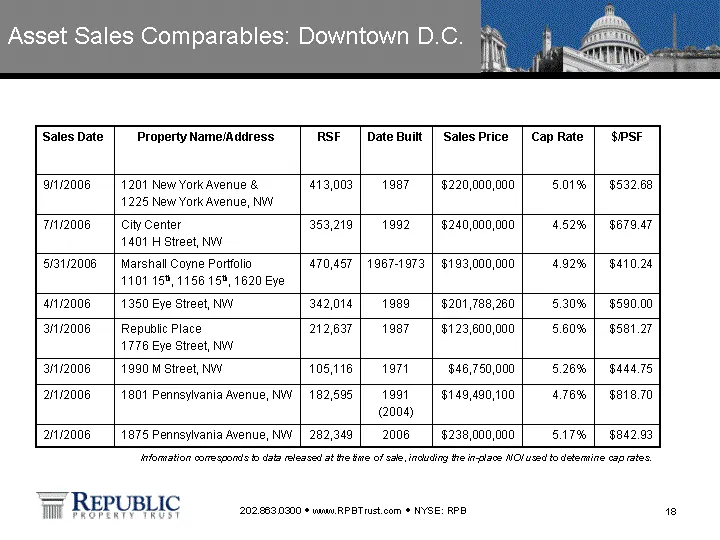
Slide 18: Asset Sales Comparables: Downtown D.C.
Asset Sales Comparables: Downtown D.C. Sales Date Property Name/Address RSF Date Built Sales Price Cap Rate $/PSF 9/1/2006 1201 New York Avenue & 1225 New York Avenue, NW 413,003 1987 $220,000,000 5.01% $532.68 7/1/2006 City Center 1401 H Street, NW 353,219 1992 $240,000,000 4.52% $679.47 5/31/2006
Slide 19: Potential Joint Venture Opportunity
Potential Joint Venture Opportunity By creating a joint venture partnership, RPB has the opportunity to realize value on its existing portfolio and future acquisitions and generate growth for the REIT Joint venture focused on a mix of core and value-add opportunities in Washington, D.C. Contribute a
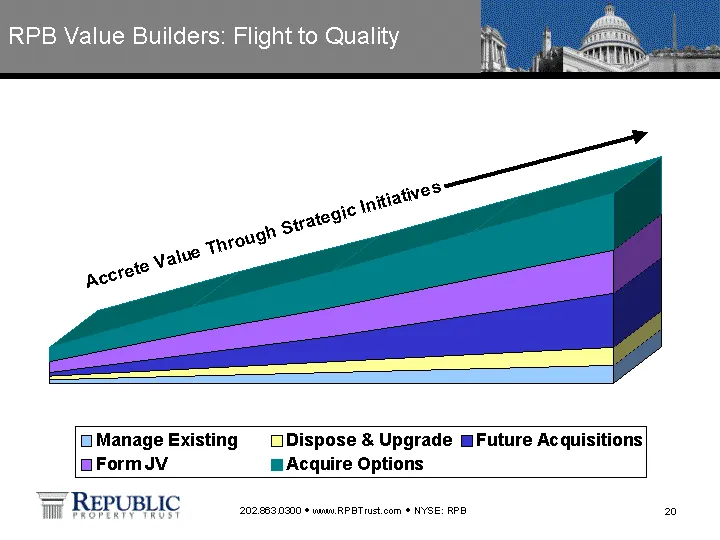
Slide 20: RPB Value Builders: Flight to Quality
RPB Value Builders: Flight to Quality 2007 2008 2009 2010 2011 Manage Existing 10 20 30 40 50 Dispose & Upgrade 10 20 30 40 50 Future Acquisitions 10 40 70 110 150 Form JV 30 60 80 100 120 Acquire Options 40 70 100 130 160 Accrete Value Through Strategic Initiatives

Slide 21: Washington, D.C. Market Focus / Capital Location
Washington, D.C. Market Focus Capital Location
Slide 22: Washington, D.C. Sharp Shooter
Washington, D.C. Sharp Shooter Republic is a "Sharp Shooter" focused on Washington, D.C. The Washington Metro Area is continuously rated one of the country's most attractive real estate markets and best economies. #1 real estate investment market in the U.S. (Source: Association of Foreign Investors
Slide 23: D.C. Metro Economic Drivers
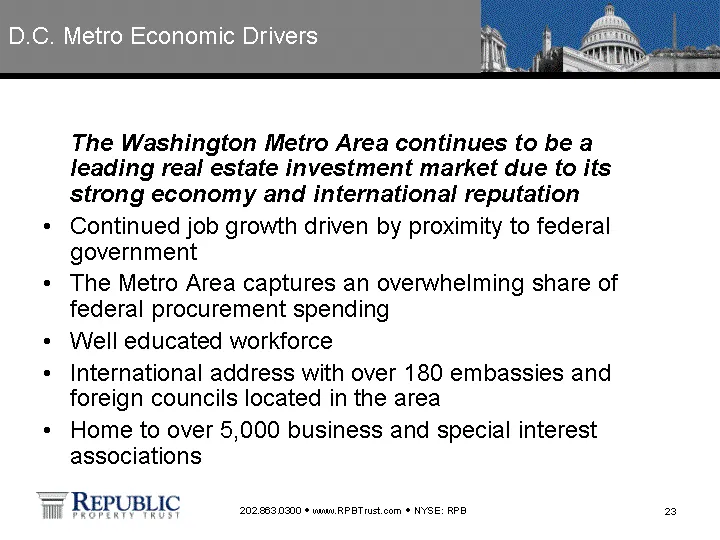
D.C. Metro Economic Drivers The Washington Metro Area continues to be a leading real estate investment market due to its strong economy and international reputation Continued job growth driven by proximity to federal government The Metro Area captures an overwhelming share of federal procurement spe
Slide 24: D.C. Metro Office Market
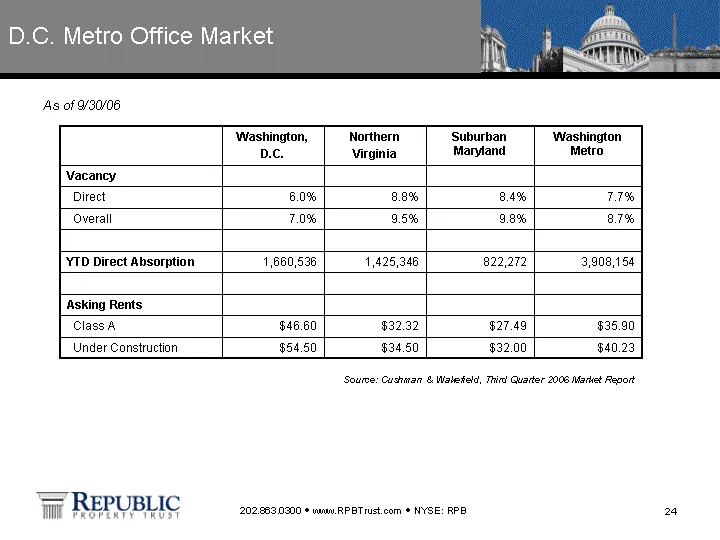
D.C. Metro Office Market Washington, D.C. Northern Virginia Suburban Maryland Washington Metro Vacancy Direct 6.0% 8.8% 8.4% 7.7% Overall 7.0% 9.5% 9.8% 8.7% YTD Direct Absorption 1,660,536 1,425,346 822,272 3,908,154 Asking Rents Class A $46.60 $32.32 $27.49 $35.90 Under Construction $54.50 $34.50
Slide 25: Greater Washington, D.C. Focus Submarket
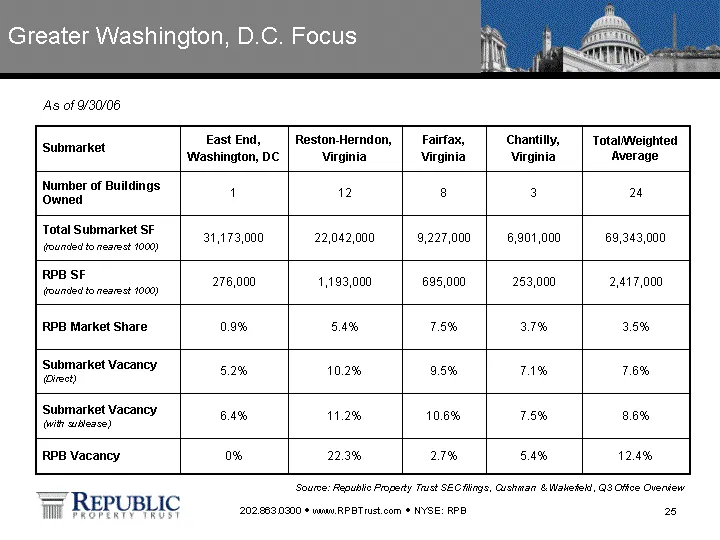
Greater Washington, D.C. Focus Submarket East End, Washington, DC Reston-Herndon, Virginia Fairfax, Virginia Chantilly, Virginia Total/Weighted Average Number of Buildings Owned 1 12 8 3 24 Total Submarket SF (rounded to nearest 1000) 31,173,000 22,042,000 9,227,000 6,901,000 69,343,000 RPB SF (roun
Slide 26: Capitalization / Capital Results
Capitalization Capital Results
Slide 27: Balance Sheet
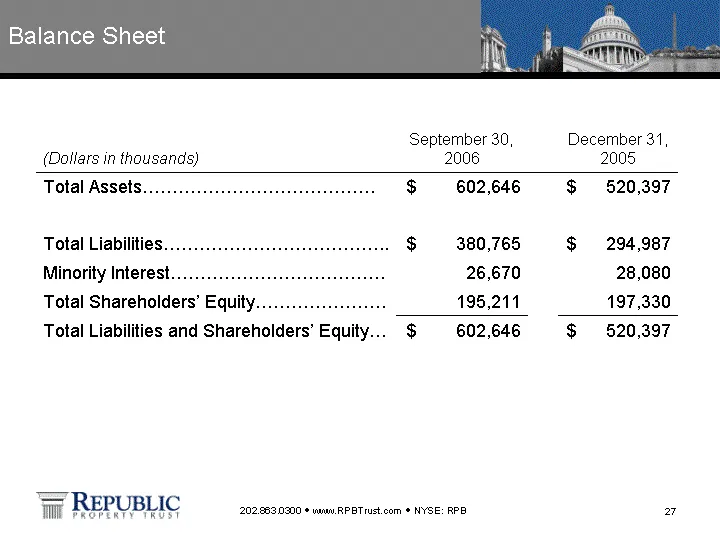
Balance Sheet (Dollars in thousands) September 30, 2006 December 31, 2005 Total Assets....................................... $ 602,646 $ 520,397 Total Liabilities...................................... $ 380,765 $ 294,987 Minority Interest.................................... 26,670 28,080 Total Shar
Slide 28: Capitalization
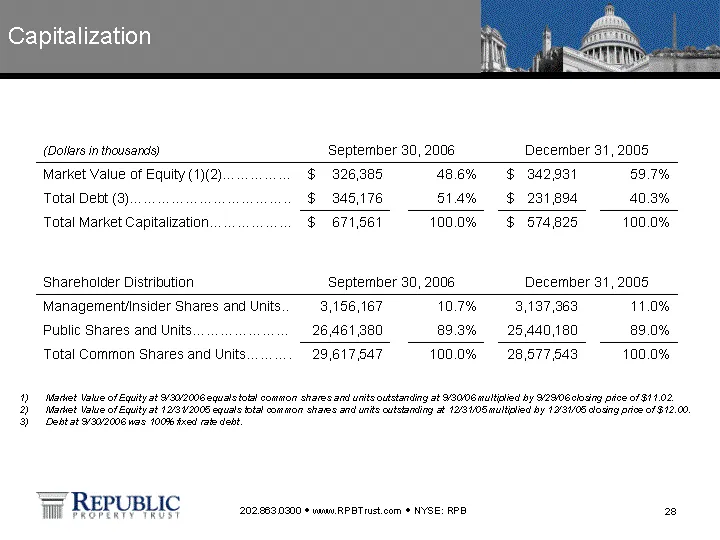
Capitalization (Dollars in thousands) September 30, 2006 September 30, 2006 September 30, 2006 December 31, 2005 December 31, 2005 December 31, 2005 Market Value of Equity (1)(2)............... $ 326,385 48.6% $ 342,931 59.7% Total Debt (3)................................... $ 345,176 51.4% $ 231,89
Slide 29: Debt Overview
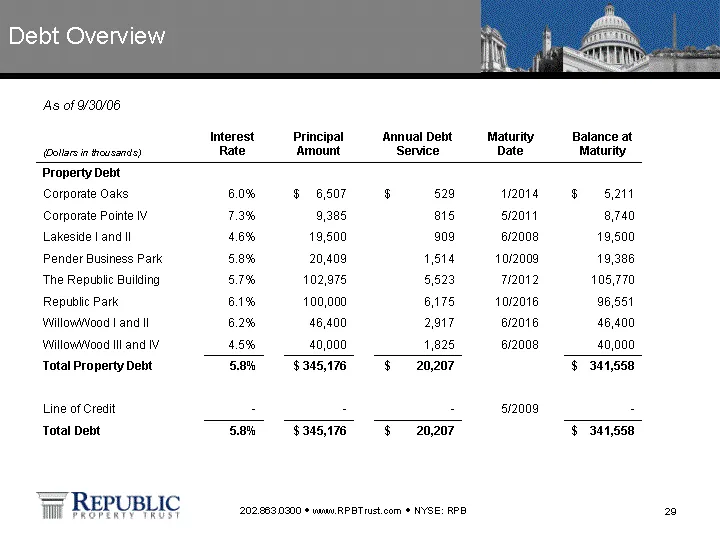
Debt Overview (Dollars in thousands) Interest Rate Principal Amount Annual Debt Service Maturity Date Balance at Maturity Property Debt Corporate Oaks 6.0% $ 6,507 $ 529 1/2014 $ 5,211 Corporate Pointe IV 7.3% 9,385 815 5/2011 8,740 Lakeside I and II 4.6% 19,500 909 6/2008 19,500 Pender Business Par
Source: SEC EDGAR · 8-K filed Nov 8, 2006