Kingfisher PLC · LSE:KGF
Kingfisher — FY2011/12 Earnings Presentation
66 slides from Kingfisher's earnings presentation, March 2012

Slide 1: Ian Cheshire, Group Chief Executive
Ian Cheshire Group Chief Executive
Slide 2: Agenda
Agenda Introduction Ian Cheshire Group CEO Delivering Value Ian Cheshire Group CEO Financial review Kevin O’Byrne Group CFO Creating the Leader Ian Cheshire Group CEO Questions 4
Slide 3: 2011/12 Summary
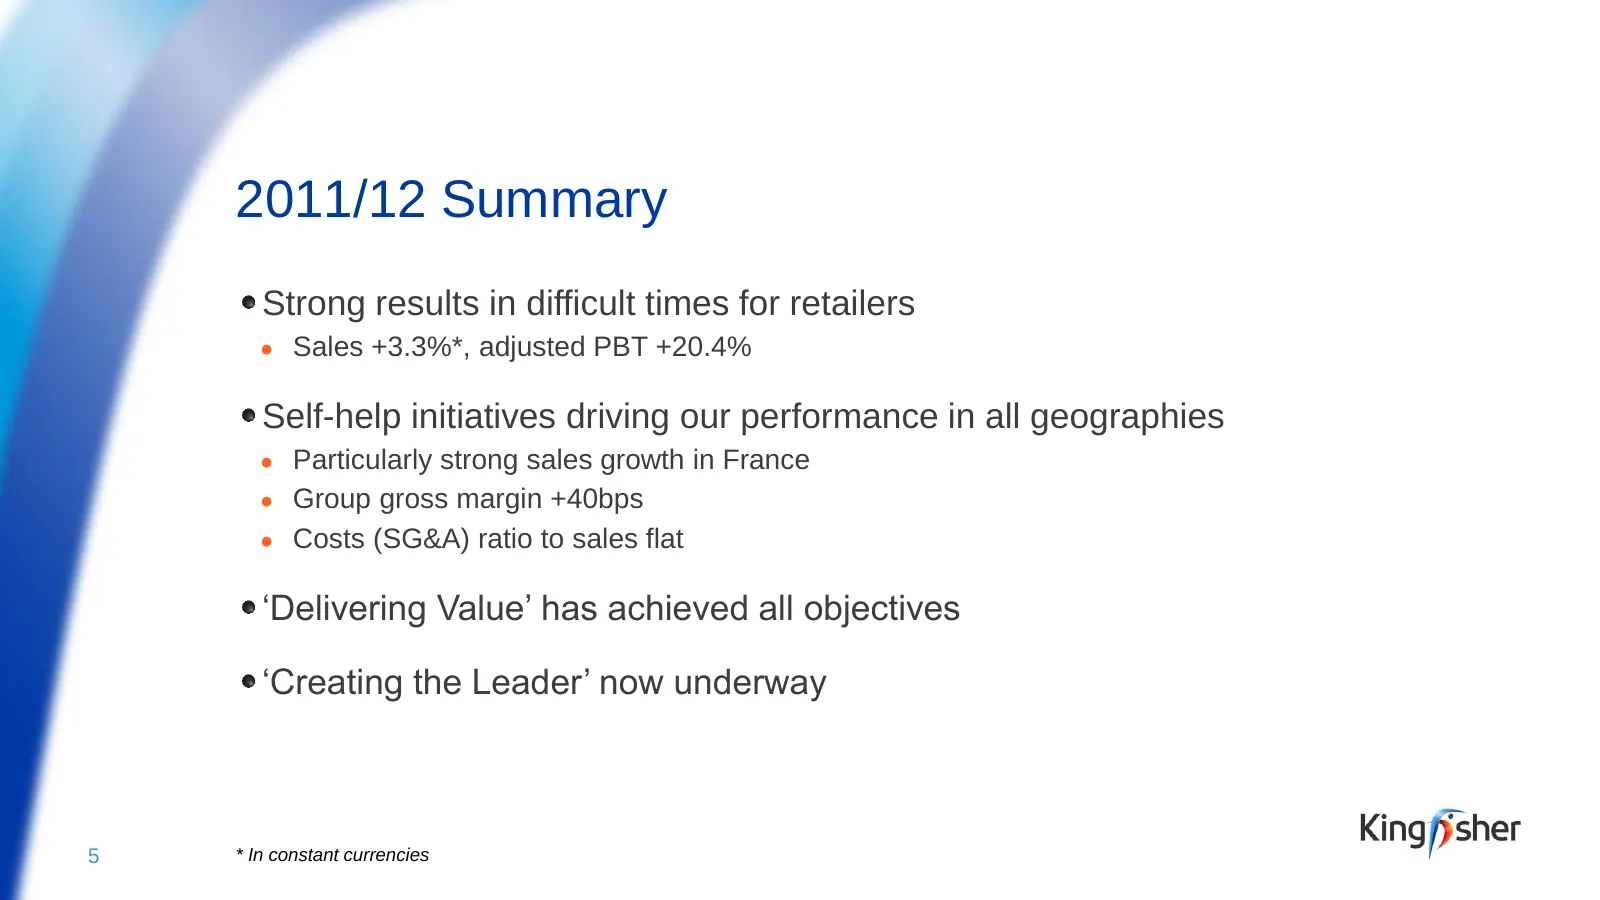
2011/12 Summary Strong results in difficult times for retailers ● Sales +3.3%*, adjusted PBT +20.4% Self-help initiatives driving our performance in all geographies ● Particularly strong sales growth in France ● Group gross margin +40bps ● Costs (SG&A) ratio to sales flat ‘Delivering Value’ has achi
Slide 4: Delivering Value – a success
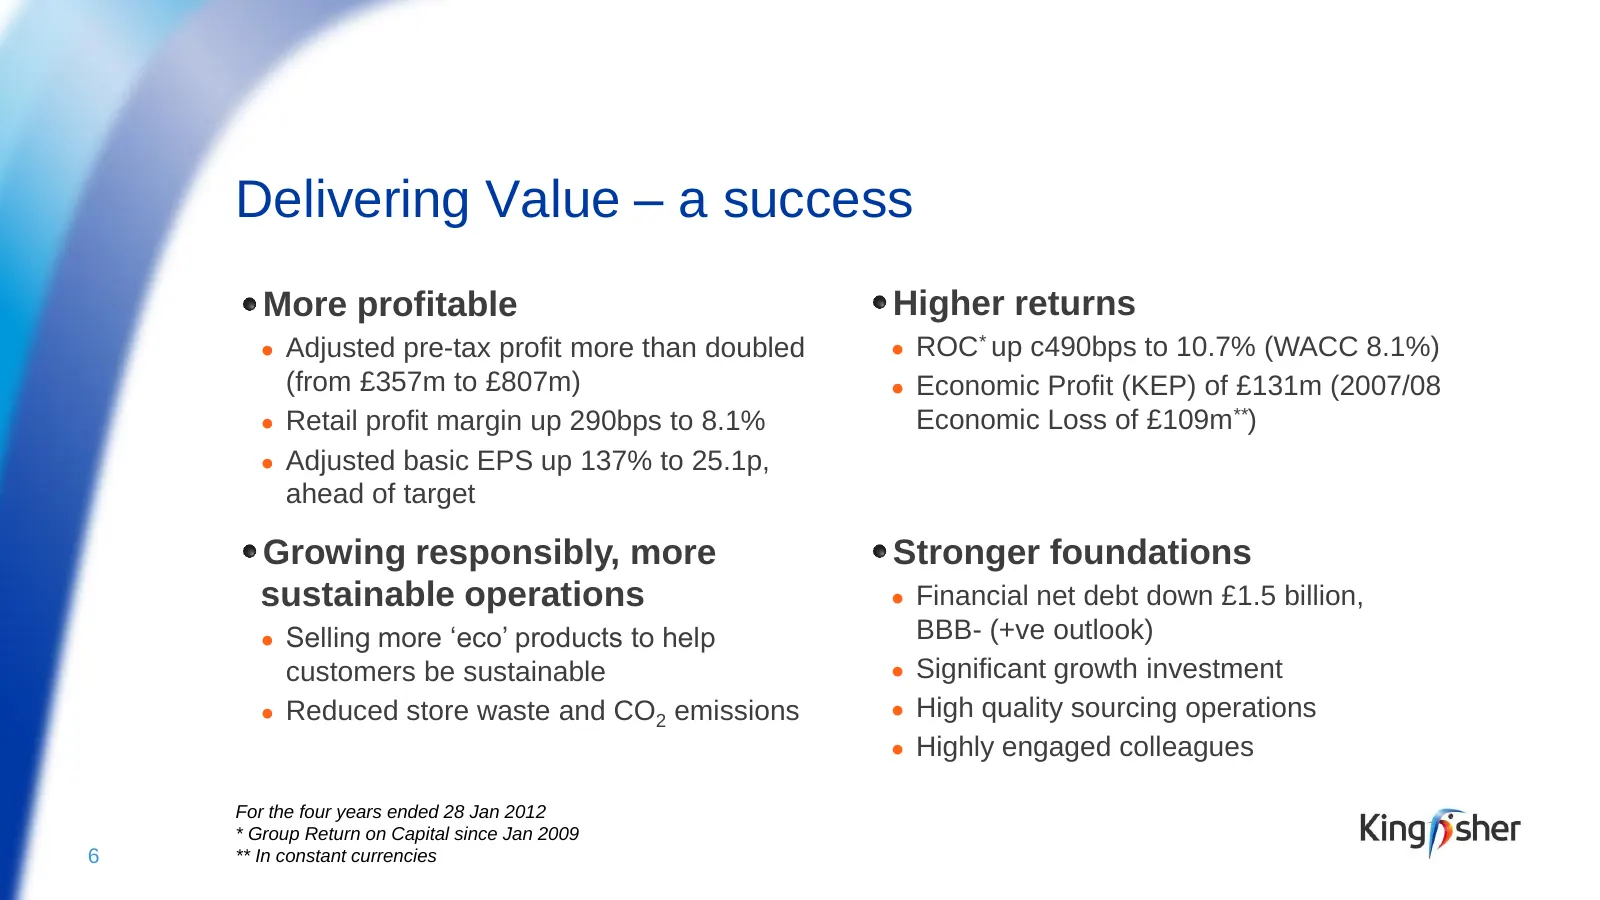
Delivering Value – a success More profitable Higher returns ● Adjusted pre-tax profit more than doubled ● ROC* up c490bps to 10.7% (WACC 8.1%) (from £357m to £807m) ● Economic Profit (KEP) of £131m (2007/08 ● Retail profit margin up 290bps to 8.1% Economic Loss of £109m**) ● Adjusted basic EPS up 13
Slide 5: Delivering Value – a success
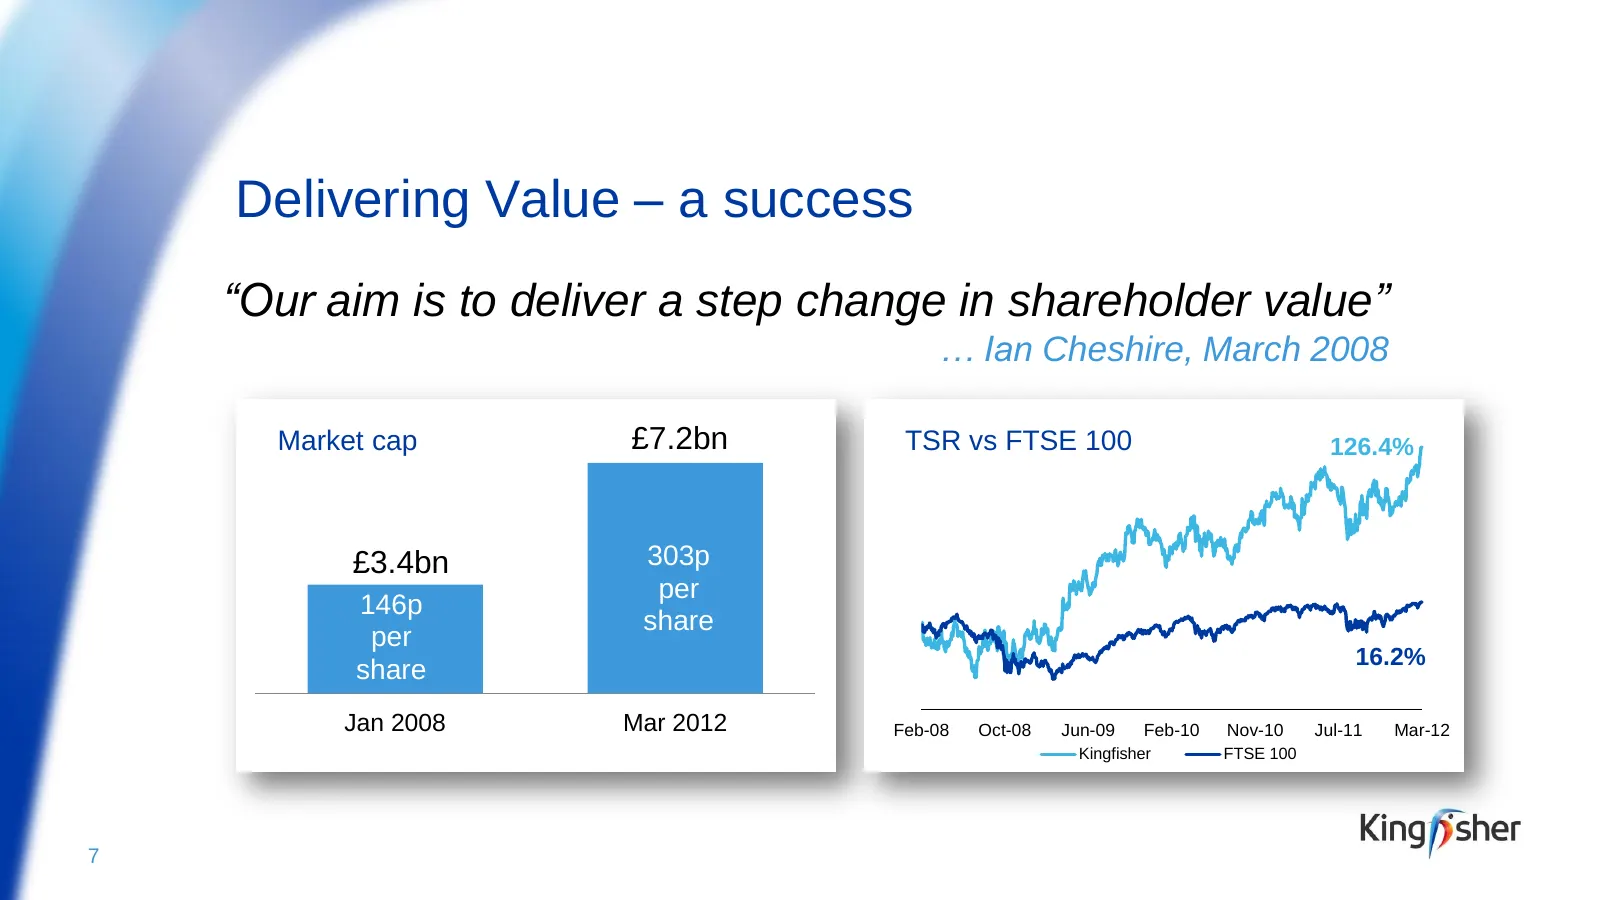
Delivering Value – a success “Our aim is to deliver a step change in shareholder value” … Ian Cheshire, March 2008 Market cap £7.2bn TSR vs FTSE 100 126.4% £3.4bn 303p per 146p share per 16.2% share Jan 2008 Mar 2012 Feb-08 Oct-08 Jun-09 Feb-10 Nov-10 Jul-11 Mar-12 Kingfisher FTSE 100 7
Slide 6: A reinvigorated B&Q
A reinvigorated B&Q B&Q retail profit up 83% despite market decline Retail profit margin up 300bps to 6.2%, on track to achieve a sustainable 7% margin, supported by: ● Distribution efficiencies ● Shrinkage reduction ● More direct sourcing ● Cost efficiency programme Store estate updated Stringent s
Slide 7: A strong and scalable UK trade offer
A strong and scalable UK trade offer Combined trade sales of over £1bn New trade offer (‘TradePoint’) added to all B&Q stores ● 800,000 trade professionals registered Developed and expanded Screwfix ● Opened 122 new Screwfix outlets (taking the total to 215) ● Added specialist trade counters exclusi
Slide 8: A stronger position in France
A stronger position in France Sales up 10%*, profits up 42%* Retail profit margin up 210bps to 9.5% supported by: ● Buying optimisation benefits ● Shrinkage reduction ● More direct sourcing Added 12% net new space Castorama modernisation accelerated ● 66% of stores now in modern format, up from 42%
Slide 9: A bigger business in Eastern Europe
A bigger business in Eastern Europe Sales up 71%* to £1.7bn**, profits up 62%* Opened 59 new stores, +85% net new space ● 25 in Poland, 21 in Turkey and 13 in Russia Opened new distribution facilities in Poland and Turkey to unlock future direct sourcing and distribution benefits * In constant curre
Slide 10: A more stable business in China
A more stable business in China Losses significantly reduced ● 2008/09: loss of £63m* ● 2011/12: loss of £3m Cash neutral Store portfolio rationalised from 63 to 40 stores, 16 downsized New, smaller format in development 12 * In constant currencies
Slide 11: A stronger sourcing capability
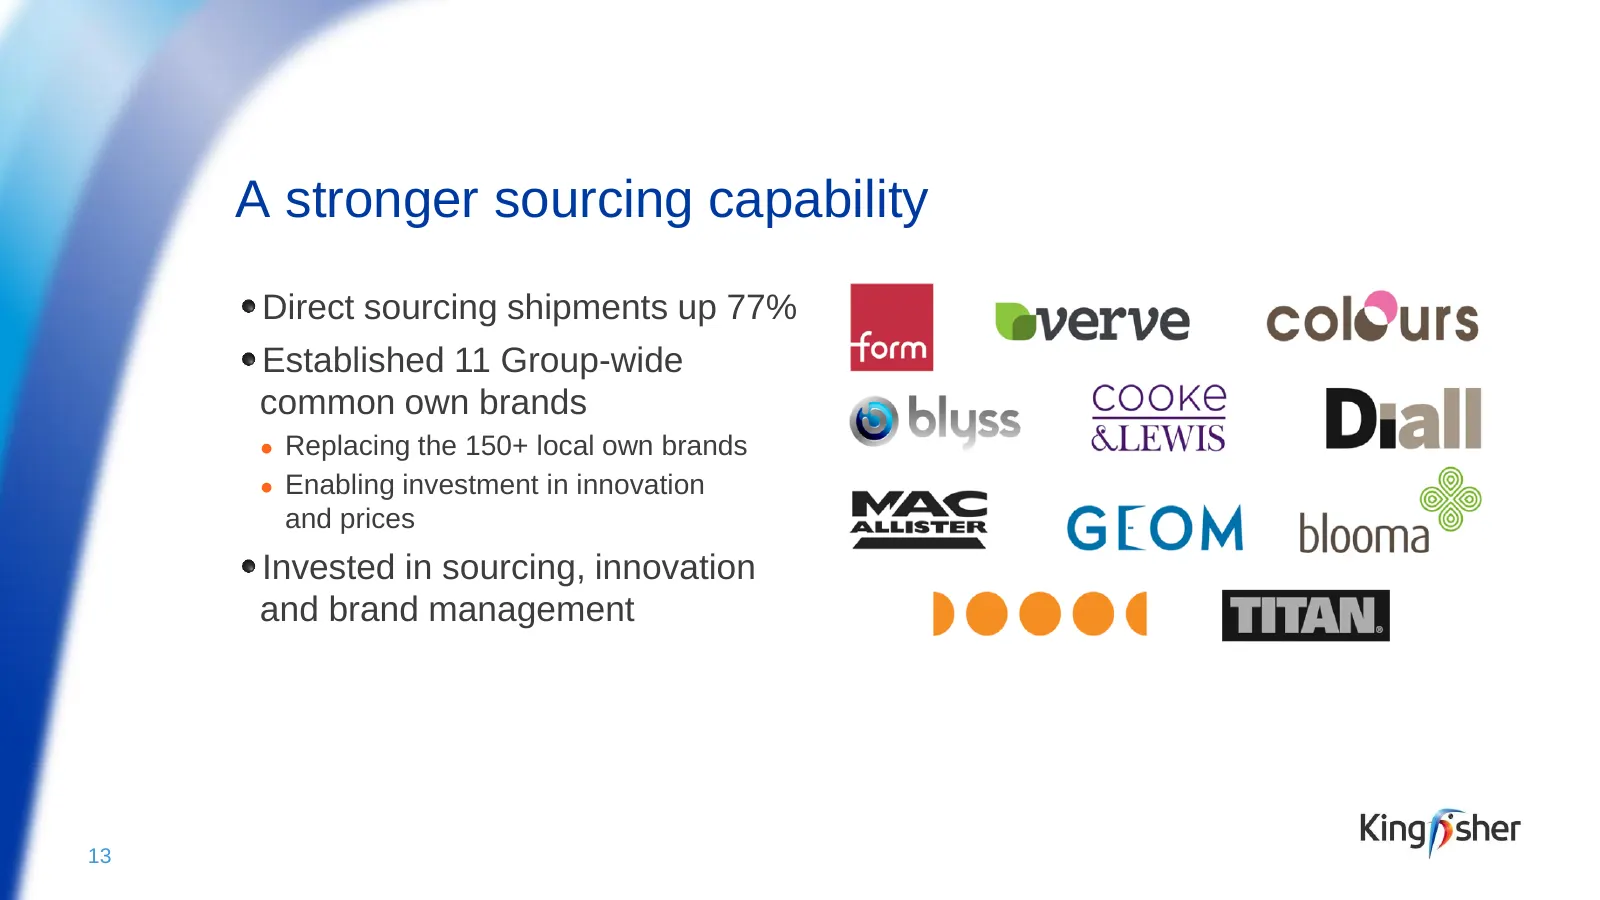
A stronger sourcing capability Direct sourcing shipments up 77% Established 11 Group-wide common own brands ● Replacing the 150+ local own brands ● Enabling investment in innovation and prices Invested in sourcing, innovation and brand management 13
Slide 12: A more profitable business model
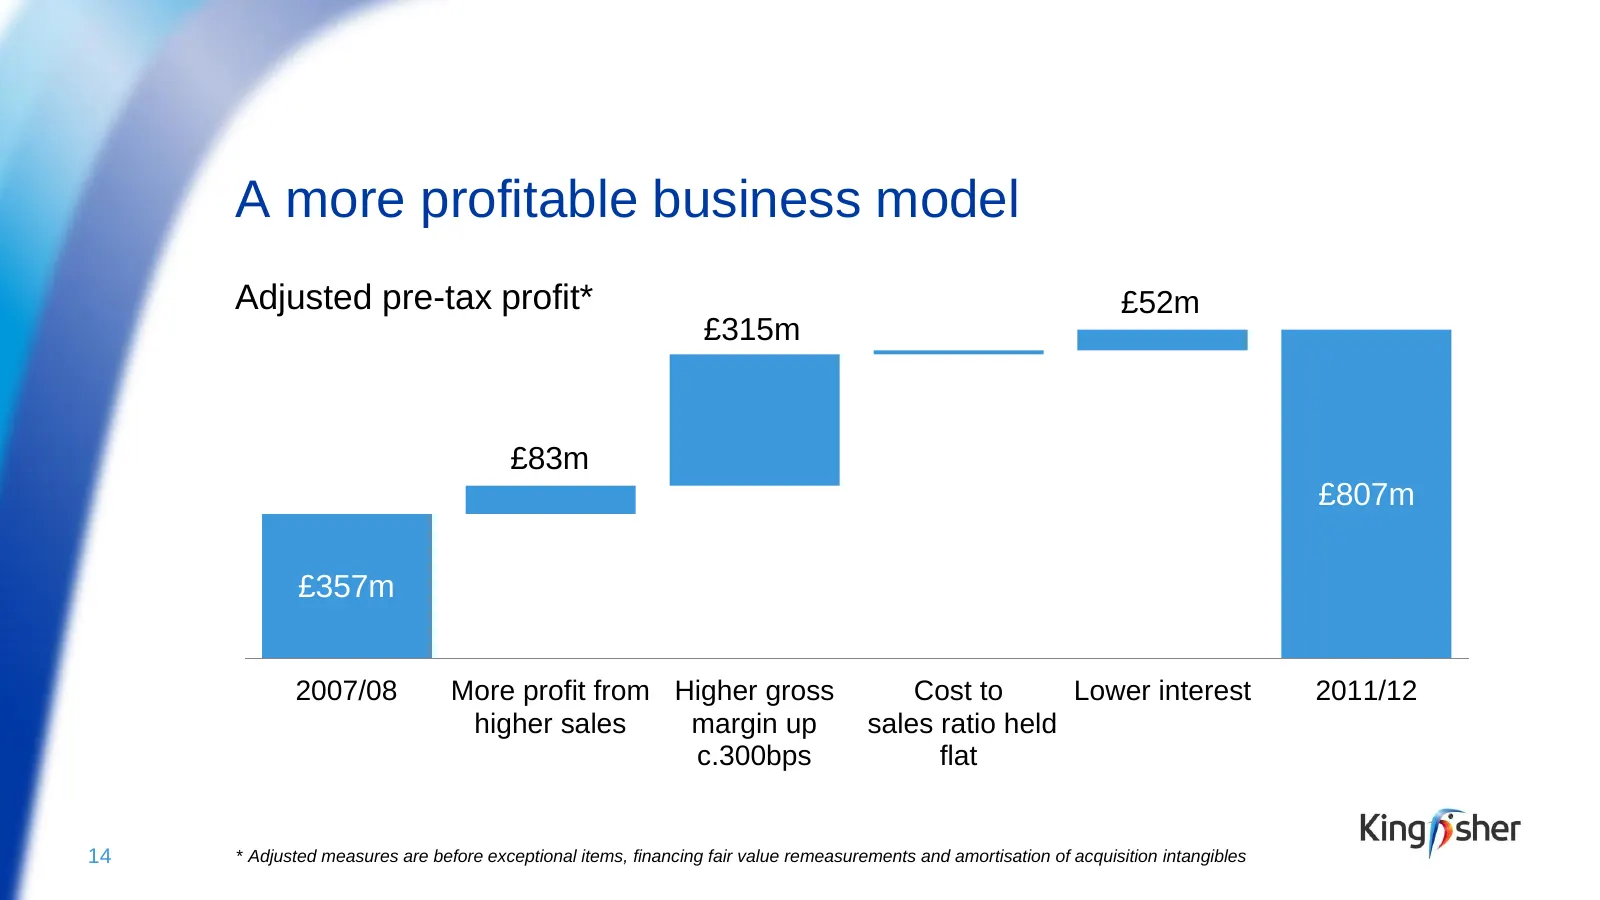
A more profitable business model Adjusted pre-tax profit* £52m £315m £83m £807m £357m 2007/08 More profit from Higher gross Cost to Lower interest 2011/12 higher sales margin up sales ratio held c.300bps flat 14 * Adjusted measures are before exceptional items, financing fair value remeasurements an
Slide 13: Now a higher returning business model
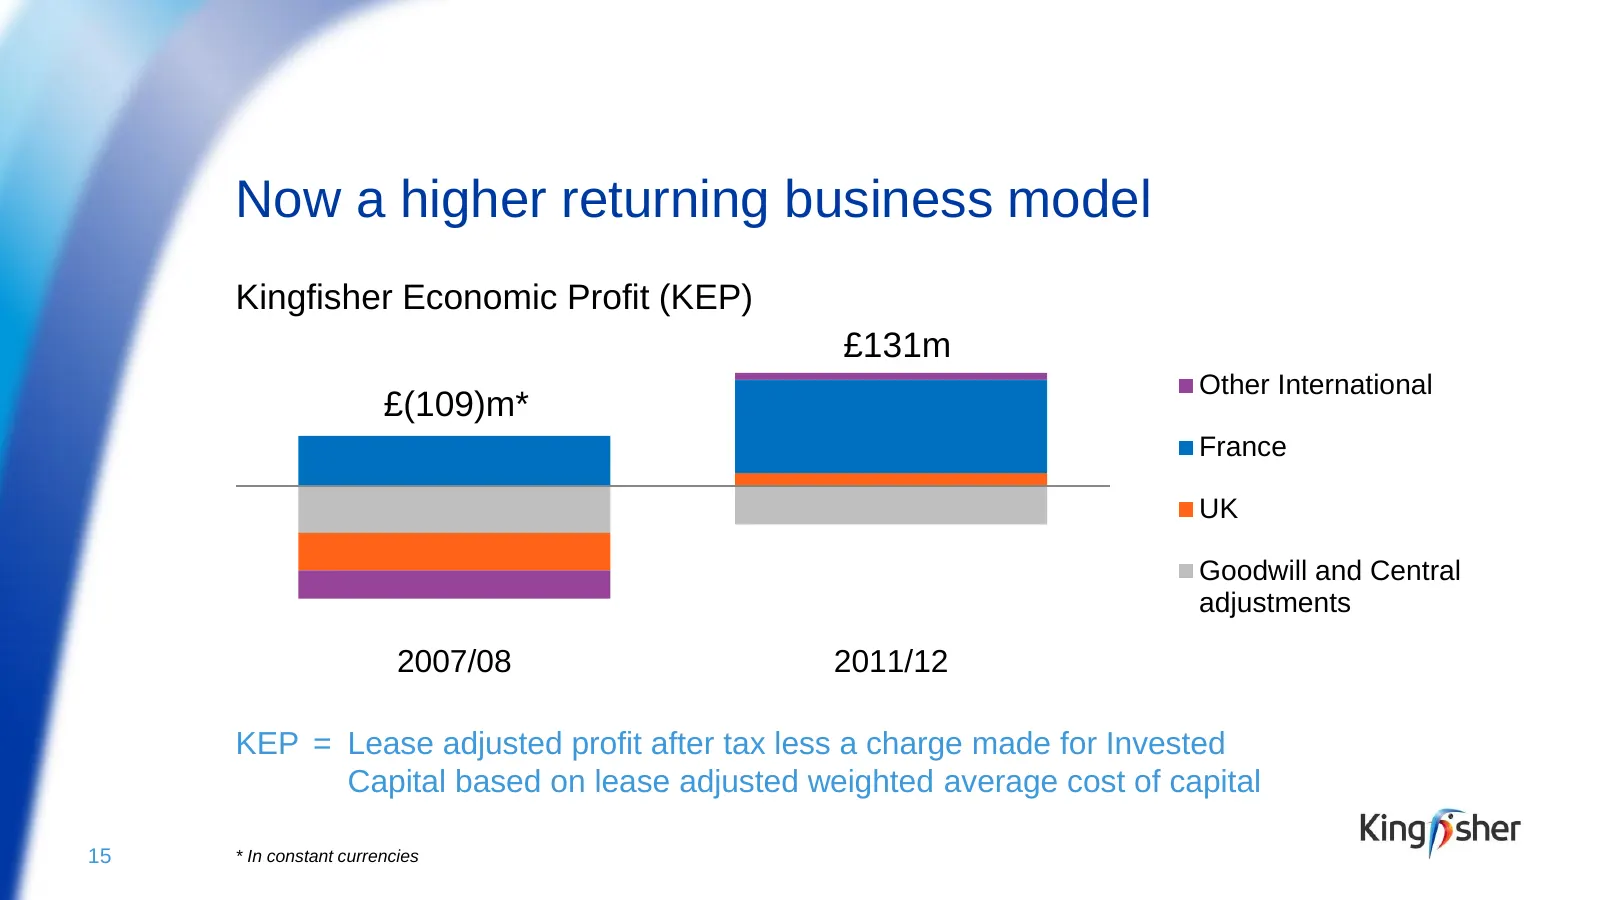
Now a higher returning business model Kingfisher Economic Profit (KEP) £131m Other International £(109)m* France UK Goodwill and Central adjustments 2007/08 2011/12 KEP = Lease adjusted profit after tax less a charge made for Invested Capital based on lease adjusted weighted average cost of capital
Slide 14: Made good use of our positive cash flow
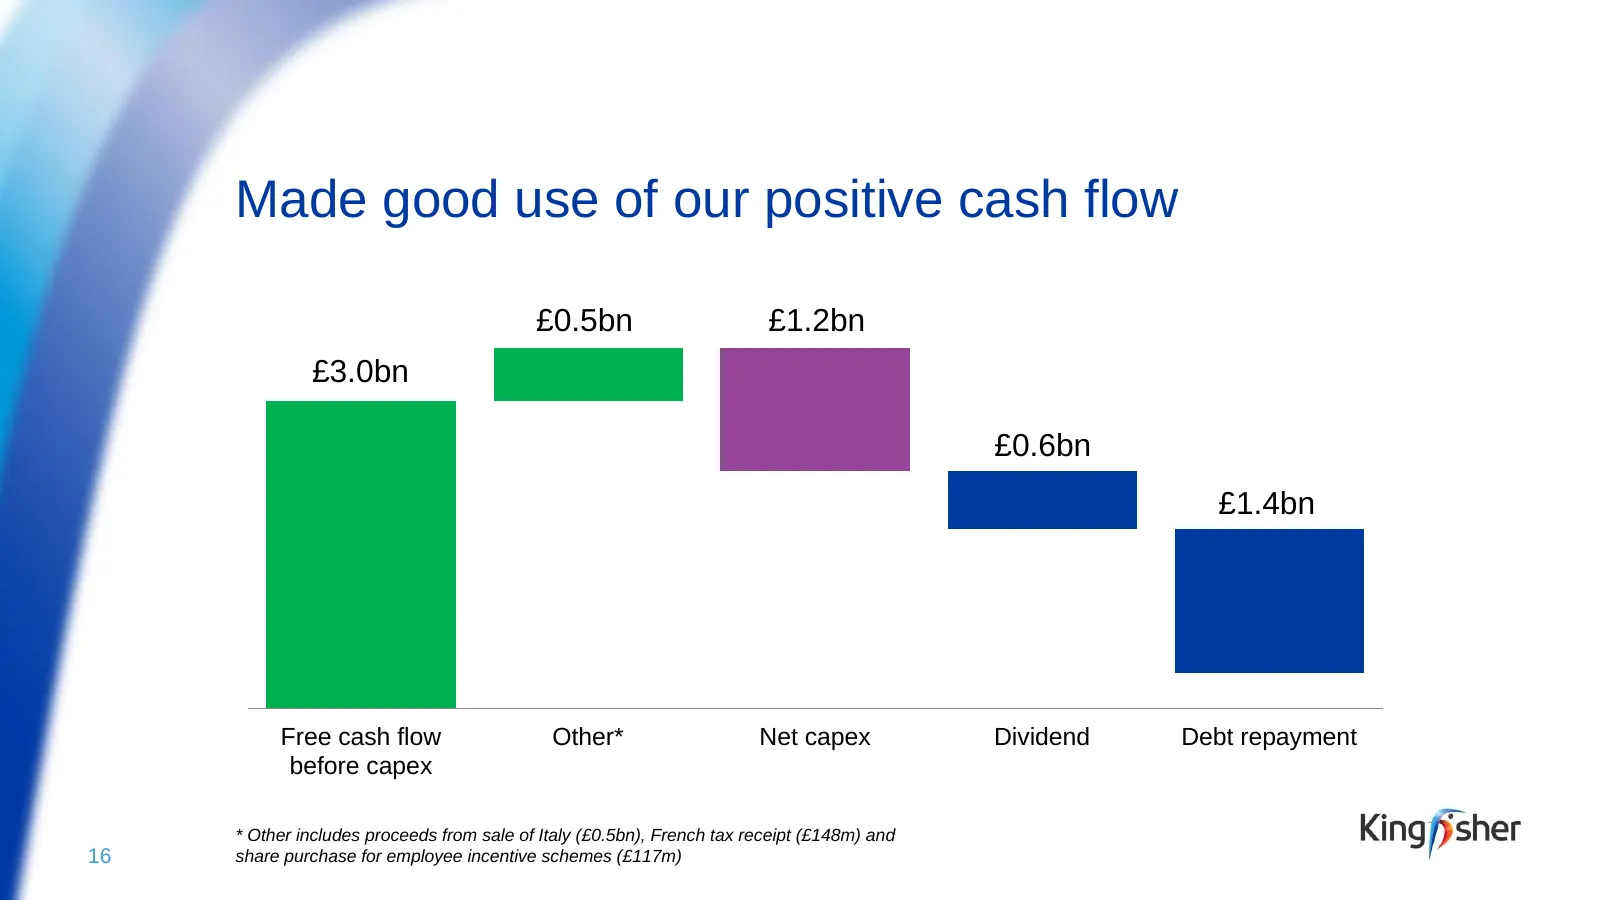
Made good use of our positive cash flow £0.5bn £1.2bn £3.0bn £0.6bn £1.4bn Free cash flow Other* Net capex Dividend Debt repayment before capex * Other includes proceeds from sale of Italy (£0.5bn), French tax receipt (£148m) and 16 share purchase for employee incentive schemes (£117m)
Slide 15: Success has been built on people engagement
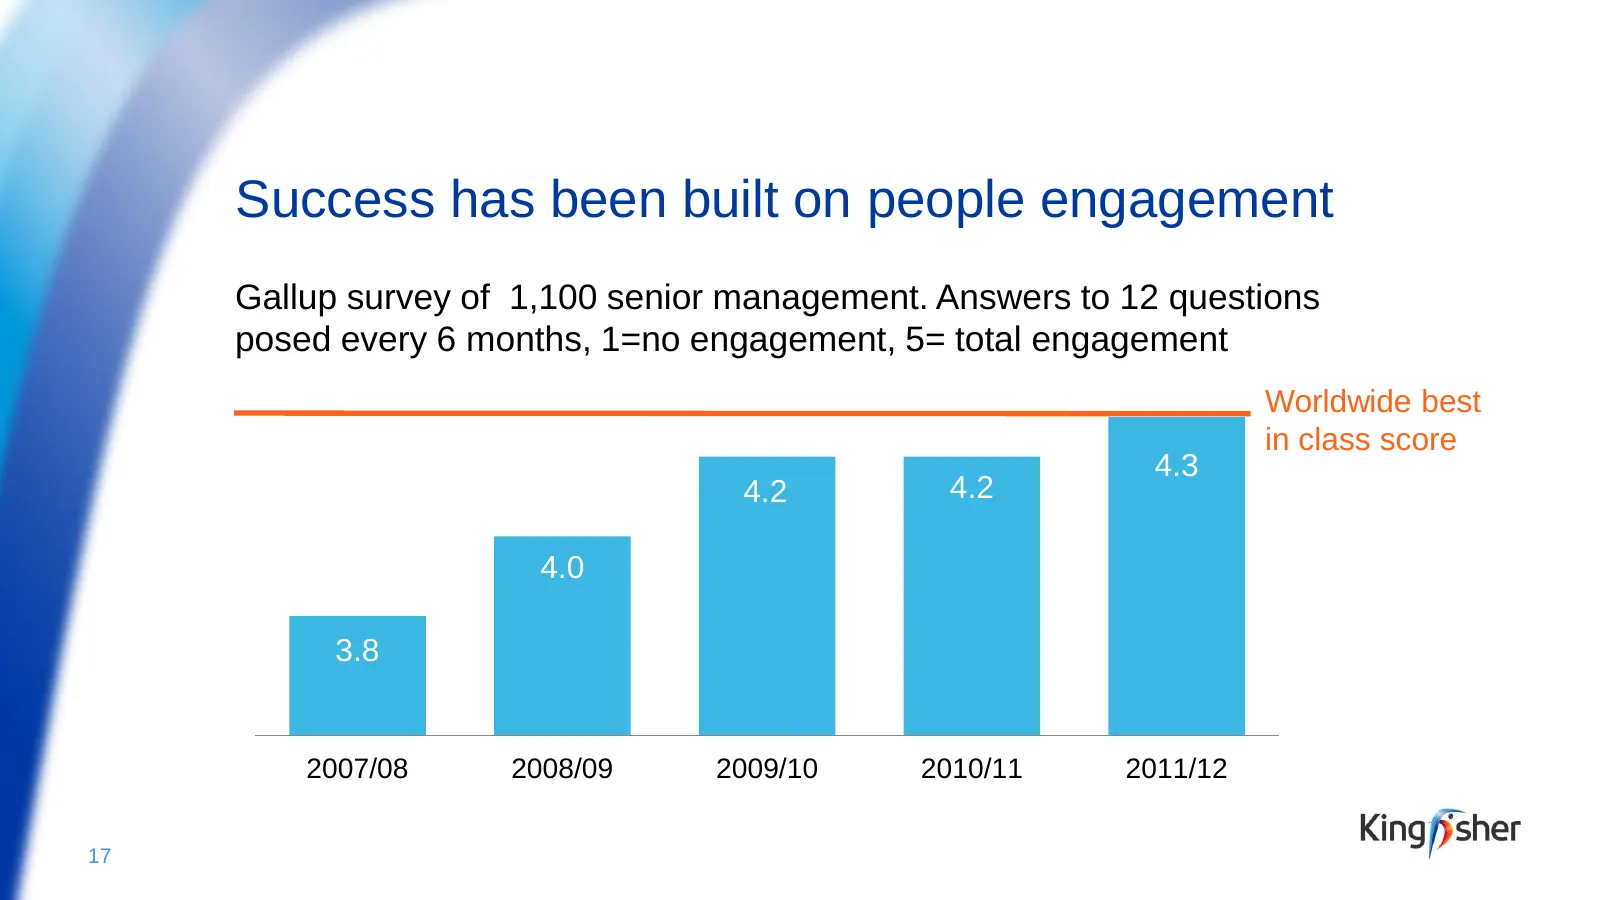
Success has been built on people engagement Gallup survey of 1,100 senior management. Answers to 12 questions posed every 6 months, 1=no engagement, 5= total engagement Worldwide best in class score 4.3 4.2 4.2 4.0 3.8 2007/08 2008/09 2009/10 2010/11 2011/12 17
Slide 16: Made our own operations more sustainable
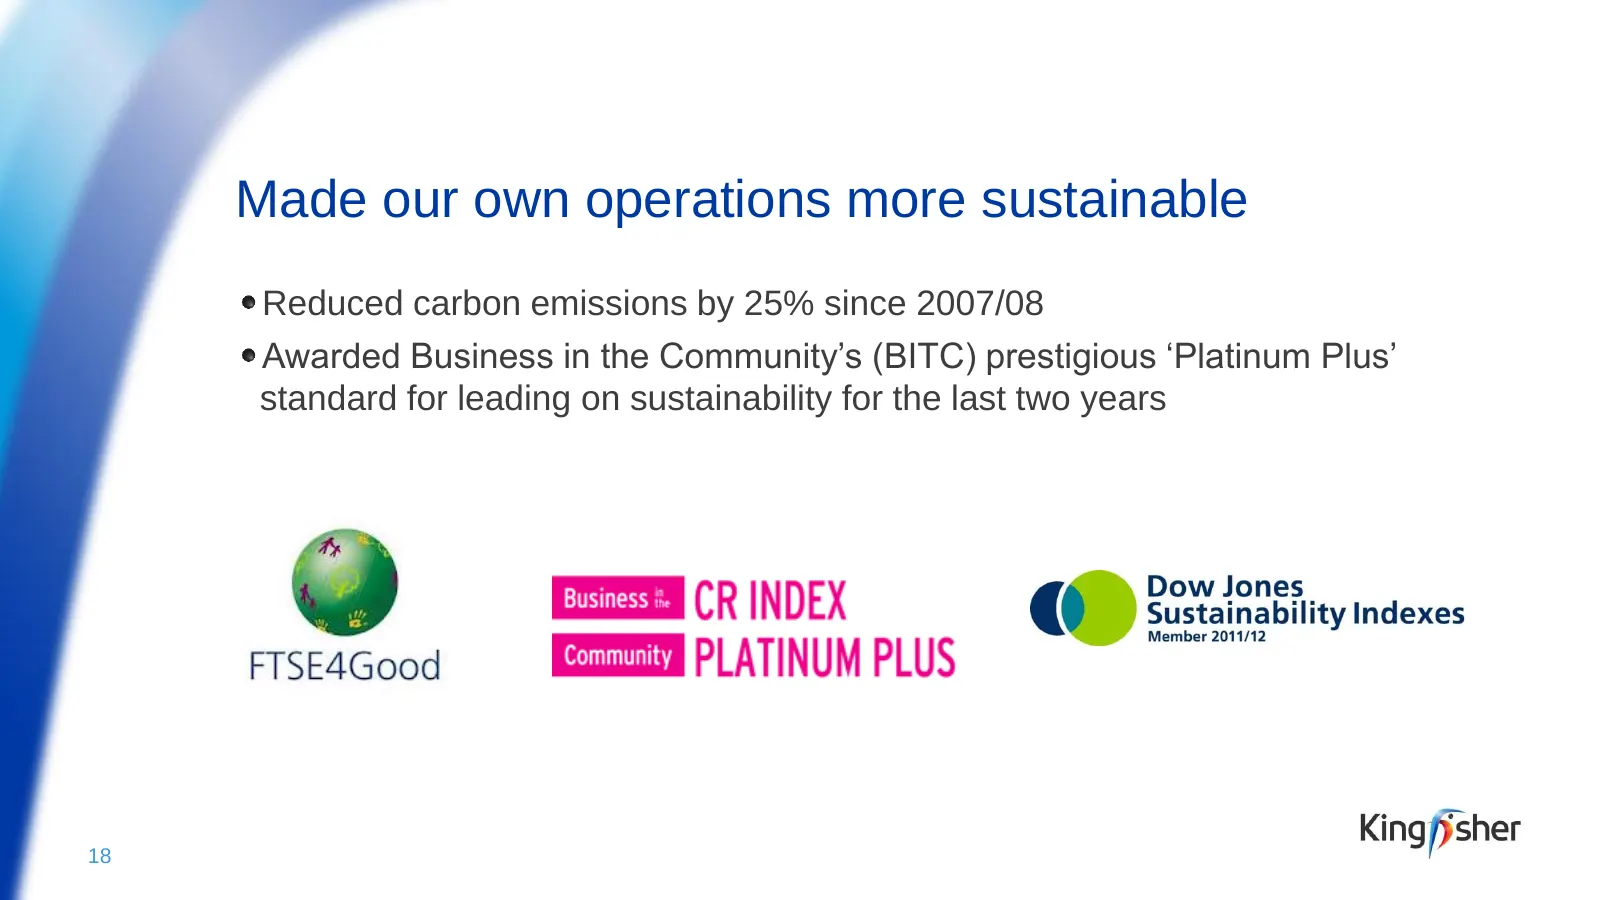
Made our own operations more sustainable Reduced carbon emissions by 25% since 2007/08 Awarded Business in the Community’s (BITC) prestigious ‘Platinum Plus’ standard for leading on sustainability for the last two years 18
Slide 17: Helped customers live more sustainably
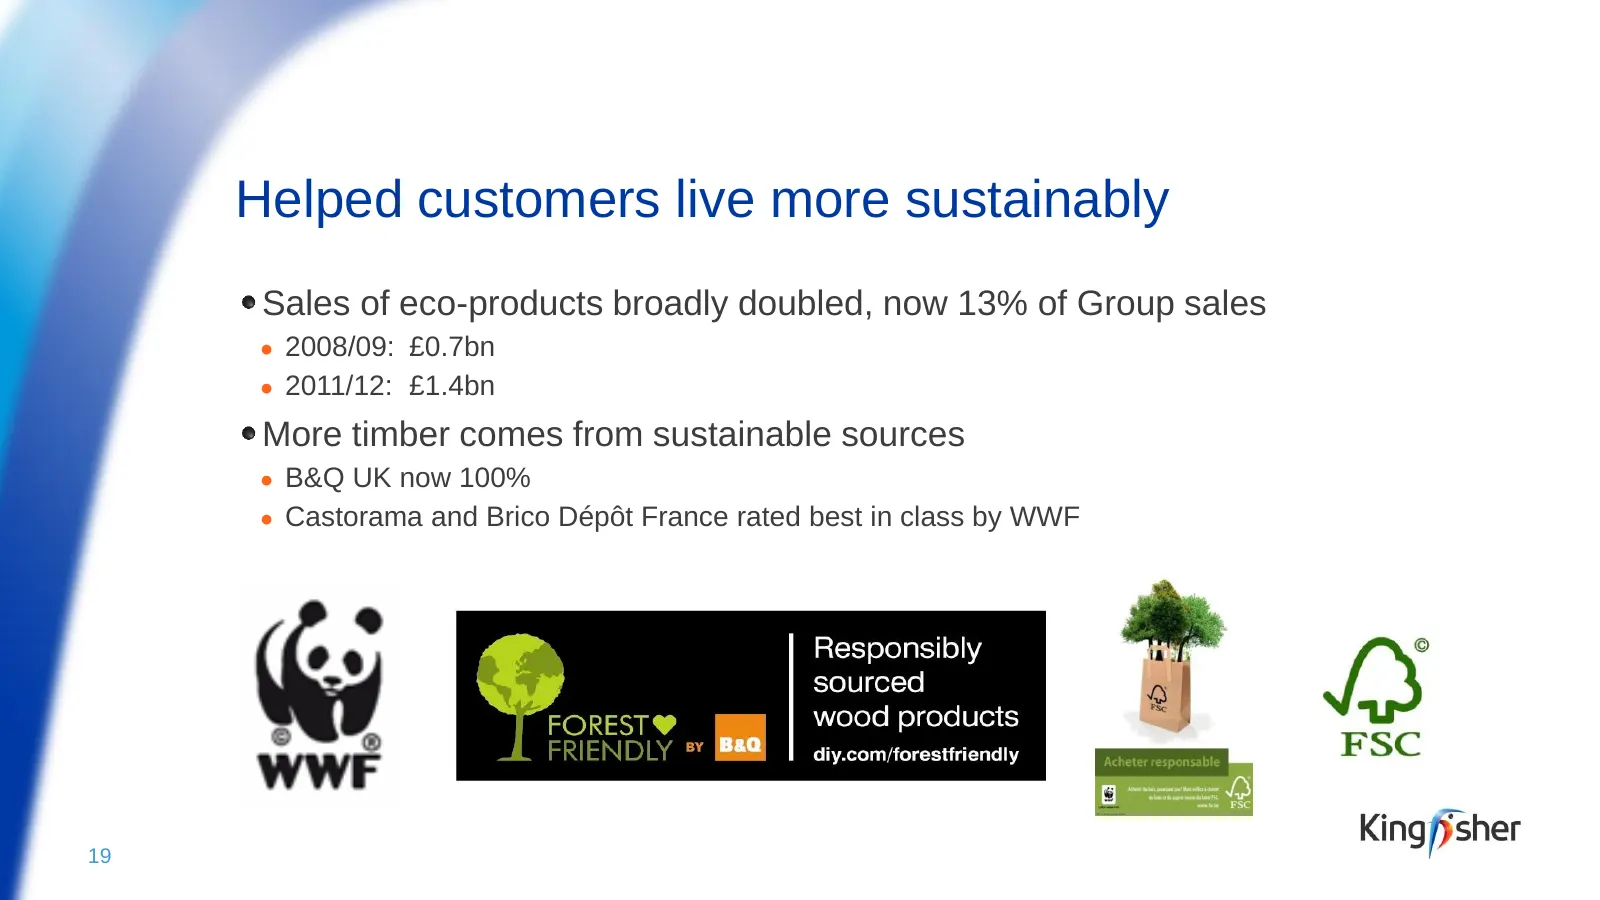
Helped customers live more sustainably Sales of eco-products broadly doubled, now 13% of Group sales ● 2008/09: £0.7bn ● 2011/12: £1.4bn More timber comes from sustainable sources ● B&Q UK now 100% ● Castorama and Brico Dépôt France rated best in class by WWF 19
Slide 18: Kevin O’Byrne, Group Finance Director
Kevin O’Byrne Group Finance Director
Slide 19: 2011/12 Financial results
2011/12 Financial results Adjusted pre-tax profit £807m, up 20.4% Free cash flow of £367m while investing for growth Reported financial net debt £88m Return on Capital 10.7%, KEP of £131m Dividends up 25.0% 21
Slide 20: Group sales up 3.3% in constant currencies
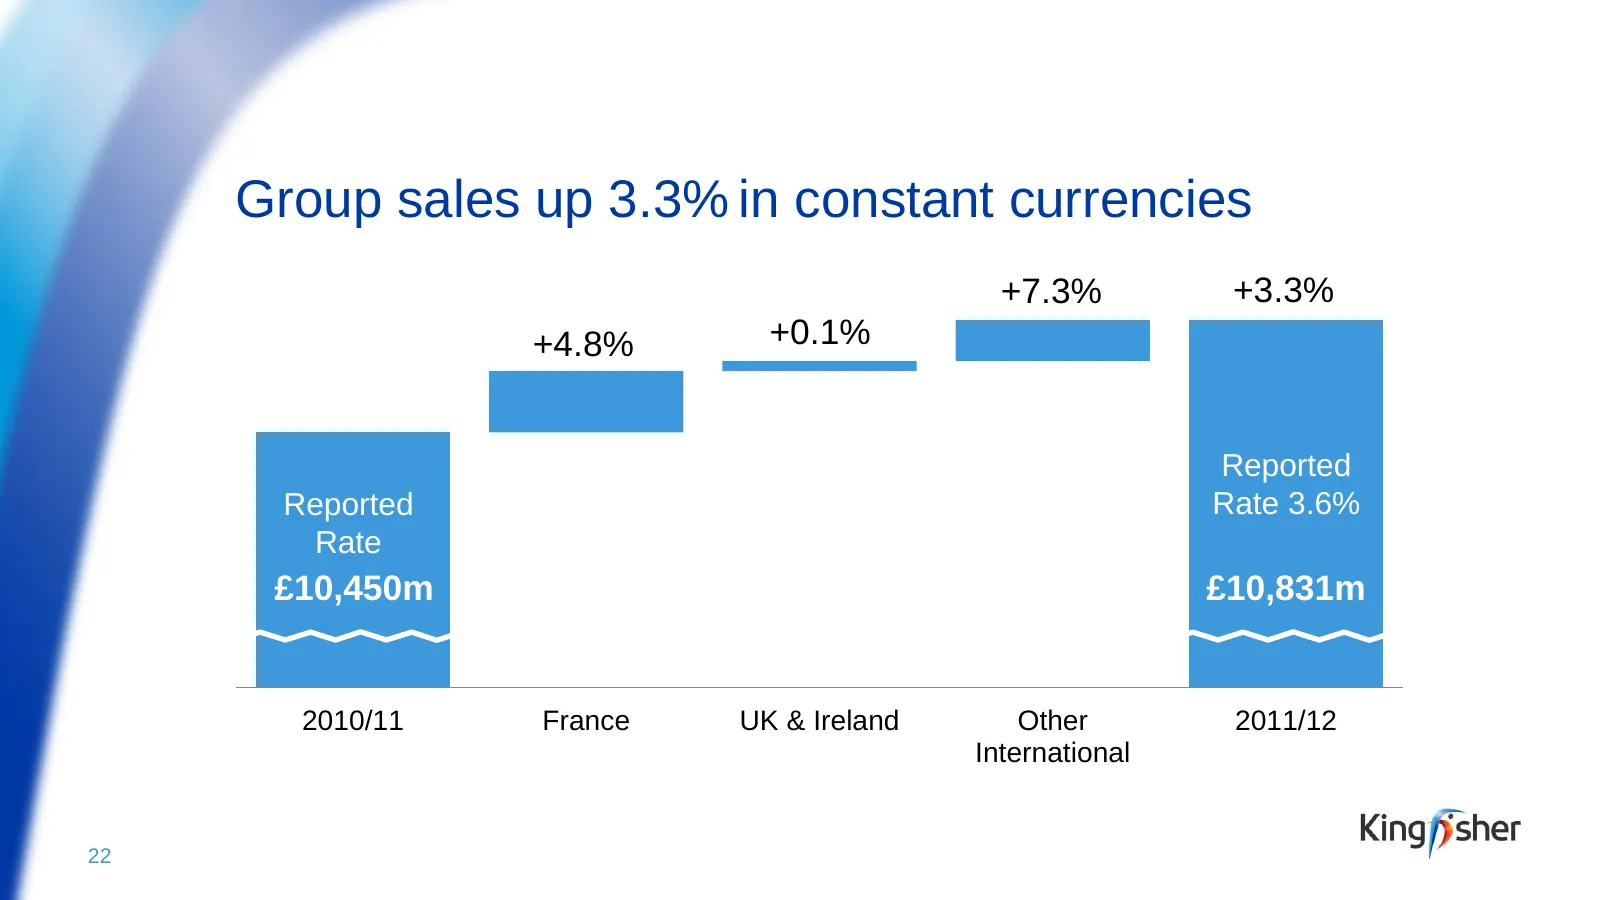
Group sales up 3.3% in constant currencies +7.3% +3.3% +4.8% +0.1% Reported Reported Rate 3.6% Rate £10,450m £10,831m 2010/11 France UK & Ireland Other 2011/12 International 22
Slide 21: Group retail profit up 15.8% in constant currencies
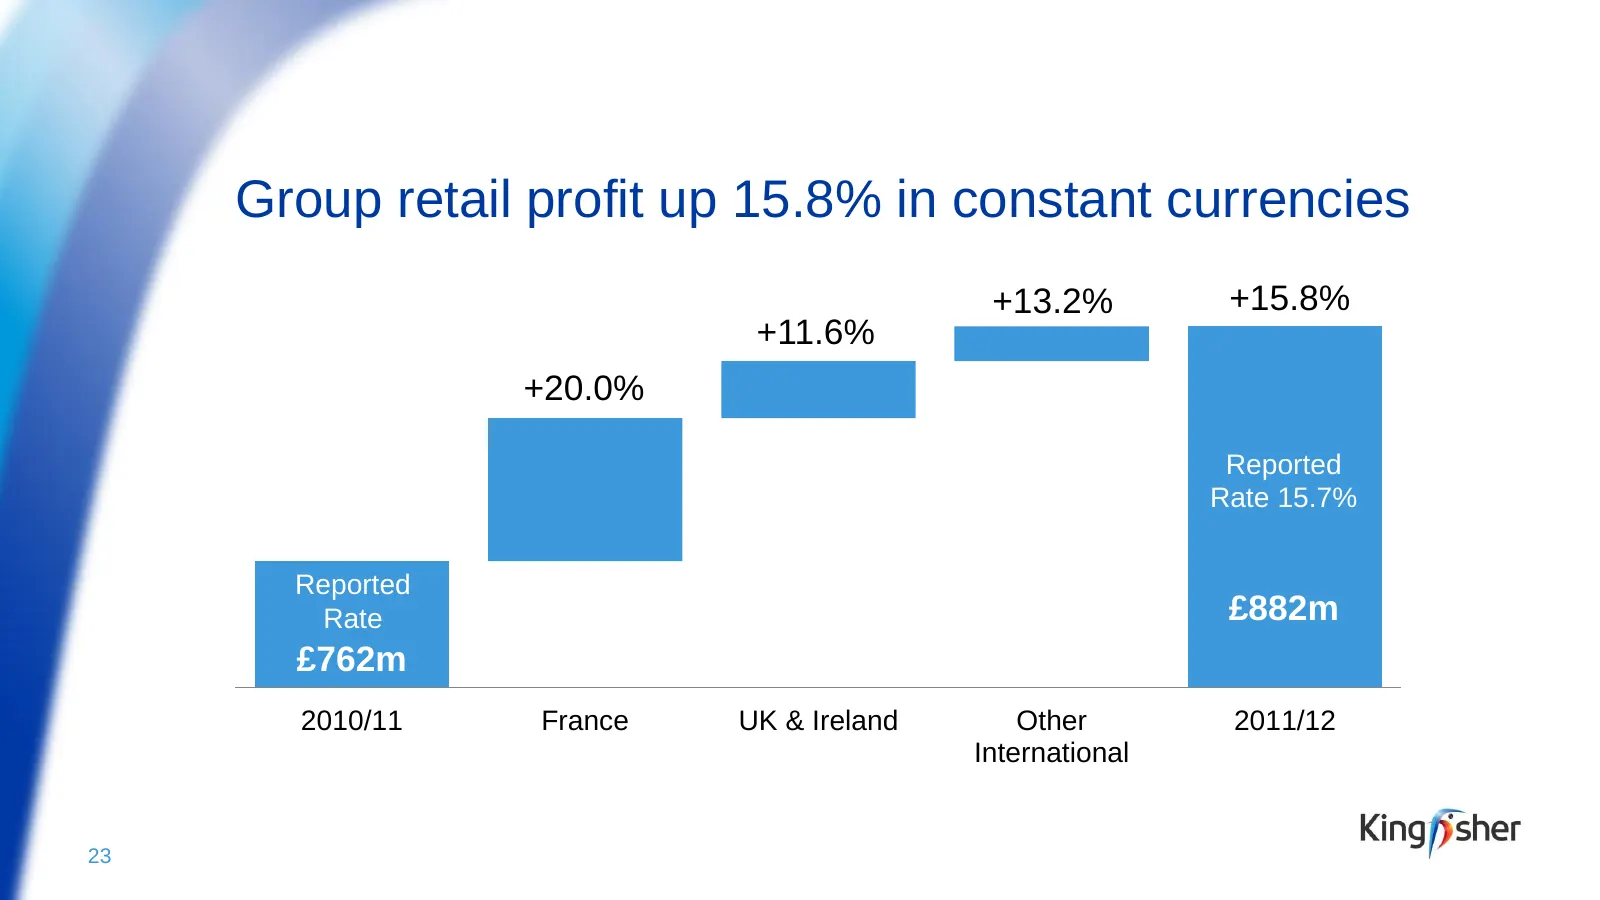
Group retail profit up 15.8% in constant currencies +13.2% +15.8% +11.6% +20.0% Reported Rate 15.7% Reported Rate £882m £762m 2010/11 France UK & Ireland Other 2011/12 International 23
Slide 22: 2011/12 - Financial highlights
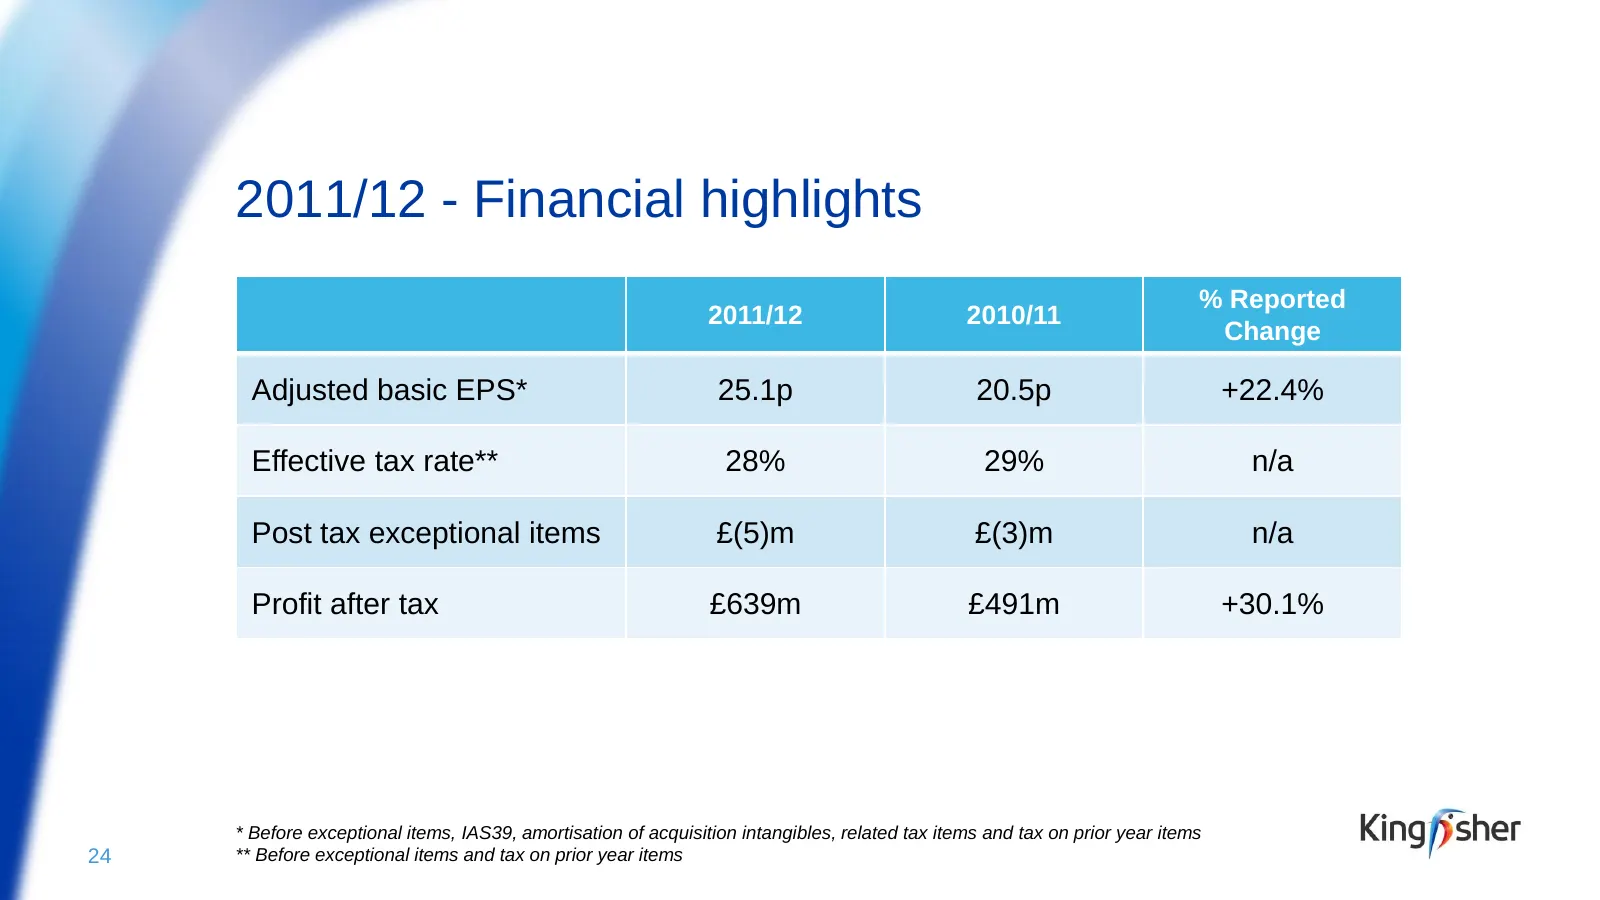
2011/12 - Financial highlights % Reported 2011/12 2010/11 Change Adjusted basic EPS* 25.1p 20.5p +22.4% Effective tax rate** 28% 29% n/a Post tax exceptional items £(5)m £(3)m n/a Profit after tax £639m £491m +30.1% * Before exceptional items, IAS39, amortisation of acquisition intangibles, related
Slide 23: Free cash flow
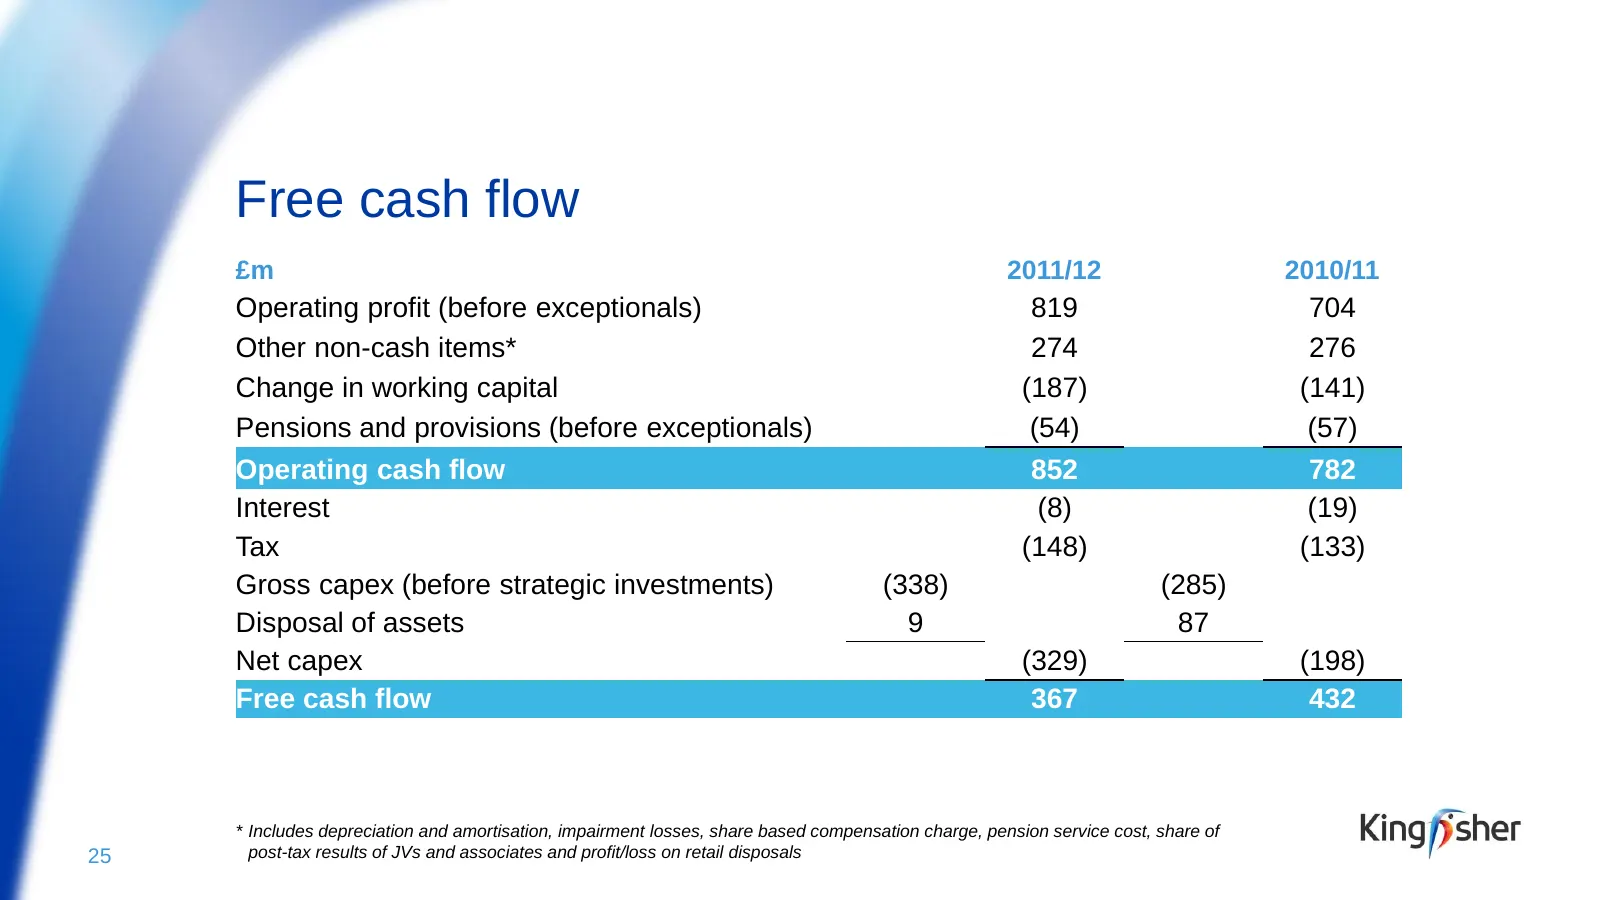
Free cash flow £m 2011/12 2010/11 Operating profit (before exceptionals) 819 704 Other non-cash items* 274 276 Change in working capital (187) (141) Pensions and provisions (before exceptionals) (54) (57) Operating cash flow 852 782 Interest (8) (19) Tax (148) (133) Gross capex (before strategic inv
Slide 24: Use of free cashflow
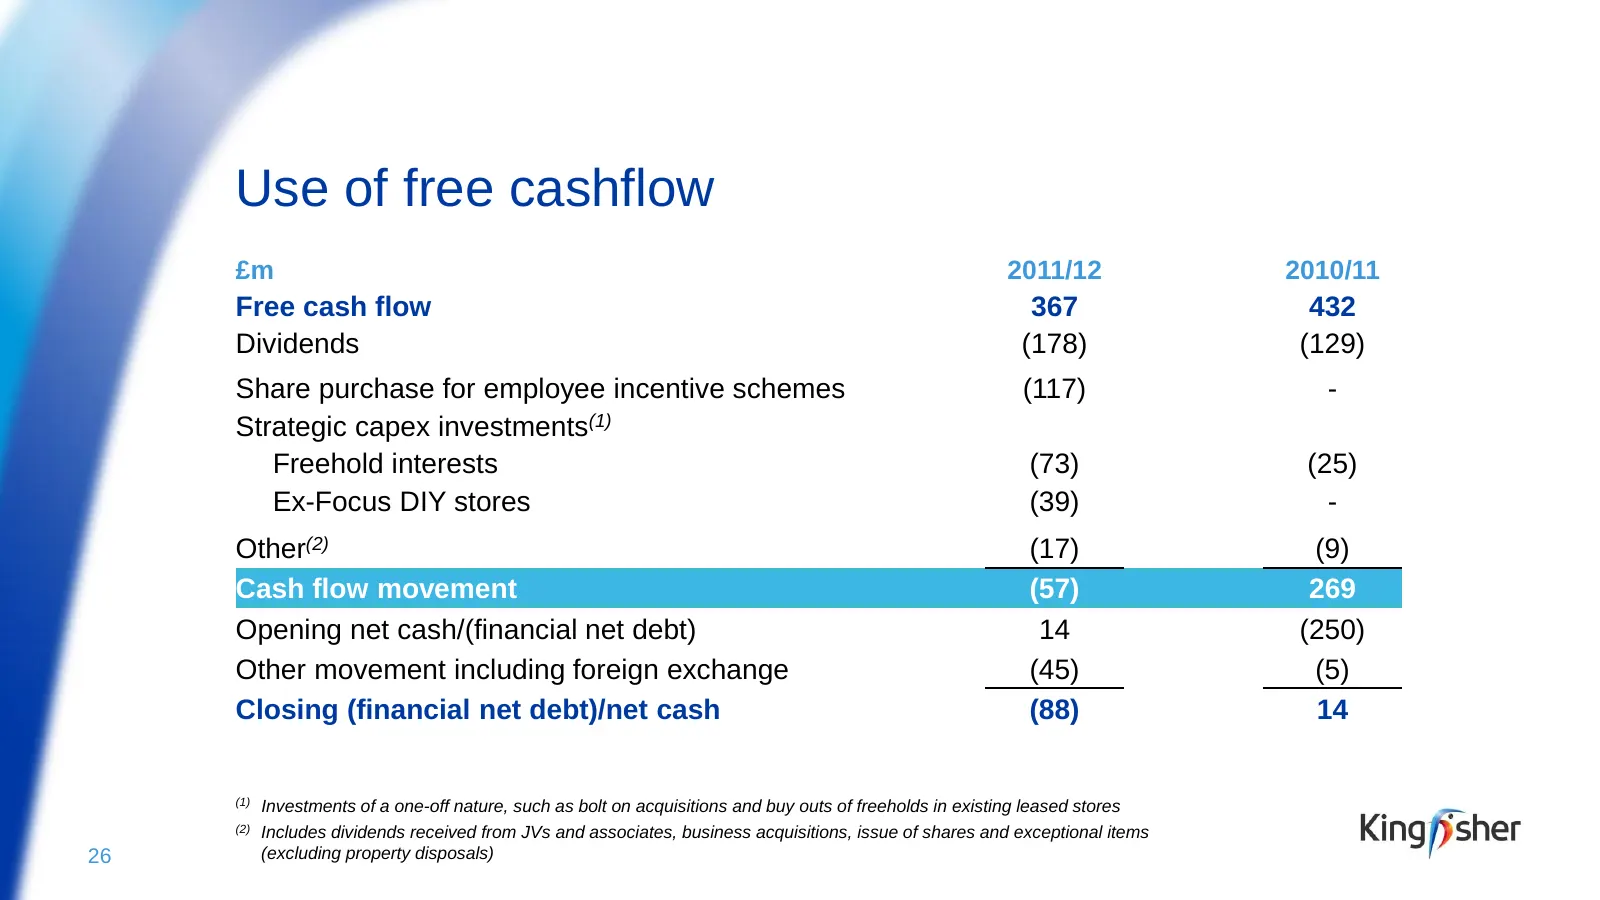
Use of free cashflow £m 2011/12 2010/11 Free cash flow 367 432 Dividends (178) (129) Share purchase for employee incentive schemes (117) - Strategic capex investments(1) Freehold interests (73) (25) Ex-Focus DIY stores (39) - Other(2) (17) (9) Cash flow movement (57) 269 Opening net cash/(financial
Slide 25: Higher growth investment
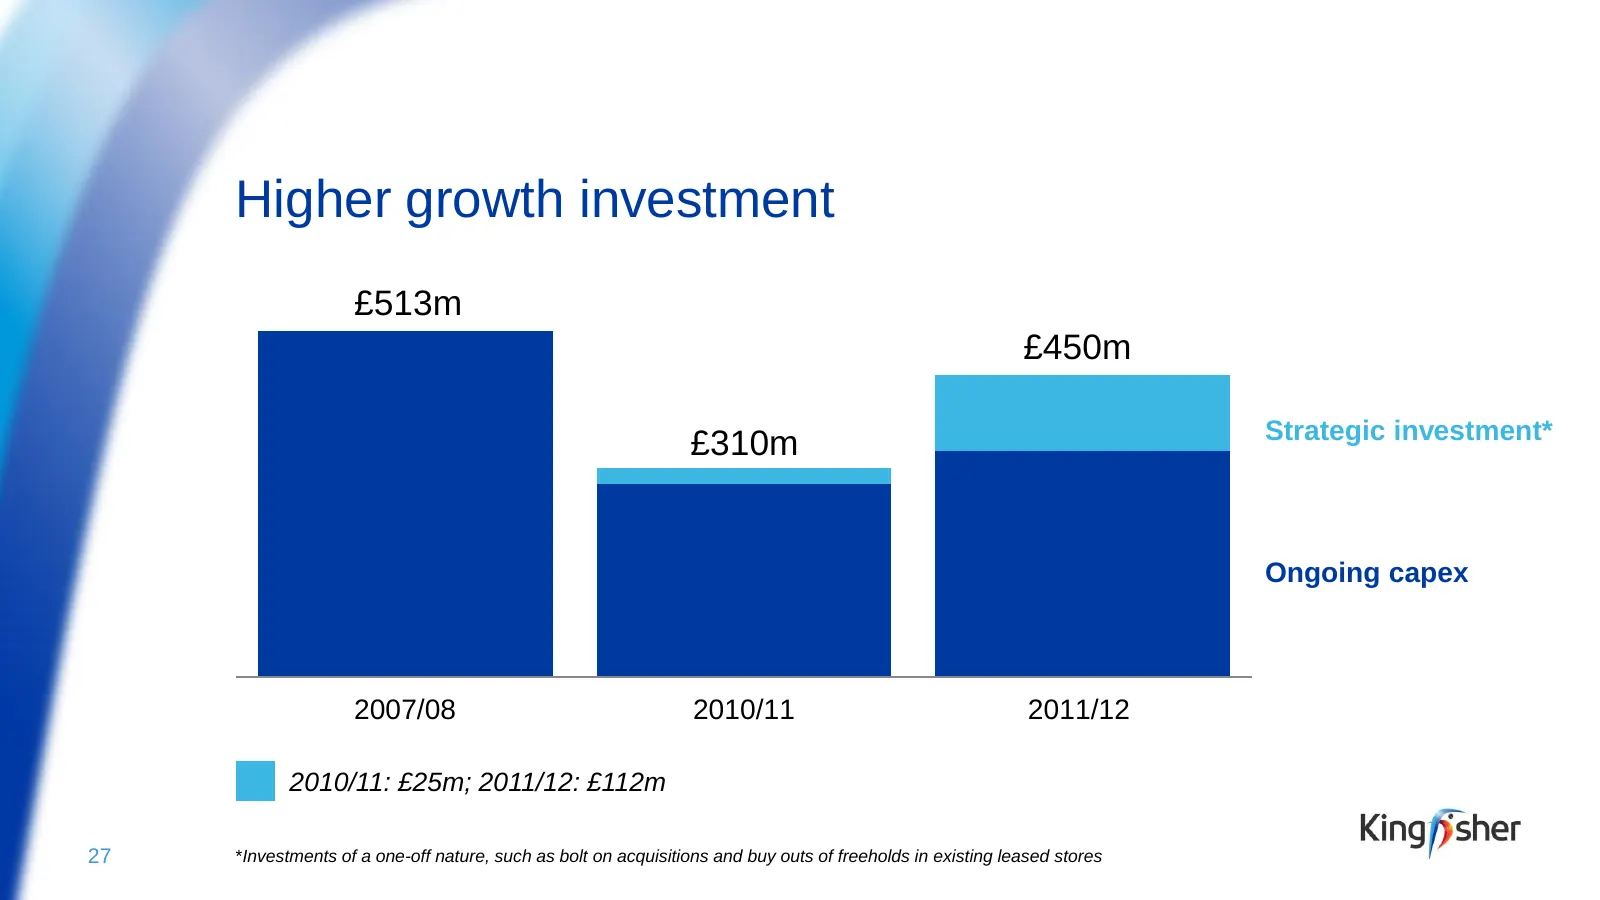
Higher growth investment £513m £450m Strategic investment* £310m Ongoing capex 2007/08 2010/11 2011/12 2010/11: £25m; 2011/12: £112m 27 *Investments of a one-off nature, such as bolt on acquisitions and buy outs of freeholds in existing leased stores
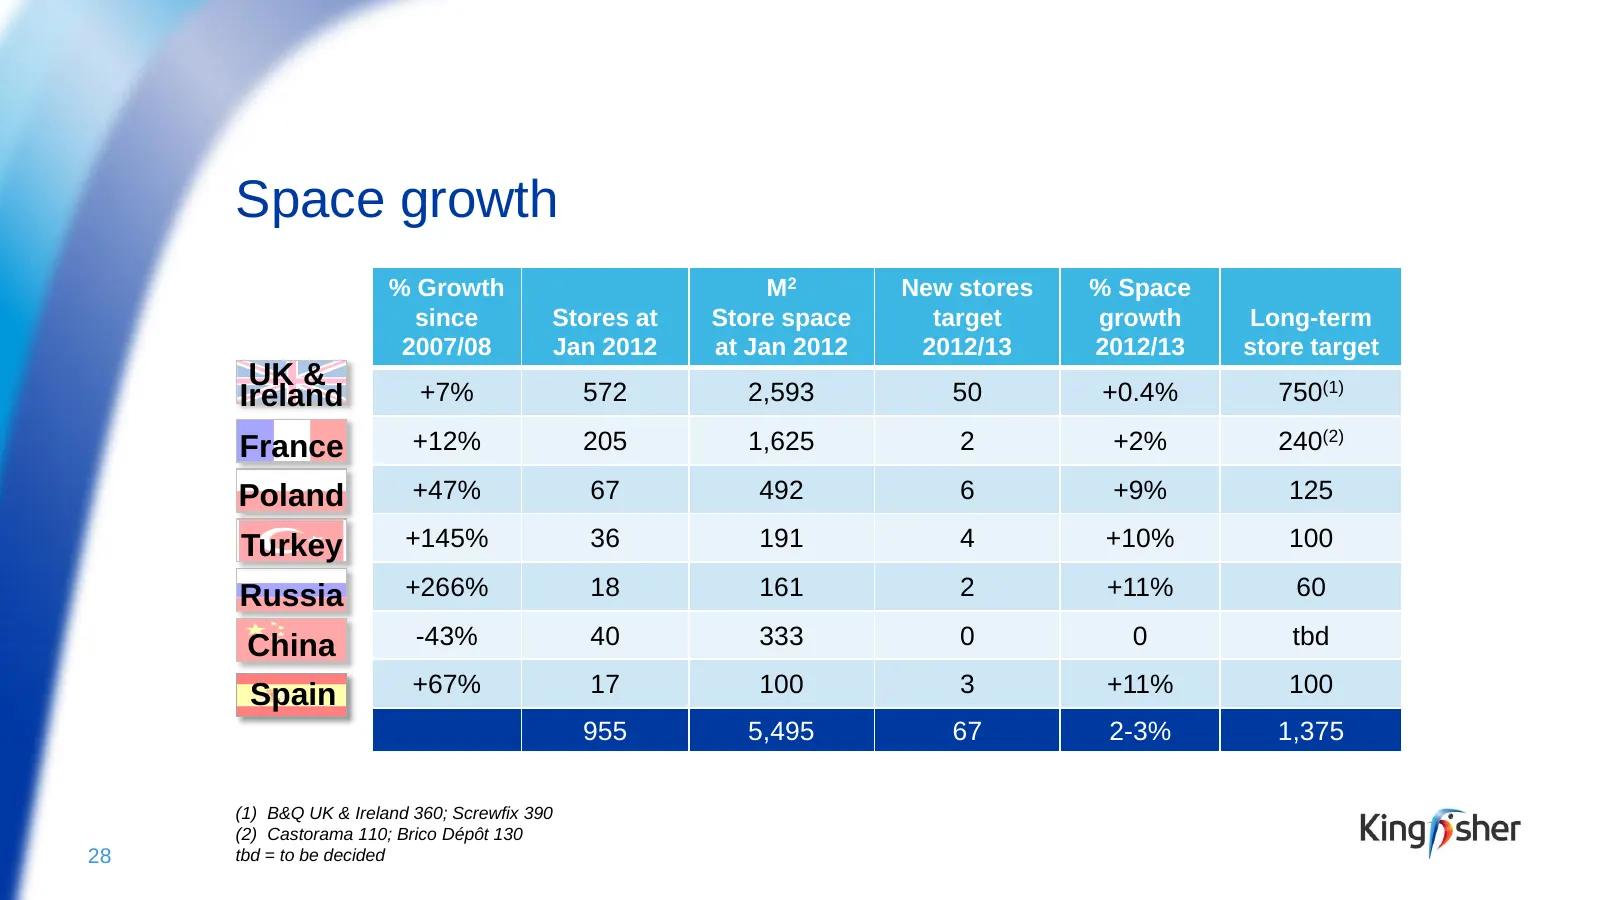
Slide 26: Space growth
Space growth % Growth M2 New stores % Space since Stores at Store space target growth Long-term 2007/08 Jan 2012 at Jan 2012 2012/13 2012/13 store target UK & Ireland +7% 572 2,593 50 +0.4% 750(1) France +12% 205 1,625 2 +2% 240(2) Poland +47% 67 492 6 +9% 125 Turkey +145% 36 191 4 +10% 100 Russia +
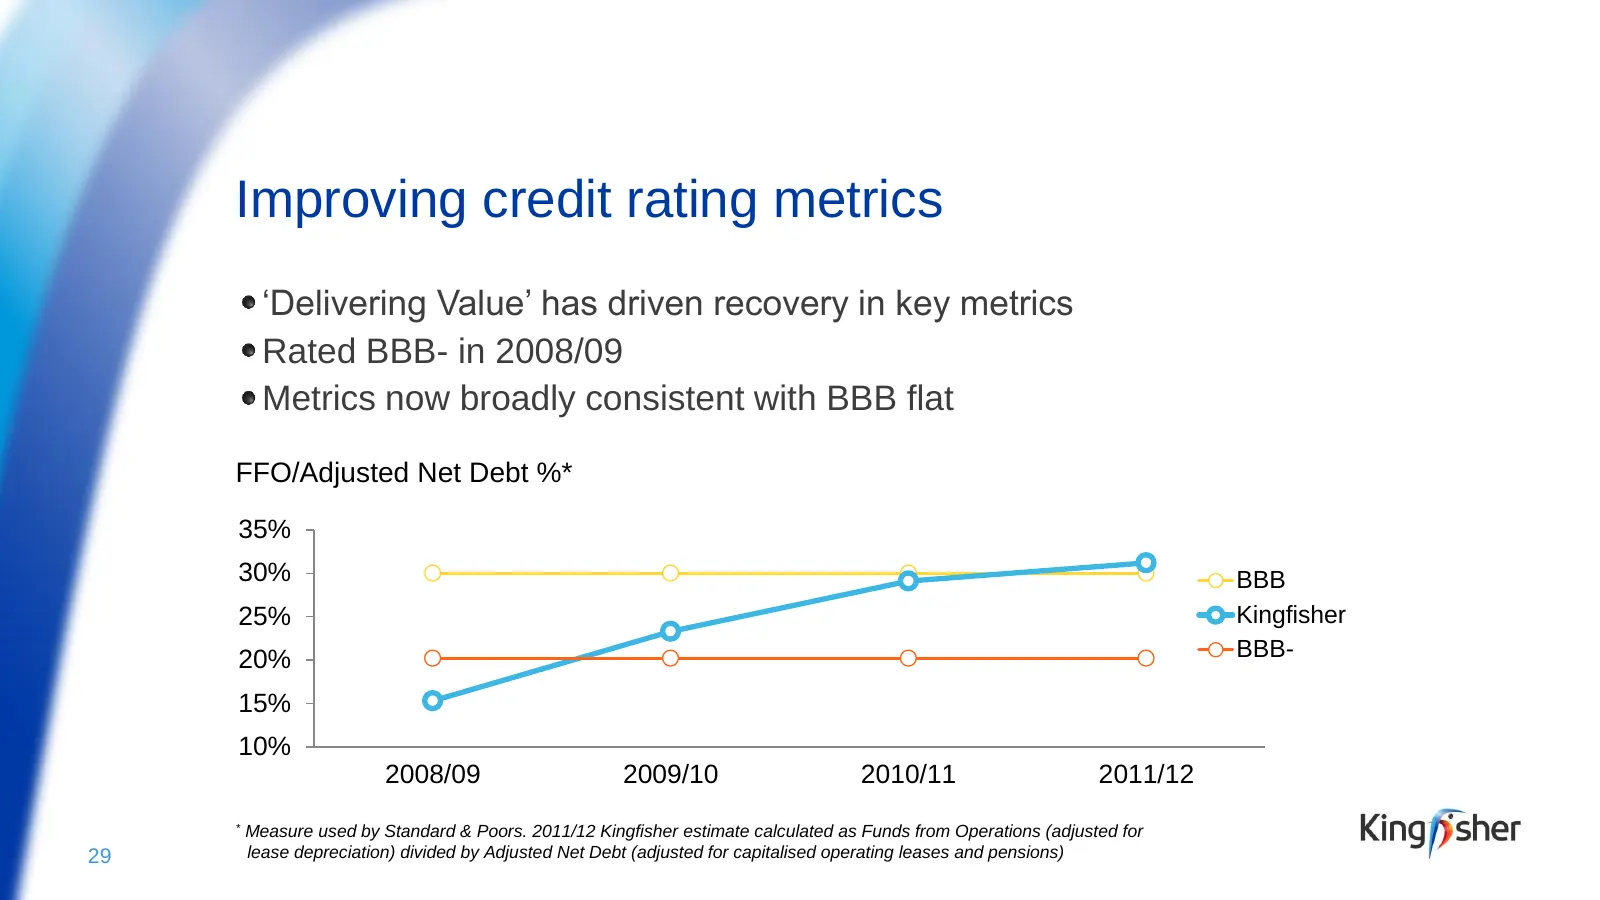
Slide 27: Improving credit rating metrics
Improving credit rating metrics ‘Delivering Value’ has driven recovery in key metrics Rated BBB- in 2008/09 Metrics now broadly consistent with BBB flat FFO/Adjusted Net Debt %* 35% 30% BBB 25% Kingfisher 20% BBB- 15% 10% 2008/09 2009/10 2010/11 2011/12 * Measure used by Standard & Poors. 2011/12 Ki
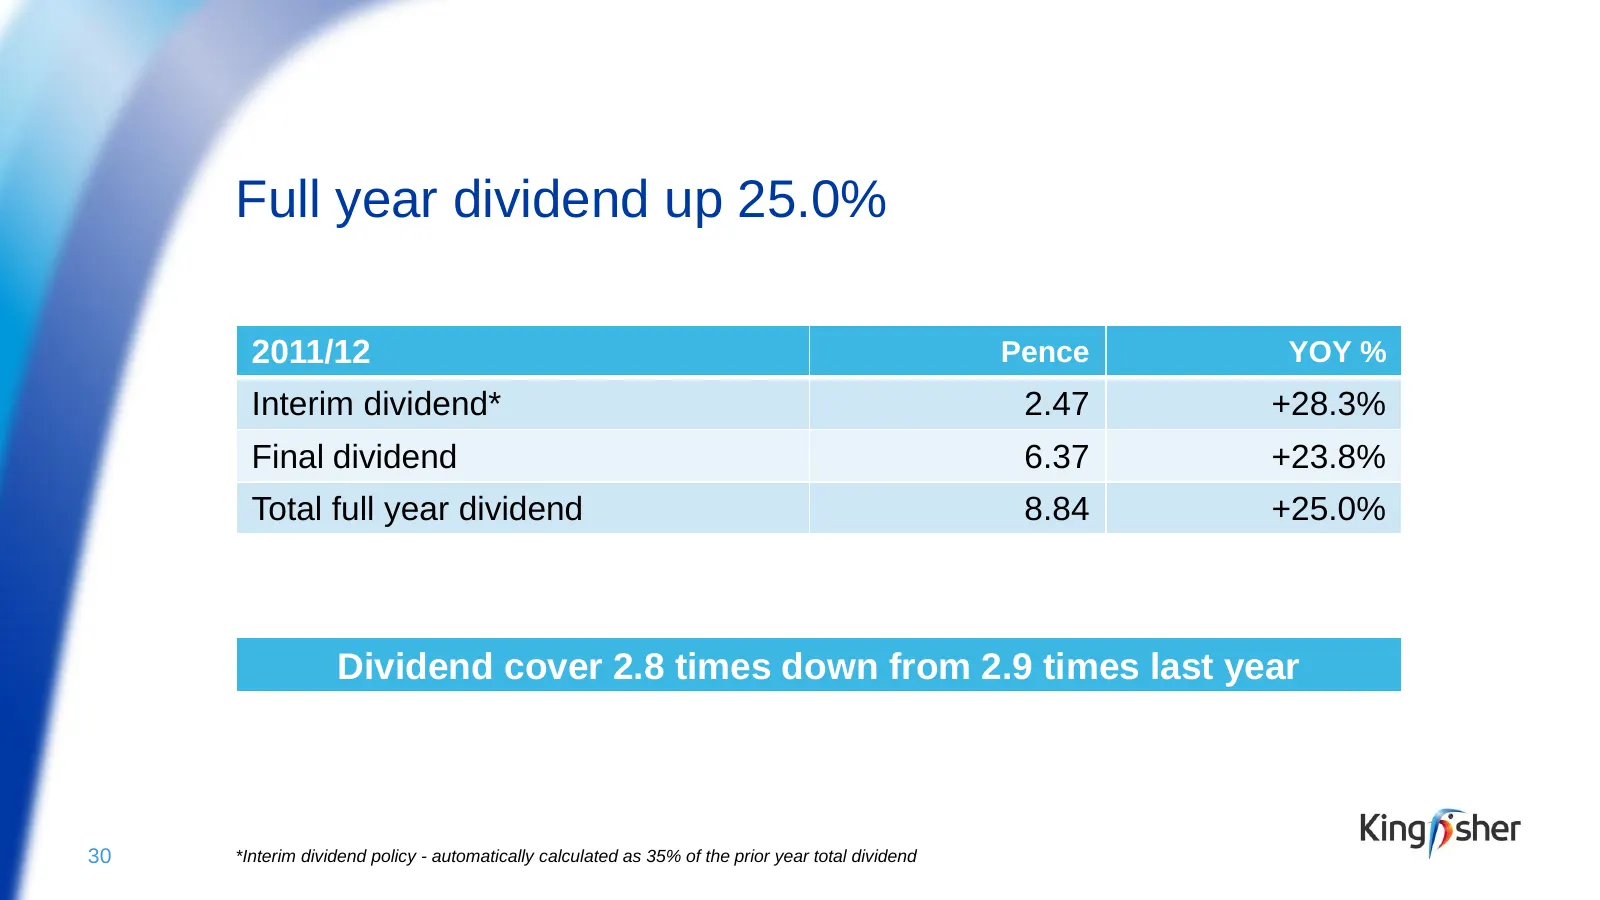
Slide 28: Full year dividend up 25.0%
Full year dividend up 25.0% 2011/12 Pence YOY % Interim dividend* 2.47 +28.3% Final dividend 6.37 +23.8% Total full year dividend 8.84 +25.0% Dividend cover 2.8 times down from 2.9 times last year 30 *Interim dividend policy - automatically calculated as 35% of the prior year total dividend
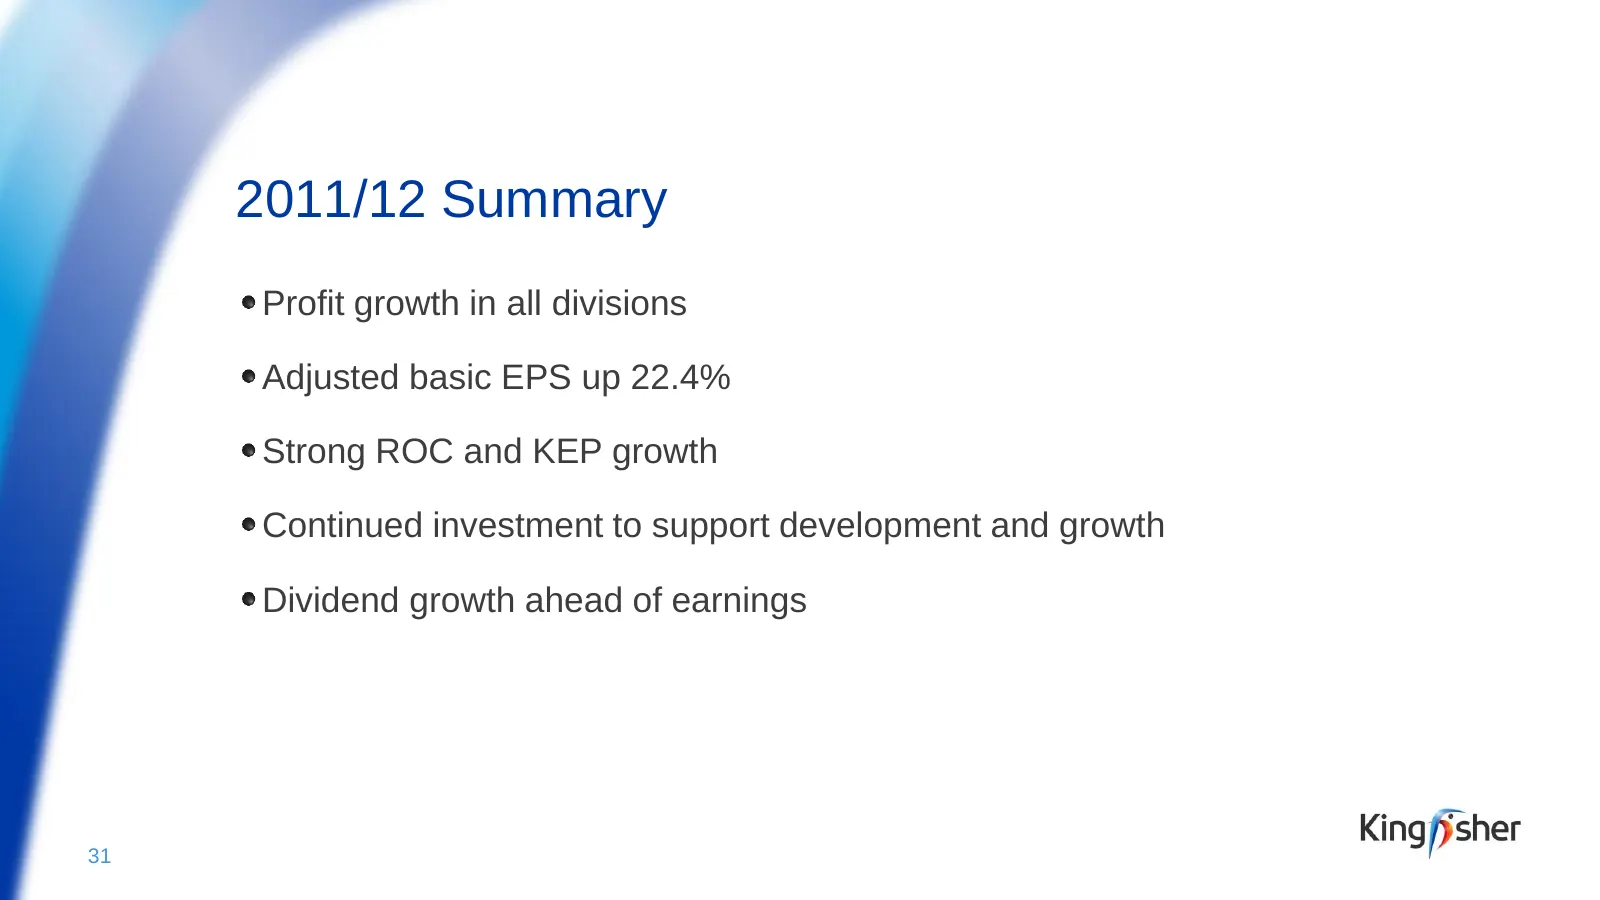
Slide 29: 2011/12 Summary
2011/12 Summary Profit growth in all divisions Adjusted basic EPS up 22.4% Strong ROC and KEP growth Continued investment to support development and growth Dividend growth ahead of earnings 31

Slide 30: Ian Cheshire, Group Chief Executive
Ian Cheshire Group Chief Executive
Slide 31: We operate in an attractive sector of retail
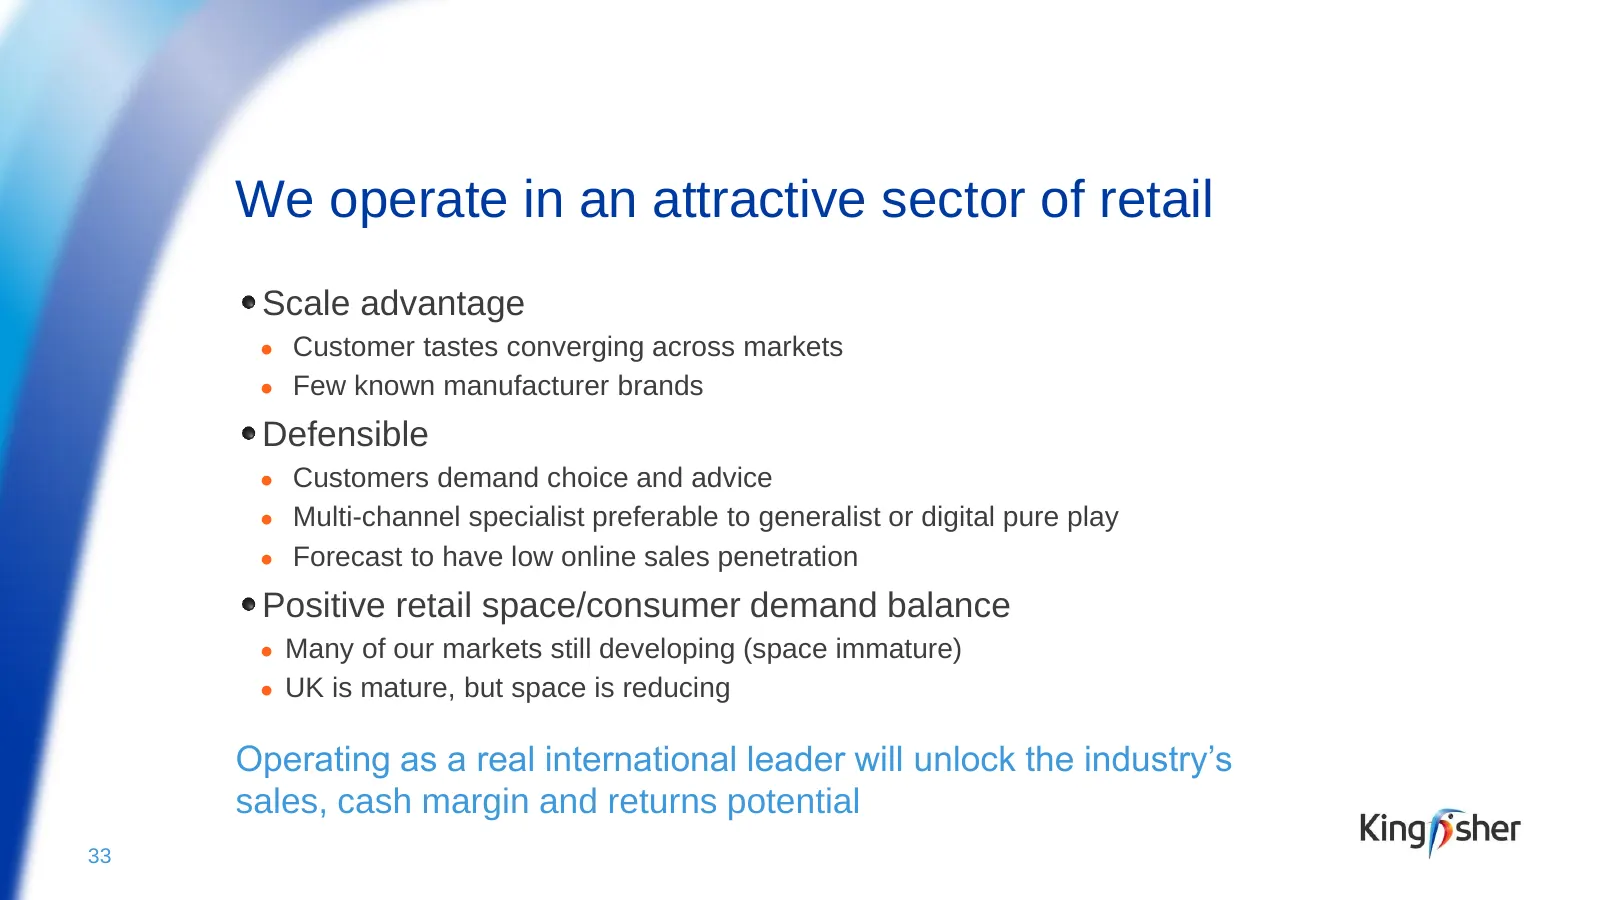
We operate in an attractive sector of retail Scale advantage ● Customer tastes converging across markets ● Few known manufacturer brands Defensible ● Customers demand choice and advice ● Multi-channel specialist preferable to generalist or digital pure play ● Forecast to have low online sales penetr
Slide 32: ‘Creating the Leader’
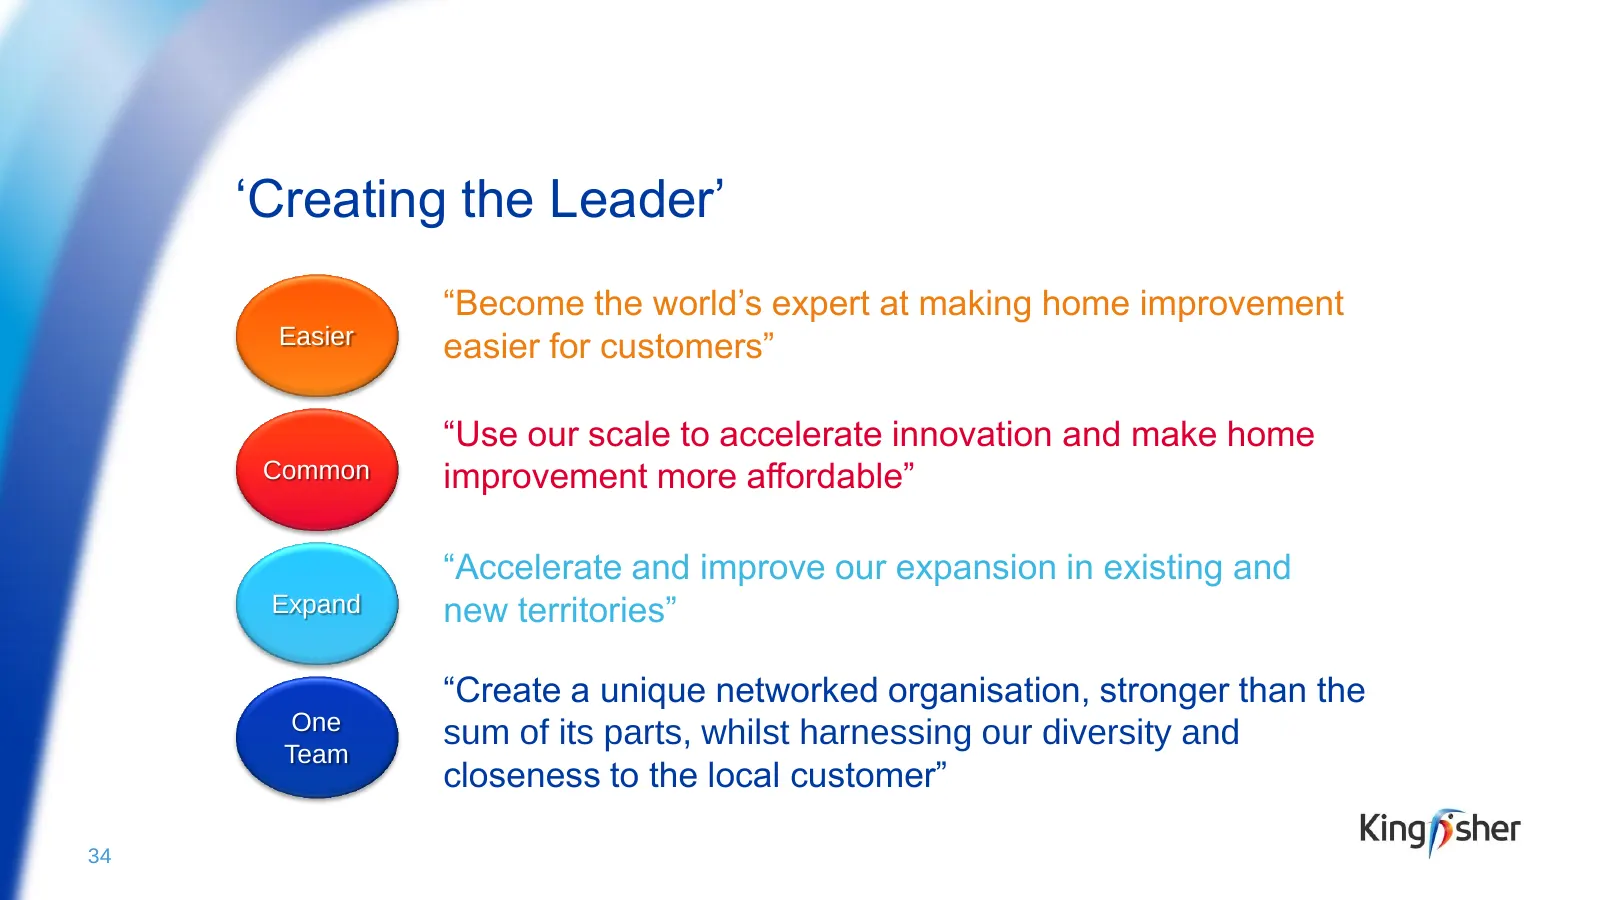
‘Creating the Leader’ “Become the world’s expert at making home improvement Easier easier for customers” “Use our scale to accelerate innovation and make home Common improvement more affordable” “Accelerate and improve our expansion in existing and Expand new territories” “Create a unique networked
Slide 33: ‘Creating the Leader’ – the right organisational structure
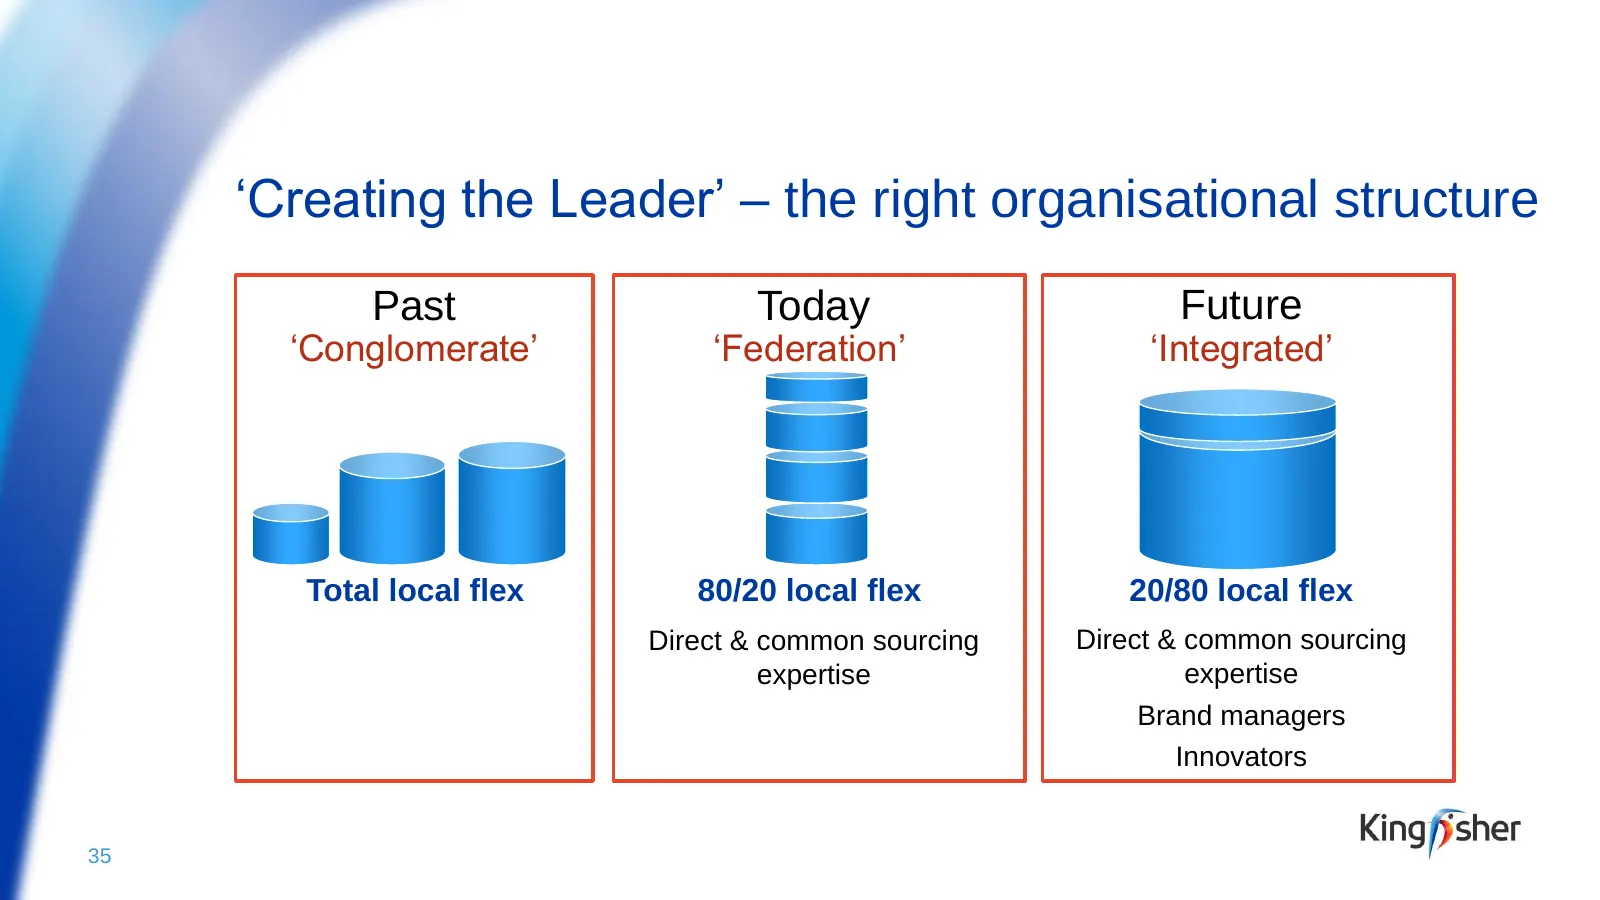
‘Creating the Leader’ – the right organisational structure Past Today Future ‘Conglomerate’ ‘Federation’ ‘Integrated’ Total local flex 80/20 local flex 20/80 local flex Direct & common sourcing Direct & common sourcing expertise expertise Brand managers Innovators 35
Slide 34: ‘Creating the Leader’ – the right organisational structure
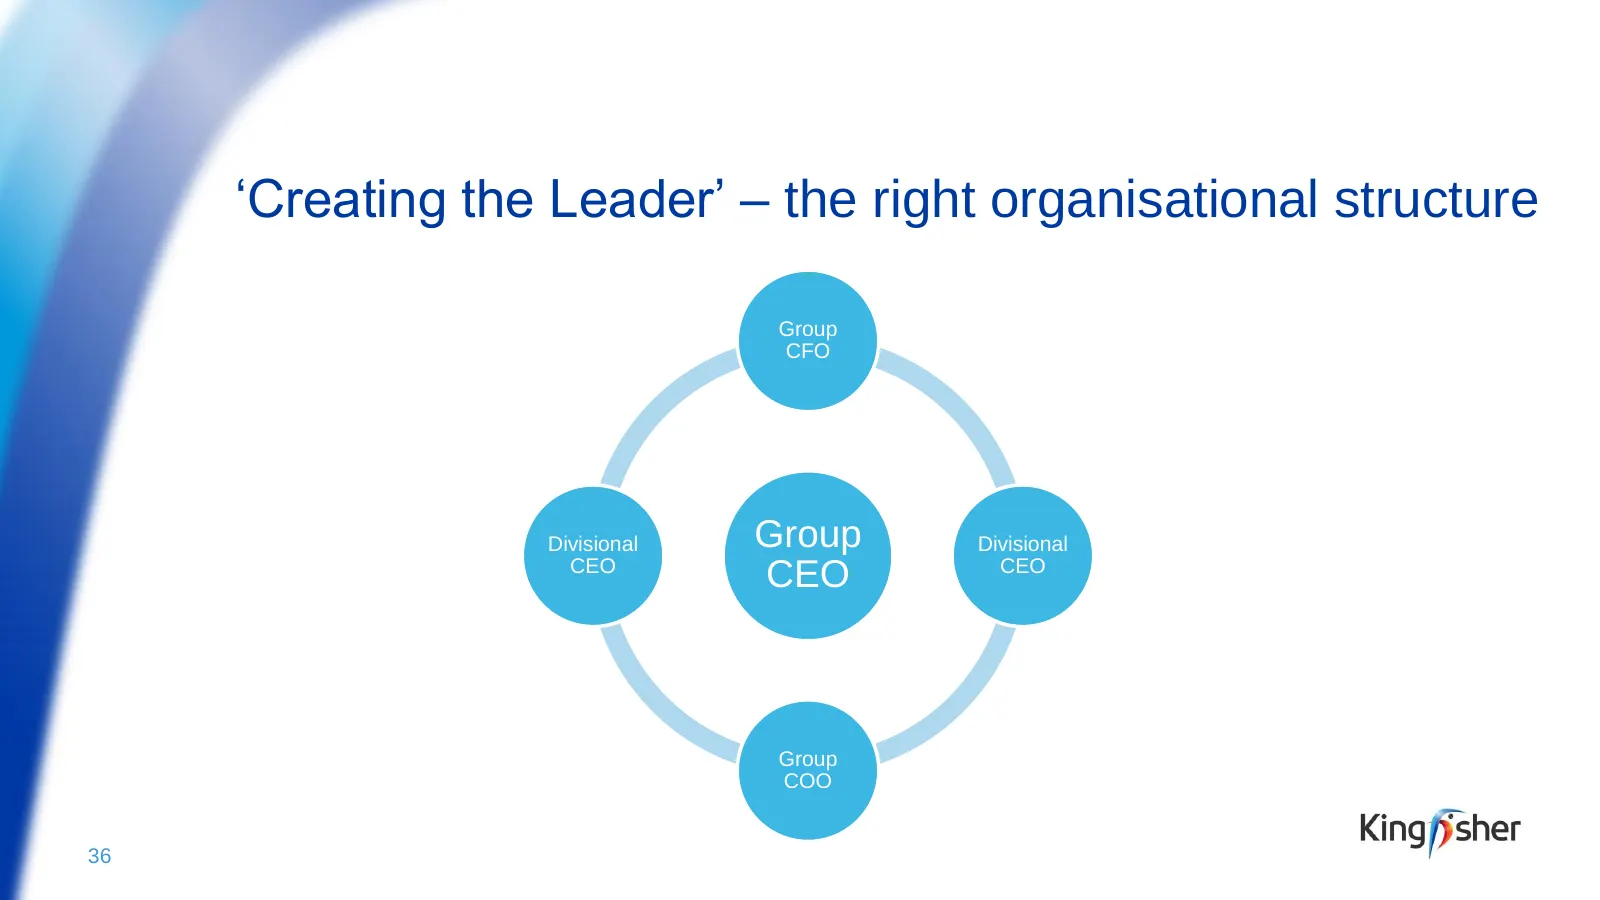
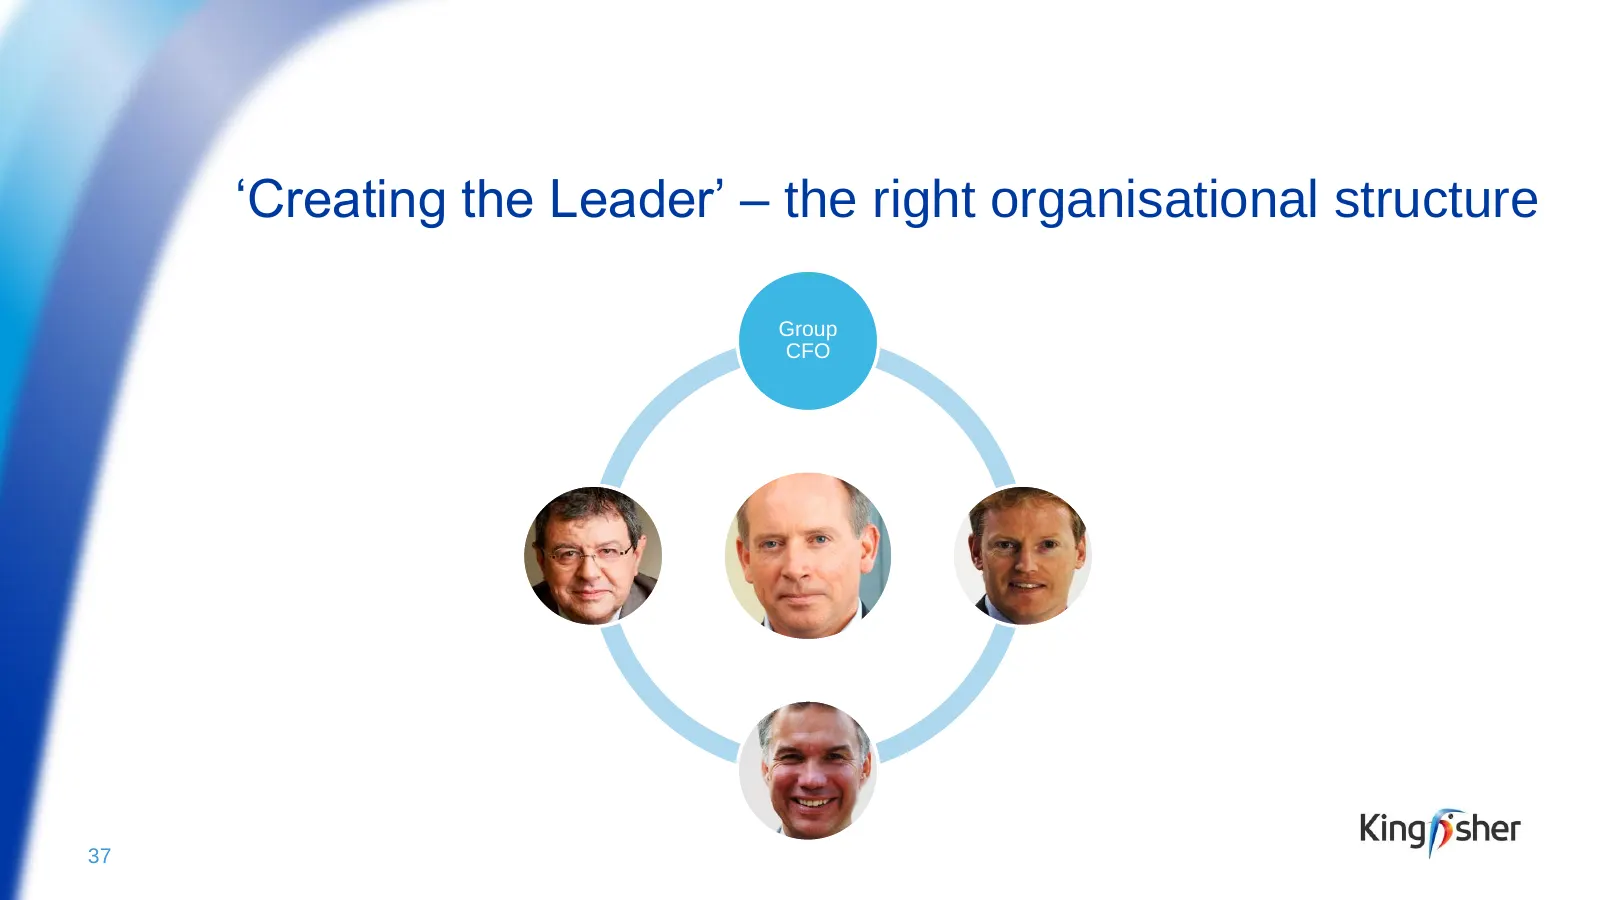
‘Creating the Leader’ – the right organisational structure Group CFO Divisional Group Divisional CEO CEO CEO Group COO 36
Slide 35: ‘Creating the Leader’ – the right organisational structure
‘Creating the Leader’ – the right organisational structure Group CFO 37
Slide 36: ‘Creating the Leader’ – strong team of CEOs
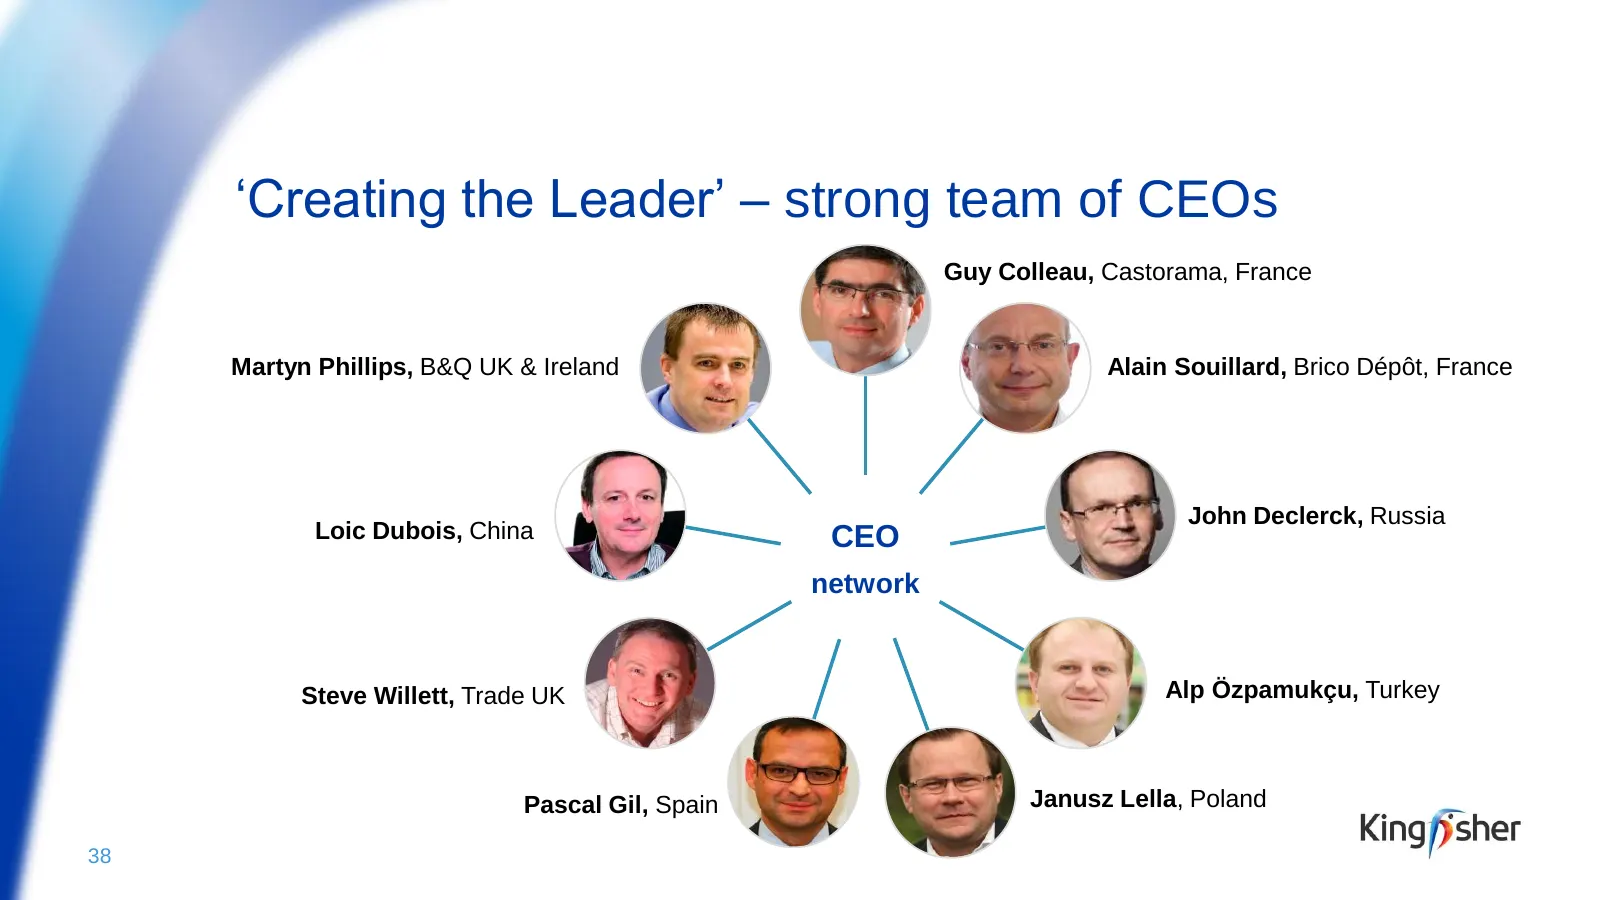
‘Creating the Leader’ – strong team of CEOs Guy Colleau, Castorama, France Martyn Phillips, B&Q UK & Ireland Alain Souillard, Brico Dépôt, France John Declerck, Russia Loic Dubois, China CEO network Steve Willett, Trade UK Alp Özpamukçu, Turkey Pascal Gil, Spain Janusz Lella, Poland 38
Slide 37: ‘Creating the Leader’ – a clear sense of purpose
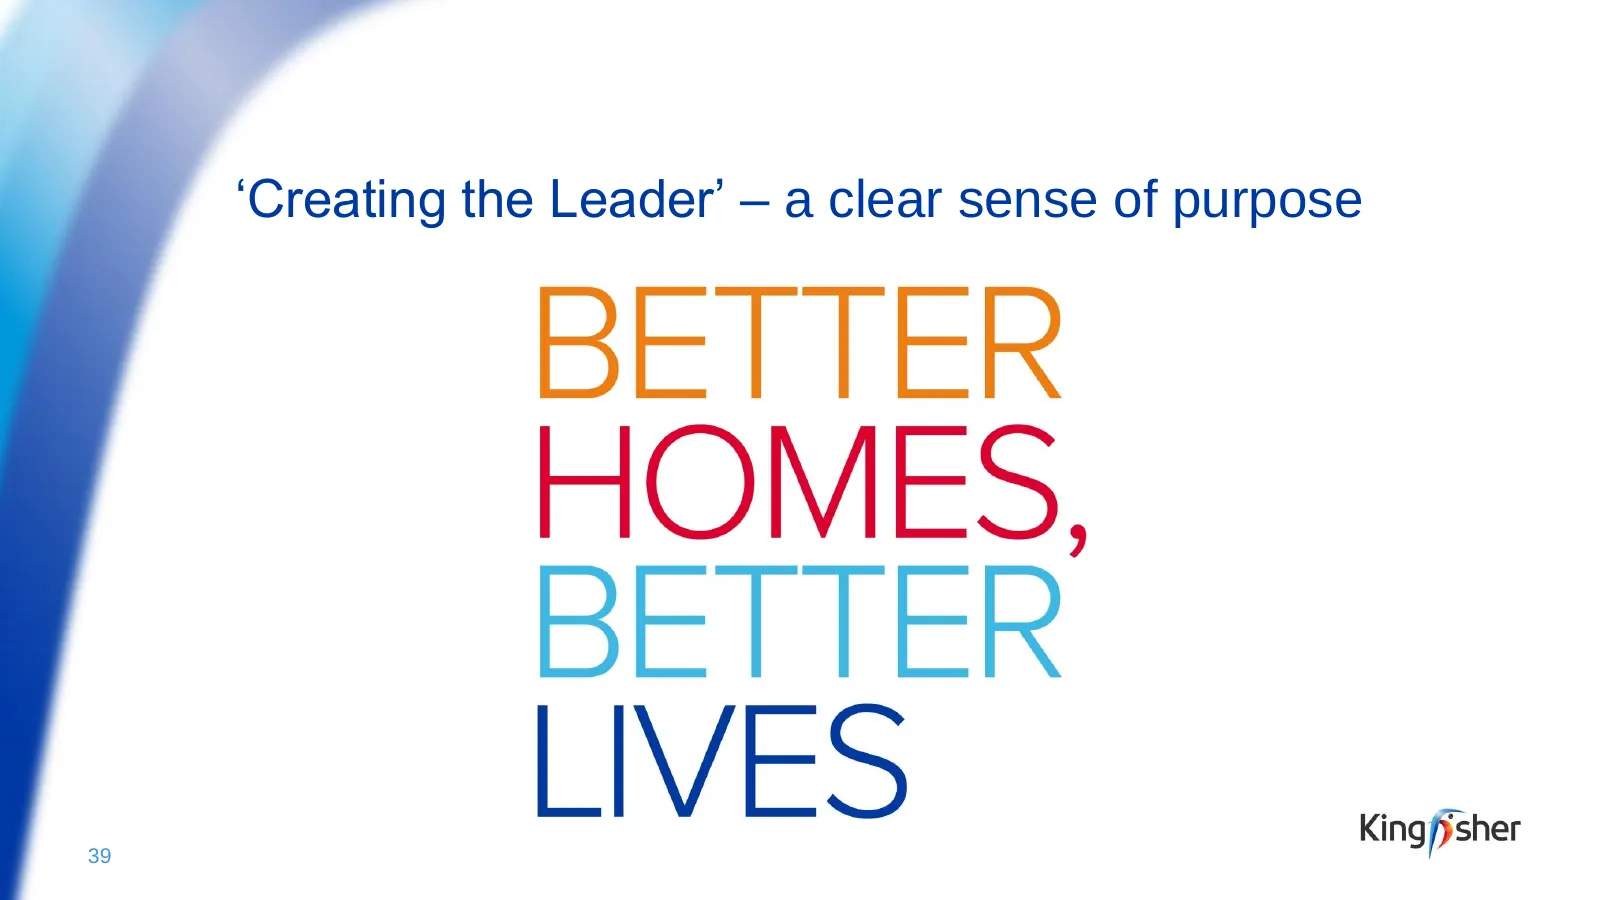
‘Creating the Leader’ – a clear sense of purpose 39
Slide 38: ‘Creating the Leader’
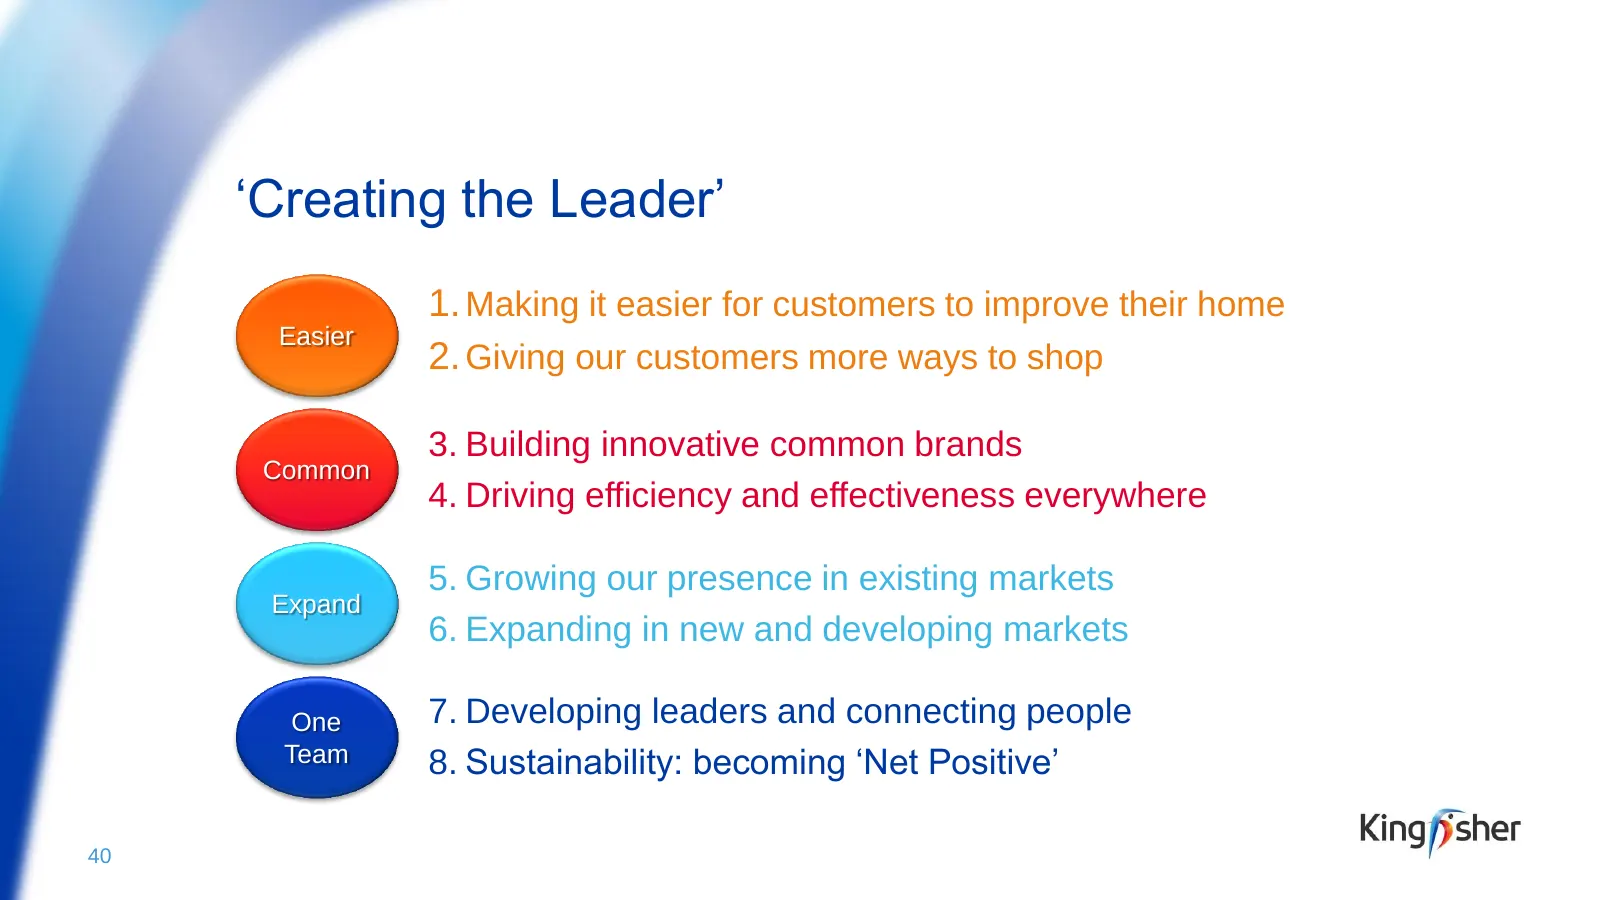
‘Creating the Leader’ 1. Making it easier for customers to improve their home Easier 2. Giving our customers more ways to shop 3. Building innovative common brands Common 4. Driving efficiency and effectiveness everywhere 5. Growing our presence in existing markets Expand 6. Expanding in new and dev
Slide 39: 1. Making it easier for our customers to improve their home
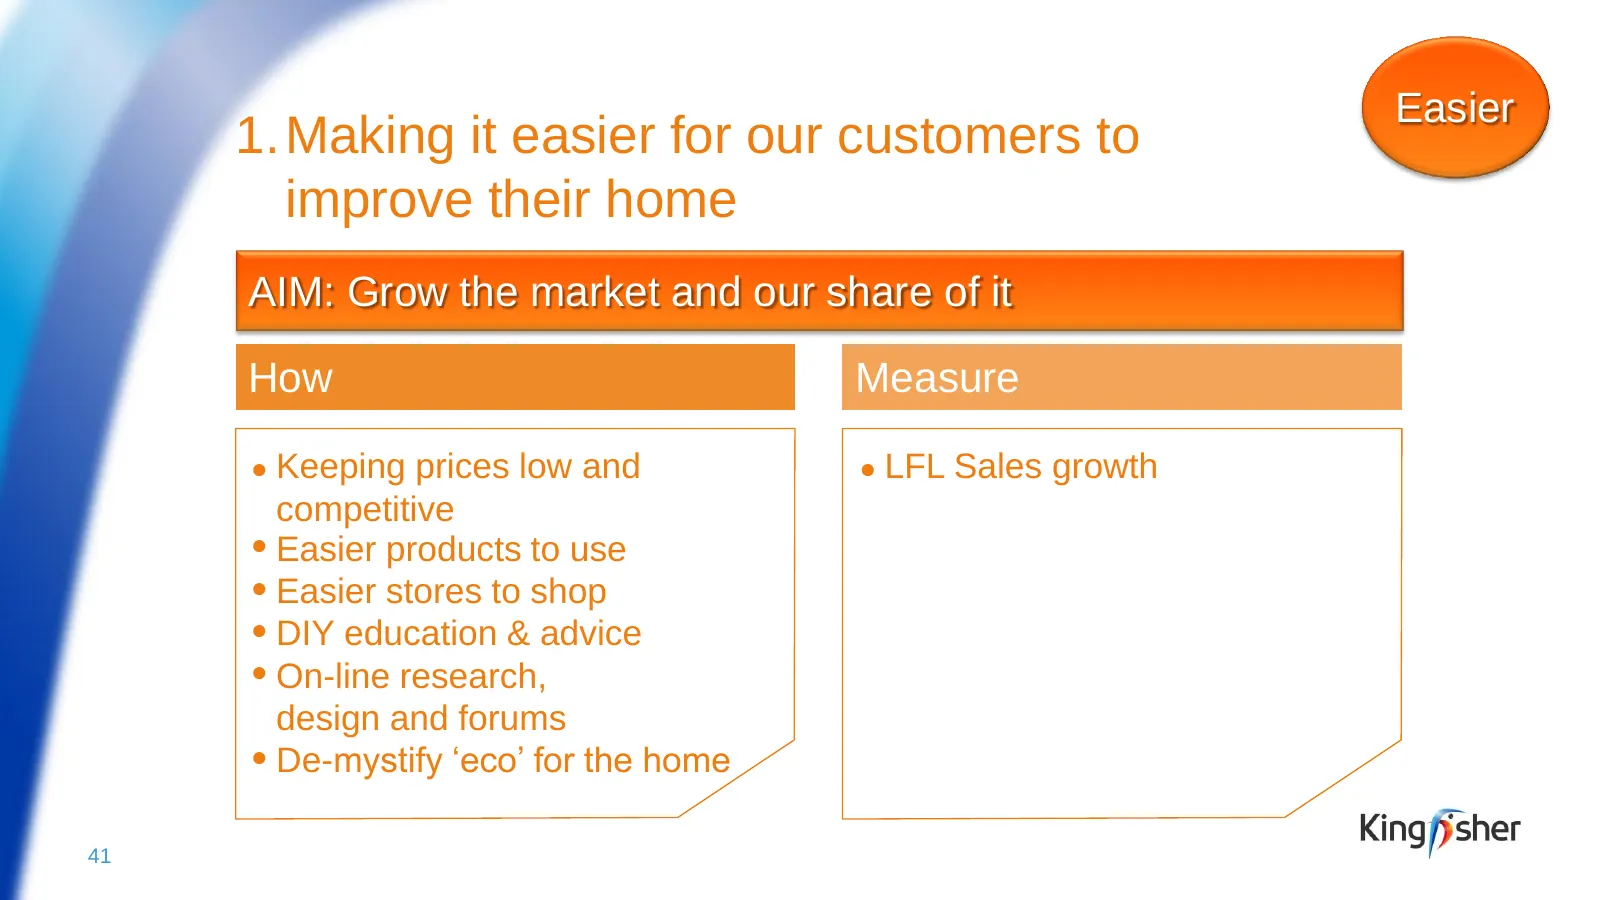
Easier 1. Making it easier for our customers to improve their home AIM: Grow the market and our share of it How Measure ● Keeping prices low and ● LFL Sales growth competitive ● Easier products to use ● Easier stores to shop ● DIY education & advice ● On-line research, design and forums ● De-mystify
Slide 40: 2. Giving our customers more ways to shop
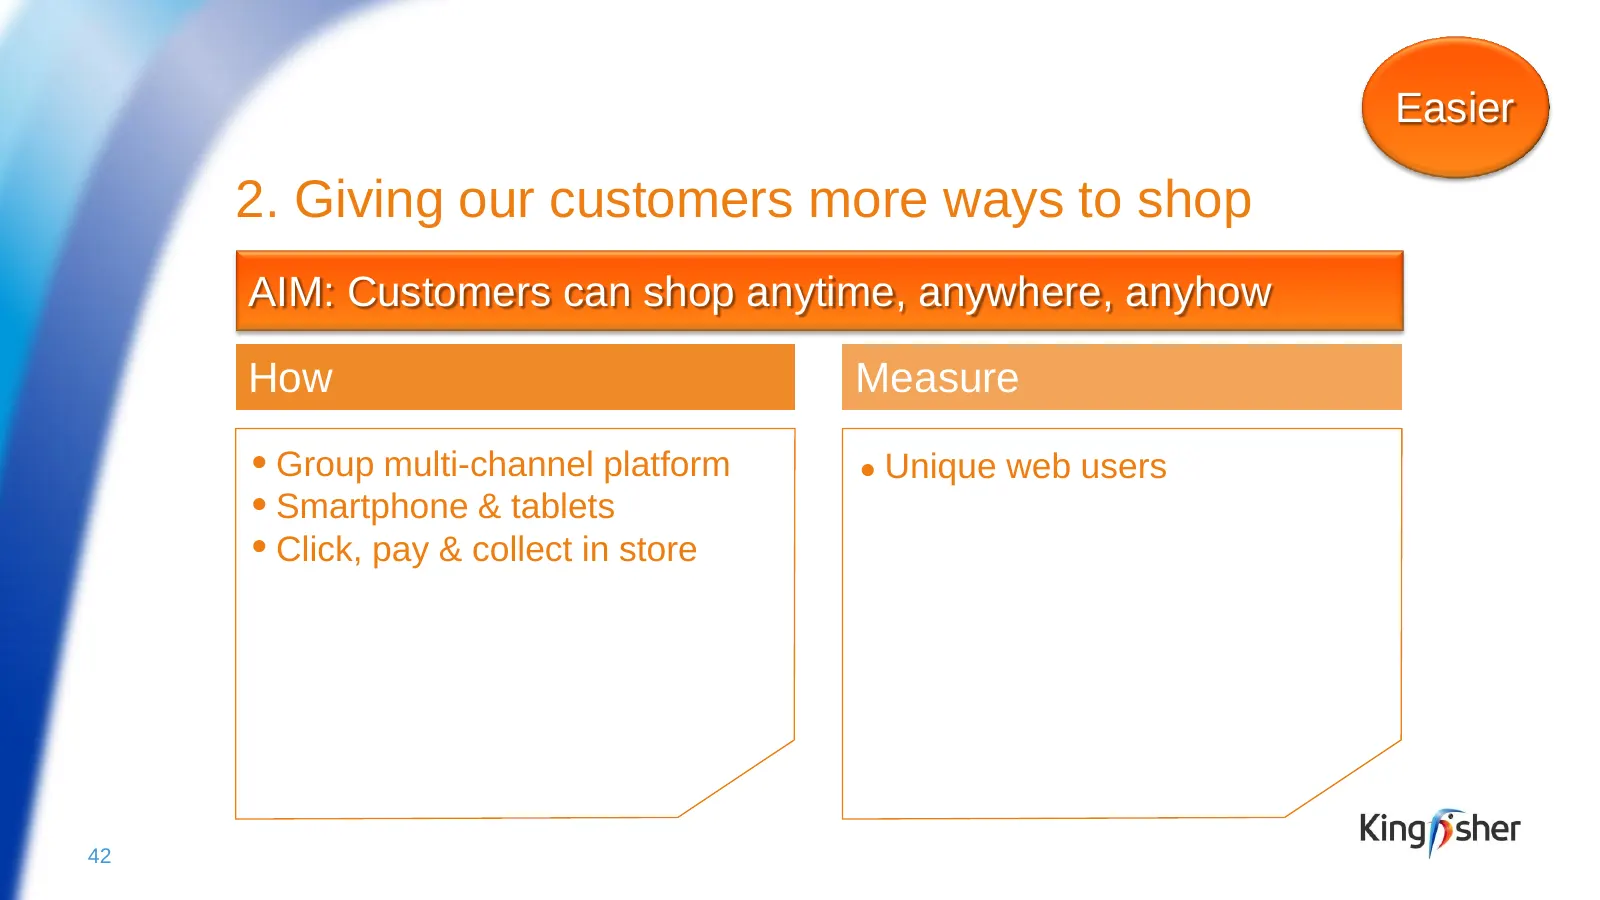
Easier 2. Giving our customers more ways to shop AIM: Customers can shop anytime, anywhere, anyhow How Measure ● Group multi-channel platform ● Unique web users ● Smartphone & tablets ● Click, pay & collect in store 42
Slide 41: 3. Building innovative, common brands
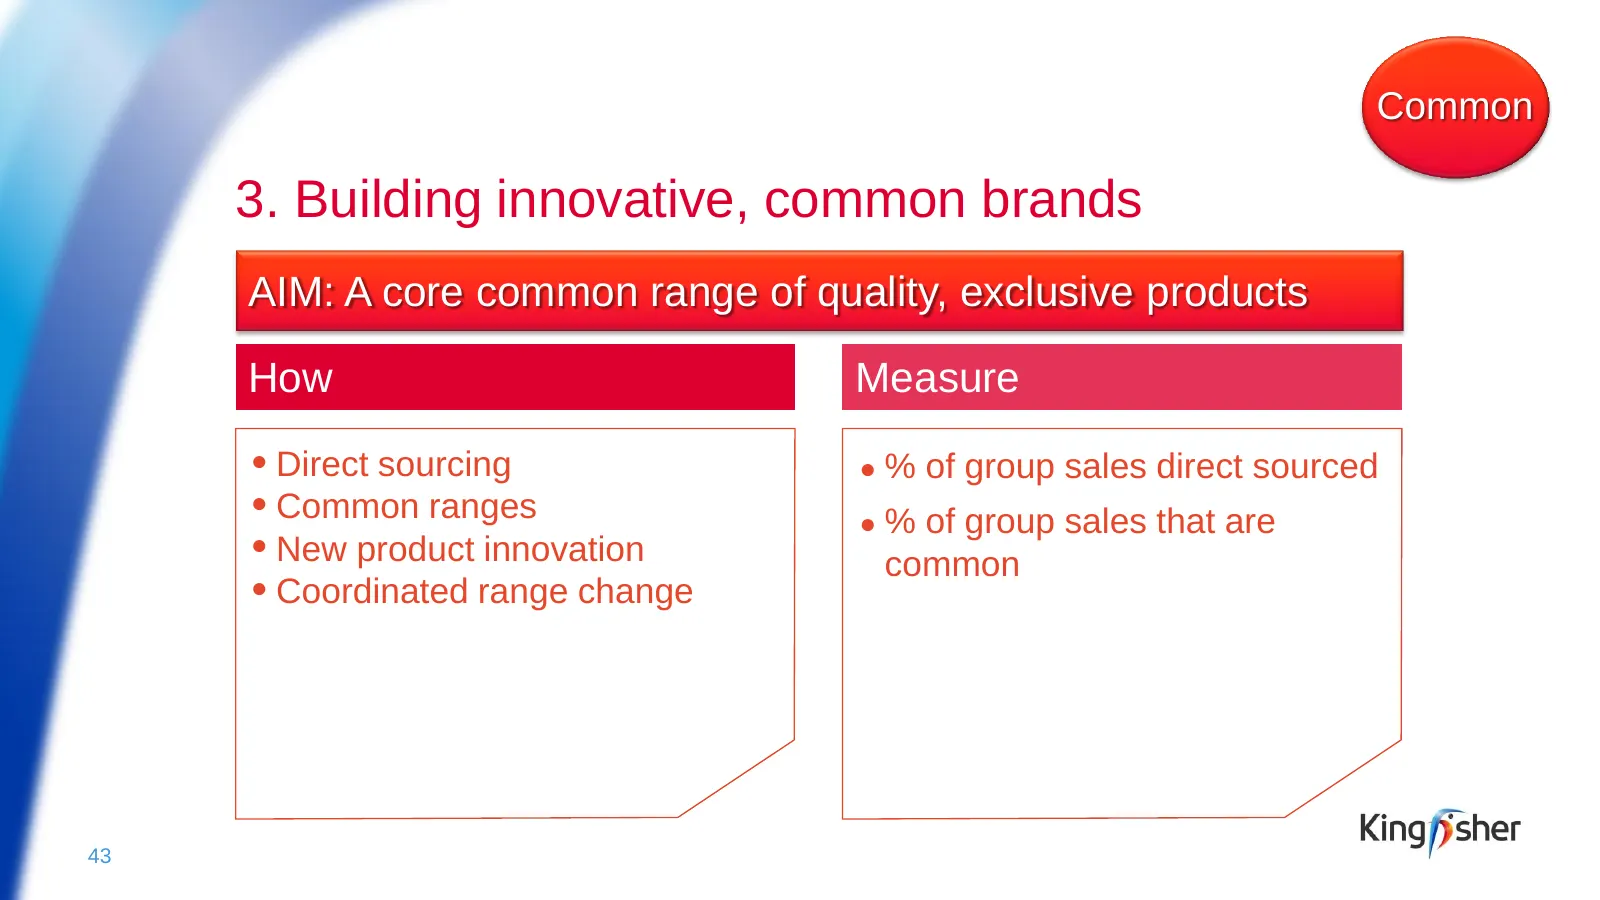
EASIER Common 3. Building innovative, common brands AIM: A core common range of quality, exclusive products How Measure ● Direct sourcing ● % of group sales direct sourced ● Common ranges ● % of group sales that are ● New product innovation common ● Coordinated range change 43
Slide 42: The benefits to come from a best in class common range
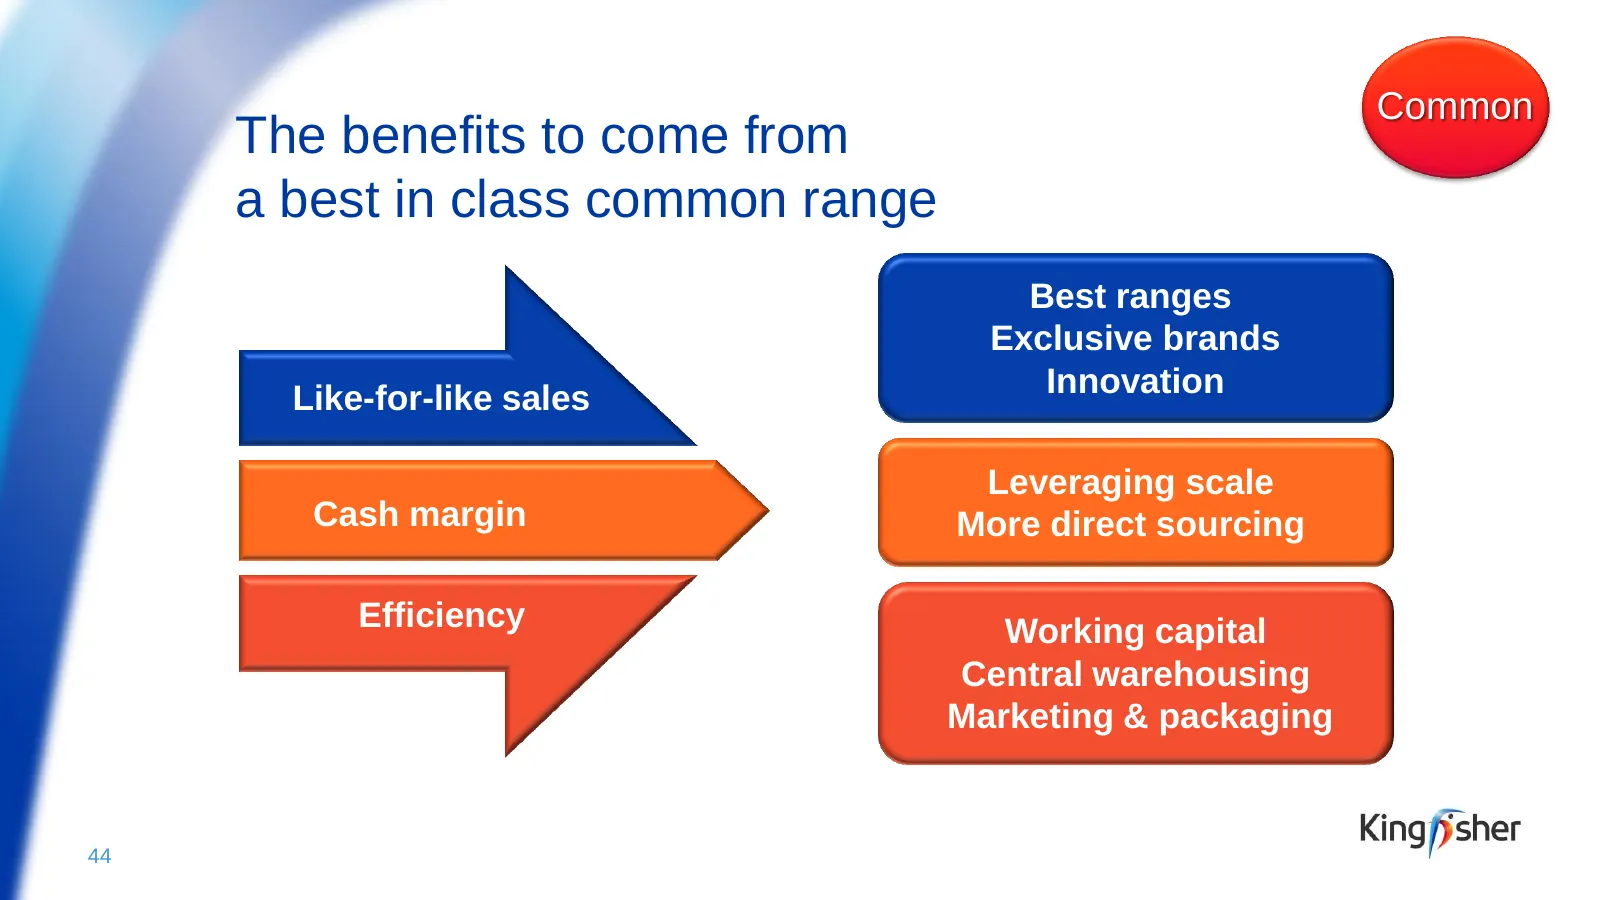
Common The benefits to come from a best in class common range Best ranges Exclusive brands Like-for-like sales Innovation Leveraging scale Cash margin More direct sourcing Efficiency Working capital Central warehousing Marketing & packaging 44
Slide 43: …recent 2011/12 real examples
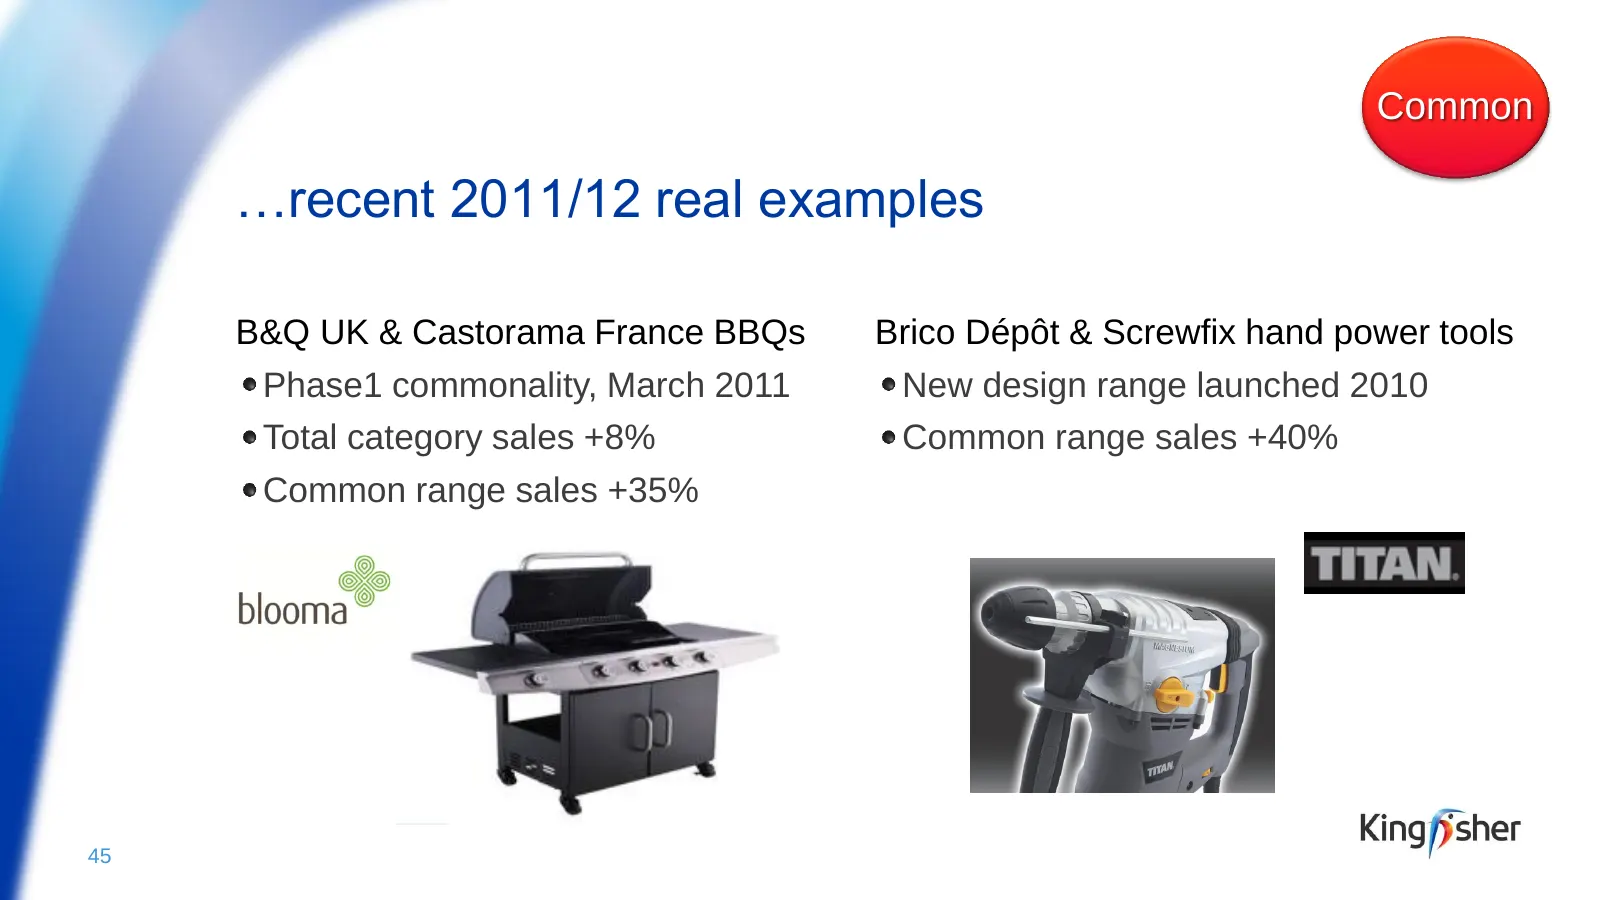
Common …recent 2011/12 real examples B&Q UK & Castorama France BBQs Brico Dépôt & Screwfix hand power tools Phase1 commonality, March 2011 New design range launched 2010 Total category sales +8% Common range sales +40% Common range sales +35% 45
Slide 44: Off to a good start…and there is more to come
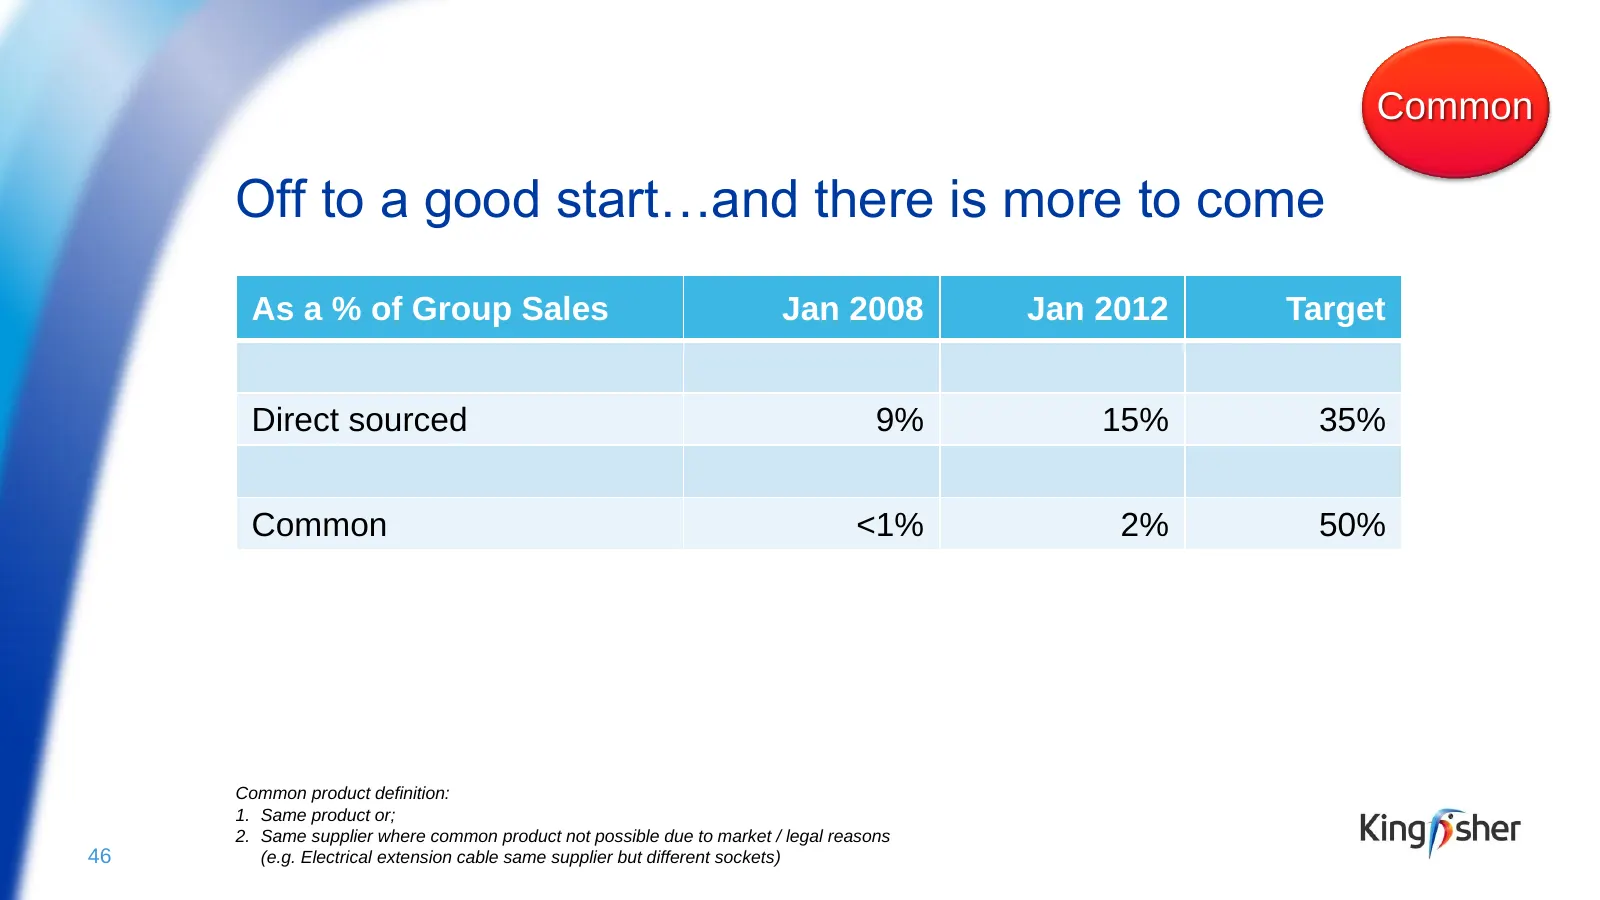
Common Off to a good start…and there is more to come As a % of Group Sales Jan 2008 Jan 2012 Target Direct sourced 9% 15% 35% Common <1% 2% 50% Common product definition: 1. Same product or; 2. Same supplier where common product not possible due to market / legal reasons 46 (e.g. Electrical extensio
Slide 45: 4. Driving efficiency and effectiveness everywhere
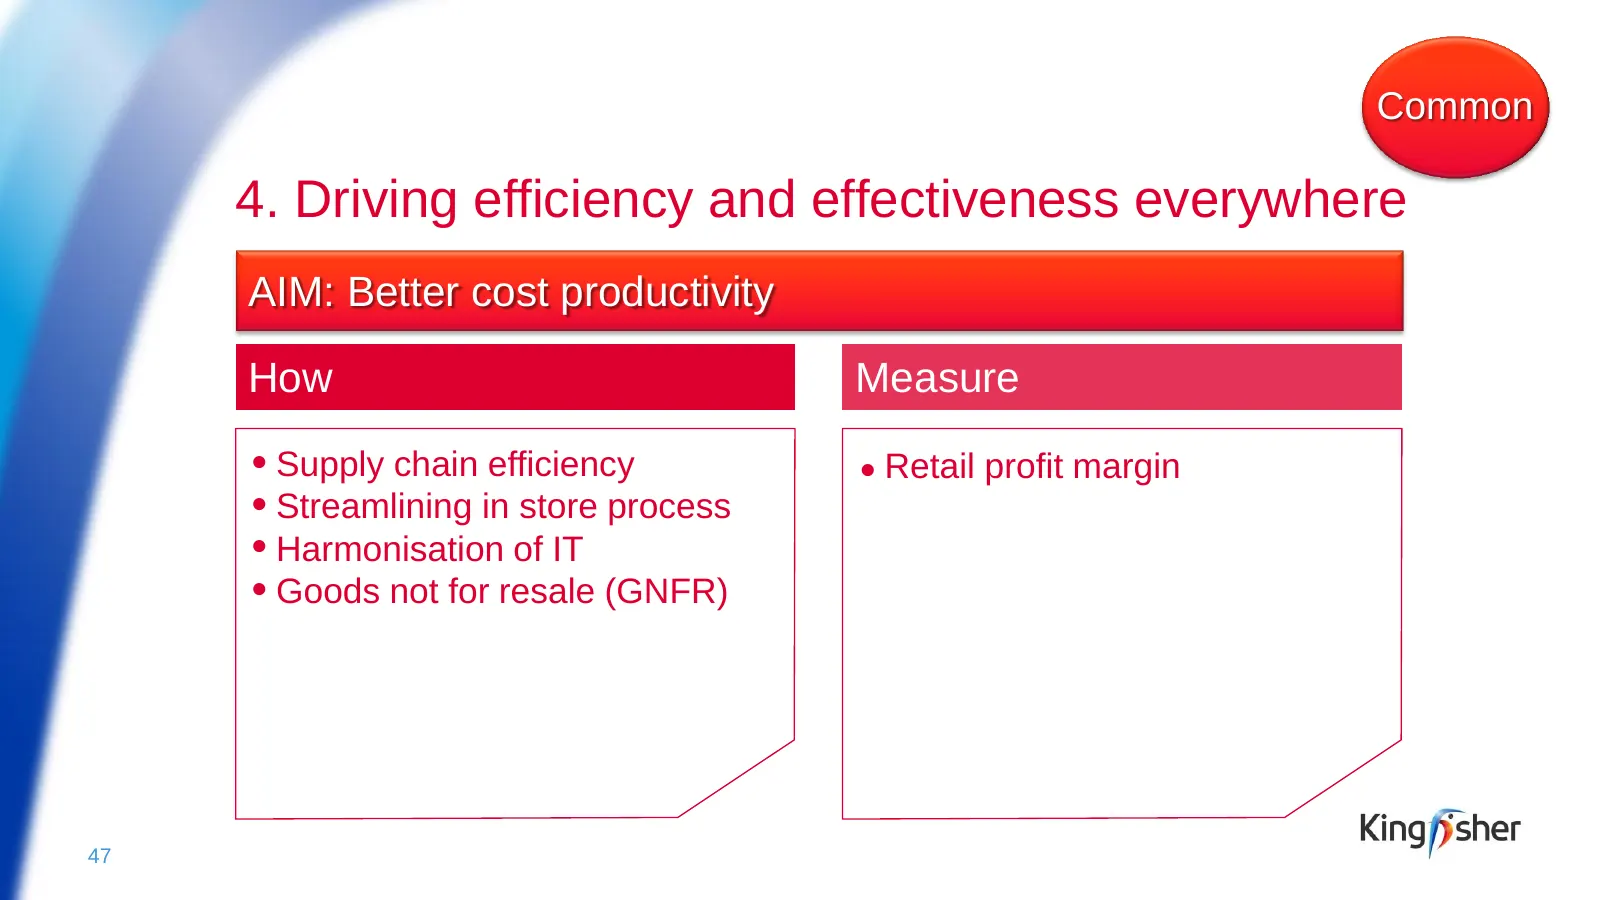
Common 4. Driving efficiency and effectiveness everywhere AIM: Better cost productivity How Measure ● Supply chain efficiency ● Retail profit margin ● Streamlining in store process ● Harmonisation of IT ● Goods not for resale (GNFR) 47
Slide 46: 5. Growing our presence in existing markets
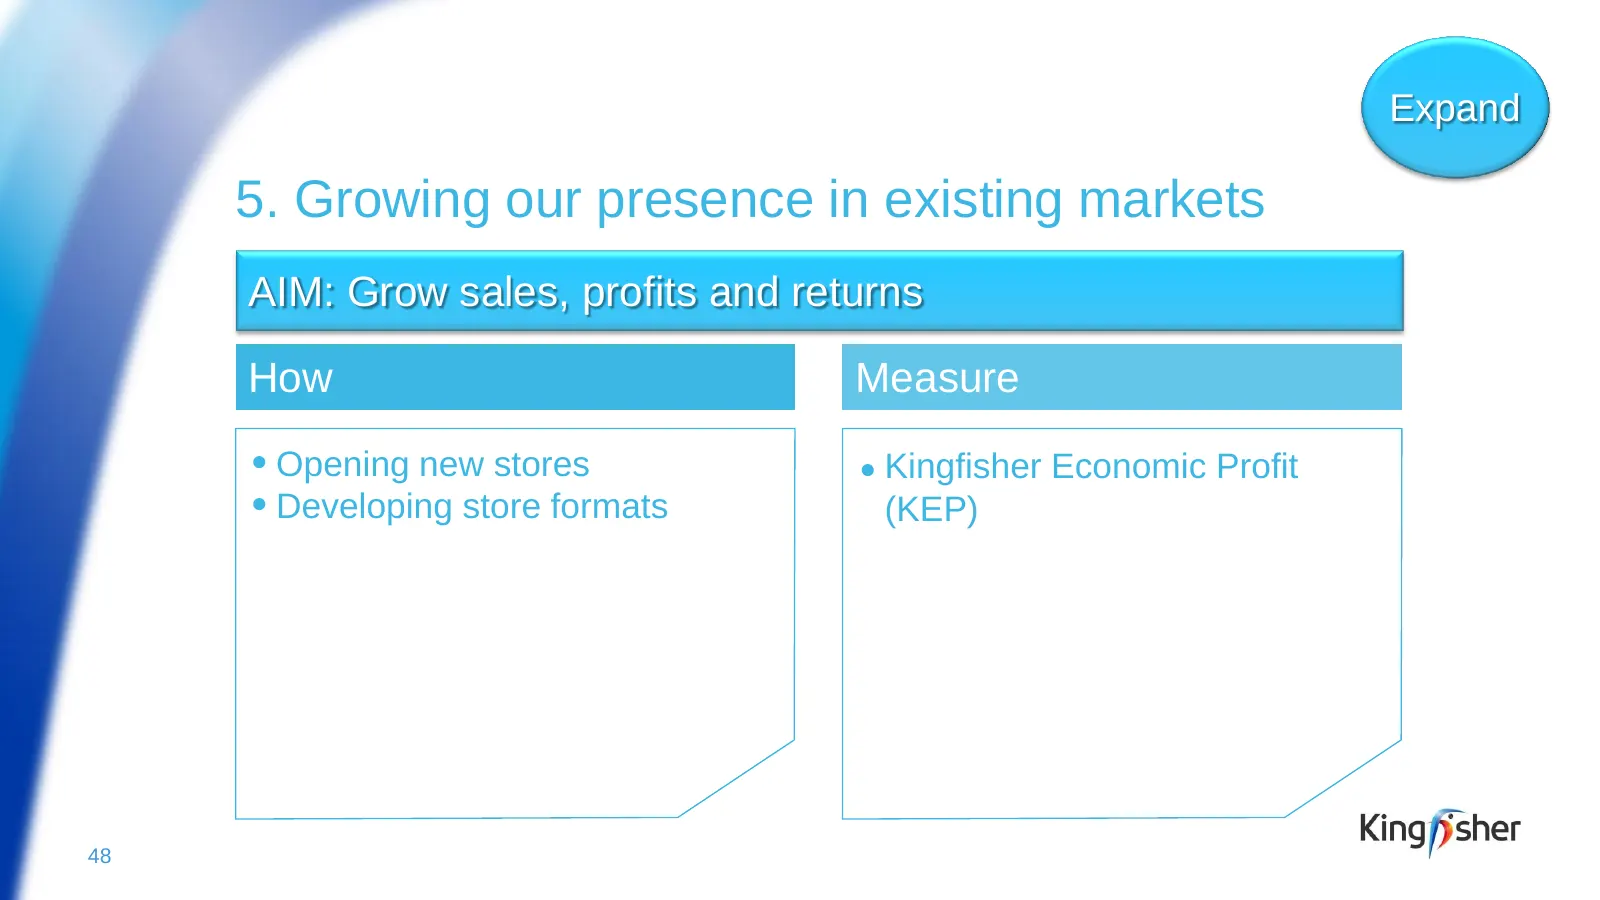
Expand 5. Growing our presence in existing markets AIM: Grow sales, profits and returns How Measure ● Opening new stores ● Kingfisher Economic Profit ● Developing store formats (KEP) 48
Slide 47: 6. Expanding in new and developing markets
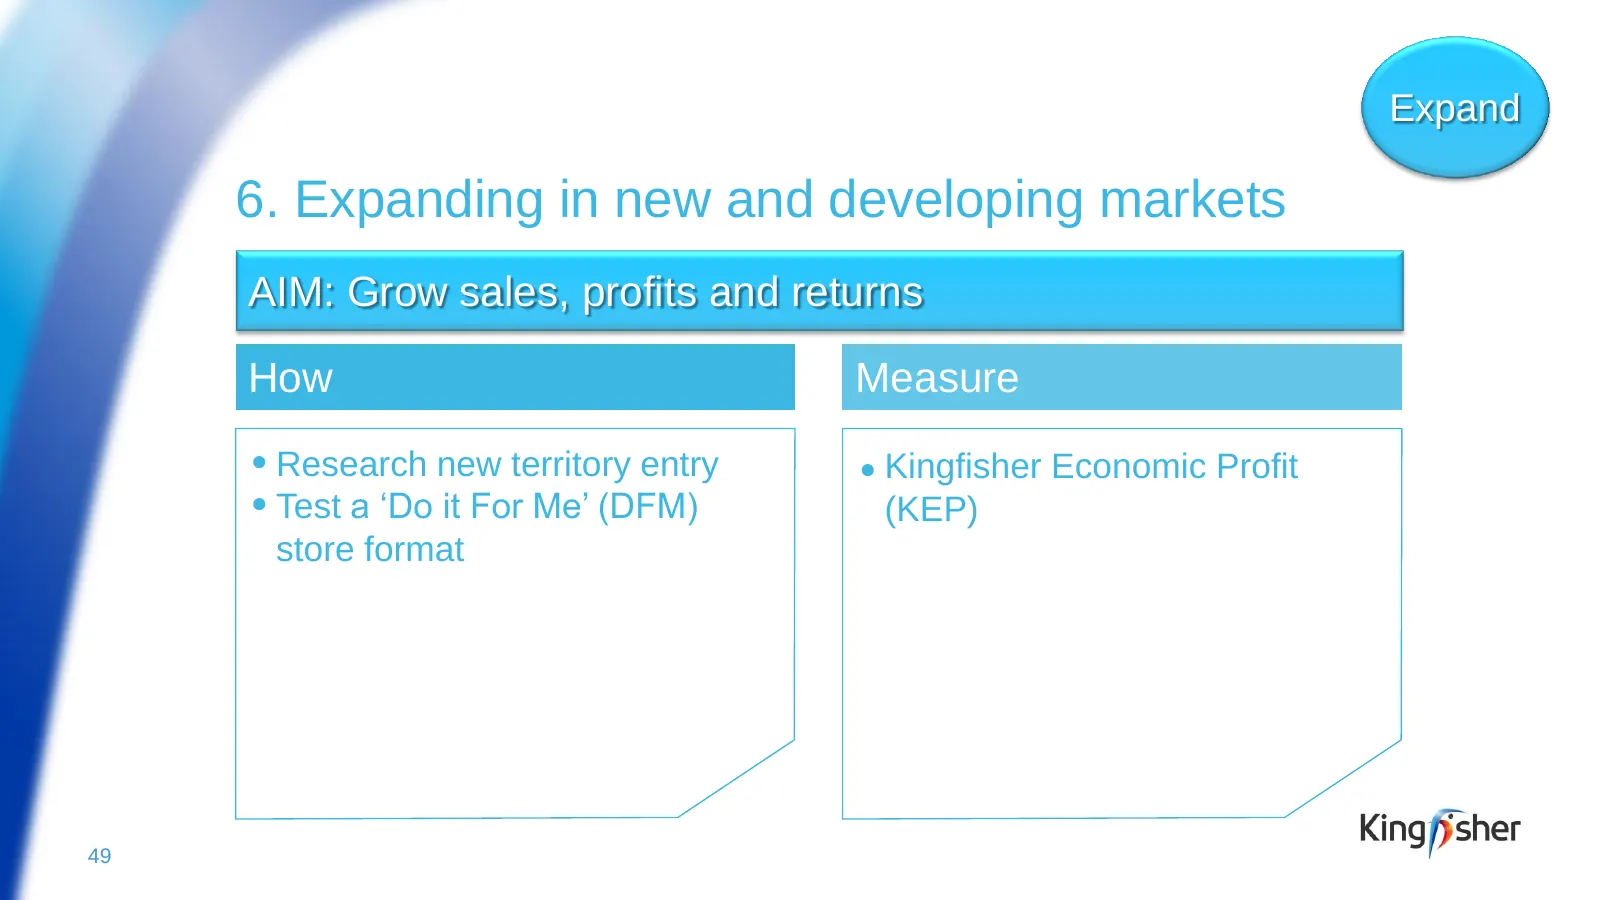
Expand 6. Expanding in new and developing markets AIM: Grow sales, profits and returns How Measure ● Research new territory entry ● Kingfisher Economic Profit ● Test a ‘Do it For Me’ (DFM) (KEP) store format 49
Slide 48: 7. Developing leaders and connecting people
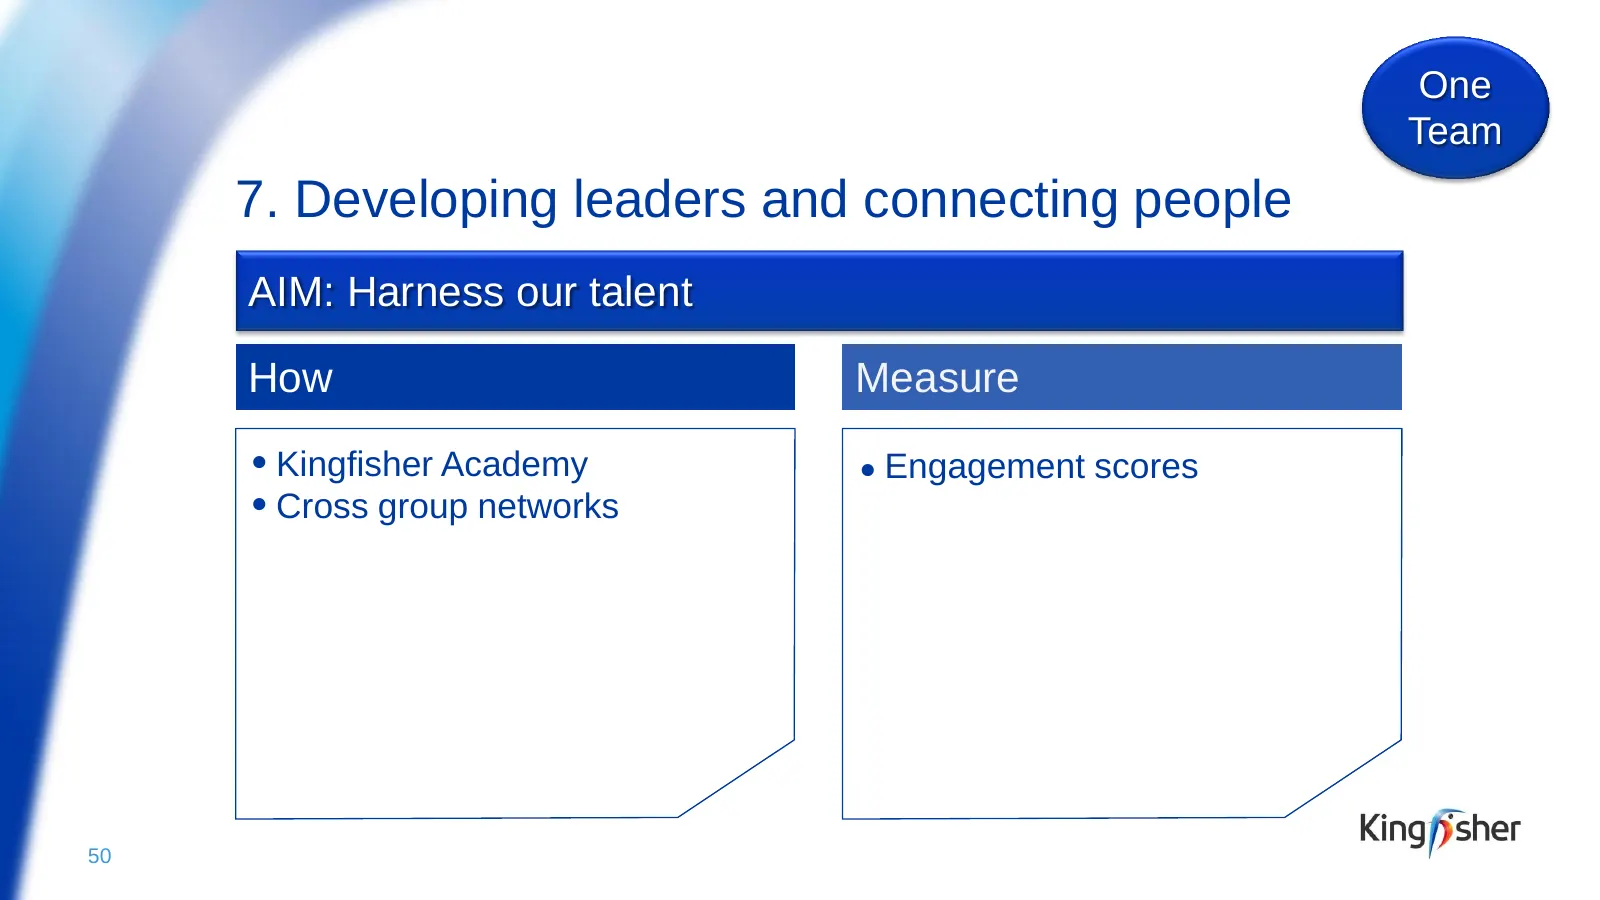
One Team 7. Developing leaders and connecting people AIM: Harness our talent How Measure ● Kingfisher Academy ● Engagement scores ● Cross group networks 50
Slide 49: 8. Sustainability: becoming ‘Net Positive’
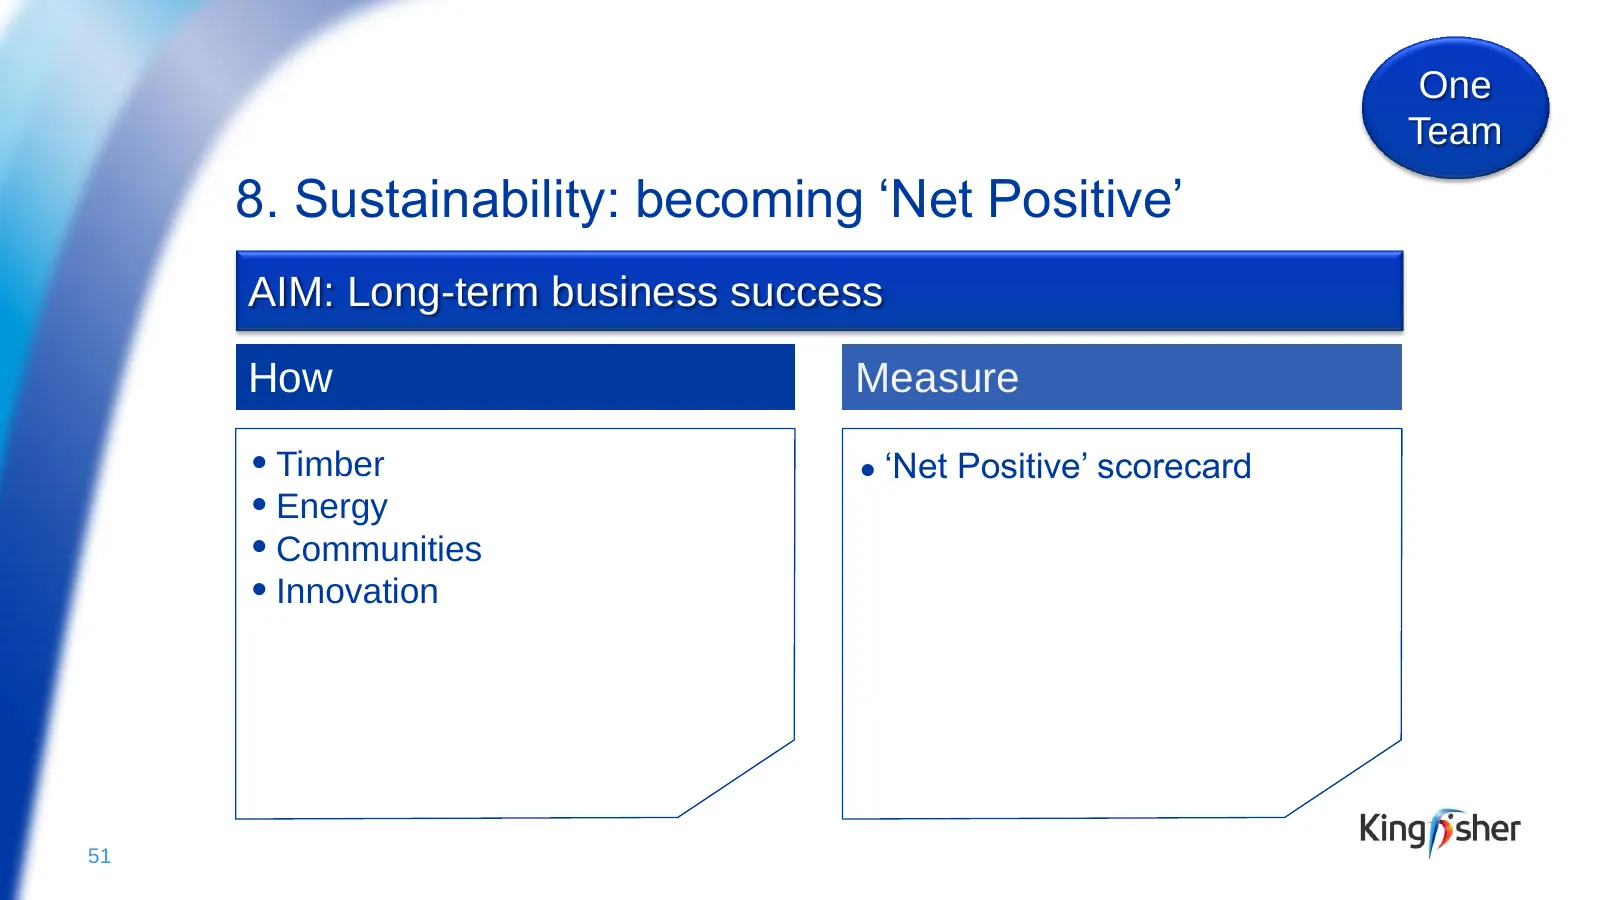
One Team 8. Sustainability: becoming ‘Net Positive’ AIM: Long-term business success How Measure ● Timber ● ‘Net Positive’ scorecard ● Energy ● Communities ● Innovation 51
Slide 50: ‘Creating the Leader’ – measures
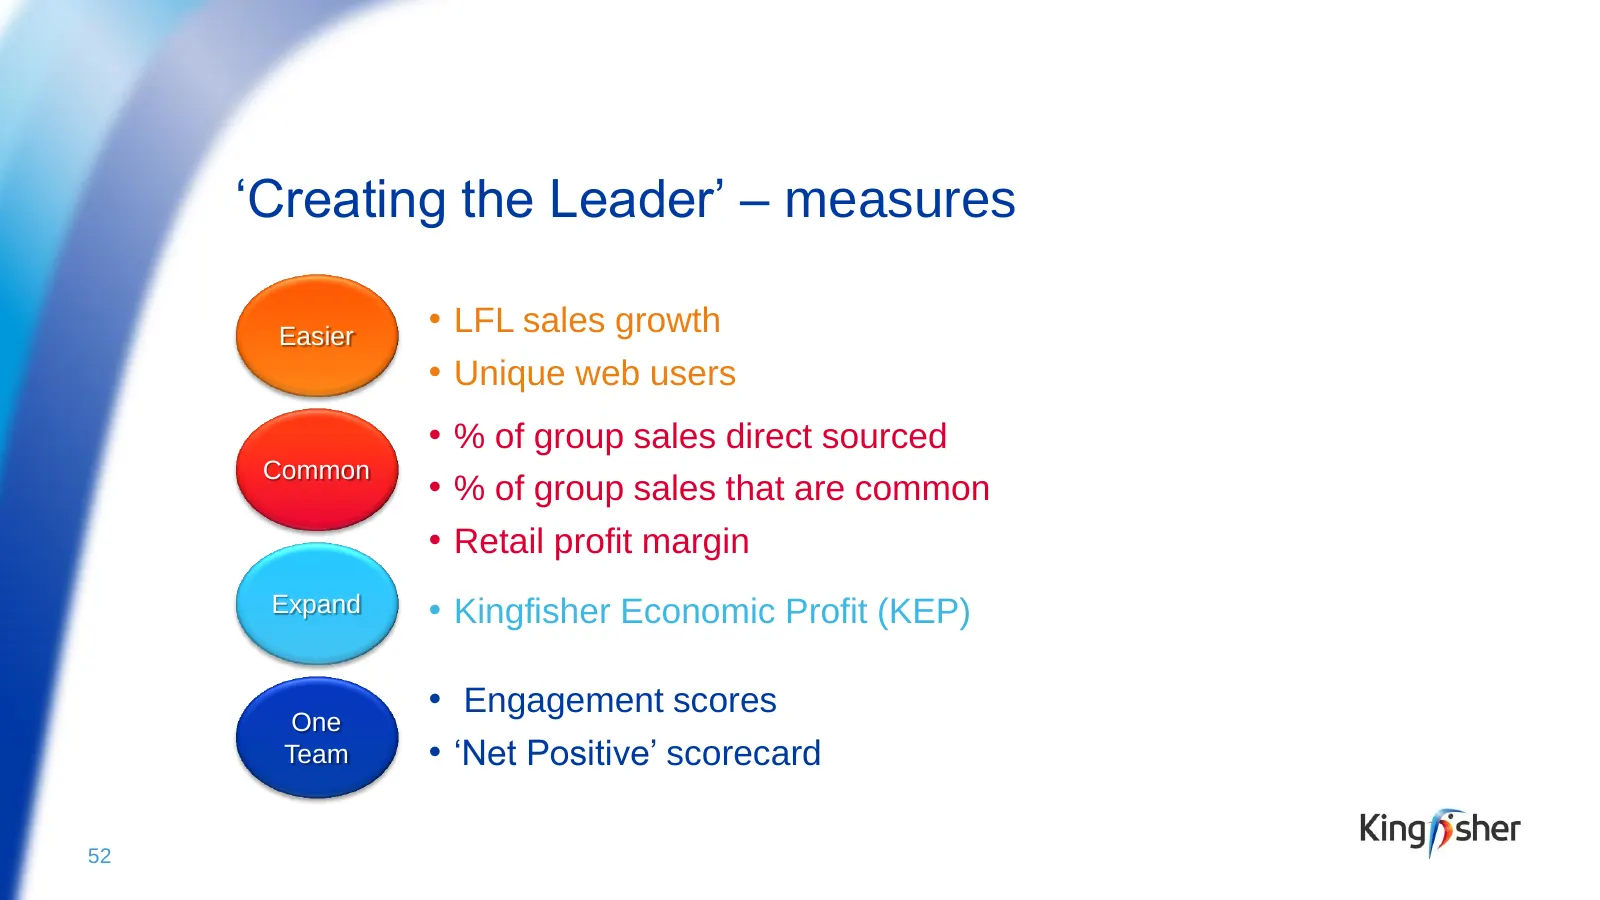
‘Creating the Leader’ – measures Easier • LFL sales growth • Unique web users • % of group sales direct sourced Common • % of group sales that are common • Retail profit margin Expand • Kingfisher Economic Profit (KEP) One • Engagement scores Team • ‘Net Positive’ scorecard 52
Slide 51: Annualised benefits targeted for year 5
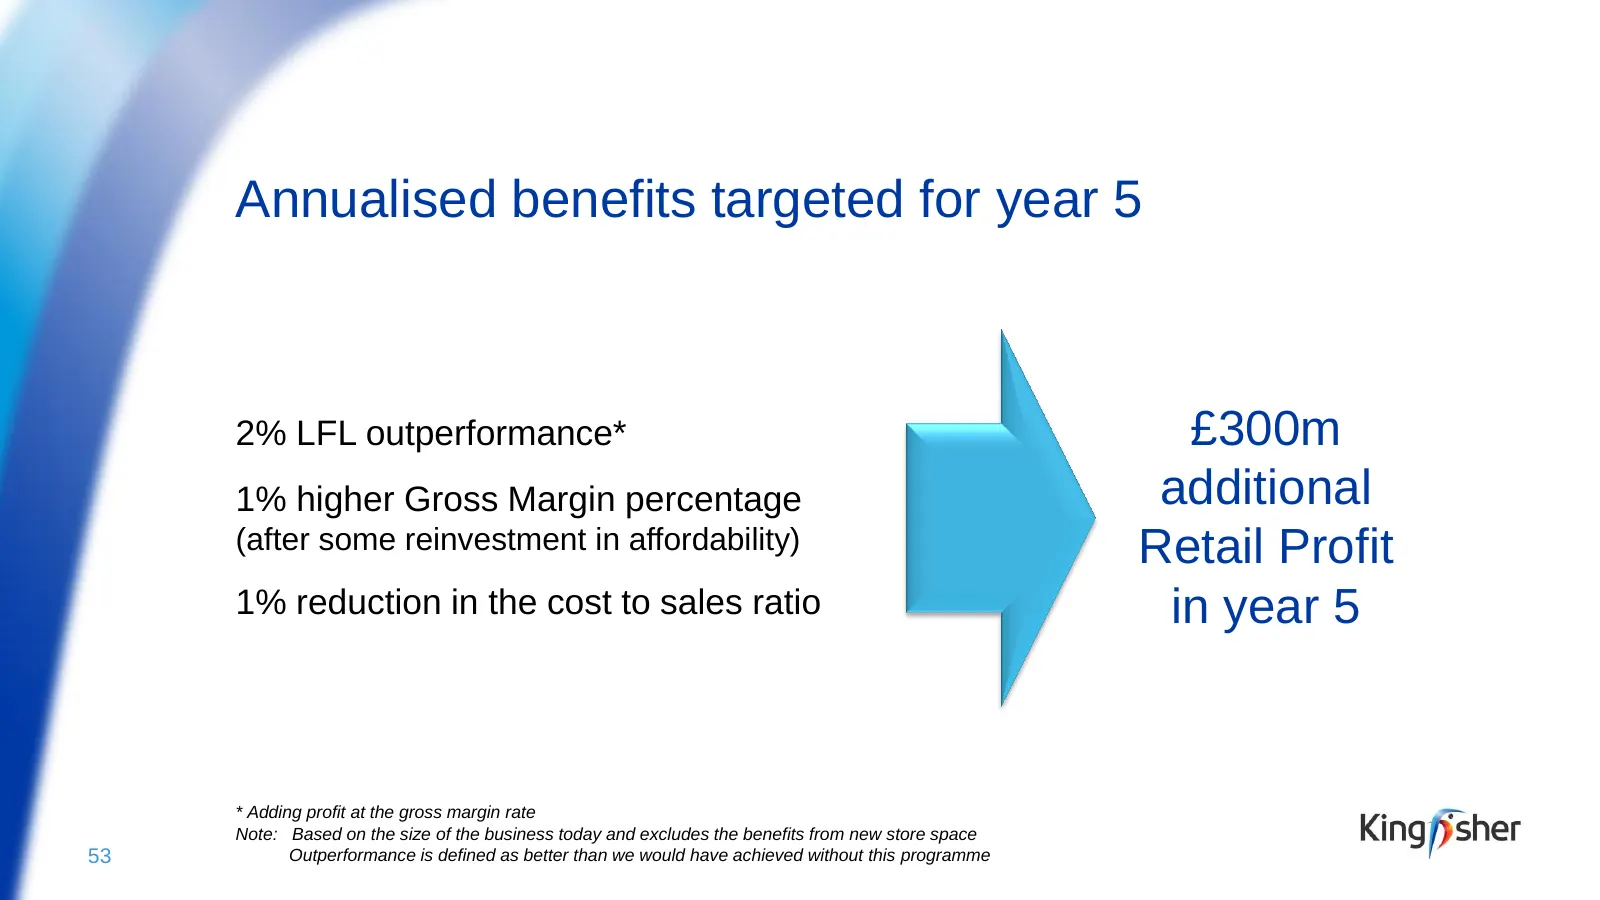
Annualised benefits targeted for year 5 2% LFL outperformance* £300m 1% higher Gross Margin percentage additional (after some reinvestment in affordability) Retail Profit 1% reduction in the cost to sales ratio in year 5 * Adding profit at the gross margin rate Note: Based on the size of the busines
Slide 52: ‘Creating the Leader’– the right targets
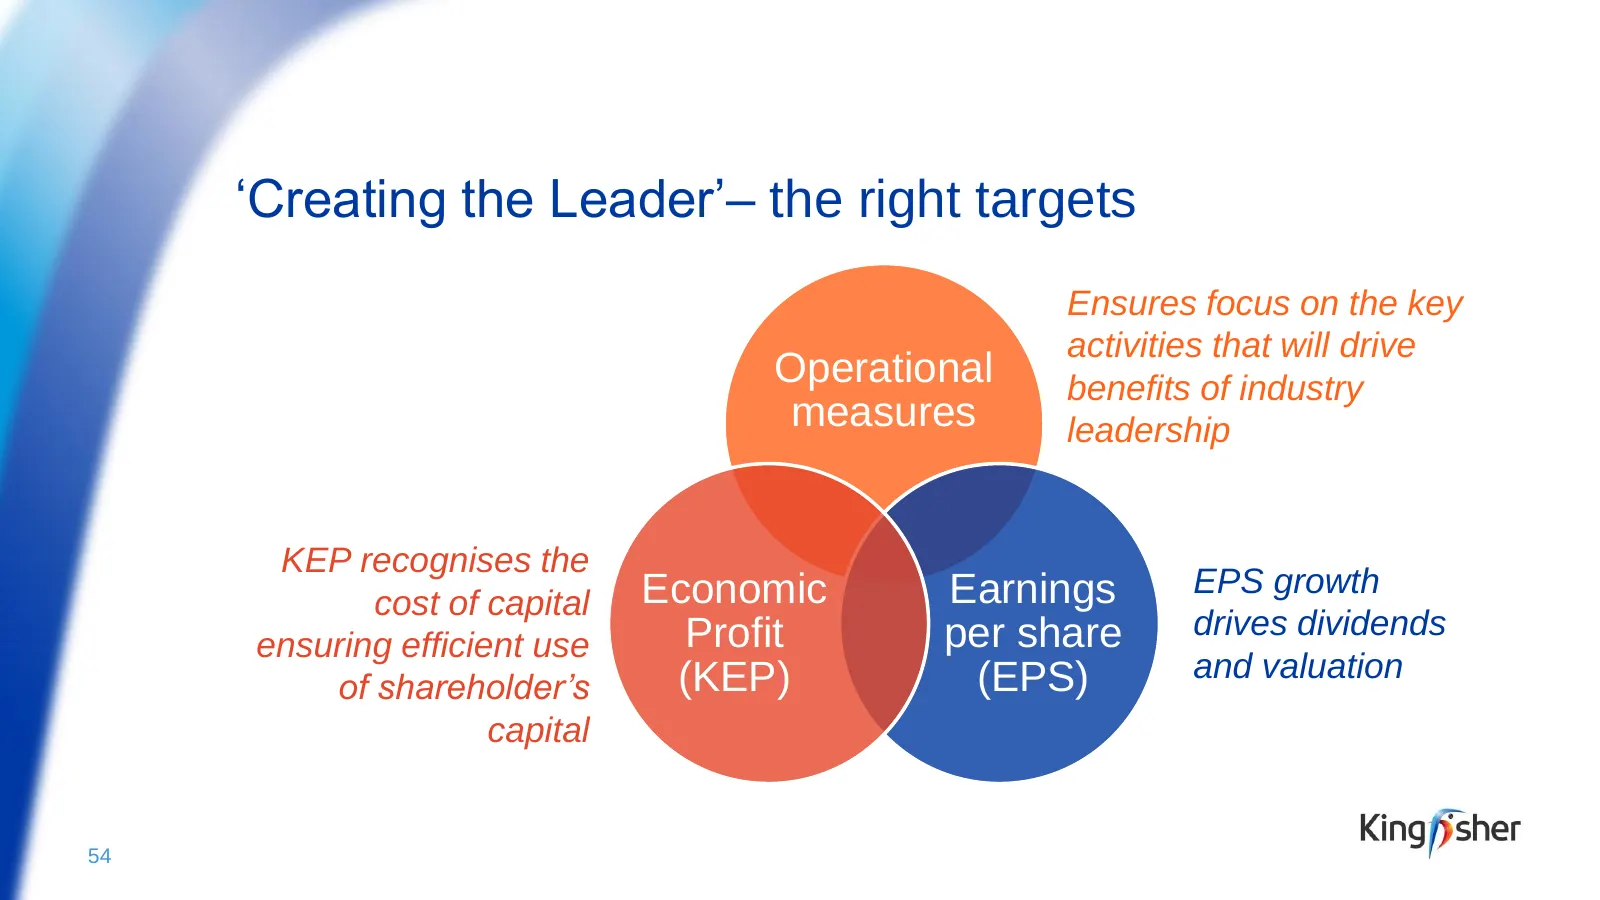
‘Creating the Leader’– the right targets Ensures focus on the key activities that will drive Operational benefits of industry measures leadership KEP recognises the Economic Earnings EPS growth cost of capital Profit per share drives dividends ensuring efficient use (KEP) (EPS) and valuation of shar
Slide 53: Existing published incentive targets
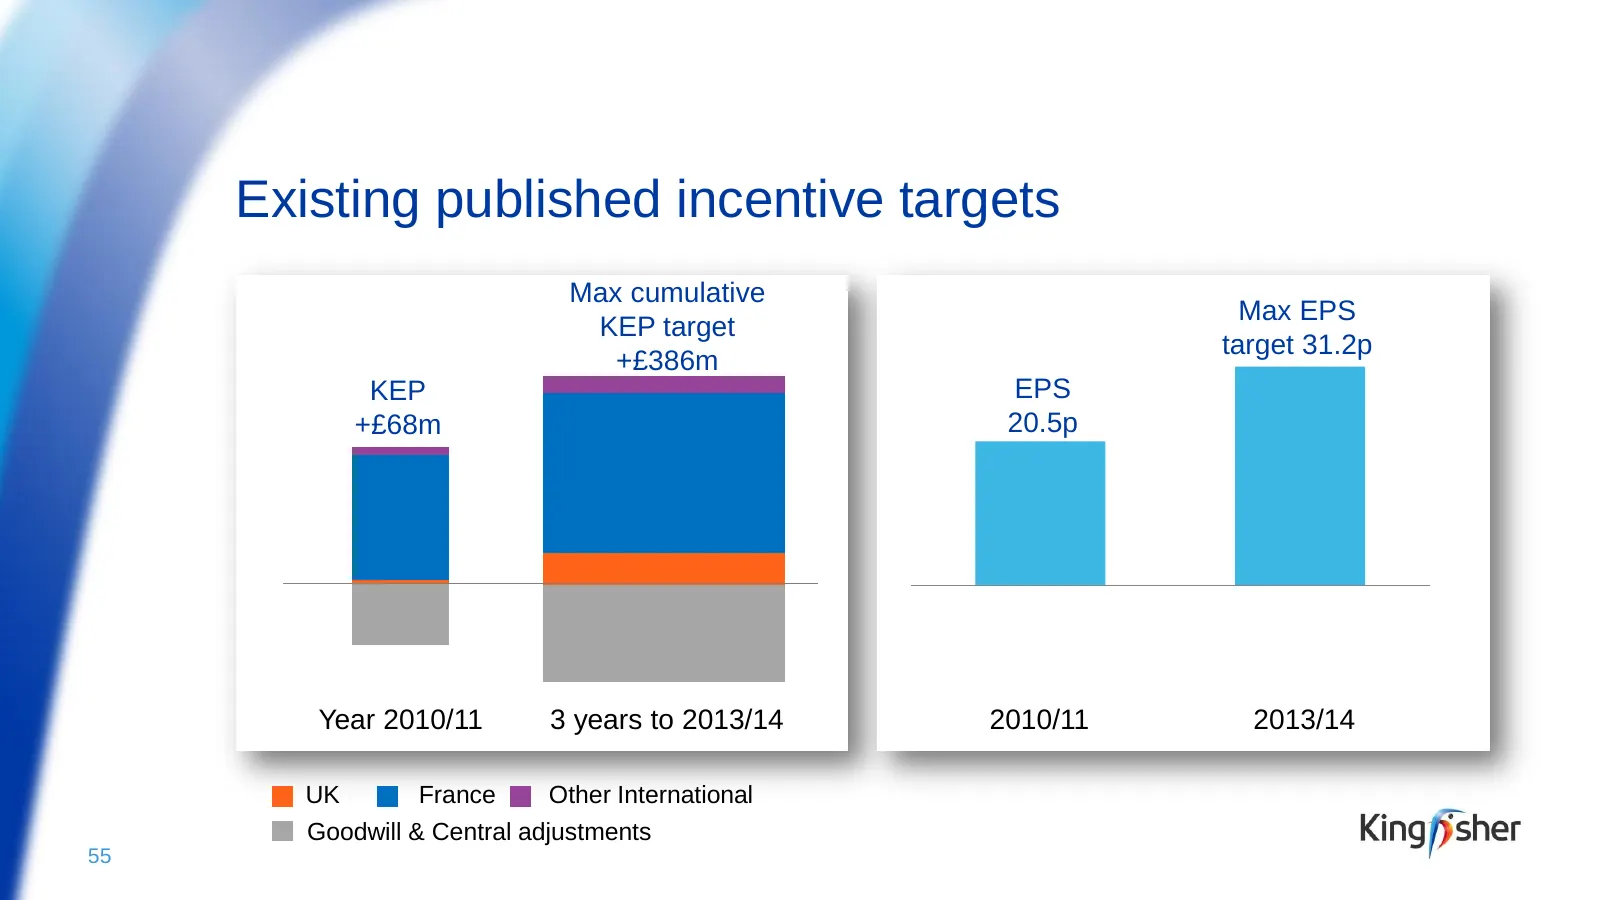
Existing published incentive targets Max cumulative Max EPS KEP target target 31.2p +£386m KEP EPS +£68m 20.5p Year 2010/11 3 years to 2013/14 2010/11 2013/14 UK France Other International Goodwill & Central adjustments 55
Slide 54: ‘Creating the Leader’, clear 2012/13 milestones
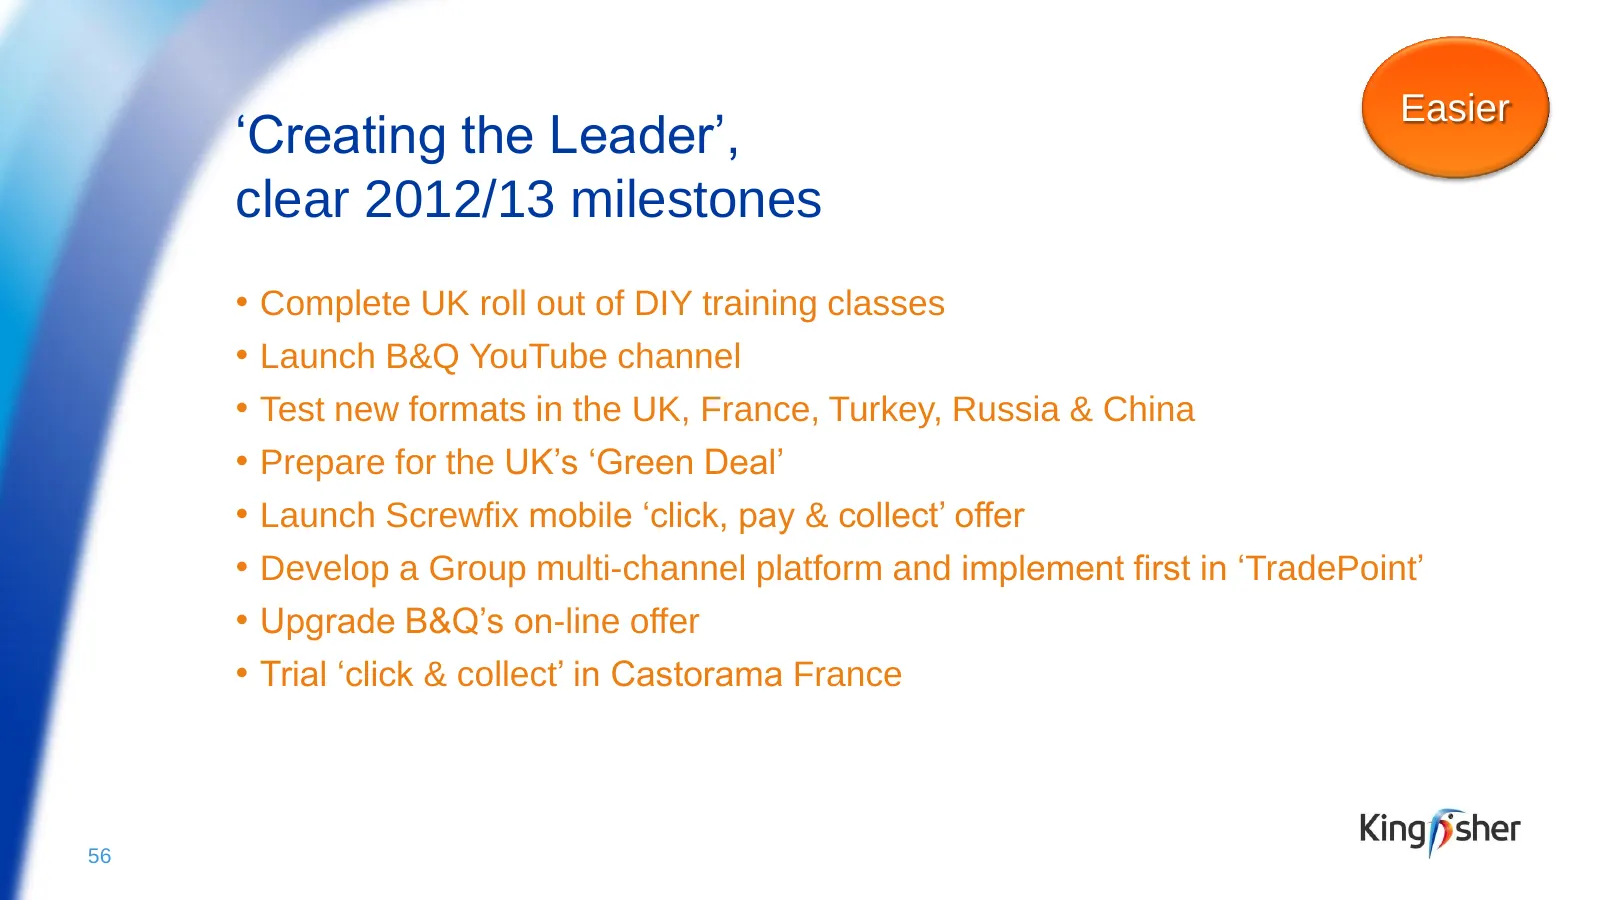
Easier ‘Creating the Leader’, clear 2012/13 milestones • Complete UK roll out of DIY training classes • Launch B&Q YouTube channel • Test new formats in the UK, France, Turkey, Russia & China • Prepare for the UK’s ‘Green Deal’ • Launch Screwfix mobile ‘click, pay & collect’ offer • Develop a Group
Slide 55: ‘Creating the Leader’, clear 2012/13 milestones
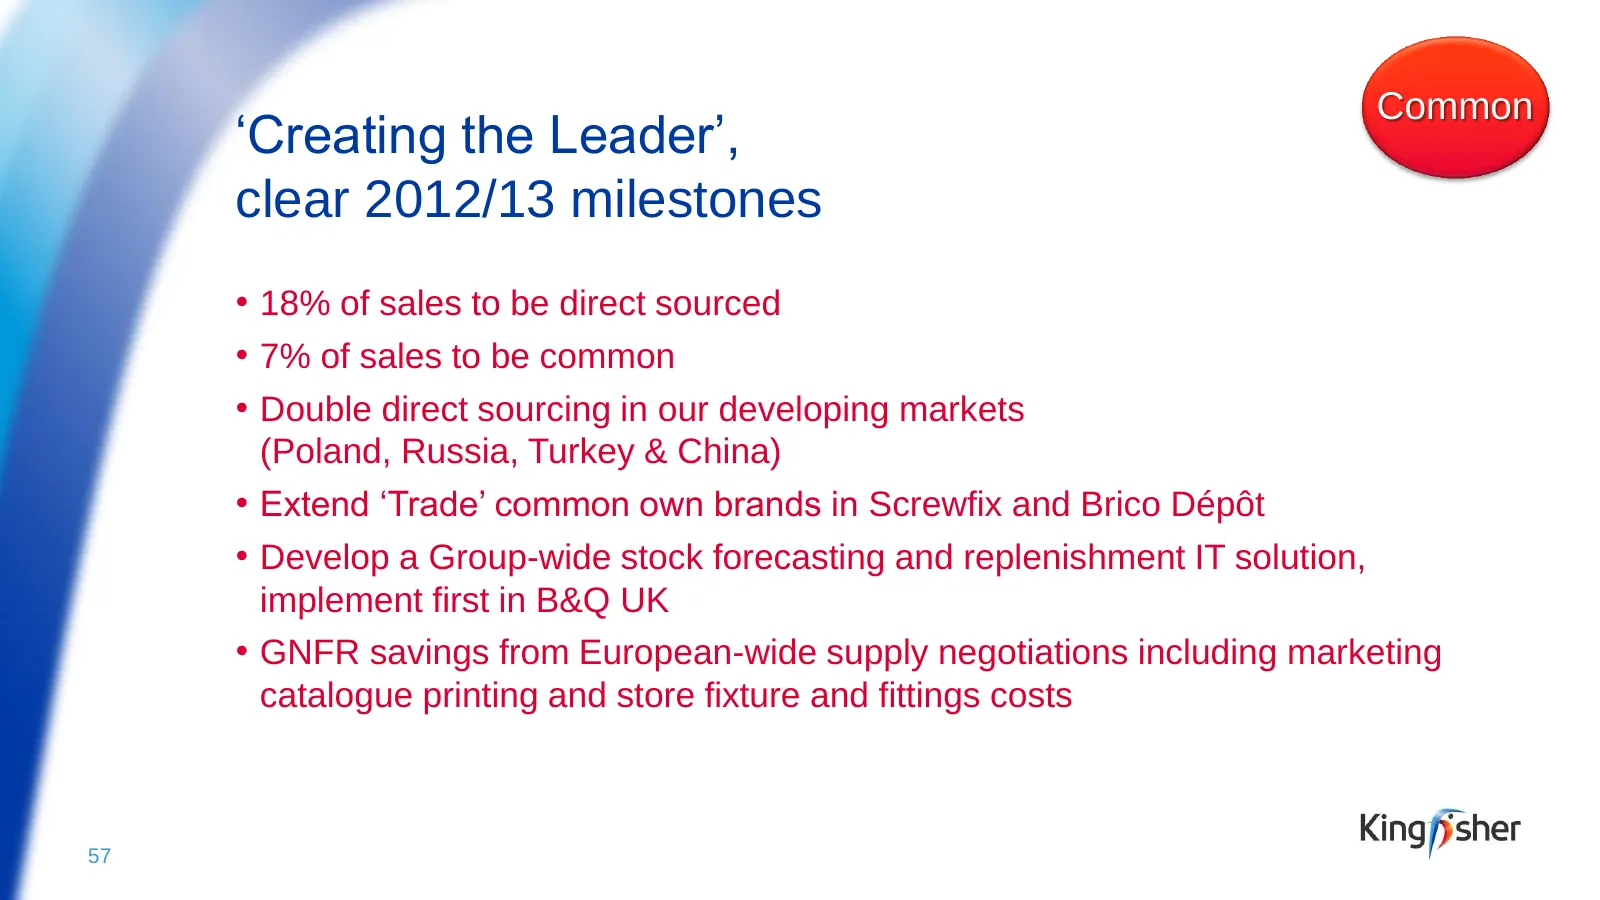
Common ‘Creating the Leader’, clear 2012/13 milestones • 18% of sales to be direct sourced • 7% of sales to be common • Double direct sourcing in our developing markets (Poland, Russia, Turkey & China) • Extend ‘Trade’ common own brands in Screwfix and Brico Dépôt • Develop a Group-wide stock foreca
Slide 56: ‘Creating the Leader’, clear 2012/13 milestones
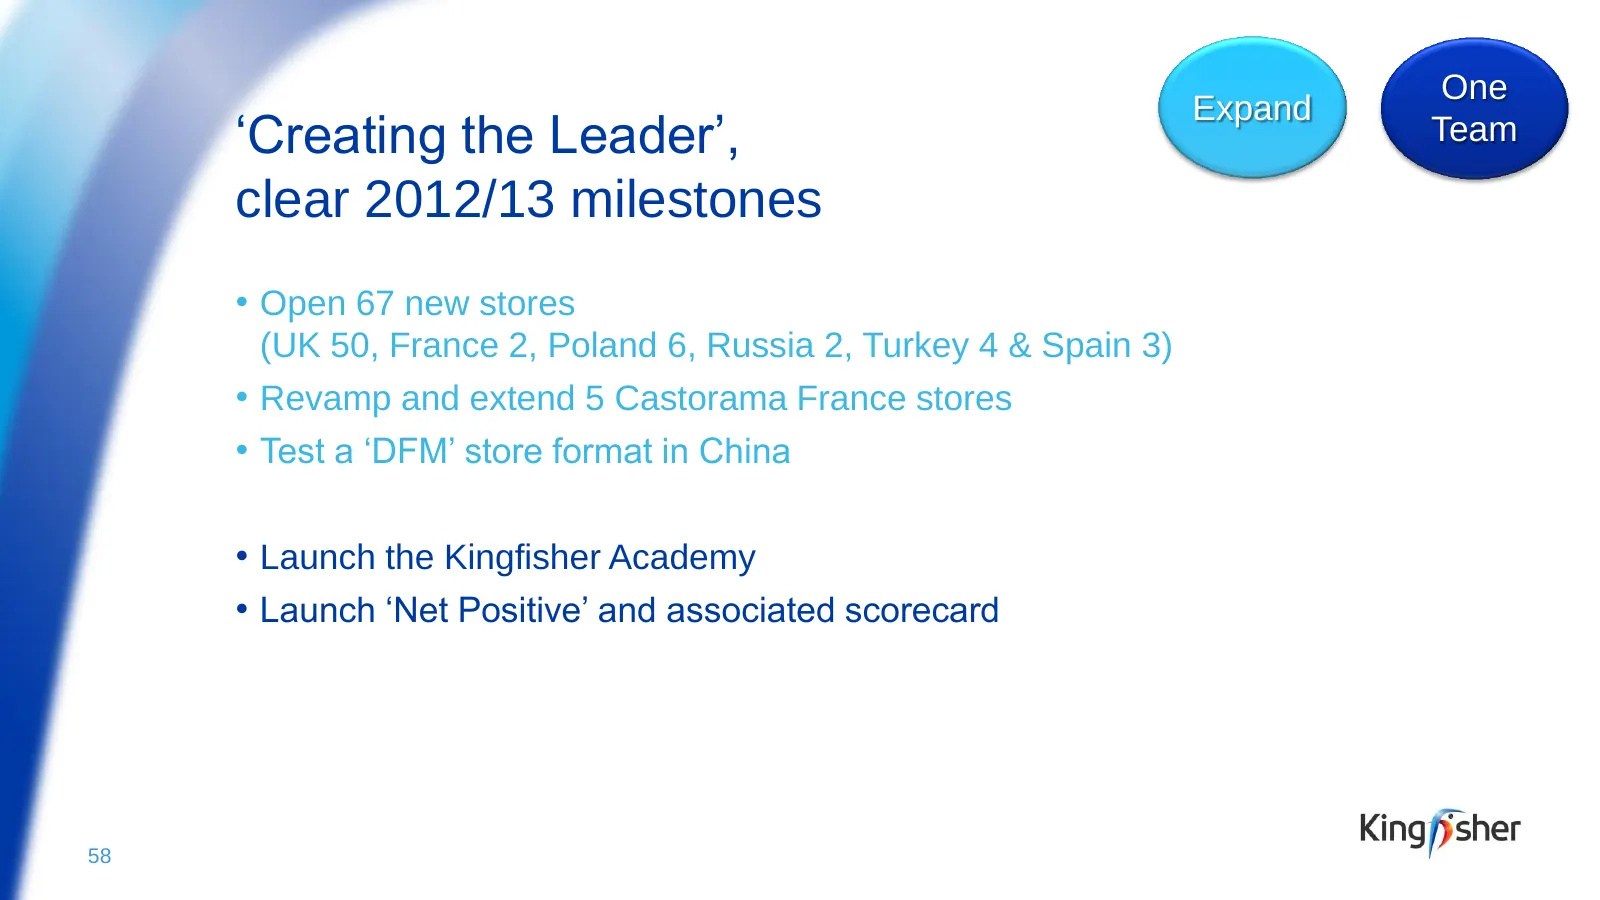
One Expand ‘Creating the Leader’, Team clear 2012/13 milestones • Open 67 new stores (UK 50, France 2, Poland 6, Russia 2, Turkey 4 & Spain 3) • Revamp and extend 5 Castorama France stores • Test a ‘DFM’ store format in China • Launch the Kingfisher Academy • Launch ‘Net Positive’ and associated sco
Slide 57: Summary & Outlook
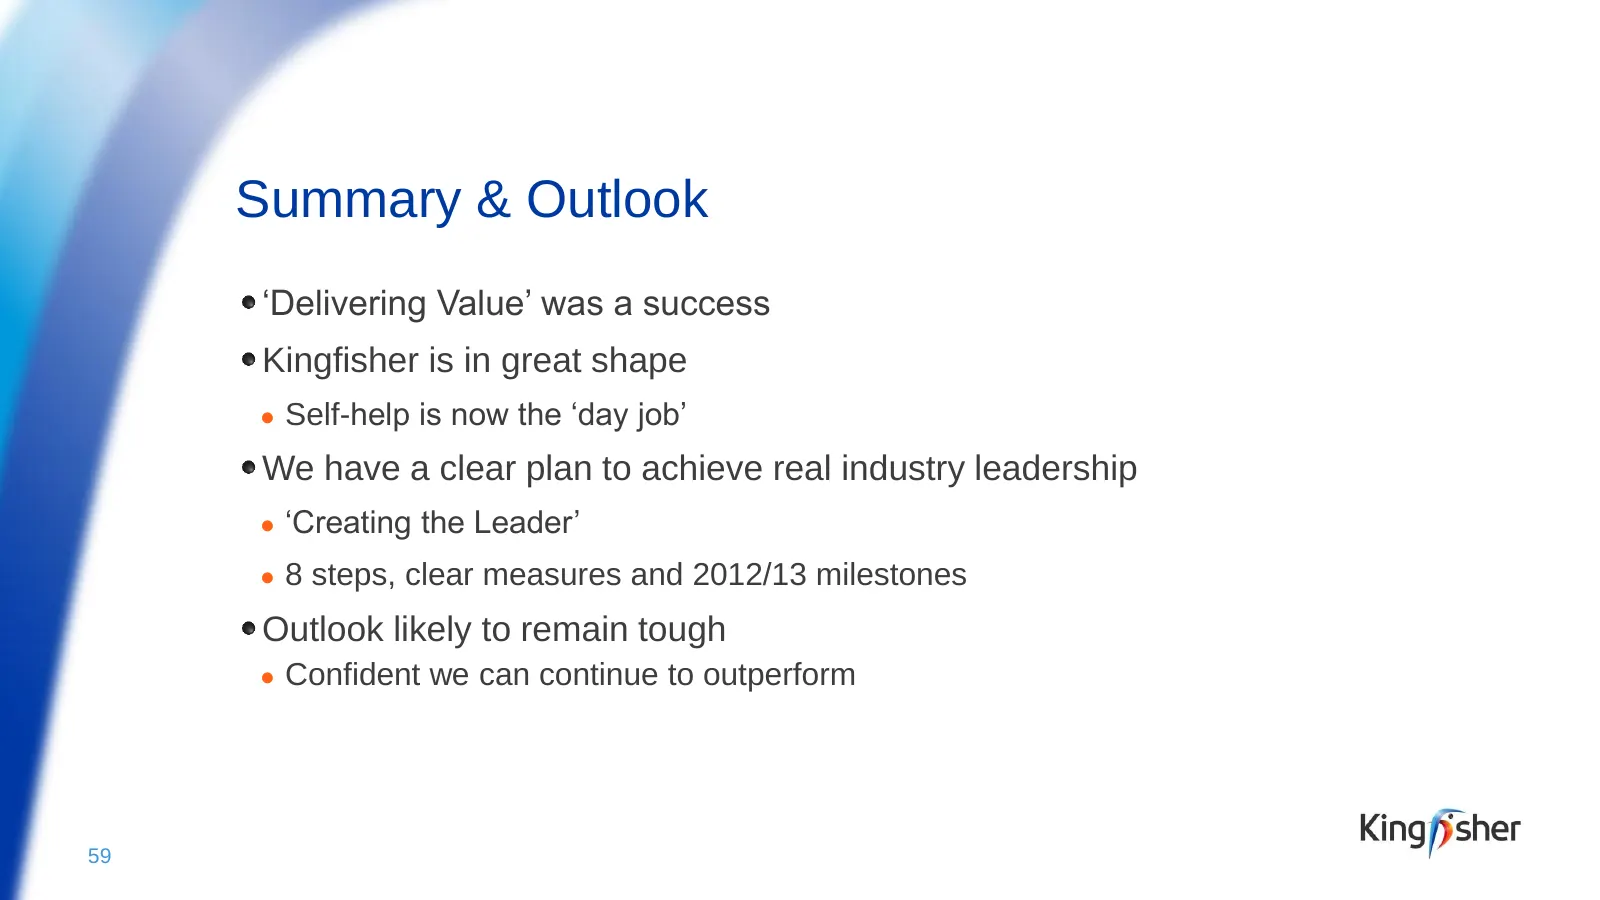
Summary & Outlook ‘Delivering Value’ was a success Kingfisher is in great shape ● Self-help is now the ‘day job’ We have a clear plan to achieve real industry leadership ● ‘Creating the Leader’ ● 8 steps, clear measures and 2012/13 milestones Outlook likely to remain tough ● Confident we can continu
Slide 58: Cautionary note regarding forward-looking statements
Cautionary note regarding forward-looking statements THIS PRESENTATION CONTAINS FORWARD-LOOKING STATEMENTS AND IS THEREFORE SUBJECT TO RISKS, ASSUMPTIONS AND UNCERTAINTIES THAT COULD CAUSE ACTUAL RESULTS TO DIFFER MATERIALLY FROM THOSE EXPRESSED OR IMPLIED BECAUSE THEY RELATE TO FUTURE EVENTS. THESE

Slide 59: Appendices
Appendices
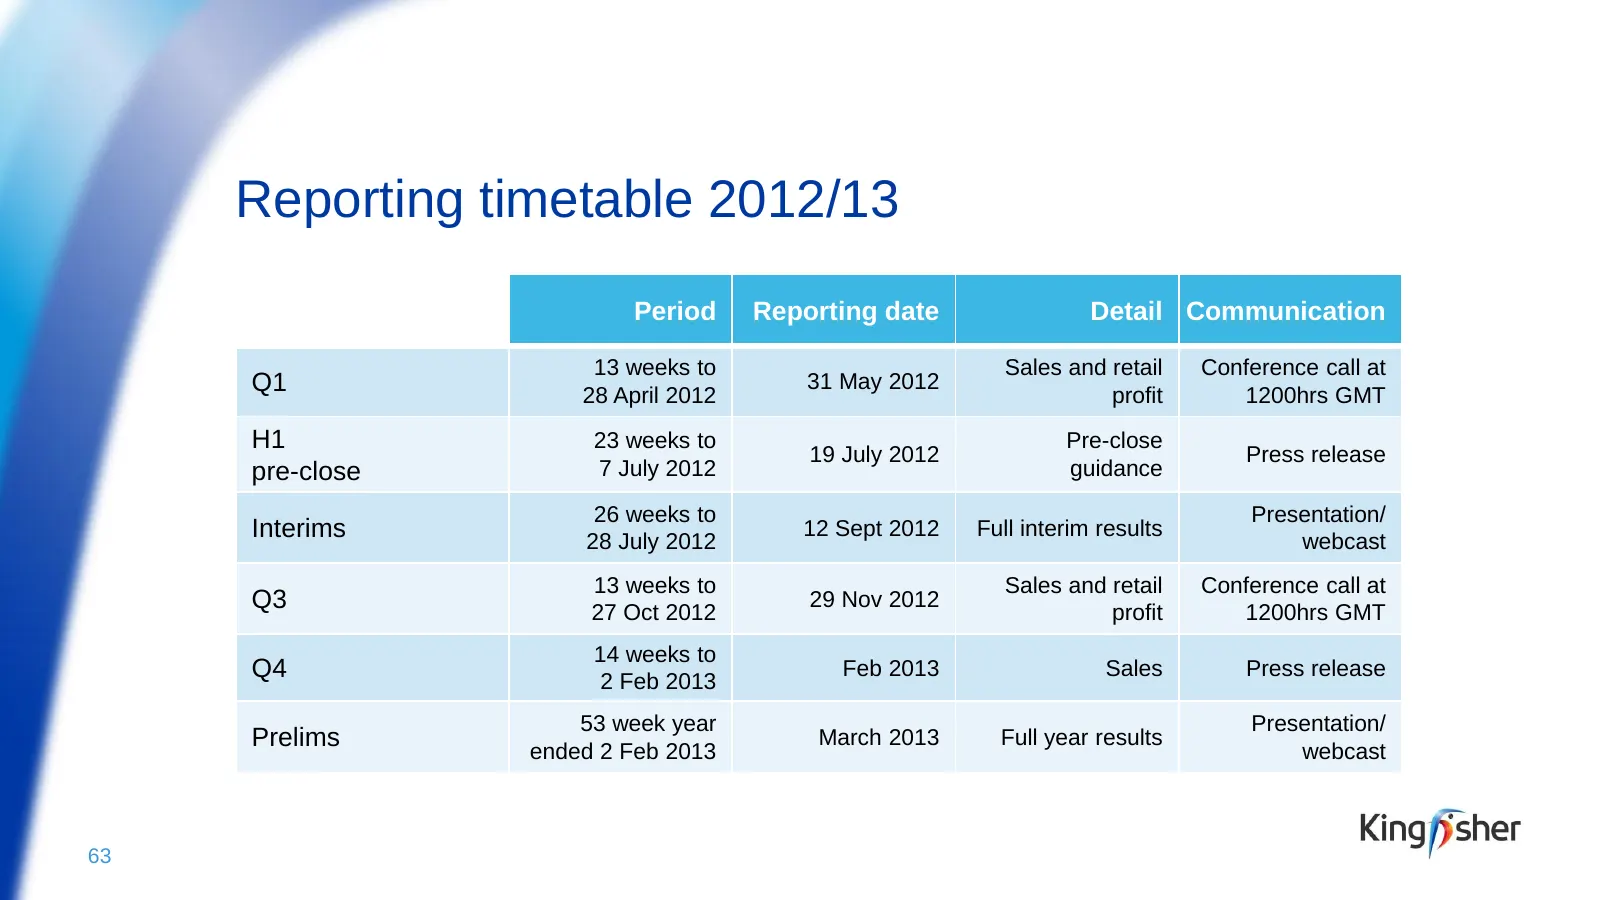
Slide 60: Reporting timetable 2012/13
Reporting timetable 2012/13 Period Reporting date Detail Communication 13 weeks to Sales and retail Conference call at Q1 28 April 2012 31 May 2012 profit 1200hrs GMT H1 23 weeks to Pre-close 19 July 2012 Press release pre-close 7 July 2012 guidance 26 weeks to Presentation/ Interims 28 July 2012 12
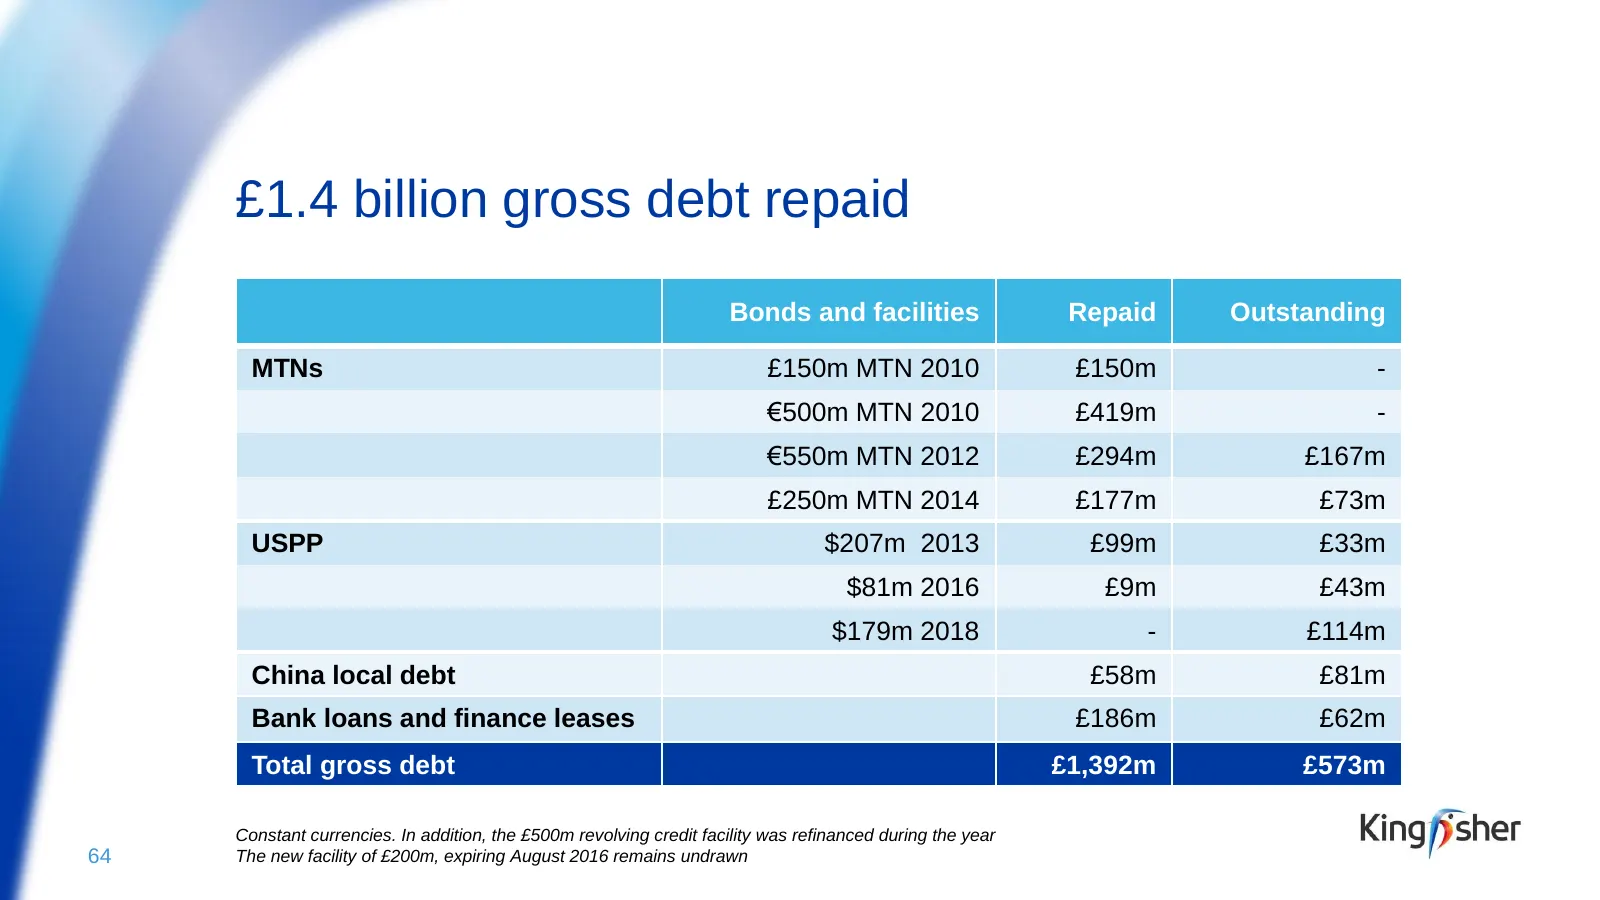
Slide 61: £1.4 billion gross debt repaid
£1.4 billion gross debt repaid Bonds and facilities Repaid Outstanding MTNs £150m MTN 2010 £150m - €500m MTN 2010 £419m - €550m MTN 2012 £294m £167m £250m MTN 2014 £177m £73m USPP $207m 2013 £99m £33m $81m 2016 £9m £43m $179m 2018 - £114m China local debt £58m £81m Bank loans and finance leases £186
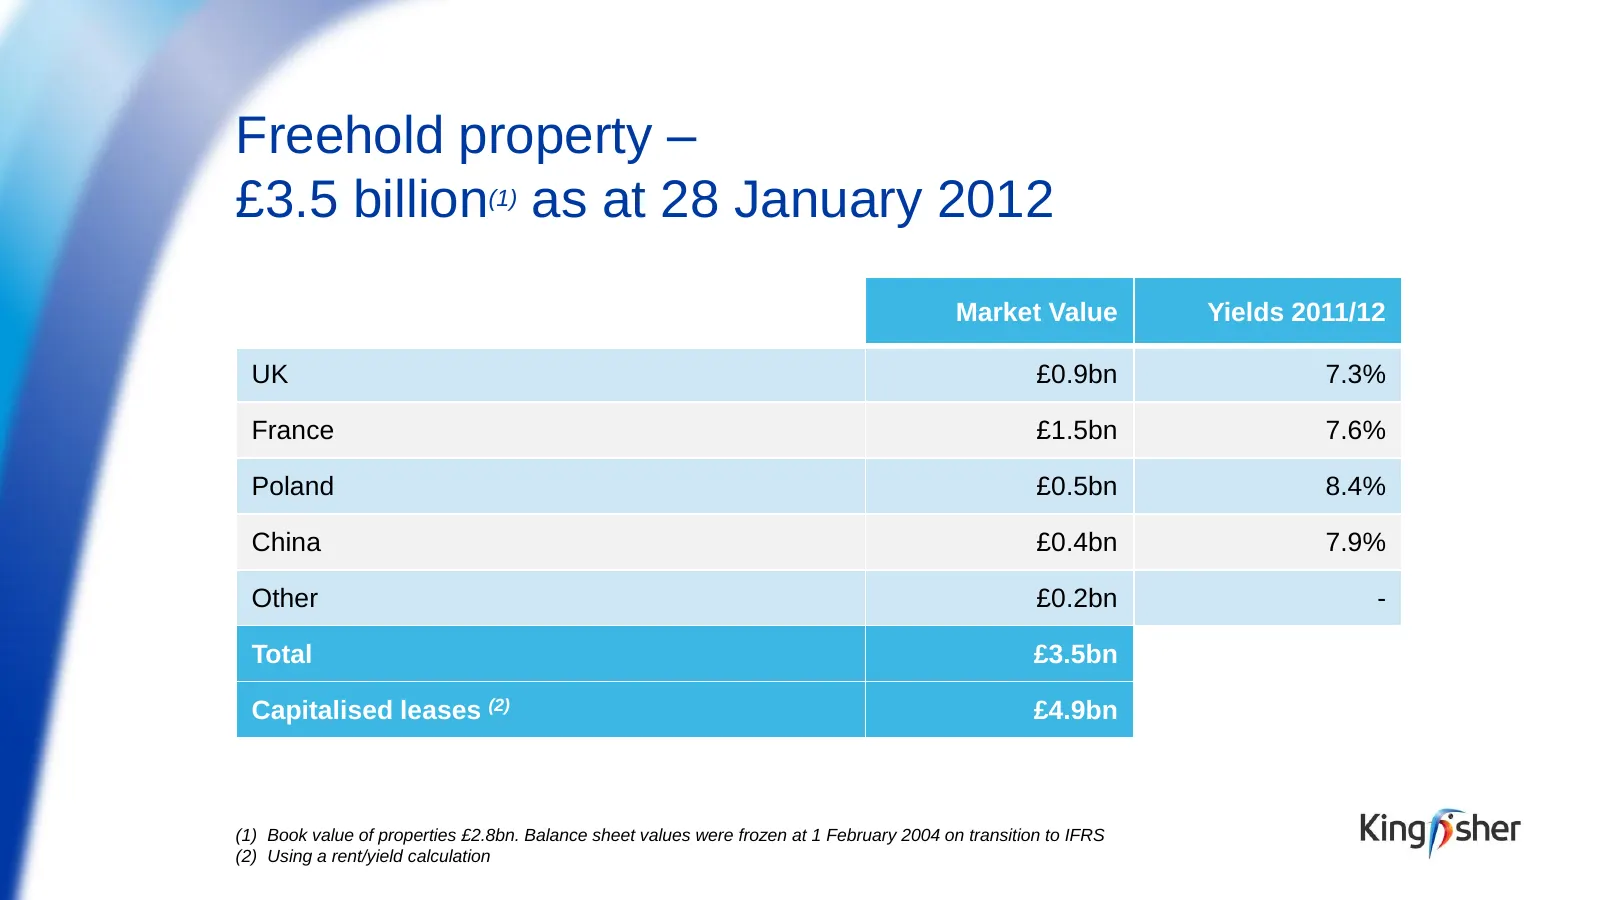
Slide 62: Freehold property – £3.5 billion as at January 2012
Freehold property – £3.5 billion(1) as at 28 January 2012 Market Value Yields 2011/12 UK £0.9bn 7.3% France £1.5bn 7.6% Poland £0.5bn 8.4% China £0.4bn 7.9% Other £0.2bn - Total £3.5bn Capitalised leases (2) £4.9bn (1) Book value of properties £2.8bn. Balance sheet values were frozen at 1 February 2
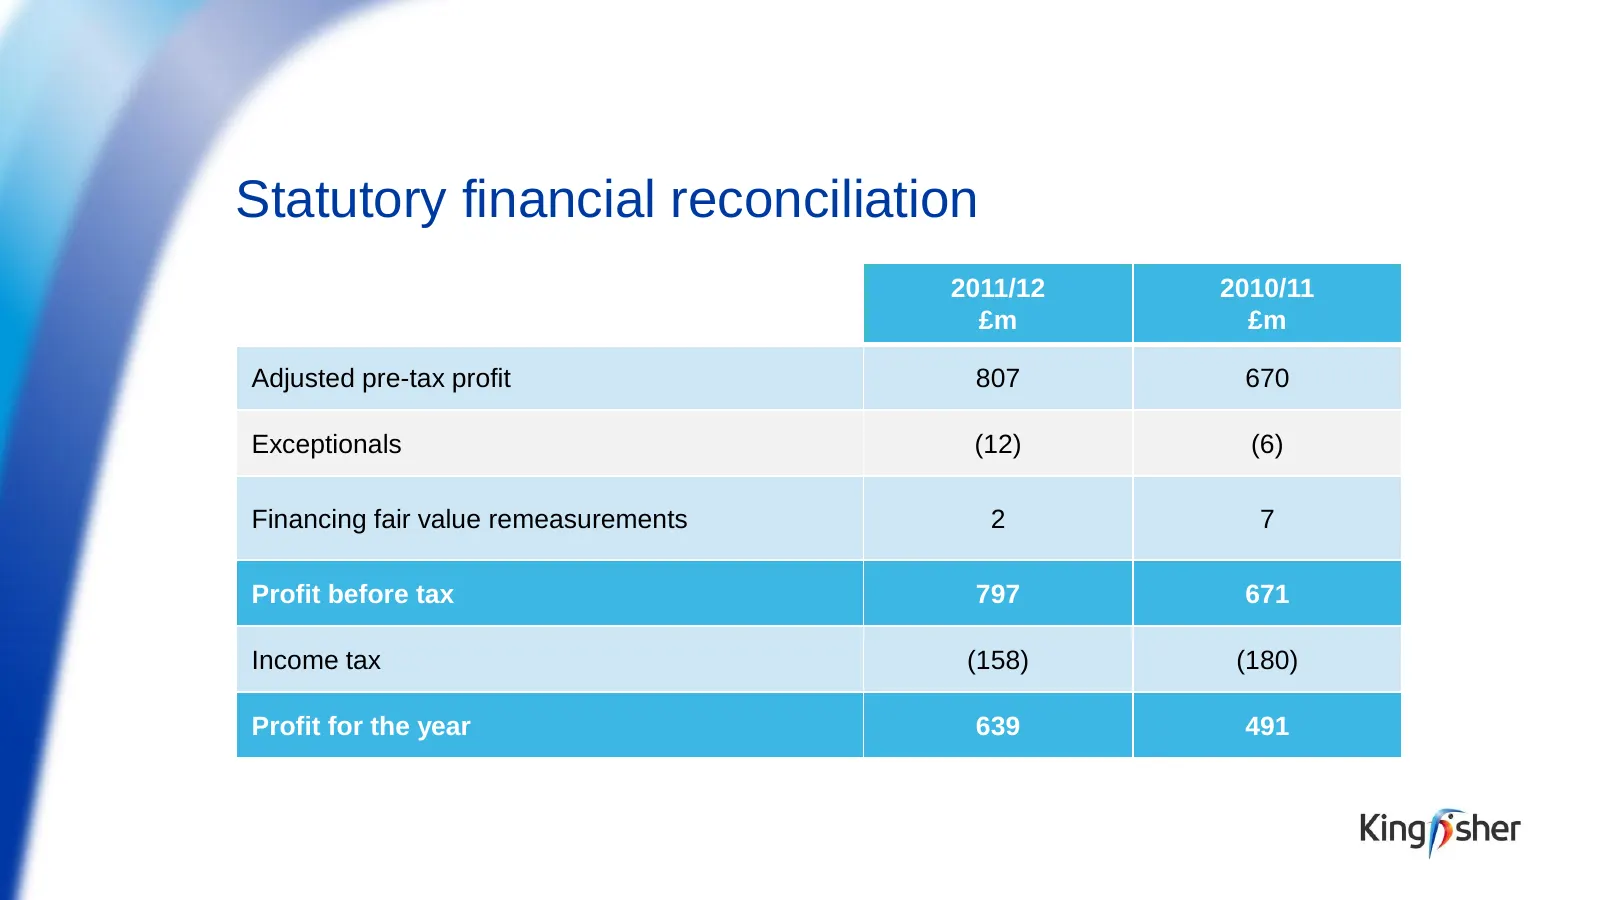
Slide 63: Statutory financial reconciliation
Statutory financial reconciliation 2011/12 2010/11 £m £m Adjusted pre-tax profit 807 670 Exceptionals (12) (6) Financing fair value remeasurements 2 7 Profit before tax 797 671 Income tax (158) (180) Profit for the year 639 491
Slide 64: Return on Capital (ROC)
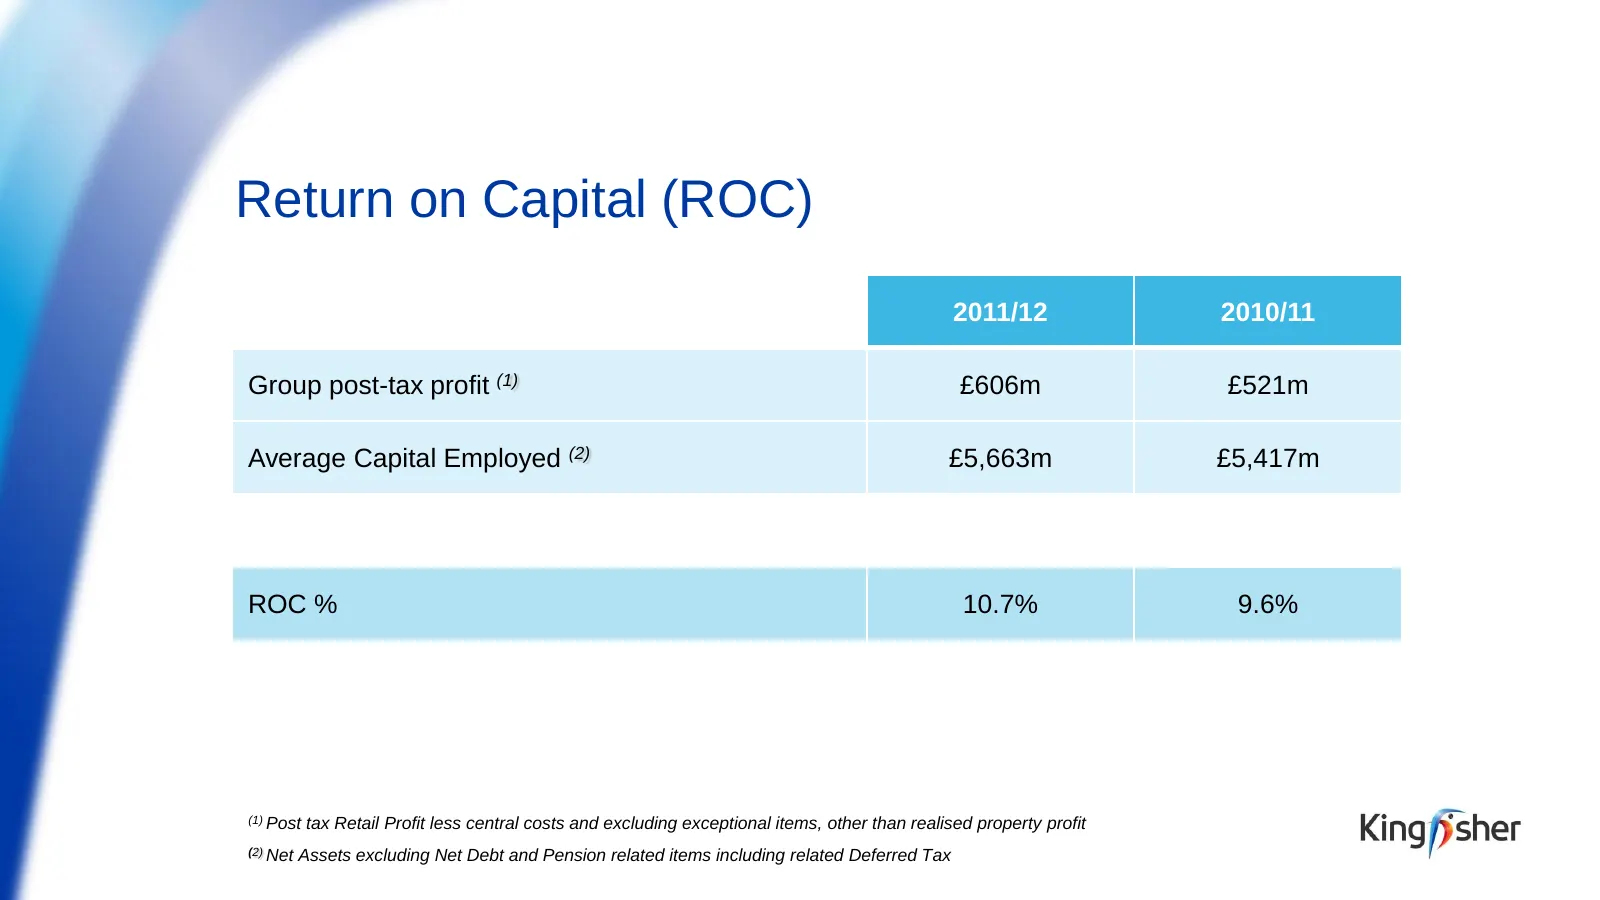
Return on Capital (ROC) 2011/12 2010/11 Group post-tax profit (1) £606m £521m Average Capital Employed (2) £5,663m £5,417m ROC % 10.7% 9.6% (1) Post tax Retail Profit less central costs and excluding exceptional items, other than realised property profit (2) Net Assets excluding Net Debt and Pension
Slide 65: Lease adjusted ROC
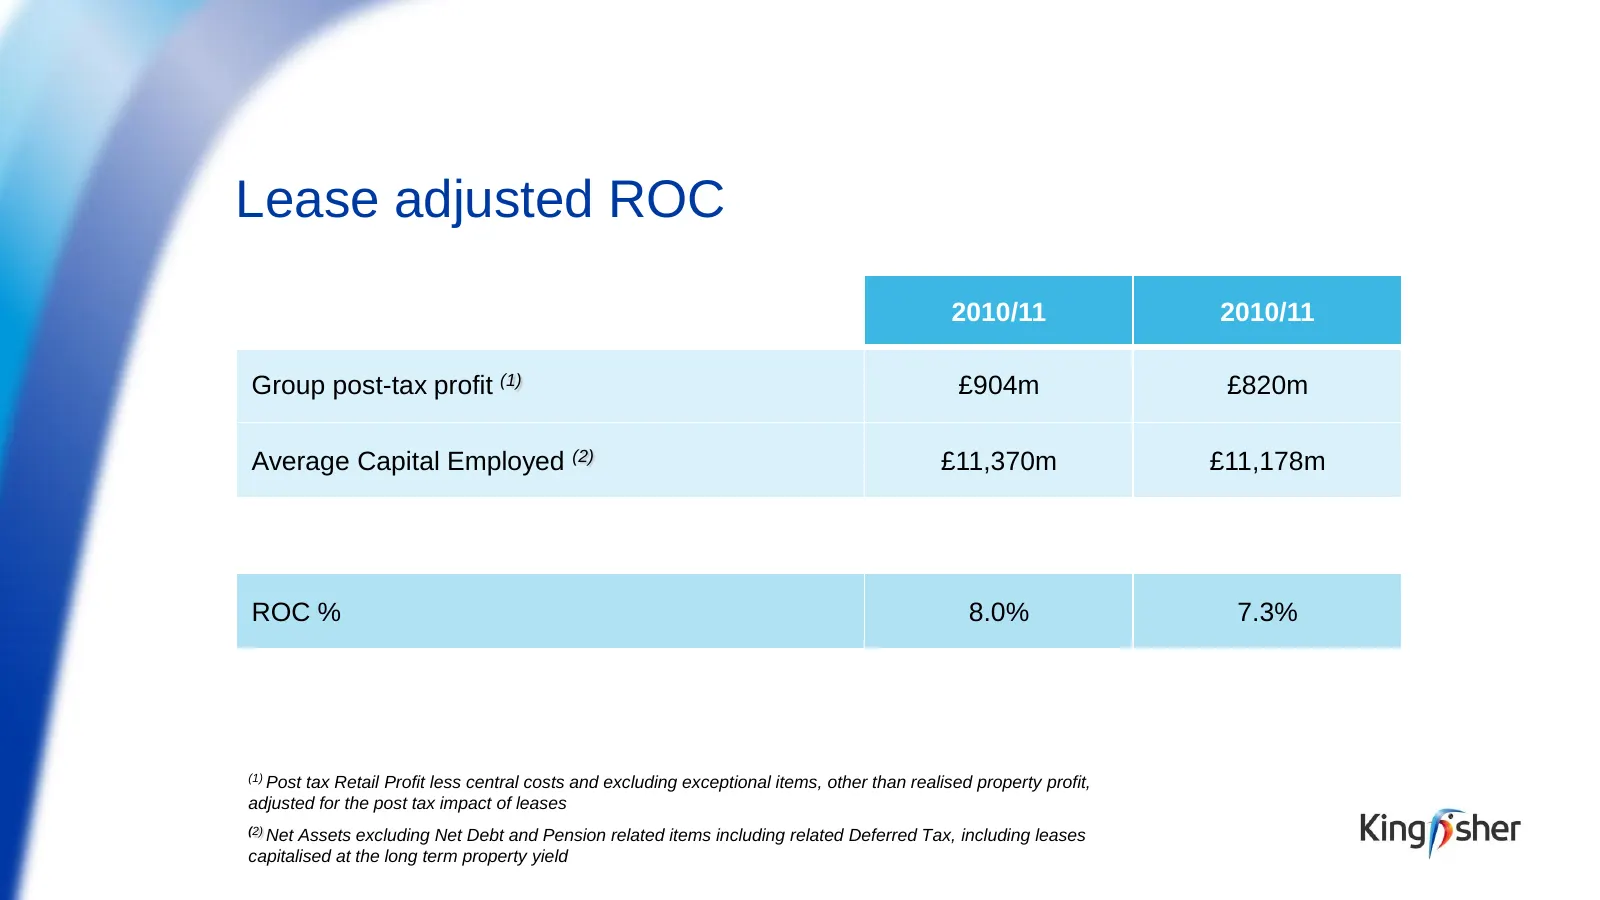
Lease adjusted ROC 2010/11 2010/11 Group post-tax profit (1) £904m £820m Average Capital Employed (2) £11,370m £11,178m ROC % 8.0% 7.3% (1) Post tax Retail Profit less central costs and excluding exceptional items, other than realised property profit, adjusted for the post tax impact of leases (2) N
Slide 66: Sponsored ADR programme
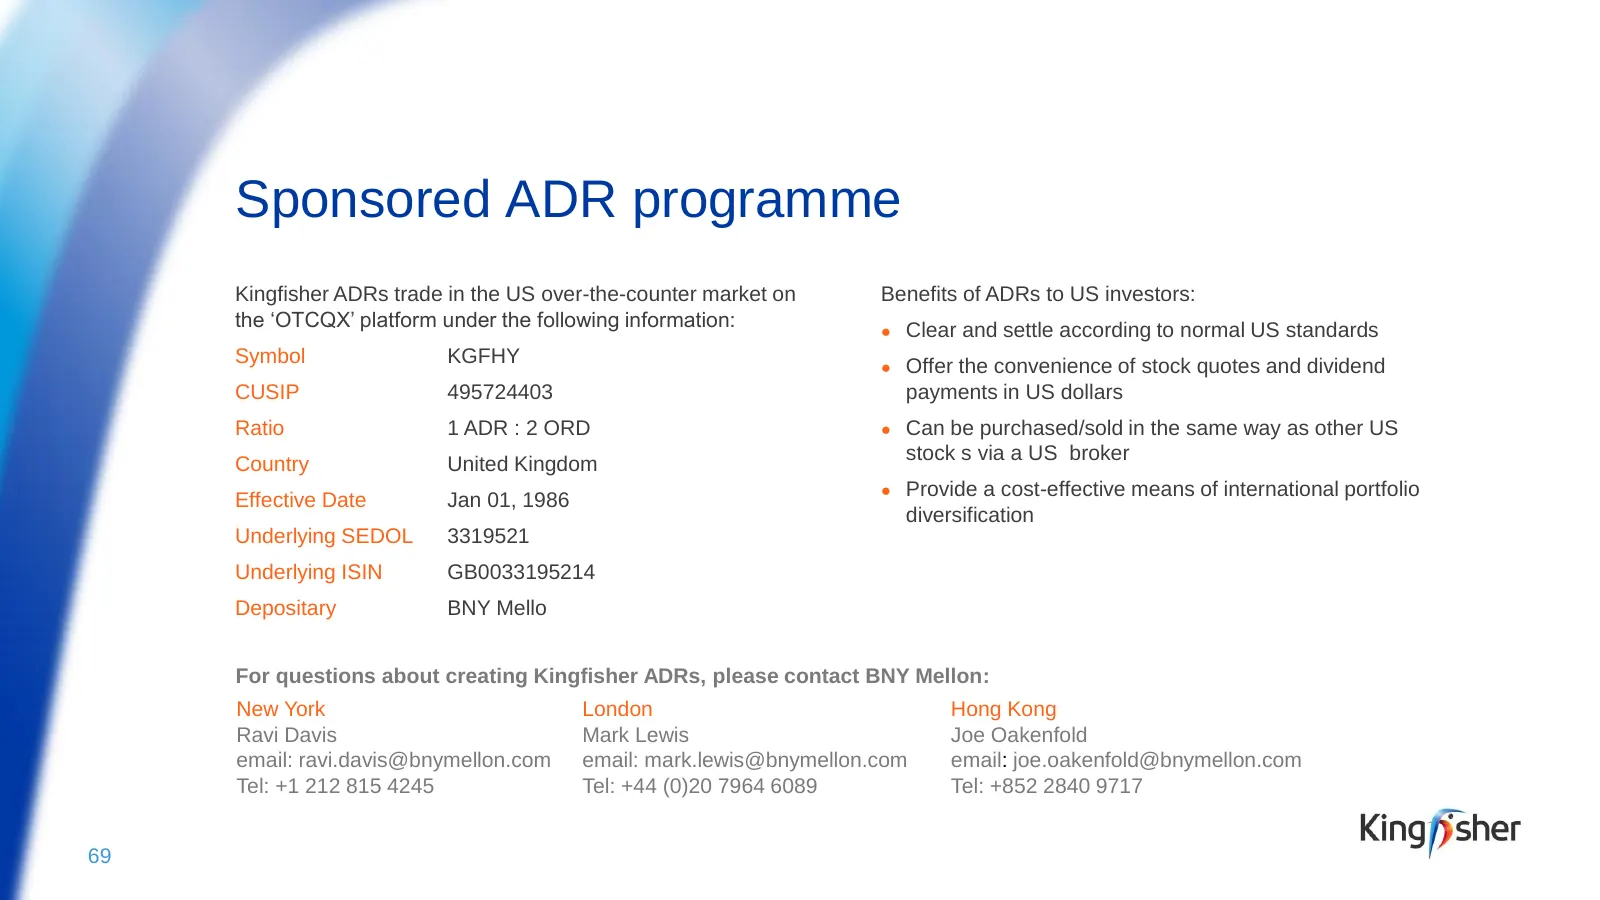
Sponsored ADR programme Kingfisher ADRs trade in the US over-the-counter market on Benefits of ADRs to US investors: the ‘OTCQX’ platform under the following information: ● Clear and settle according to normal US standards Symbol KGFHY ● Offer the convenience of stock quotes and dividend CUSIP 49572
Source: Internet Archive copy of kingfisher.com
More decks from Kingfisher PLC
 H1 2026/27 Earnings Presentation33 slides · Sep 22, 2026
 FY2025/26 Earnings Presentation39 slides · Mar 24, 2026
 H1 2025/26 Earnings Presentation38 slides · Sep 23, 2025
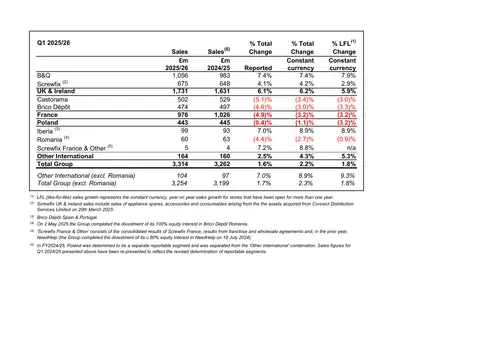 H1 2025/26 Earnings Presentation6 slides · September 2025
 FY2024/25 Earnings Presentation35 slides · Apr 8, 2025
 FY2024/25 Earnings Presentation40 slides · Mar 25, 2025