Guild — Q1 2021 Earnings Presentation
26 slides from Guild's earnings presentation, May 11, 2021

Slide 1: First Quarter 2021 Investor Presentation
First Quarter 2021 Investor Presentation MAY 2021
Slide 2: Disclaimer: Forward-Looking Statements
Disclaimer 2 Forward-Looking Statements This presentation contains forward-looking statements. These forward-looking statements reflect our current views with respect to, among other things, future events and our financial performance. These statements are often, but not always, made through the use
Slide 3: Overview of First Quarter 2021 Results
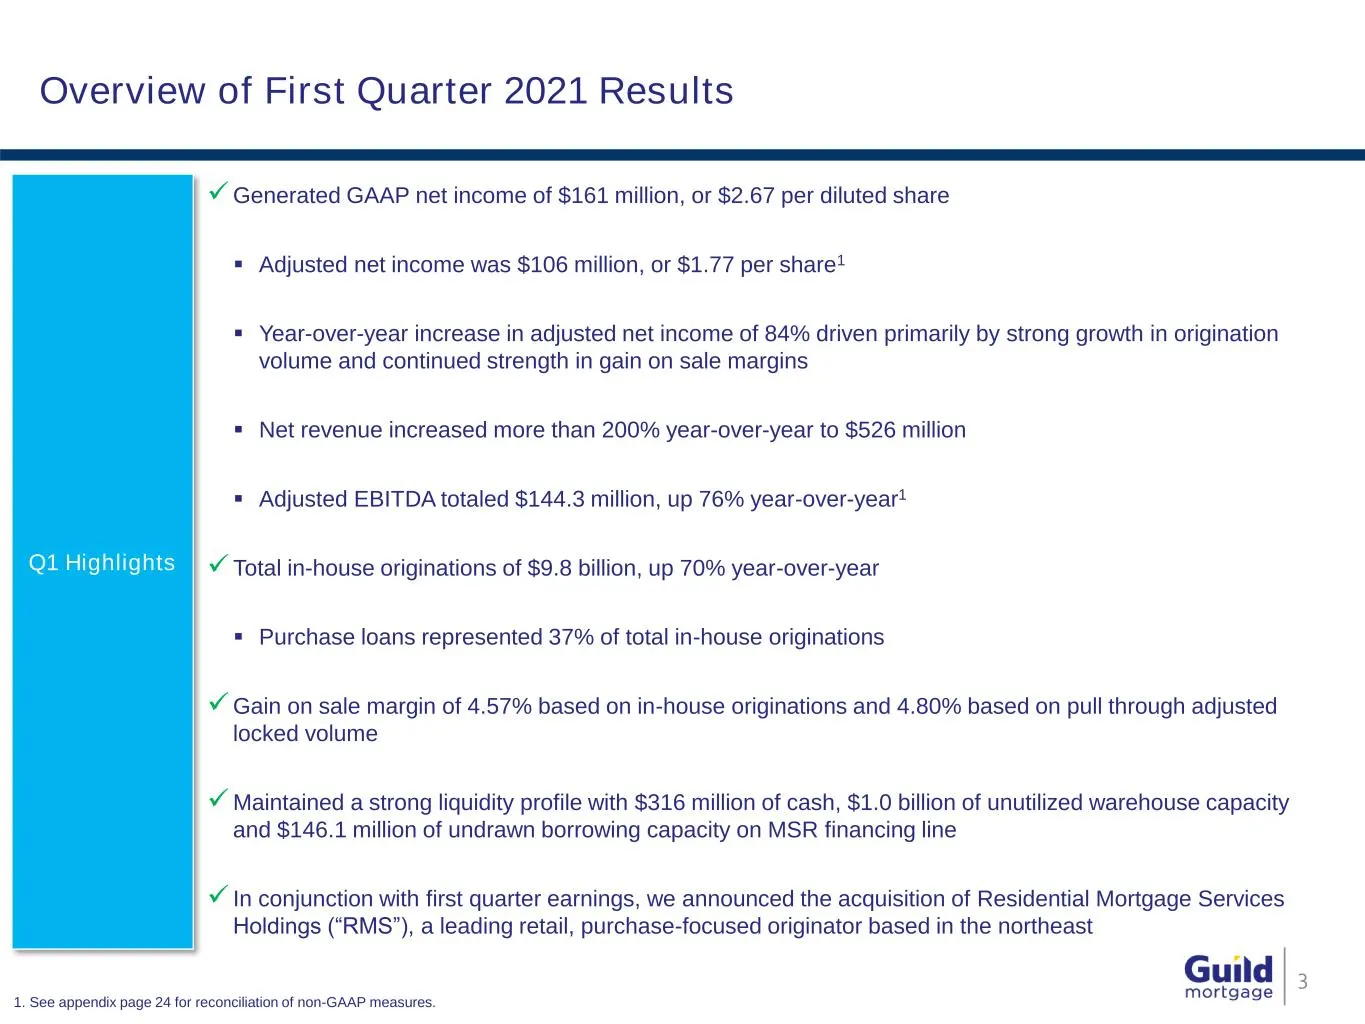
Overview of First Quarter 2021 Results 3 Q1 Highlights Generated GAAP net income of $161 million, or $2.67 per diluted share Adjusted net income was $106 million, or $1.77 per share1 Year-over-year increase in adjusted net income of 84% driven primarily by strong growth in origination volume an
Slide 4: Overview of First Quarter 2021 Results (continued)
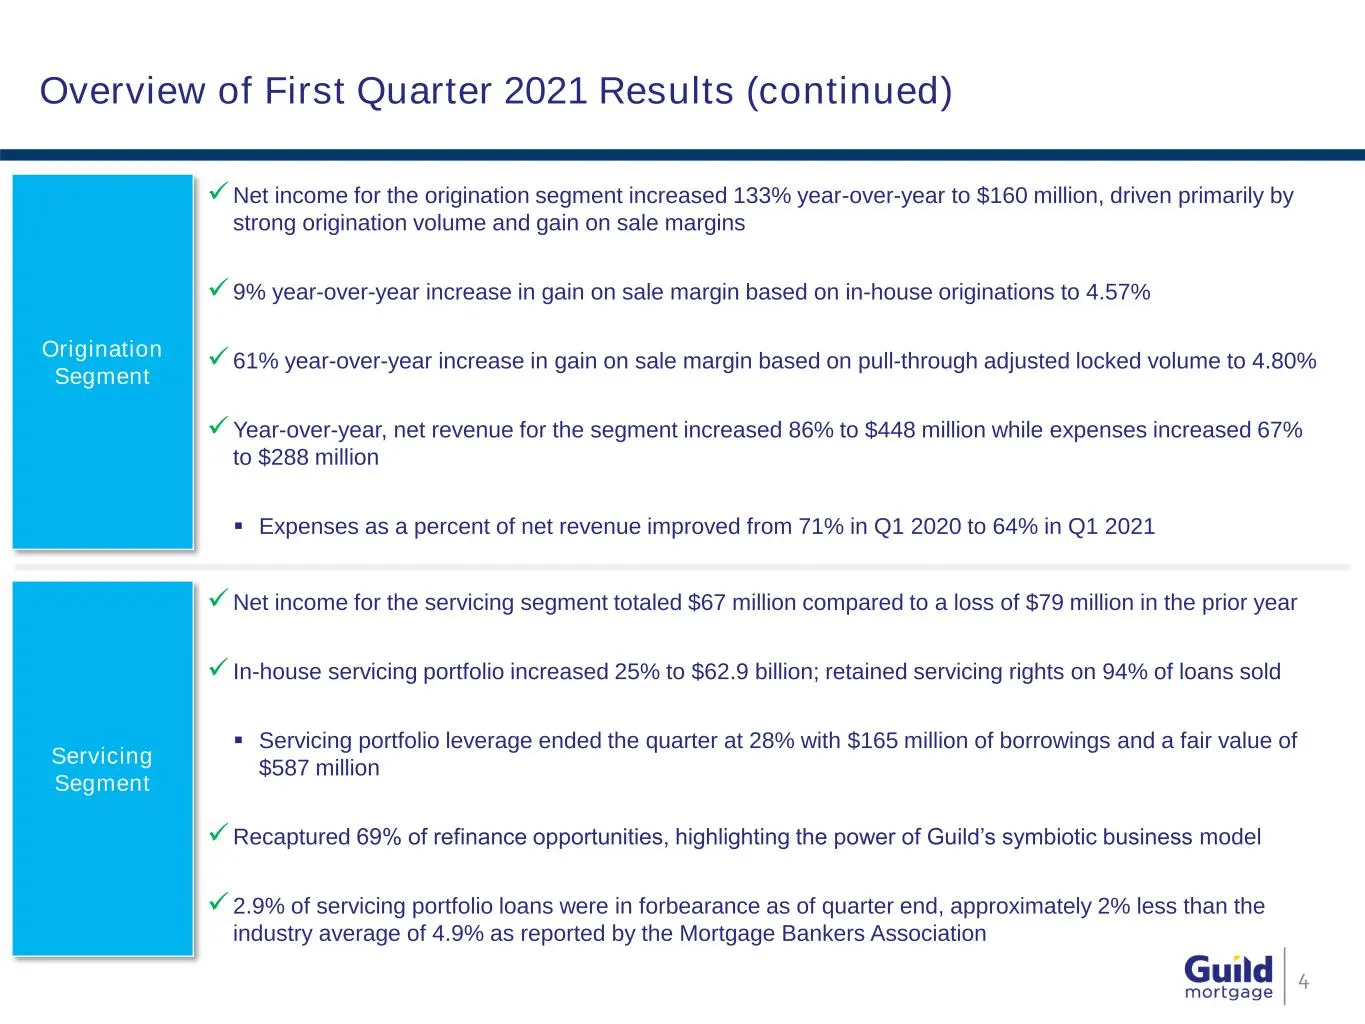
Overview of First Quarter 2021 Results (continued) 4 Origination Segment Net income for the origination segment increased 133% year-over-year to $160 million, driven primarily by strong origination volume and gain on sale margins 9% year-over-year increase in gain on sale margin based on in-house
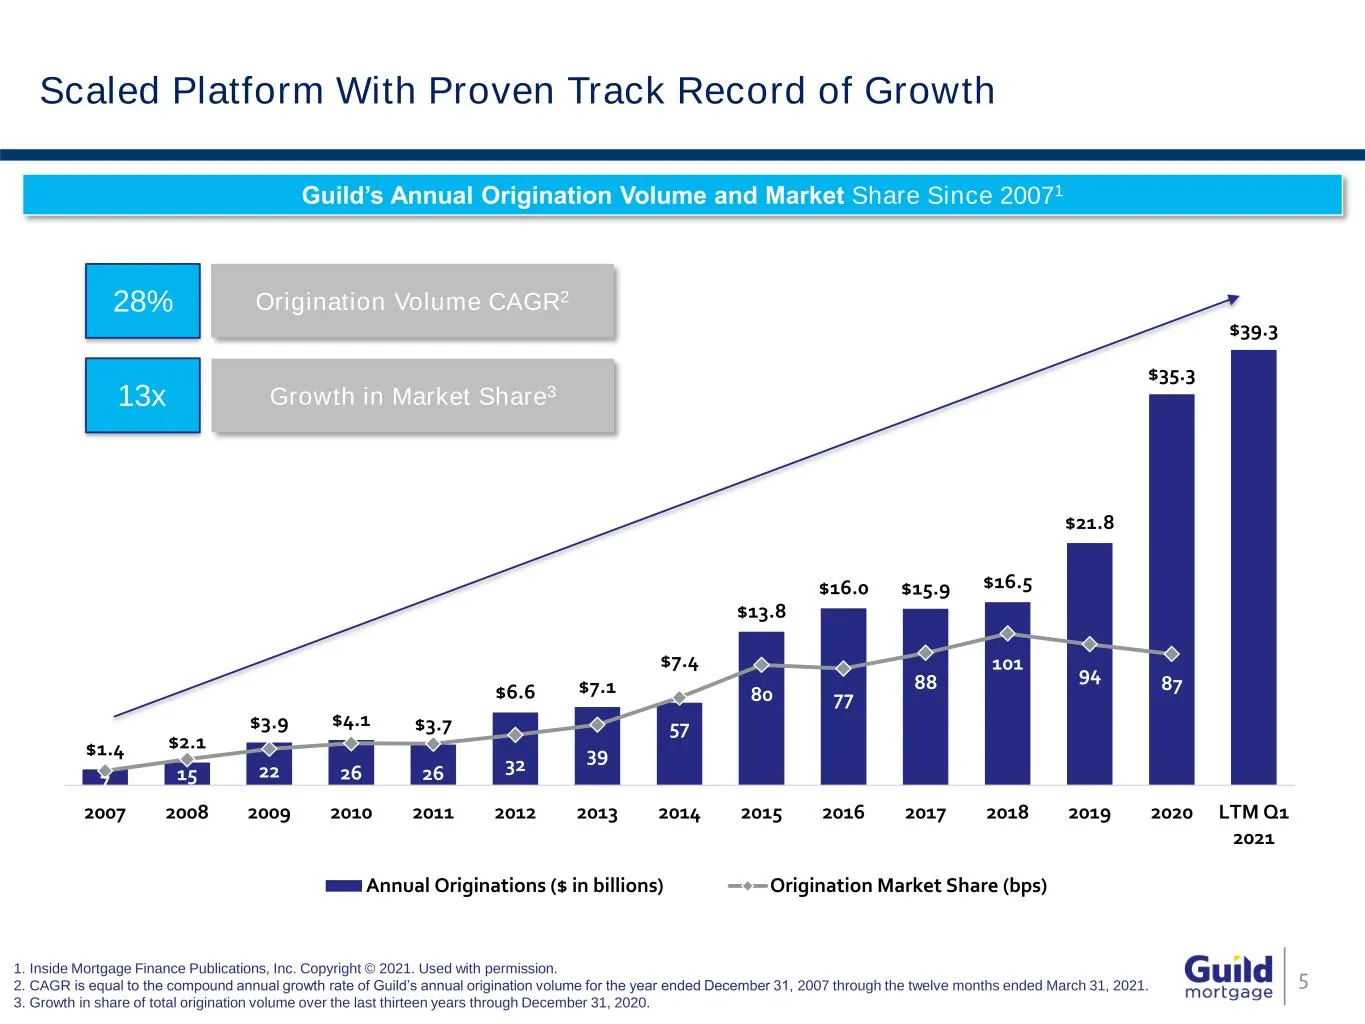
Slide 5: Scaled Platform With Proven Track Record of Growth
$1.4 $2.1 $3.9 $4.1 $3.7 $6.6 $7.1 $7.4 $13.8 $16.0 $15.9 $16.5 $21.8 $35.3 $39.3 7 15 22 26 26 32 39 57 80 77 88 101 94 87 2007 2008 2009 2010 2011 2012 2013 2014 2015 2016 2017 2018 2019 2020 LTM Q1 2021 Annual Originations ($ in billions) Origination Market Share (bps) Growth in Market Share3 Sca
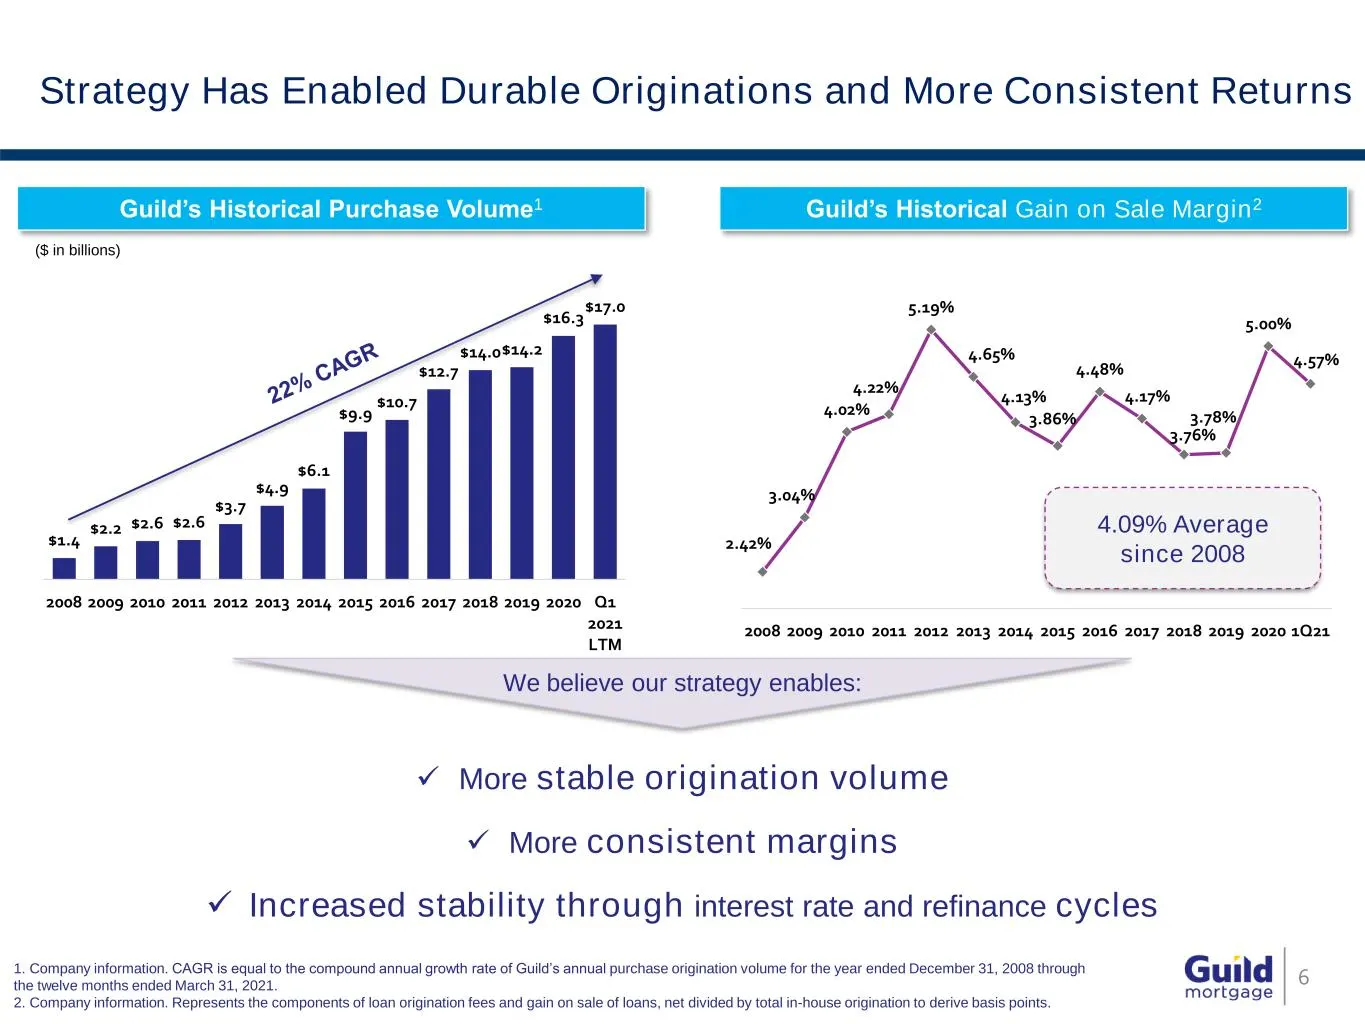
Slide 6: Strategy Has Enabled Durable Originations and More Consistent Returns
2.42% 3.04% 4.02% 4.22% 5.19% 4.65% 4.13% 3.86% 4.48% 4.17% 3.76% 3.78% 5.00% 4.57% 2008 2009 2010 2011 2012 2013 2014 2015 2016 2017 2018 2019 2020 1Q21 Guild’s Historical Gain on Sale Margin2 Strategy Has Enabled Durable Originations and More Consistent Returns 1. Company information. CAGR is equa

Slide 7: Residential Mortgage Services Holdings Transaction Overview
Residential Mortgage Services Holdings Transaction Overview 7
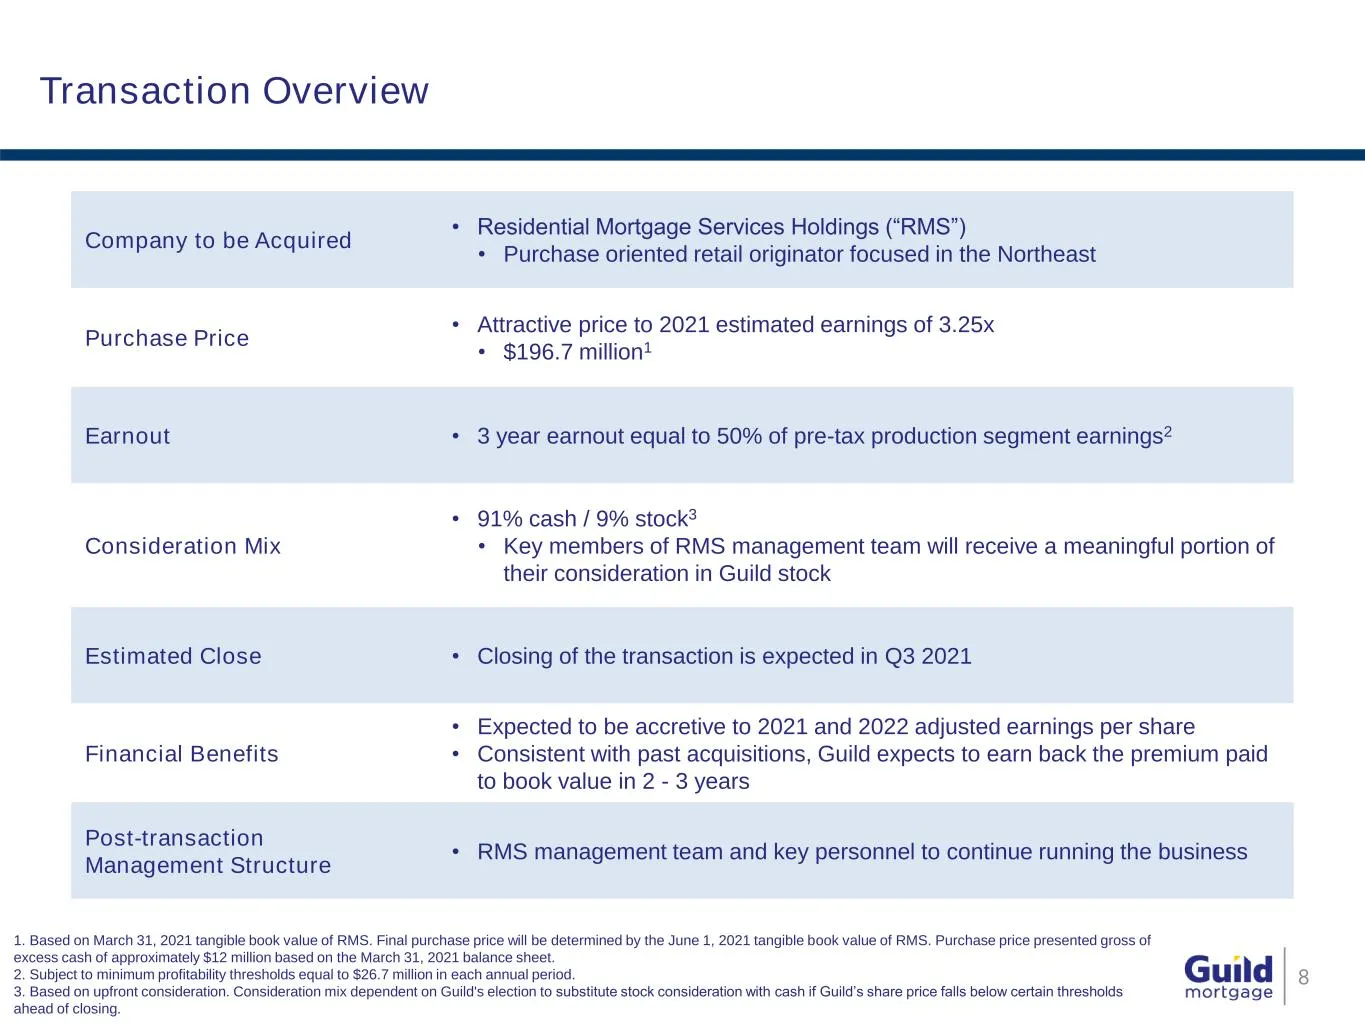
Slide 8: Transaction Overview
Transaction Overview 8 Company to be Acquired • Residential Mortgage Services Holdings (“RMS”) • Purchase oriented retail originator focused in the Northeast Purchase Price • Attractive price to 2021 estimated earnings of 3.25x • $196.7 million1 Earnout • 3 year earnout equal to 50% of pre-tax produ
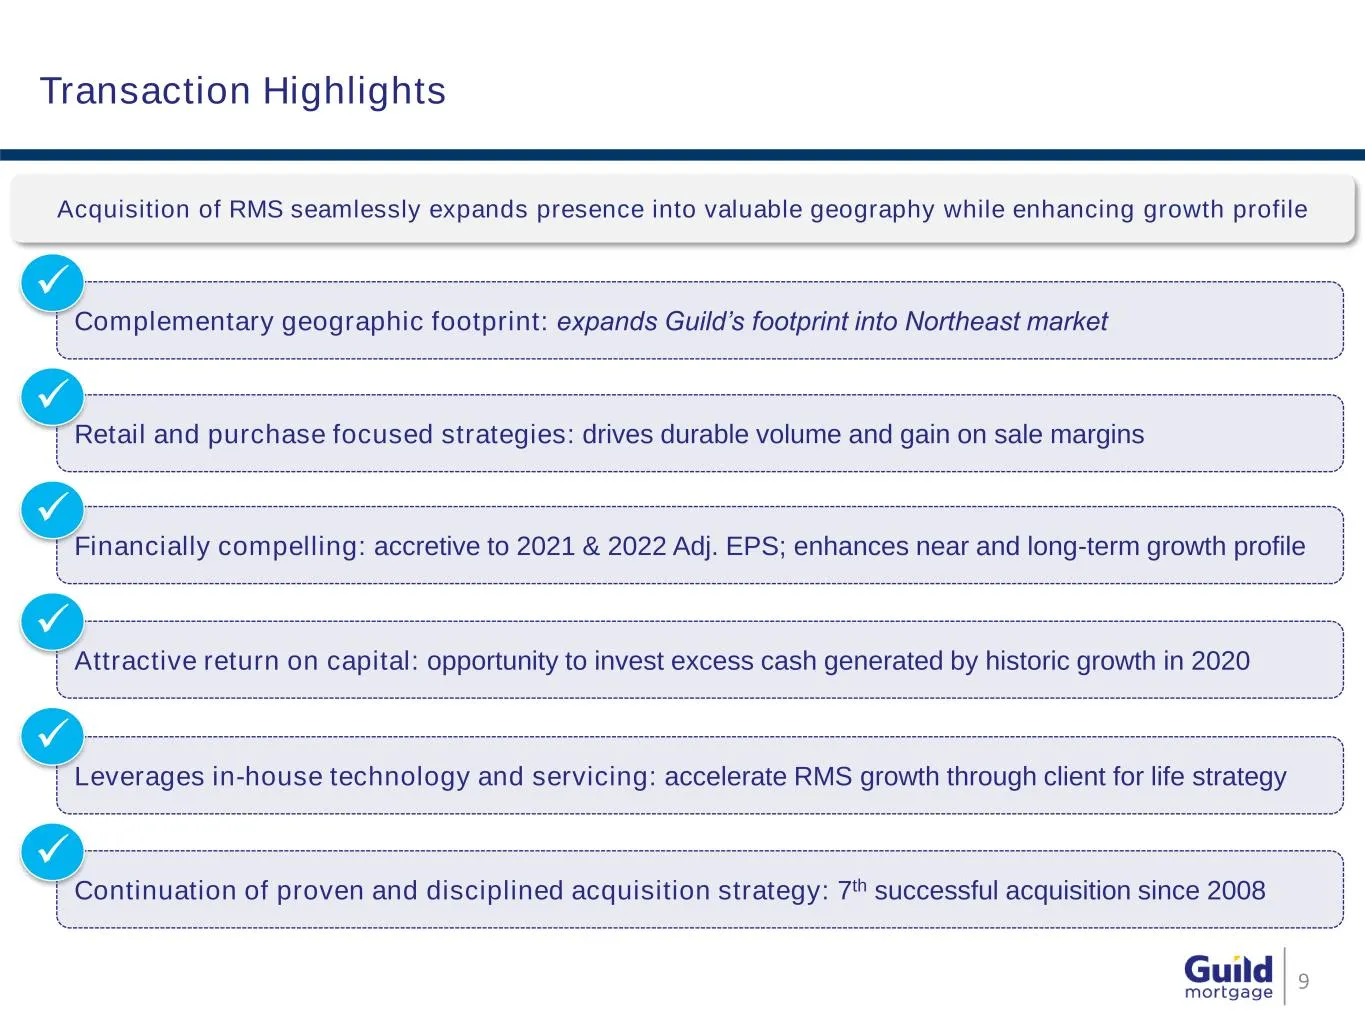
Slide 9: Transaction Highlights
Transaction Highlights 9 Acquisition of RMS seamlessly expands presence into valuable geography while enhancing growth profile Complementary geographic footprint: expands Guild’s footprint into Northeast market Leverages in-house technology and servicing: accelerate RMS growth through client for l
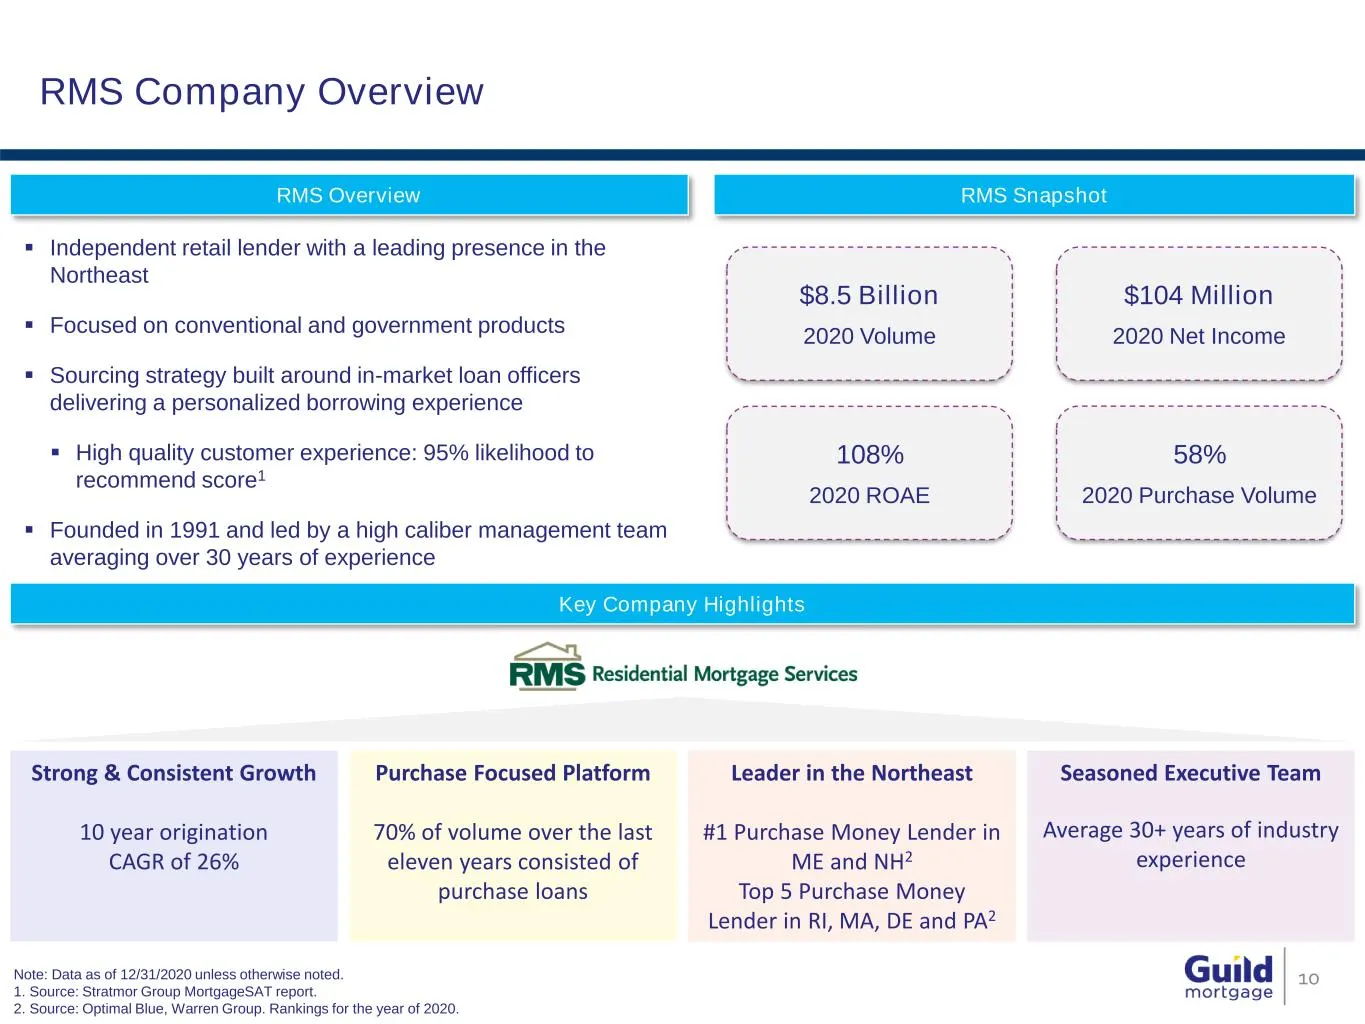
Slide 10: RMS Company Overview
RMS Company Overview 10Note: Data as of 12/31/2020 unless otherwise noted. 1. Source: Stratmor Group MortgageSAT report. 2. Source: Optimal Blue, Warren Group. Rankings for the year of 2020. Independent retail lender with a leading presence in the Northeast Focused on conventional and government
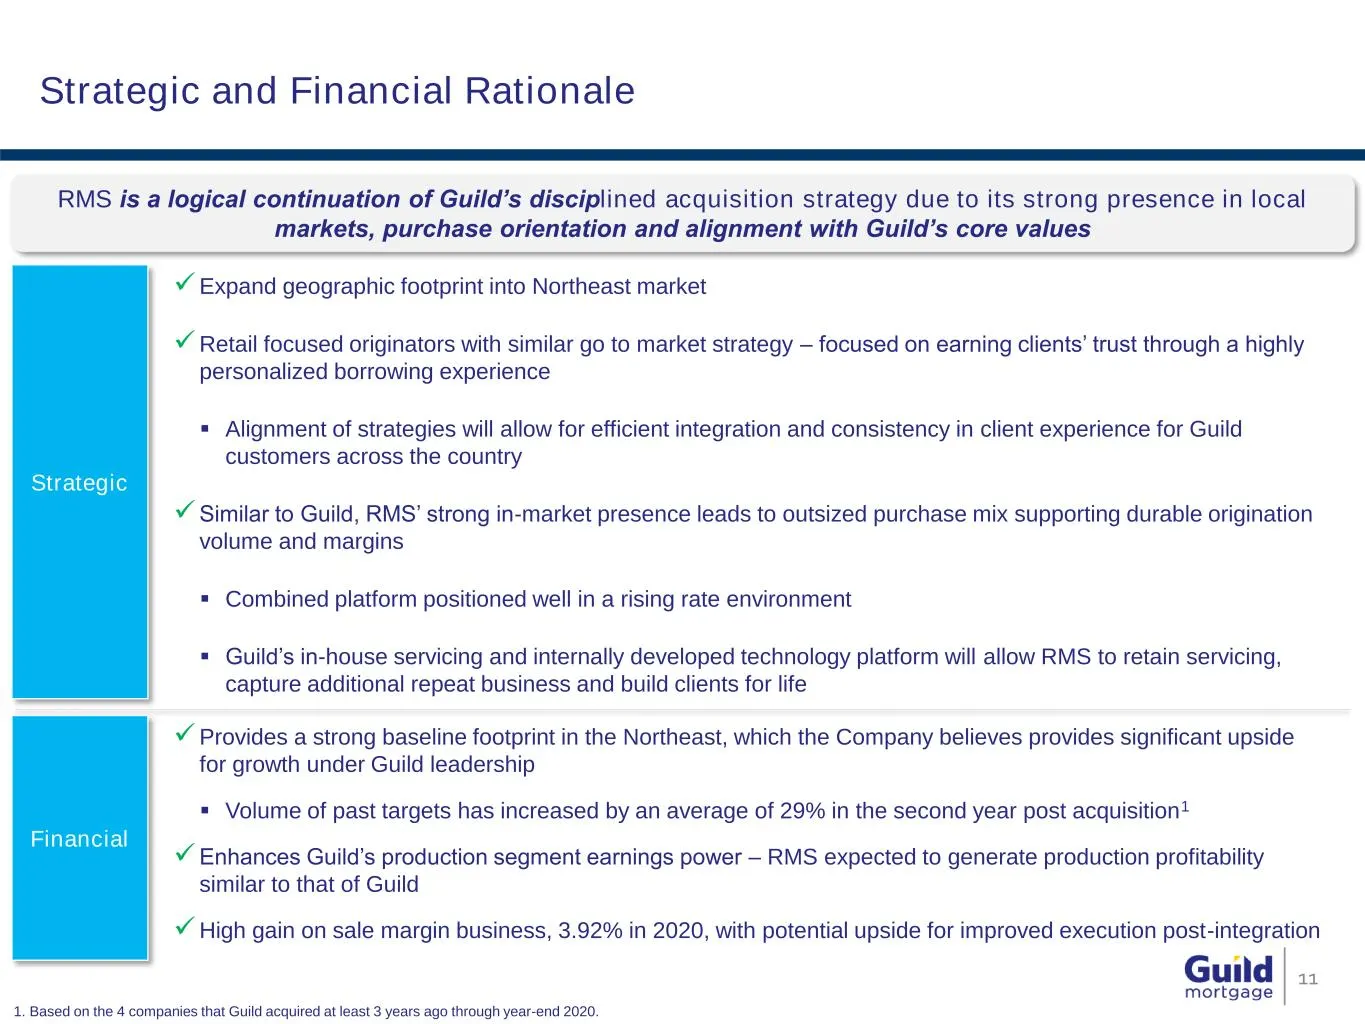
Slide 11: Strategic and Financial Rationale
Strategic and Financial Rationale 11 Financial Strategic Expand geographic footprint into Northeast market Retail focused originators with similar go to market strategy – focused on earning clients’ trust through a highly personalized borrowing experience Alignment of strategies will allow for e
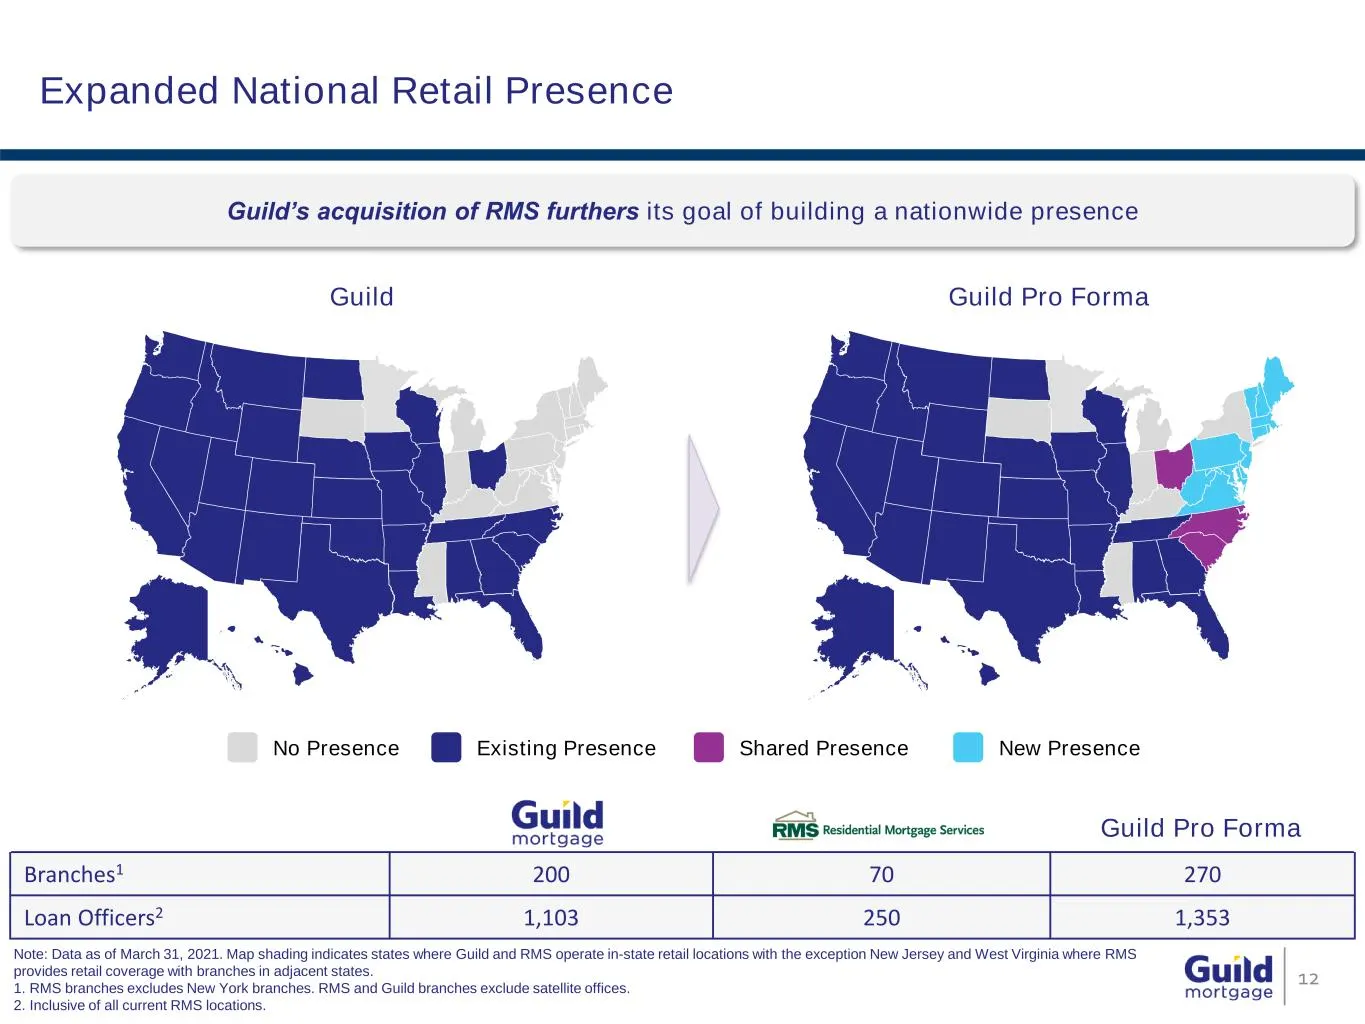
Slide 12: Expanded National Retail Presence
Expanded National Retail Presence Guild Guild Pro Forma 12 Note: Data as of March 31, 2021. Map shading indicates states where Guild and RMS operate in-state retail locations with the exception New Jersey and West Virginia where RMS provides retail coverage with branches in adjacent states. 1. RMS b
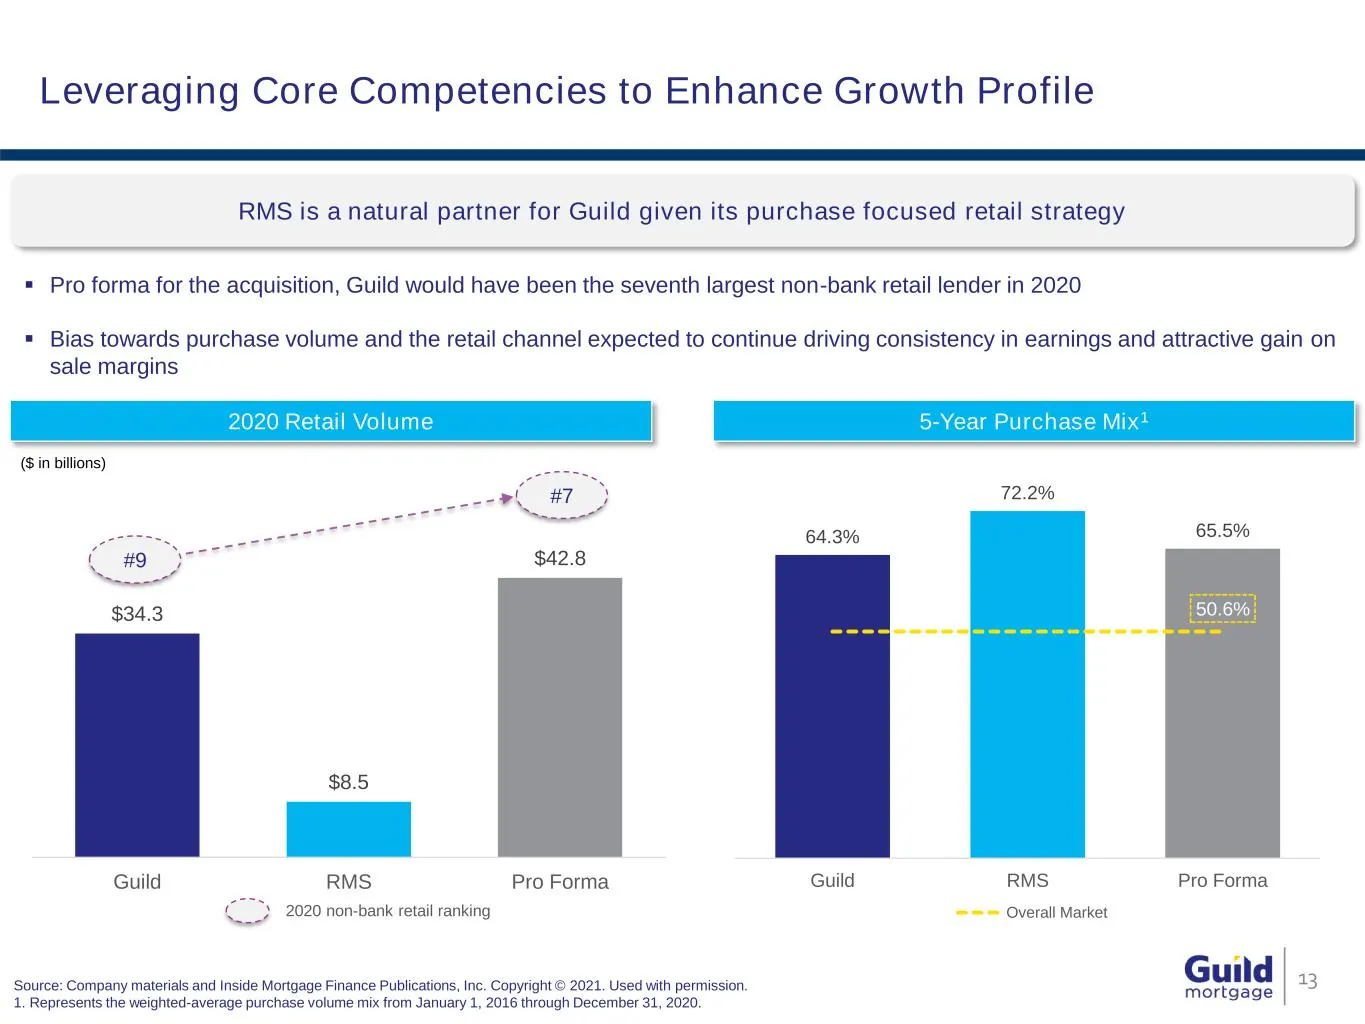
Slide 13: Leveraging Core Competencies to Enhance Growth Profile
Leveraging Core Competencies to Enhance Growth Profile 13Source: Company materials and Inside Mortgage Finance Publications, Inc. Copyright © 2021. Used with permission. 1. Represents the weighted-average purchase volume mix from January 1, 2016 through December 31, 2020. RMS is a natural partner fo
Slide 14: Proven and Disciplined Acquisition Strategy
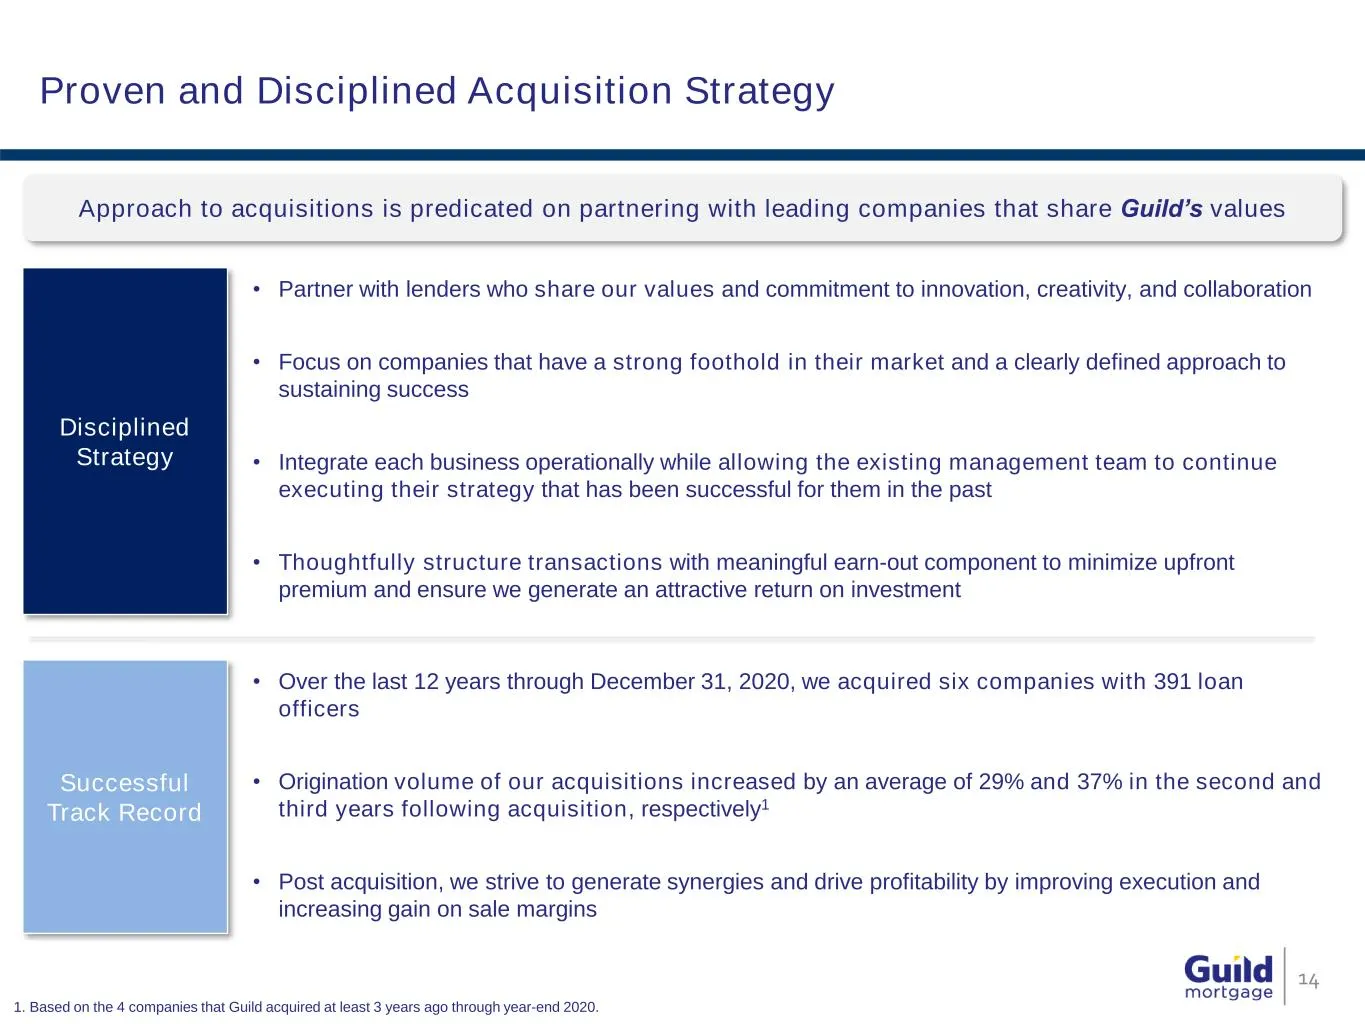
Proven and Disciplined Acquisition Strategy Approach to acquisitions is predicated on partnering with leading companies that share Guild’s values Disciplined Strategy Successful Track Record 14 • Partner with lenders who share our values and commitment to innovation, creativity, and collaboration •
Slide 15: Proven and Disciplined Acquisition Strategy (continued)
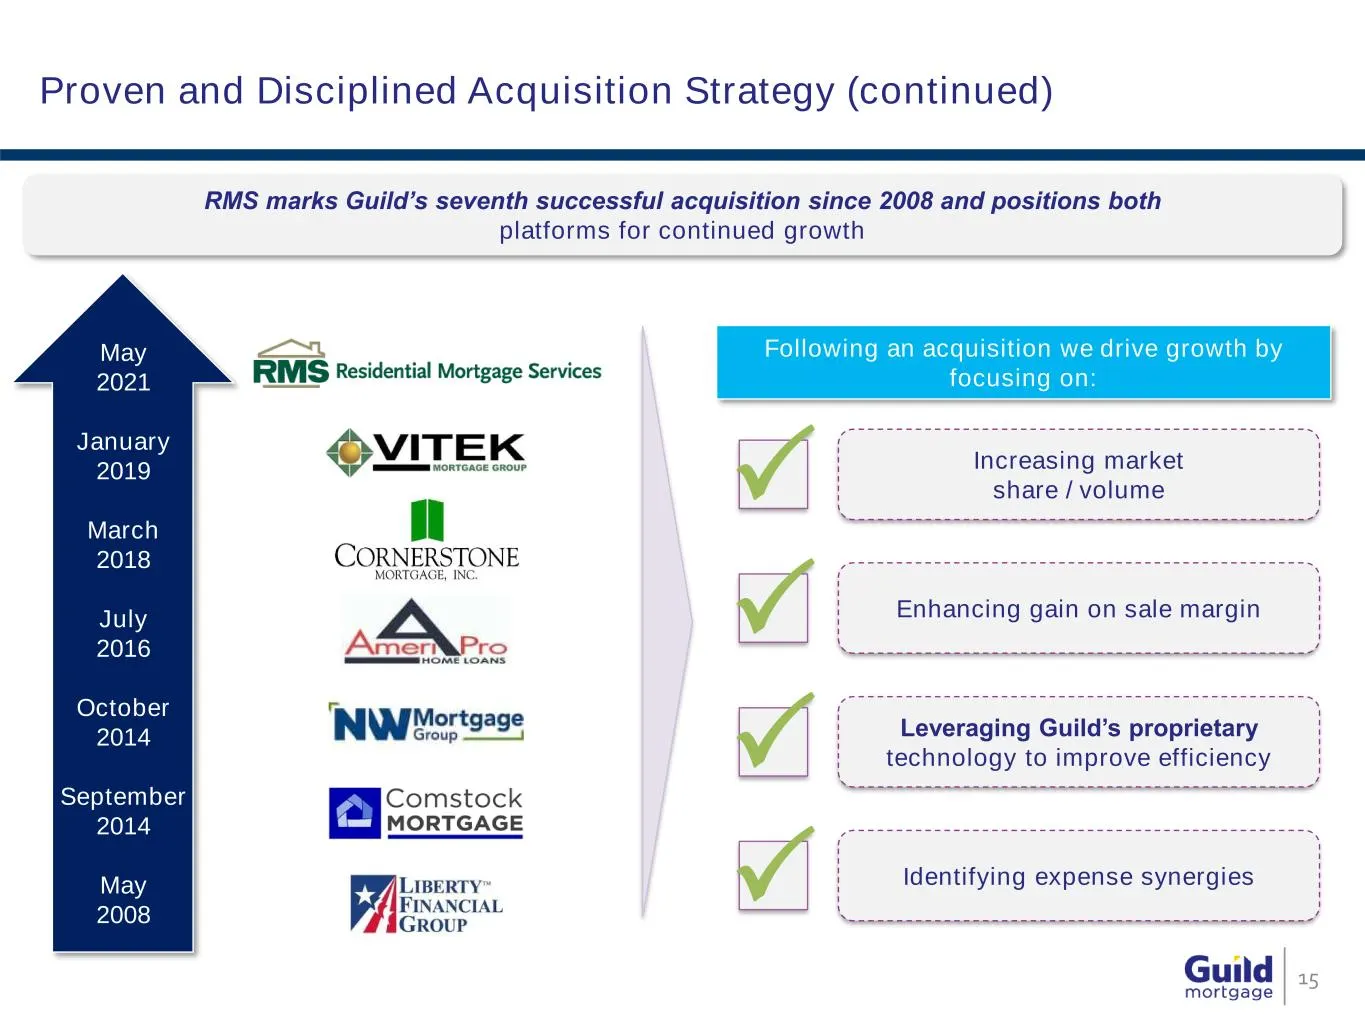
Proven and Disciplined Acquisition Strategy (continued) 15 Following an acquisition we drive growth by focusing on: Increasing market share / volume Enhancing gain on sale margin Leveraging Guild’s proprietary technology to improve efficiency Identifying expense synergies May 2021 January 20
Slide 16: Transaction Benefits for Guild Shareholders
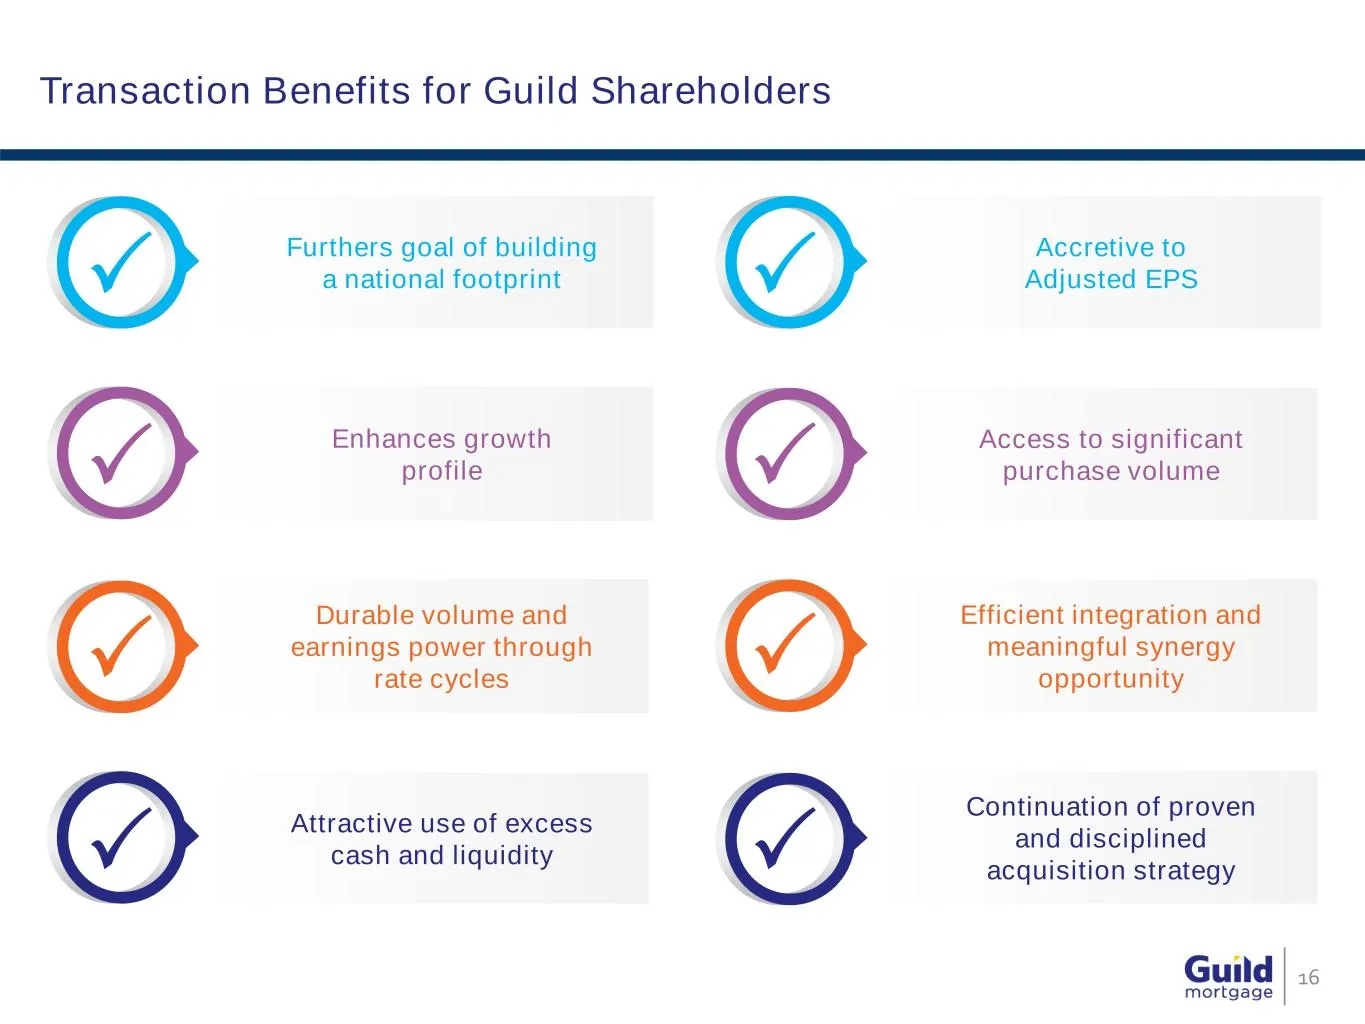
Transaction Benefits for Guild Shareholders 16 Furthers goal of building a national footprint Enhances growth profile Durable volume and earnings power through rate cycles Attractive use of excess cash and liquidity Accretive to Adjusted EPS Access to significant purchase volume Efficient integratio
Slide 17: Appendix — RMS Overview
Guild mortgage Appendix — RMS Overview
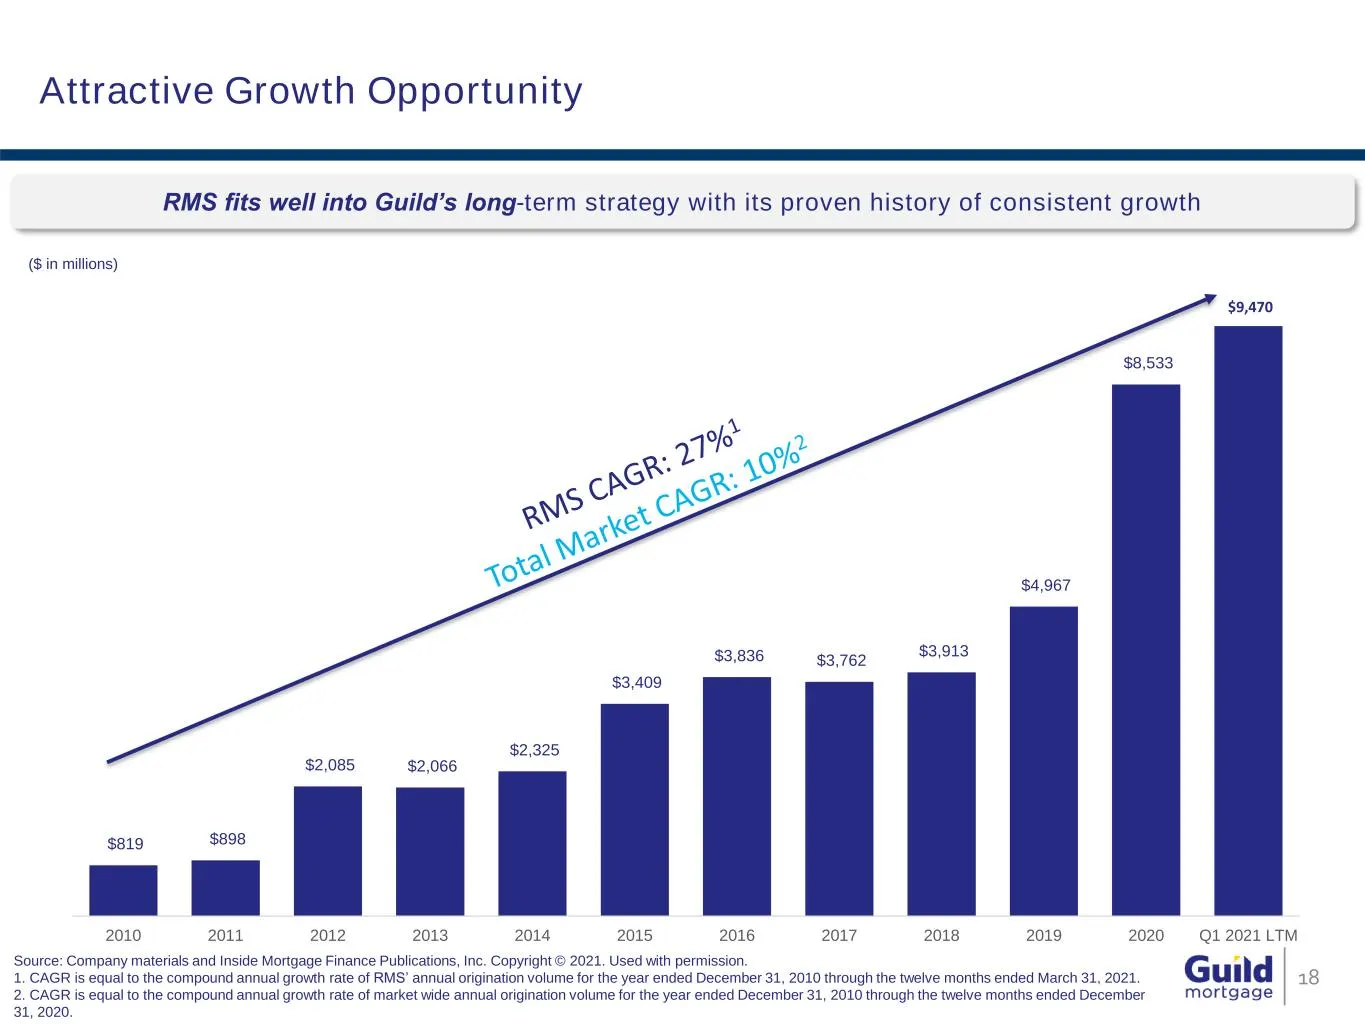
Slide 18: Attractive Growth Opportunity
$9,470 $819 $898 $2,085 $2,066 $2,325 $3,409 $3,836 $3,762 $3,913 $4,967 $8,533 2010 2011 2012 2013 2014 2015 2016 2017 2018 2019 2020 Q1 2021 LTM RMS fits well into Guild’s long-term strategy with its proven history of consistent growth Attractive Growth Opportunity 18 ($ in millions) Source: Compa
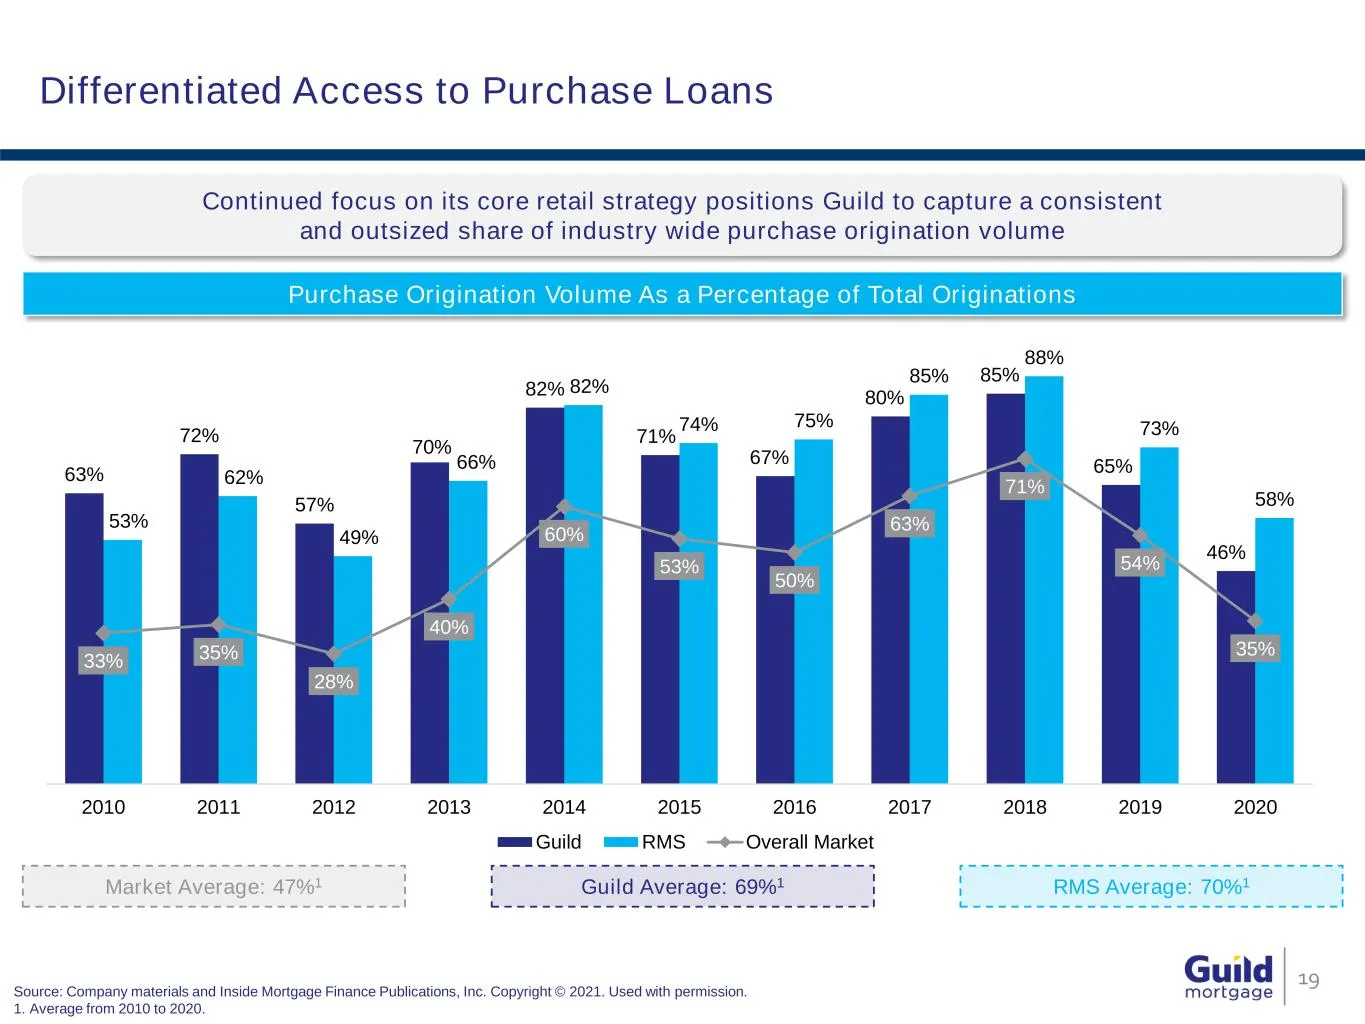
Slide 19: Differentiated Access to Purchase Loans
Differentiated Access to Purchase Loans 19 Continued focus on its core retail strategy positions Guild to capture a consistent and outsized share of industry wide purchase origination volume Purchase Origination Volume As a Percentage of Total Originations Market Average: 47%1 Guild Average: 69%1 63
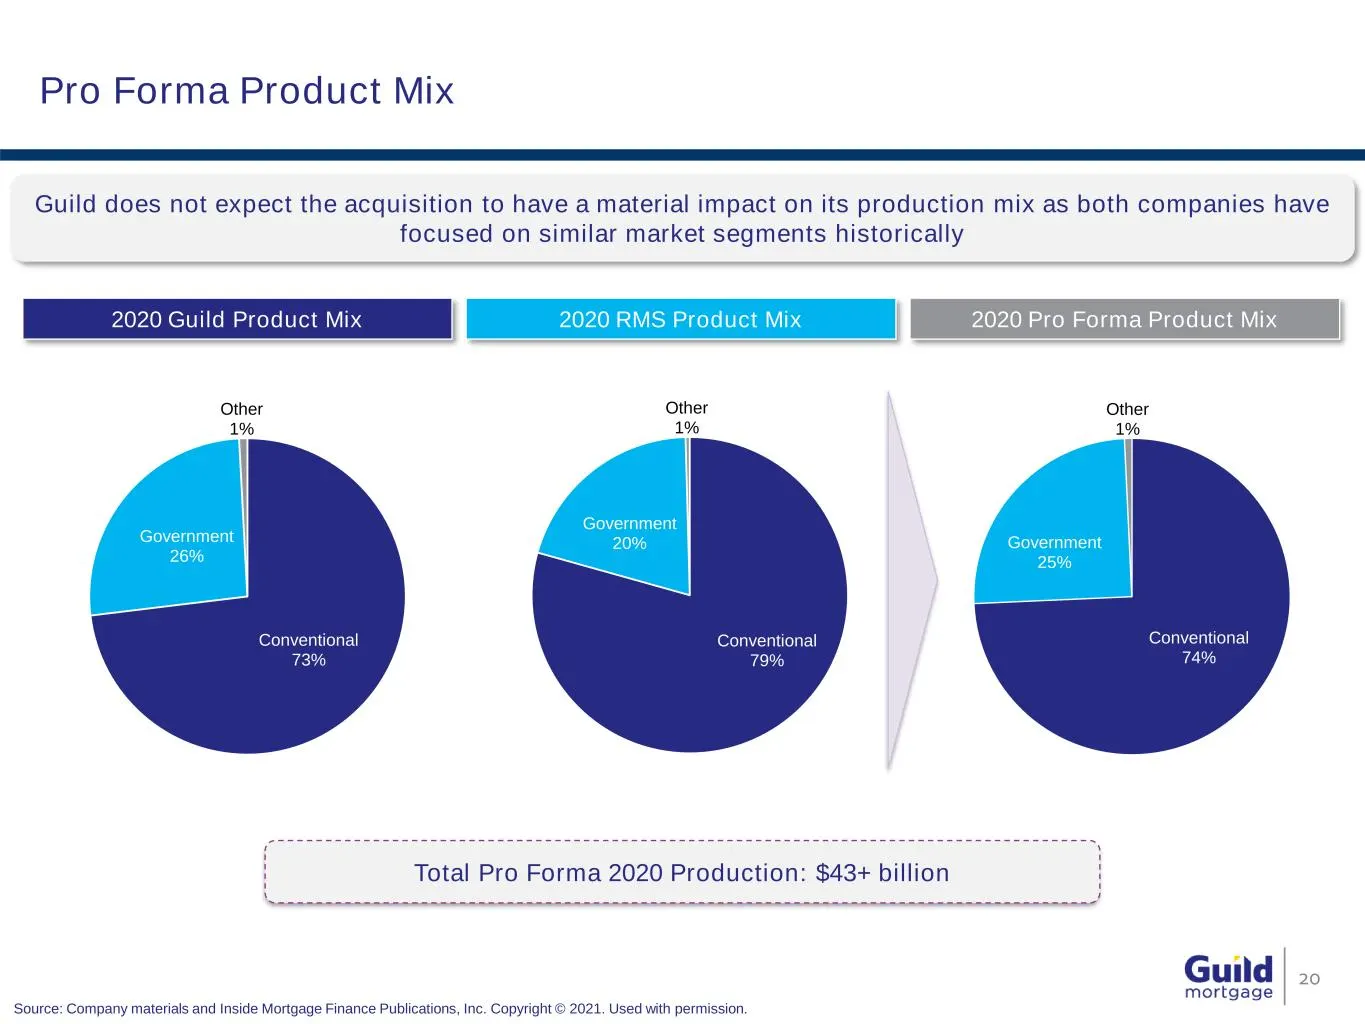
Slide 20: Pro Forma Product Mix
Conventional 73% Government 26% Other 1% Conventional 79% Government 20% Other 1% Conventional 74% Government 25% Other 1% Pro Forma Product Mix 20 2020 Guild Product Mix 2020 RMS Product Mix Total Pro Forma 2020 Production: $43+ billion Guild does not expect the acquisition to have a material impac
Slide 21: Appendix – Q1 2021 Financials
Appendix – Q1 2021 Financials 21
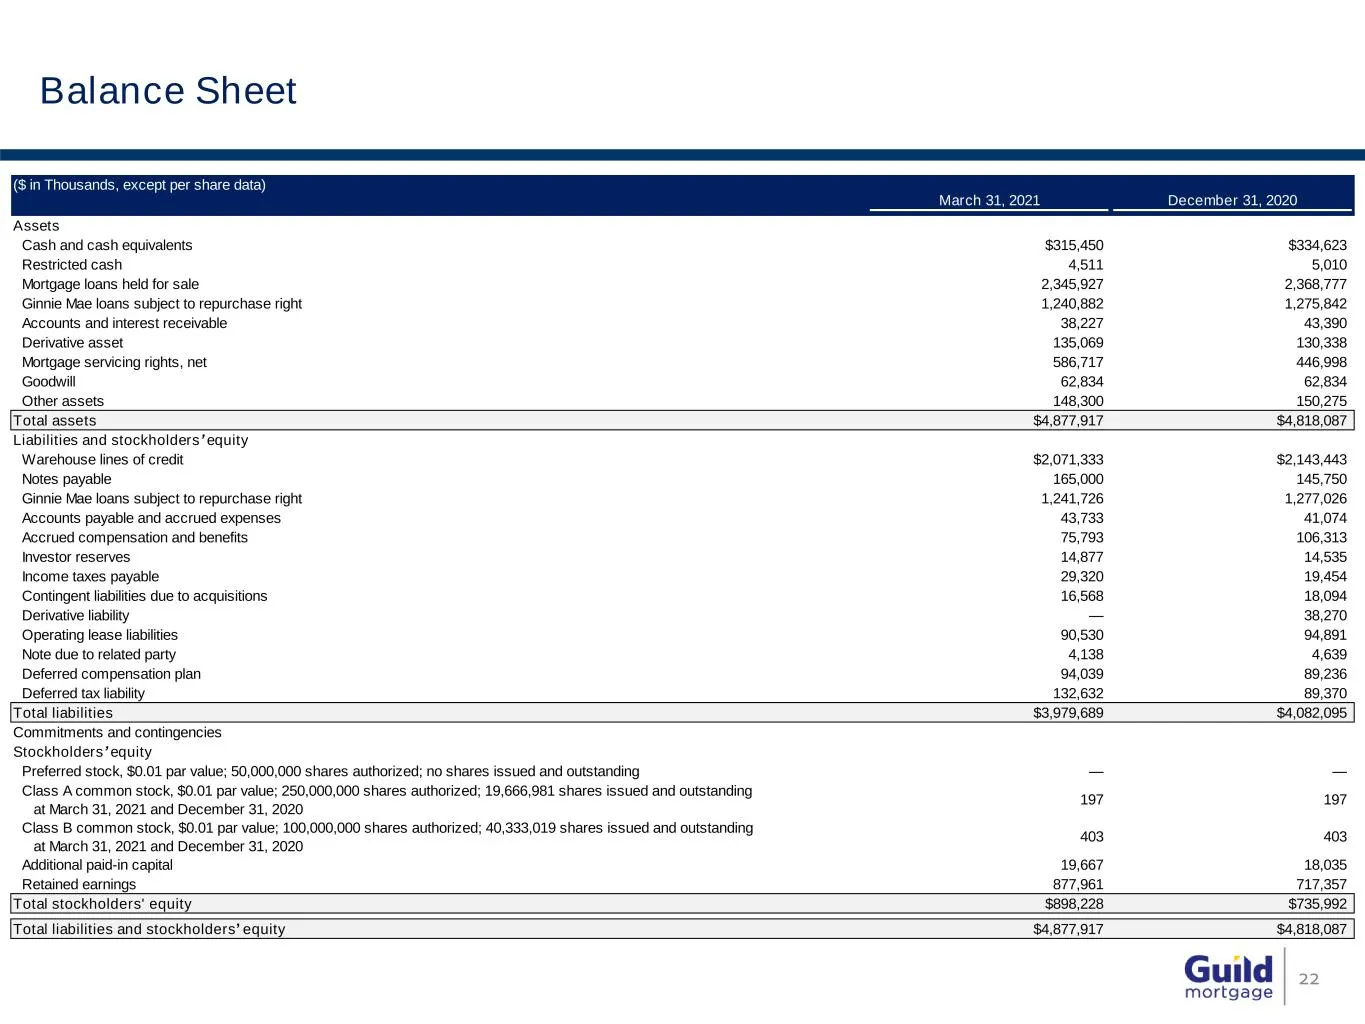
Slide 22: Balance Sheet
Balance Sheet 22 ($ in Thousands, except per share data) March 31, 2021 December 31, 2020 Assets Cash and cash equivalents $315,450 $334,623 Restricted cash 4,511 5,010 Mortgage loans held for sale 2,345,927 2,368,777 Ginnie Mae loans subject to repurchase right 1,240,882 1,275,842 Accounts and inte
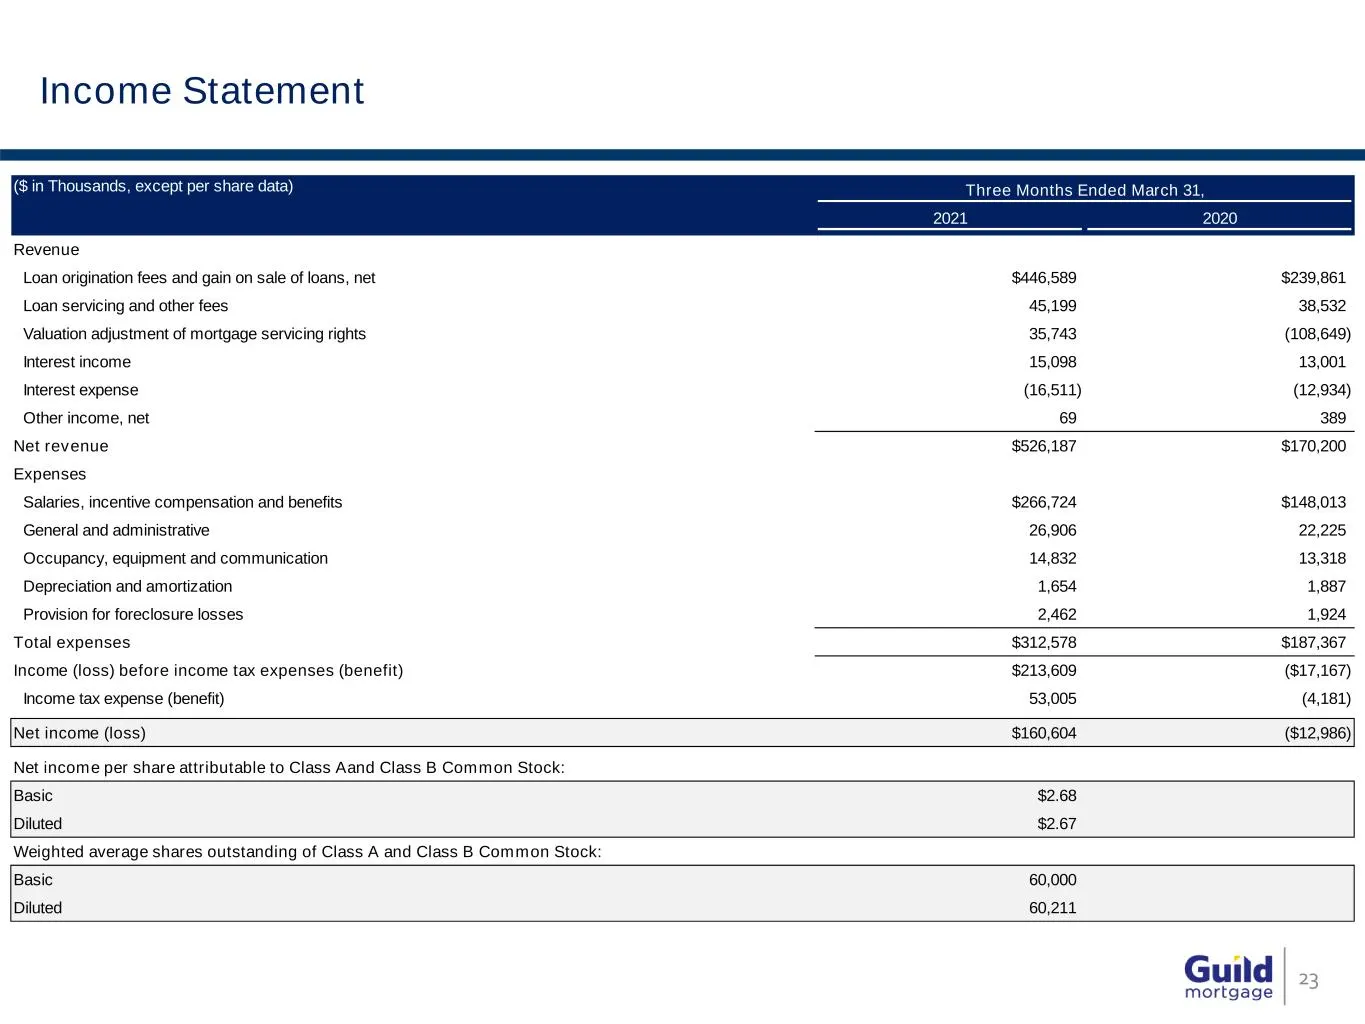
Slide 23: Income Statement
Income Statement 23 ($ in Thousands, except per share data) Three Months Ended March 31, 2021 2020 Revenue Loan origination fees and gain on sale of loans, net $446,589 $239,861 Loan servicing and other fees 45,199 38,532 Valuation adjustment of mortgage servicing rights 35,743 (108,649) Interest in
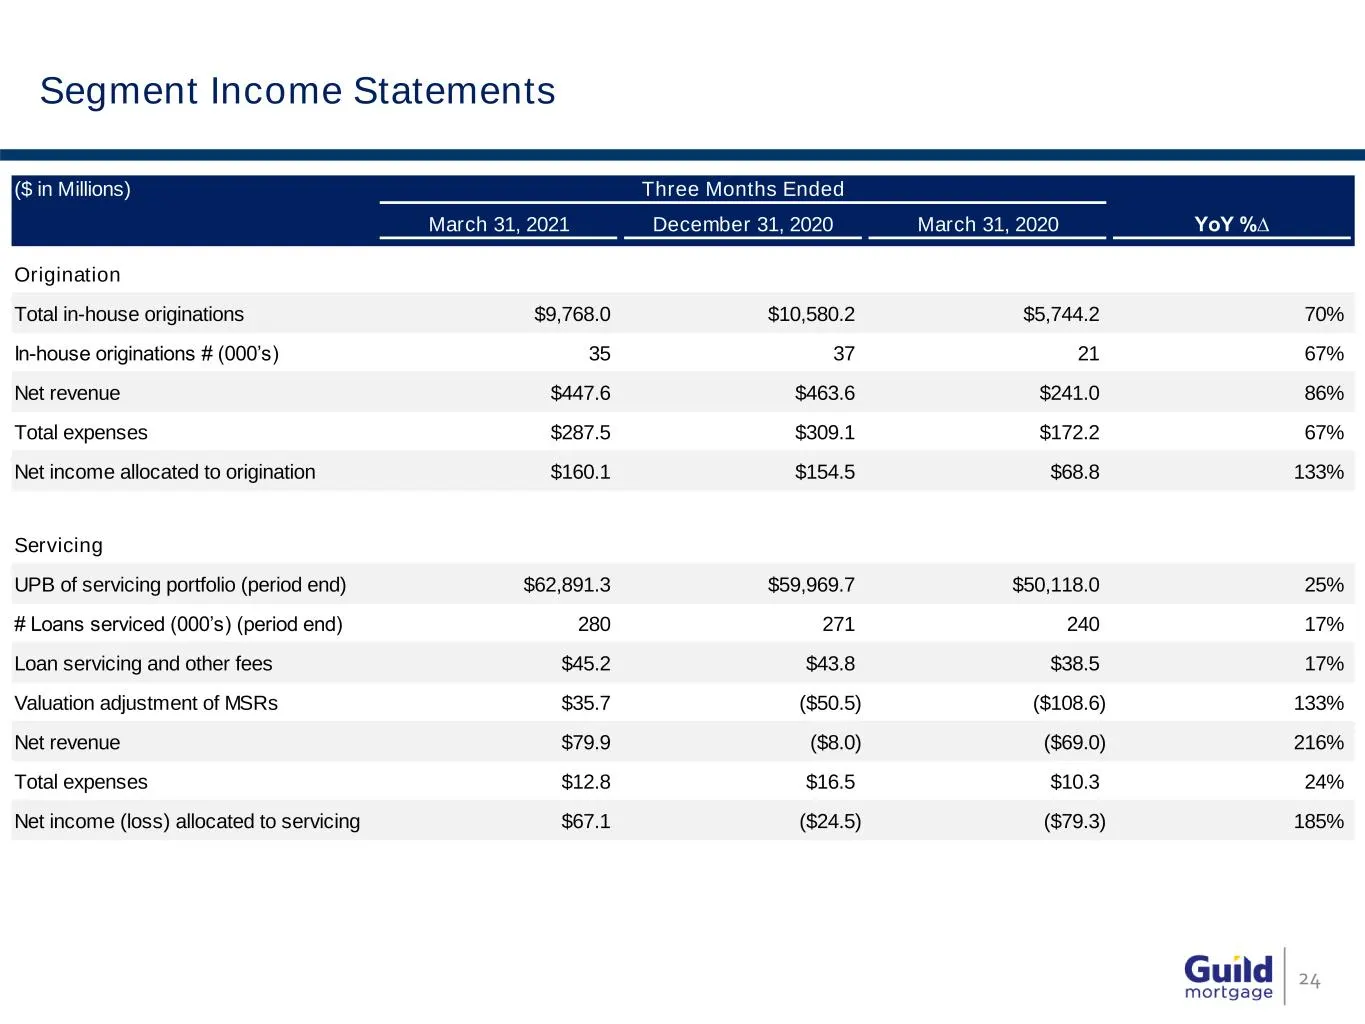
Slide 24: Segment Income Statements
Segment Income Statements 24 ($ in Millions) Three Months Ended March 31, 2021 December 31, 2020 March 31, 2020 YoY %∆ Origination Total in-house originations $9,768.0 $10,580.2 $5,744.2 70% In-house originations # (000’s) 35 37 21 67% Net revenue $447.6 $463.6 $241.0 86% Total expenses $287.5 $309.
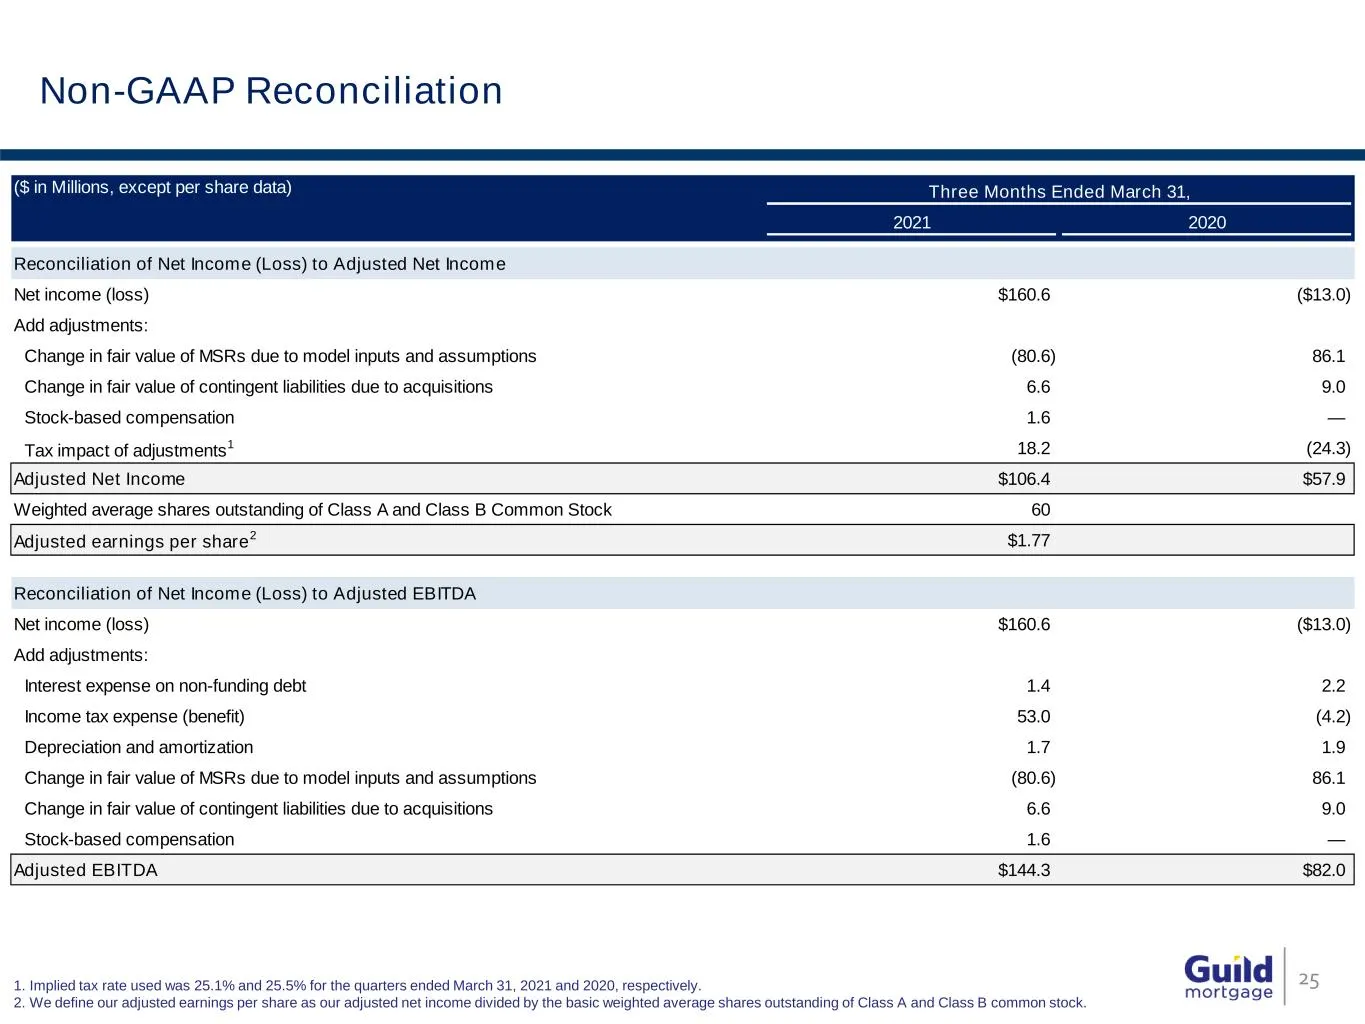
Slide 25: Non-GAAP Reconciliation
Non-GAAP Reconciliation 251. Implied tax rate used was 25.1% and 25.5% for the quarters ended March 31, 2021 and 2020, respectively. 2. We define our adjusted earnings per share as our adjusted net income divided by the basic weighted average shares outstanding of Class A and Class B common stock. (

Slide 26: Guild Mortgage – Own What Matters
Guild mortgage OWN WHAT MATTERS
Source: SEC EDGAR · 8-K filed May 11, 2021