Quadient SA · EURONEXT:QDT
Quadient SA — H1 2020 Earnings Presentation
46 slides from Quadient SA's earnings presentation, Sep 28, 2020

Slide 1: 2020 First Half Results
2020 First Half Results 28 September 2020
Slide 2: Disclaimer
Disclaimer FORWARD-LOOKING STATEMENT This presentation contains forward-looking statements (made pursuant to the safe harbour provisions of the Private Securities Litigation Reform Act of 1995), which, by their nature, involve a degree of risk and uncertainty. Forward-looking statements represent th
Slide 3: Agenda
Agenda 1 H1 2020 highlights 4 Business update 2 H1 2020 operational review 5 Outlook 3 H1 2020 financial review 6 Appendices 3
Slide 4: H1 2020 Highlights
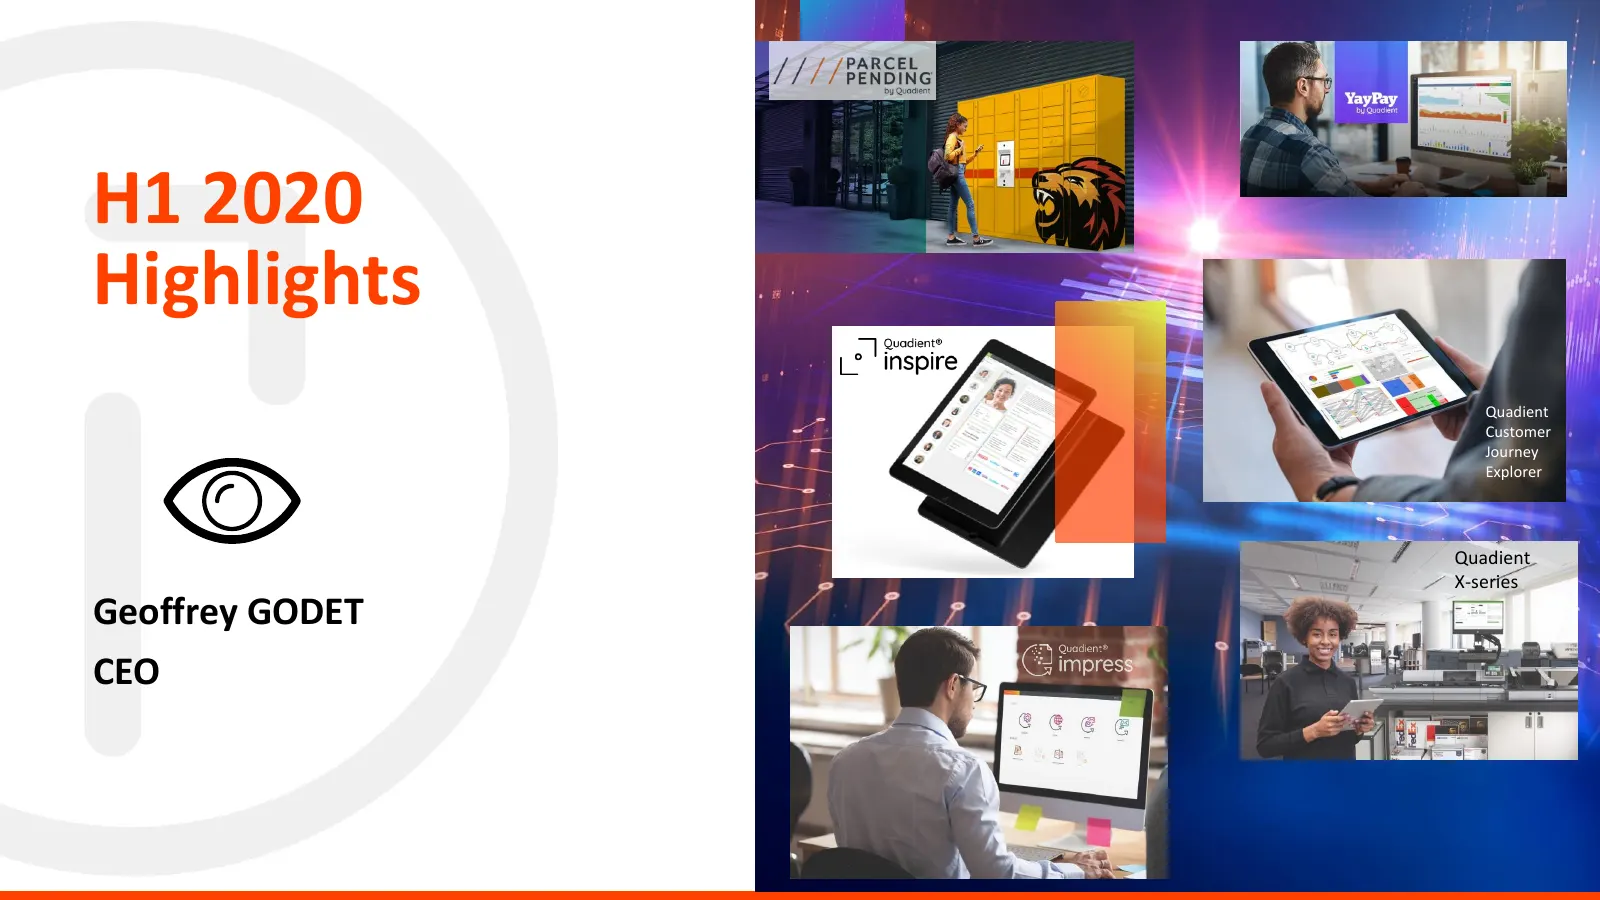
H1 2020 Highlights Quadient Customer Journey Explorer Quadient X-series Geoffrey GODET CEO 4
Slide 5: Relentless execution of our strategy in a challenging environment
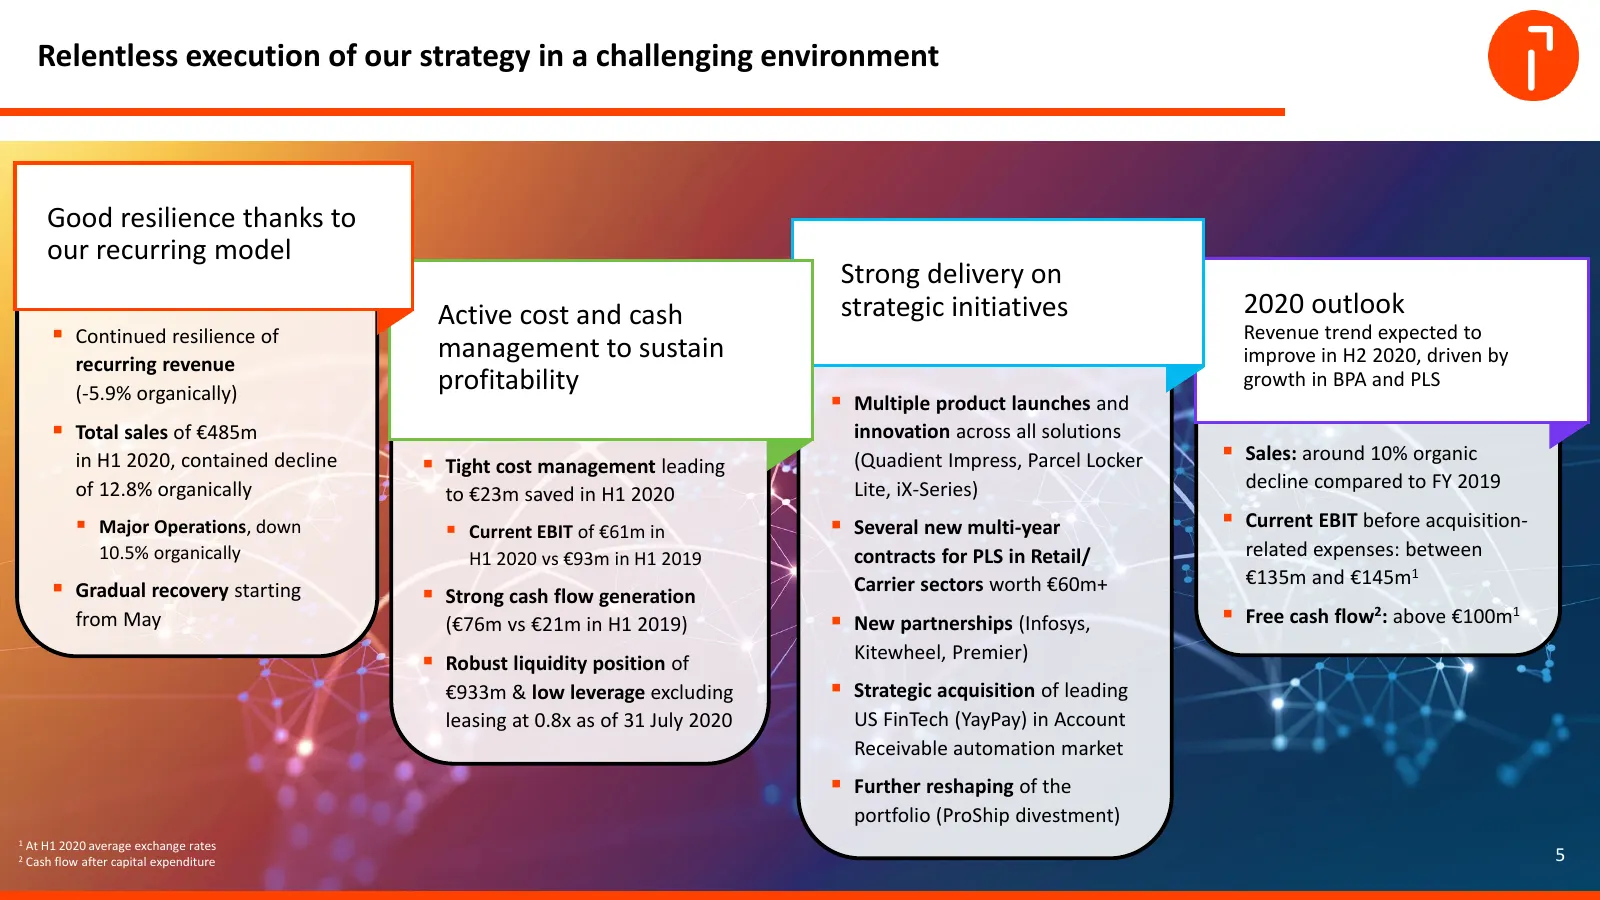
Relentless execution of our strategy in a challenging environment Good resilience thanks to our recurring model Strong delivery on Active cost and cash strategic initiatives 2020 outlook Continued resilience of Revenue trend expected to recurring revenue management to sustain improve in H2 2020, d
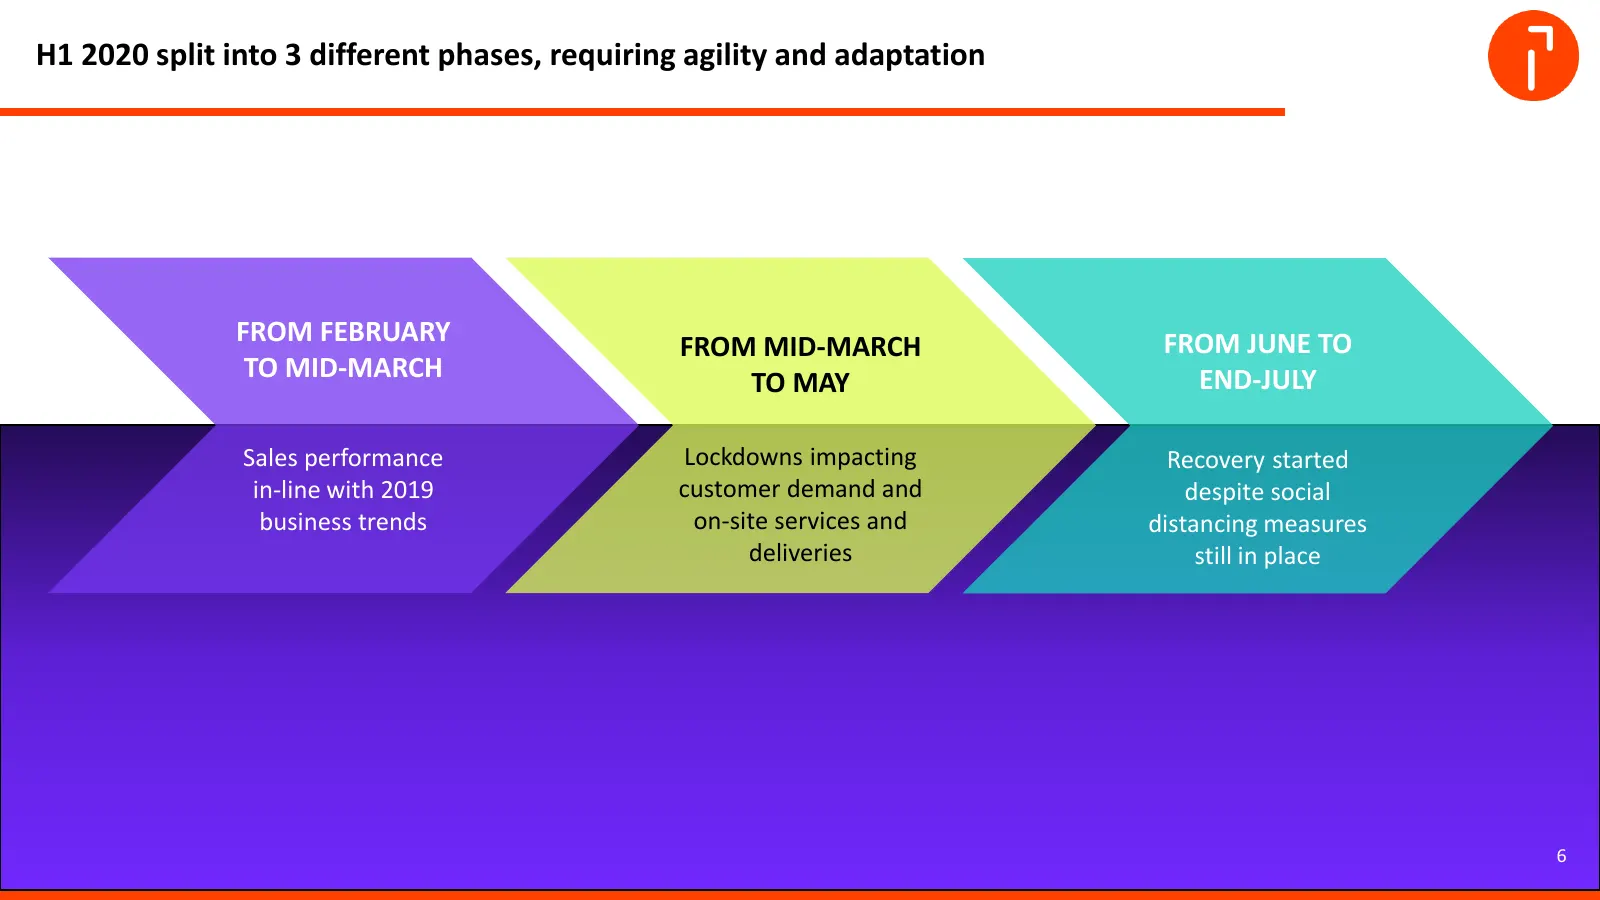
Slide 6: H1 2020 split into 3 different phases, requiring agility and adaptation
H1 2020 split into 3 different phases, requiring agility and adaptation FROM FEBRUARY FROM JUNE TO FROM MID-MARCH TO MID-MARCH END-JULY TO MAY Sales performance Lockdowns impacting Recovery started in-line with 2019 customer demand and despite social business trends on-site services and distancing m
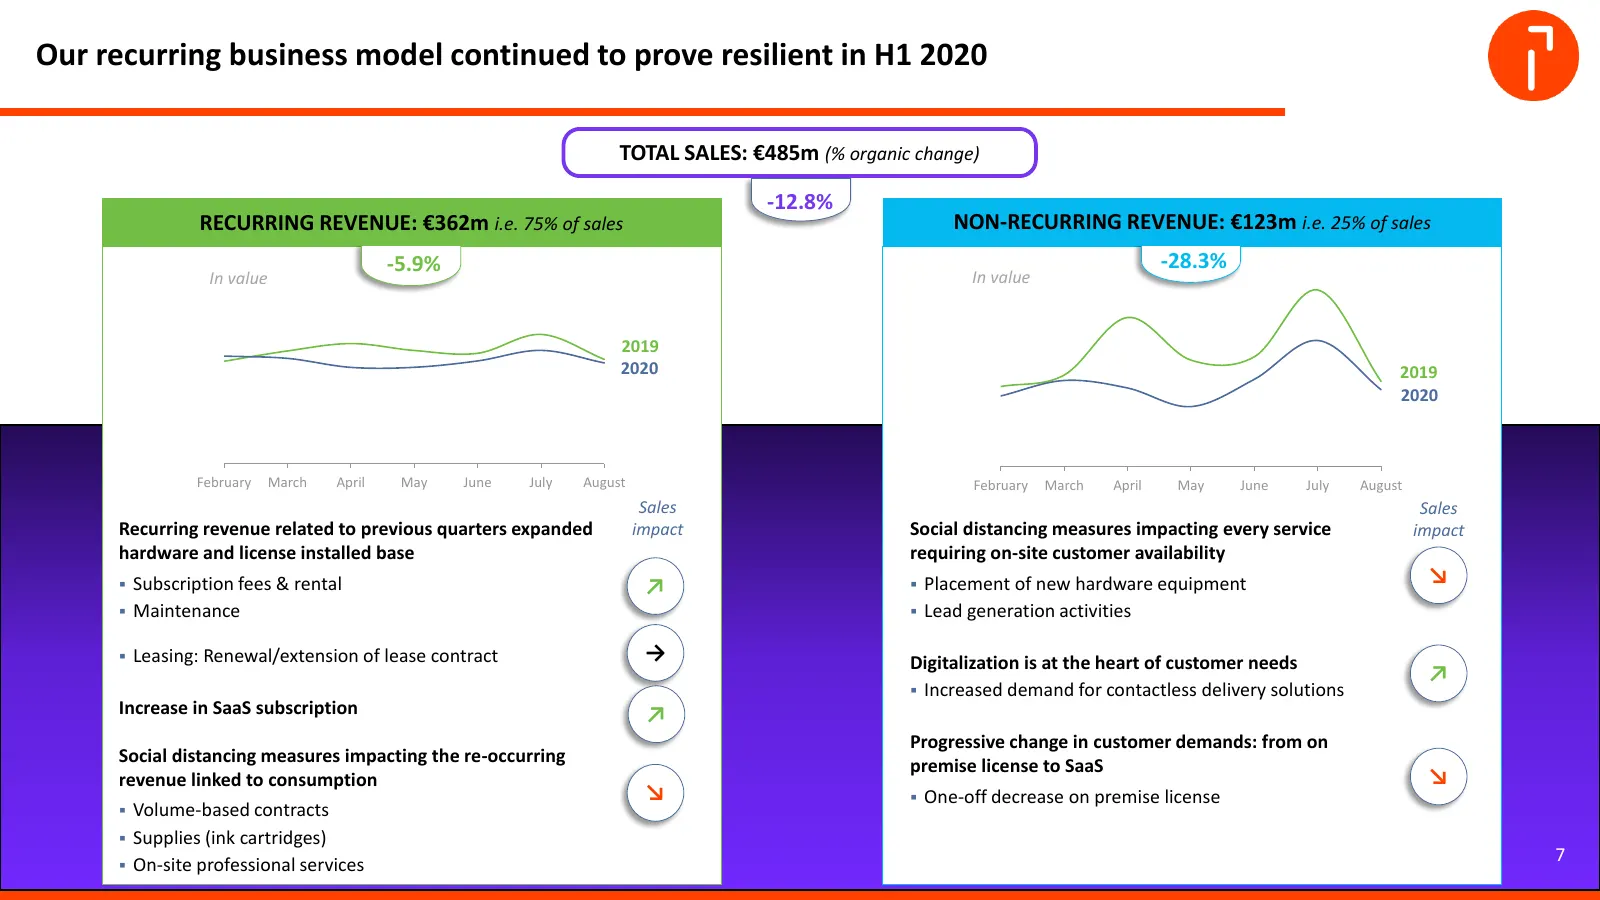
Slide 7: Our recurring business model continued to prove resilient in H1 2020
Our recurring business model continued to prove resilient in H1 2020 TOTAL SALES: €485m (% organic change) -12.8% RECURRING REVENUE: €362m i.e. 75% of sales NON-RECURRING REVENUE: €123m i.e. 25% of sales -5.9% -28.3% In value In value 2019 2020 2019 2020 February March April May June July August Feb

Slide 8: H1 2020 Operational Review
H1 2020 Operational Review Geoffrey GODET CEO 8
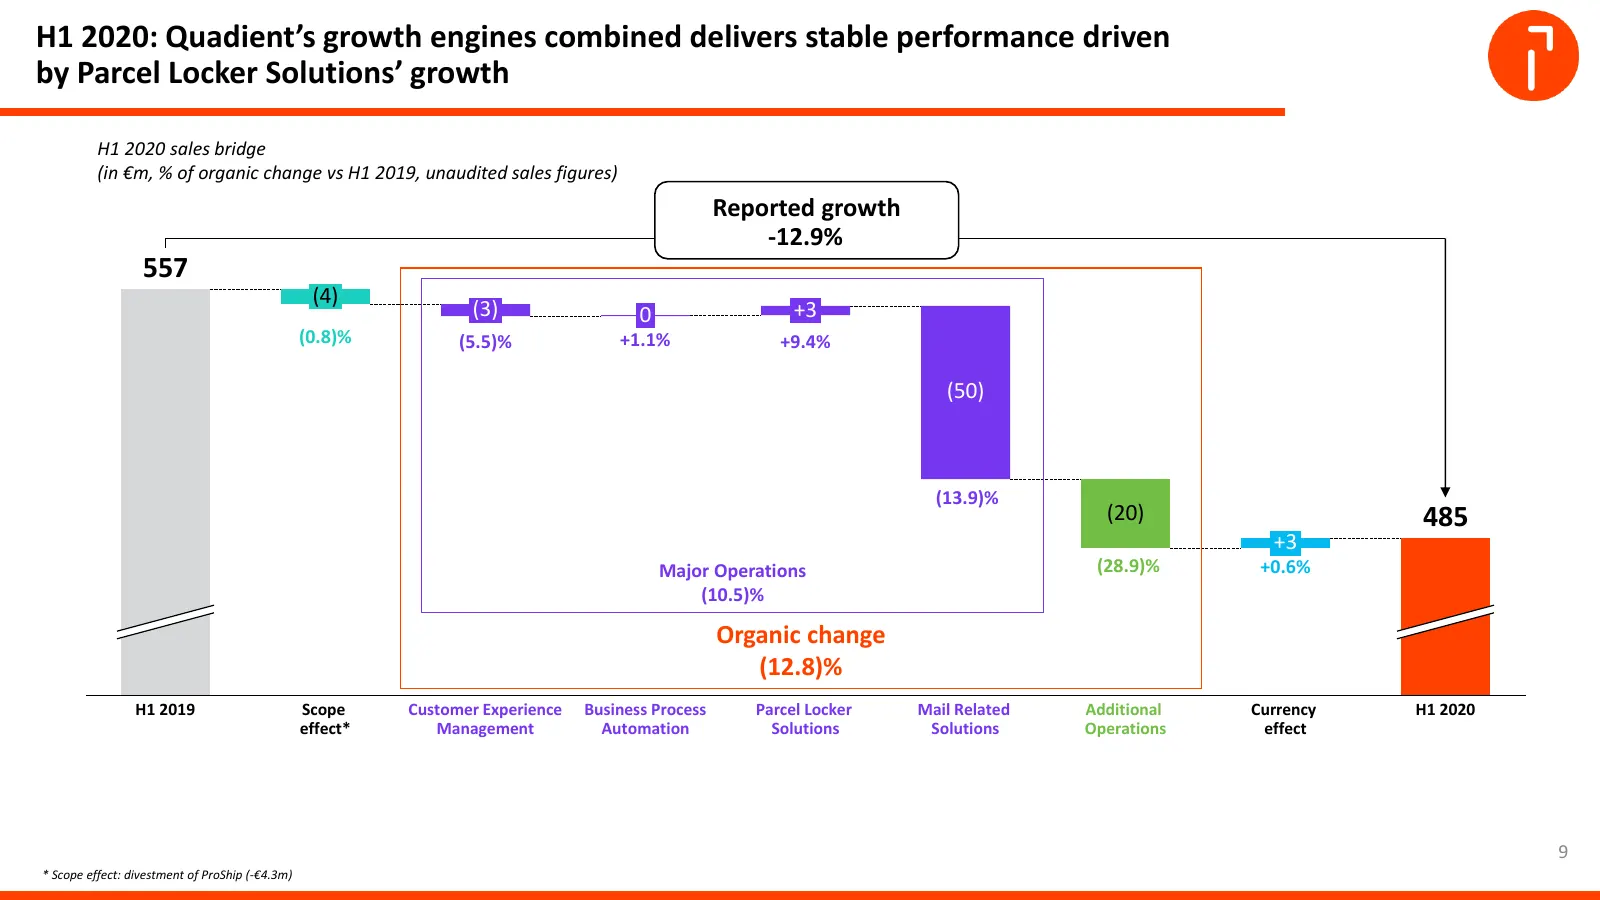
Slide 9: H1 2020 sales bridge by growth engine
H1 2020: Quadient’s growth engines combined delivers stable performance driven by Parcel Locker Solutions’ growth H1 2020 sales bridge (in €m, % of organic change vs H1 2019, unaudited sales figures) Reported growth -12.9% 557 (4) (3) 0 +3 (0.8)% (5.5)% +1.1% +9.4% (50) (13.9)% (20) 485 +3 Major Ope
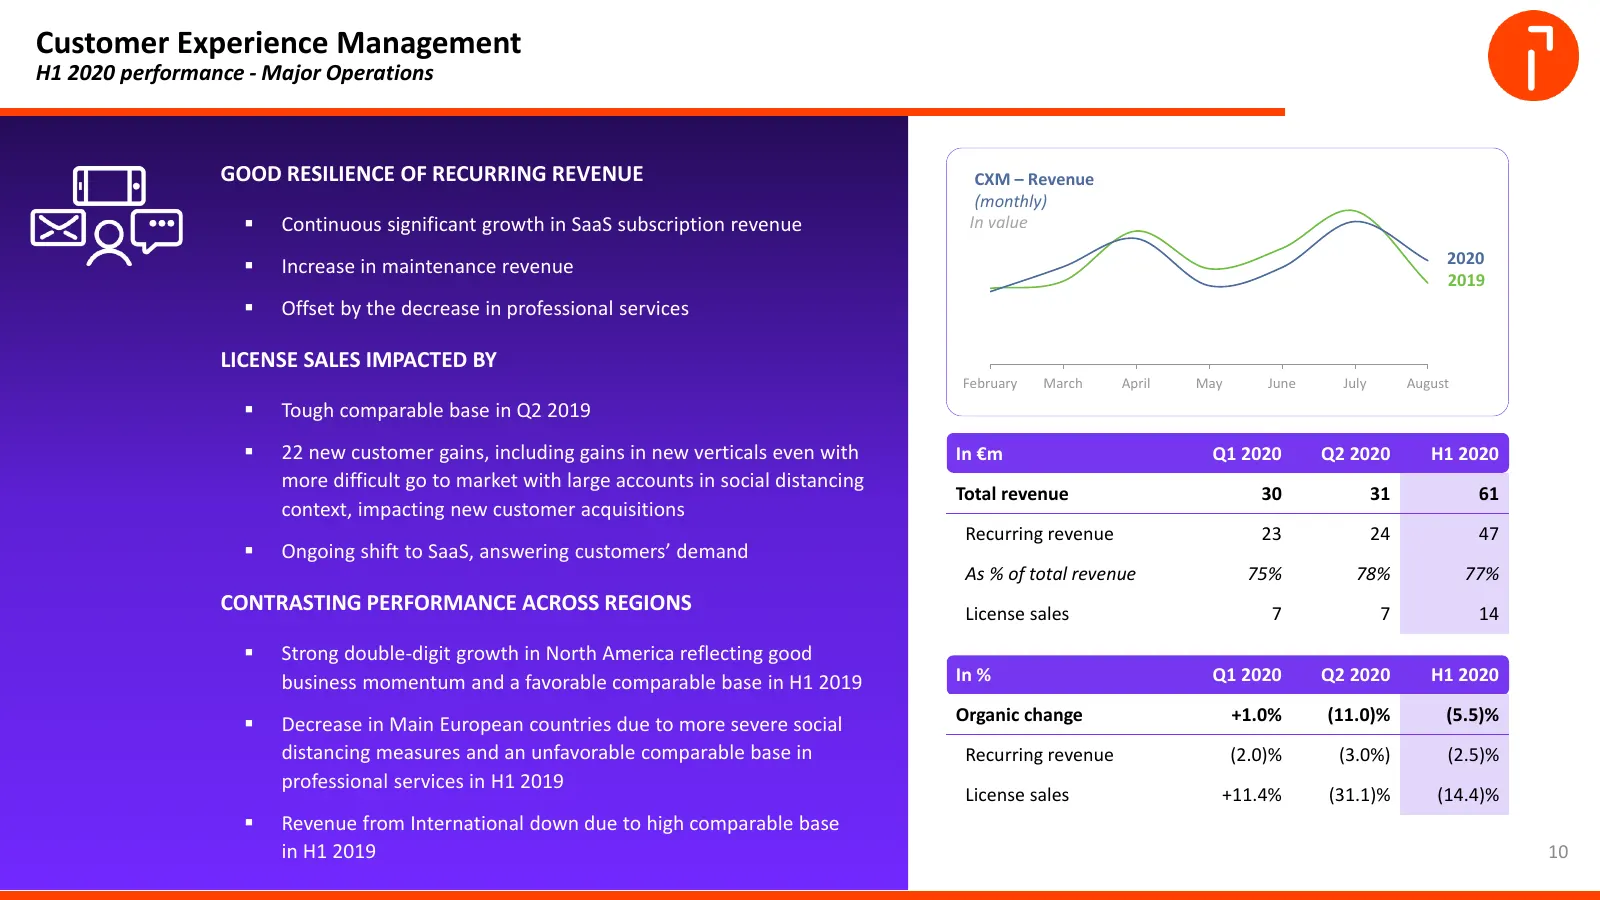
Slide 10: Customer Experience Management
Customer Experience Management H1 2020 performance - Major Operations GOOD RESILIENCE OF RECURRING REVENUE CXM – Revenue (monthly) Continuous significant growth in SaaS subscription revenue In value Increase in maintenance revenue 2020 2019 Offset by the decrease in professional services LICEN
Slide 11: Business Process Automation
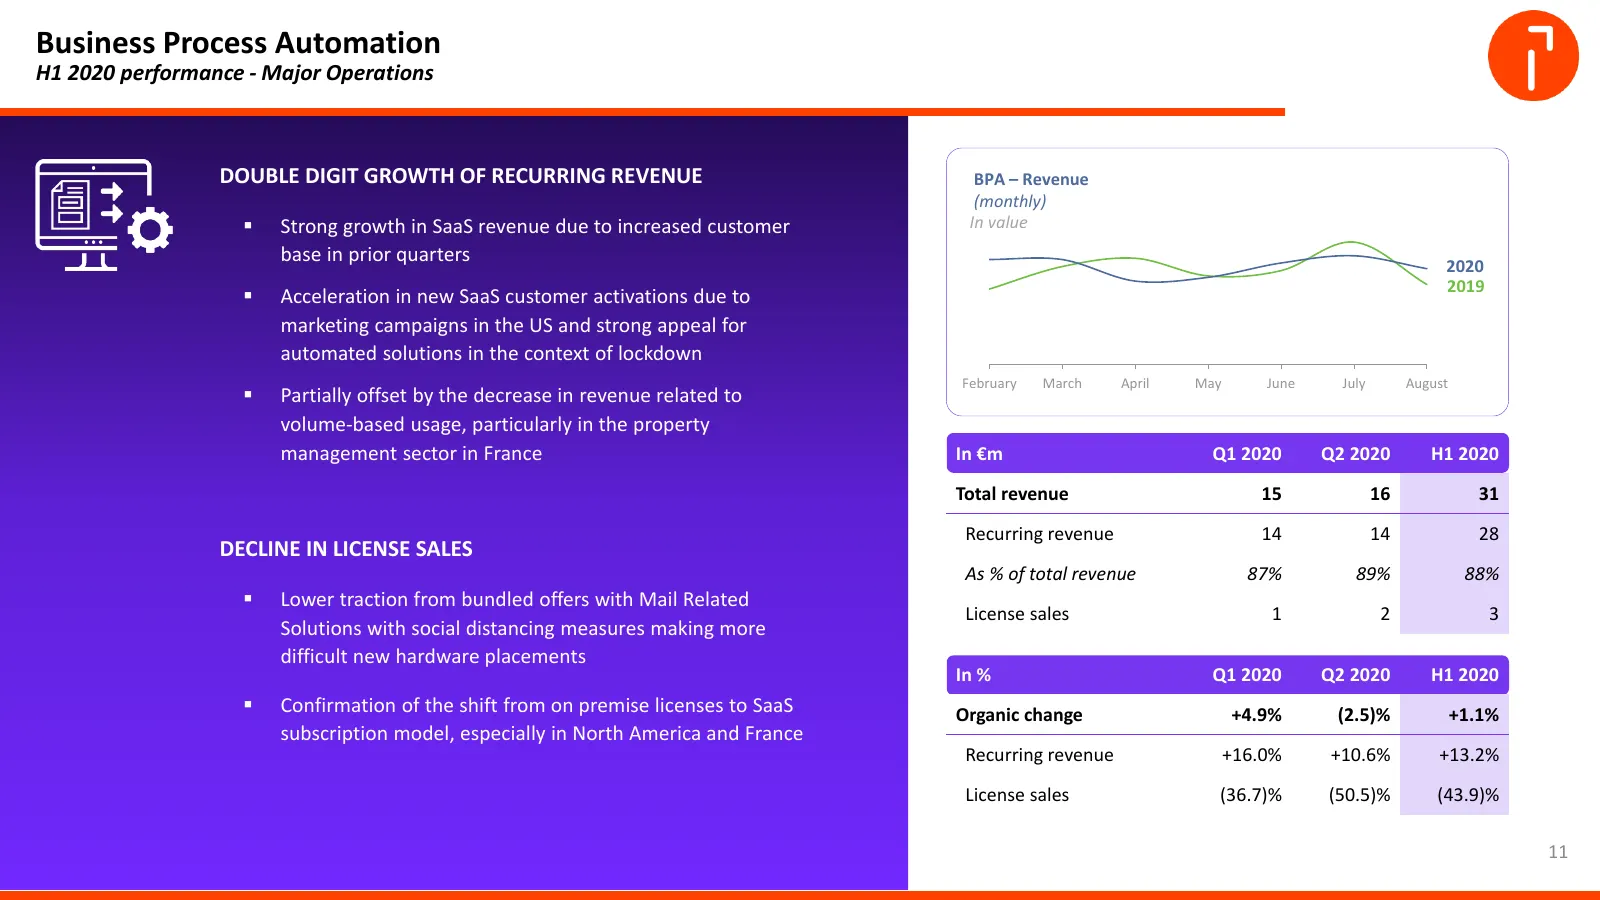
Business Process Automation H1 2020 performance - Major Operations DOUBLE DIGIT GROWTH OF RECURRING REVENUE BPA – Revenue (monthly) Strong growth in SaaS revenue due to increased customer In value base in prior quarters 2020 2019 Acceleration in new SaaS customer activations due to marketing cam
Slide 12: Parcel Locker Solutions
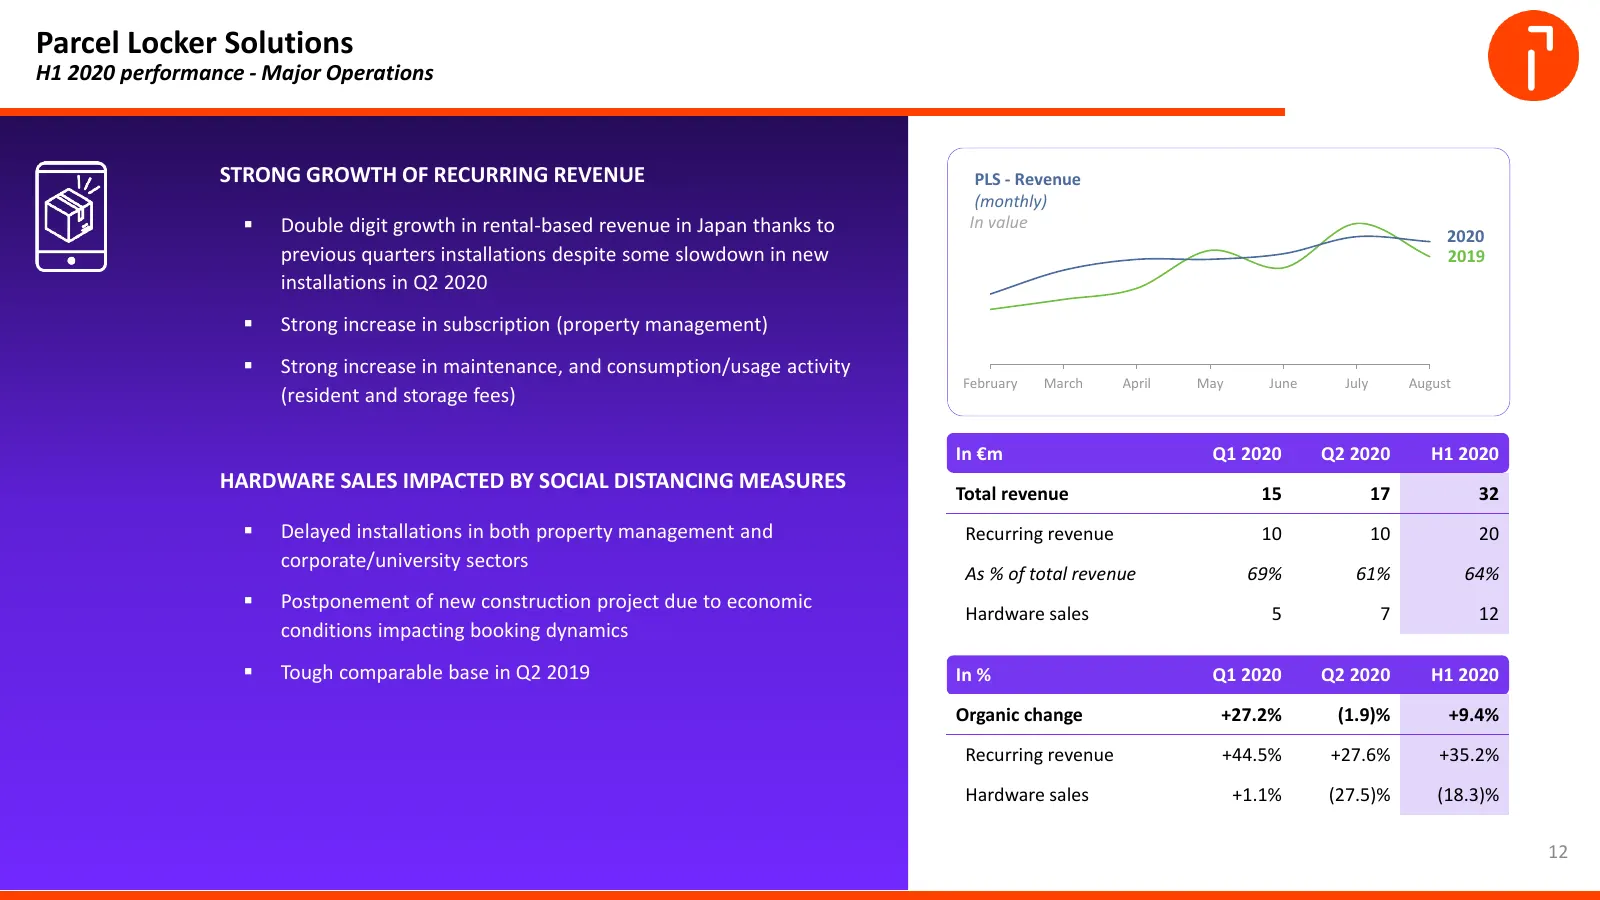
Parcel Locker Solutions H1 2020 performance - Major Operations STRONG GROWTH OF RECURRING REVENUE PLS - Revenue (monthly) Double digit growth in rental-based revenue in Japan thanks to In value 2020 previous quarters installations despite some slowdown in new 2019 installations in Q2 2020 Strong
Slide 13: Mail-Related Solutions
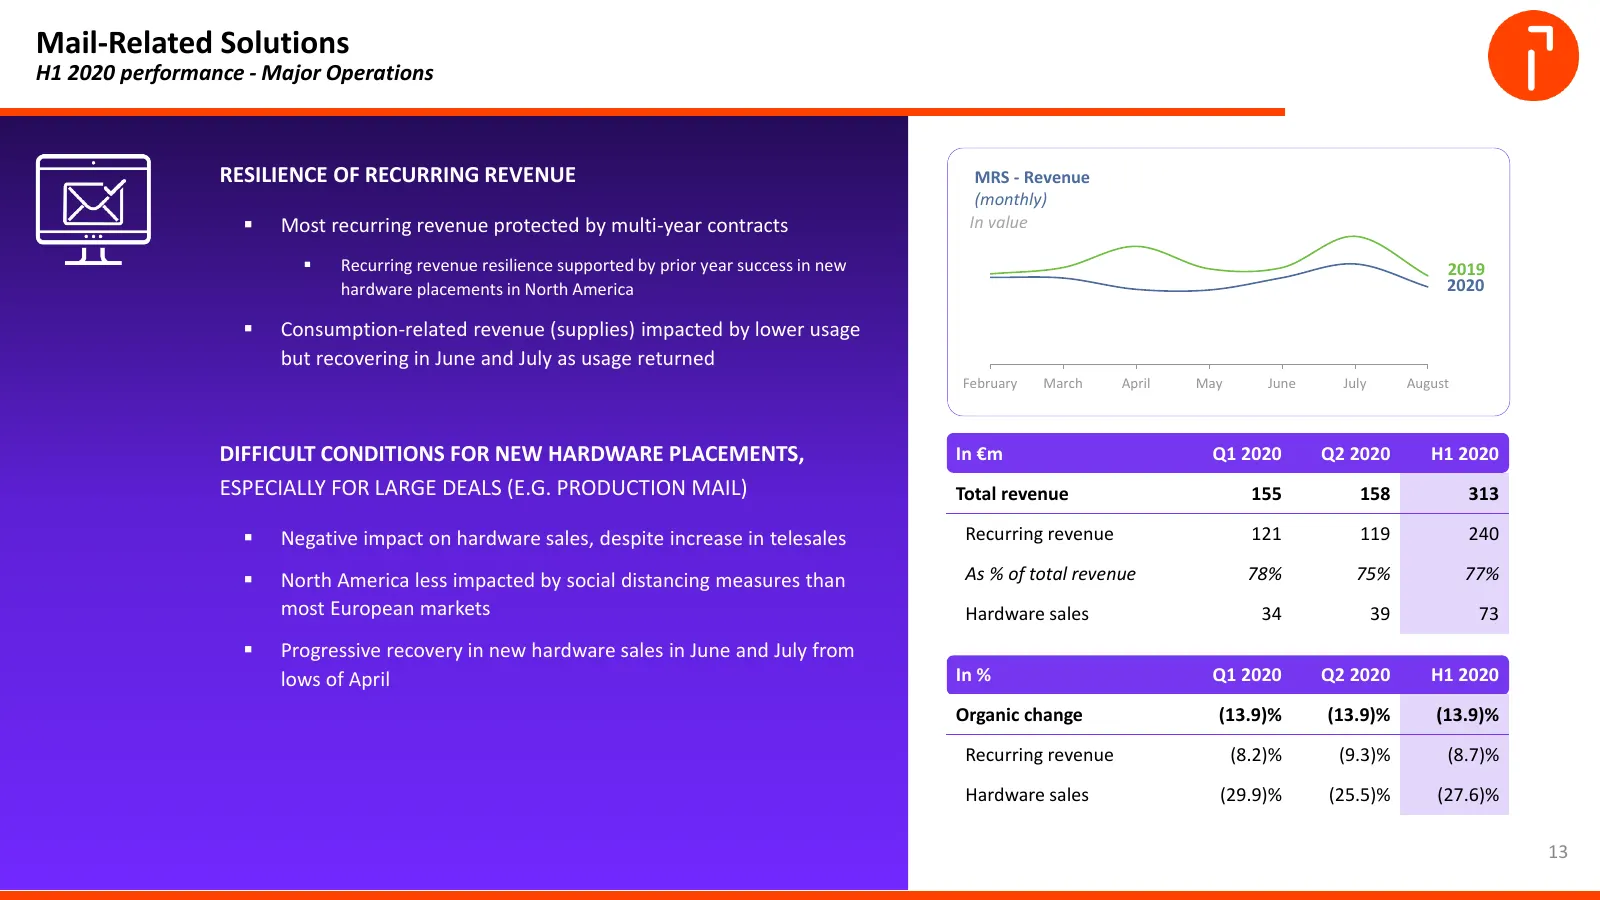
Mail-Related Solutions H1 2020 performance - Major Operations RESILIENCE OF RECURRING REVENUE MRS - Revenue (monthly) Most recurring revenue protected by multi-year contracts In value Recurring revenue resilience supported by prior year success in new 2019 hardware placements in North America 20

Slide 14: H1 2020 Financial review
H1 2020 Financial review Christelle VILLADARY CFO 14
Slide 15: H1 2020 results - summary
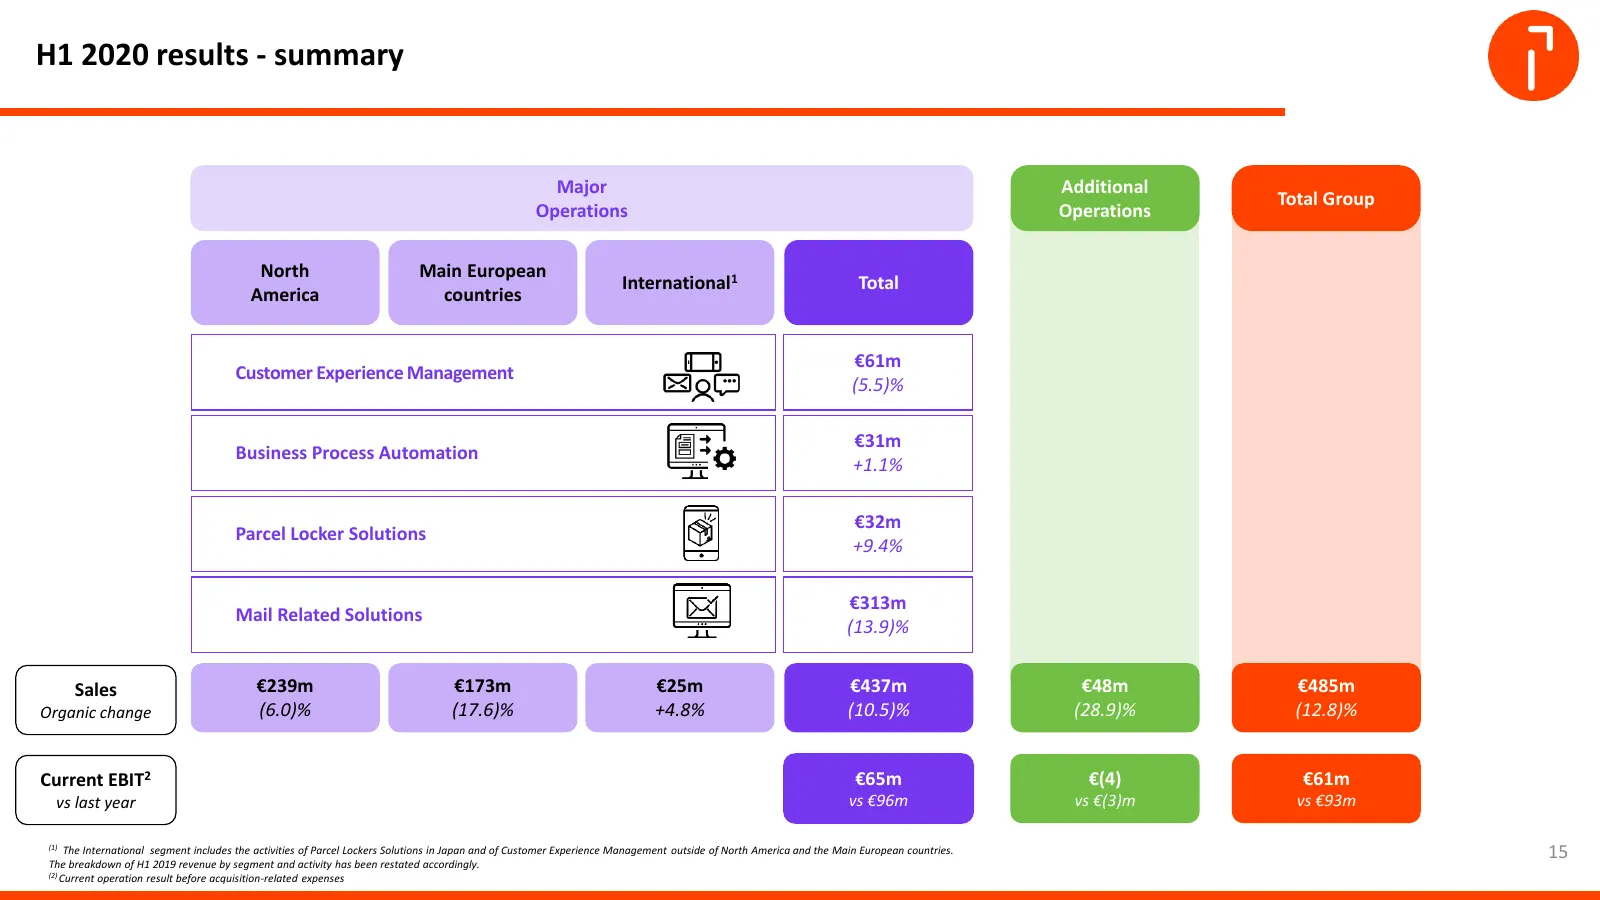
H1 2020 results - summary (in €m, % of organic change vs 2019, unaudited figures) Major Additional Total Group Operations Operations North Main European International1 Total America countries €61m Customer Experience Management (5.5)% €31m Business Process Automation +1.1% €32m Parcel Locker Solutio
Slide 16: Major Operations
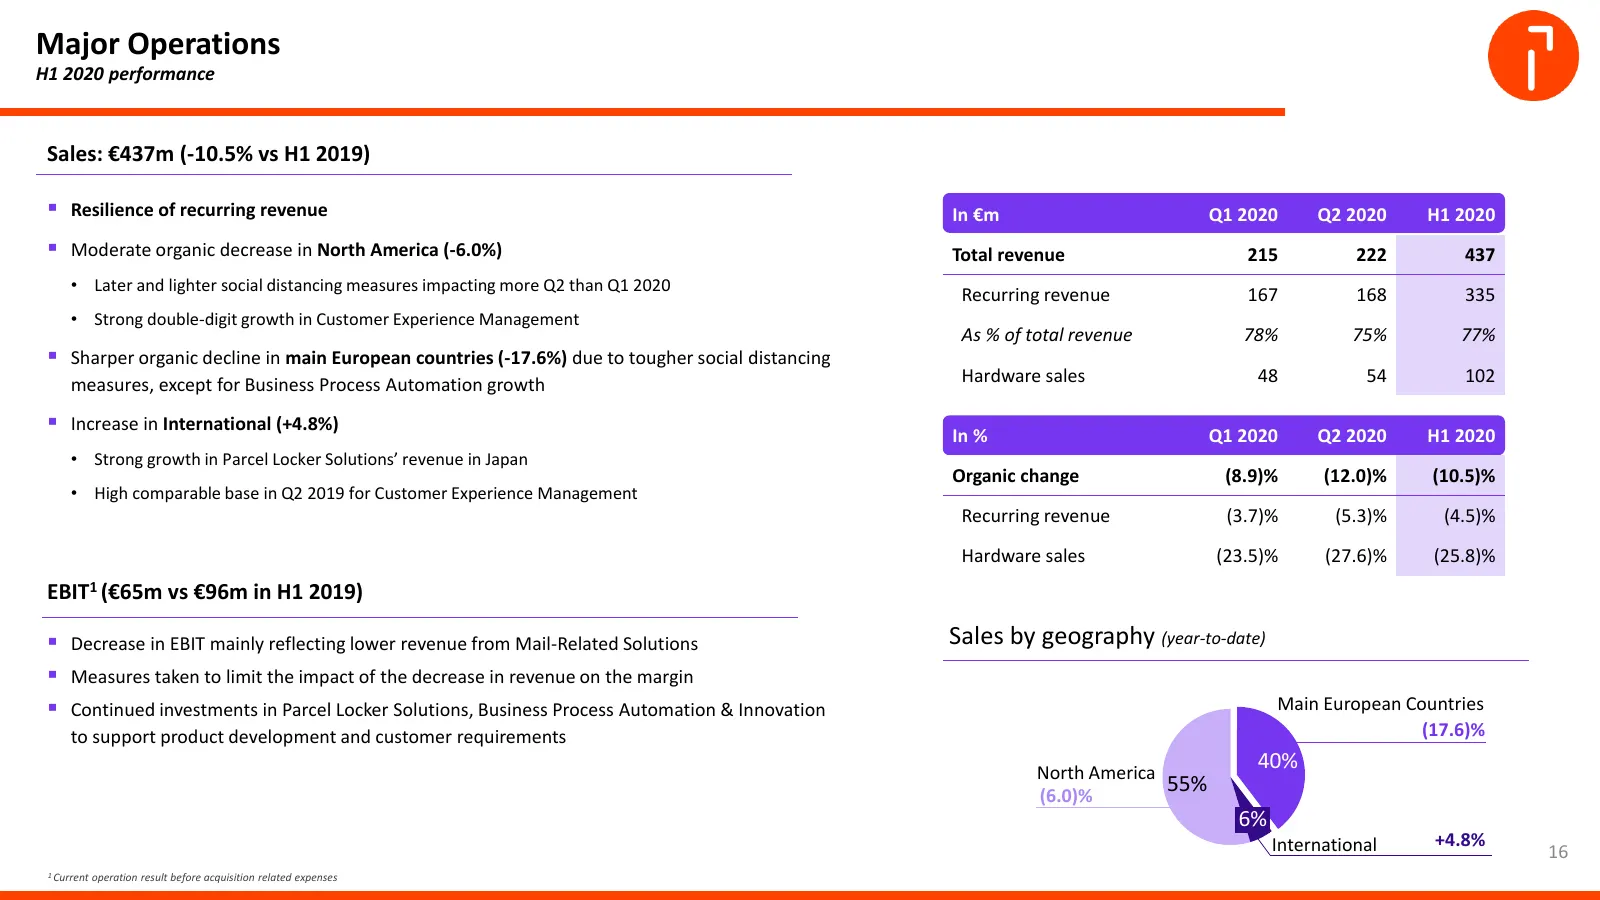
Major Operations H1 2020 performance Sales: €437m (-10.5% vs H1 2019) Resilience of recurring revenue In €m Q1 2020 Q2 2020 H1 2020 Moderate organic decrease in North America (-6.0%) Total revenue 215 222 437 • Later and lighter social distancing measures impacting more Q2 than Q1 2020 Recurring
Slide 17: Additional Operations
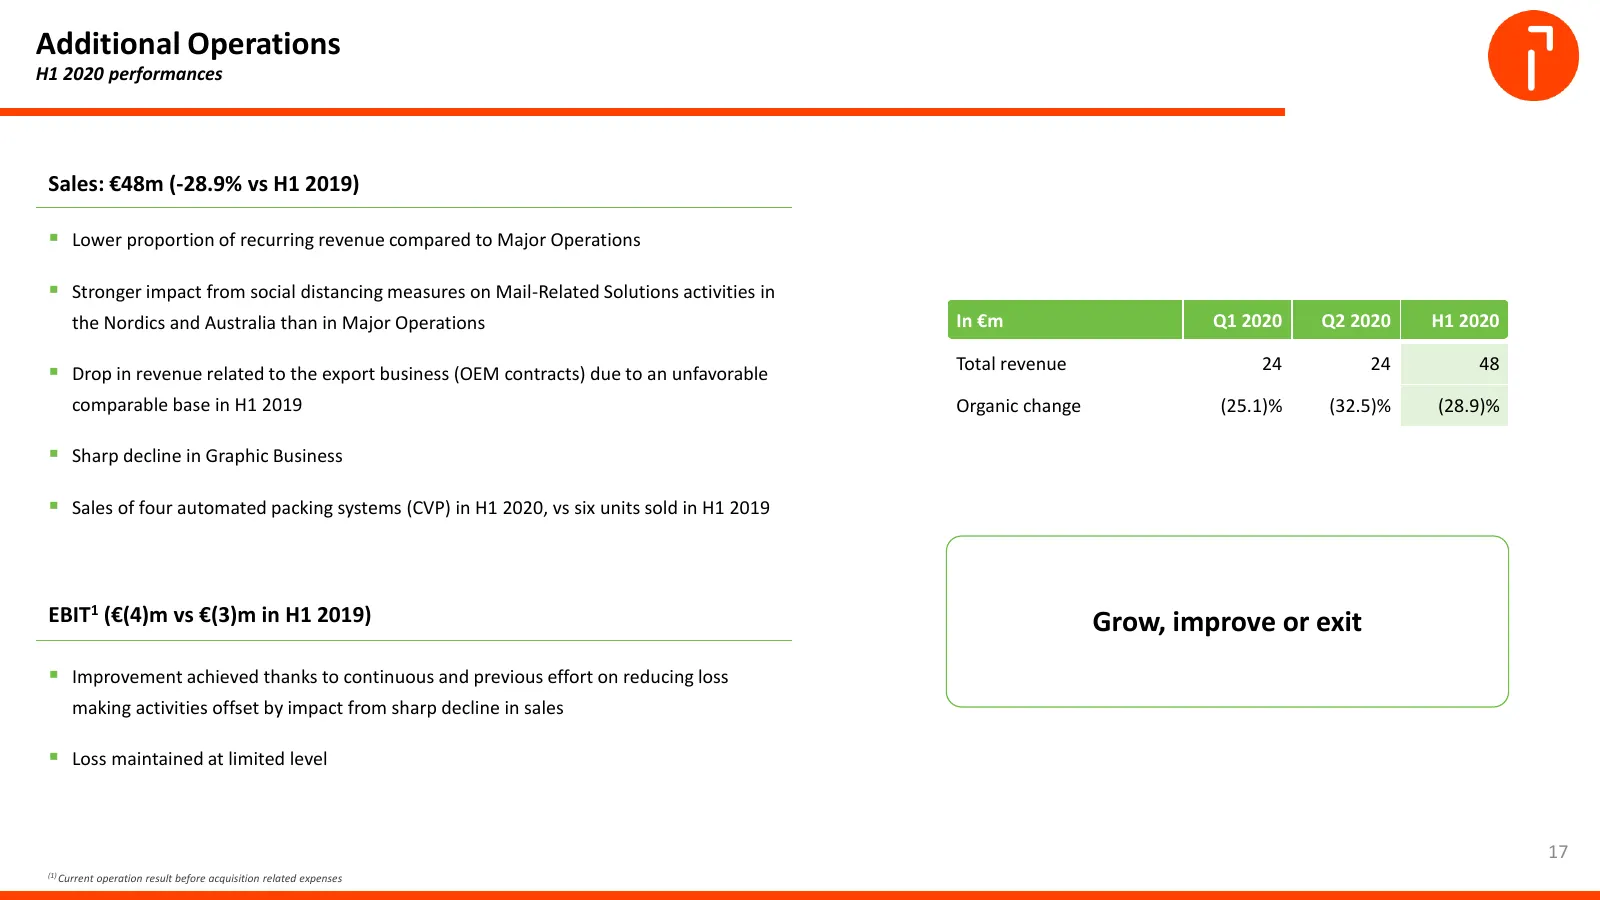
Additional Operations H1 2020 performances Sales: €48m (-28.9% vs H1 2019) Lower proportion of recurring revenue compared to Major Operations Stronger impact from social distancing measures on Mail-Related Solutions activities in the Nordics and Australia than in Major Operations In €m Q1 2020 Q
Slide 18: Focus on cost management
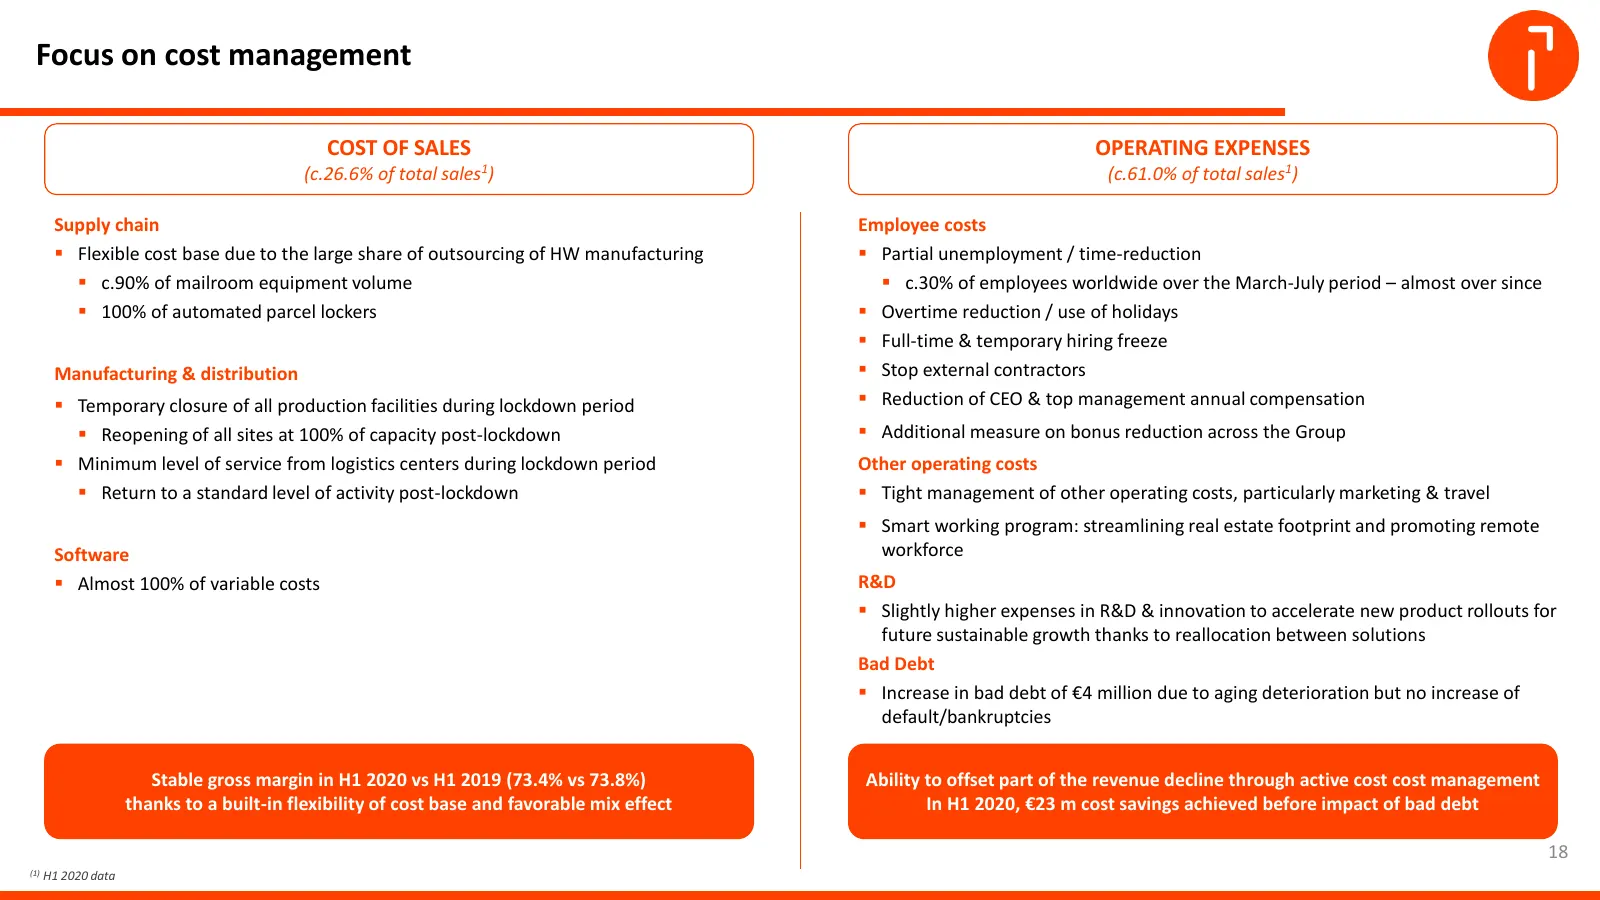
Focus on cost management COST OF SALES OPERATING EXPENSES (c.26.6% of total sales1) (c.61.0% of total sales1) Supply chain Employee costs Flexible cost base due to the large share of outsourcing of HW manufacturing Partial unemployment / time-reduction c.90% of mailroom equipment volume c.30
Slide 19: Active cost management limited the impact of sales decline on EBIT
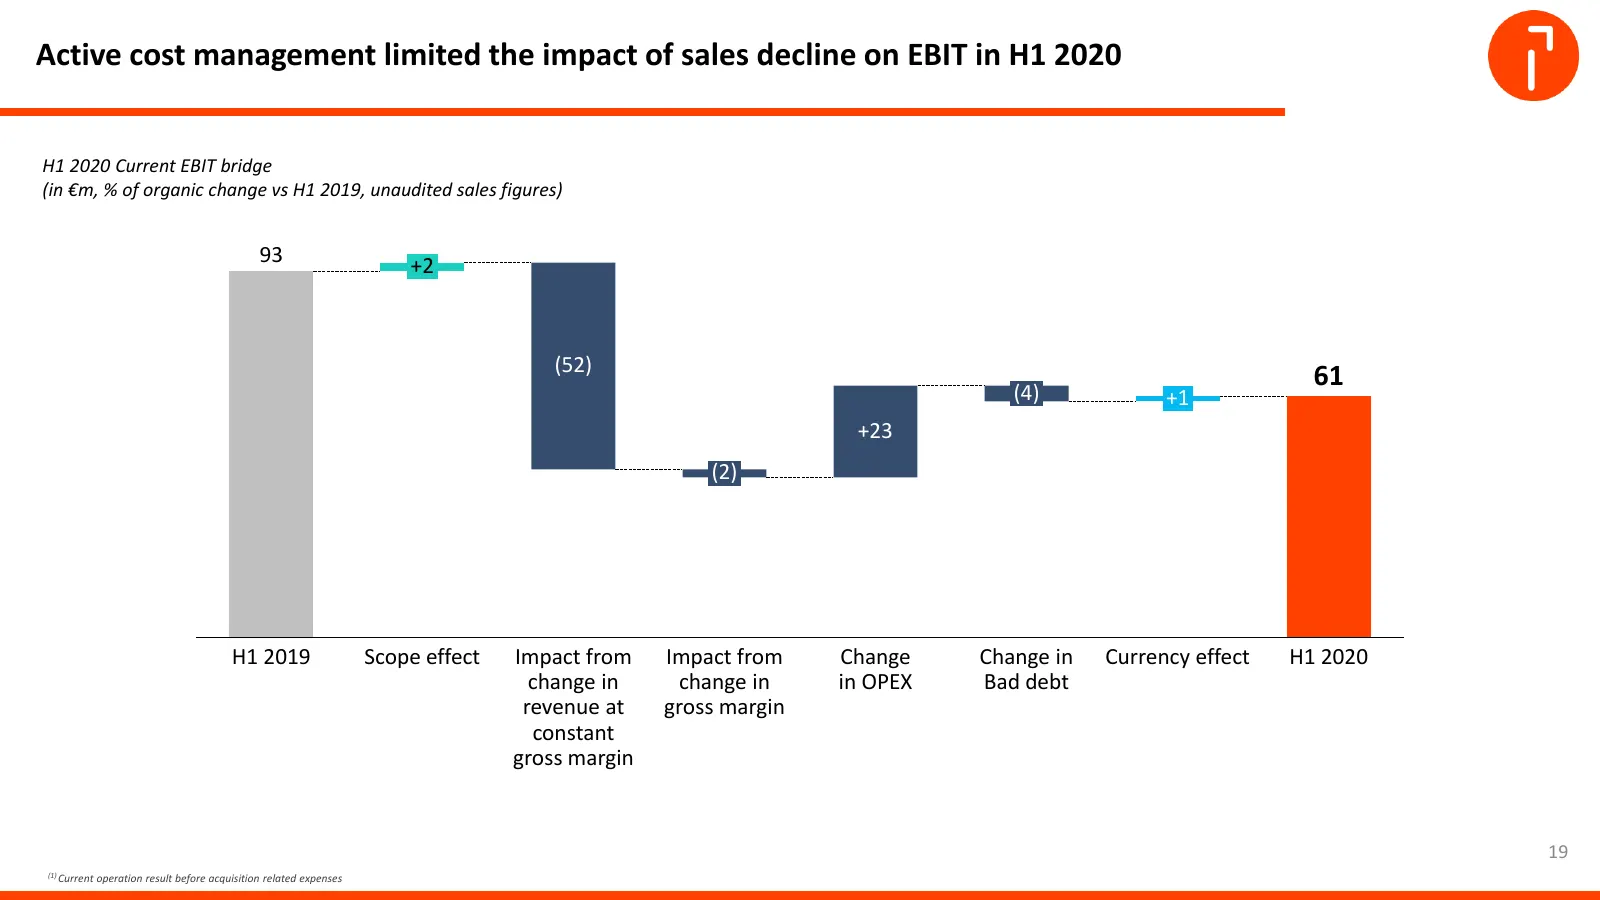
Active cost management limited the impact of sales decline on EBIT in H1 2020 H1 2020 Current EBIT bridge (in €m, % of organic change vs H1 2019, unaudited sales figures) 93 +2 (52) (4) 61 +1 +23 (2) H1 2019 Scope effect Impact from Impact from Change Change in Currency effect H1 2020 change in chan
Slide 20: Net attributable income of €21 million
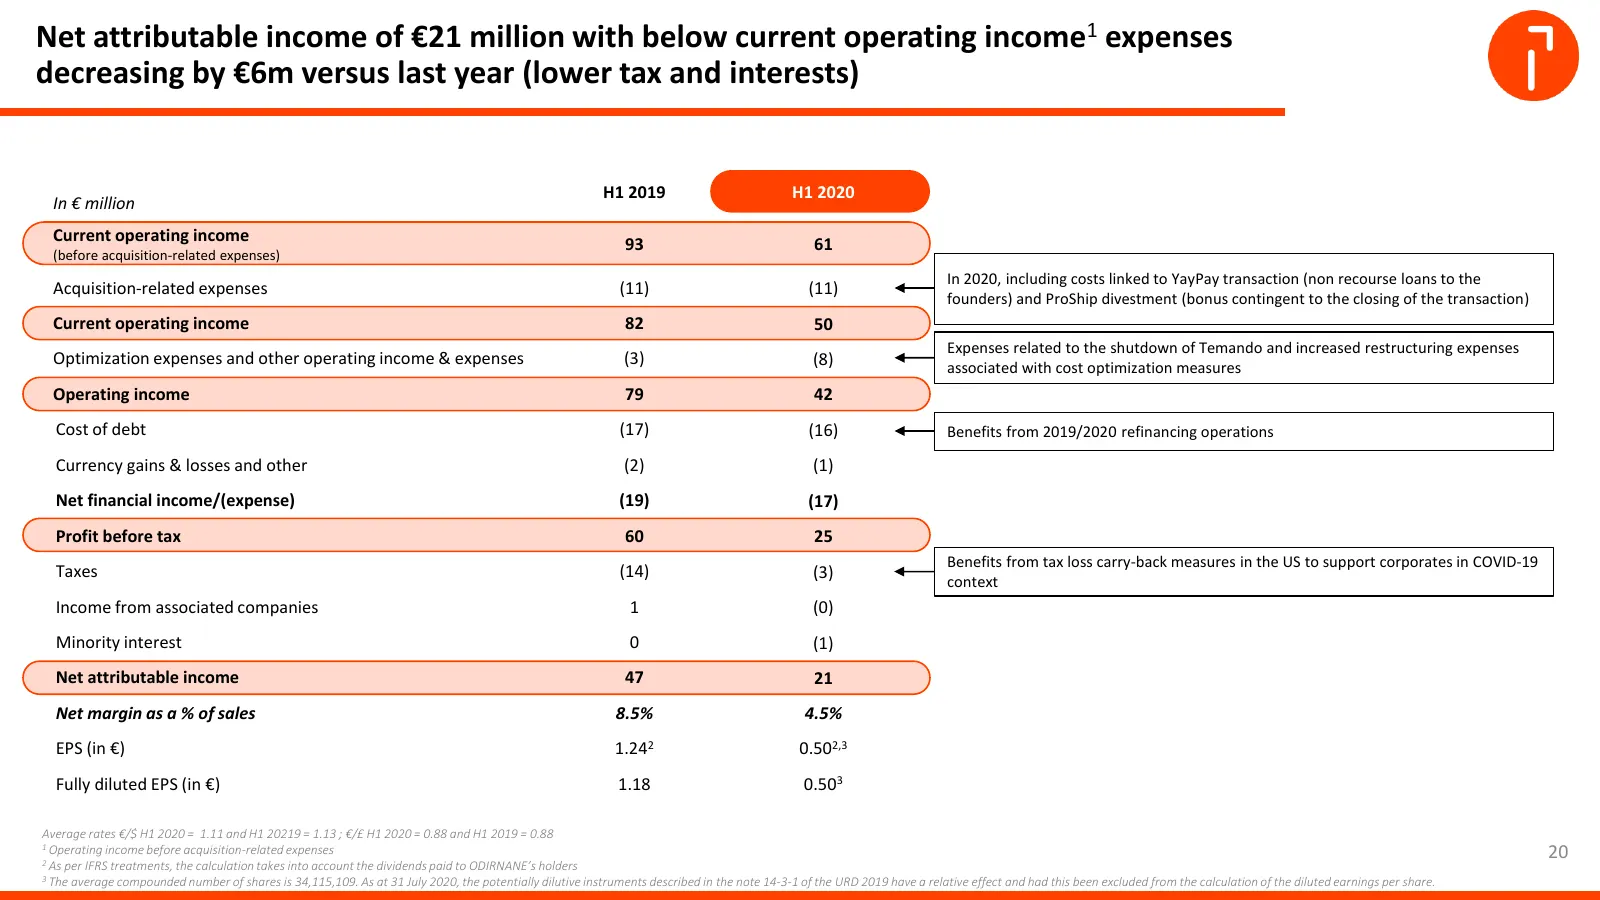
Net attributable income of €21 million with below current operating income1 expenses decreasing by €6m versus last year (lower tax and interests) H1 2019 H1 2020 In € million Current operating income 93 61 (before acquisition-related expenses) In 2020, including costs linked to YayPay transaction (n
Slide 21: Strong cash flow generation and EBITDA margin at 21.5%
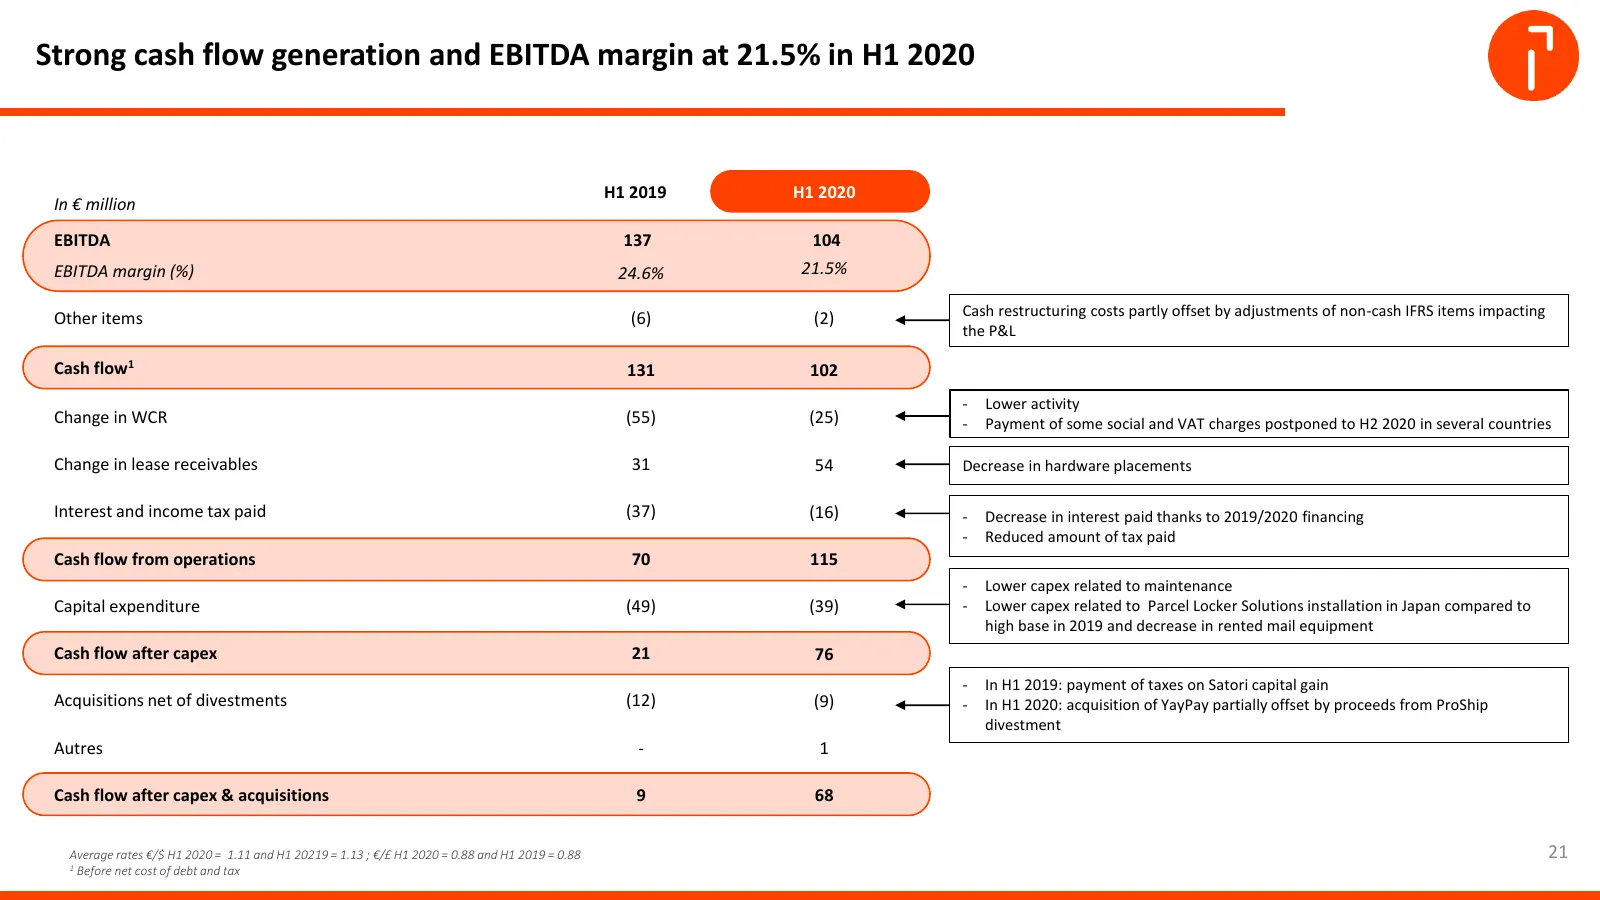
Strong cash flow generation and EBITDA margin at 21.5% in H1 2020 H1 2019 H1 2020 In € million EBITDA 137 104 EBITDA margin (%) 24.6% 21.5% Other items (6) Cash restructuring costs partly offset by adjustments of non-cash IFRS items impacting (2) the P&L Cash flow1 131 102 - Lower activity Change in
Slide 22: CAPEX mix reflecting current trading
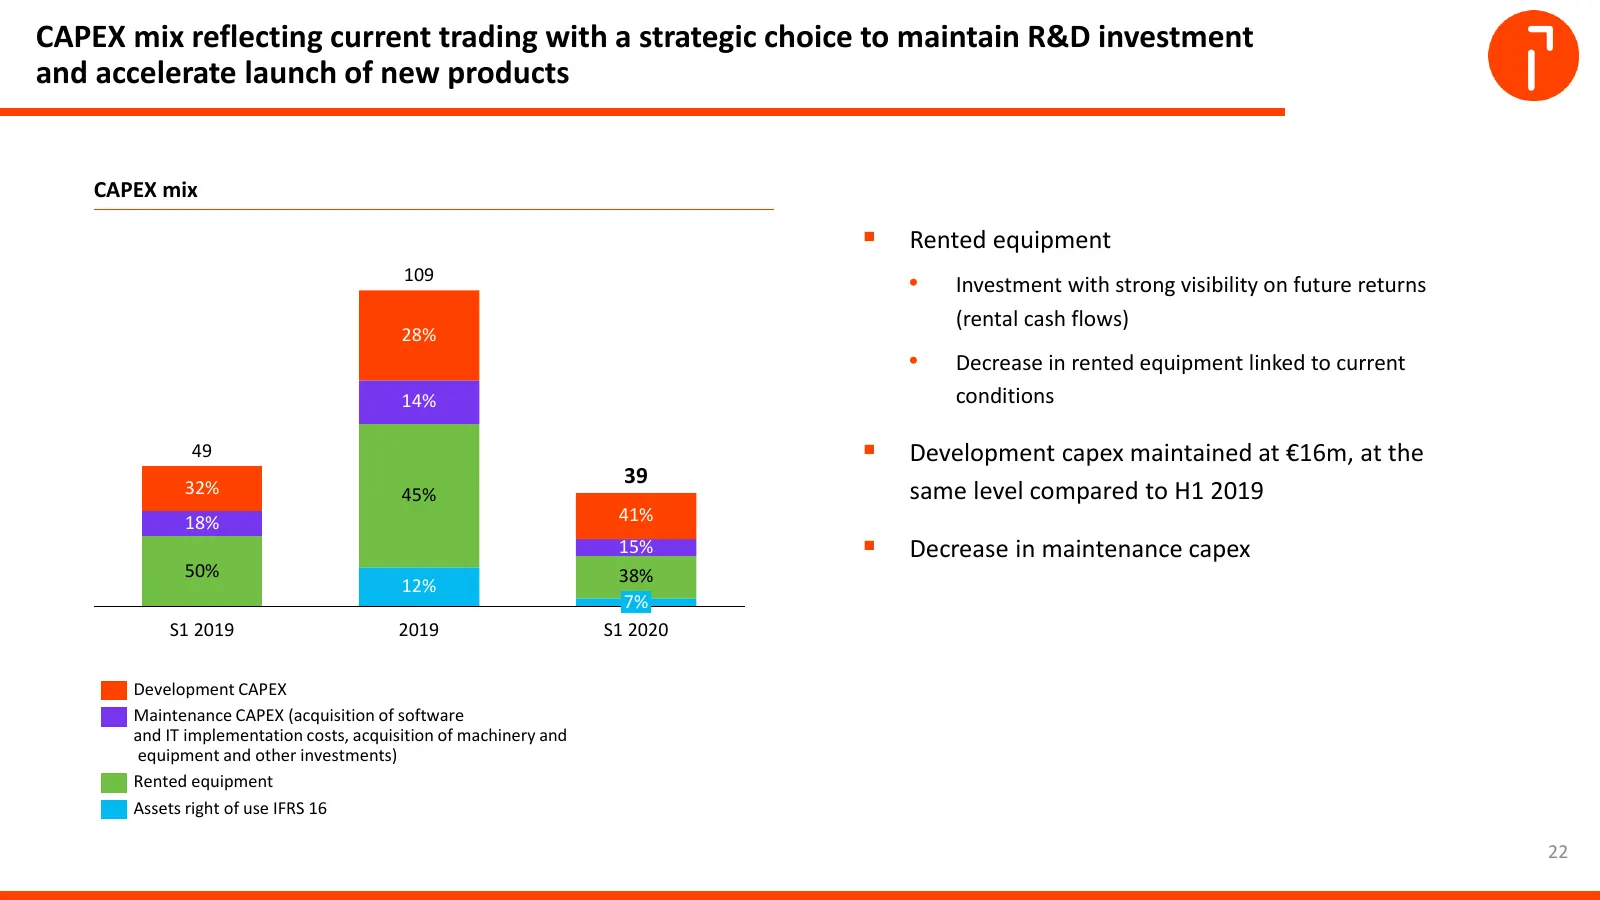
CAPEX mix reflecting current trading with a strategic choice to maintain R&D investment and accelerate launch of new products CAPEX mix Rented equipment 109 • Investment with strong visibility on future returns (rental cash flows) 28% • Decrease in rented equipment linked to current 14% conditions
Slide 23: Financial structure: decrease in net debt and improved leverage
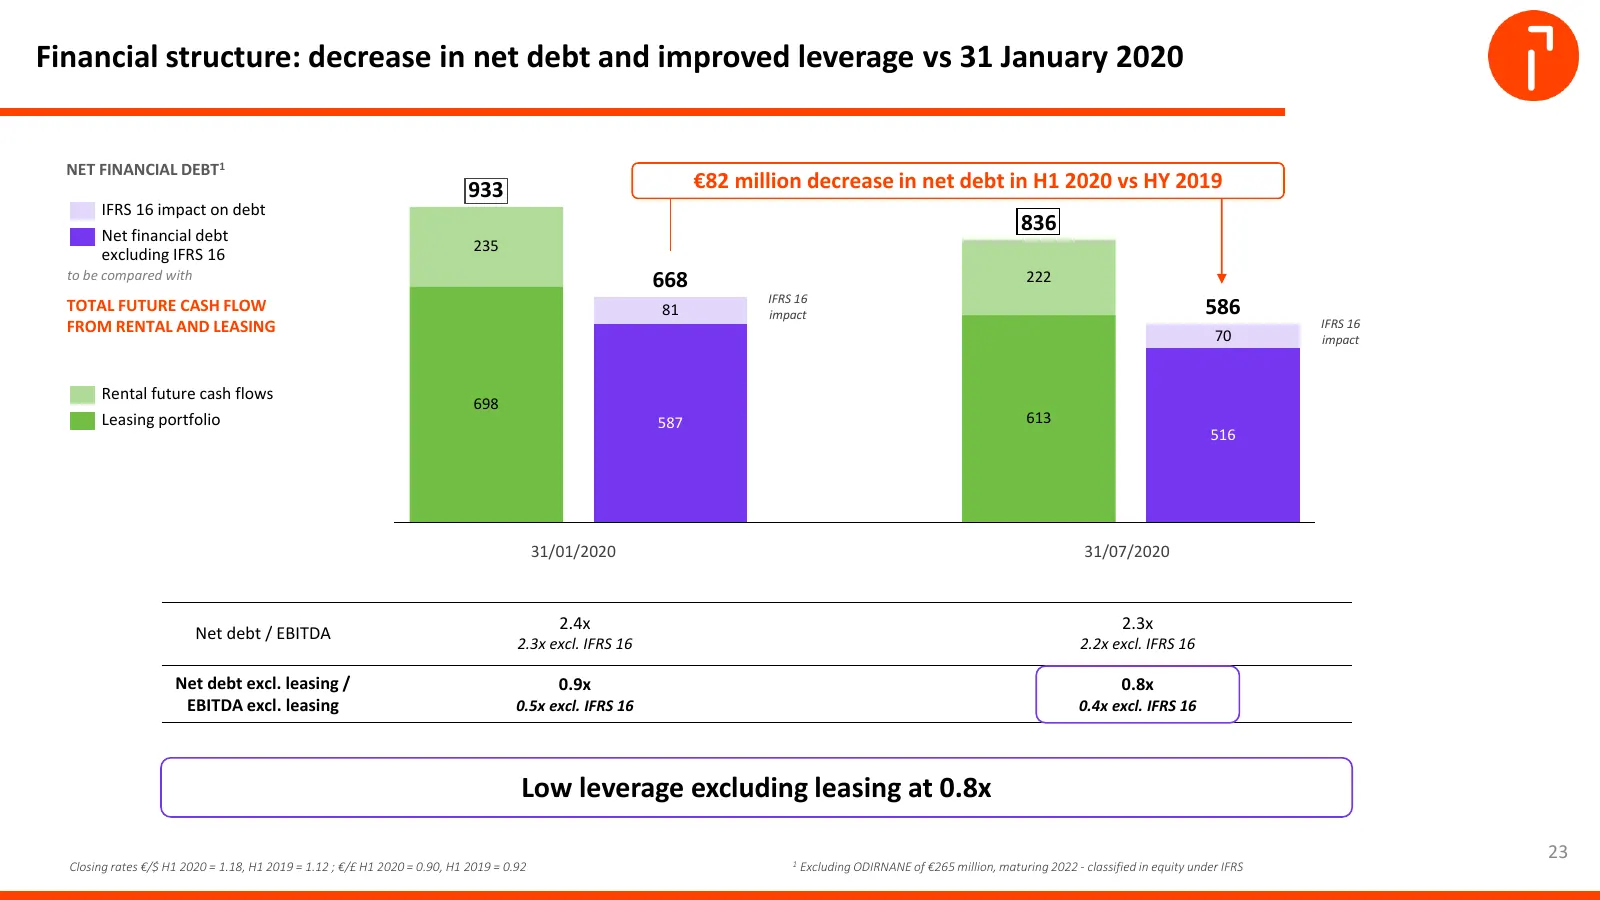
Financial structure: decrease in net debt and improved leverage vs 31 January 2020 NET FINANCIAL DEBT1 933 €82 million decrease in net debt in H1 2020 vs HY 2019 IFRS 16 impact on debt Net financial debt 836 235 excluding IFRS 16 to be compared with 668 222 IFRS 16 TOTAL FUTURE CASH FLOW 81 impact 5
Slide 24: Strong liquidity position as at 31 July 2020
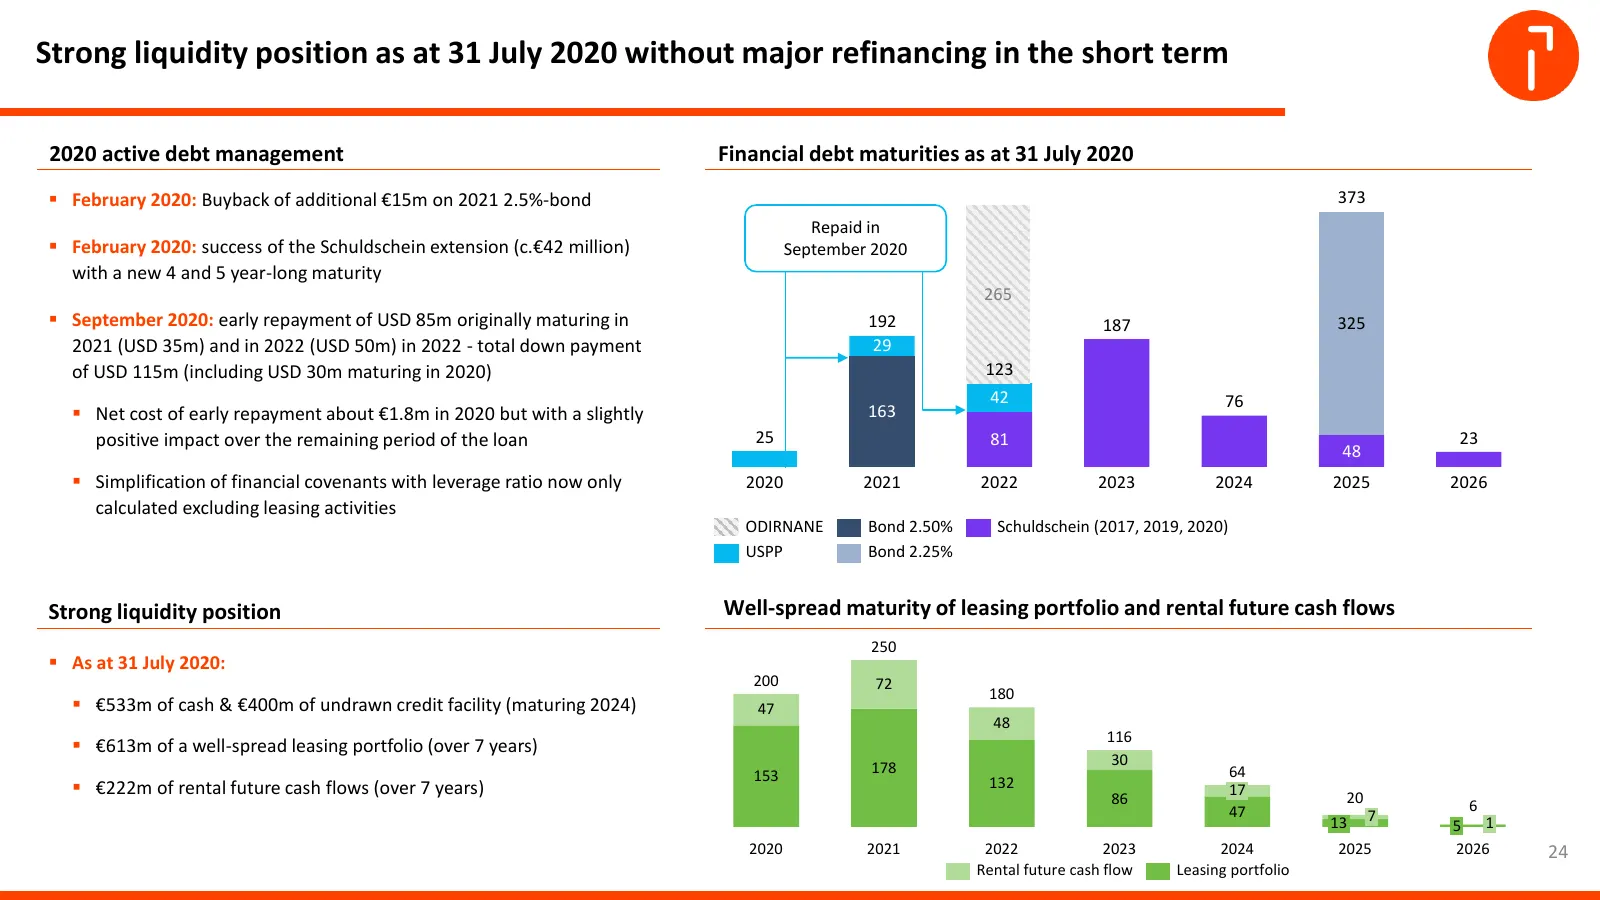
Strong liquidity position as at 31 July 2020 without major refinancing in the short term 2020 active debt management Financial debt maturities as at 31 July 2020 February 2020: Buyback of additional €15m on 2021 2.5%-bond 373 Repaid in February 2020: success of the Schuldschein extension (c.€42
Slide 25: Business Update
Business Update Geoffrey GODET CEO 25
Slide 26: Continue to reshape the portfolio in COVID context with discipline
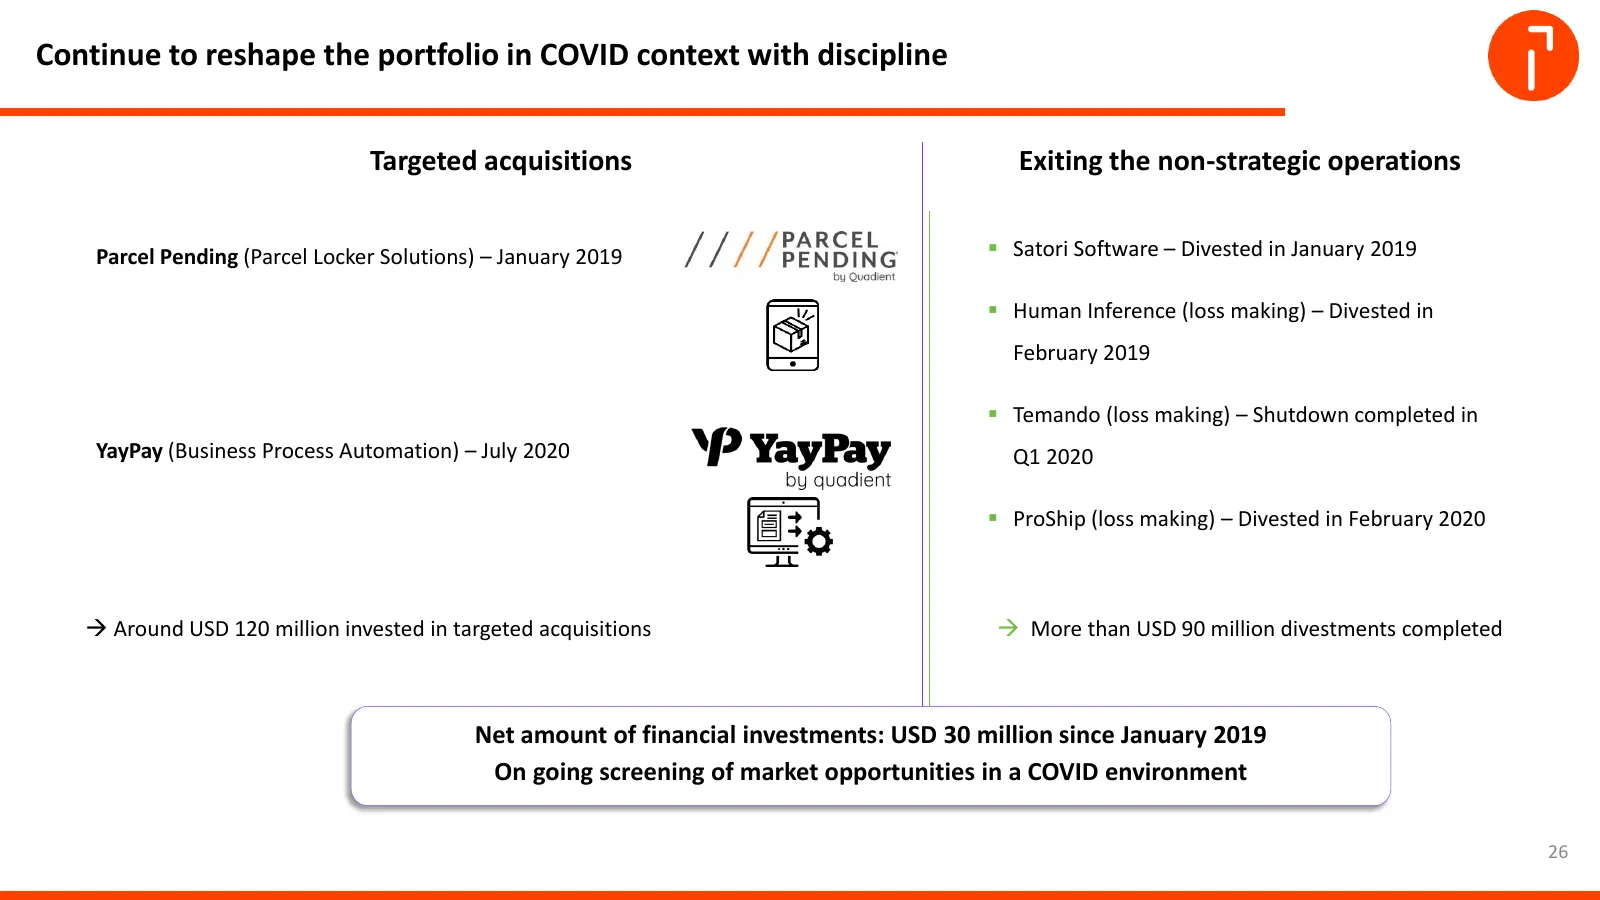
Continue to reshape the portfolio in COVID context with discipline Targeted Targeted M&Aacquisitions strategy Exiting the non-strategic operations Parcel Pending (Parcel Locker Solutions) – January 2019 Satori Software – Divested in January 2019 Human Inference (loss making) – Divested in Februa
Slide 27: Businesses accelerating digitization as a result of COVID-19
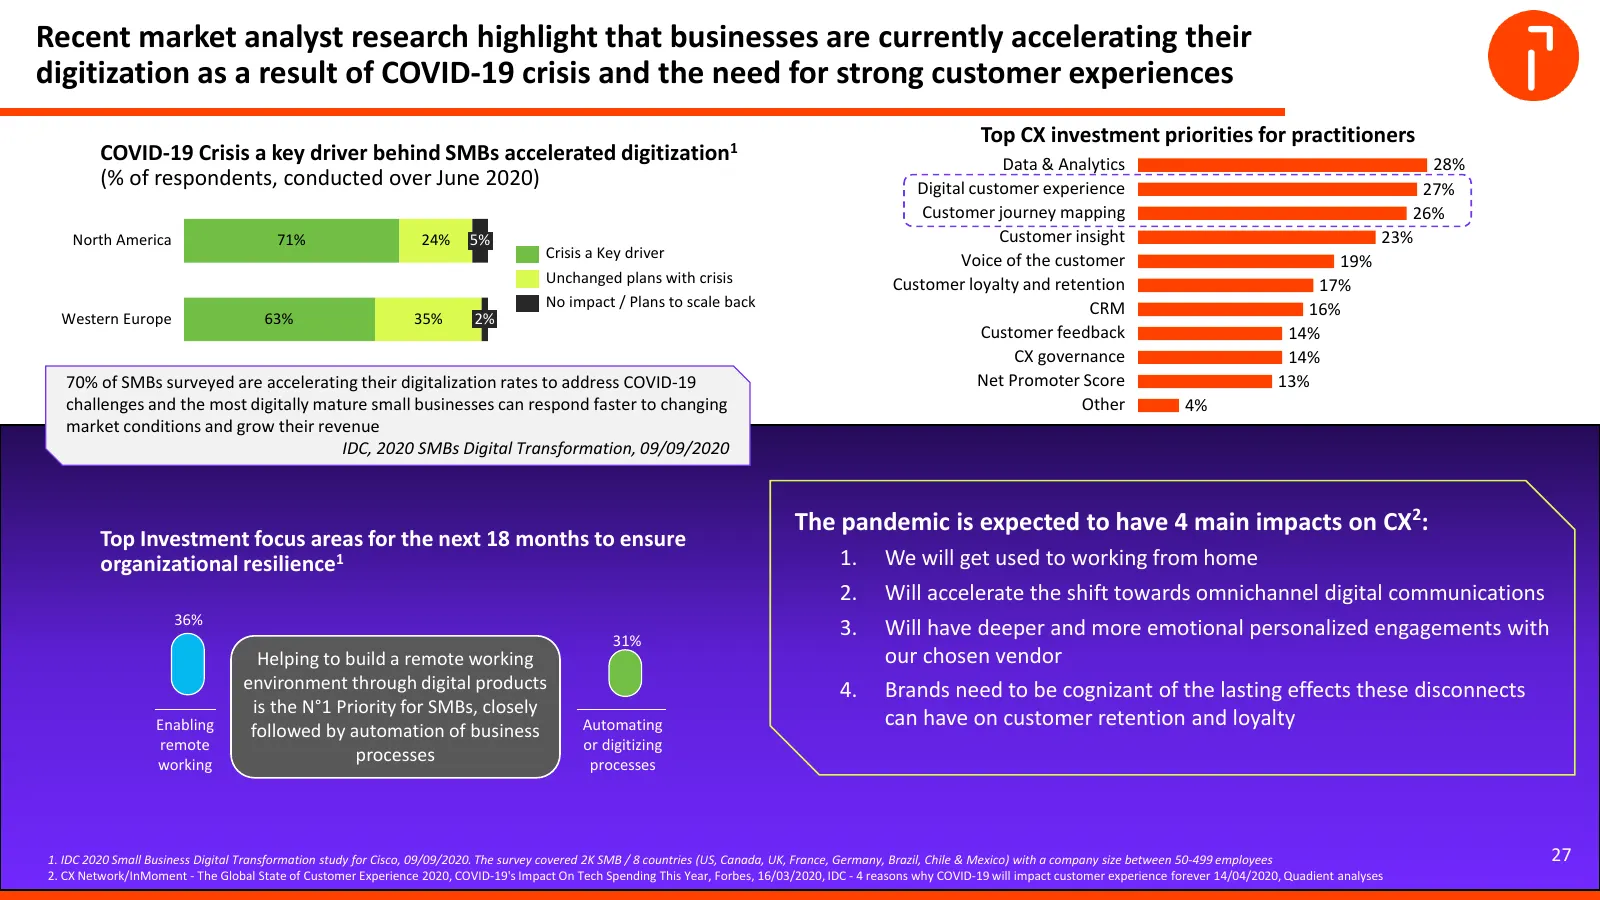
Recent market analyst research highlight that businesses are currently accelerating their digitization as a result of COVID-19 crisis and the need for strong customer experiences Top CX investment priorities for practitioners COVID-19 Crisis a key driver behind SMBs accelerated digitization1 Data &
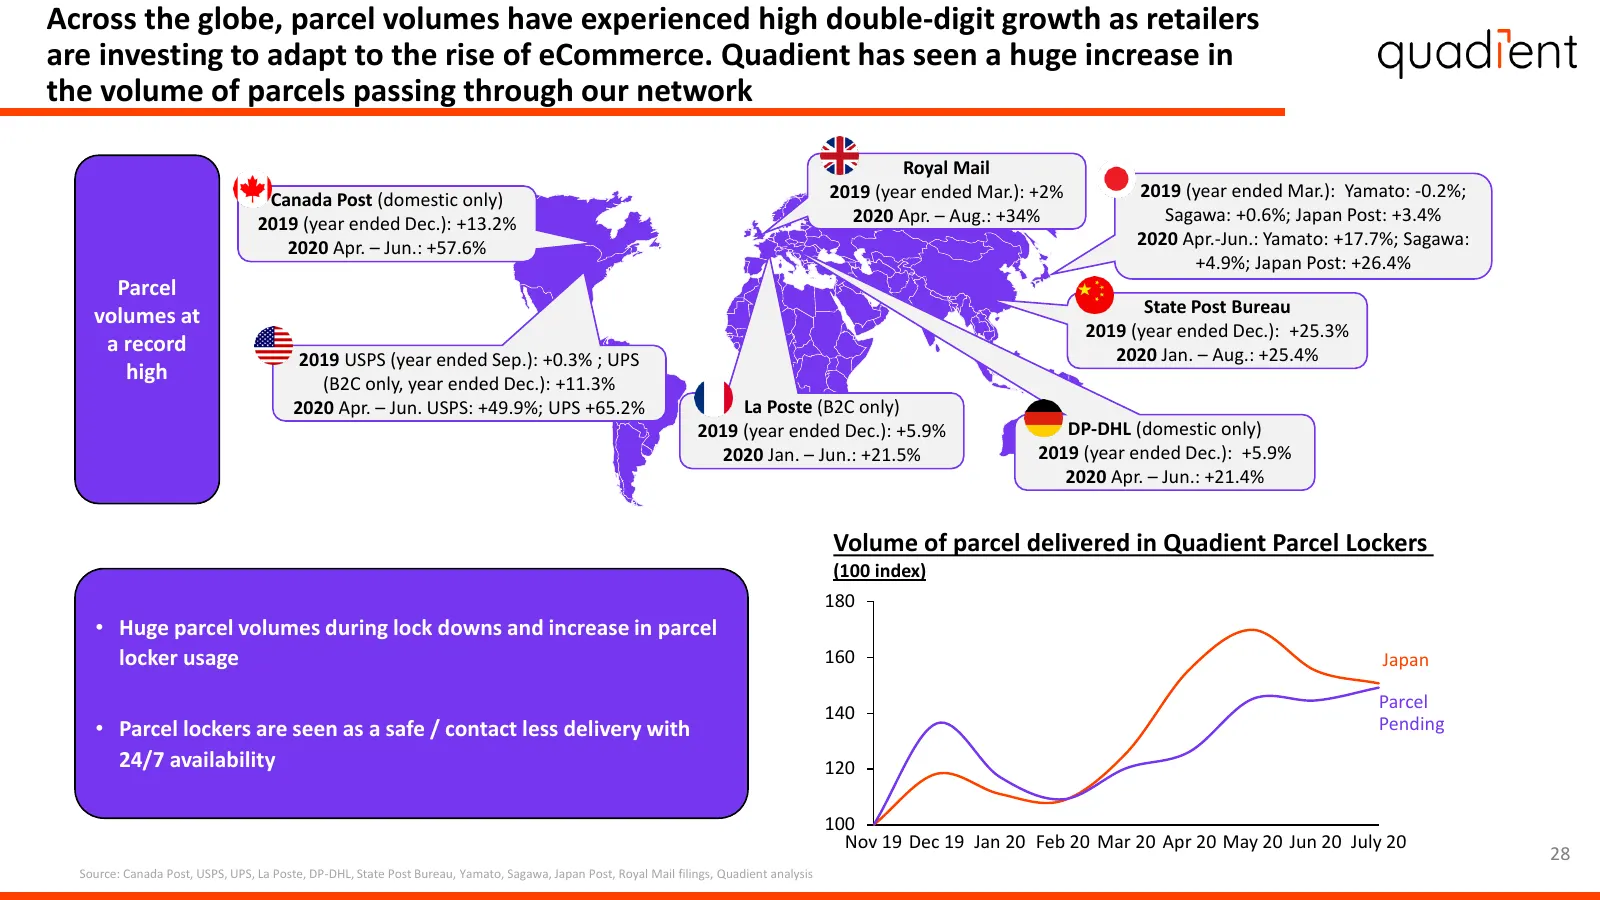
Slide 28: Parcel volumes at a record high
Across the globe, parcel volumes have experienced high double-digit growth as retailers are investing to adapt to the rise of eCommerce. Quadient has seen a huge increase in the volume of parcels passing through our network Royal Mail Canada Post (domestic only) 2019 (year ended Mar.): +2% 2019 (yea
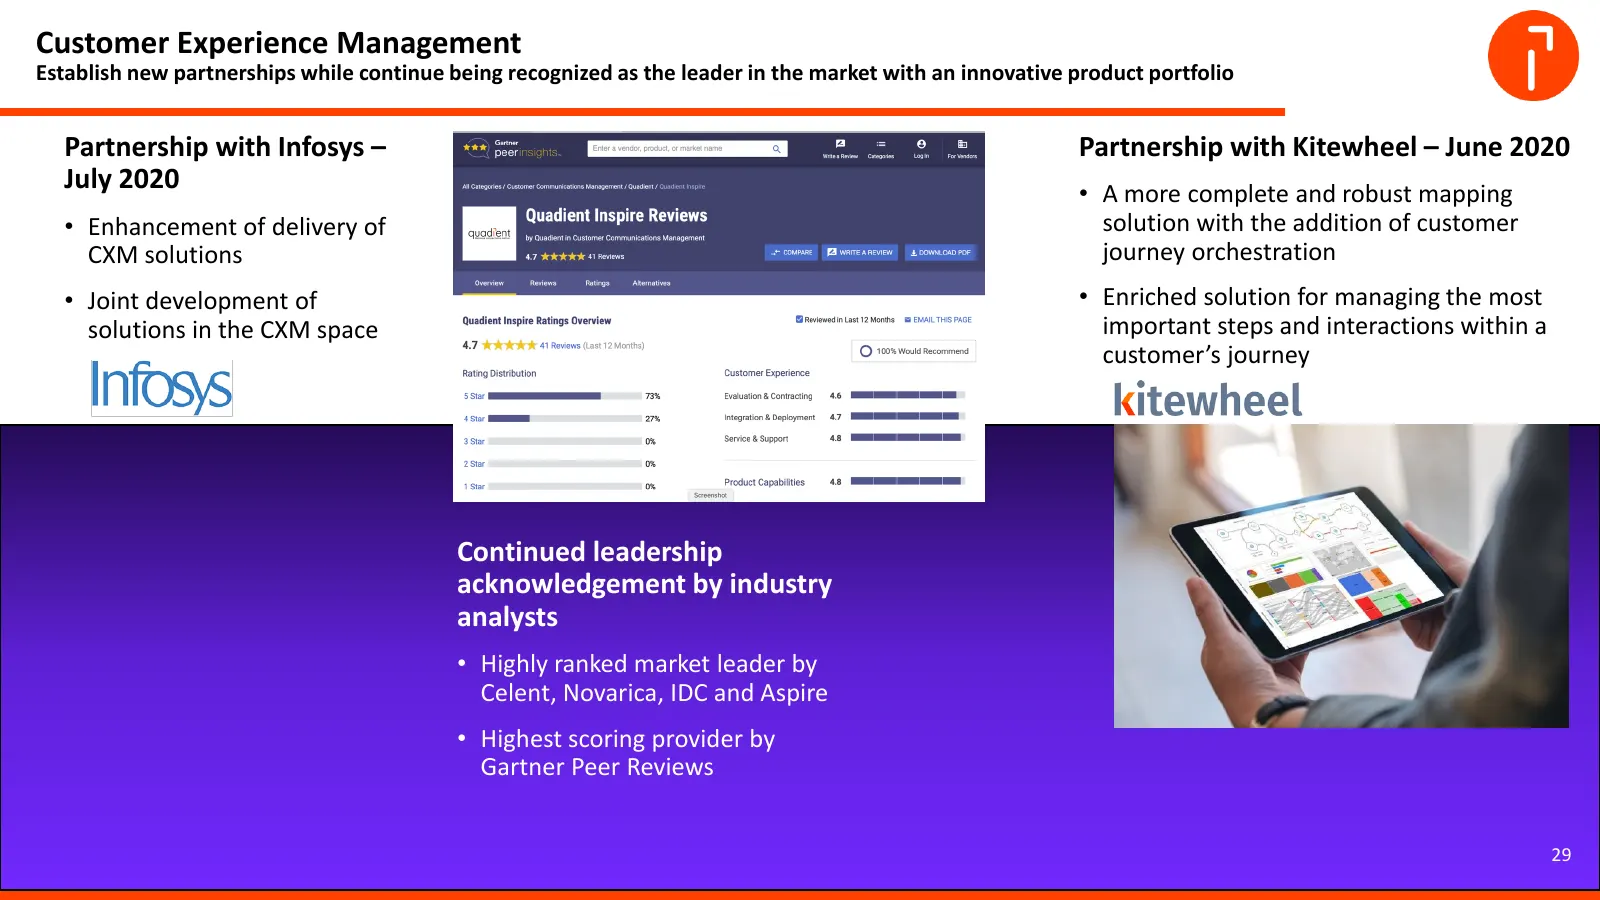
Slide 29: Customer Experience Management
Customer Experience Management Establish new partnerships while continue being recognized as the leader in the market with an innovative product portfolio Partnership with Infosys – Partnership with Kitewheel – June 2020 July 2020 • A more complete and robust mapping • Enhancement of delivery of sol
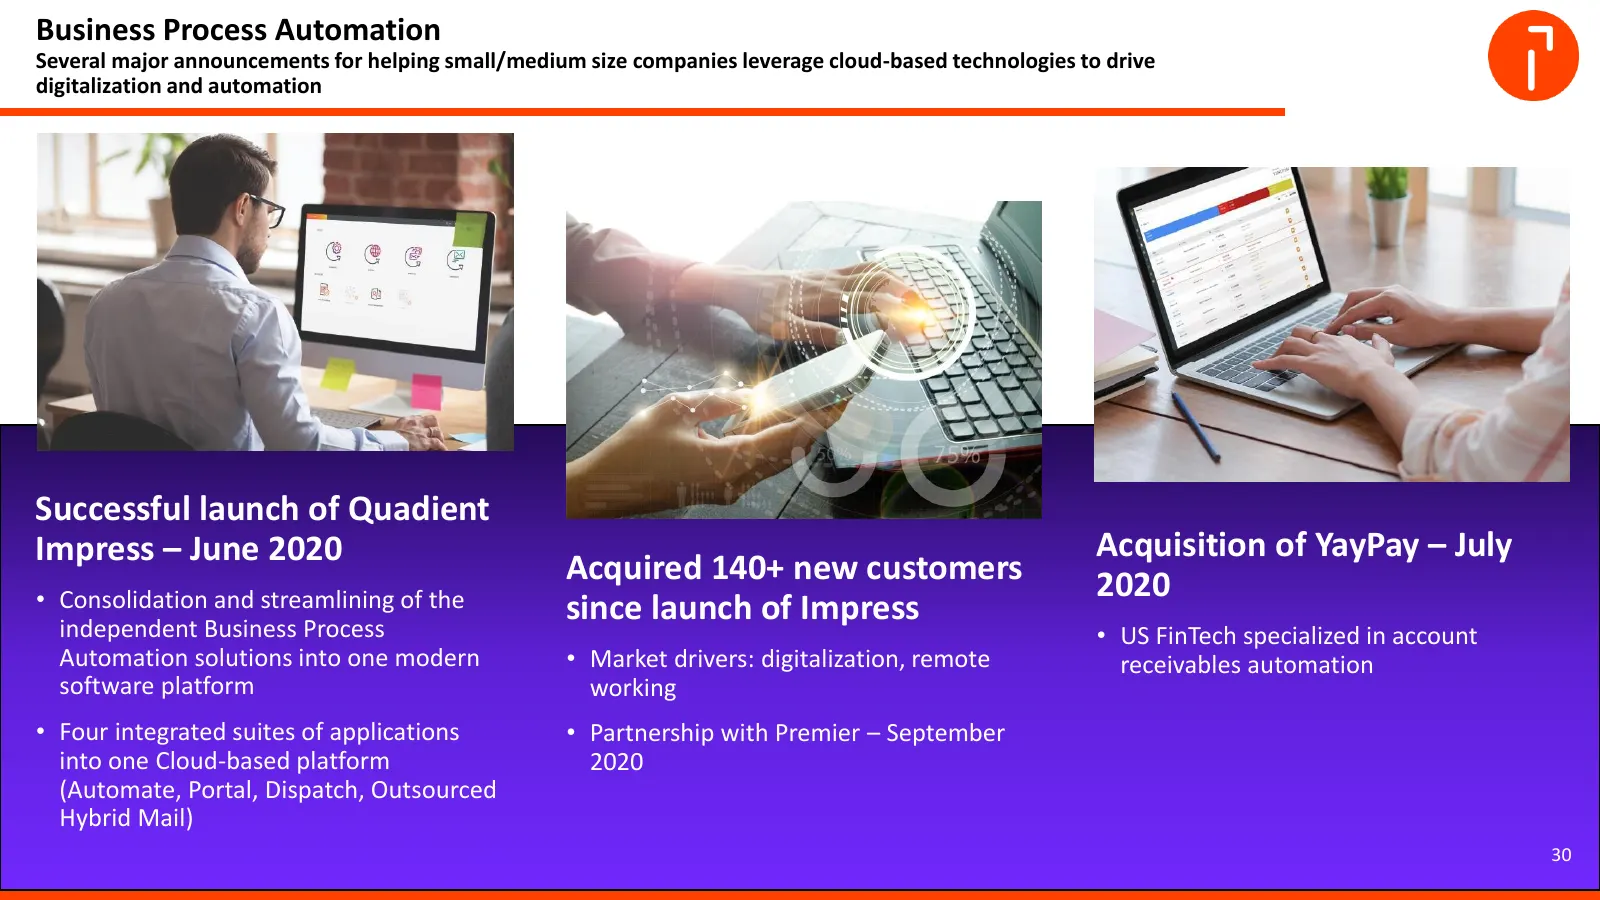
Slide 30: Business Process Automation: launch of Quadient Impress
Business Process Automation Several major announcements for helping small/medium size companies leverage cloud-based technologies to drive digitalization and automation Successful launch of Quadient Impress – June 2020 Acquisition of YayPay – July Acquired 140+ new customers 2020 • Consolidation and
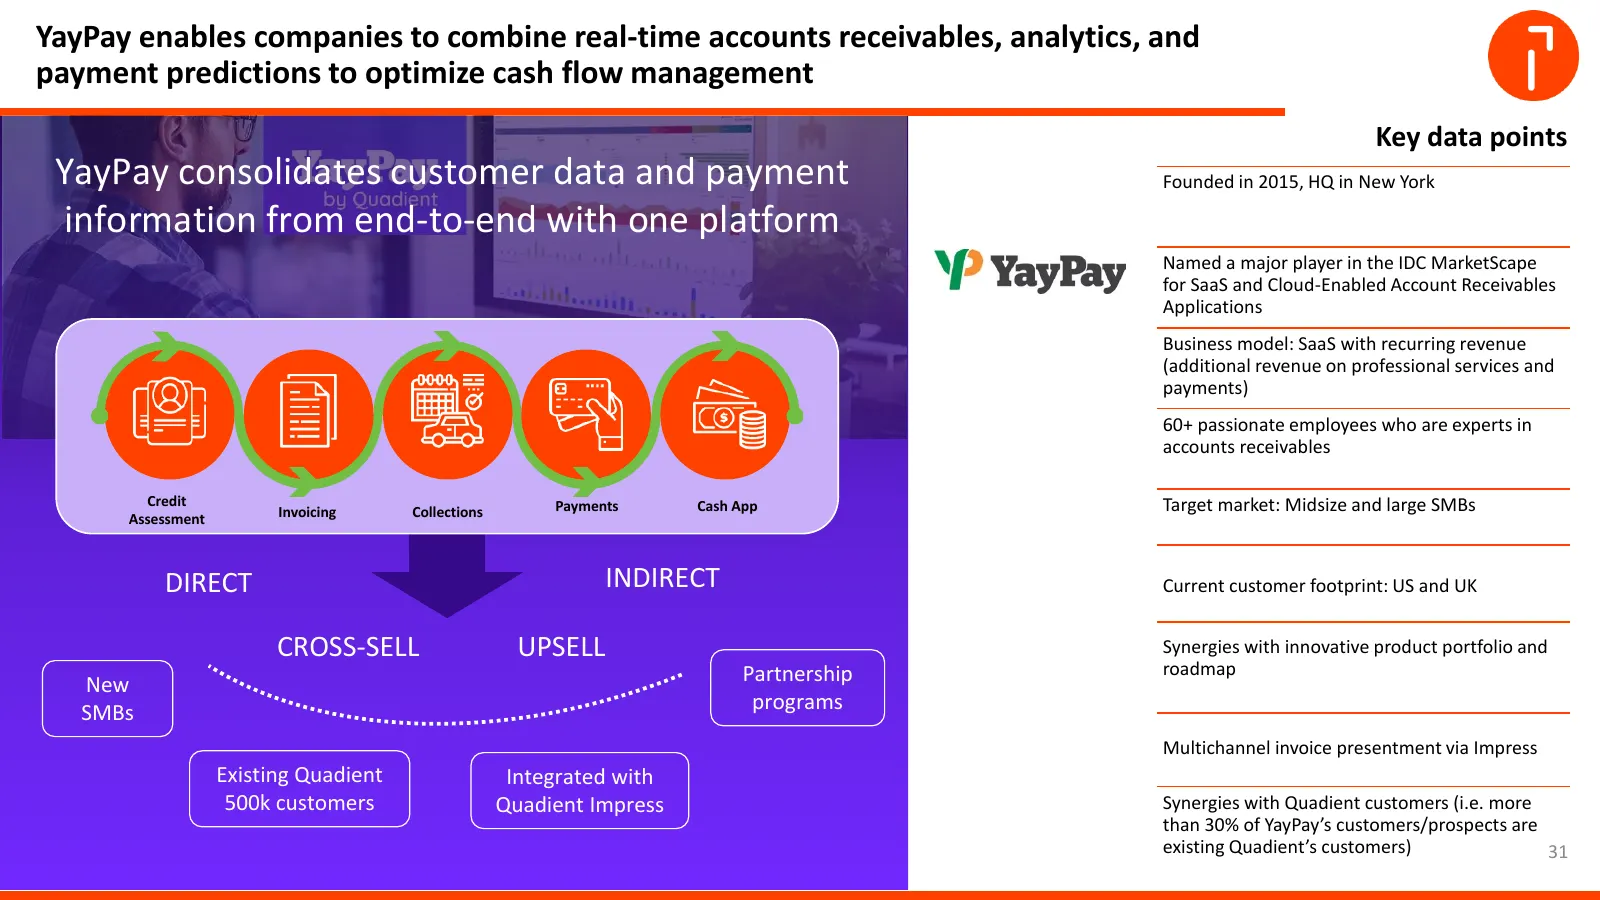
Slide 31: YayPay consolidates customer data and payment information
YayPay enables companies to combine real-time accounts receivables, analytics, and payment predictions to optimize cash flow management Key data points YayPay consolidates customer data and payment Founded in 2015, HQ in New York information from end-to-end with one platform Named a major player in
Slide 32: Full suite of automation process solutions: Impress & YayPay
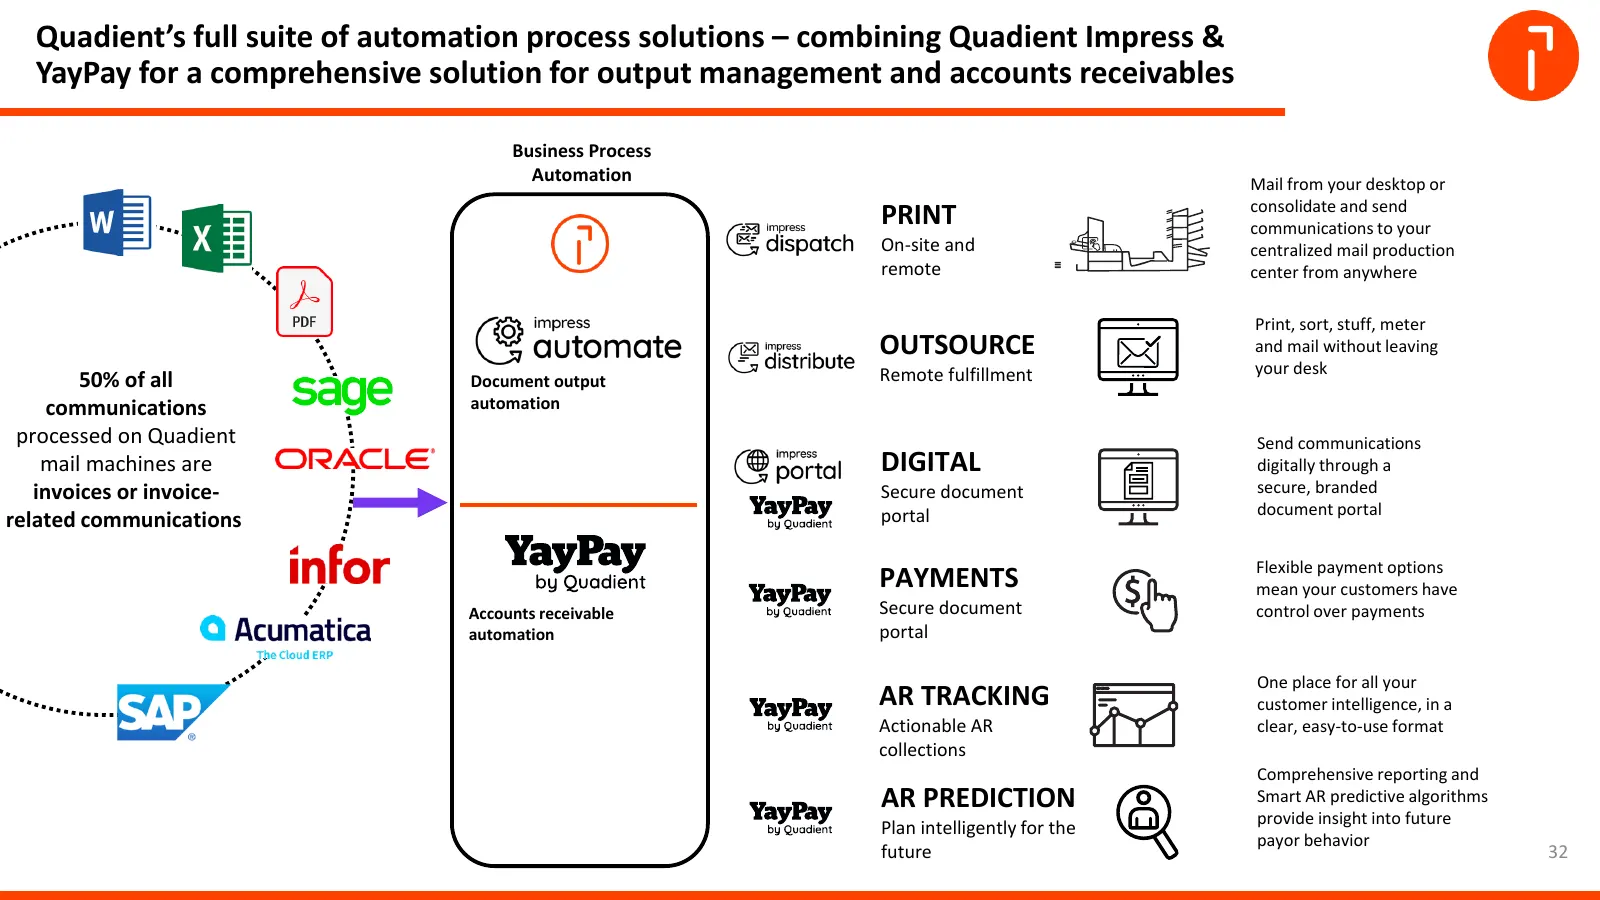
Quadient’s full suite of automation process solutions – combining Quadient Impress & YayPay for a comprehensive solution for output management and accounts receivables Business Process Automation Mail from your desktop or consolidate and send PRINT communications to your On-site and centralized mail
Slide 33: Parcel Locker Solutions: Launch of Parcel Locker Lite
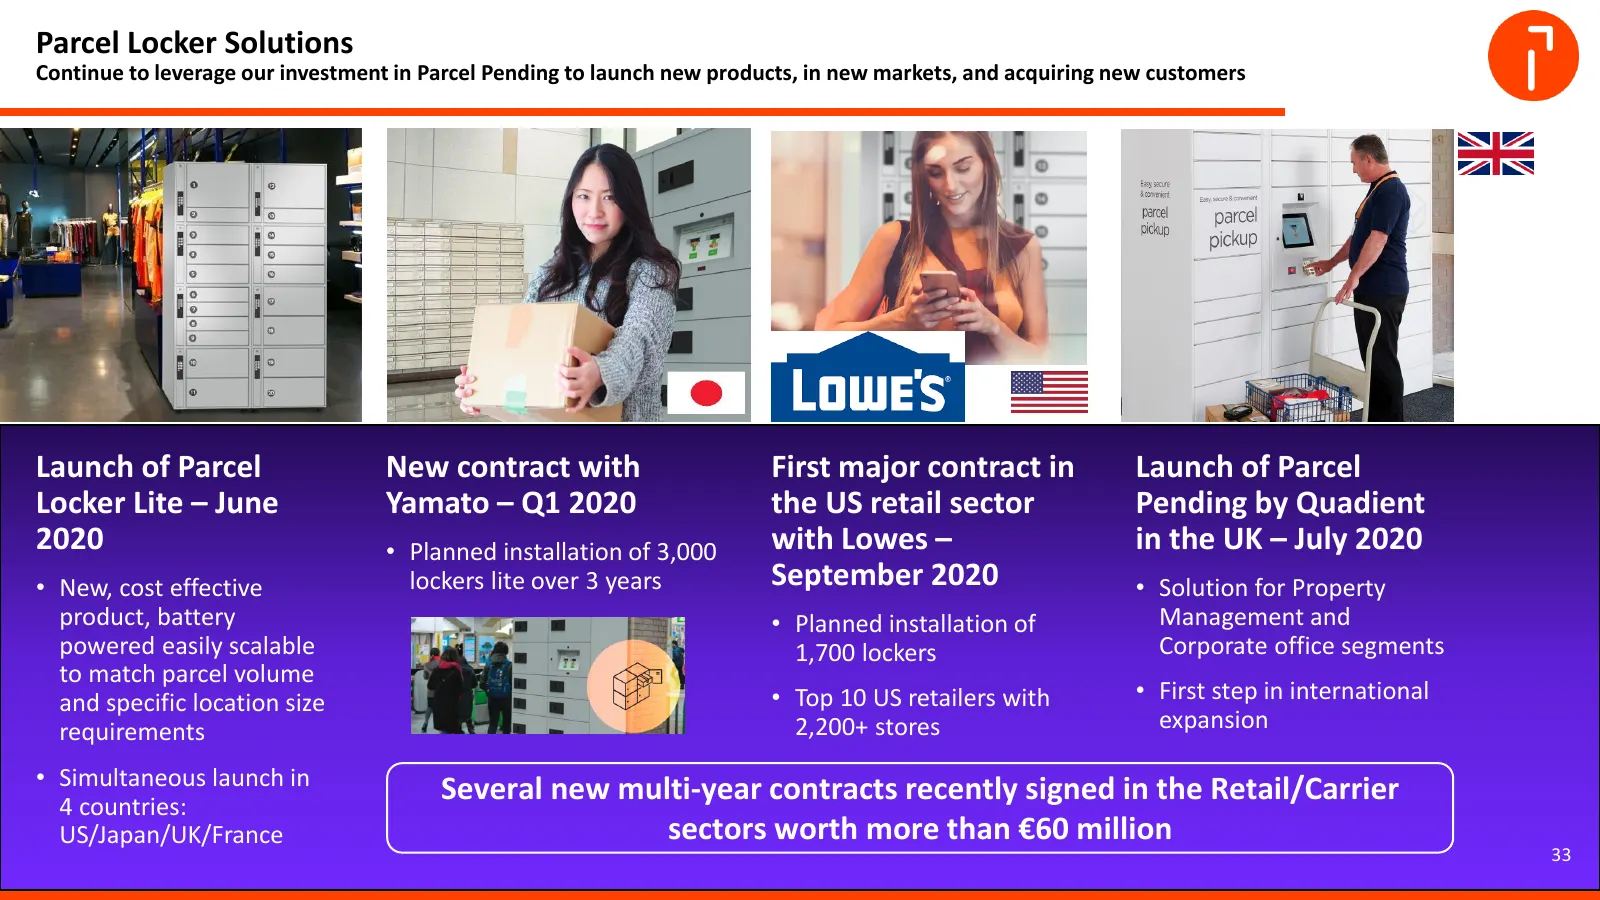
Parcel Locker Solutions Continue to leverage our investment in Parcel Pending to launch new products, in new markets, and acquiring new customers Launch of Parcel New contract with First major contract in Launch of Parcel Locker Lite – June Yamato – Q1 2020 the US retail sector Pending by Quadient 2

Slide 34: Introduction of the iX-Series Mailing System in the US
Mail Related Solutions Quadient released next generation product and established a new strategic partnership Introduction of the iX-Series New original Mailing System in the US – June equipment 2020 manufacturer • Designed and built to meet the needs of (OEM) contract small, medium and large busines
Slide 35: Further integration between our four solutions
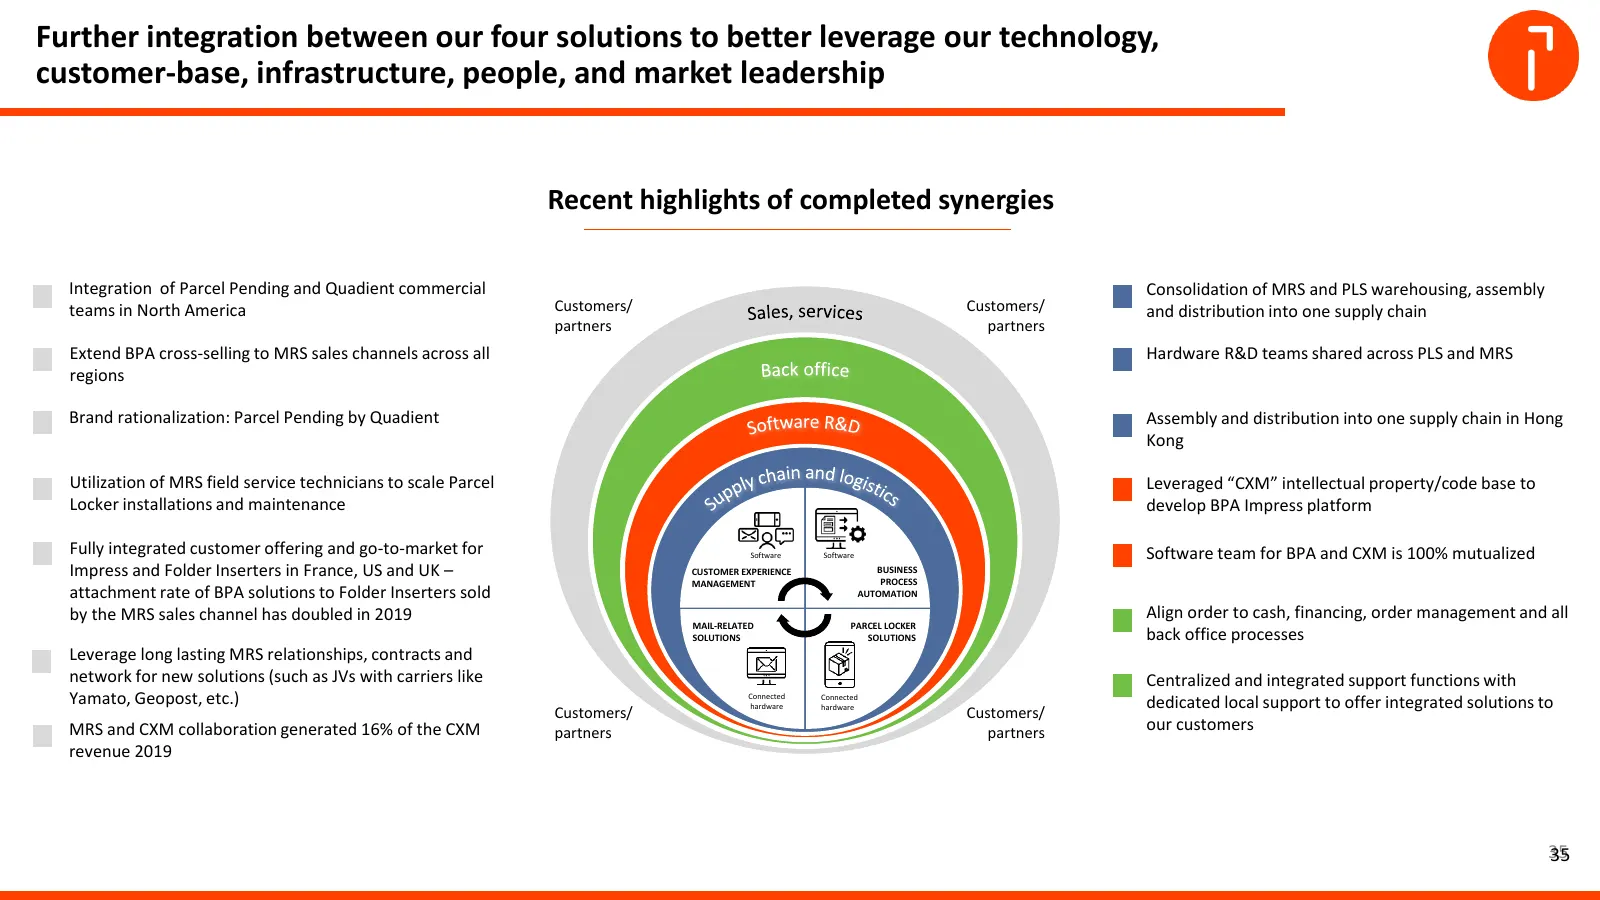
Further integration between our four solutions to better leverage our technology, customer-base, infrastructure, people, and market leadership Recent highlights of completed synergies Integration of Parcel Pending and Quadient commercial Consolidation of MRS and PLS warehousing, assembly teams in No

Slide 36: 2020 Outlook
2020 Outlook Geoffrey GODET CEO 36
Slide 37: 2020 outlook
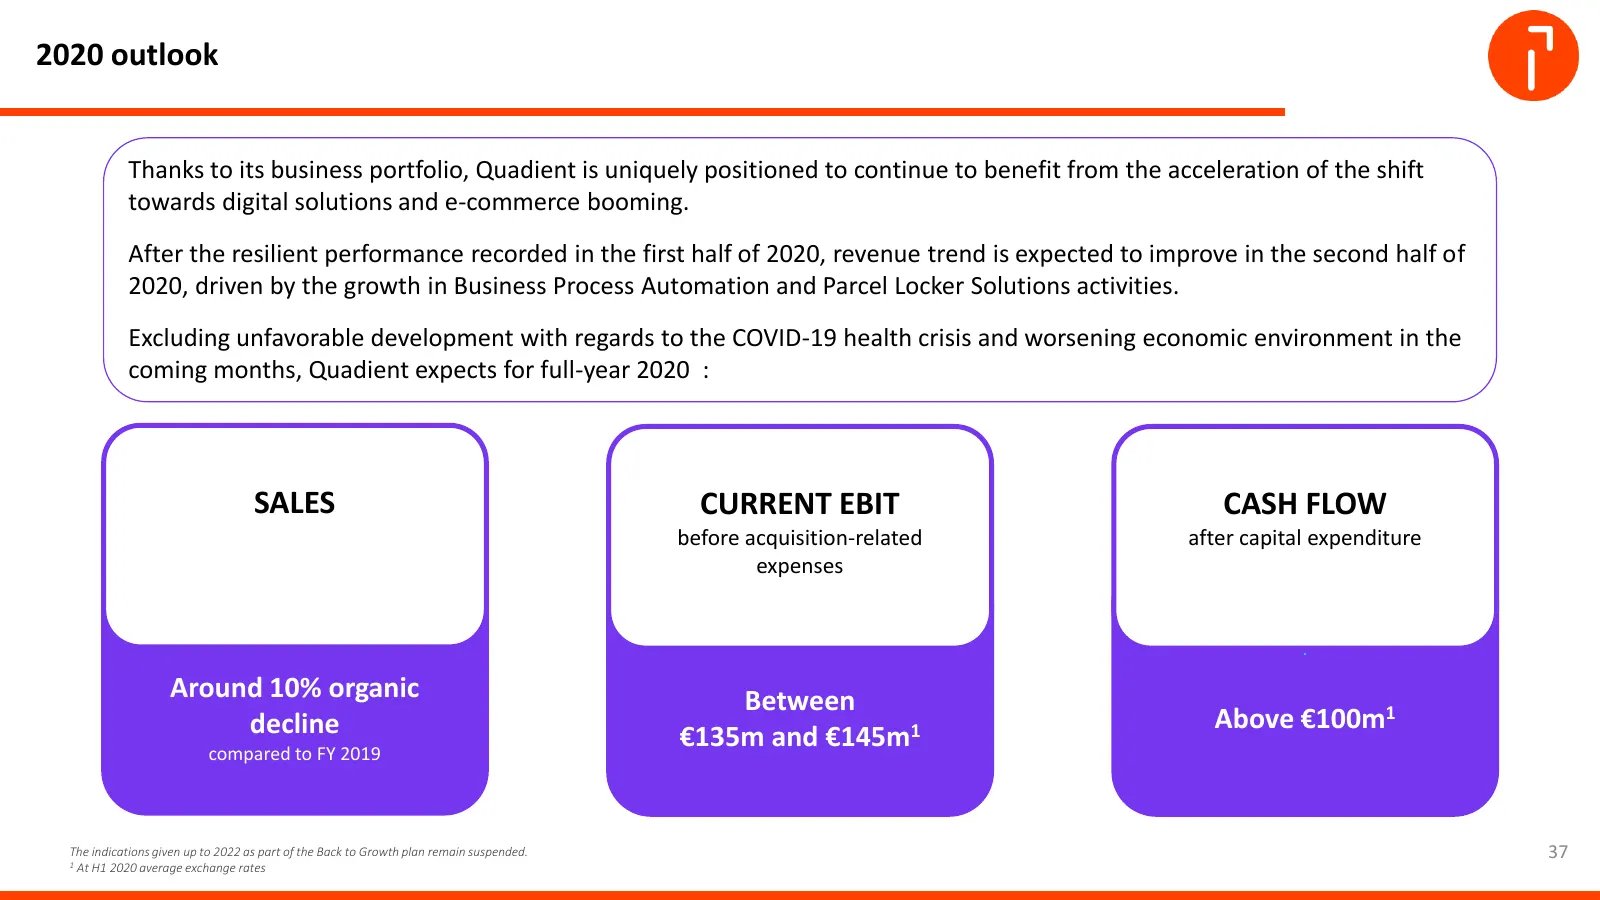
2020 outlook Thanks to its business portfolio, Quadient is uniquely positioned to continue to benefit from the acceleration of the shift towards digital solutions and e-commerce booming. After the resilient performance recorded in the first half of 2020, revenue trend is expected to improve in the s

Slide 38: Appendix
Appendix 38
Slide 39: P&L
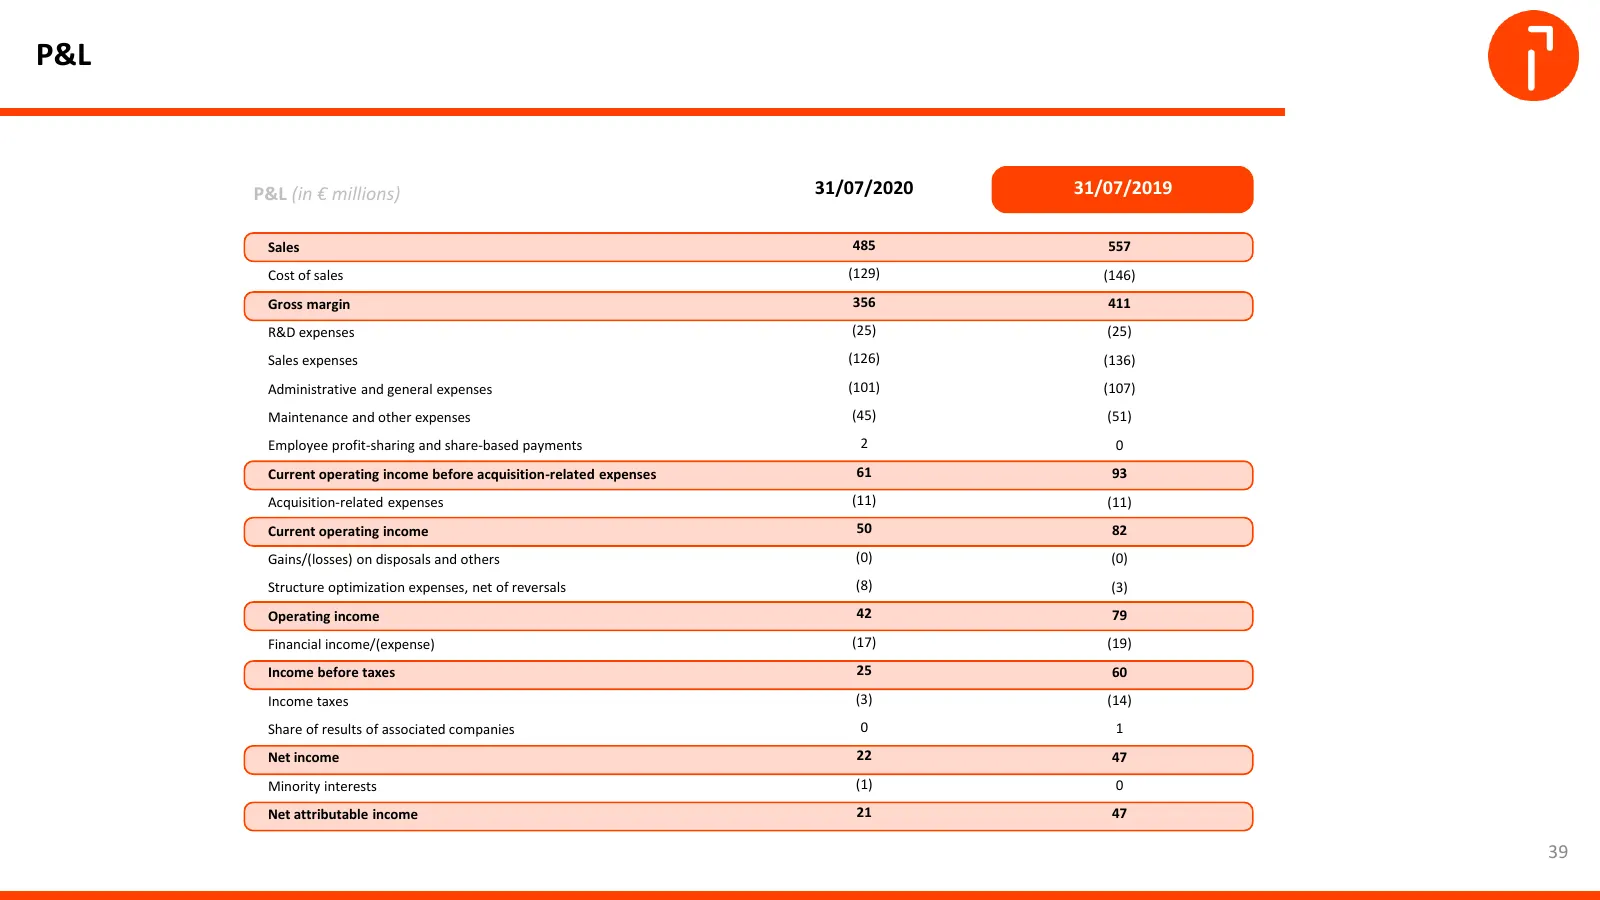
P&L P&L (in € millions) 31/07/2020 31/07/2019 Sales 485 557 Cost of sales (129) (146) Gross margin 356 411 R&D expenses (25) (25) Sales expenses (126) (136) Administrative and general expenses (101) (107) Maintenance and other expenses (45) (51) Employee profit-sharing and share-based payments 2 0 C
Slide 40: Consolidated balance sheet (1/2)
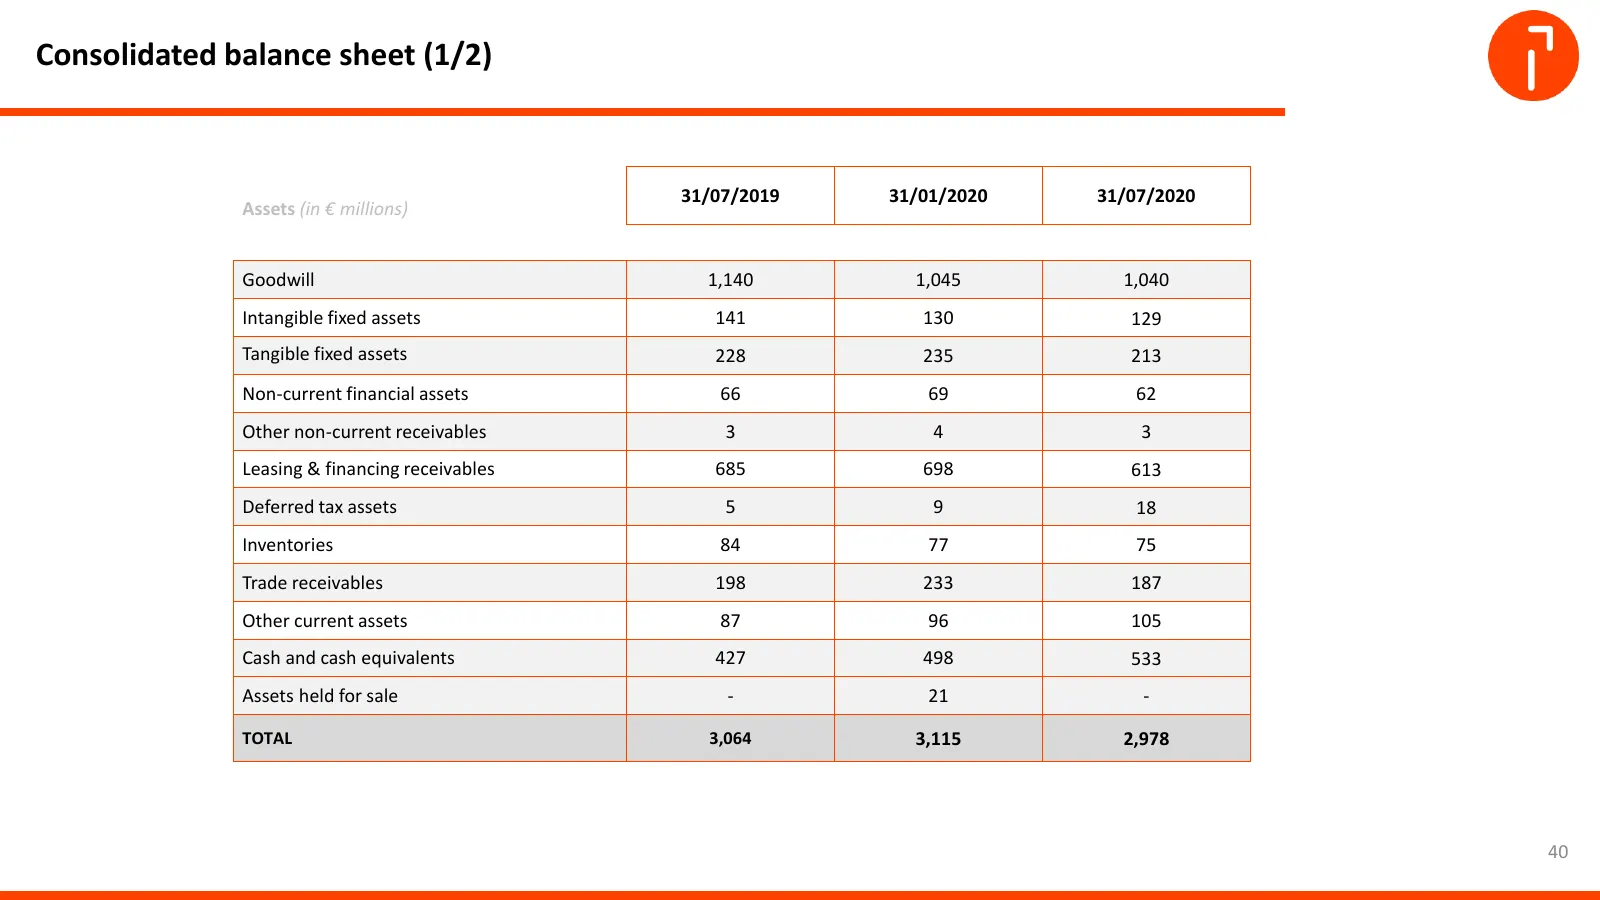
Consolidated balance sheet (1/2) 31/07/2019 31/01/2020 31/07/2020 Assets (in € millions) Goodwill 1,140 1,045 1,040 Intangible fixed assets 141 130 129 Tangible fixed assets 228 235 213 Non-current financial assets 66 69 62 Other non-current receivables 3 4 3 Leasing & financing receivables 685 698
Slide 41: Consolidated balance sheet (2/2)
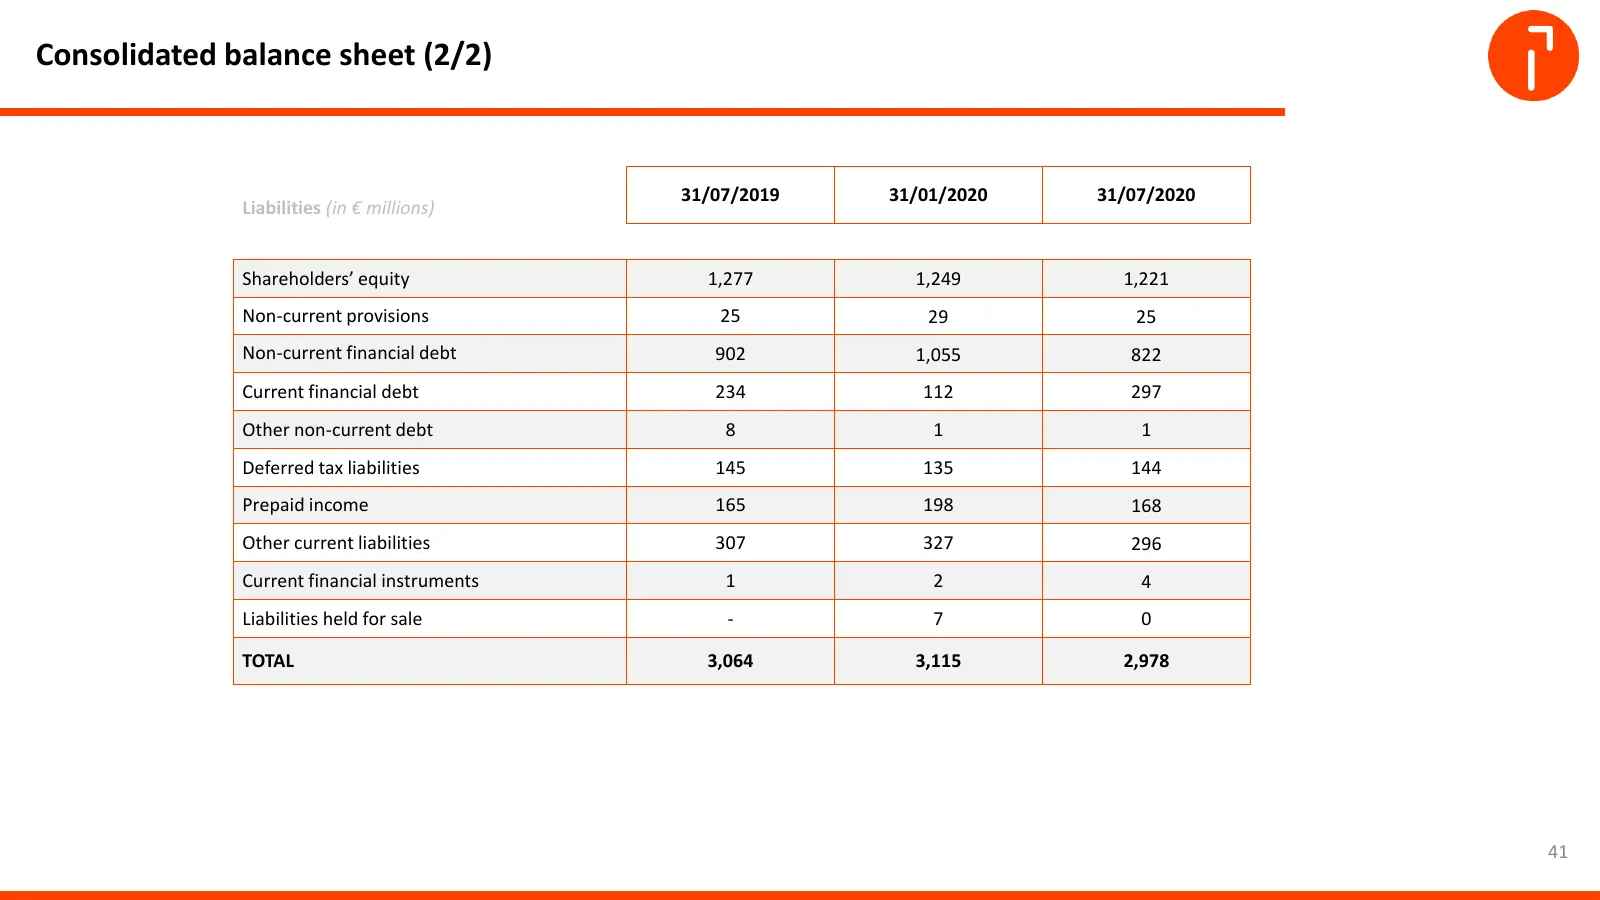
Consolidated balance sheet (2/2) 31/07/2019 31/01/2020 31/07/2020 Liabilities (in € millions) Shareholders’ equity 1,277 1,249 1,221 Non-current provisions 25 29 25 Non-current financial debt 902 1,055 822 Current financial debt 234 112 297 Other non-current debt 8 1 1 Deferred tax liabilities 145 1
Slide 42: All financial covenants easily met
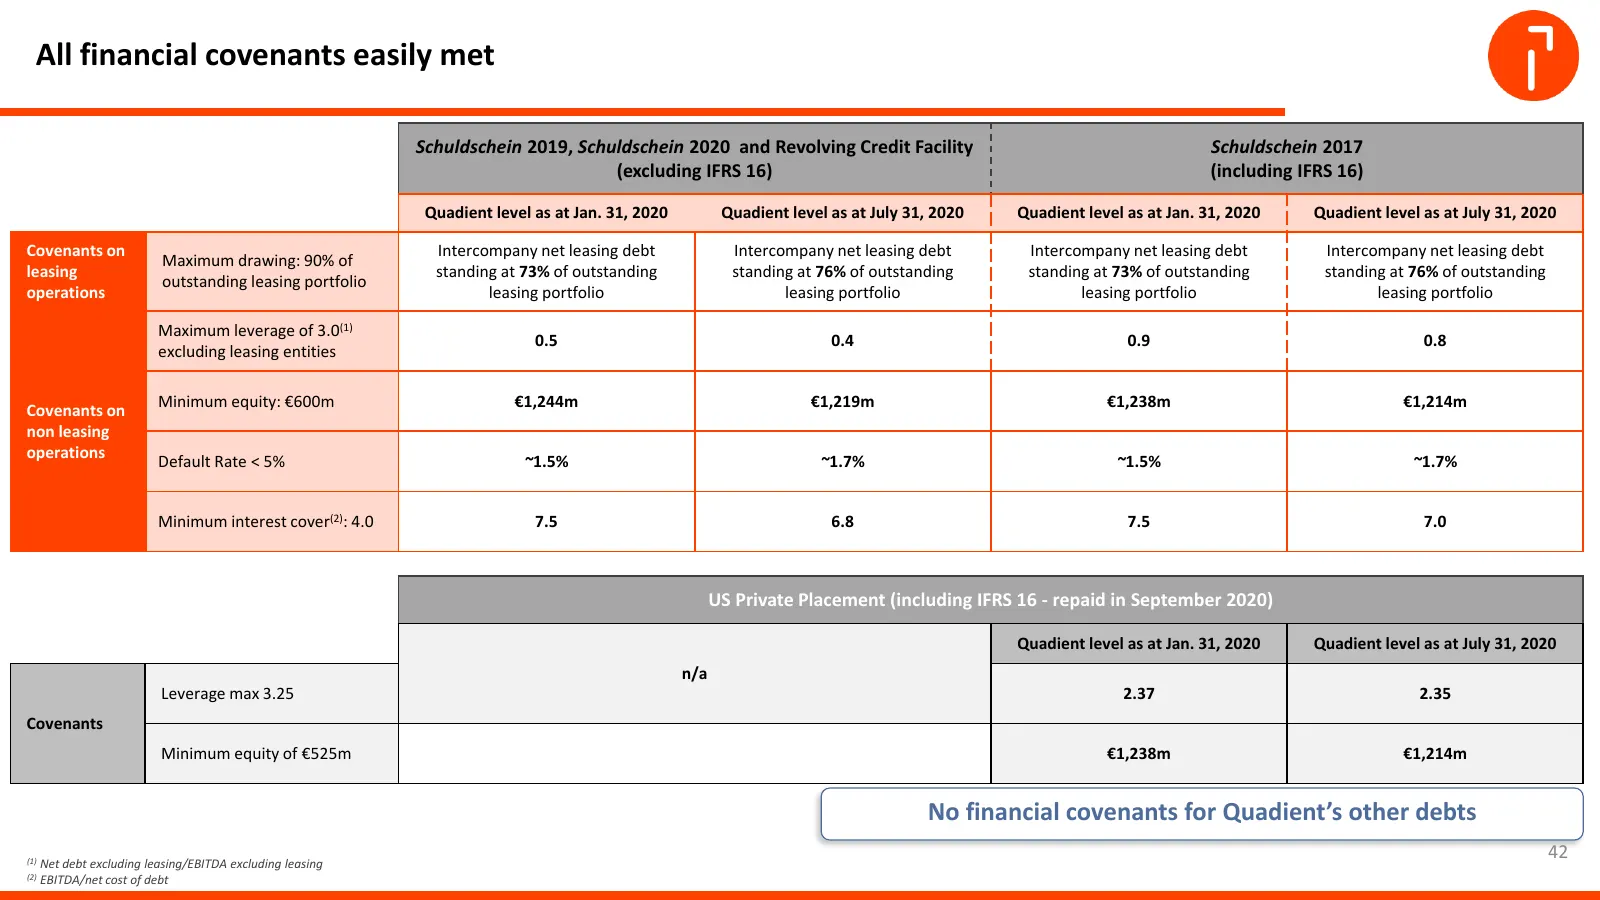
All financial covenants easily met Schuldschein 2019, Schuldschein 2020 and Revolving Credit Facility Schuldschein 2017 (excluding IFRS 16) (including IFRS 16) Quadient level as at Jan. 31, 2020 Quadient level as at July 31, 2020 Quadient level as at Jan. 31, 2020 Quadient level as at July 31, 2020
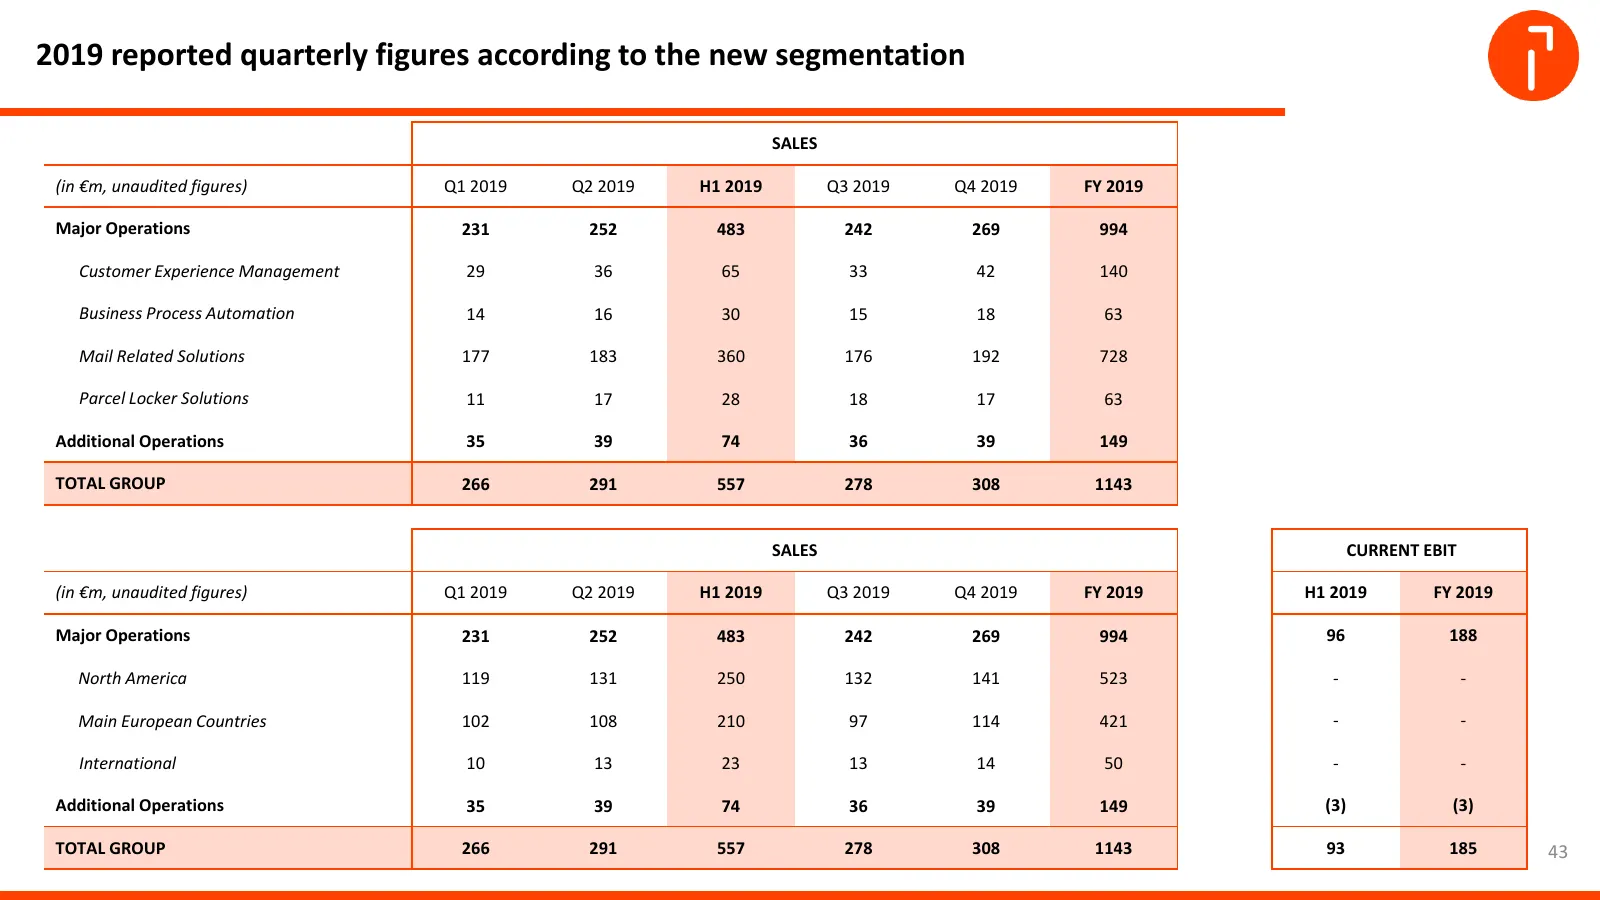
Slide 43: 2019 reported quarterly figures according to the new segmentation
2019 reported quarterly figures according to the new segmentation SALES (in €m, unaudited figures) Q1 2019 Q2 2019 H1 2019 Q3 2019 Q4 2019 FY 2019 Major Operations 231 252 483 242 269 994 Customer Experience Management 29 36 65 33 42 140 Business Process Automation 14 16 30 15 18 63 Mail Related Sol
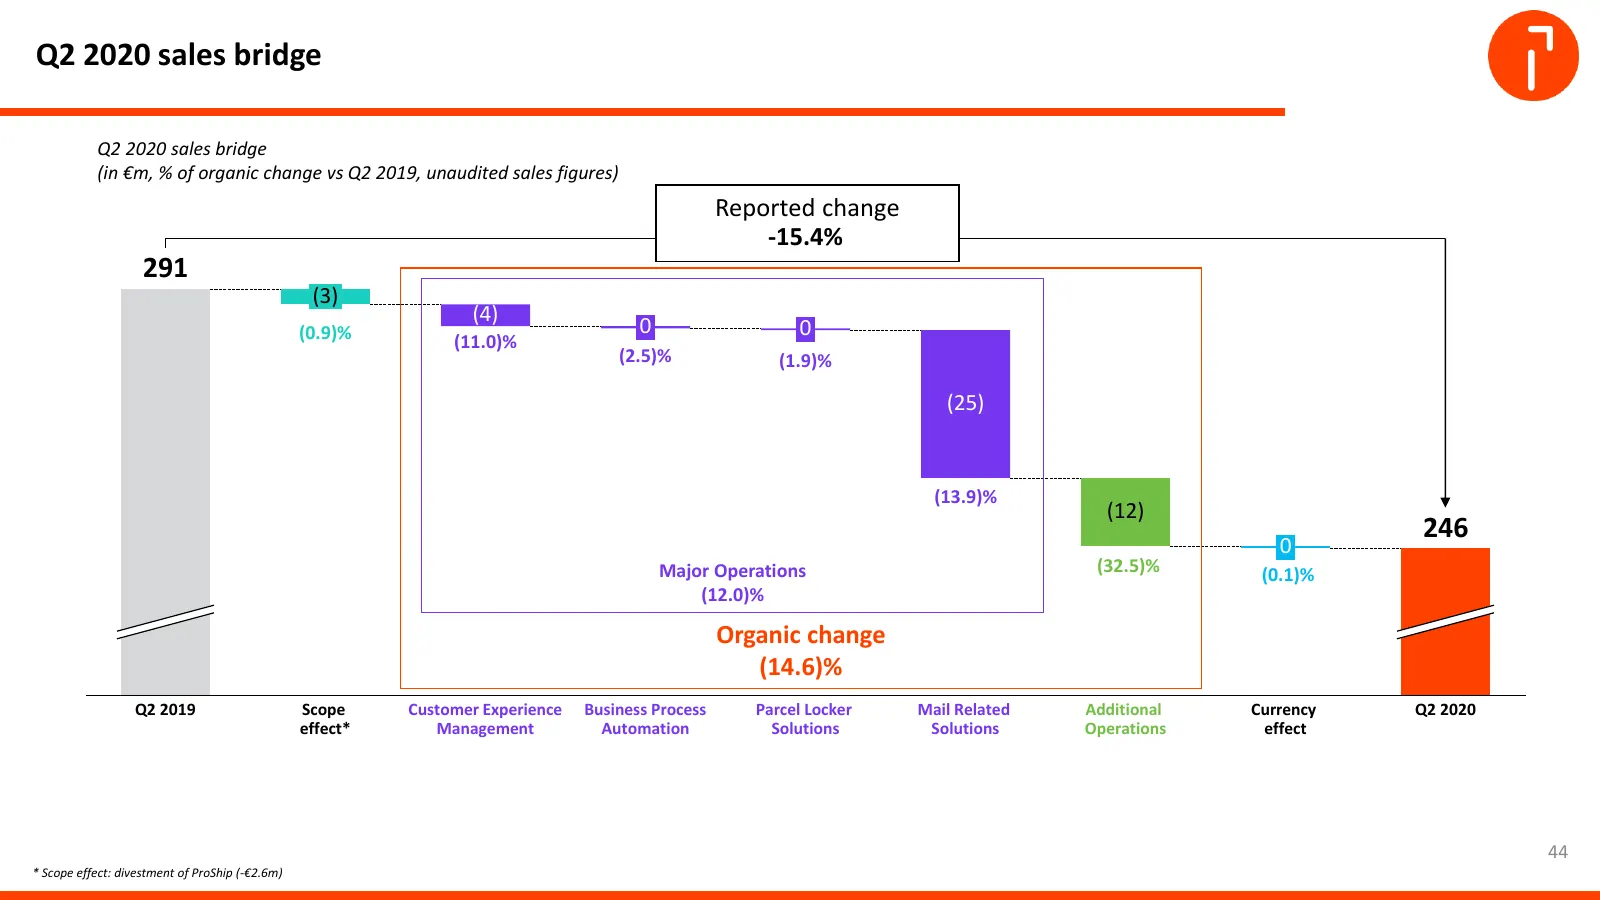
Slide 44: Q2 2020 sales bridge
Q2 2020 sales bridge Q2 2020 sales bridge (in €m, % of organic change vs Q2 2019, unaudited sales figures) Reported change -15.4% 291 (3) (4) (0.9)% 0 0 (11.0)% (2.5)% (1.9)% (25) (13.9)% (12) 246 0 Major Operations (32.5)% (0.1)% (12.0)% Organic change (14.6)% Q2 2019 Scope Customer Experience Busi
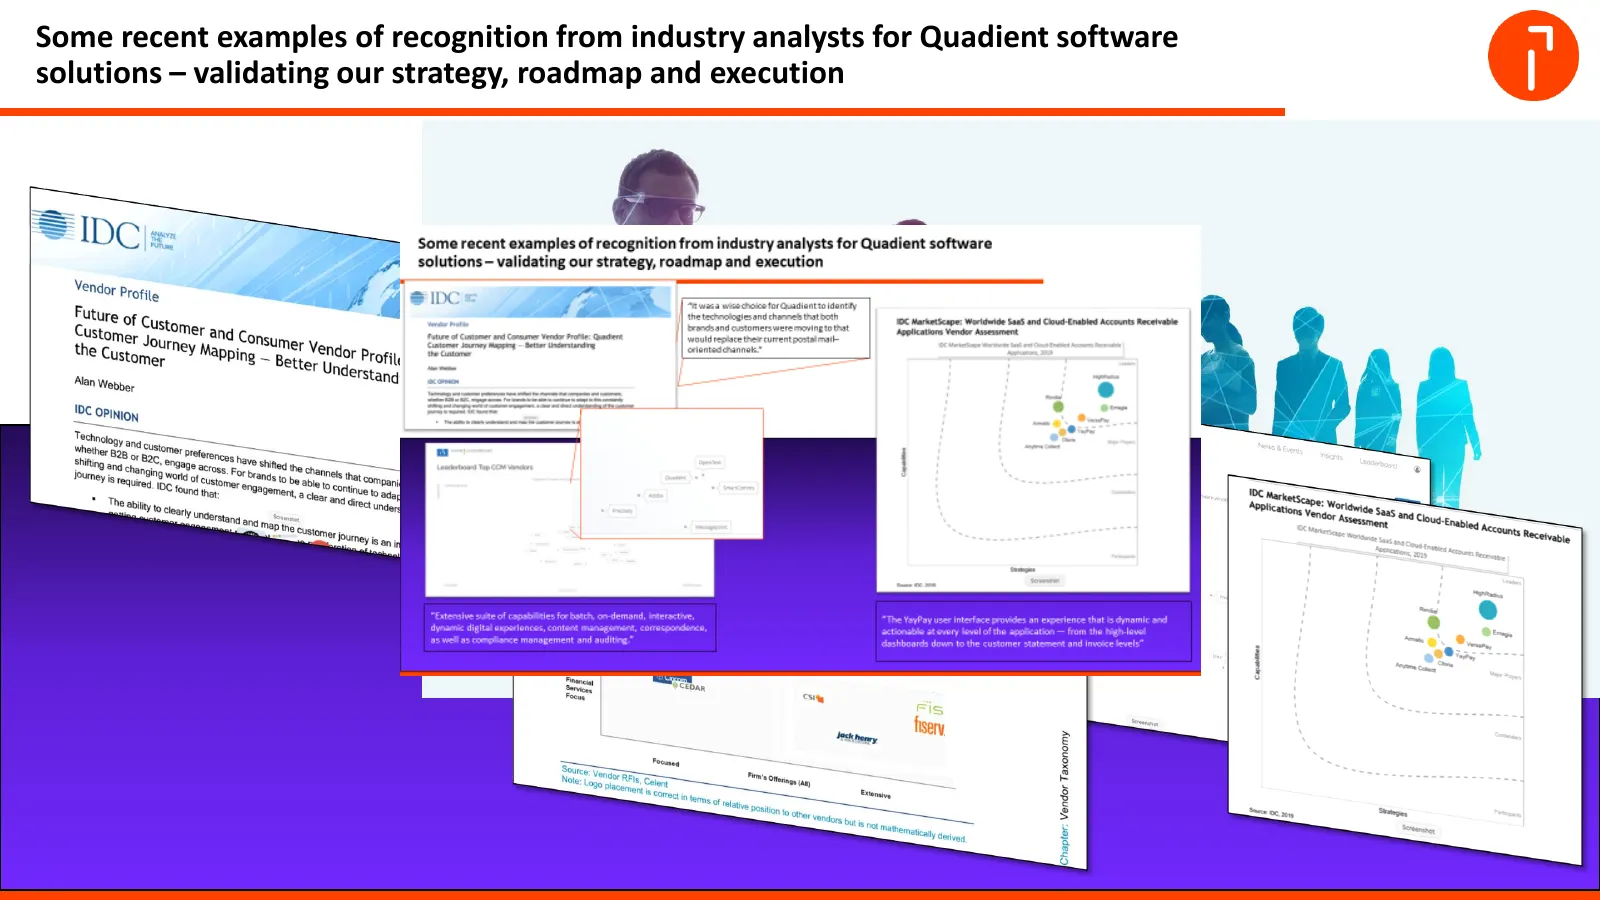
Slide 45: Recognition from industry analysts for Quadient software solutions
Some recent examples of recognition from industry analysts for Quadient software solutions – validating our strategy, roadmap and execution 45

Slide 46: Investor Relations Team
INVESTOR RELATIONS TEAM financial-communication@quadient.com https://invest.quadient.com/ NEXT MEETINGS • CXM - Education session: October 2020 • Q3 2020 sales: 24 November 2020 46 © Quadient
Source: Internet Archive copy of resources.quadient.com
More decks from Quadient SA
 H1 2026 Earnings Presentation43 slides · Sep 23, 2026
 Shareholder Meeting (June 2026)41 slides · Jun 18, 2026
 FY2025 Earnings Presentation52 slides · Mar 25, 2026
 Q3 2025 Earnings Presentation31 slides · Dec 2, 2025
 H1 2025 Earnings Presentation40 slides · Sep 24, 2025
 Shareholder Meeting (June 2025)35 slides · Jun 13, 2025