Cloudberry Clean Energy ASA · OSL:CLOUD
Cloudberry Clean Energy ASA — Investor Day (September 2023)
57 slides from Cloudberry Clean Energy ASA's investor day presentation, Sep 5, 2023
Slide 1: Capital Markets Day 5 September 2023
Capital Markets Day 5 September 2023 © Cloudberry
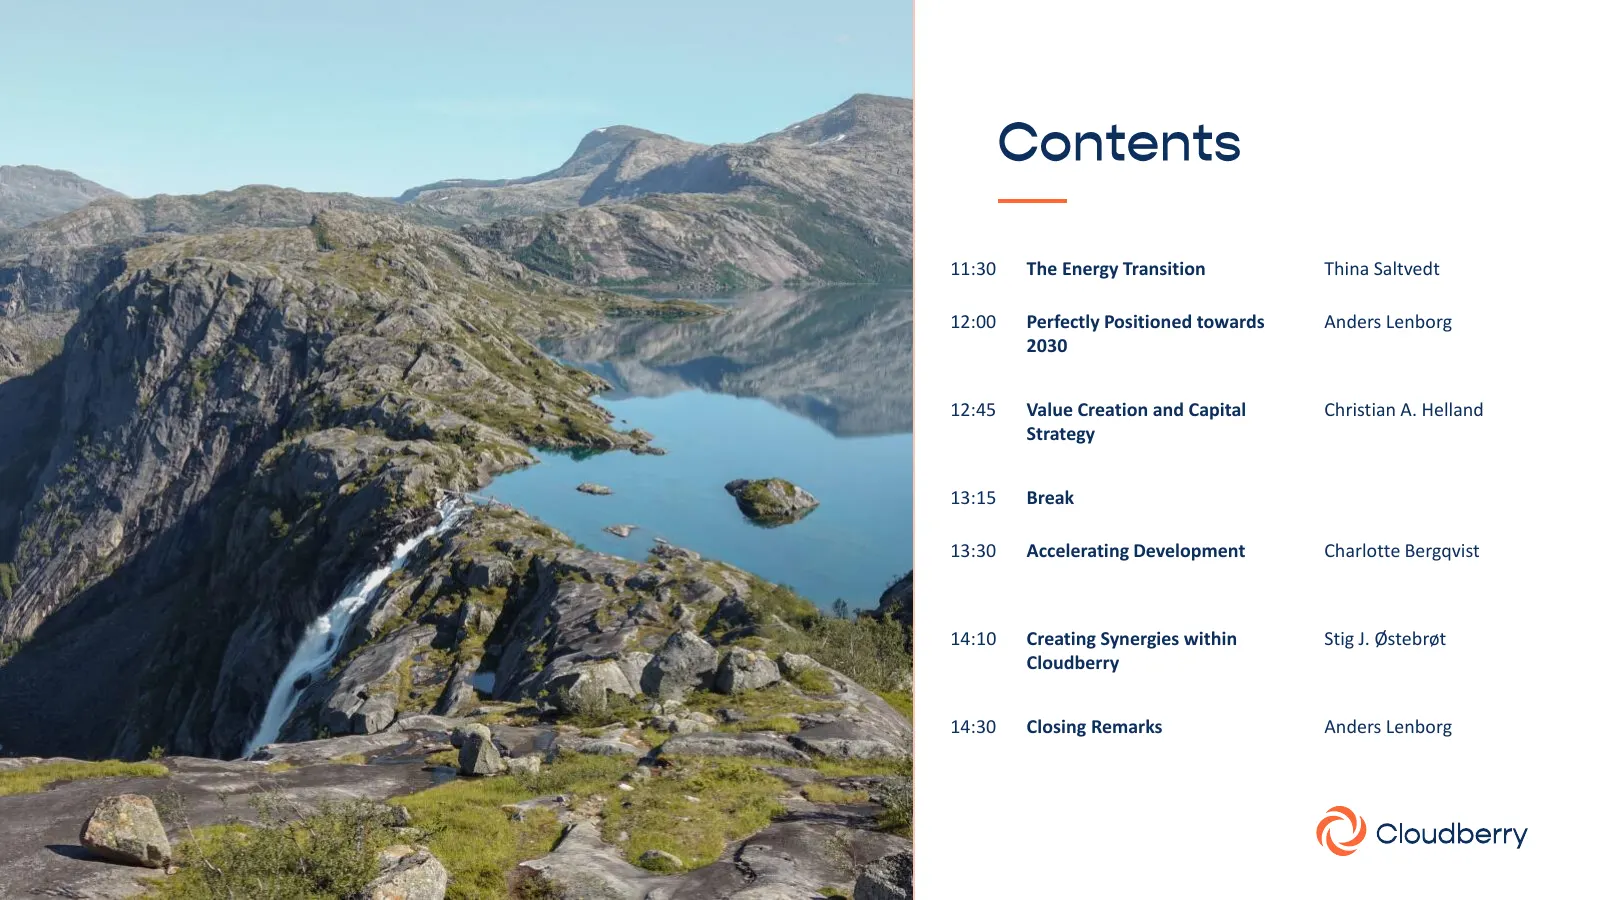
Slide 2: Agenda
11:30 The Energy Transition Thina Saltvedt 12:00 Perfectly Positioned towards Anders Lenborg 2030 12:45 Value Creation and Capital Christian A. Helland Strategy 13:15 Break 13:30 Accelerating Development Charlotte Bergqvist 14:10 Creating Synergies within Stig J. Østebrøt Cloudberry 14:30 Closing Re
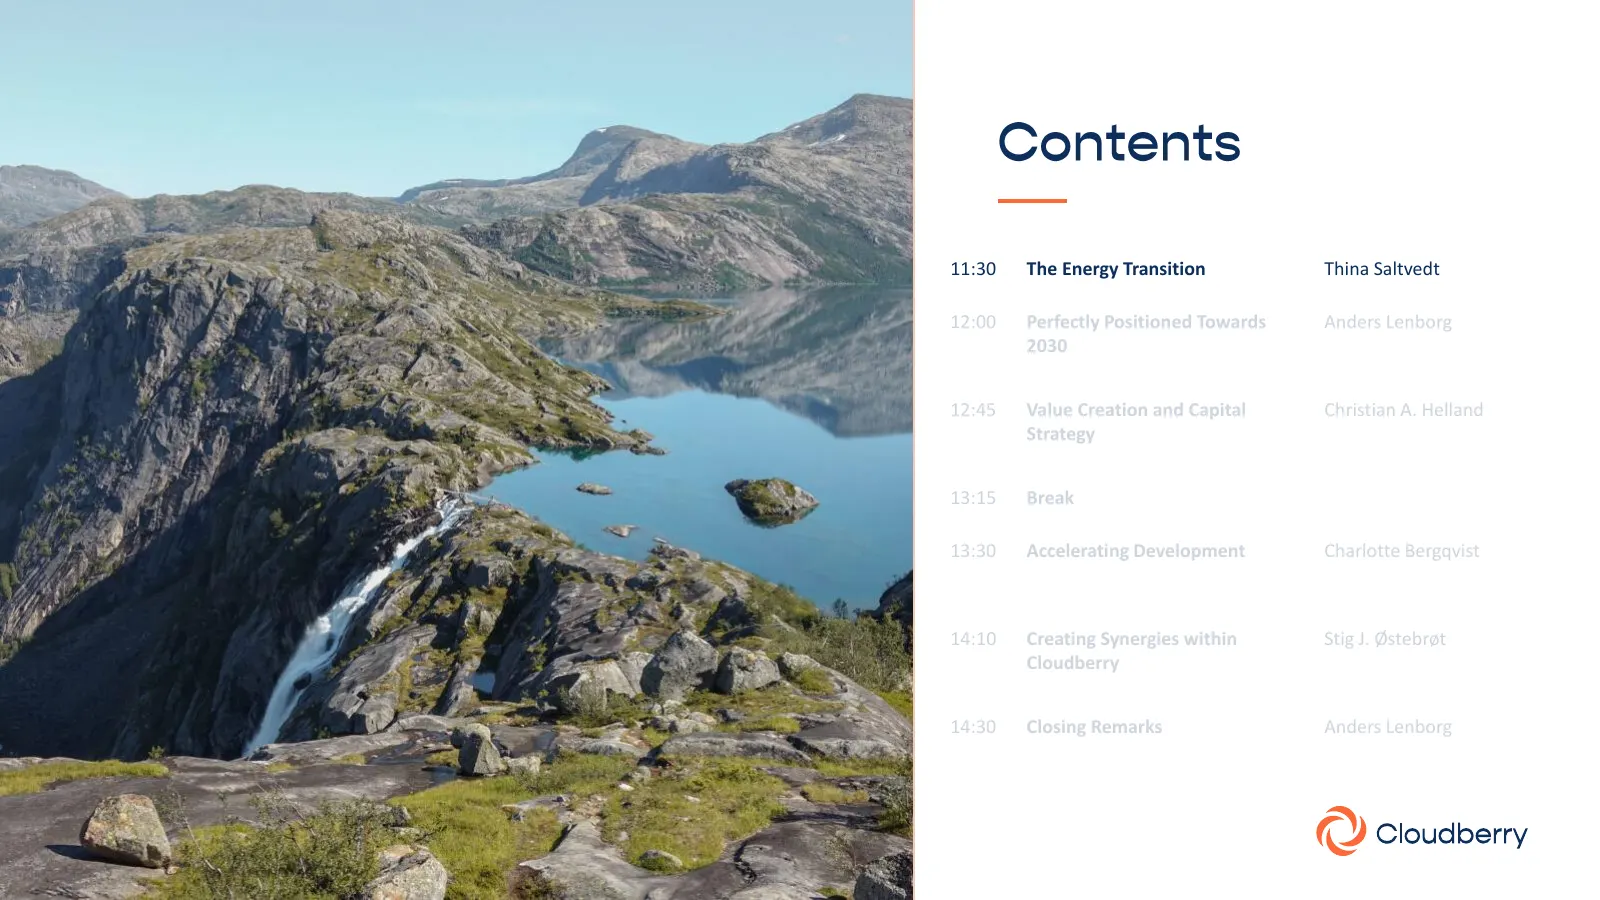
Slide 3: Agenda
11:30 The Energy Transition Thina Saltvedt 12:00 Perfectly Positioned Towards Anders Lenborg 2030 12:45 Value Creation and Capital Christian A. Helland Strategy 13:15 Break 13:30 Accelerating Development Charlotte Bergqvist 14:10 Creating Synergies within Stig J. Østebrøt Cloudberry 14:30 Closing Re
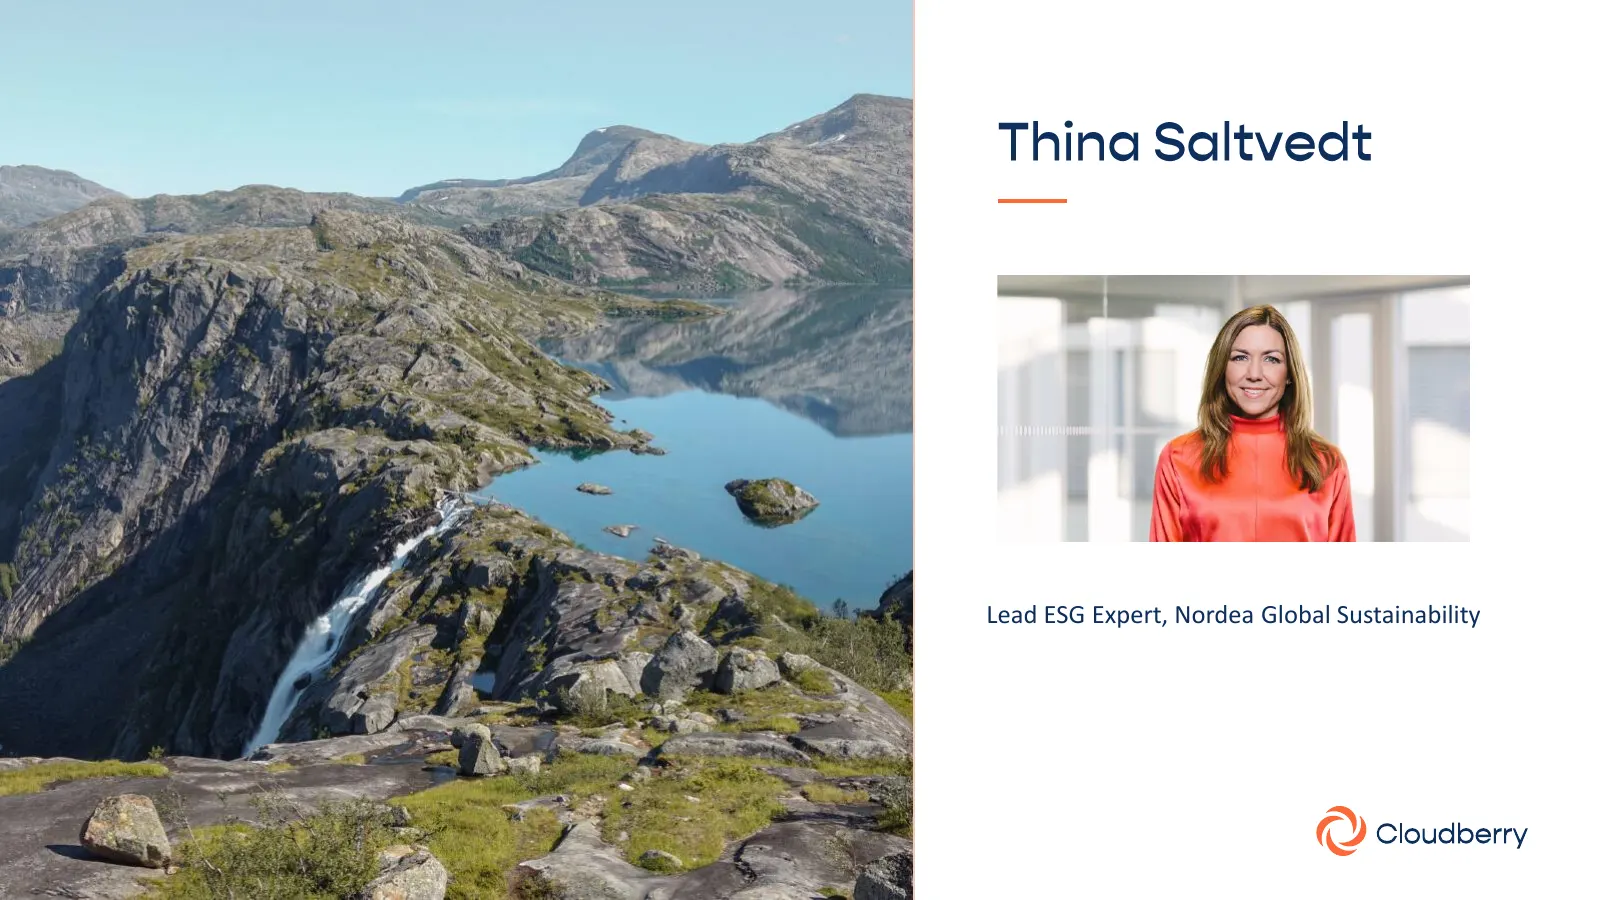
Slide 4: Lead ESG Expert, Nordea Global Sustainability
Lead ESG Expert, Nordea Global Sustainability
Slide 5: Slides presented separately
Slides presented separately Q Cloudberry
Slide 6: Agenda
11:30 The Energy Transition Thina Saltvedt 12:00 Perfectly Positioned towards Anders Lenborg 2030 12:45 Value Creation and Capital Christian A. Helland Strategy 13:15 Break 13:30 Accelerating Development Charlotte Bergqvist 14:10 Creating Synergies within Stig J. Østebrøt Cloudberry 14:30 Closing Re
Slide 7: Chief Executive Officer
Chief Executive Officer al@cloudberry.no
Slide 8: Established the Nordic platform with a clear strategy towards 2030
Established the Nordic platform with a clear strategy towards 2030 We have access to exclusive projects throughout the Nordics and we cover and create value through the full life cycle We have a robust balance sheet, we have the cash generating assets and we have the flexibility 8
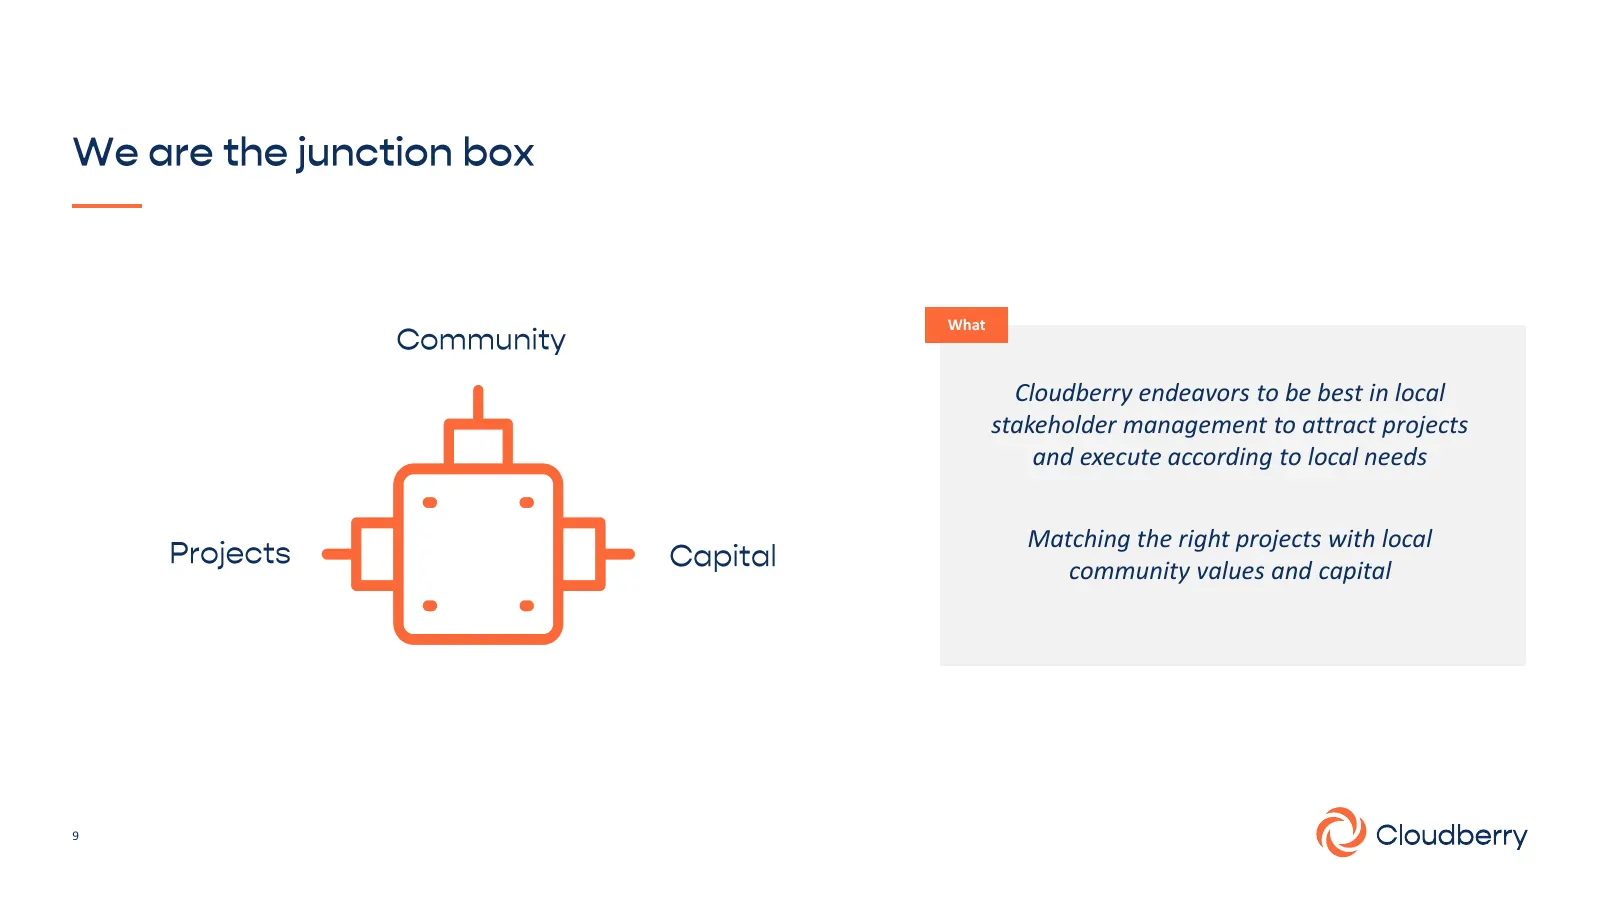
Slide 9: Best in local stakeholder management
What Cloudberry endeavors to be best in local stakeholder management to attract projects and execute according to local needs Matching the right projects with local community values and capital 9
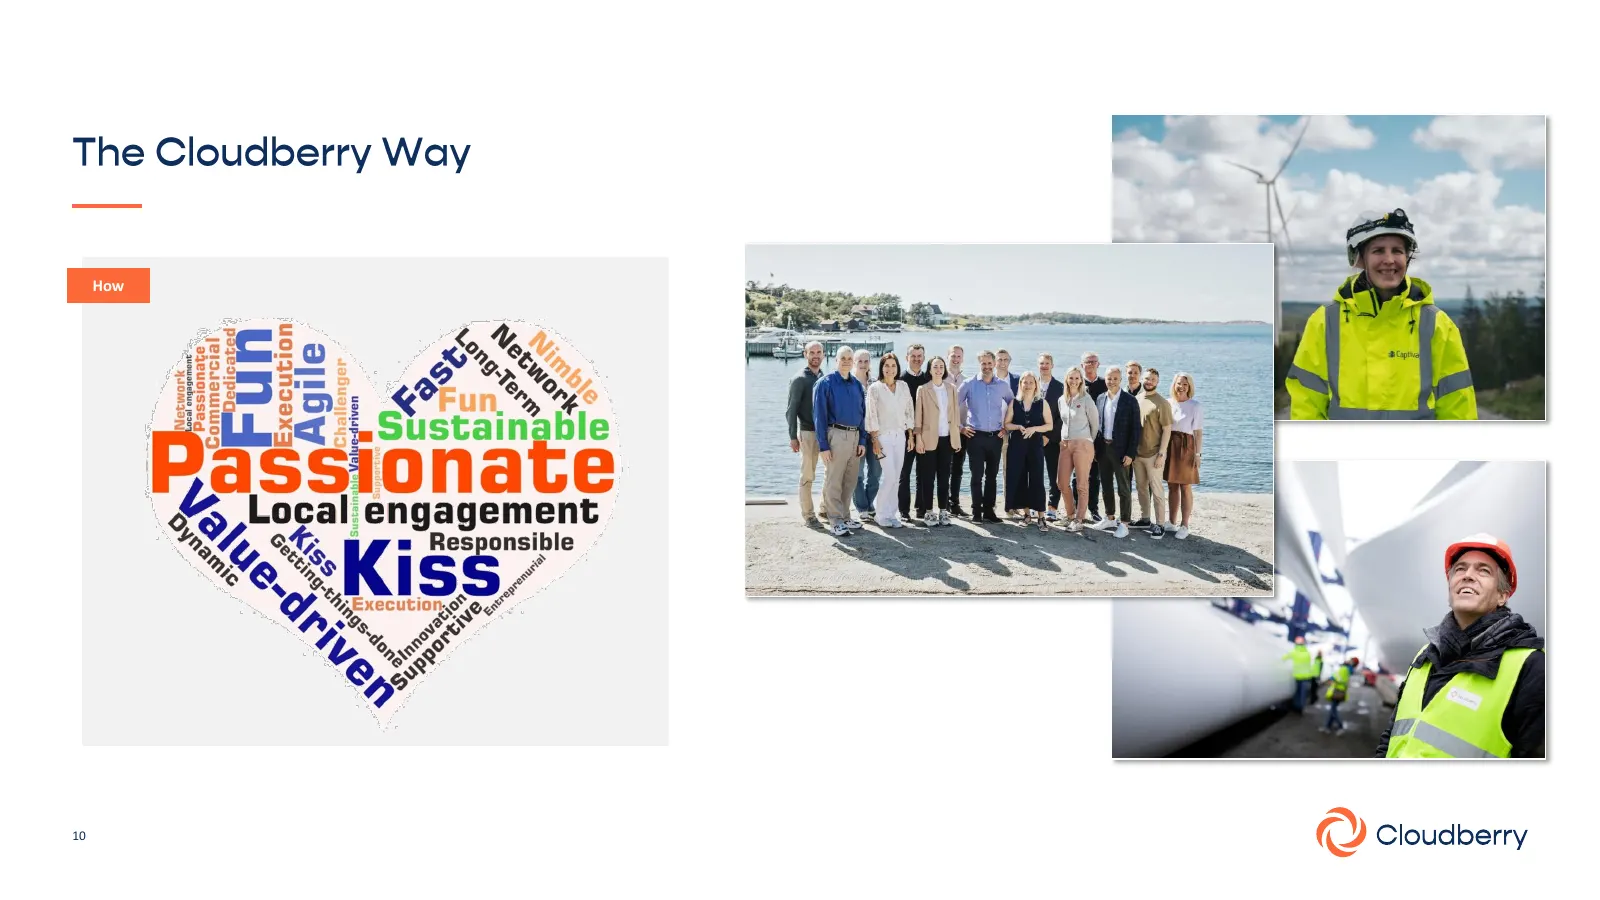
Slide 10: The Cloudberry Way
The Cloudberry Way iis oO. Sri, 5S Sree > Seay Prune? pect la oe yassiona $ Local | engagement N/, °h Ki Res| onsible “e SS” “Q, Kiss ys 3 ee 10 QR Cloudberry
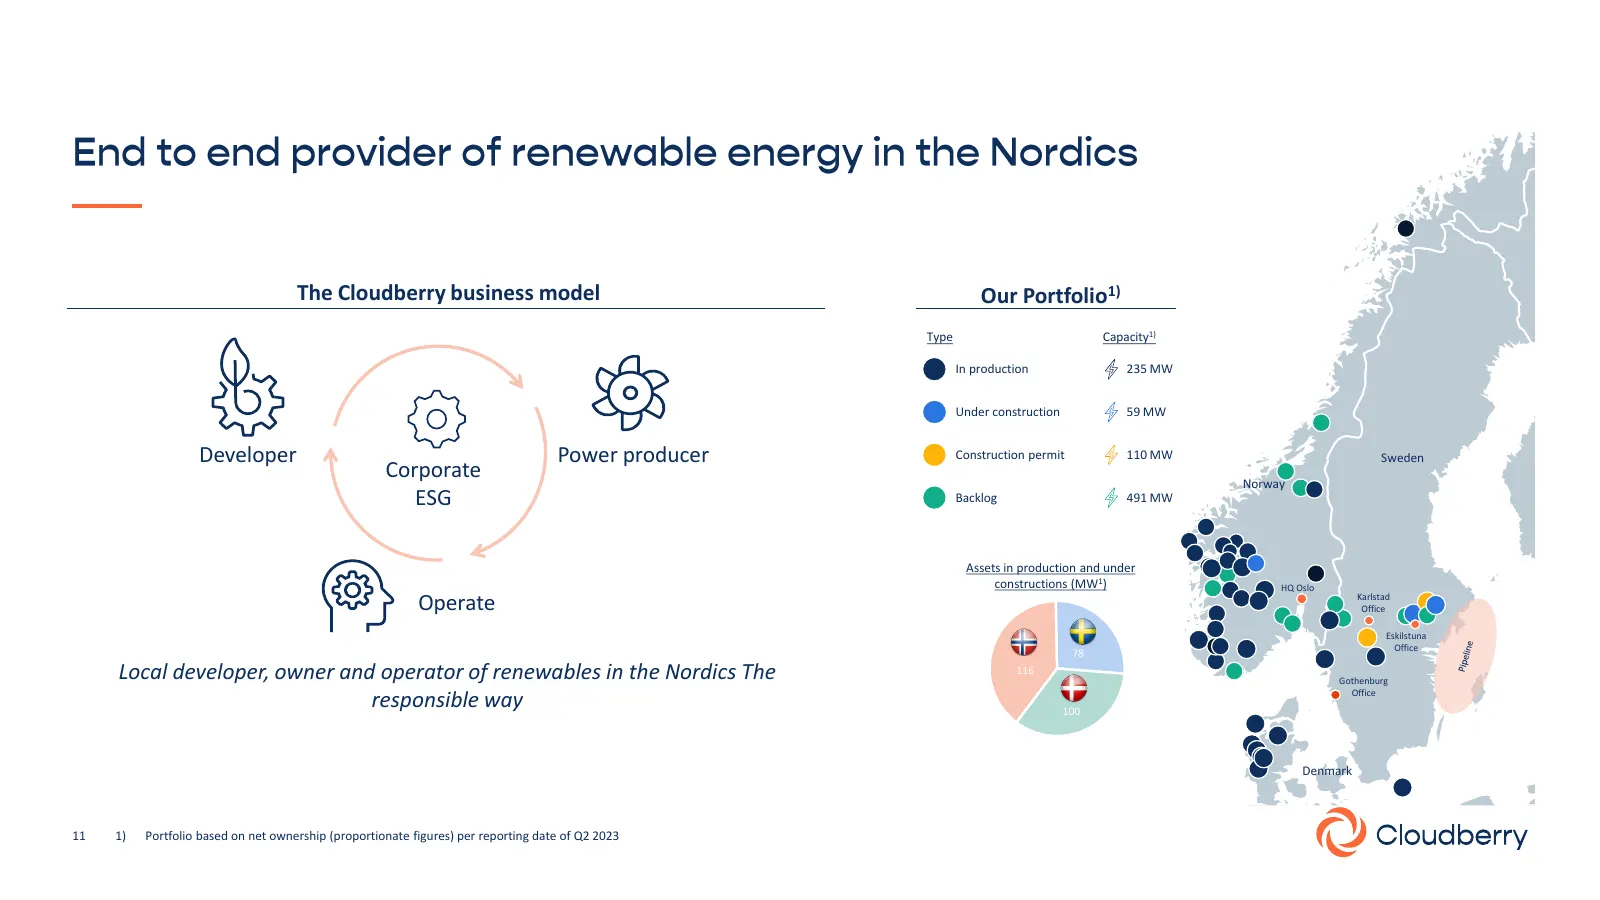
Slide 11: The Cloudberry business model and portfolio
The Cloudberry business model Our Portfolio1) Type Capacity1) In production 235 MW Under construction 59 MW Developer Power producer Construction permit 110 MW Sweden Corporate Norway ESG Backlog 491 MW Assets in production and under constructions (MW1) HQ Oslo Karlstad Operate Office Eskilstuna Off
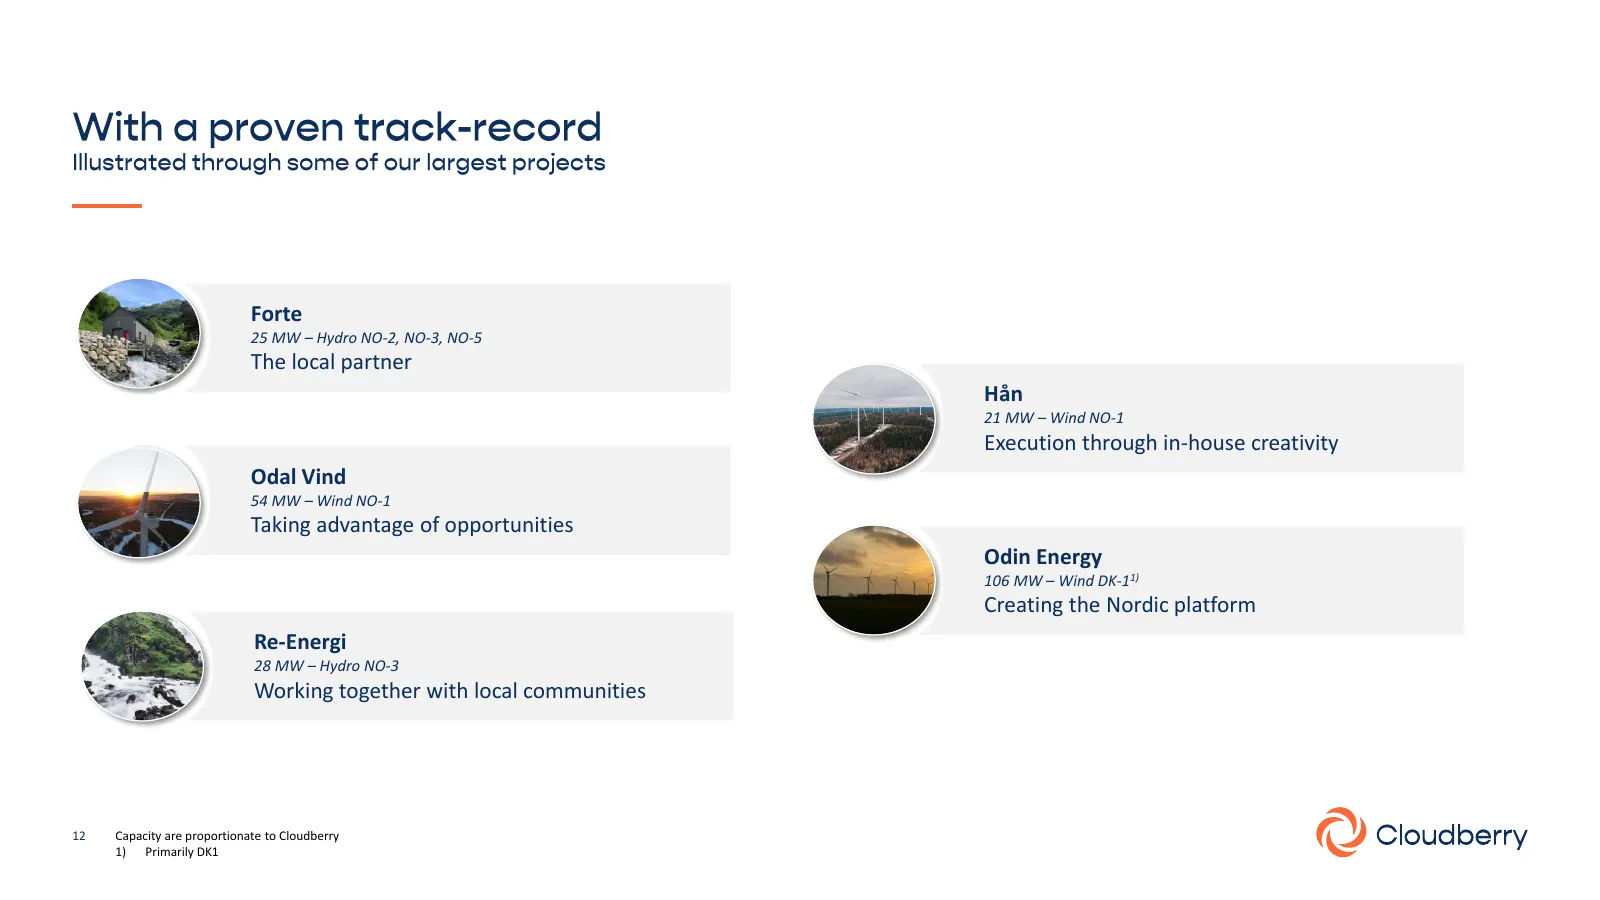
Slide 12: Local partners and portfolio companies
Forte 25 MW – Hydro NO-2, NO-3, NO-5 The local partner Hån 21 MW – Wind NO-1 Execution through in-house creativity Odal Vind 54 MW – Wind NO-1 Taking advantage of opportunities Odin Energy 106 MW – Wind DK-11) Creating the Nordic platform Re-Energi 28 MW – Hydro NO-3 Working together with local comm
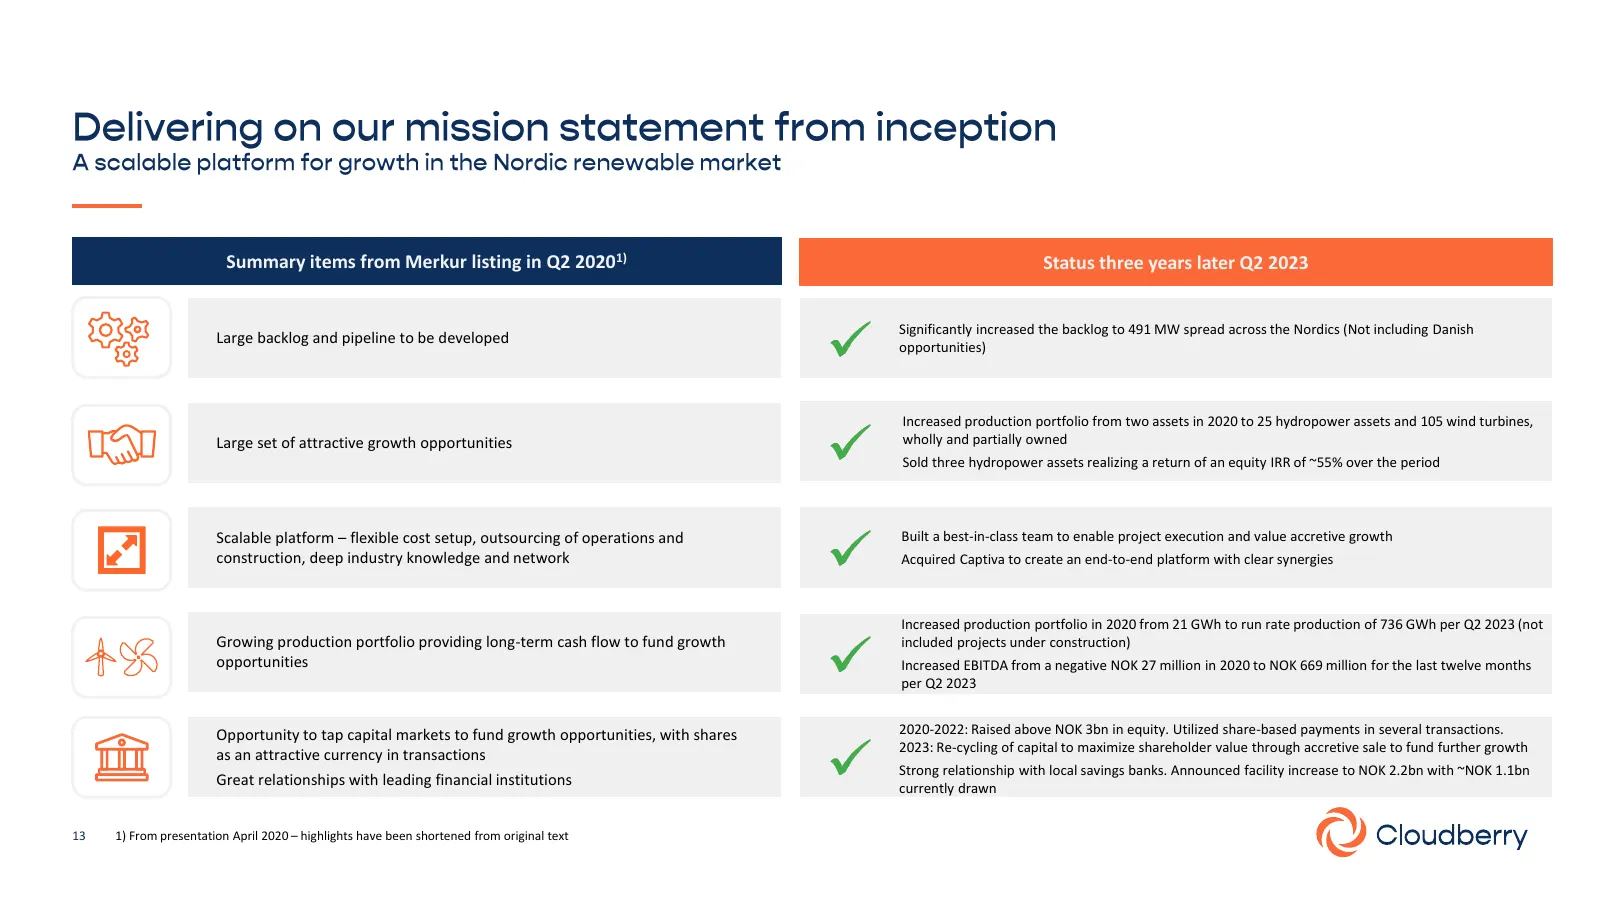
Slide 13: Status three years after Merkur listing
Summary items from Merkur listing in Q2 20201) Status three years later Q2 2023 Significantly increased the backlog to 491 MW spread across the Nordics (Not including Danish Large backlog and pipeline to be developed opportunities) Increased production portfolio from two assets in 2020 to 25 hydropo
Slide 14: Growing production portfolio
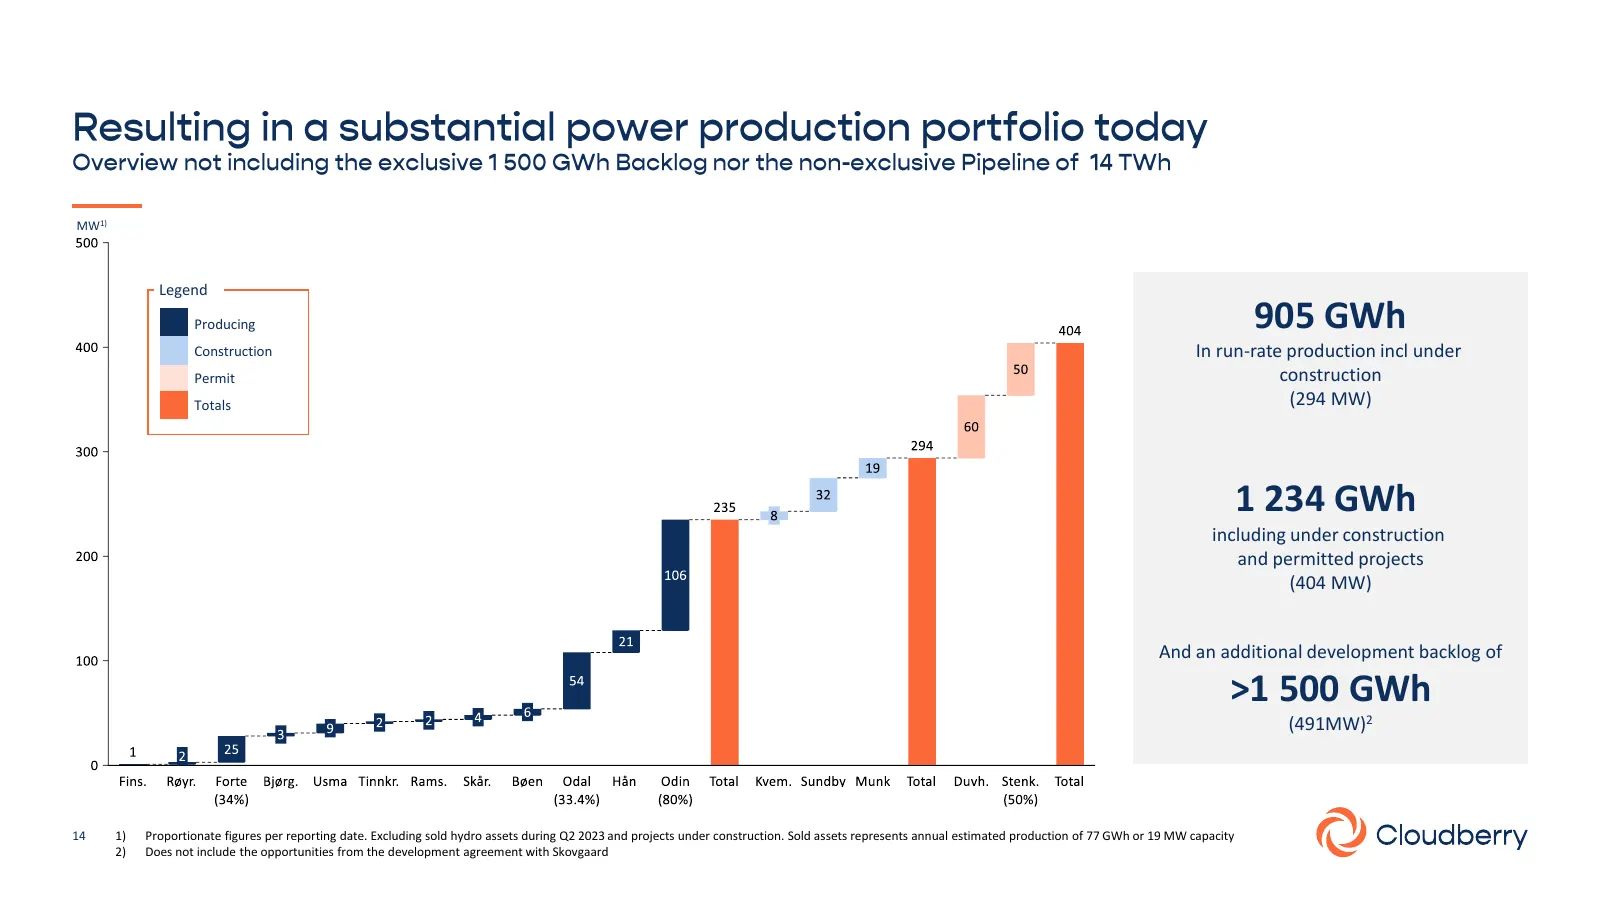
MW1) Legend Producing 905 GWh Construction In run-rate production incl under Permit construction Totals (294 MW) 1 234 GWh including under construction and permitted projects (404 MW) And an additional development backlog of >1 500 GWh (491MW)2 14 1) Proportionate figures per reporting date. Excludi
Slide 15: Annual historical production
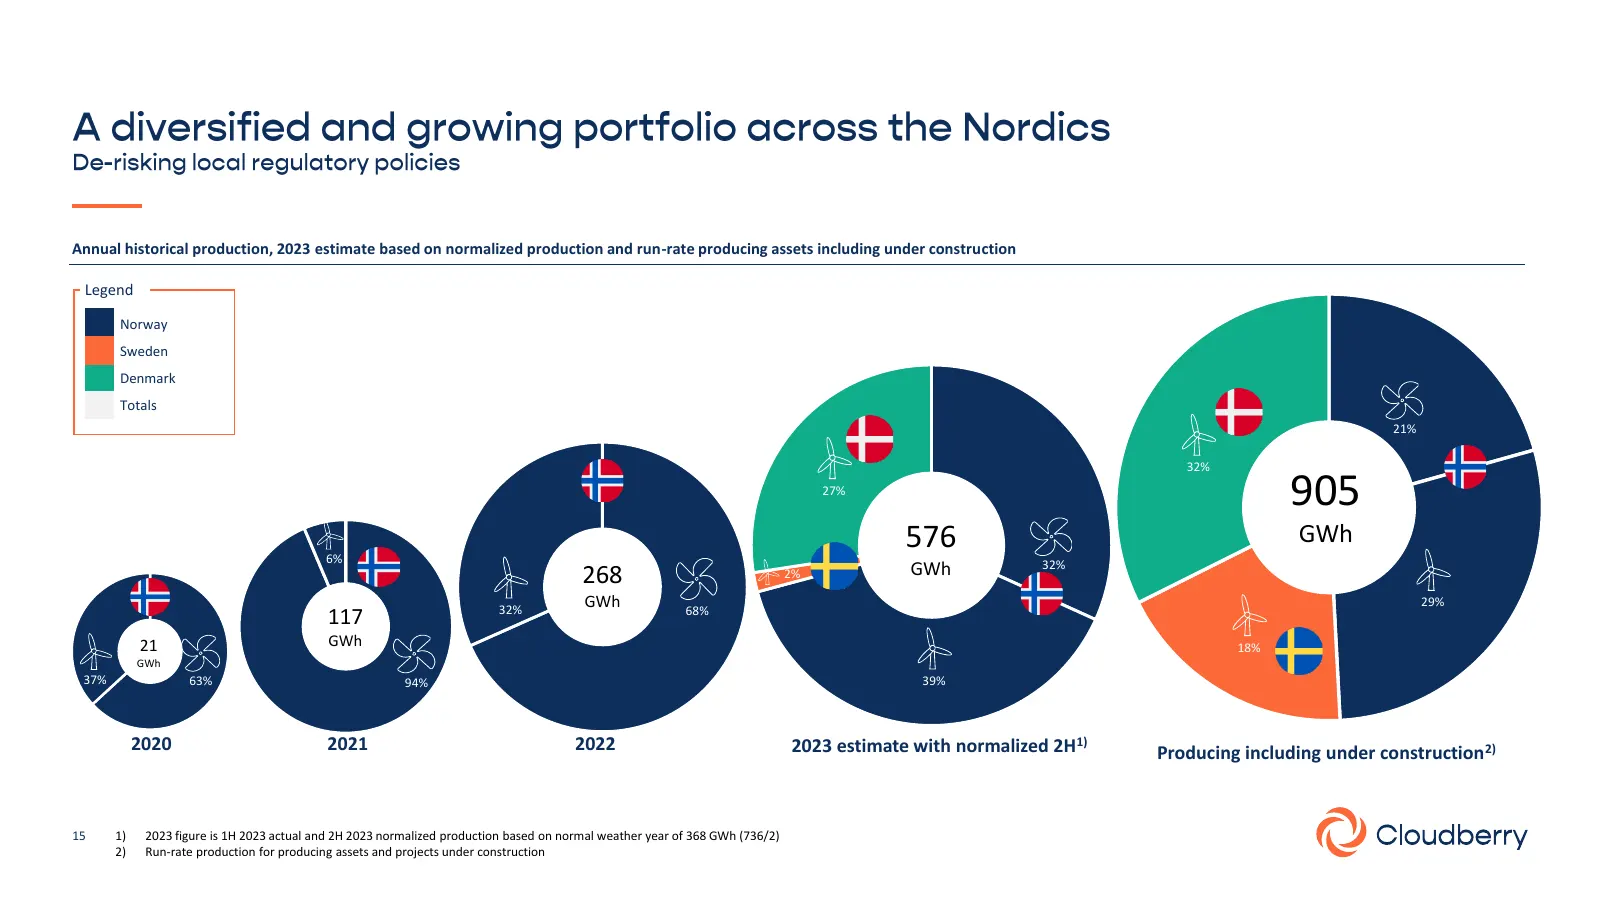
Annual historical production, 2023 estimate based on normalized production and run-rate producing assets including under construction Legend Norway Sweden Denmark Totals 21% 32% 27% 905 576 GWh 6% 32% 268 2% GWh 32% GWh 68% 29% 117 21 GWh 18% GWh 37% 63% 94% 39% 2020 2021 2022 2023 estimate with nor
Slide 16: Normalized production profile by technology
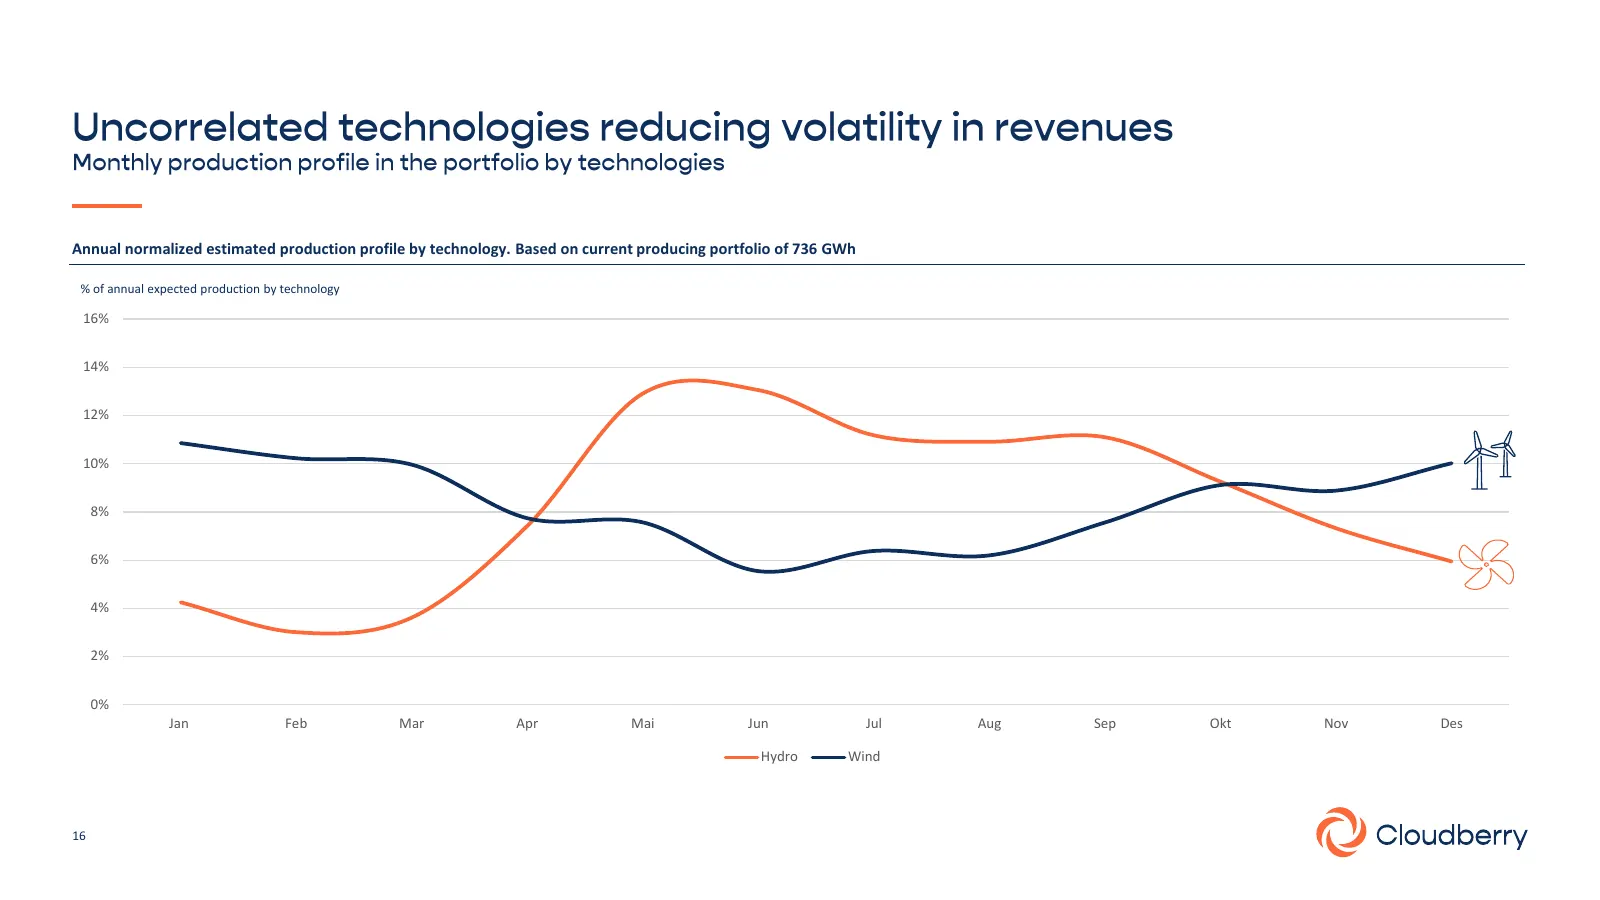
Annual normalized estimated production profile by technology. Based on current producing portfolio of 736 GWh % of annual expected production by technology 16% 14% 12% 10% 8% 6% 4% 2% 0% Jan Feb Mar Apr Mai Jun Jul Aug Sep Okt Nov Des Hydro Wind 16
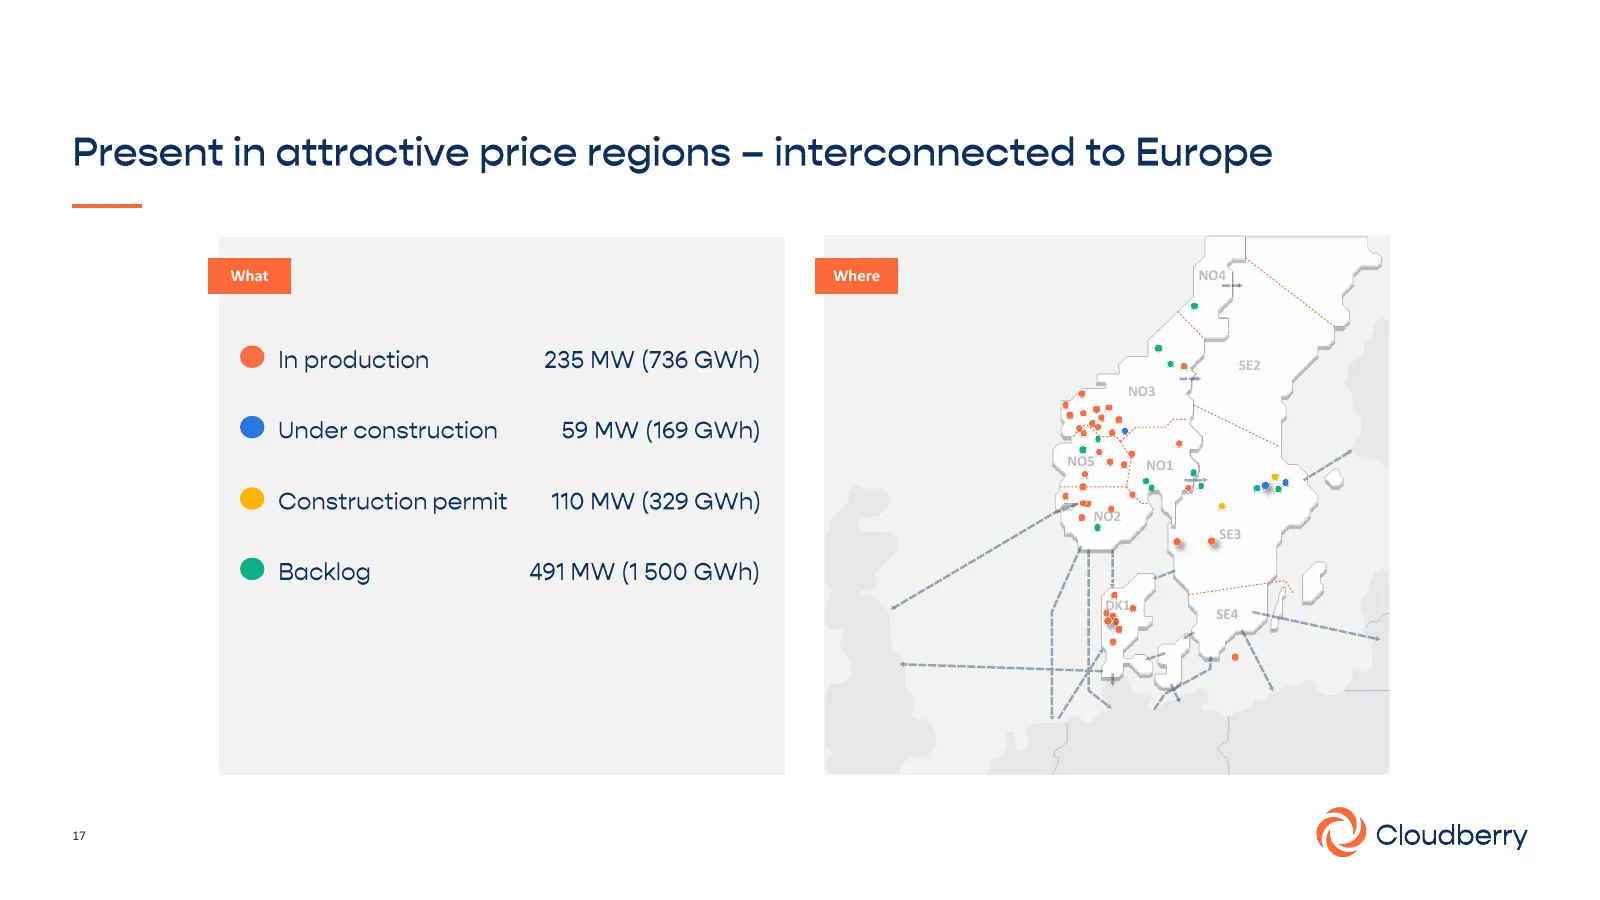
Slide 17: What and where
What Where NO4 SE2 NO3 NO5 NO1 NO2 SE3 DK1 SE4 17
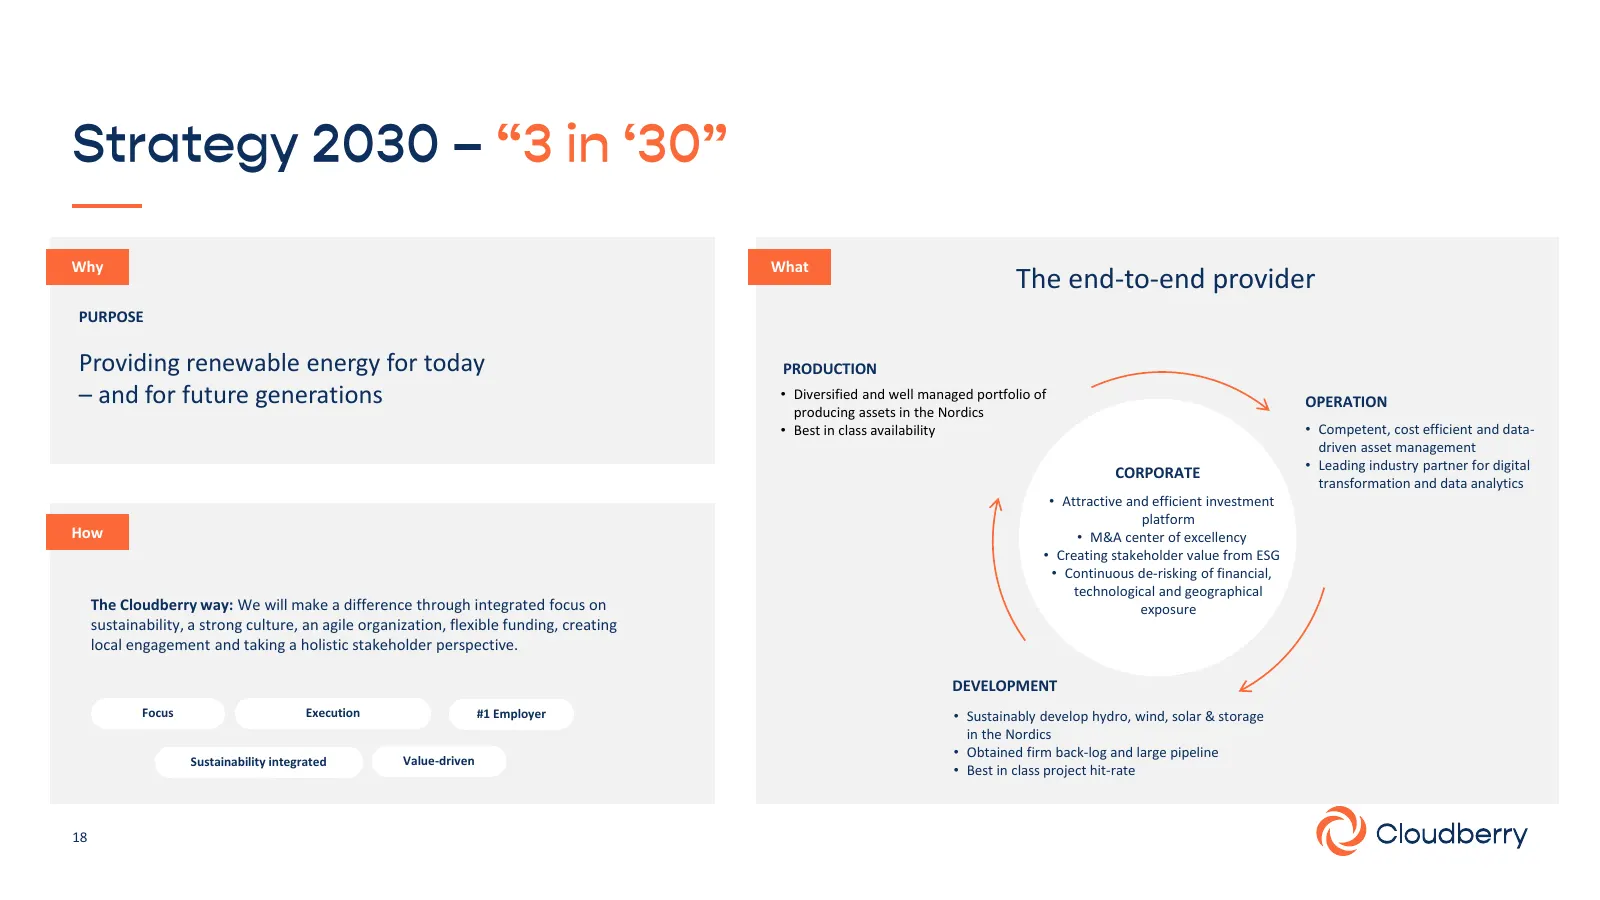
Slide 18: The end-to-end provider
Why What The end-to-end provider PURPOSE Providing renewable energy for today PRODUCTION – and for future generations • Diversified and well managed portfolio of OPERATION producing assets in the Nordics • Best in class availability • Competent, cost efficient and data- driven asset management • Le
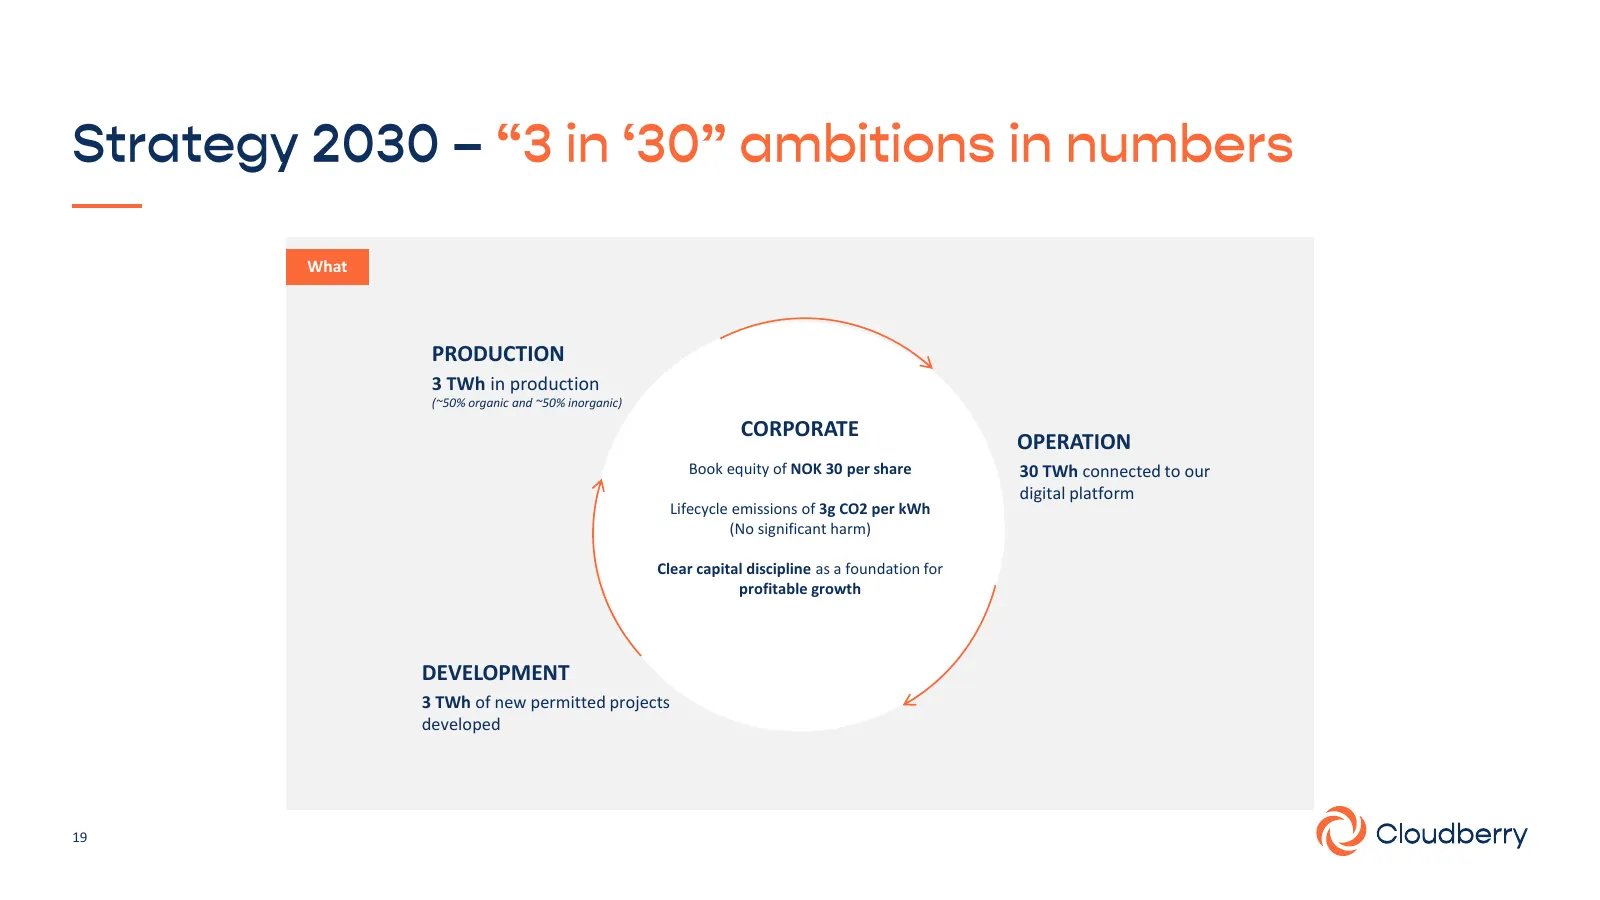
Slide 19: Targets towards 2030
What PRODUCTION 3 TWh in production (~50% organic and ~50% inorganic) CORPORATE OPERATION Book equity of NOK 30 per share 30 TWh connected to our digital platform Lifecycle emissions of 3g CO2 per kWh (No significant harm) Clear capital discipline as a foundation for profitable growth DEVELOPMENT 3
Slide 20: Agenda
11:30 The Energy Transition Thina Saltvedt 12:00 Perfectly Positioned towards Anders Lenborg 2030 12:45 Value Creation and Capital Christian A. Helland Strategy 13:15 Break 13:30 Accelerating Development Charlotte Bergqvist 14:10 Creating Synergies within Stig J. Østebrøt Cloudberry 14:30 Closing Re
Slide 21: Chief Value Officer
Chief Value Officer ch@cloudberry.no
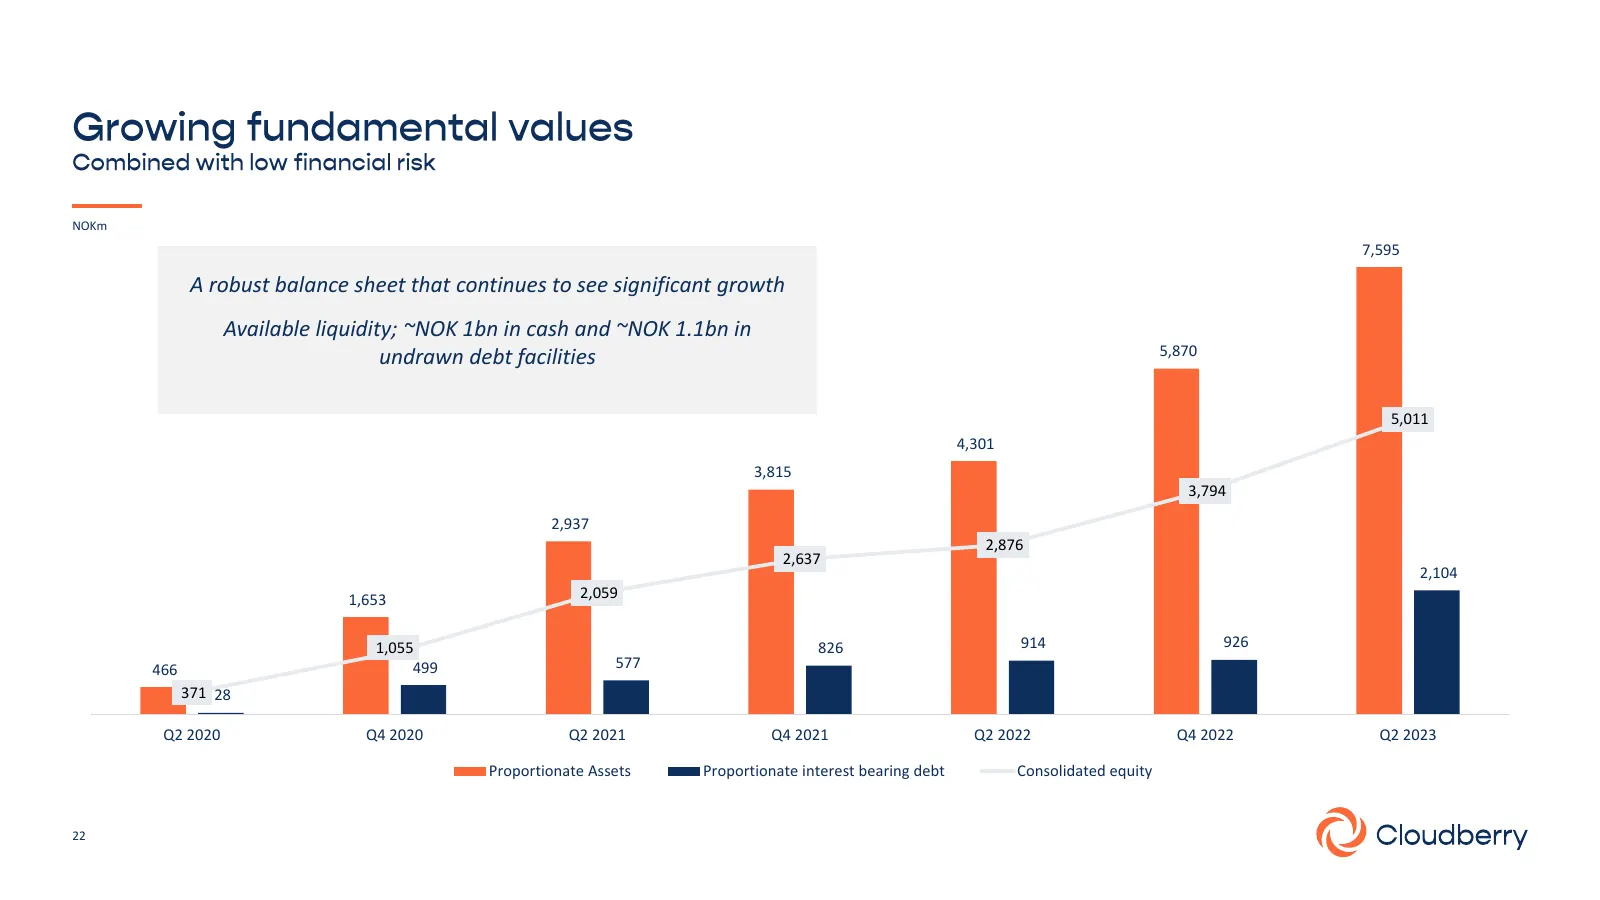
Slide 22: A robust balance sheet with significant growth
NOKm 7,595 A robust balance sheet that continues to see significant growth Available liquidity; ~NOK 1bn in cash and ~NOK 1.1bn in 5,870 undrawn debt facilities 5,011 4,301 3,815 3,794 2,937 2,876 2,637 2,104 1,653 2,059 1,055 826 914 926 466 499 577 371 28 Q2 2020 Q4 2020 Q2 2021 Q4 2021 Q2 2022 Q4
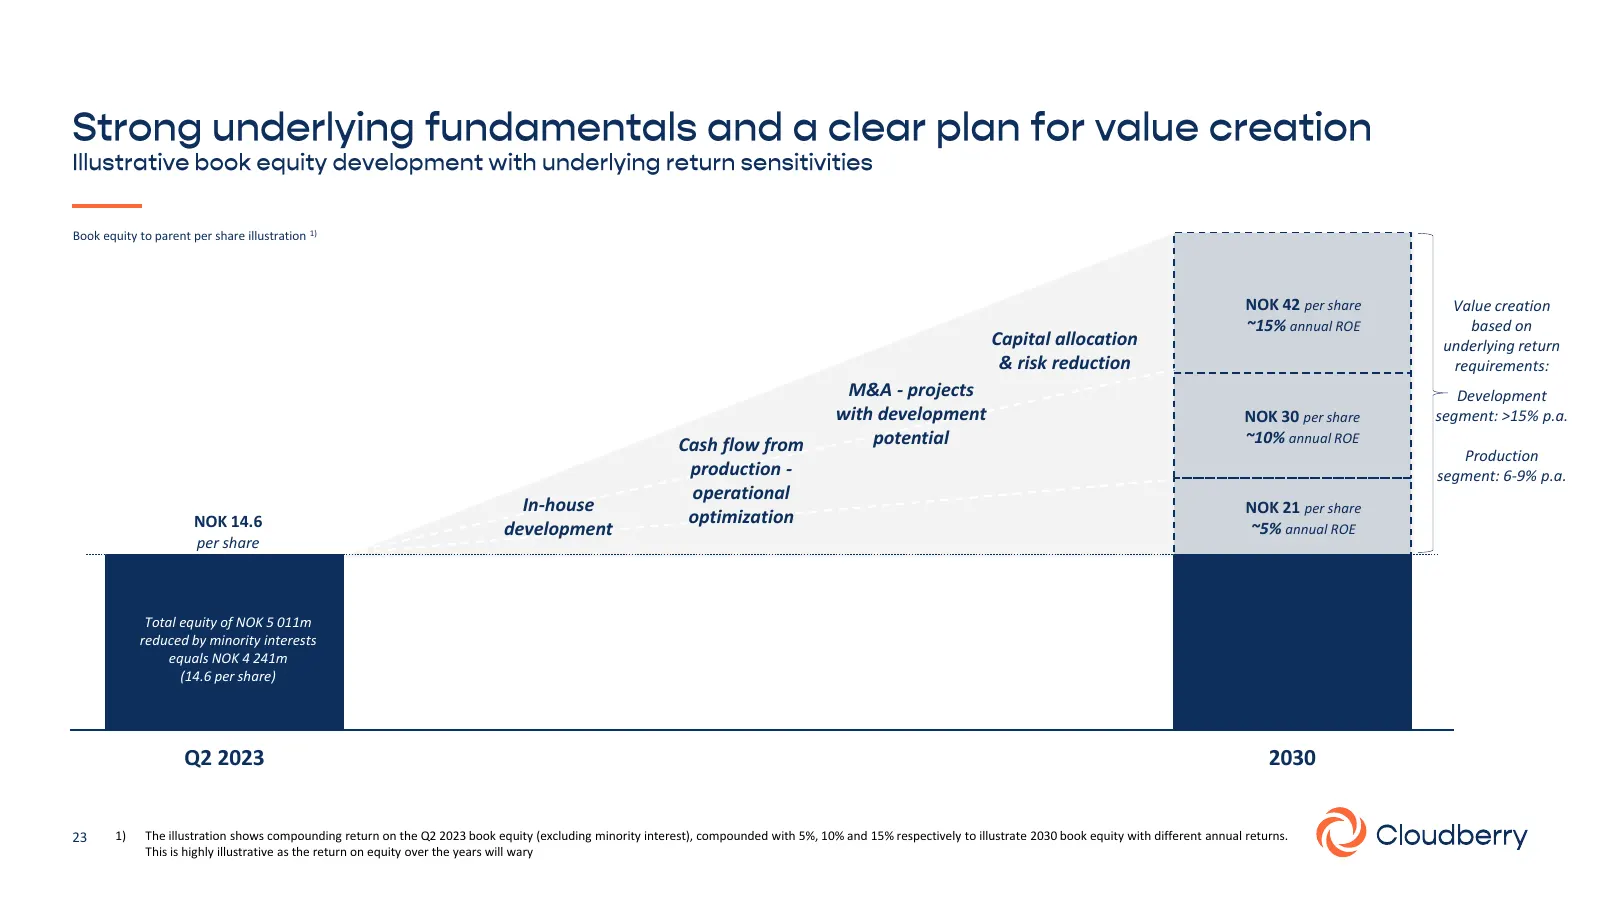
Slide 23: Capital allocation and risk reduction
Book equity to parent per share illustration 1) NOK 42 per share Value creation ~15% annual ROE based on Capital allocation underlying return & risk reduction requirements: M&A - projects Development with development NOK 30 per share segment: >15% p.a. Cash flow from potential ~10% annual ROE Produc
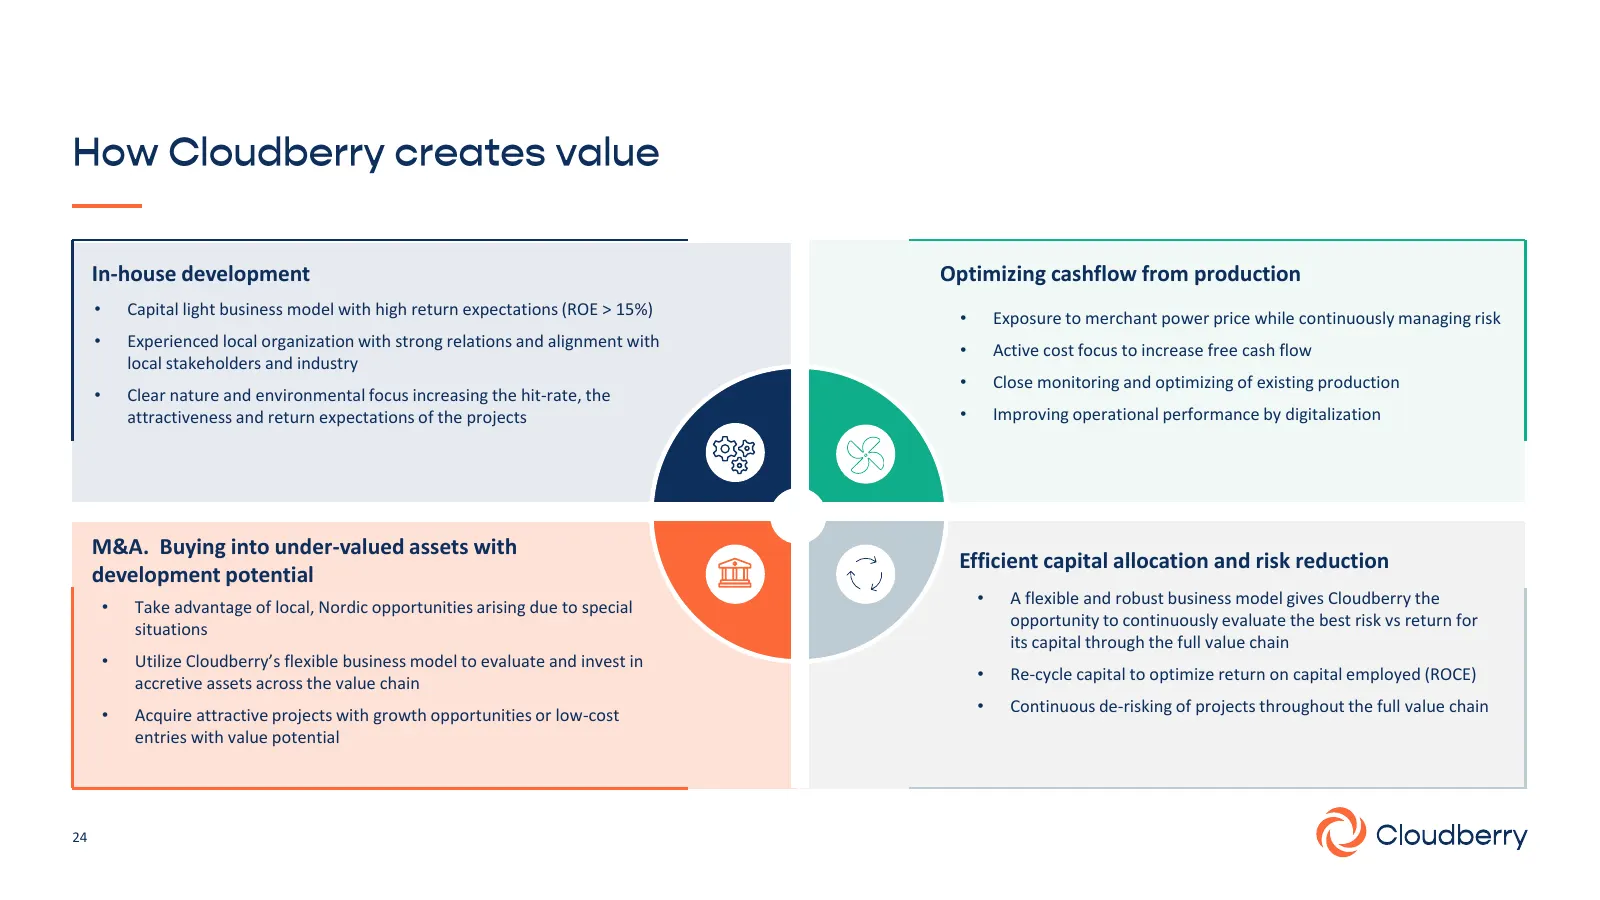
Slide 24: In-house development, M&A and cash flow optimization
In-house development Optimizing cashflow from production • Capital light business model with high return expectations (ROE > 15%) • Exposure to merchant power price while continuously managing risk • Experienced local organization with strong relations and alignment with • Active cost focus to incre
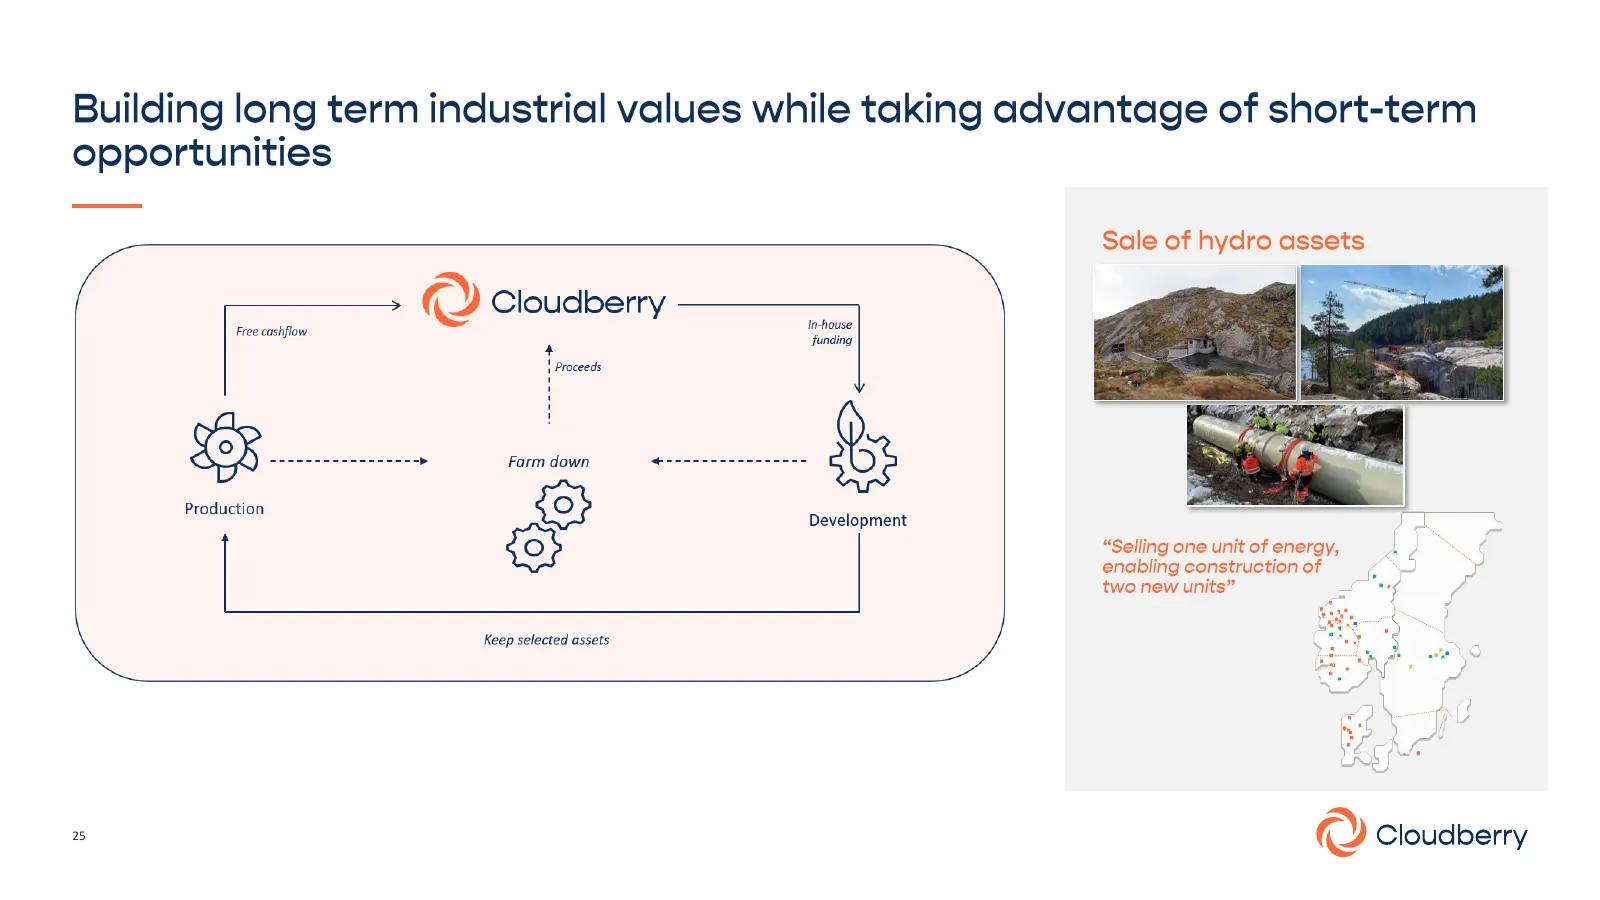
Slide 25: Building long term industrial values
Building long term industrial values while taking advantage of short-term opportunities (— XX Q Cloudberry Free cashflow 4 | Proceeds Production | Farm down + a Development Keep selected assets / 25 Sale of hydro assets “Selling one unit of energy, enabling construction of two new units” QR Cloudber
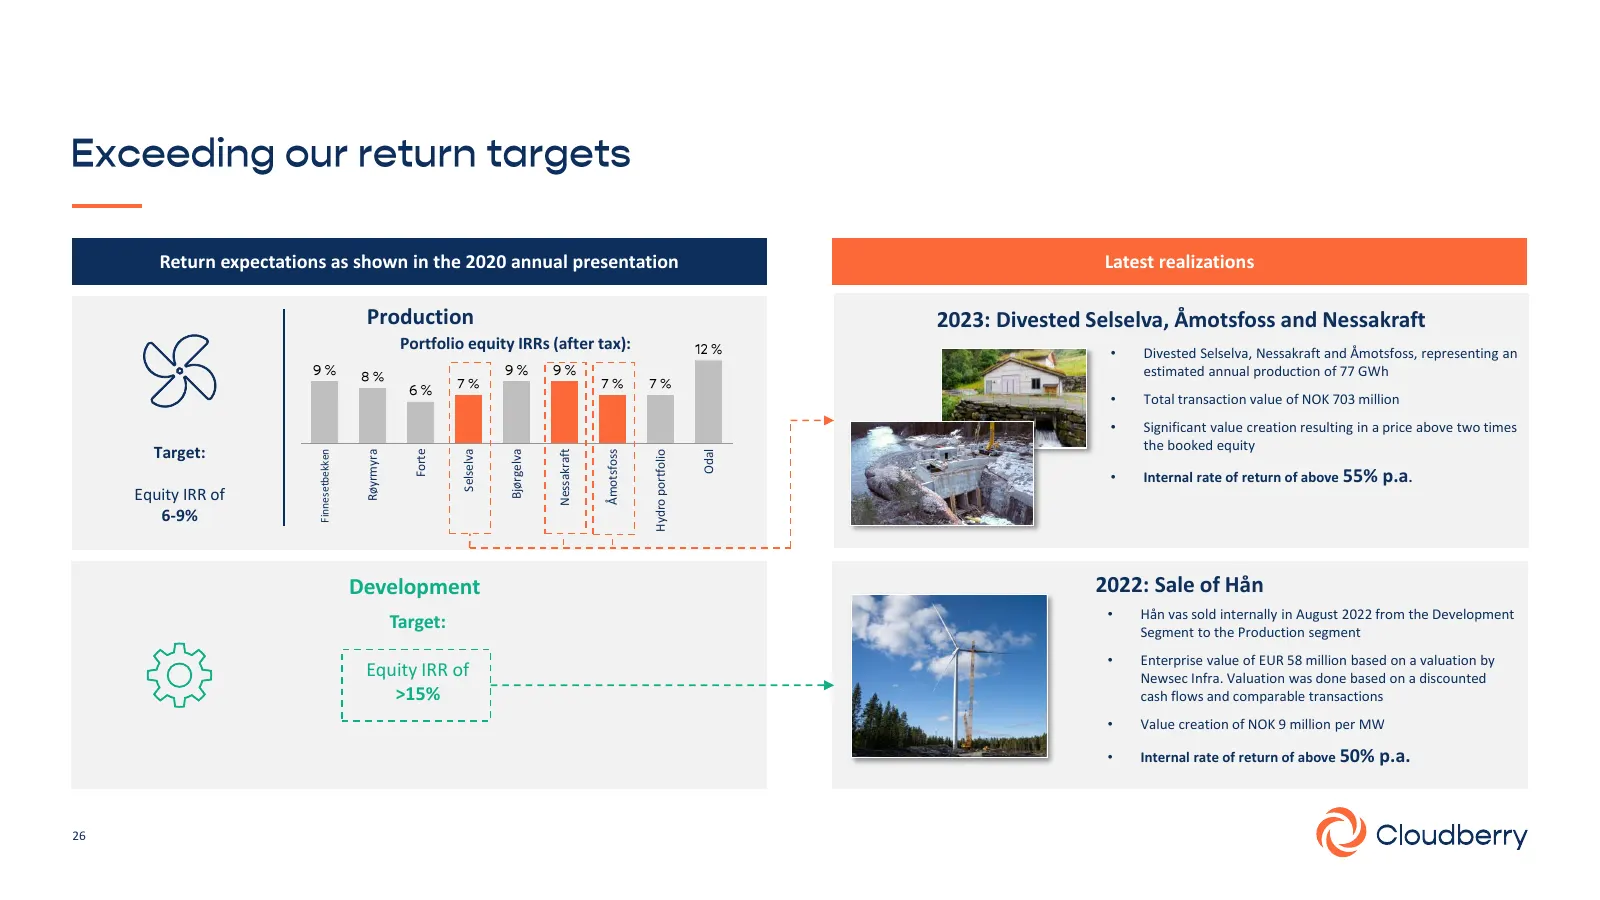
Slide 26: Latest realizations and return expectations
Return expectations as shown in the 2020 annual presentation Latest realizations Production 2023: Divested Selselva, Åmotsfoss and Nessakraft Portfolio equity IRRs (after tax): • Divested Selselva, Nessakraft and Åmotsfoss, representing an estimated annual production of 77 GWh • Total transaction va
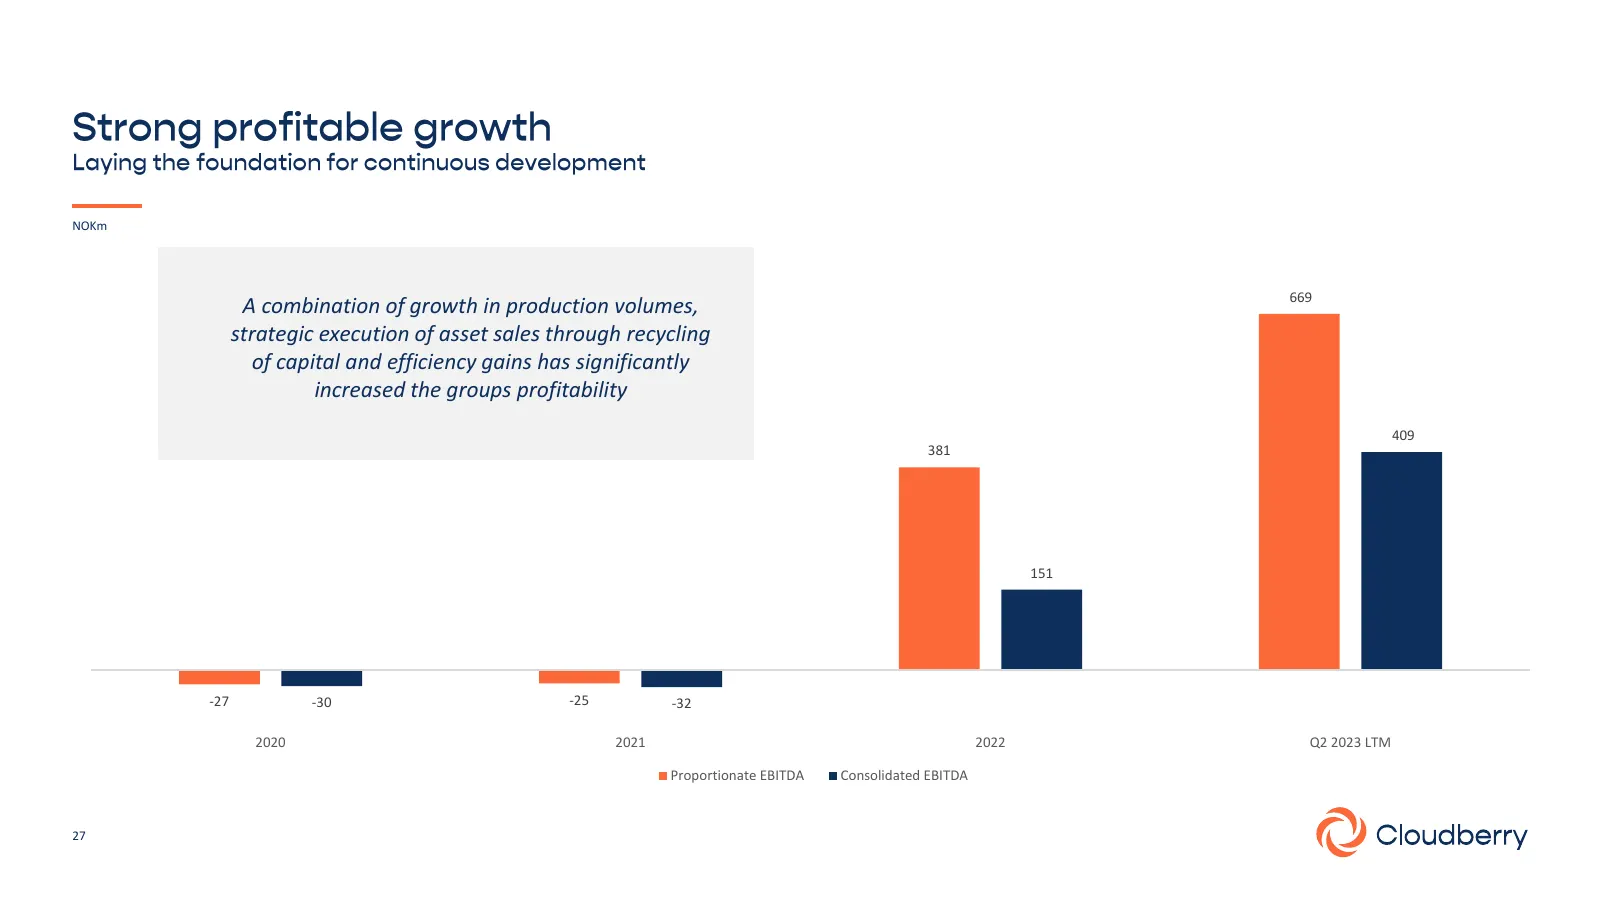
Slide 27: Growth in production and profitability
NOKm 669 A combination of growth in production volumes, strategic execution of asset sales through recycling of capital and efficiency gains has significantly increased the groups profitability 409 381 151 -27 -30 -25 -32 2020 2021 2022 Q2 2023 LTM Proportionate EBITDA Consolidated EBITDA 27
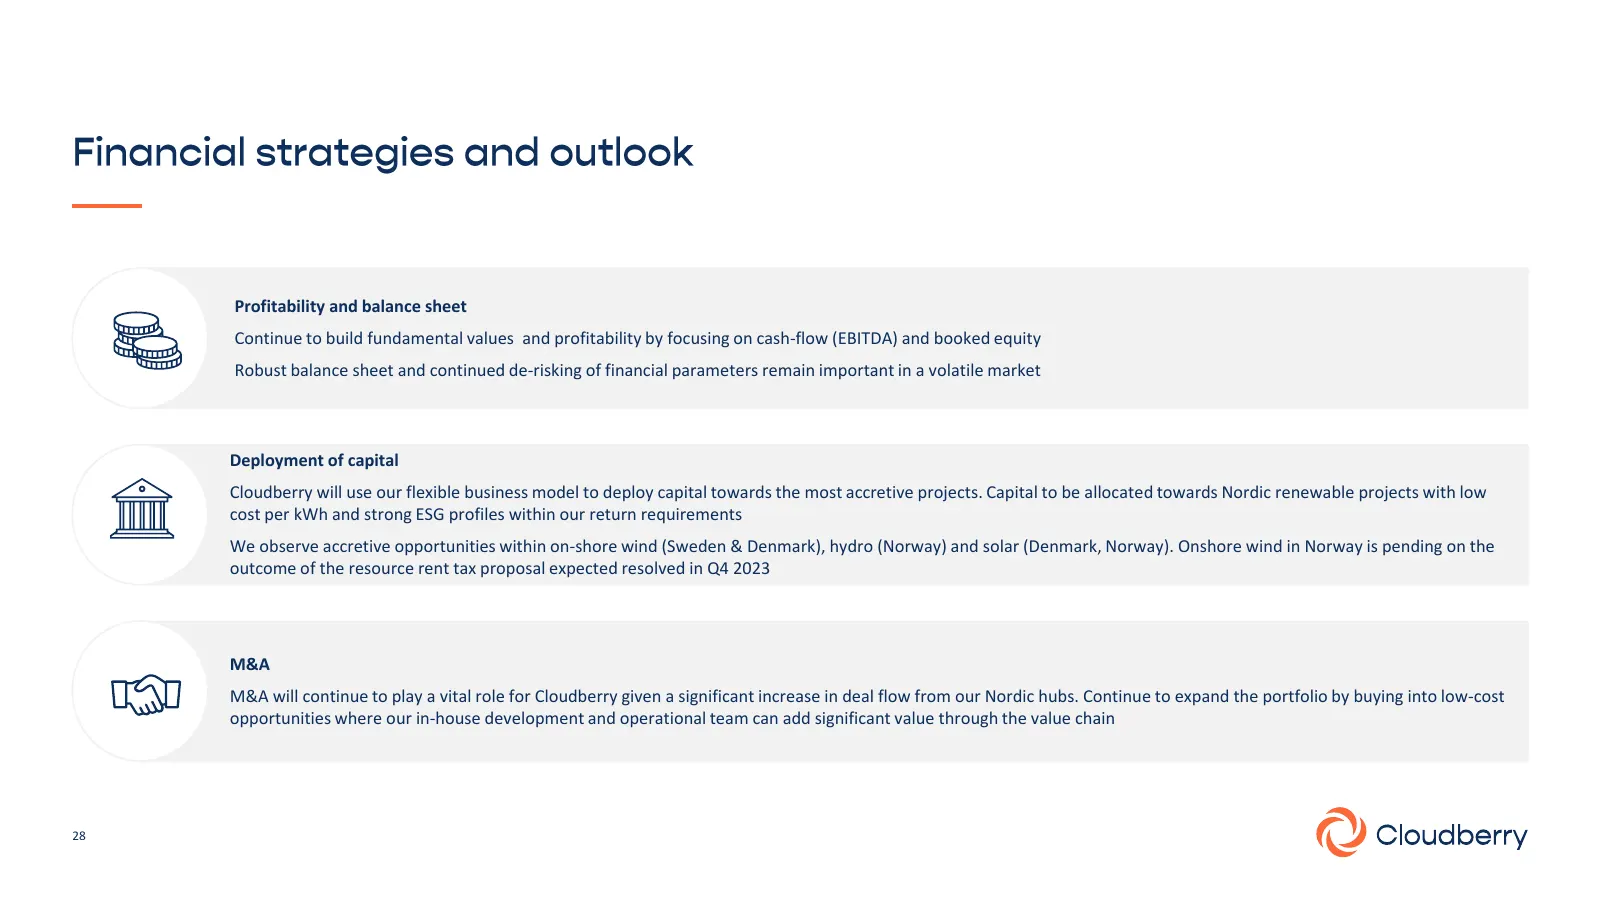
Slide 28: Profitability and balance sheet
Profitability and balance sheet Continue to build fundamental values and profitability by focusing on cash-flow (EBITDA) and booked equity Robust balance sheet and continued de-risking of financial parameters remain important in a volatile market Deployment of capital Cloudberry will use our flexibl
Slide 29: Share buyback mandate
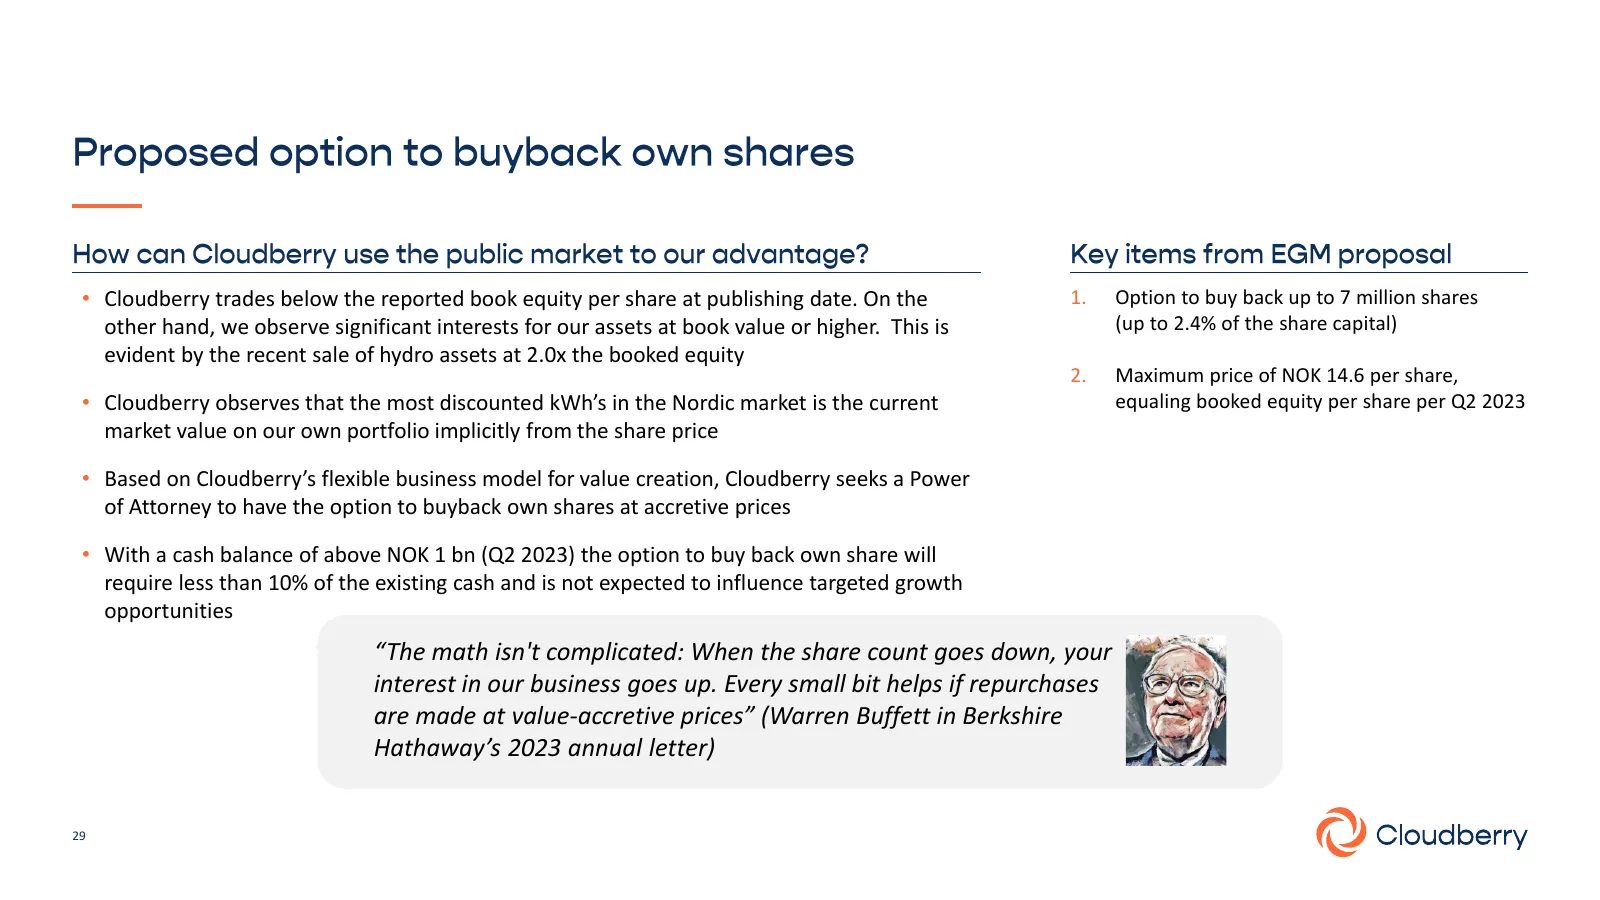
• Cloudberry trades below the reported book equity per share at publishing date. On the 1. Option to buy back up to 7 million shares other hand, we observe significant interests for our assets at book value or higher. This is (up to 2.4% of the share capital) evident by the recent sale of hydro asse
Slide 30: Coverage
Coverage ites = SIEIB_ DNB Ej. Jefferies O Q Cloudberry
Slide 31: Break
Break — 10 min Next 13:30 Accelerating Development Charlotte Bergqvist Q Cloudberry
Slide 32: Agenda
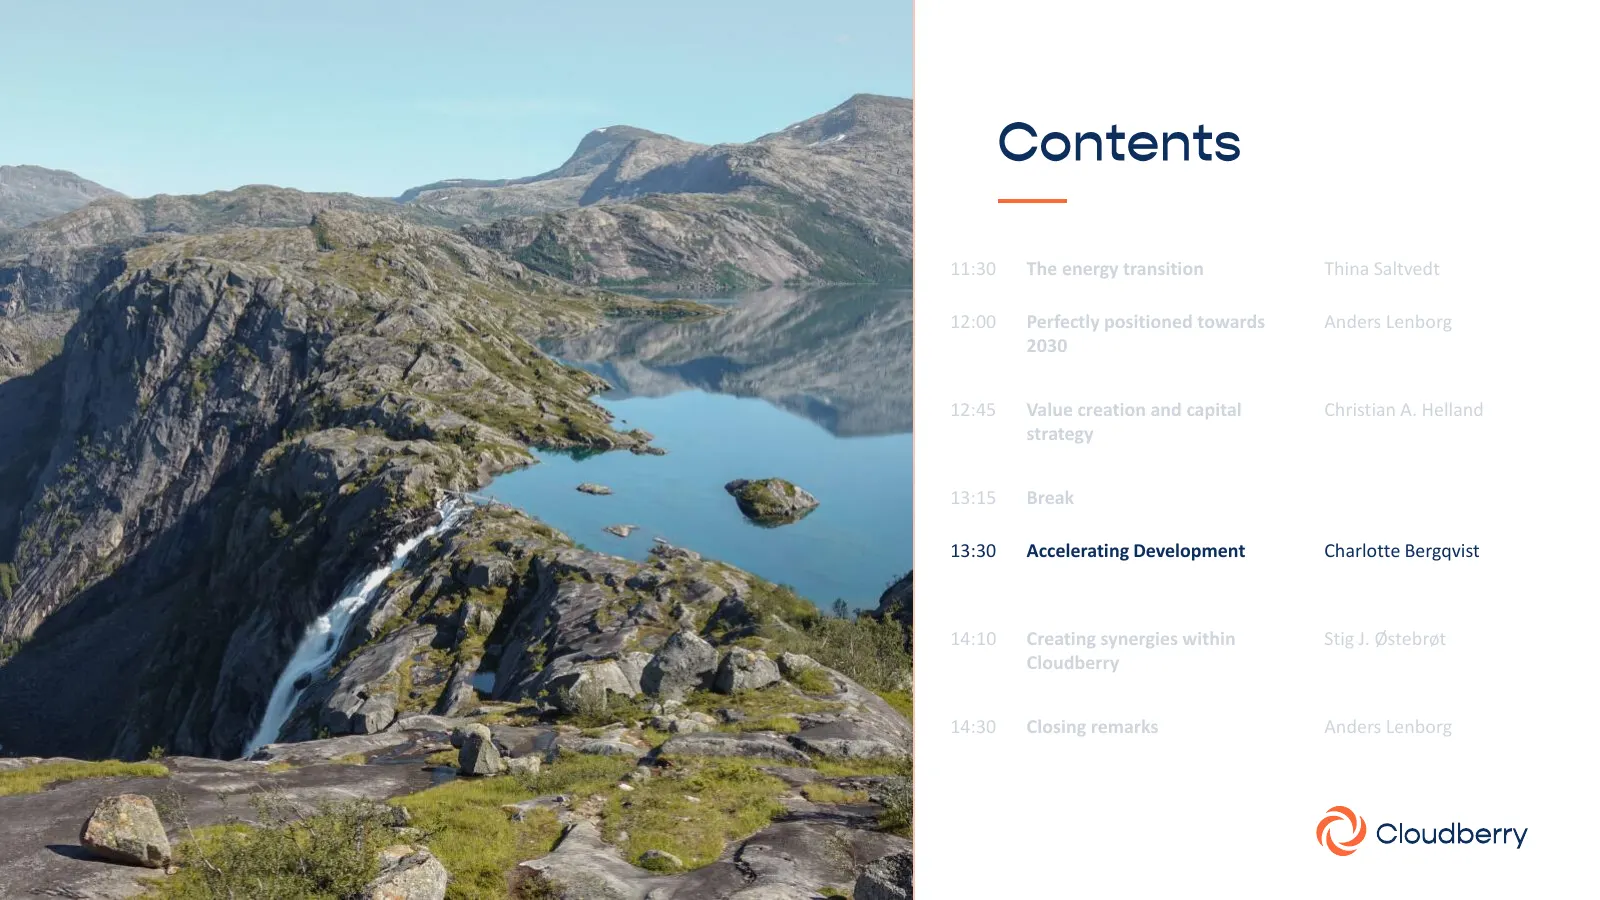
11:30 The energy transition Thina Saltvedt 12:00 Perfectly positioned towards Anders Lenborg 2030 12:45 Value creation and capital Christian A. Helland strategy 13:15 Break 13:30 Accelerating Development Charlotte Bergqvist 14:10 Creating synergies within Stig J. Østebrøt Cloudberry 14:30 Closing re
Slide 33: Chief Development Officer
Chief Development Officer cb@cloudberrywind.se
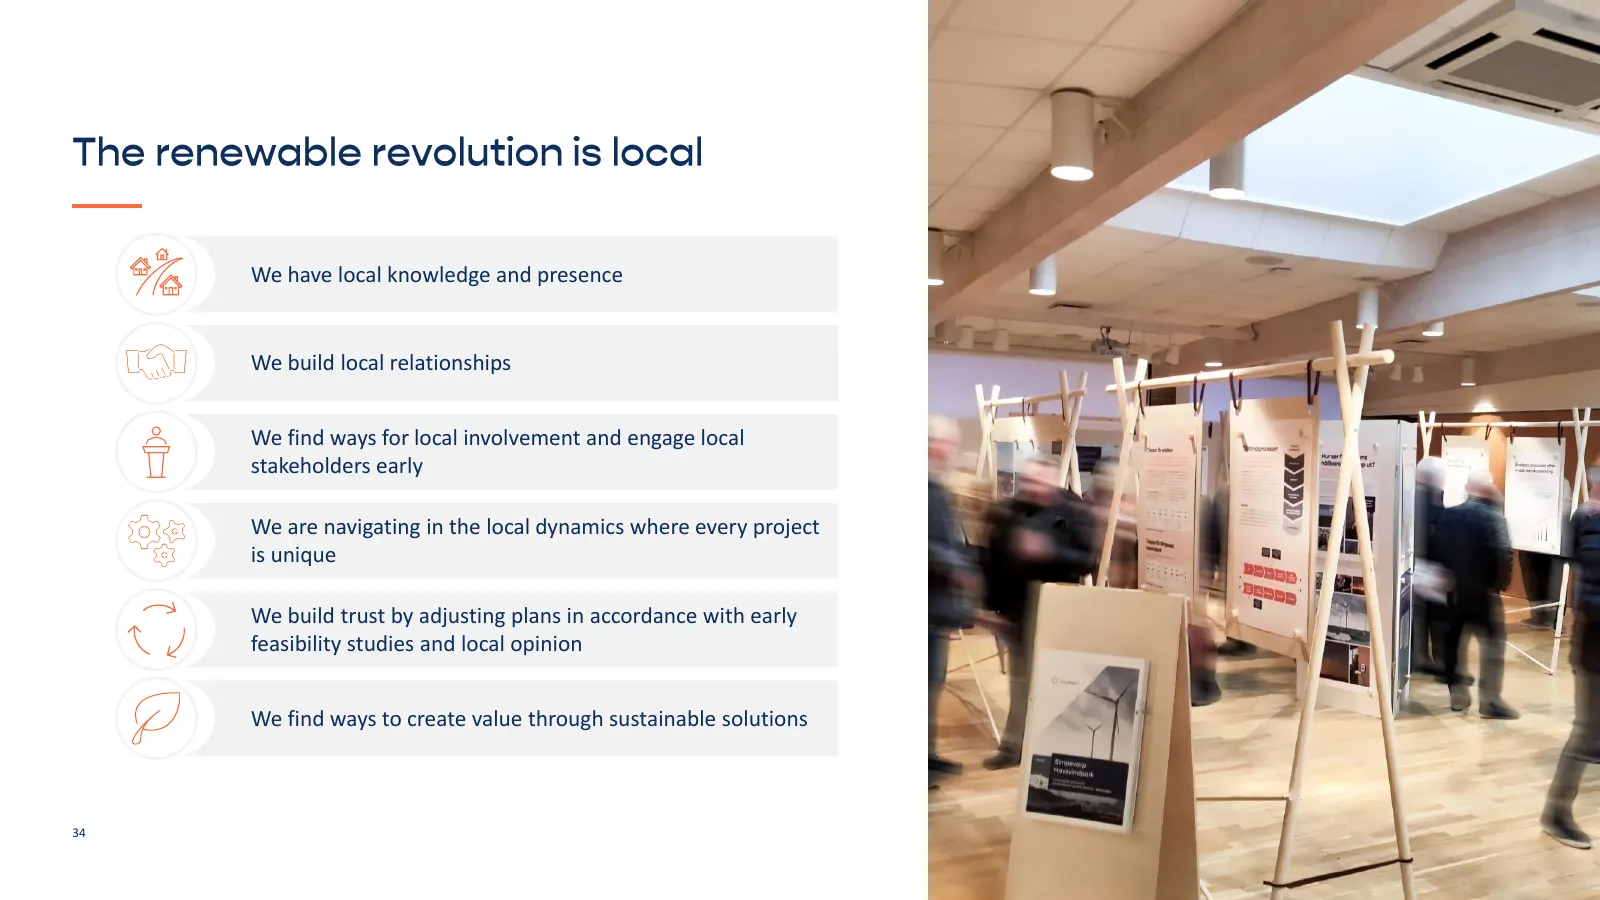
Slide 34: Local knowledge and presence
We have local knowledge and presence We build local relationships We find ways for local involvement and engage local stakeholders early We are navigating in the local dynamics where every project is unique We build trust by adjusting plans in accordance with early feasibility studies and local opin
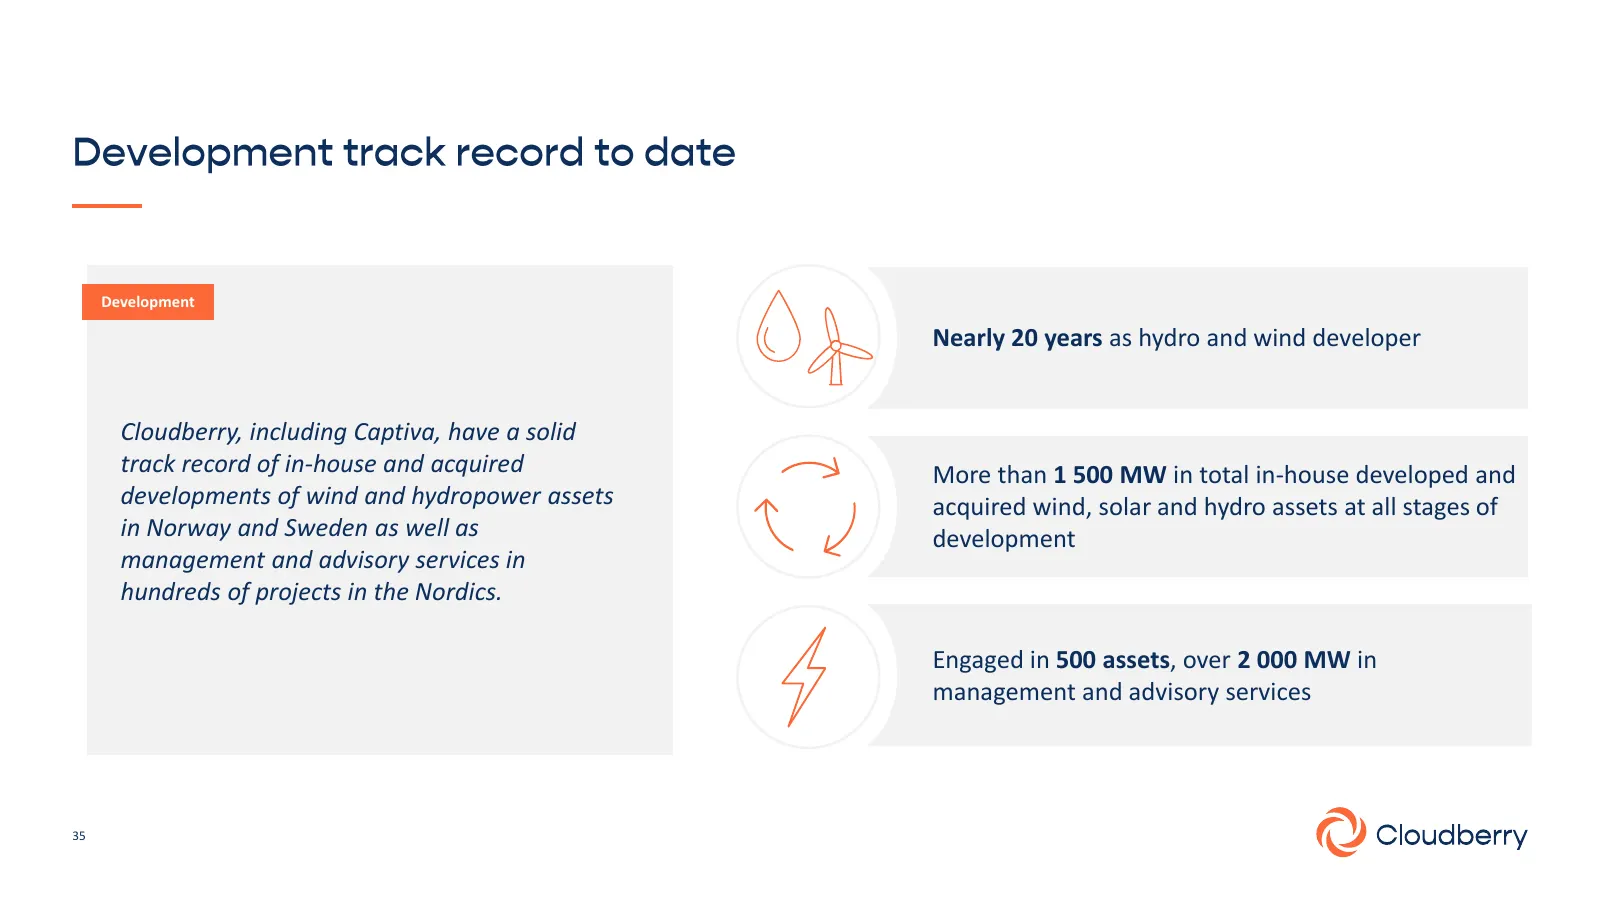
Slide 35: Nearly 20 years as hydro and wind developer
Development Nearly 20 years as hydro and wind developer Cloudberry, including Captiva, have a solid track record of in-house and acquired More than 1 500 MW in total in-house developed and developments of wind and hydropower assets acquired wind, solar and hydro assets at all stages of in Norway and
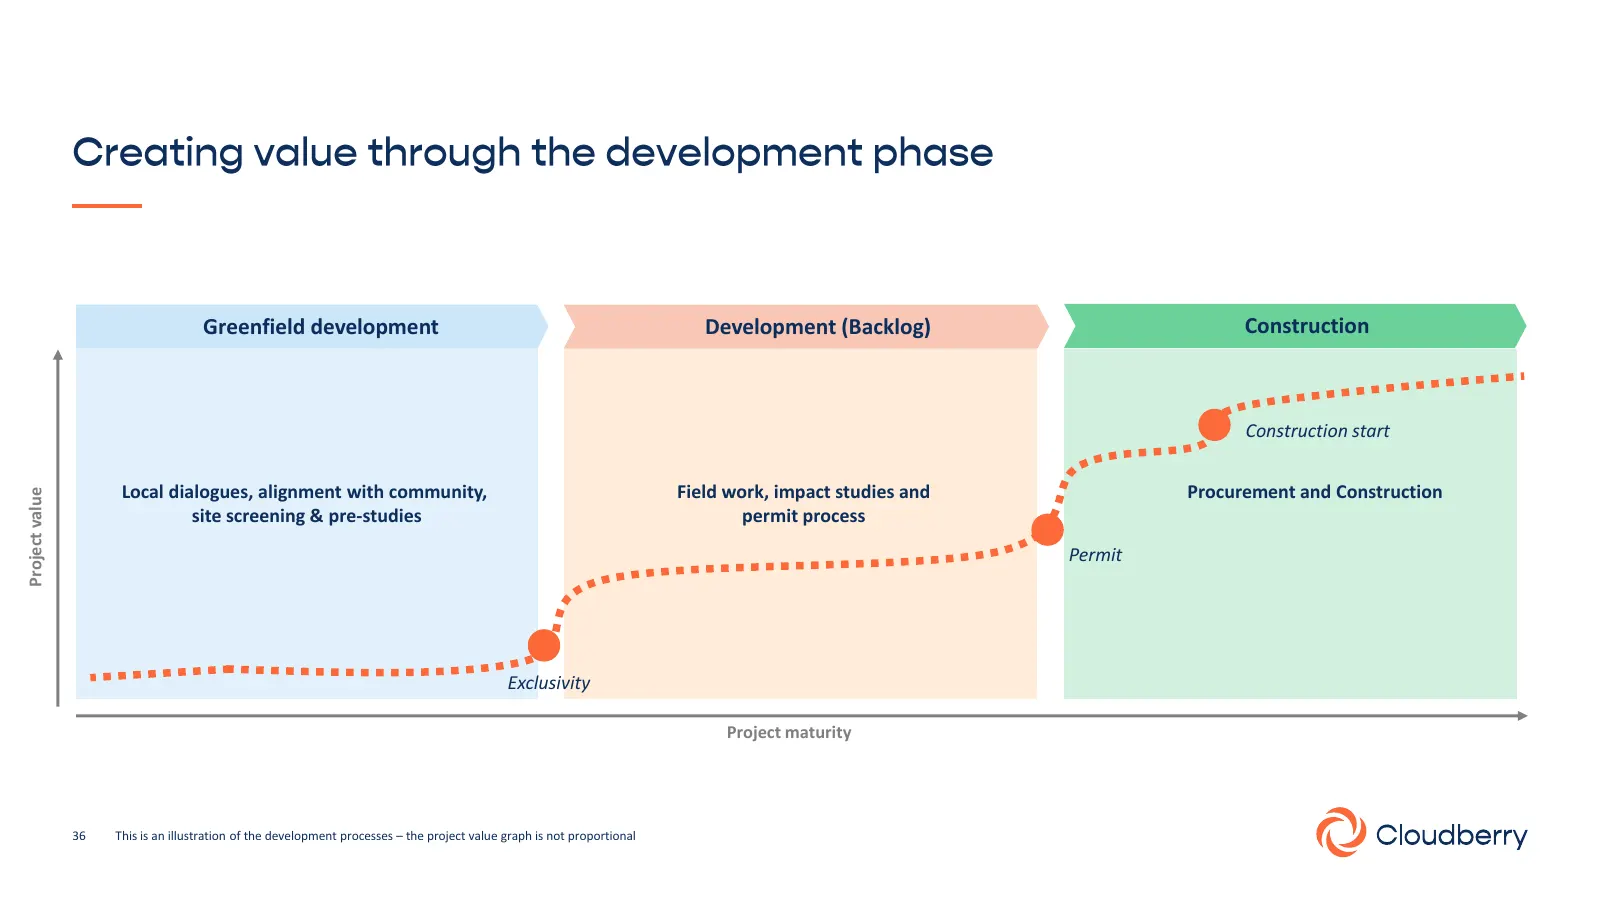
Slide 36: Project value through development stages
Greenfield development Development (Backlog) Construction Construction start Local dialogues, alignment with community, Field work, impact studies and Procurement and Construction Project value site screening & pre-studies permit process Permit Exclusivity Project maturity 36 This is an illustration
Slide 37: Construction projects overview
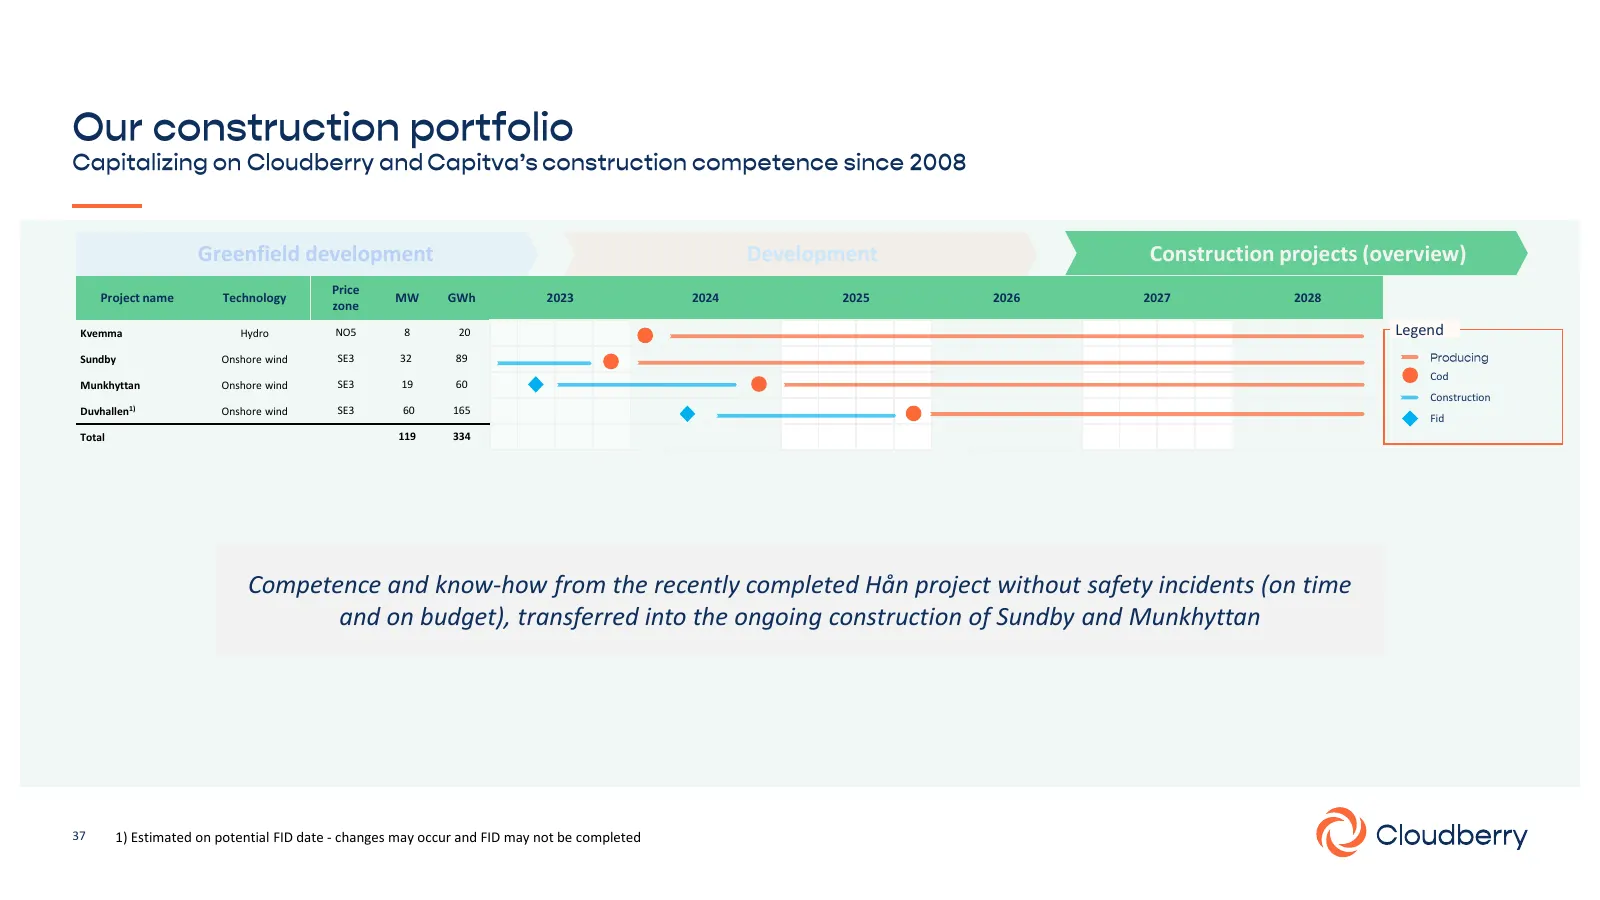
Greenfield development Development Construction projects (overview) Price Project name Technology MW GWh 2023 2024 2025 2026 2027 2028 zone Kvemma Hydro NO5 8 20 Legend Sundby Onshore wind SE3 32 89 Cod Munkhyttan Onshore wind SE3 19 60 Construction Duvhallen1) Onshore wind SE3 60 165 Fid Total 119
Slide 38: Development backlog overview
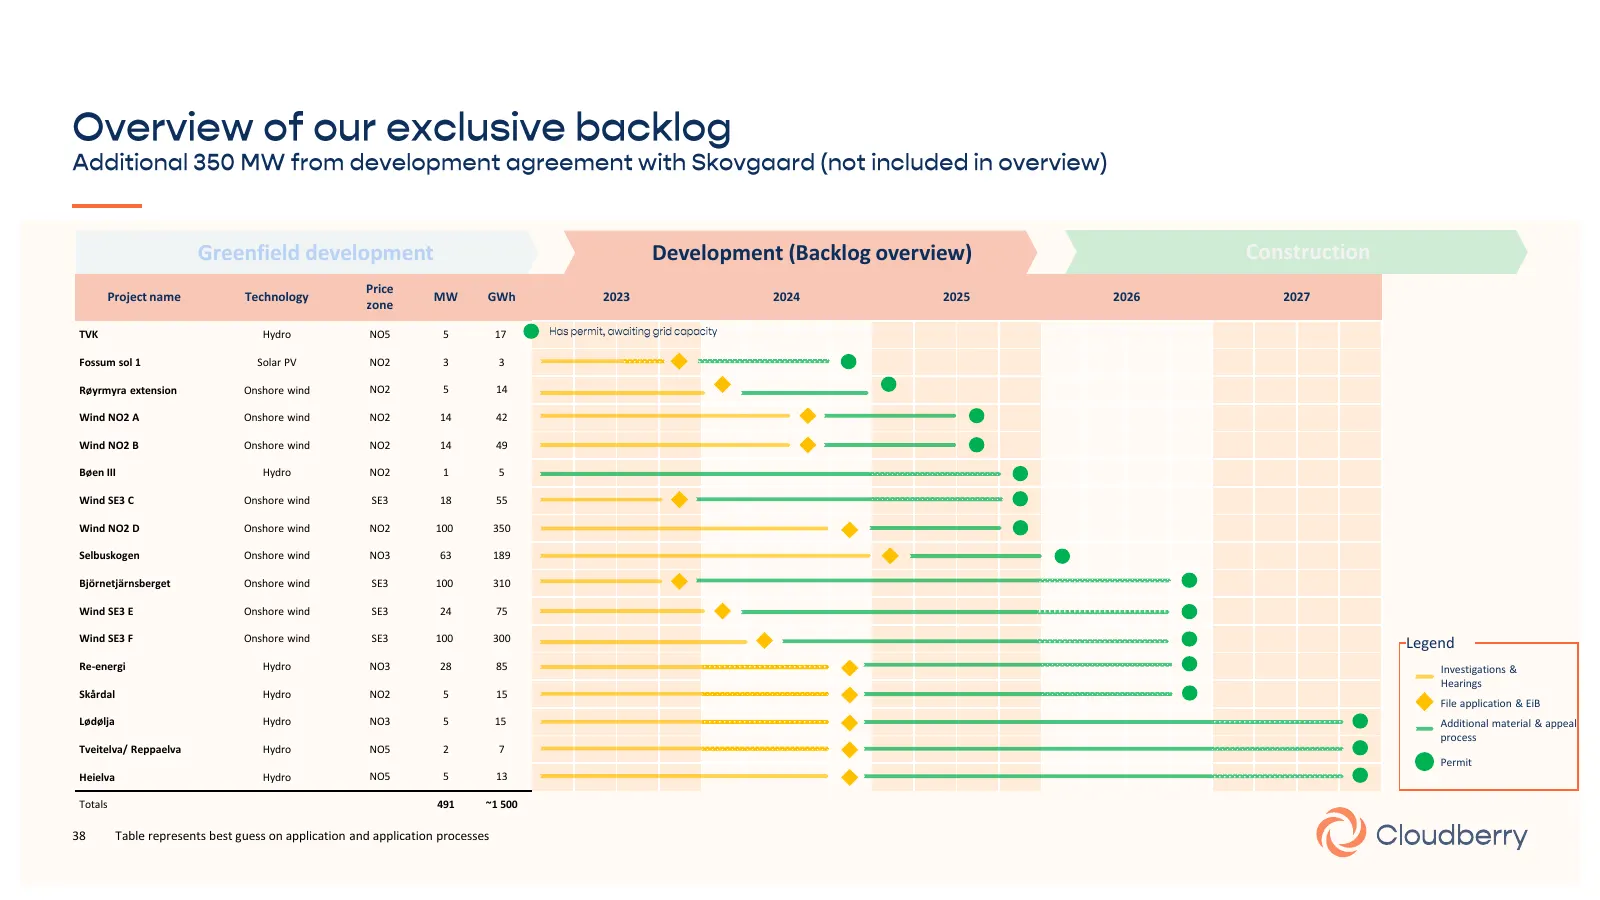
Greenfield development Development (Backlog overview) Construction Price Project name Technology MW GWh 2023 2024 2025 2026 2027 zone TVK Hydro NO5 5 17 Fossum sol 1 Solar PV NO2 3 3 Røyrmyra extension Onshore wind NO2 5 14 Wind NO2 A Onshore wind NO2 14 42 Wind NO2 B Onshore wind NO2 14 49 Bøen III
Slide 39: Pipeline of onshore, offshore wind, solar and hydro
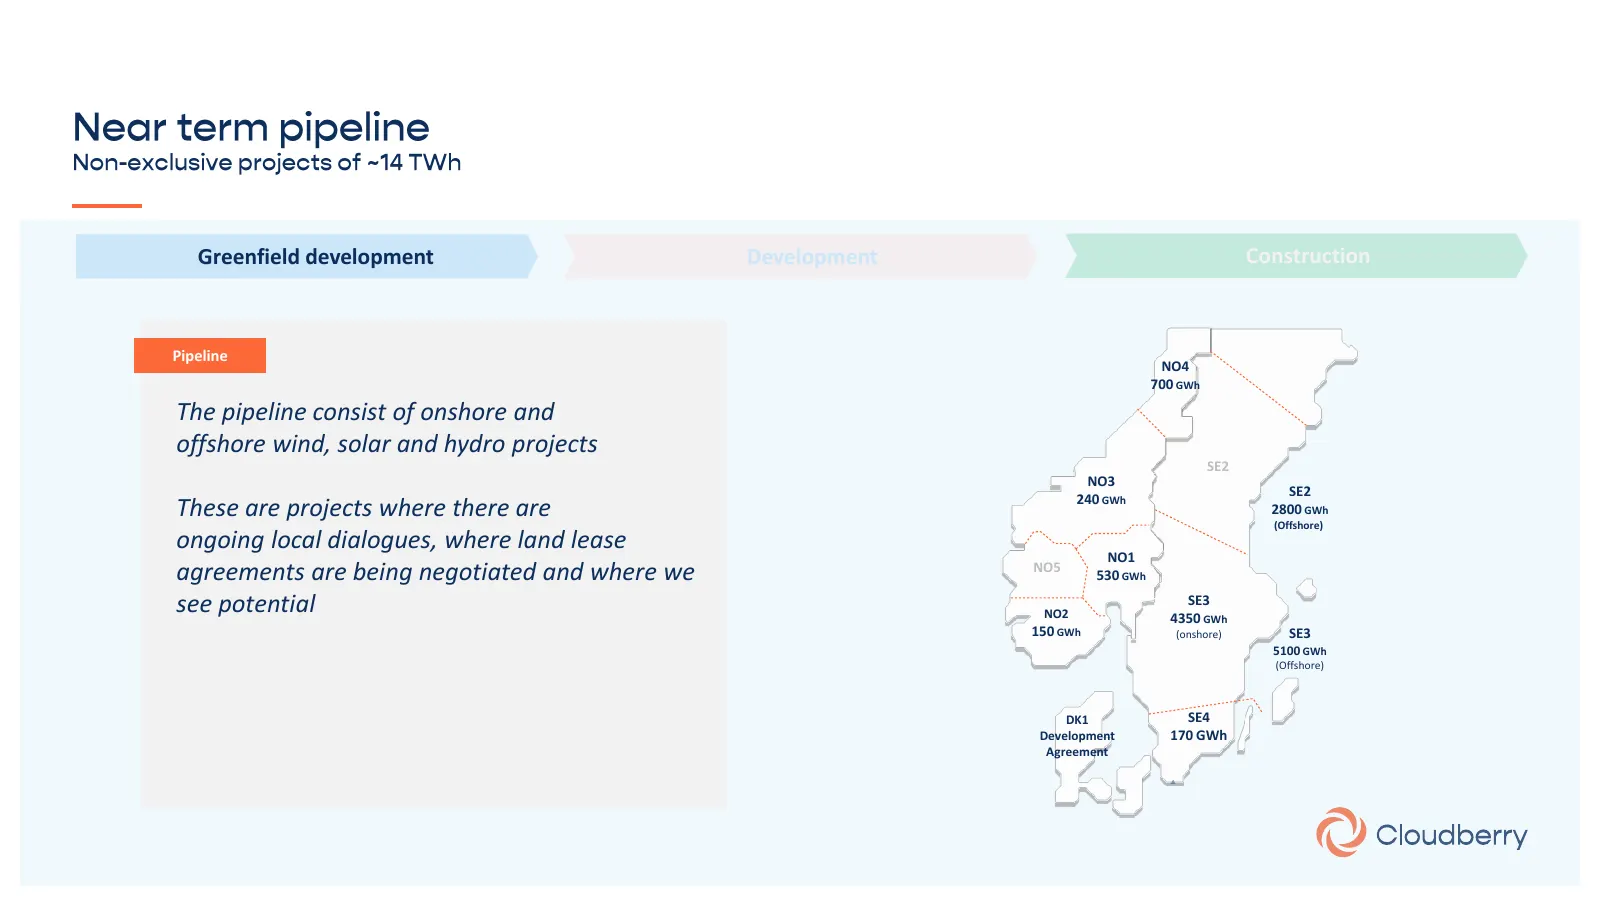
Greenfield development Development Construction Pipeline NO4 700 GWh The pipeline consist of onshore and offshore wind, solar and hydro projects SE2 NO3 SE2 240 GWh These are projects where there are 2800 GWh (Offshore) ongoing local dialogues, where land lease NO1 agreements are being negotiated an
Slide 40: Combined resources of Cloudberry and Captiva
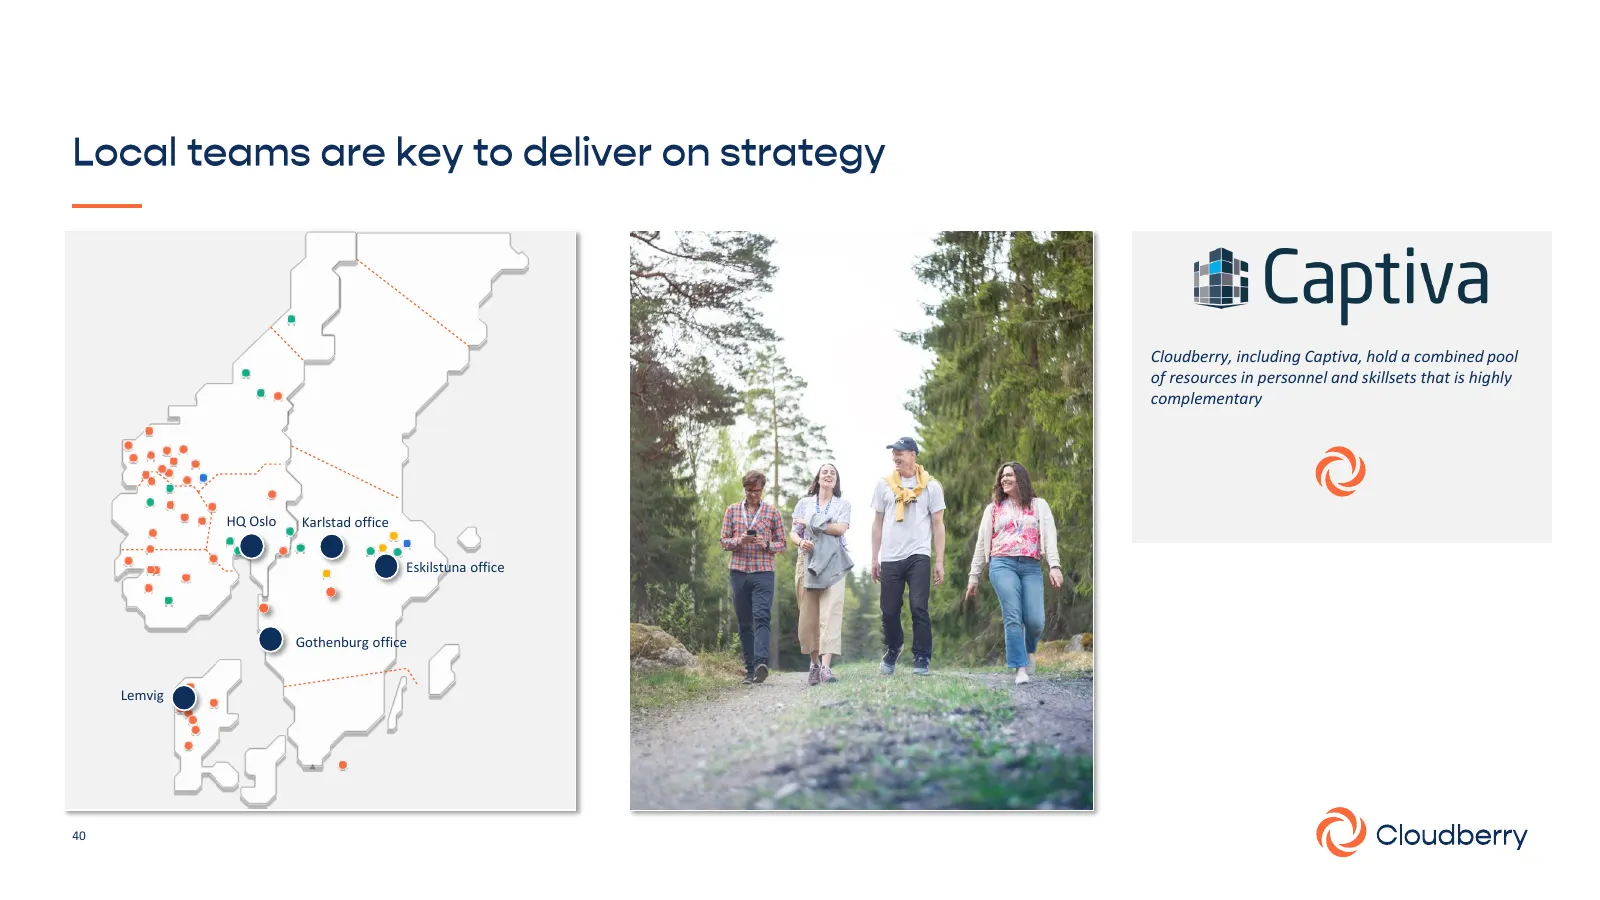
Cloudberry, including Captiva, hold a combined pool of resources in personnel and skillsets that is highly complementary HQ Oslo Karlstad office Eskilstuna office Gothenburg office Lemvig 40
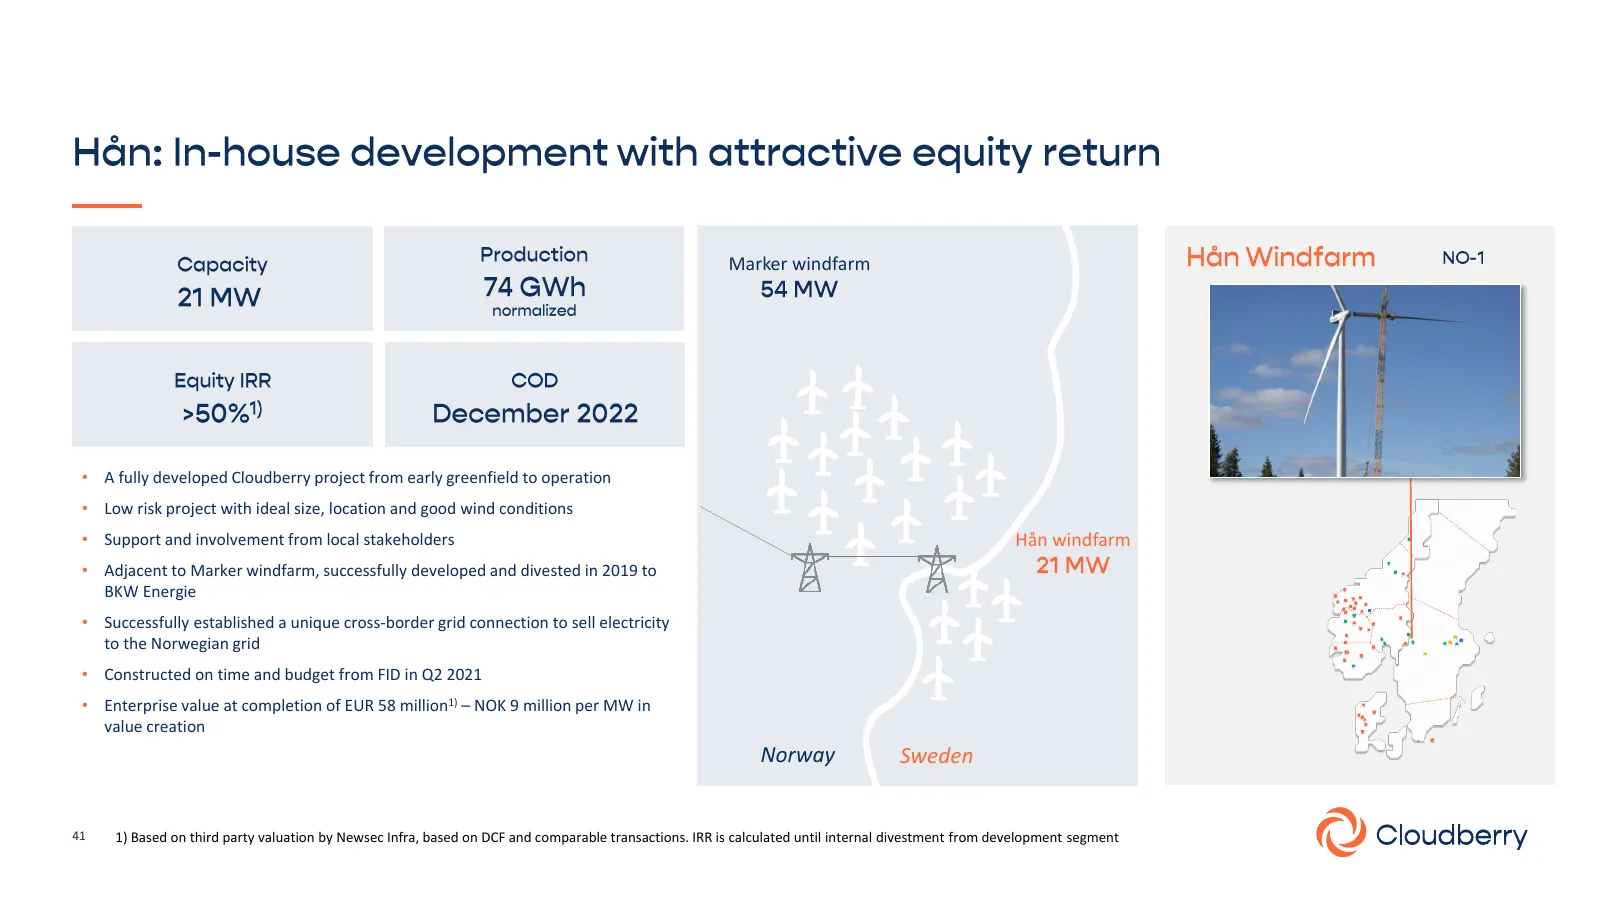
Slide 41: Hån windfarm
Marker windfarm • A fully developed Cloudberry project from early greenfield to operation • Low risk project with ideal size, location and good wind conditions • Support and involvement from local stakeholders Hån windfarm • Adjacent to Marker windfarm, successfully developed and divested in 2019 to
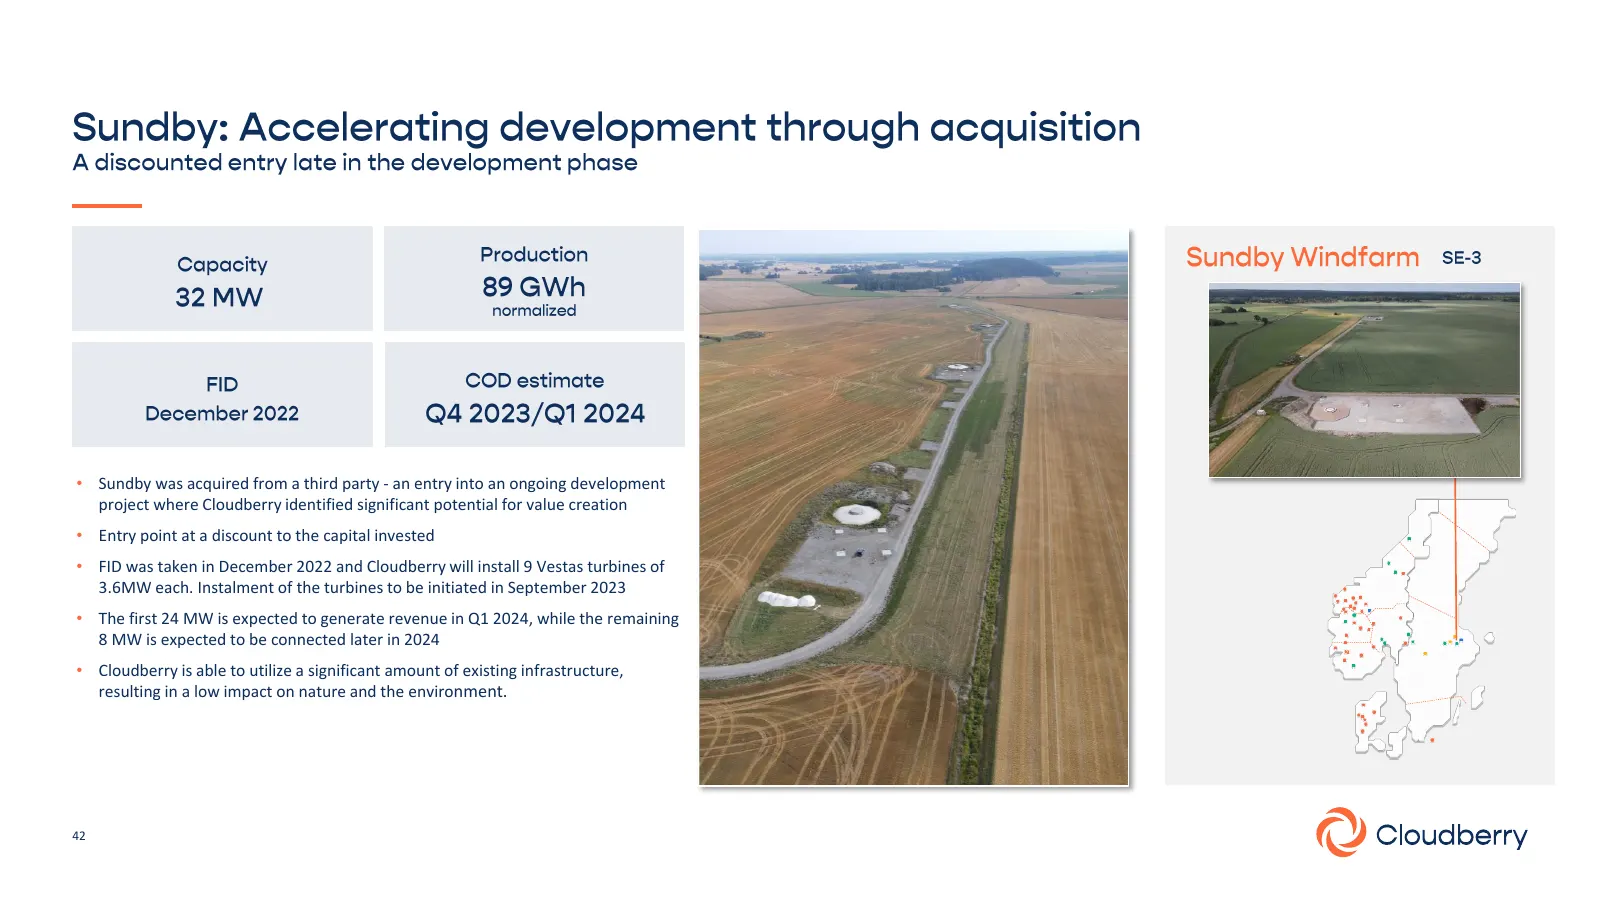
Slide 42: Sundby
• Sundby was acquired from a third party - an entry into an ongoing development project where Cloudberry identified significant potential for value creation • Entry point at a discount to the capital invested • FID was taken in December 2022 and Cloudberry will install 9 Vestas turbines of 3.6MW eac
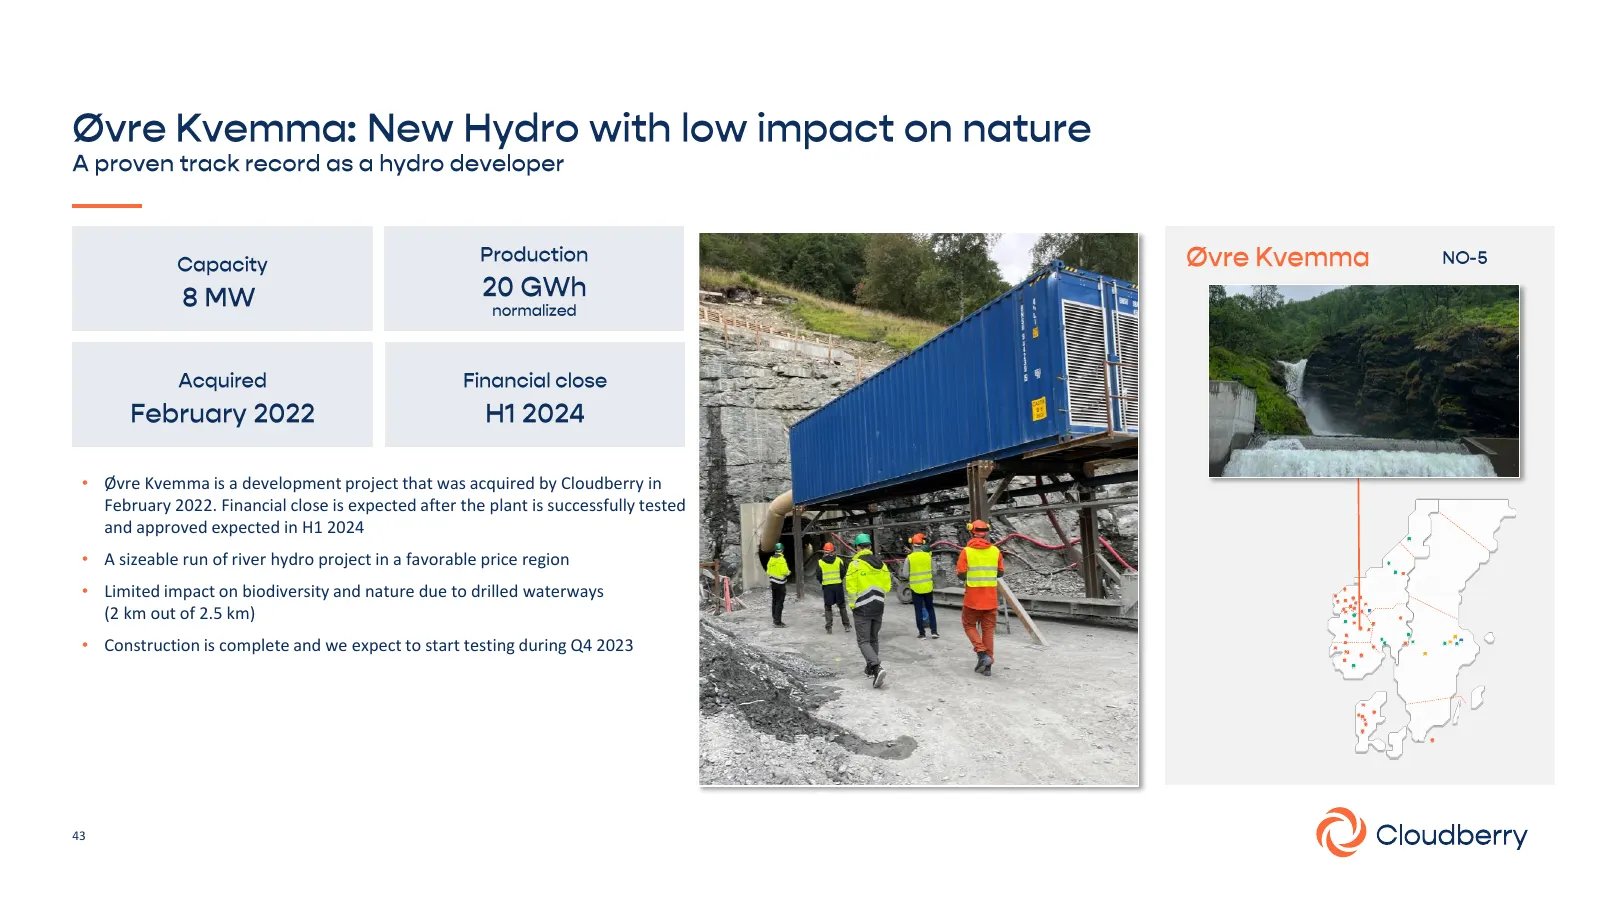
Slide 43: Øvre Kvemma
• Øvre Kvemma is a development project that was acquired by Cloudberry in February 2022. Financial close is expected after the plant is successfully tested and approved expected in H1 2024 • A sizeable run of river hydro project in a favorable price region • Limited impact on biodiversity and nature
Slide 44: 44
44
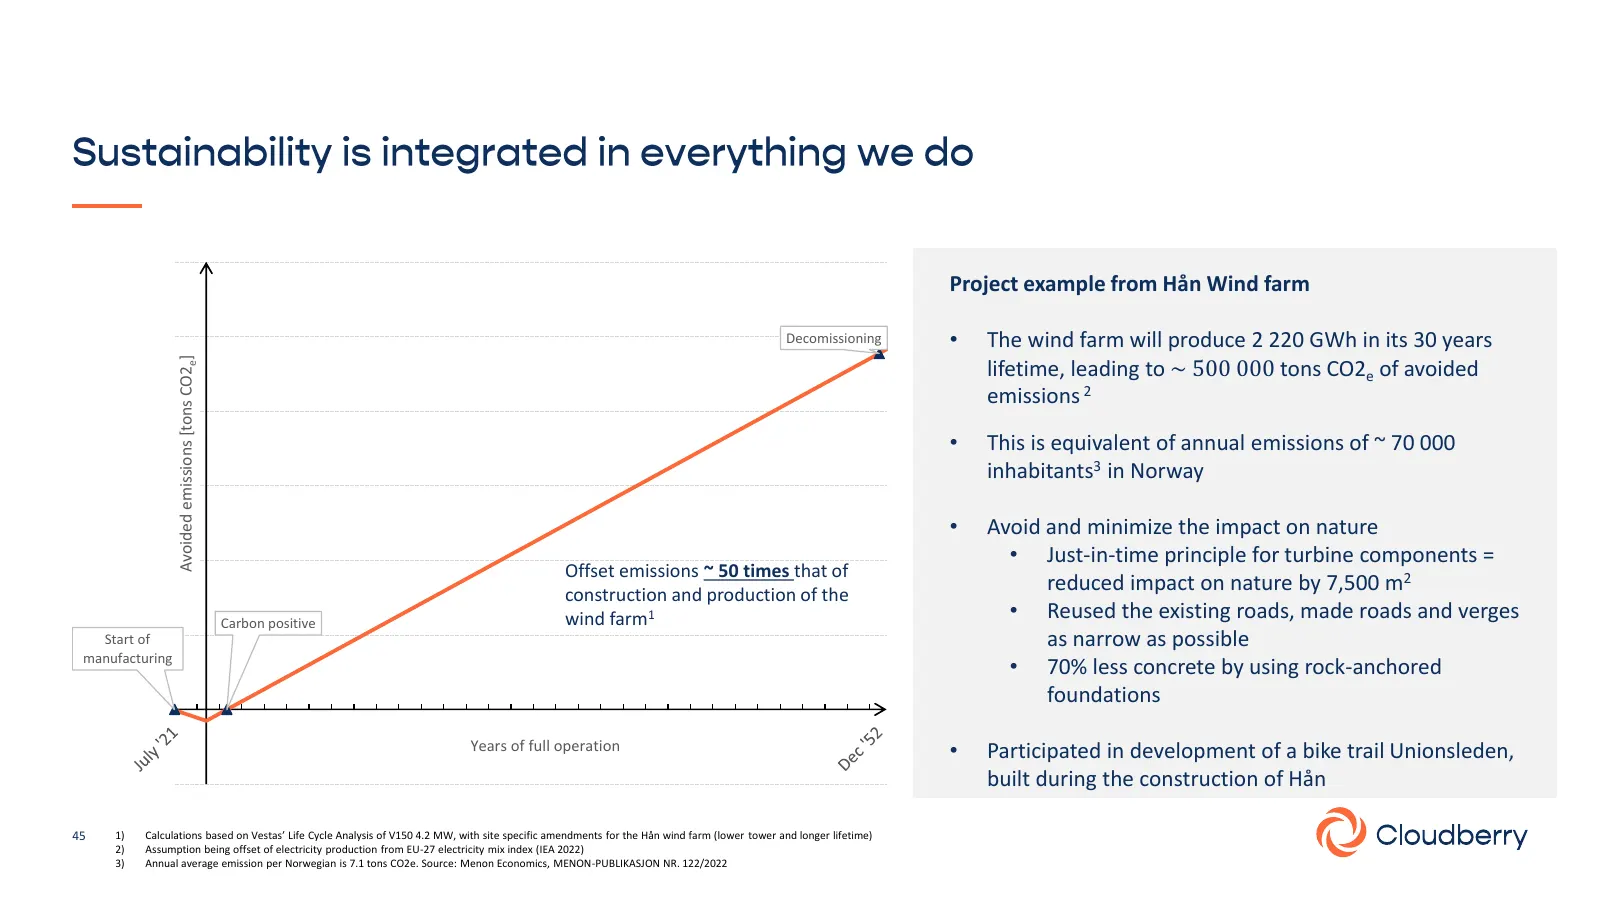
Slide 45: Avoided emissions: Hån wind farm
120 ,000 Project example from Hån Wind farm 100 ,000 Decomissioning • The wind farm will produce 2 220 GWh in its 30 years Avoided emissions [tons CO2e] lifetime, leading to ~ 500 000 tons CO2e of avoided 80, 000 emissions 2 • This is equivalent of annual emissions of ~ 70 000 60, 000 inhabitants3 i
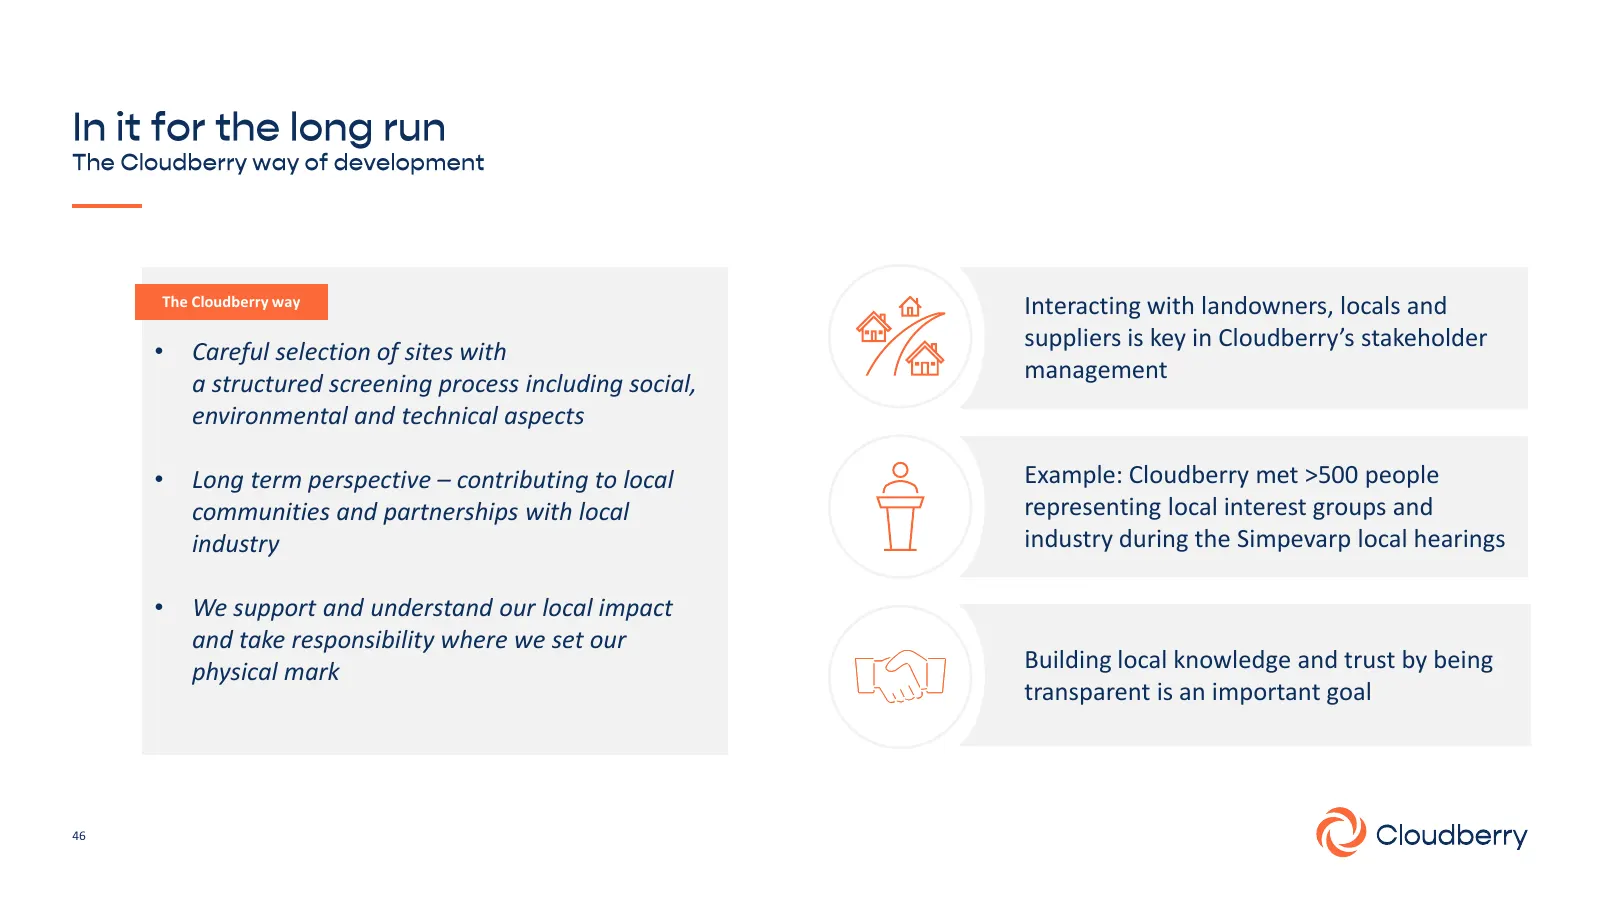
Slide 46: The Cloudberry way: stakeholder management
The Cloudberry way Interacting with landowners, locals and suppliers is key in Cloudberry’s stakeholder • Careful selection of sites with management a structured screening process including social, environmental and technical aspects • Long term perspective – contributing to local Example: Cloudberr
Slide 47: Agenda
11:30 The energy transition Thina Saltvedt 12:00 Perfectly positioned towards Anders Lenborg 2030 12:45 Value creation and capital Christian A. Helland strategy 13:15 Break 13:30 Accelerating Development Charlotte Bergqvist 14:10 Creating Synergies within Stig J. Østebrøt Cloudberry 14:30 Closing re
Slide 48: Captiva Chief Executive Officer
Captiva Chief Executive Officer sjo@captiva.no
Slide 49: Management and digital solutions
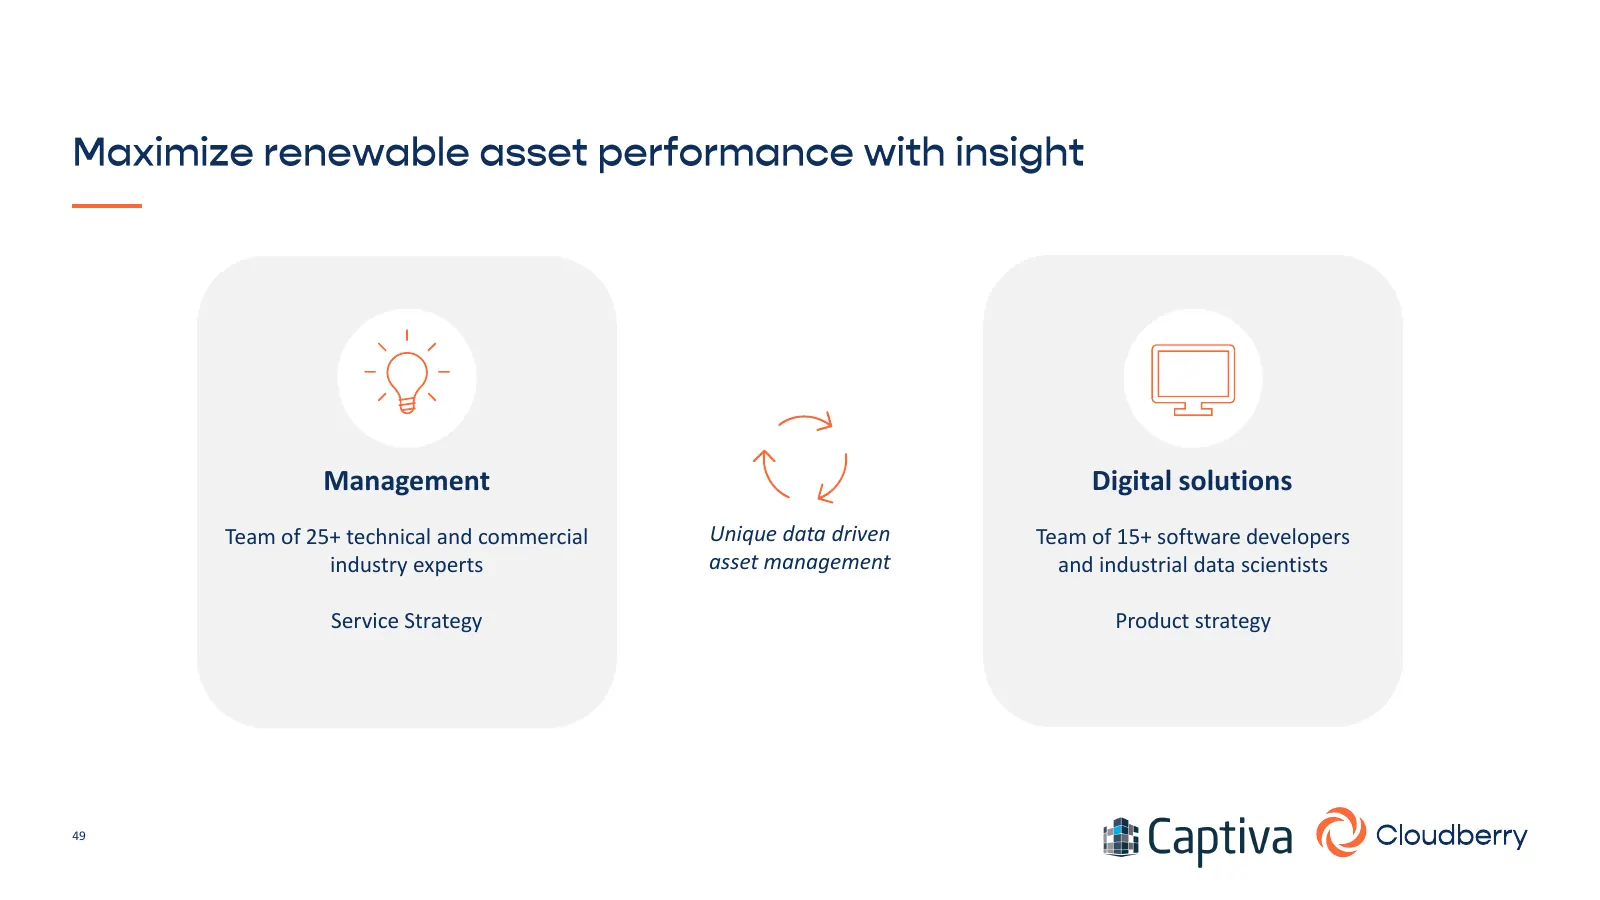
Management Digital solutions Team of 25+ technical and commercial Unique data driven Team of 15+ software developers industry experts asset management and industrial data scientists Service Strategy Product strategy 49
Slide 50: Data, management and digital solutions
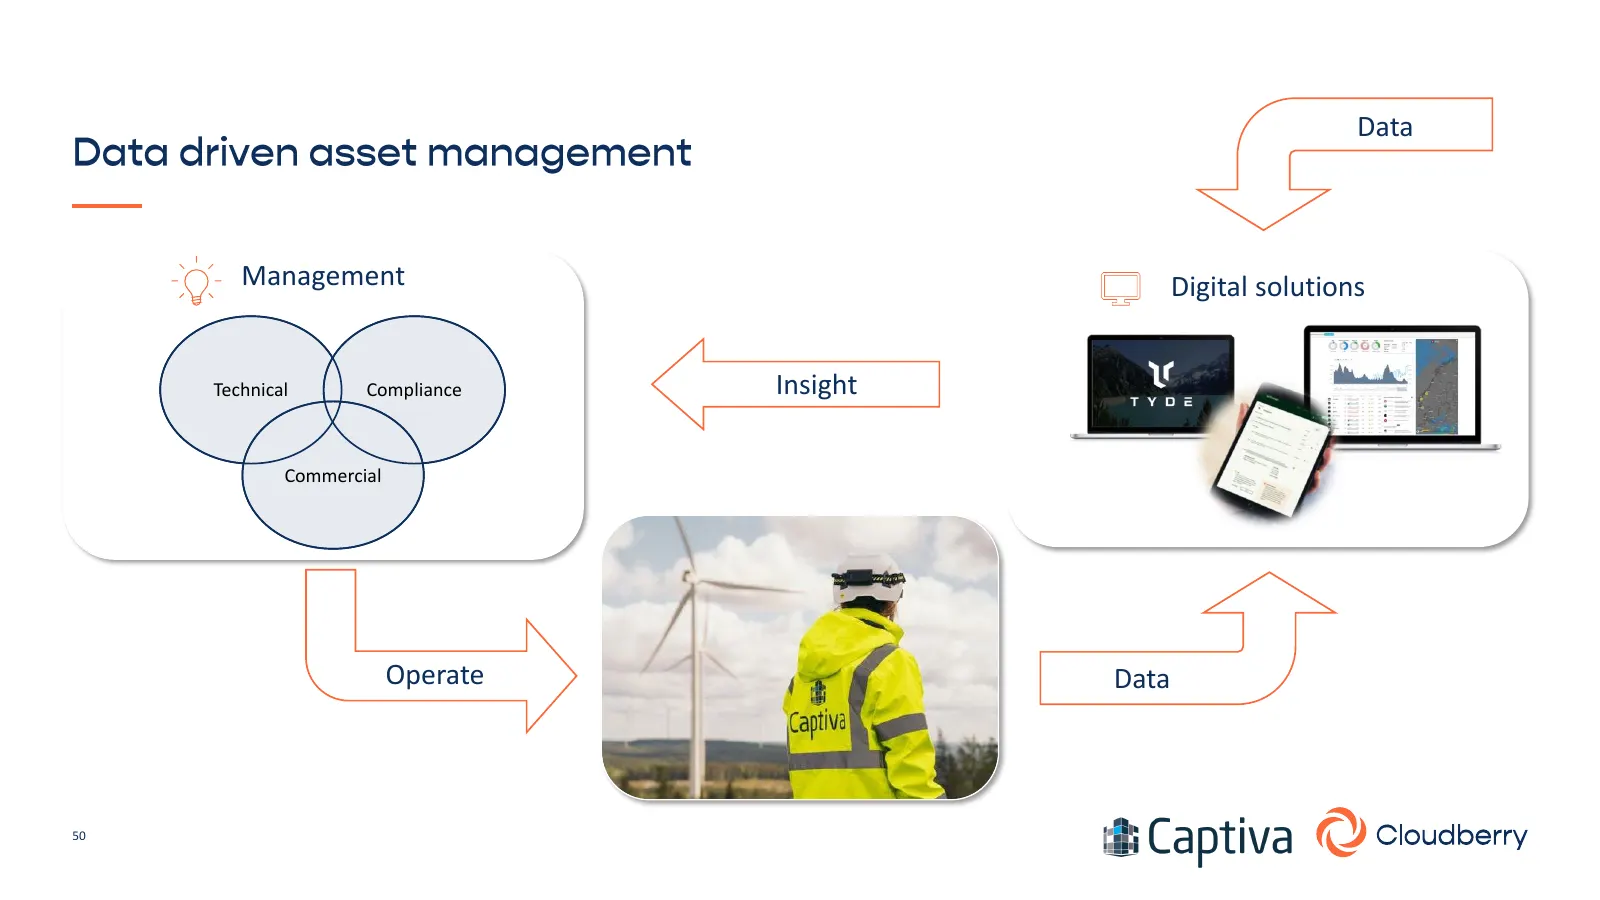
Data Management Digital solutions Technical Compliance Insight Commercial Operate Data 50
Slide 51: Developed for the industry, by the industry
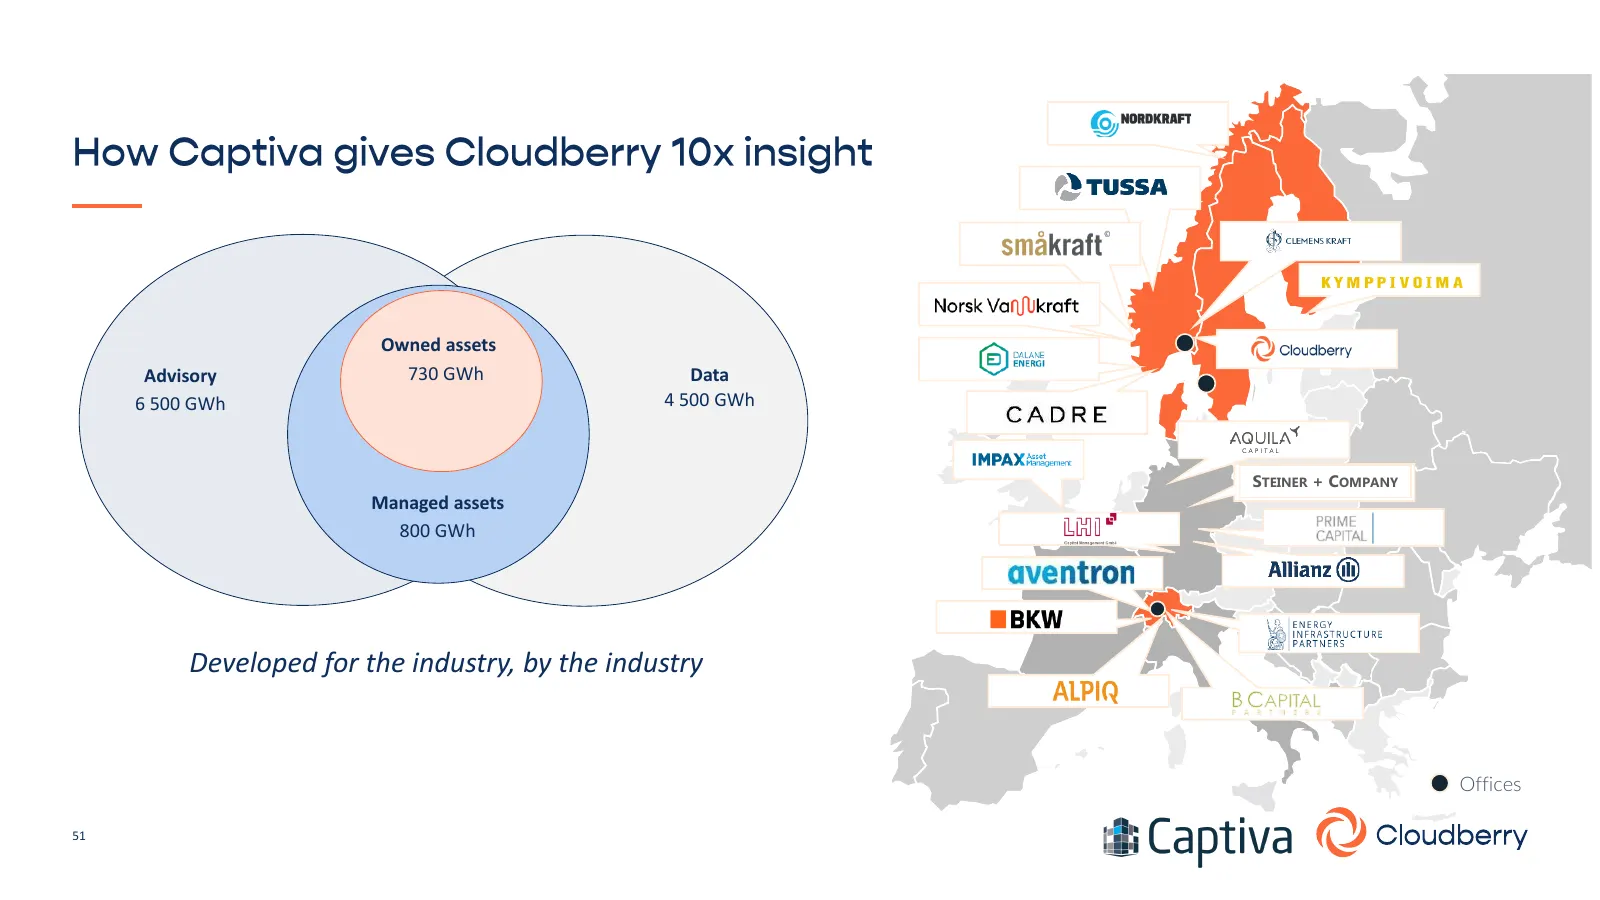
Owned assets Advisory 730 GWh Data 6 500 GWh 4 500 GWh STEINER + COMPANY Managed assets 800 GWh Developed for the industry, by the industry Offices 51
Slide 52: Leveraging Captiva's operational scale through the value chain
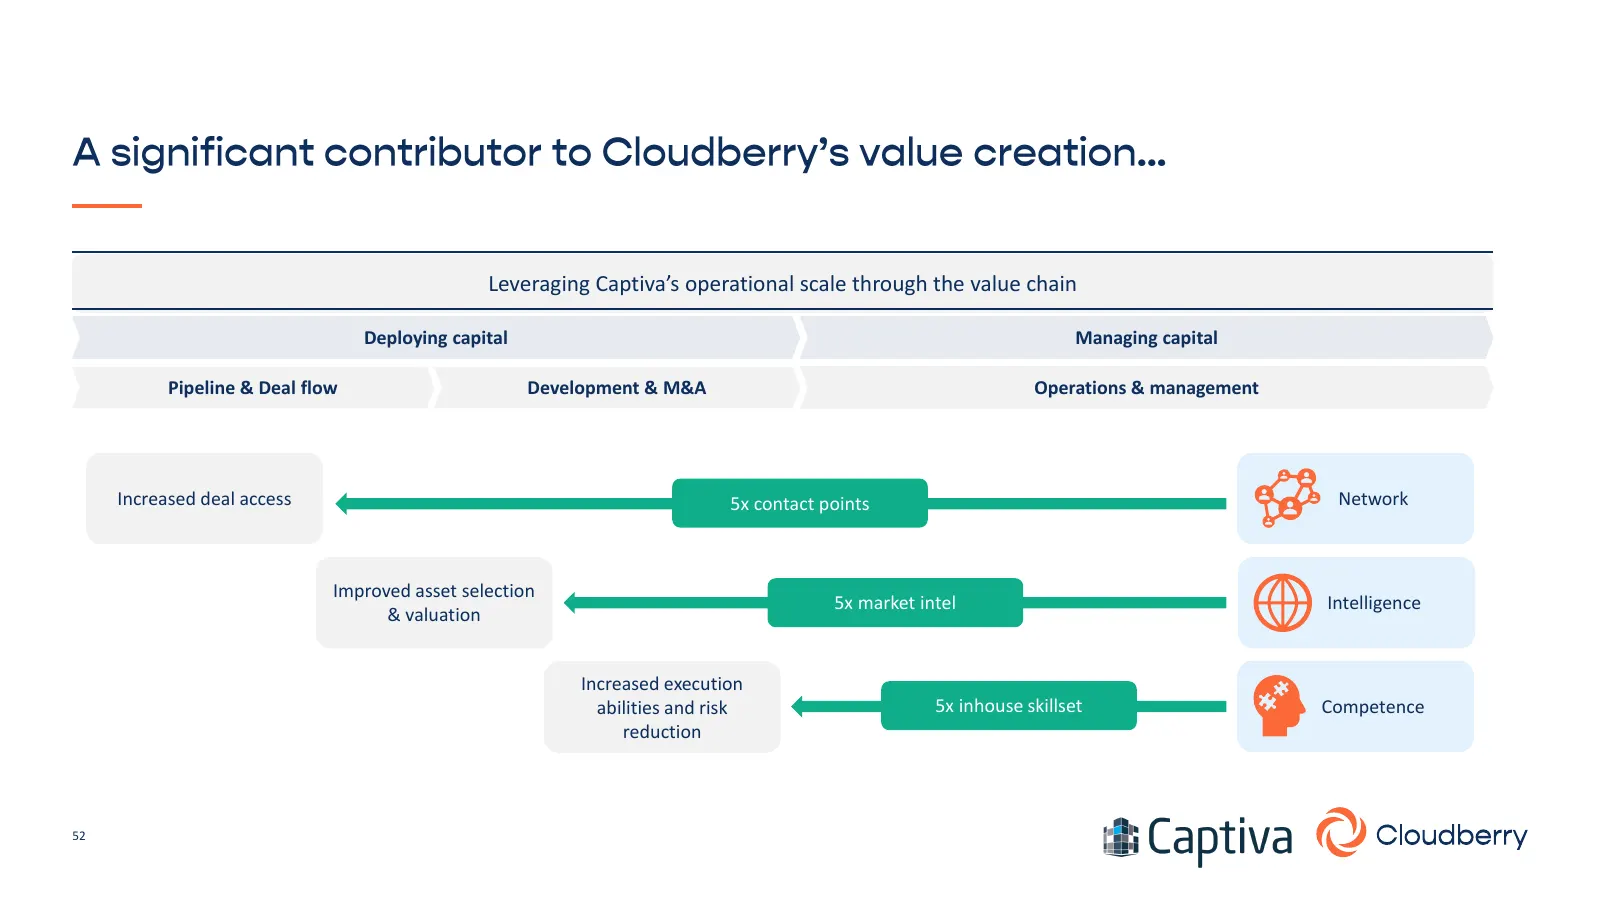
Leveraging Captiva’s operational scale through the value chain Deploying capital Managing capital Pipeline & Deal flow Development & M&A Operations & management Increased deal access 5x contact points Network Improved asset selection 5x market intel Intelligence & valuation Increased execution abili
Slide 53: Pipeline, development, M&A and commercial synergies
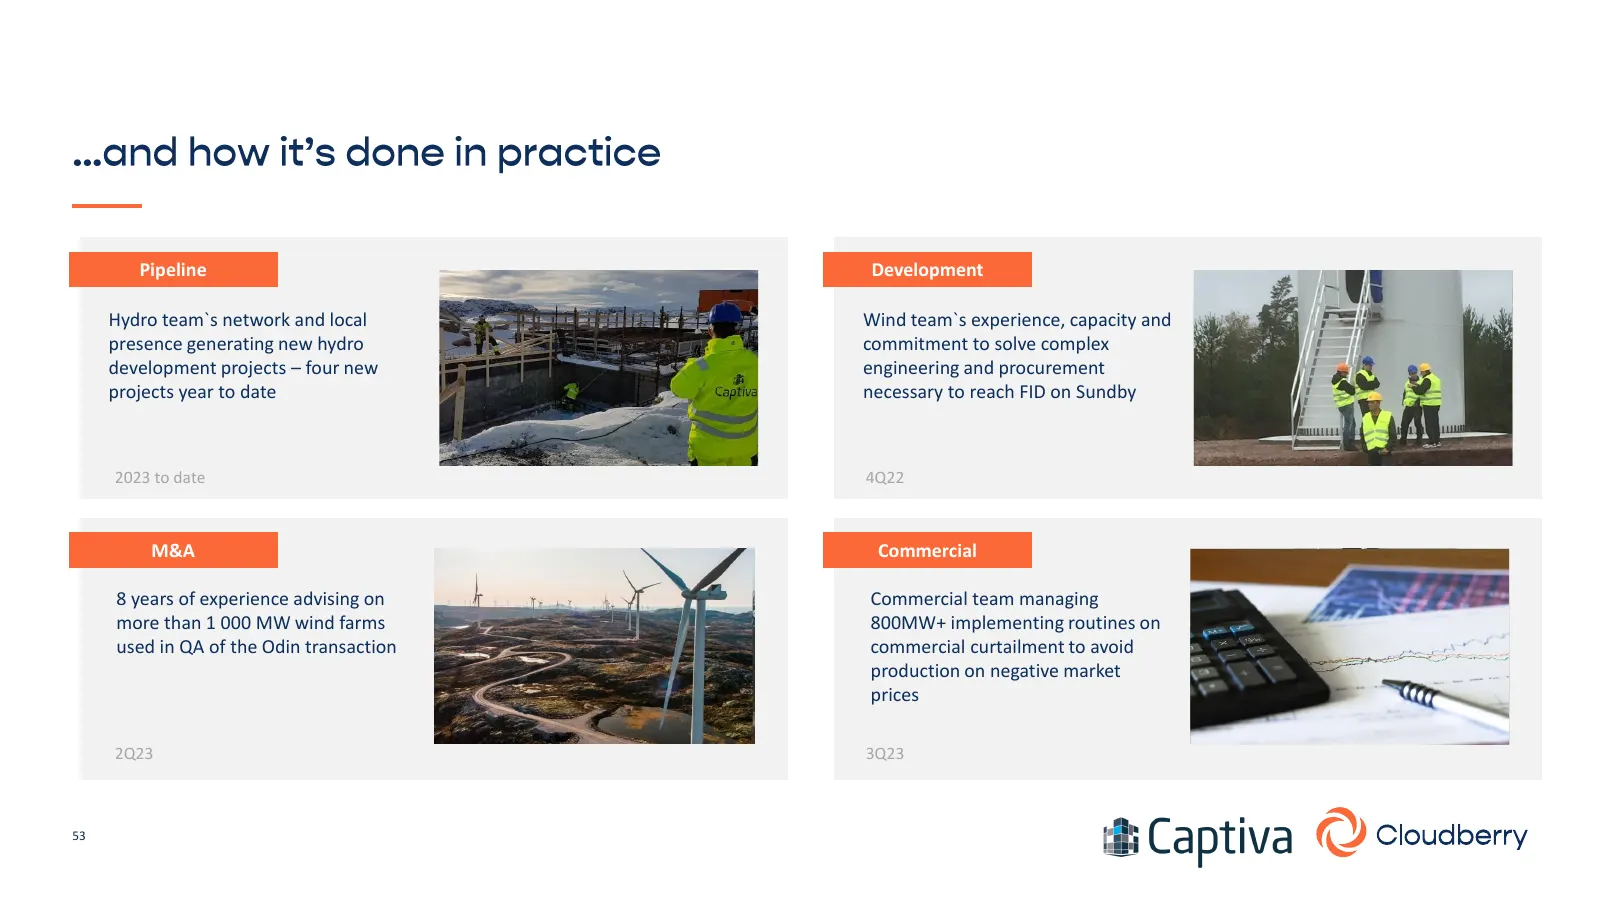
Pipeline Development Hydro team`s network and local Wind team`s experience, capacity and presence generating new hydro commitment to solve complex development projects – four new engineering and procurement projects year to date necessary to reach FID on Sundby 2023 to date 4Q22 M&A Commercial 8 yea
Slide 54: Profitable on stand alone basis plus strong synergies
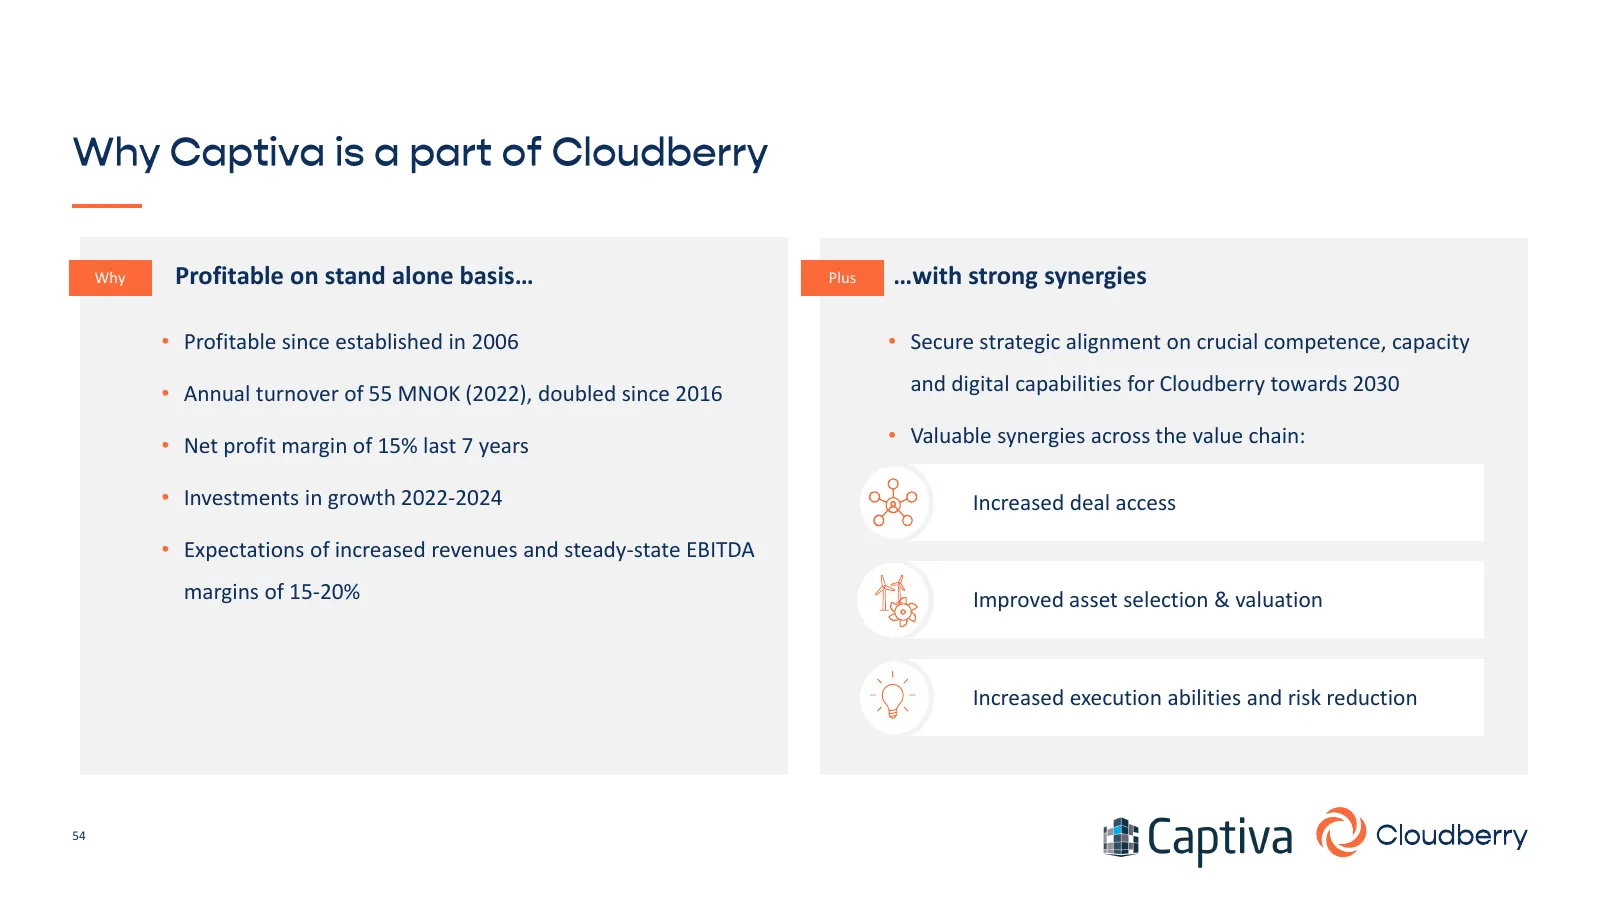
Why Profitable on stand alone basis… Plus …with strong synergies • Profitable since established in 2006 • Secure strategic alignment on crucial competence, capacity • Annual turnover of 55 MNOK (2022), doubled since 2016 and digital capabilities for Cloudberry towards 2030 • Net profit margin of 15%
Slide 55: Agenda
11:30 The energy transition Thina Saltvedt 12:00 Perfectly positioned towards Anders Lenborg 2030 12:45 Value creation and capital Christian A. Helland strategy 13:15 Break 13:30 Accelerating Development Charlotte Bergqvist 14:10 Creating synergies within Stig J. Østebrøt Cloudberry 14:30 Closing re
Slide 56: Uniquely positioned for the energy transition
Uniquely positioned for the energy transition, with a clear strategy, sustainability at core and committed people With a Nordic focus, we utilize our flexible business model to execute on accretive projects and M&A opportunities A strong balance sheet - positioned for further profitable growth 56

Slide 57: Cloudberry
Q Cloudberry
Source: Internet Archive copy of cloudberry.no
More decks from Cloudberry Clean Energy ASA
 Q3 2026 Earnings Presentation19 slides · Nov 4, 2026
 Pareto Securities' Energy Conference 202615 slides · Sep 16, 2026
 Q2 2026 Earnings Presentation24 slides · Aug 19, 2026
 Q1 2026 Earnings Presentation22 slides · May 12, 2026
 Q4 2025 Earnings Presentation23 slides · Feb 10, 2026
 Q3 2025 Earnings Presentation22 slides · Nov 4, 2025