Aspen Insurance Holdings Ltd · NYSE:AHL/PE
Aspen Insurance — Investor Presentation (November 2009)
35 slides from Aspen Insurance's investor presentation, Nov 16, 2009

Slide 1: Investor Presentation November/December 2009
Aspen Insurance Holdings Limited Chris O'Kane Chief Executive Officer Richard Houghton Chief Financial Officer November/December 2009 Investor Presentation
Slide 2: Safe Harbor Disclosure
2 Safe Harbor Disclosure This slide presentation is for information purposes only. It should be read in conjunction with our financial supplement posted on our website on the Investor Relations page and with other documents filed by Aspen Insurance Holdings Limited (the "Company" or "Aspen") with th
Slide 3: Contents
3 Contents Introduction and Shareholder Value Drivers Review of Underwriting Platforms and Strategy Market Conditions Q3 2009 Results Highlights Liquidity and Capital Position Appendix
Slide 4: Aspen at a Glance: Overview
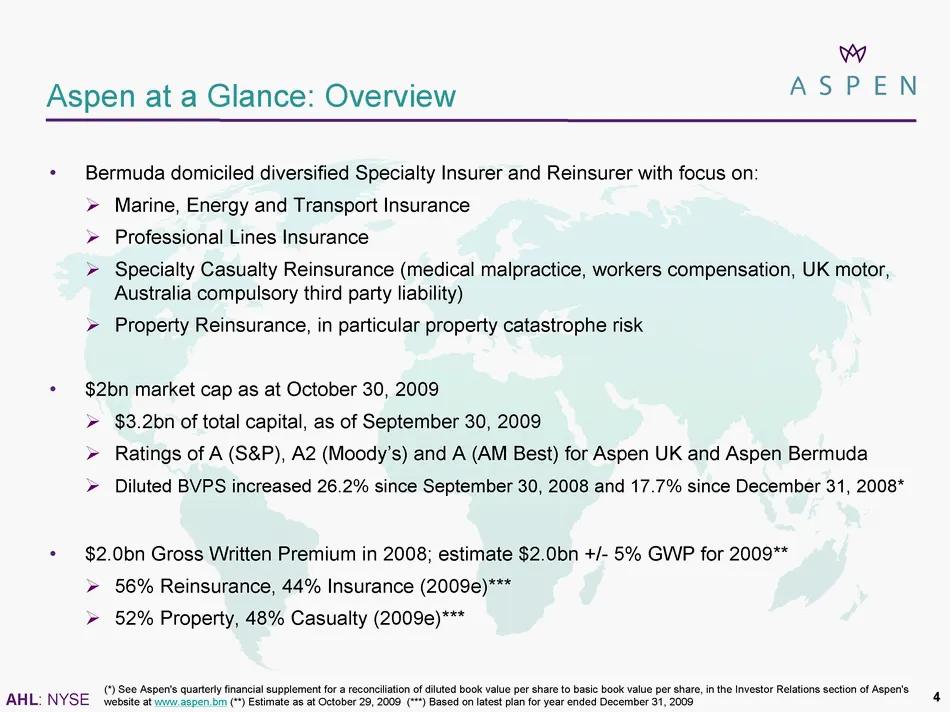
4 Aspen at a Glance: Overview Bermuda domiciled diversified Specialty Insurer and Reinsurer with focus on: ? Marine, Energy and Transport Insurance ? Professional Lines Insurance ? Specialty Casualty Reinsurance (medical malpractice, workers compensation, UK motor, Australia compulsory third party l
Slide 5: Drivers of Value for our Shareholders
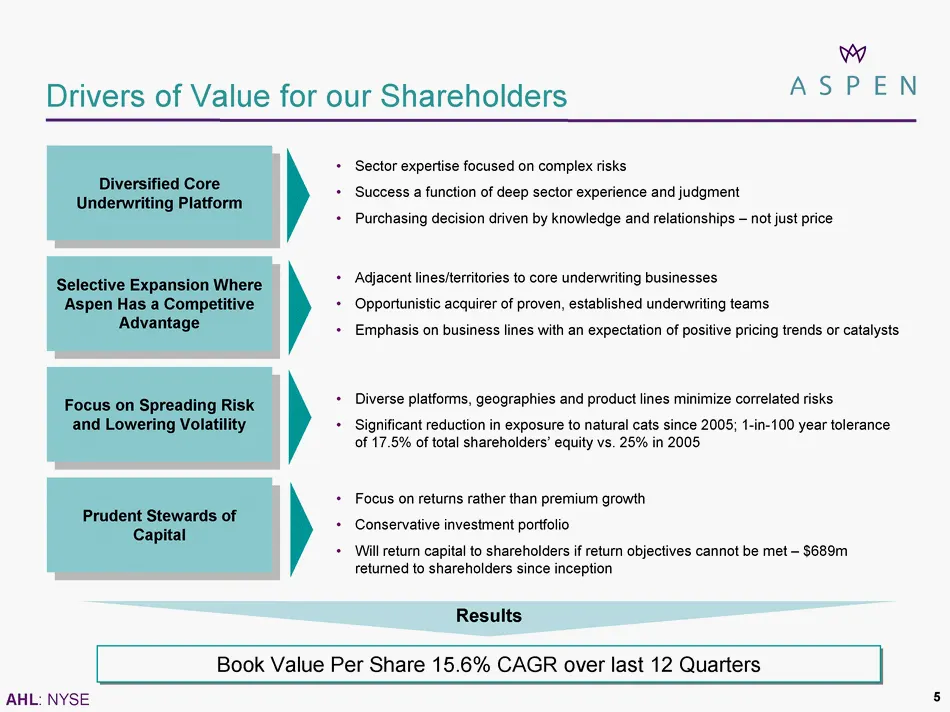
Drivers of Value for our Shareholders Diversified Core Underwriting Platform Selective Expansion Where Aspen Has a Competitive Advantage Focus on Spreading Risk and Lowering Volatility Prudent Stewards of Capital Sector expertise focused on complex risks Success a function of deep sector experience
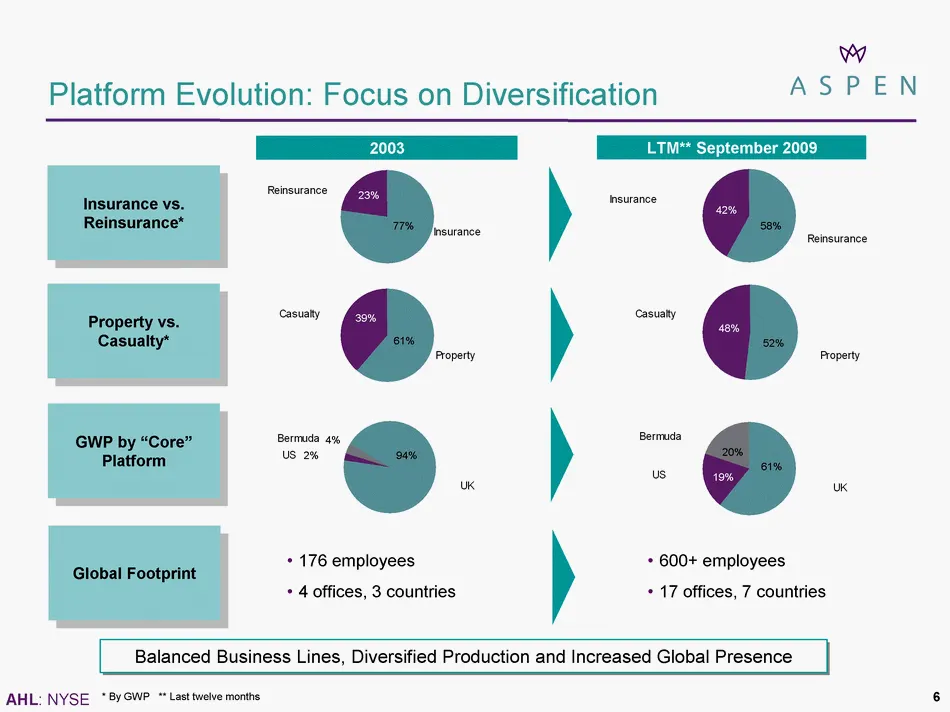
Slide 6: Platform Evolution: Focus on Diversification
6 Platform Evolution: Focus on Diversification Insurance vs. Reinsurance* Property vs. Casualty* GWP by "Core" Platform Global Footprint 2003 176 employees 4 offices, 3 countries 600+ employees 17 offices, 7 countries Balanced Business Lines, Diversified Production and Increased Global Presence LTM*
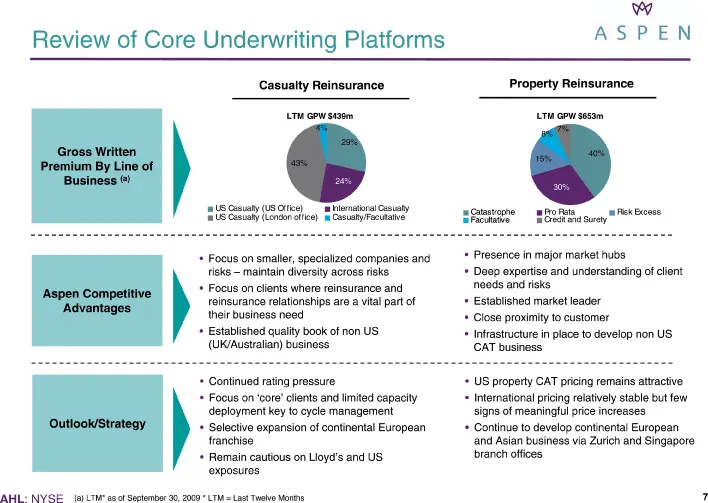
Slide 7: Review of Core Underwriting Platforms
7 Review of Core Underwriting Platforms 30 Gross Written Premium By Line of Business (a) Aspen Competitive Advantages Outlook/Strategy (a) LTM* as of September 30, 2009 * LTM = Last Twelve Months Focus on smaller, specialized companies and risks - maintain diversity across risks Focus on clients whe
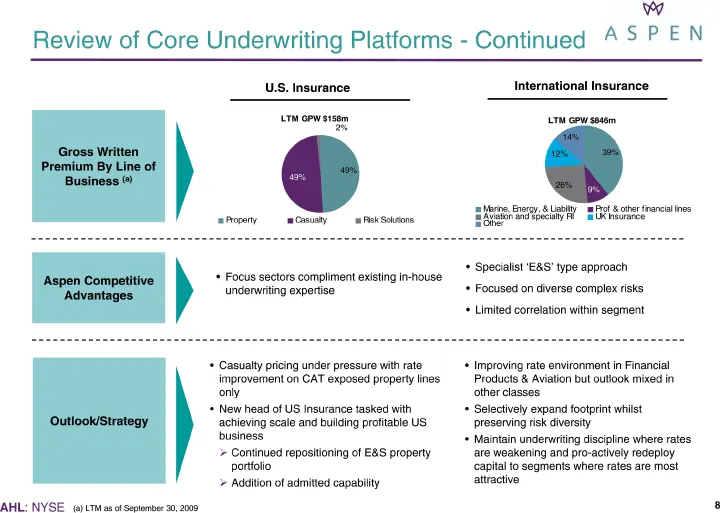
Slide 8: Review of Core Underwriting Platforms - Continued
8 Review of Core Underwriting Platforms - Continued 30 (a) LTM as of September 30, 2009 Specialist 'E&S' type approach Focused on diverse complex risks Limited correlation within segment Improving rate environment in Financial Products & Aviation but outlook mixed in other classes Selectively expand
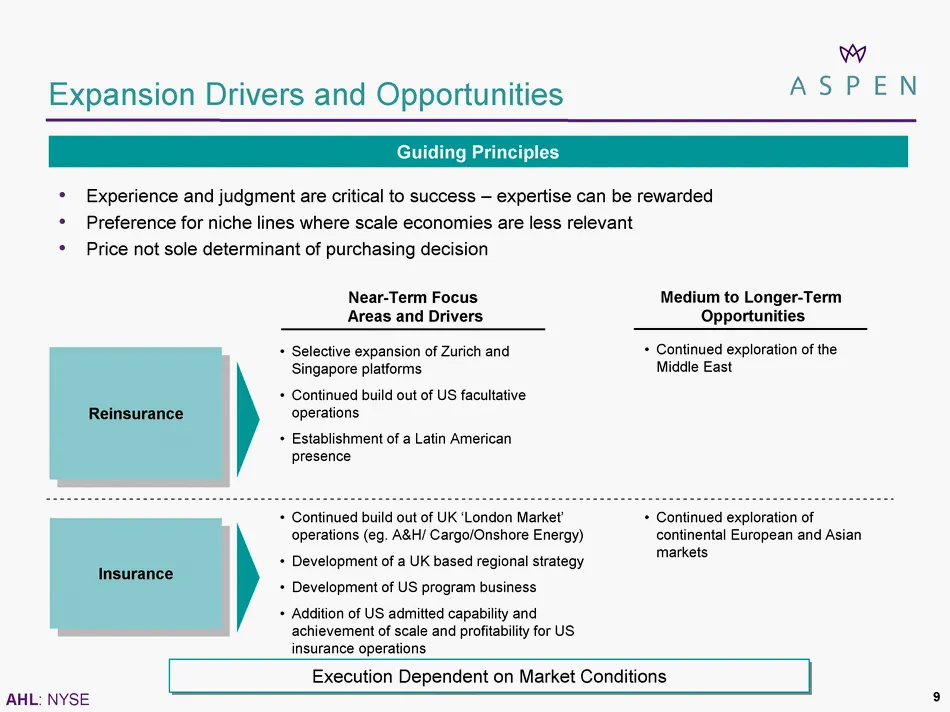
Slide 9: Expansion Drivers and Opportunities
9 Expansion Drivers and Opportunities Near-Term Focus Areas and Drivers Medium to Longer-Term Opportunities Continued build out of UK 'London Market' operations (eg. A&H/ Cargo/Onshore Energy) Development of a UK based regional strategy Development of US program business Addition of US admitted capa
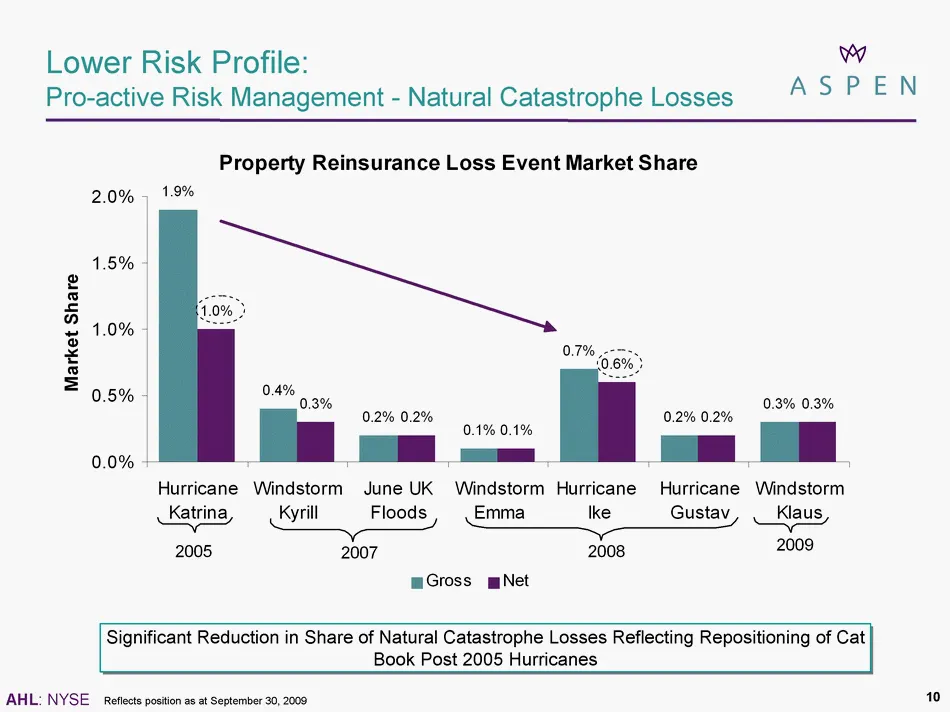
Slide 10: Lower Risk Profile: Pro-active Risk Management - Natural Catastrophe Losses
Lower Risk Profile: Pro-active Risk Management - Natural Catastrophe Losses Reflects position as at September 30, 2009 Significant Reduction in Share of Natural Catastrophe Losses Reflecting Repositioning of Cat Book Post 2005 Hurricanes 10
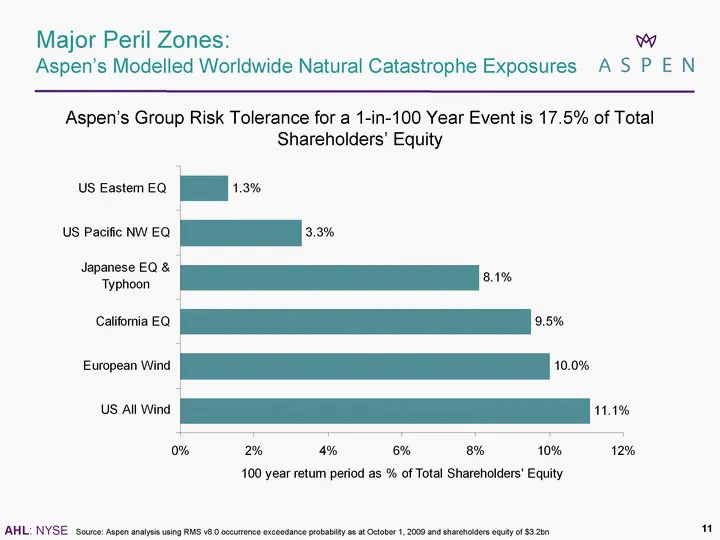
Slide 11: Major Peril Zones: Modelled Worldwide Natural Catastrophe Exposures
Major Peril Zones: Aspen's Modelled Worldwide Natural Catastrophe Exposures Source: Aspen analysis using RMS v8.0 occurrence exceedance probability as at 1 October 2009 Aspen's Group Risk Tolerance for a 1-in-100 Year Event is 17.5% of Total Shareholders' Equity 11
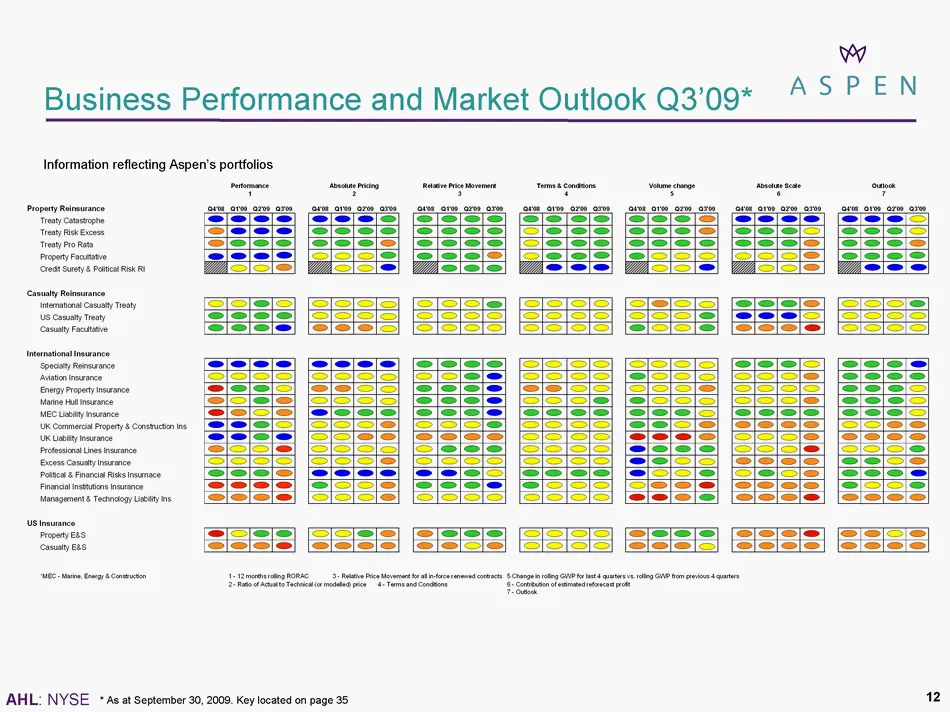
Slide 12: Business Performance and Market Outlook Q3'09
Business Performance and Market Outlook Q3'09* Information reflecting Aspen's portfolios * As at September 30, 2009. Key located on page 35 12
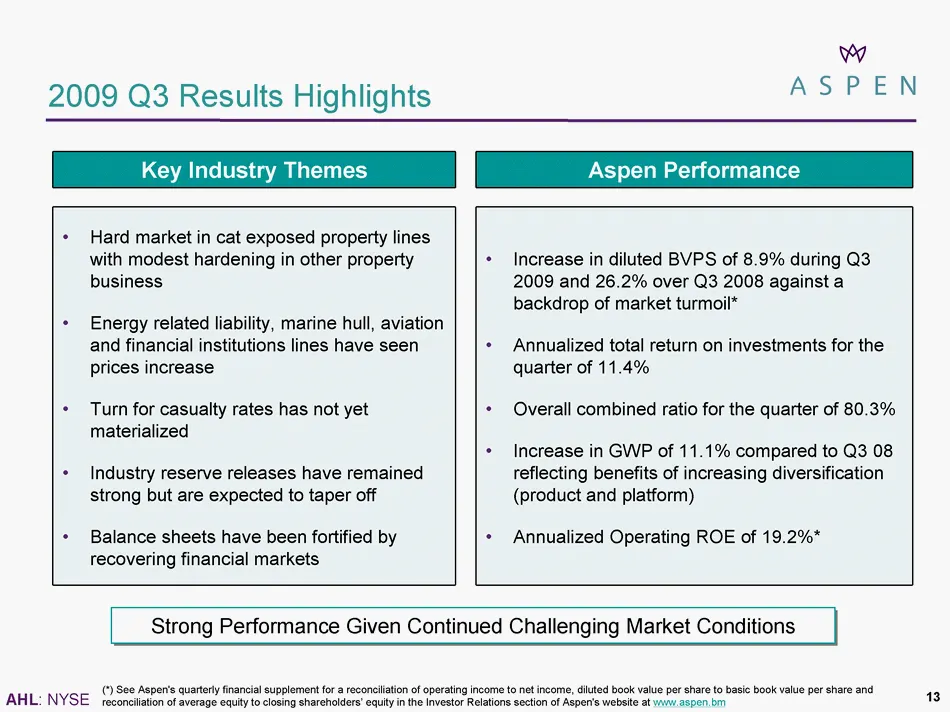
Slide 13: 2009 Q3 Results Highlights
13 2009 Q3 Results Highlights Key Industry Themes Aspen Performance Hard market in cat exposed property lines with modest hardening in other property business Energy related liability, marine hull, aviation and financial institutions lines have seen prices increase Turn for casualty rates has not ye
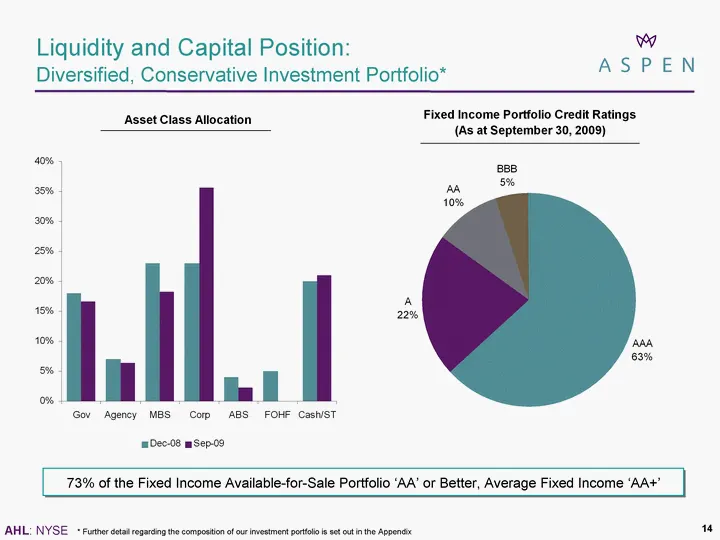
Slide 14: Liquidity and Capital Position: Diversified, Conservative Investment Portfolio
14 Liquidity and Capital Position: Diversified, Conservative Investment Portfolio* 73% of The Fixed Income Available-for-Sale Portfolio 'AA' or Better, Average Fixed Income 'AA+' * Further detail regarding the composition of our investment portfolio is set out in the Appendix
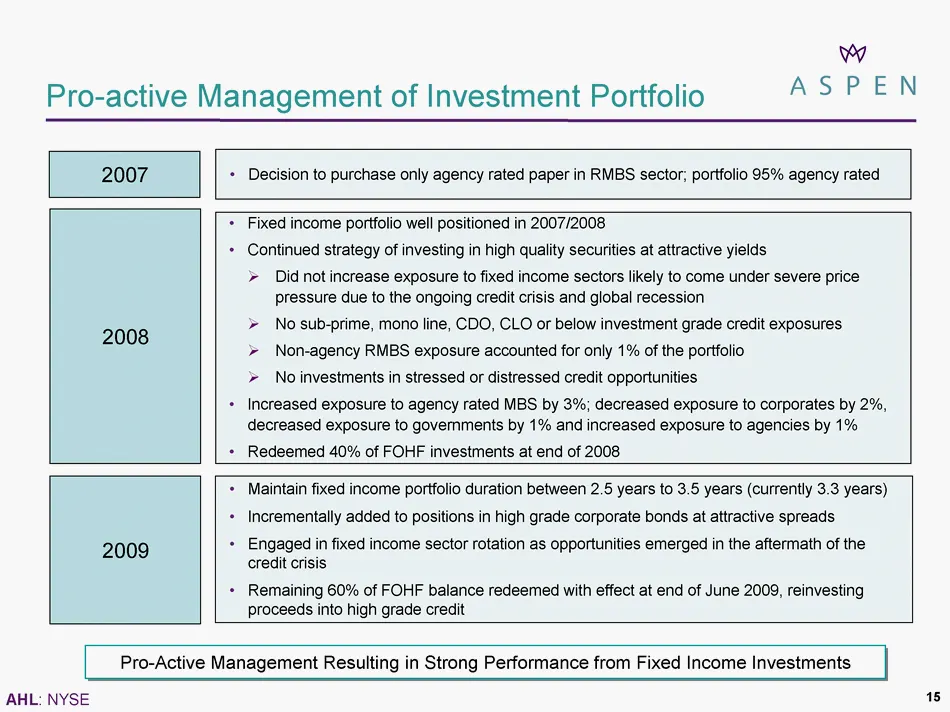
Slide 15: Pro-active Management of Investment Portfolio
15 Pro-active Management of Investment Portfolio Decision to purchase only agency rated paper in RMBS sector; portfolio 95% agency rated 2007 Pro-Active Management Resulting in Strong Performance from Fixed Income Investments Fixed income portfolio well positioned in 2007/2008 Continued strategy of
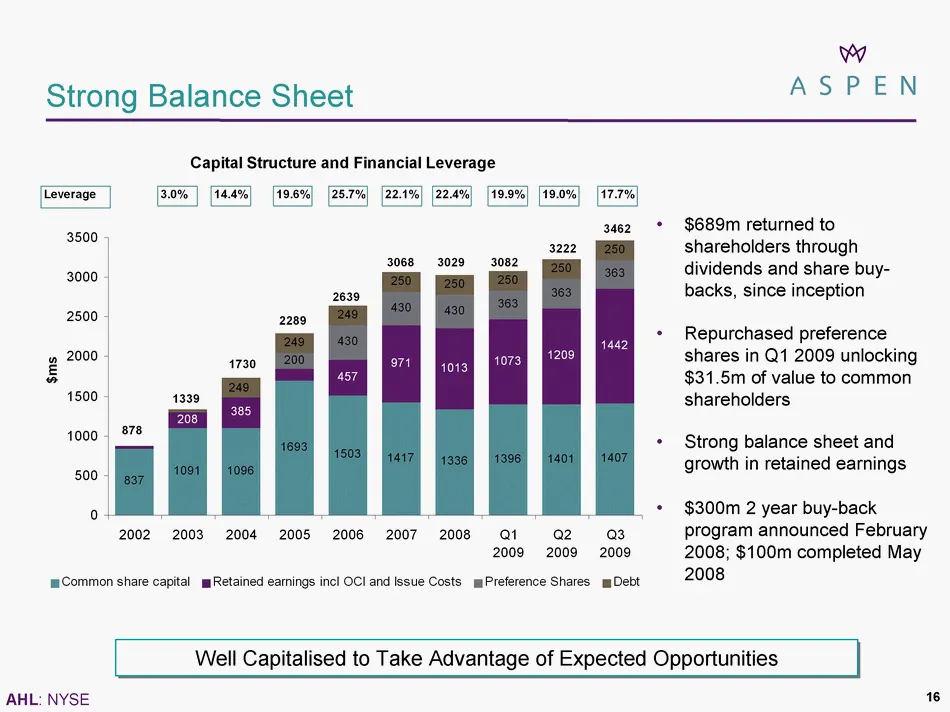
Slide 16: Strong Balance Sheet
16 Strong Balance Sheet $689m returned to shareholders through dividends and share buy- backs, since inception Repurchased preference shares in Q1 2009 unlocking $31.5m of value to common shareholders Strong balance sheet and growth in retained earnings $300m 2 year buy-back program announced Februa
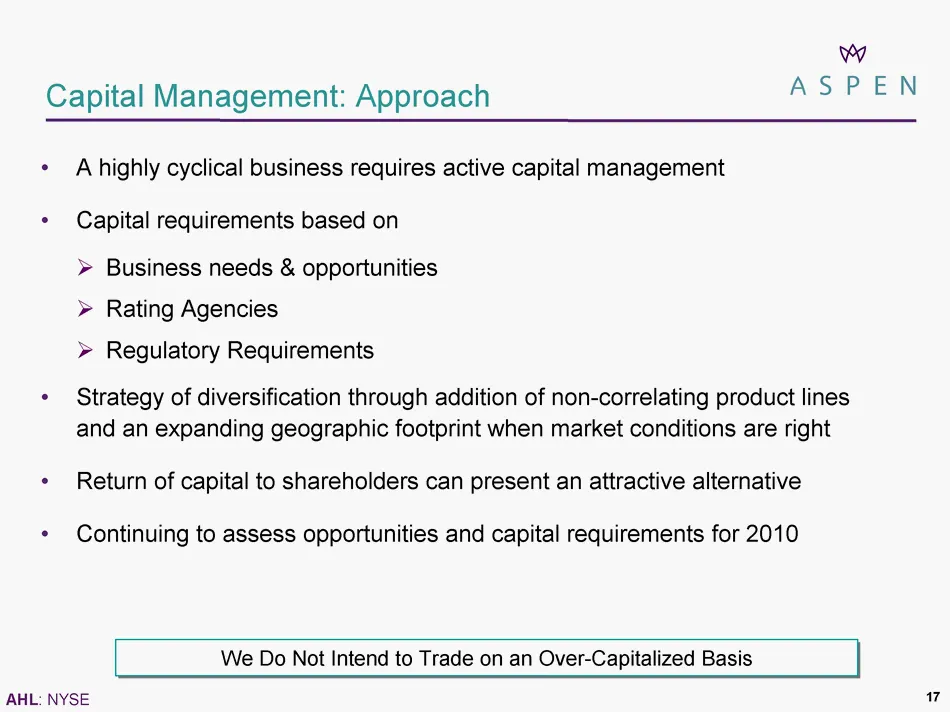
Slide 17: Capital Management: Approach
Capital Management: Approach A highly cyclical business requires active capital management Capital requirements based on ? Business needs & opportunities ? Rating Agencies ? Regulatory Requirements Strategy of diversification through addition of non-correlating product lines and an expanding geograp
Slide 18: Growth in Book Value Per Share and ROE
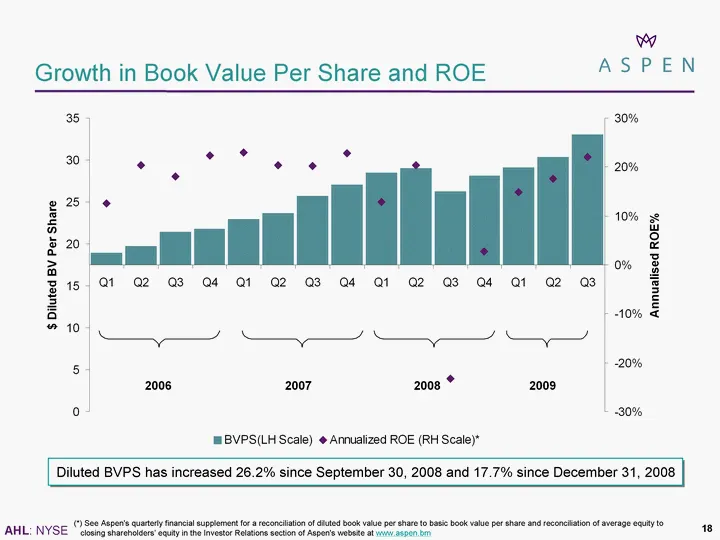
Growth in Book Value Per Share and ROE (*) See Aspen's quarterly financial supplement for a reconciliation of diluted book value per share to basic book value per share, reconciliation of average equity to closing shareholders' equity in the Investor Relations section of Aspen's website at www.aspen
Slide 19: Conclusions
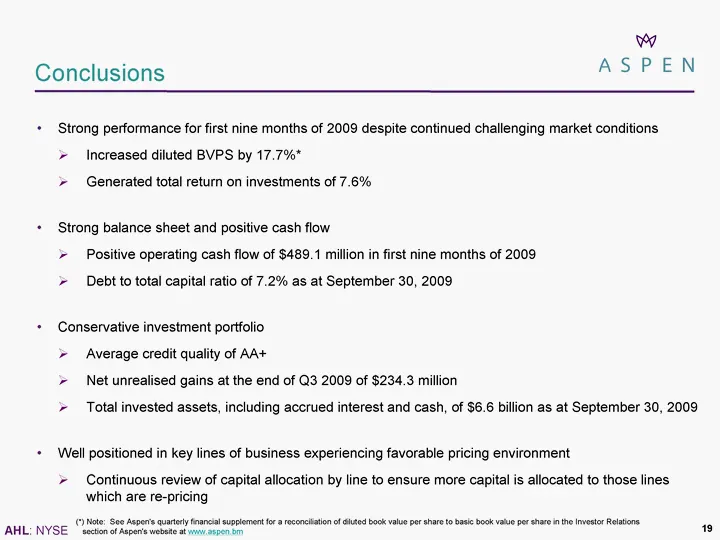
Strong performance for first nine months of 2009 despite continued challenging market conditions ? Increased diluted BVPS by 17.7%* ? Generated total return on investments of 6.7% Strong balance sheet and positive cash flow ? Positive operating cash flow of $489.1 million in first nine months of 200
Slide 20: Appendix
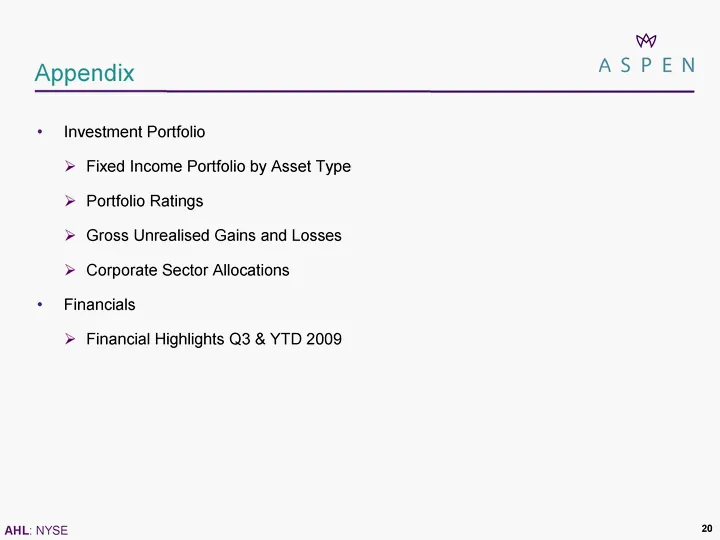
20 Appendix Investment Portfolio ? Fixed Income Portfolio by Asset Type ? Portfolio Ratings ? Gross Unrealised Gains and Losses ? Corporate Sector Allocations Lower Risk Profile Financials ? Financial Highlights Q3 & YTD 2009
Slide 21: Fixed Income Portfolio by Asset Type
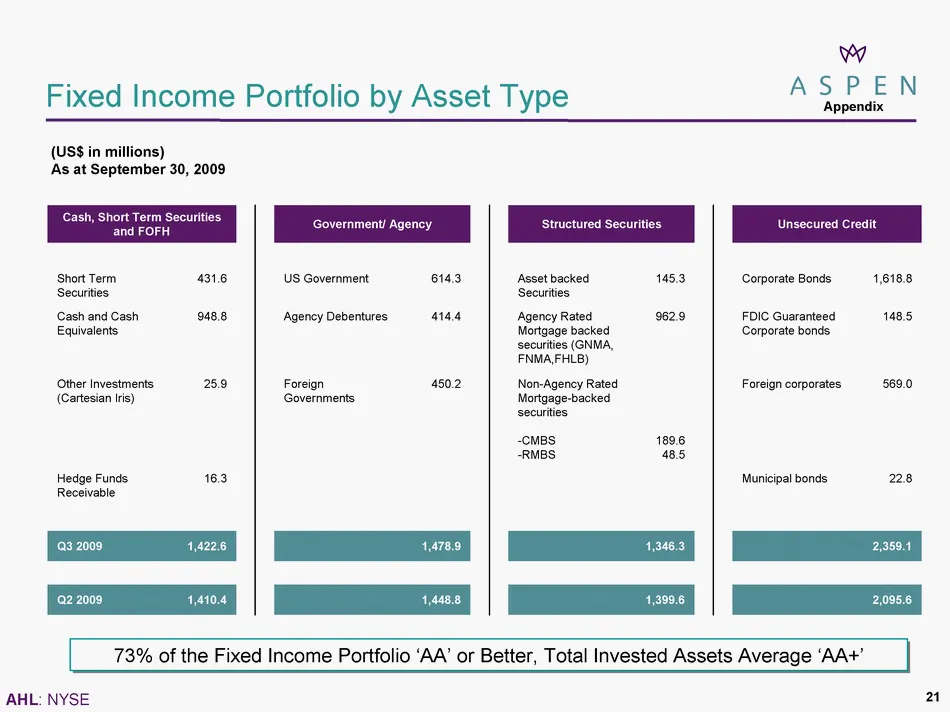
Fixed Income Portfolio by Asset Type (US$ in millions) As at September 30, 2009 73% of the Fixed Income Portfolio 'AA' or Better, Total Invested Assets Average 'AA+' Appendix 21 Cash, Short Term Securities and FOFH Cash, Short Term Securities and FOFH Government/ Agency Government/ Agency Structured
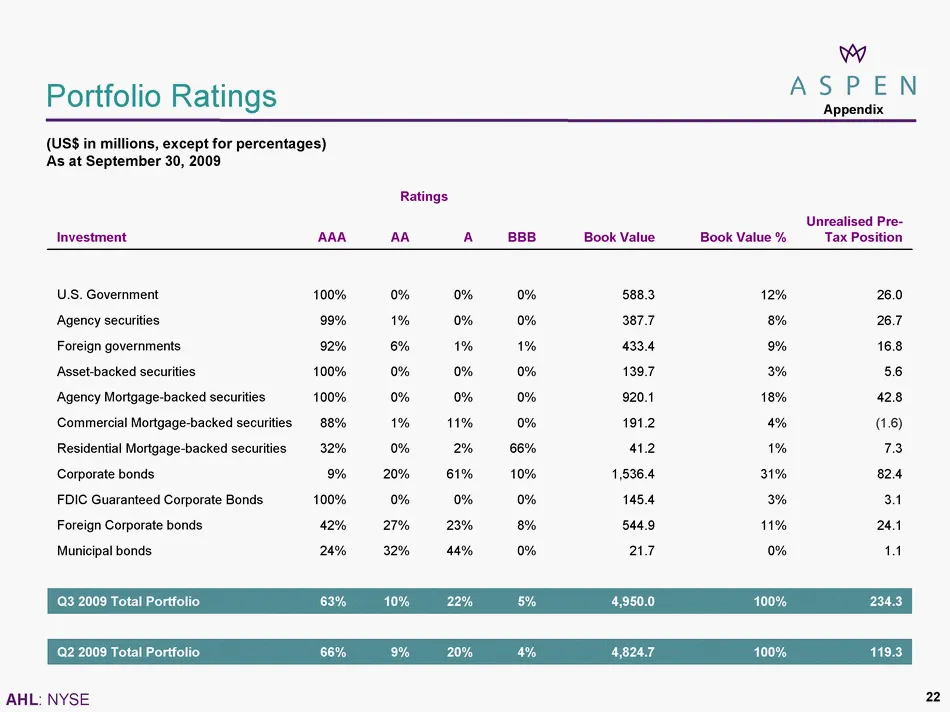
Slide 22: Portfolio Ratings
22 Portfolio Ratings Appendix Ratings Ratings Ratings Ratings Investment AAA AA A BBB Book Value Book Value % Unrealised Pre-Tax Position U.S. Government 100% 0% 0% 0% 588.3 12% 26.0 Agency securities 99% 1% 0% 0% 387.7 8% 26.7 Foreign governments 92% 6% 1% 1% 433.4 9% 16.8 Asset-backed securities 1
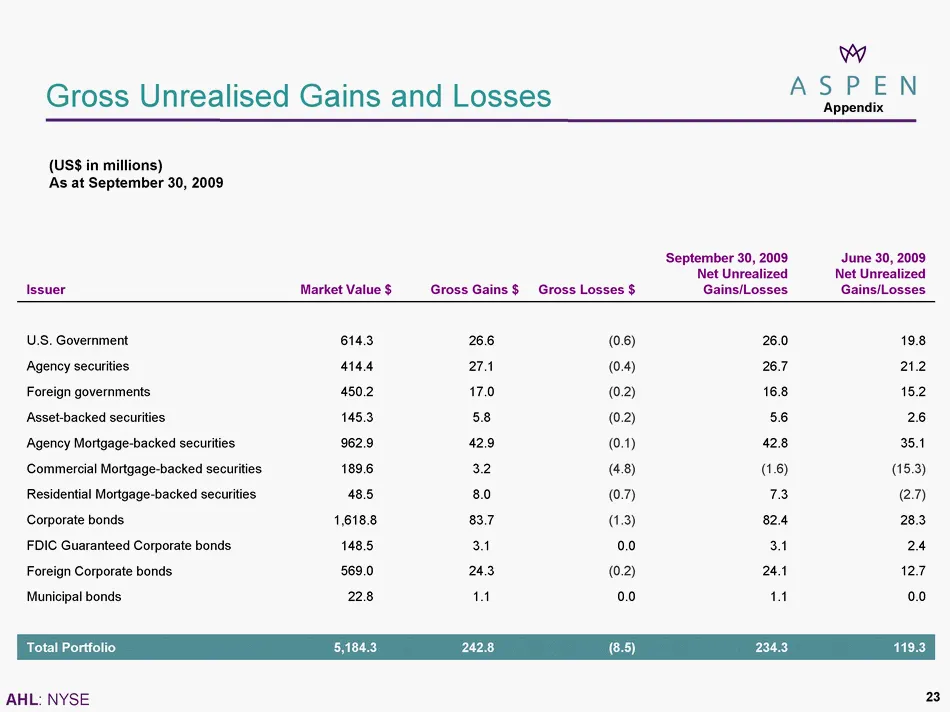
Slide 23: Gross Unrealised Gains and Losses
23 Gross Unrealised Gains and Losses Appendix (US$ in millions) As at September 30, 2009 Issuer Market Value $ Gross Gains $ Gross Losses $ September 30, 2009 Net Unrealized Gains/Losses June 30, 2009 Net Unrealized Gains/Losses U.S. Government 614.3 26.6 (0.6) 26.0 19.8 Agency securities 414.4 27.1
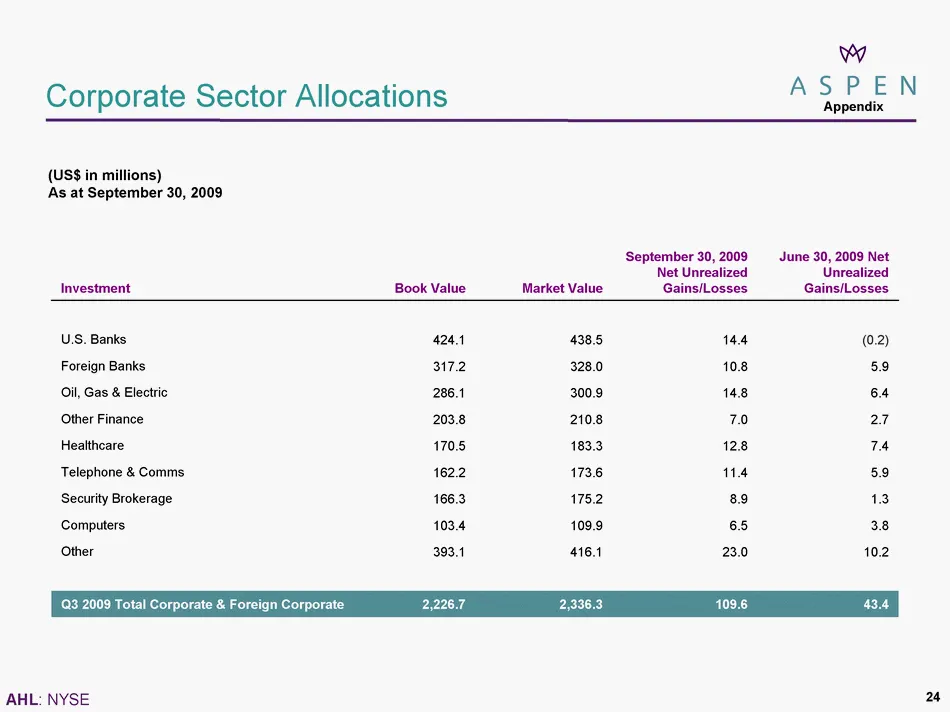
Slide 24: Corporate Sector Allocations
24 Corporate Sector Allocations Appendix (US$ in millions) As at September 30, 2009 Investment Book Value Market Value September 30, 2009 Net Unrealized Gains/Losses June 30, 2009 Net Unrealized Gains/Losses U.S. Banks 424.1 438.5 14.4 (0.2) Foreign Banks 317.2 328.0 10.8 5.9 Oil, Gas & Electric 286
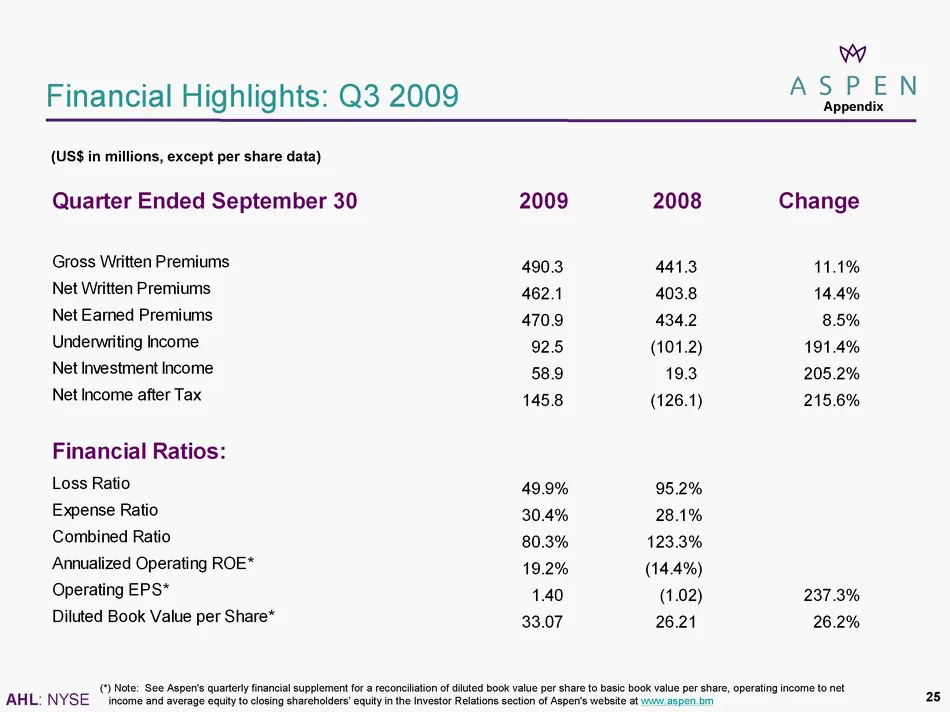
Slide 25: Financial Highlights: Q3 2009
Financial Highlights: Q3 2009 (US$ in millions, except per share data) (*) Note: See Aspen's quarterly financial supplement for a reconciliation of diluted book value per share to basic book value per share, operating income to net income and average equity to closing shareholders' equity in the Inv
Slide 26: Financial Highlights: Q3 2009 YTD
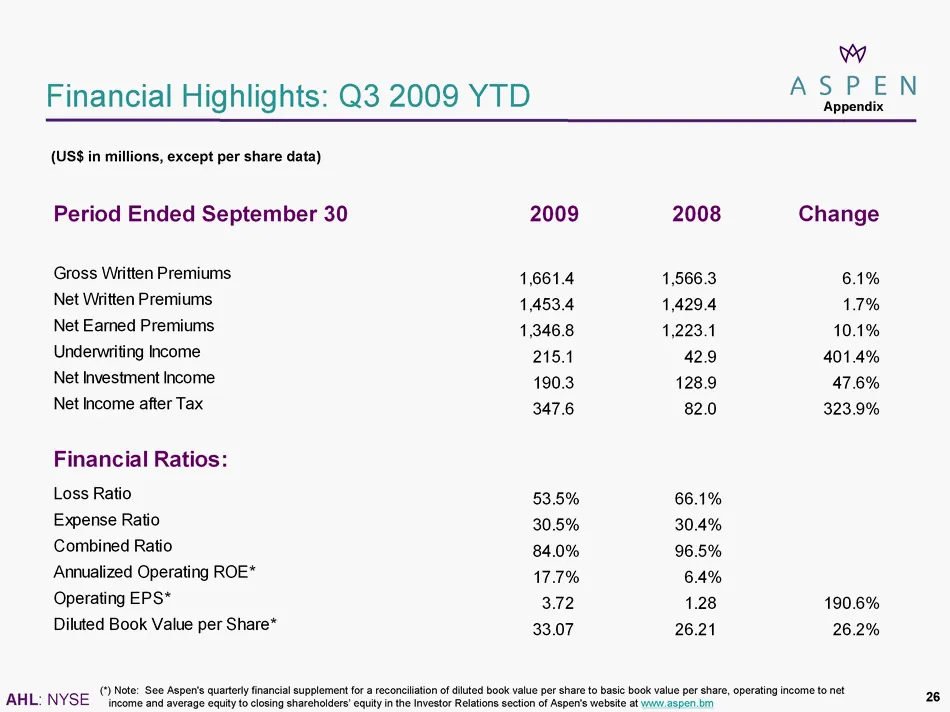
Financial Highlights: Q3 2009 YTD (US$ in millions, except per share data) Appendix 26 (*) Note: See Aspen's quarterly financial supplement for a reconciliation of diluted book value per share to basic book value per share, operating income to net income and average equity to closing shareholders' e
Slide 27: Financial Highlights: Group Summary Q3 2009
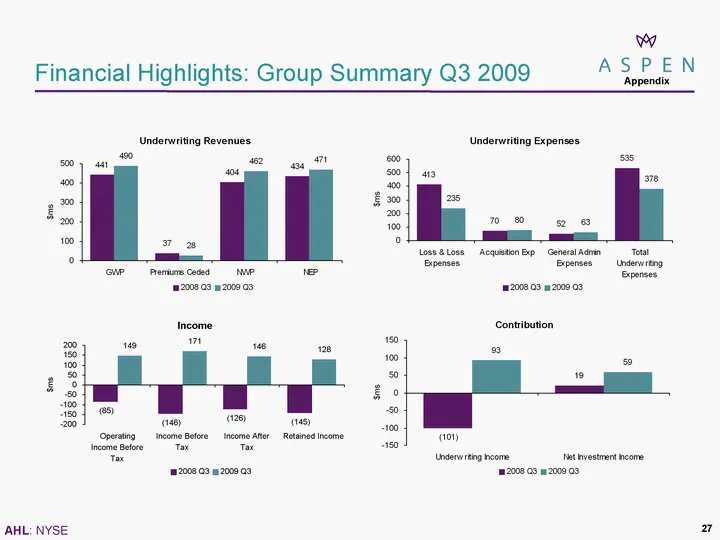
Financial Highlights: Group Summary Q3 2009 Appendix Appendix Appendix Appendix Appendix 27
Slide 28: Financial Highlights: Group Summary Q3 2009 YTD
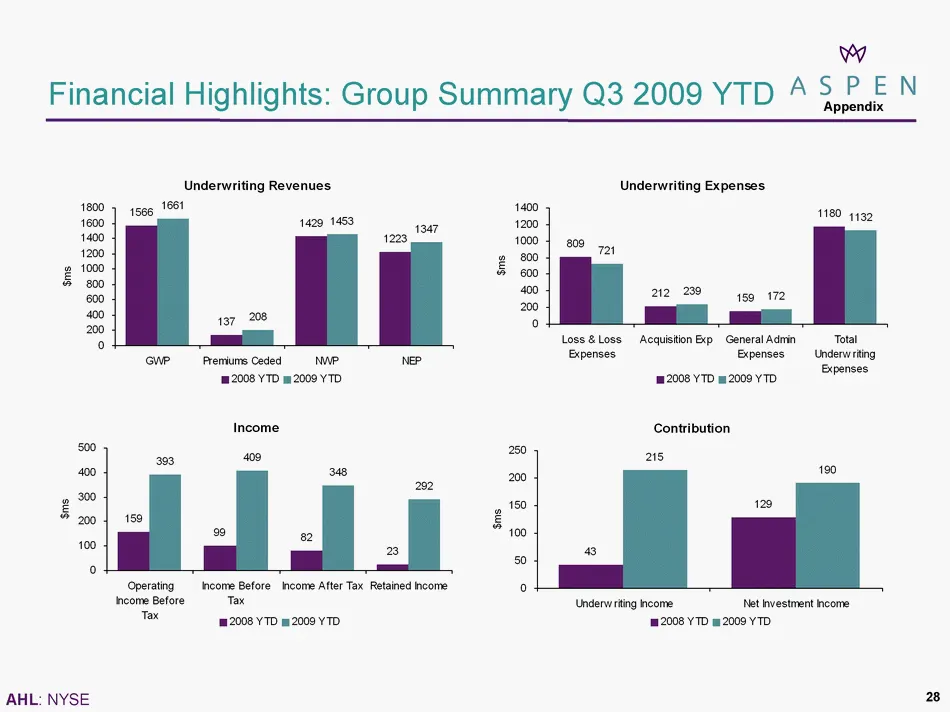
Financial Highlights: Group Summary Q3 2009 YTD Financial Highlights: Group Summary Q3 2009 YTD Financial Highlights: Group Summary Q3 2009 YTD Financial Highlights: Group Summary Q3 2009 YTD 28 Appendix
Slide 29: Key Performance Metrics: Q3 2009
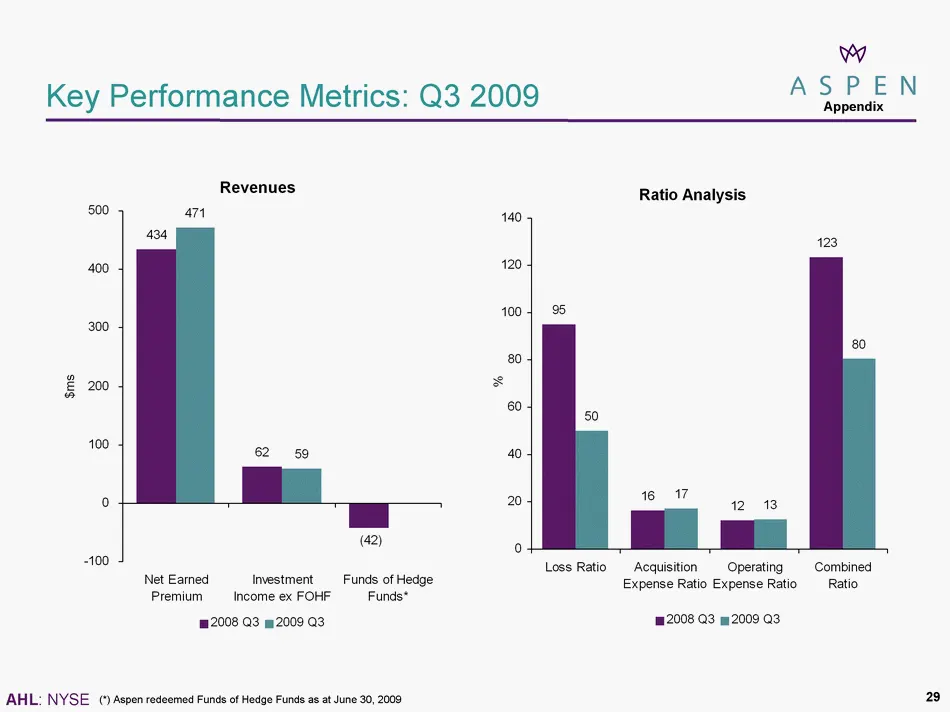
Key Performance Metrics: Q3 2009 * (*) Aspen redeemed Funds of Hedge Funds as at June 30, 2009 Appendix Appendix 29
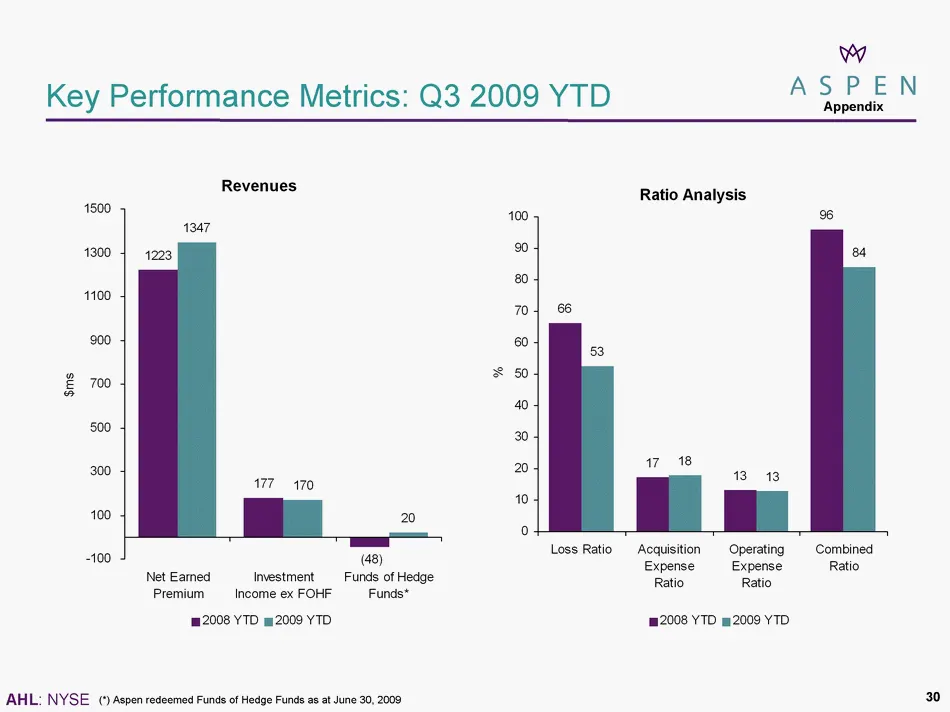
Slide 30: Key Performance Metrics: Q3 2009 YTD
Key Performance Metrics: Q3 2009 YTD * (*) Aspen redeemed Funds of Hedge Funds as at June 30, 2009 Appendix Appendix 30 30
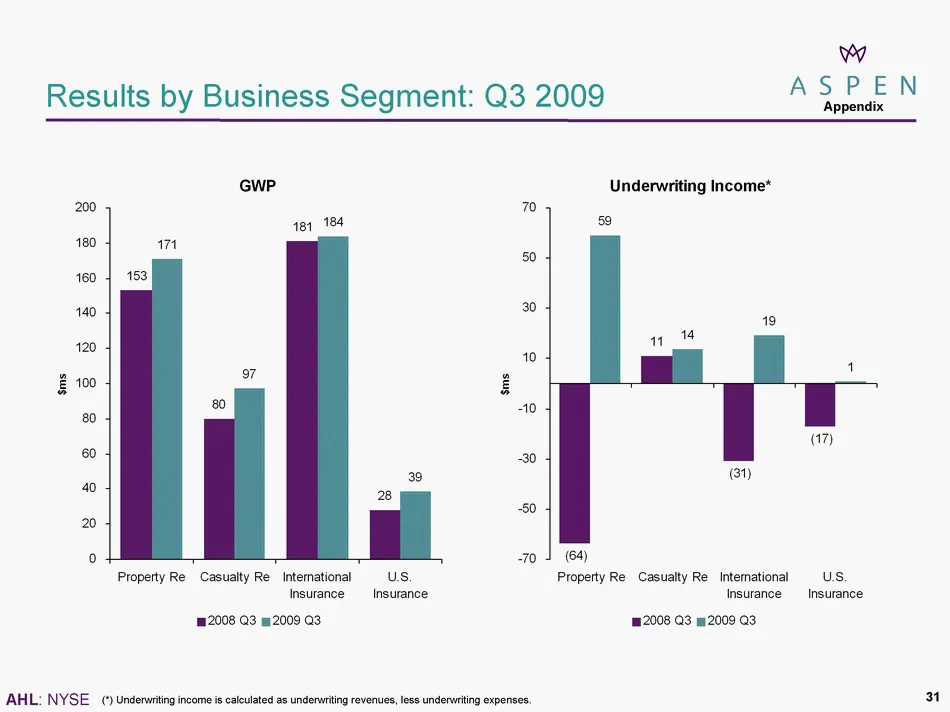
Slide 31: Results by Business Segment: Q3 2009
Results by Business Segment: Q3 2009 (*) Underwriting income is calculated as underwriting revenues, less underwriting expenses. * Appendix Appendix Appendix 31
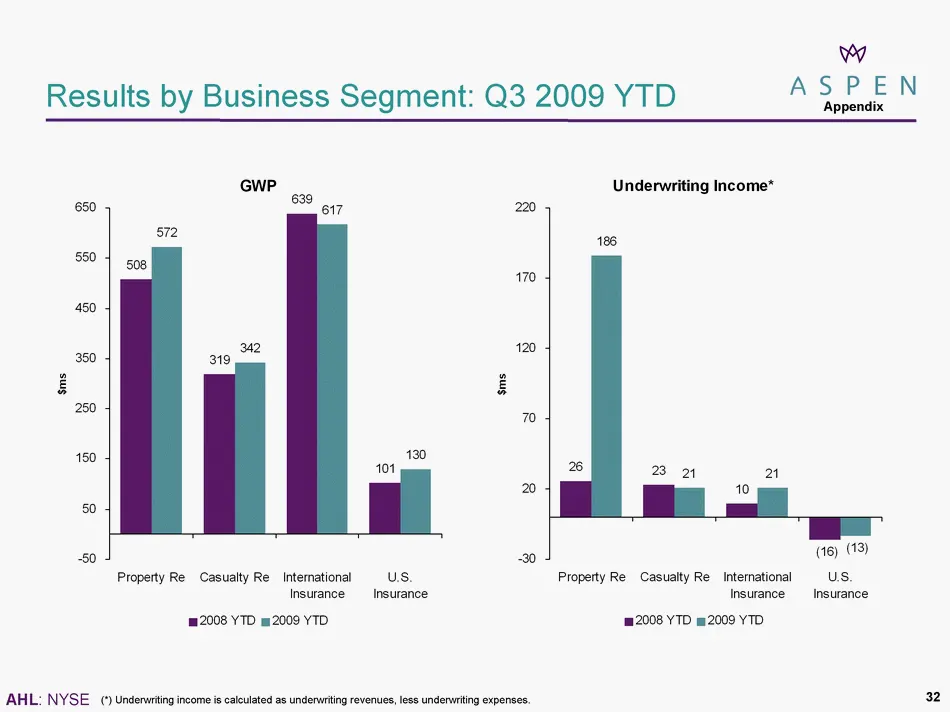
Slide 32: Results by Business Segment: Q3 2009 YTD
Results by Business Segment: Q3 2009 YTD (*) Underwriting income is calculated as underwriting revenues, less underwriting expenses. * Appendix Appendix Appendix 32
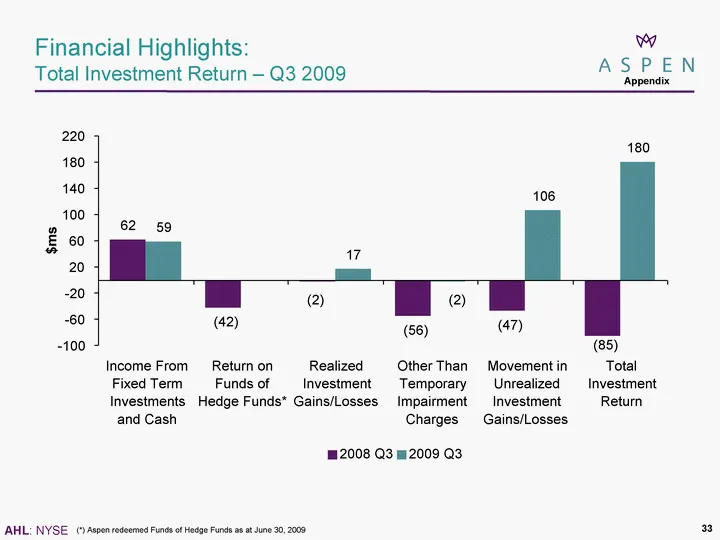
Slide 33: Financial Highlights: Total Investment Return - Q3 2009
Financial Highlights: Total Investment Return - Q3 2009 (*) Aspen redeemed Funds of Hedge Funds as at June 30, 2009 Appendix 33
Slide 34: Financial Highlights: Total Investment Return - Q3 2009 YTD
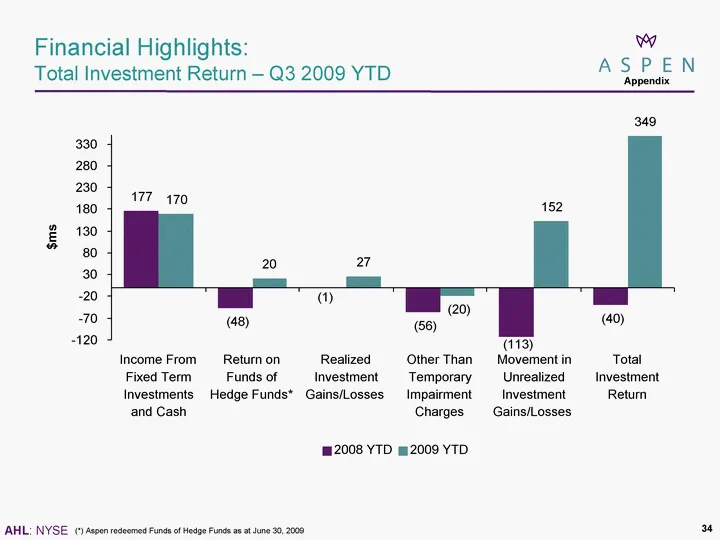
Financial Highlights: Total Investment Return - Q3 2009 YTD (*) Aspen redeemed Funds of Hedge Funds as at June 30, 2009 Appendix 34
Slide 35: Business Performance and Market Outlook: Key
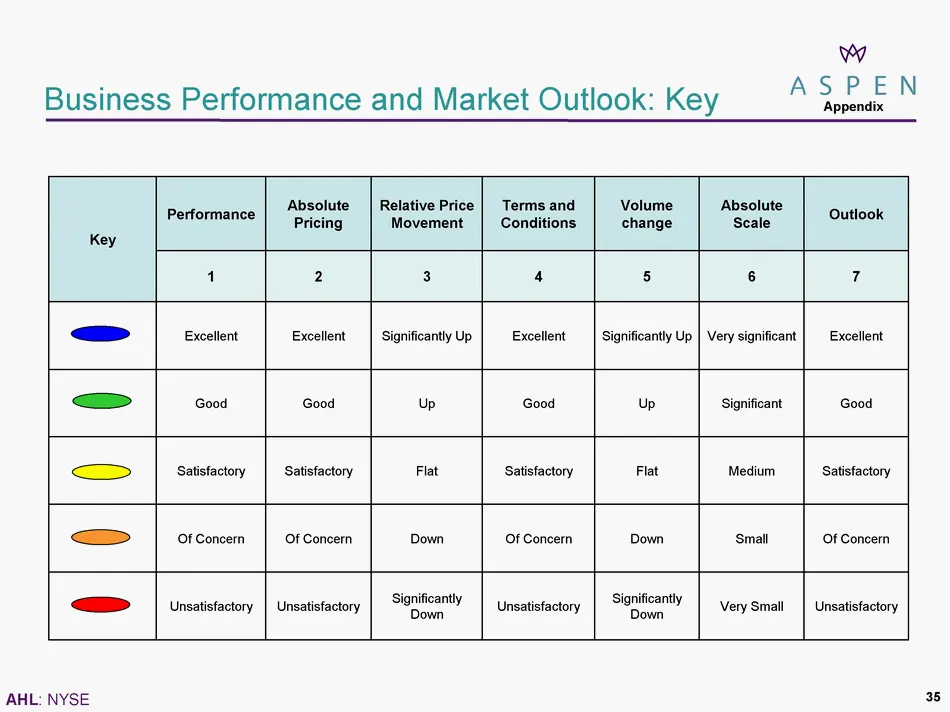
Business Performance and Market Outlook: Key Key Performance Absolute Pricing Relative Price Movement Terms and Conditions Volume change Absolute Scale Outlook Key 1 2 3 4 5 6 7 Excellent Excellent Significantly Up Excellent Significantly Up Very significant Excellent Good Good Up Good Up Significan
Source: SEC EDGAR · 8-K filed Nov 16, 2009
More decks from Aspen Insurance Holdings Ltd
 Q1 2018 Earnings Presentation13 slides · May 2, 2018
 Q3 2017 Earnings Presentation20 slides · Nov 15, 2017
 Q2 2017 Earnings Presentation20 slides · Jul 26, 2017
 Q1 2017 Earnings Presentation20 slides · Apr 26, 2017
 Q4 2016 Earnings Presentation16 slides · Feb 14, 2017
 Q3 2016 Earnings Presentation16 slides · Oct 26, 2016