NorthStar Realty Finance — Investor Presentation (May 2014)
39 slides from NorthStar Realty Finance's investor presentation, May 23, 2014
Slide 1: Investor Presentation May 2014
Investor Presentation May 2014 399 Park Avenue, 18 th Floor, New York, NY 10022 | 212.547.2600 | nrfc.com
Slide 2: Safe Harbor
1 Safe Harbor This presentation contains certain “forward - looking statements” within the meaning of the Private Securities Litigation Reform Act of 1995 , Section 27 A of the Securities Act of 1933 , as amended, or Securities Act, and Section 21 E of the Securities Exchange Act of 1934 , as amende
Slide 3: Overview of NorthStar Realty Finance
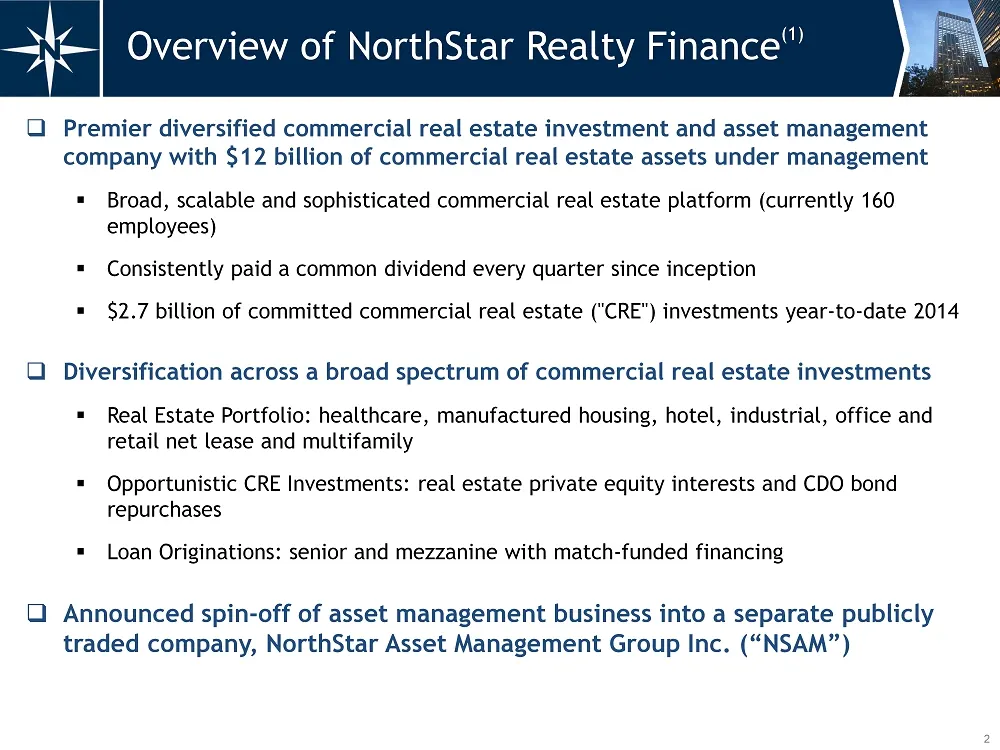
Overview of NorthStar Realty Finance (1) 2 □ Premier diversified commercial real estate investment and asset management company with $12 billion of commercial real estate assets under management ▪ Broad, scalable and sophisticated commercial real estate platform (currently 160 employees) ▪ Consisten
Slide 4: NRF Consistent Outperformance
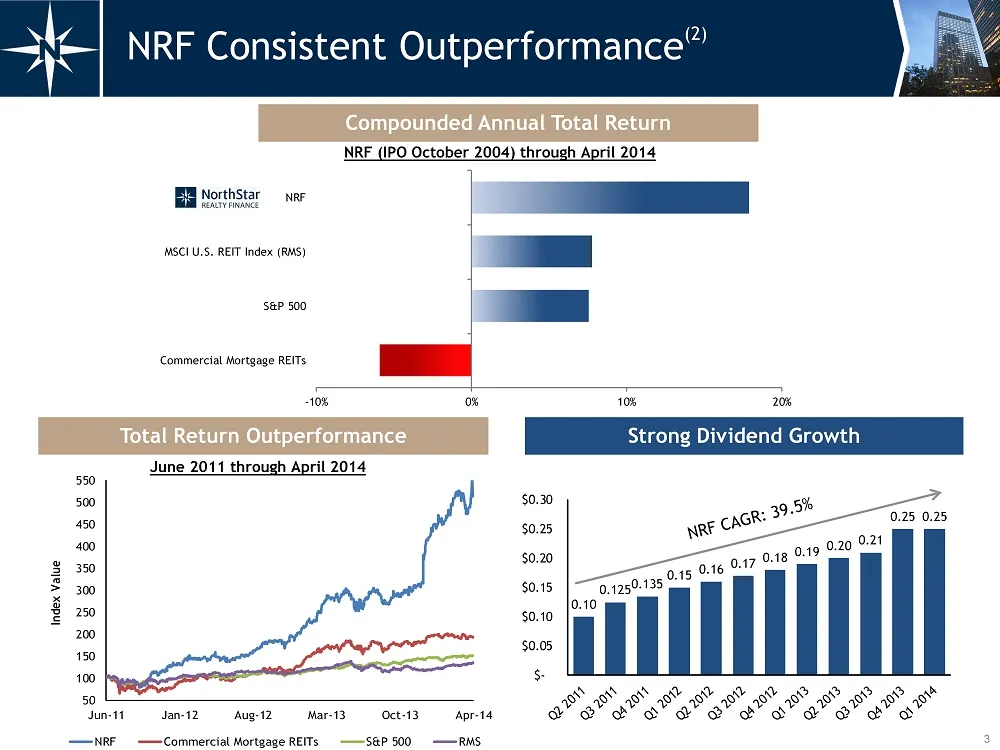
-10% 0% 10% 20% Commercial Mortgage REITs S&P 500 MSCI U.S. REIT Index (RMS) NRF 50 100 150 200 250 300 350 400 450 500 550 Jun-11 Jan-12 Aug-12 Mar-13 Oct-13 Apr-14 Index Value NRF Commercial Mortgage REITs S&P 500 RMS 3 NRF Consistent Outperformance (2) 0.10 0.125 0.135 0.15 0.16 0.17 0.18 0.19 0.
Slide 5: Overview of Asset Management Spin-Off
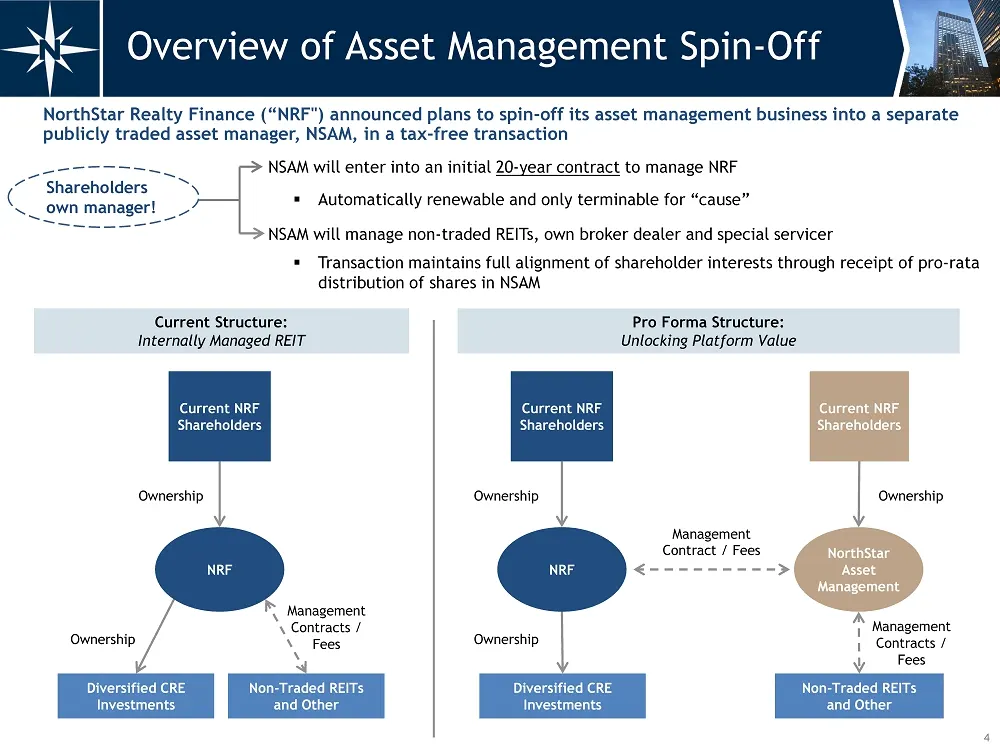
NorthStar Realty Finance (“NRF ") announced plans to spin - off its asset management business into a separate publicly traded asset manager, NSAM, in a tax - free transaction ▪ NSAM will enter into an initial 20 - year contract to manage NRF ▪ Automatically renewable and only terminable for “cause”
Slide 6: Overview of Asset Management Spin-Off
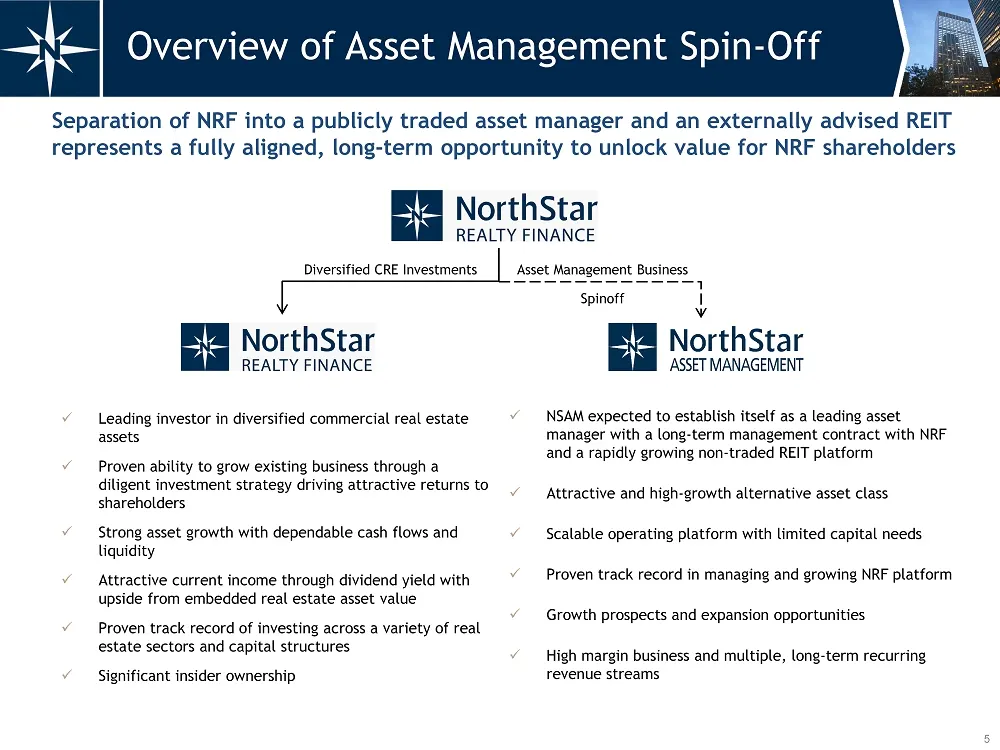
5 Overview of Asset Management Spin - Off Asset Management Business Diversified CRE Investments Spinoff x Leading investor in diversified commercial real estate assets x Proven ability to grow existing business through a diligent investment strategy driving attractive returns to shareholders x Stron
Slide 7: NRF Asset Management Contract
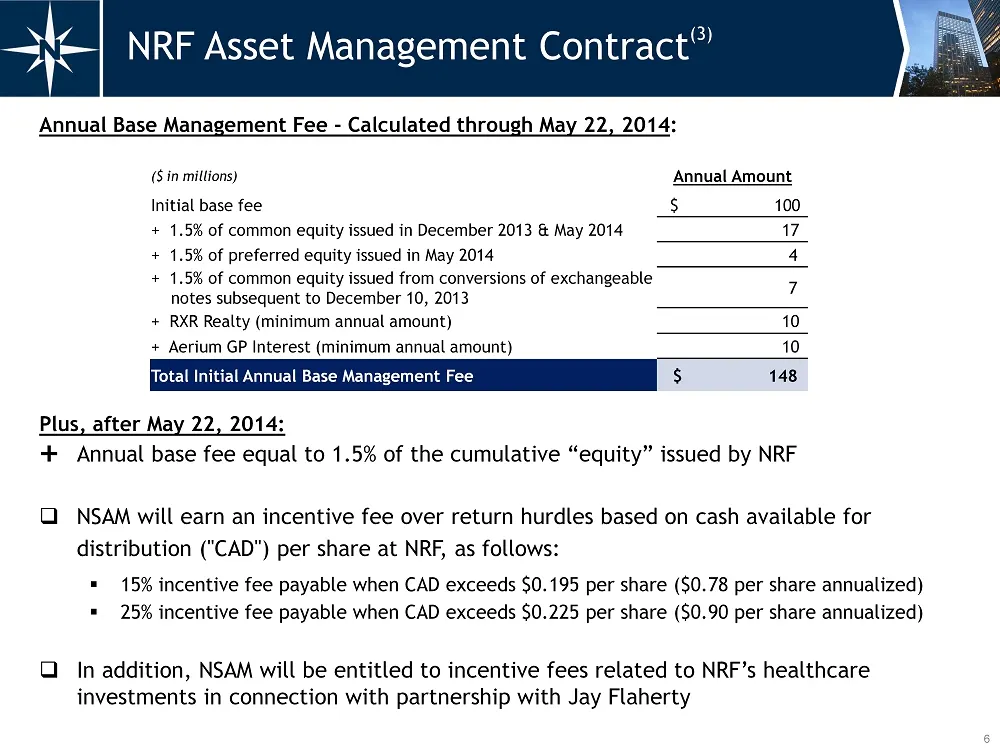
Annual Base Management Fee - Calculated through May 22, 2014 : Plus, after May 22, 2014: Annual base fee equal to 1.5% of the cumulative “equity” issued by NRF □ NSAM will earn an incentive fee over return hurdles based on cash available for distribution ("CAD") per share at NRF, as follows : ▪ 15%
Slide 8: Non-Traded REIT Asset Management Contract
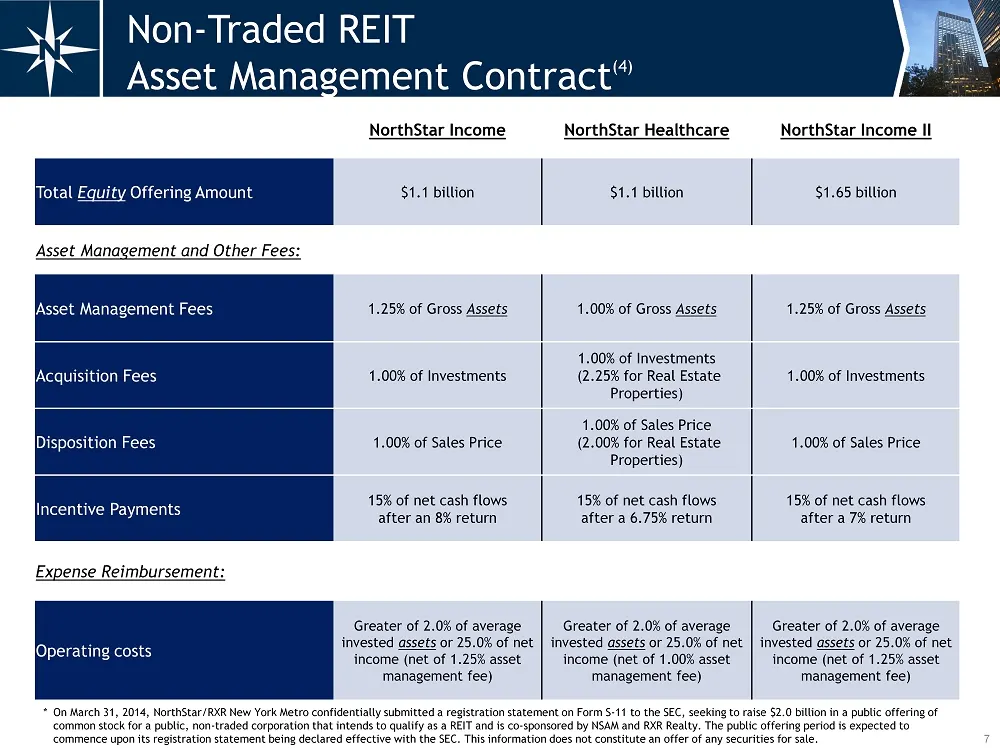
7 Non - Traded REIT Asset Management Contract (4) NorthStar Income NorthStar Healthcare NorthStar Income II Total Equity Offering Amount $1.1 billion $1.1 billion $1.65 billion Asset Management and Other Fees: Asset Management Fees 1.25% of Gross Assets 1.00% of Gross Assets 1.25% of Gross Assets Ac
Slide 9: NSAM Post-Spin 2014 Annualized Projected CAD
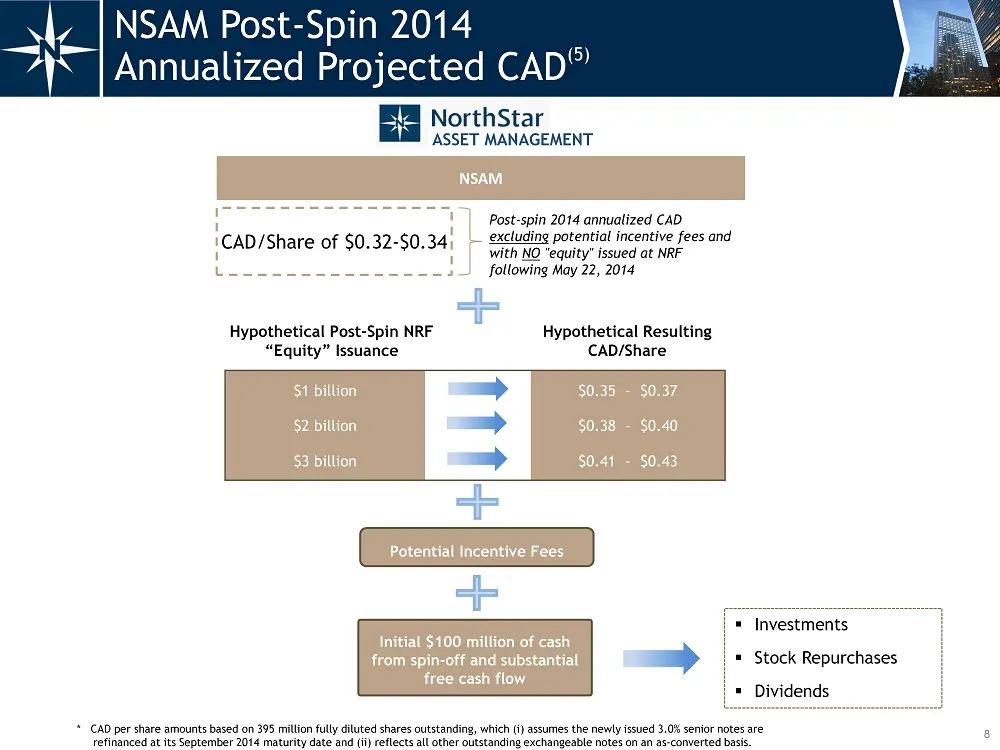
$1 billion $0.35 - $0.37 $2 billion $0.38 - $0.40 $3 billion $0.41 - $0.43 NSAM 8 NSAM Post - Spin 2014 Annualized Projected CAD (5) CAD/Share of $0.32 - $0.34 Post - spin 2014 annualized CAD e xcluding potential i ncentive fees and with NO "equity" issued at NRF following May 22, 2014 ASSET MANAGEM
Slide 10: NorthStar Asset Management Comparable
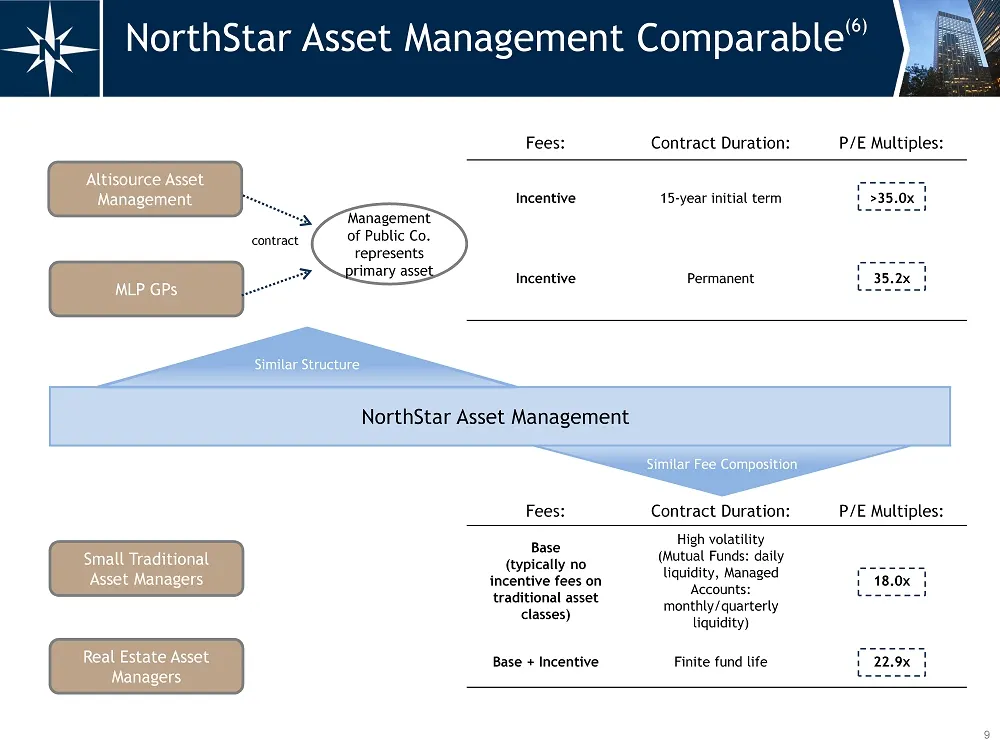
Fees: Contract Duration: P/E Multiples: Incentive 15 - year initial term >35.0x Incentive Permanent 35.2x Real Estate Asset Managers Fees: Contract Duration: P/E Multiples: Base (typically no incentive fees on traditional asset classes) High volatility (Mutual Funds: daily liquidity, Managed Account
Slide 11: NSAM Value Proposition
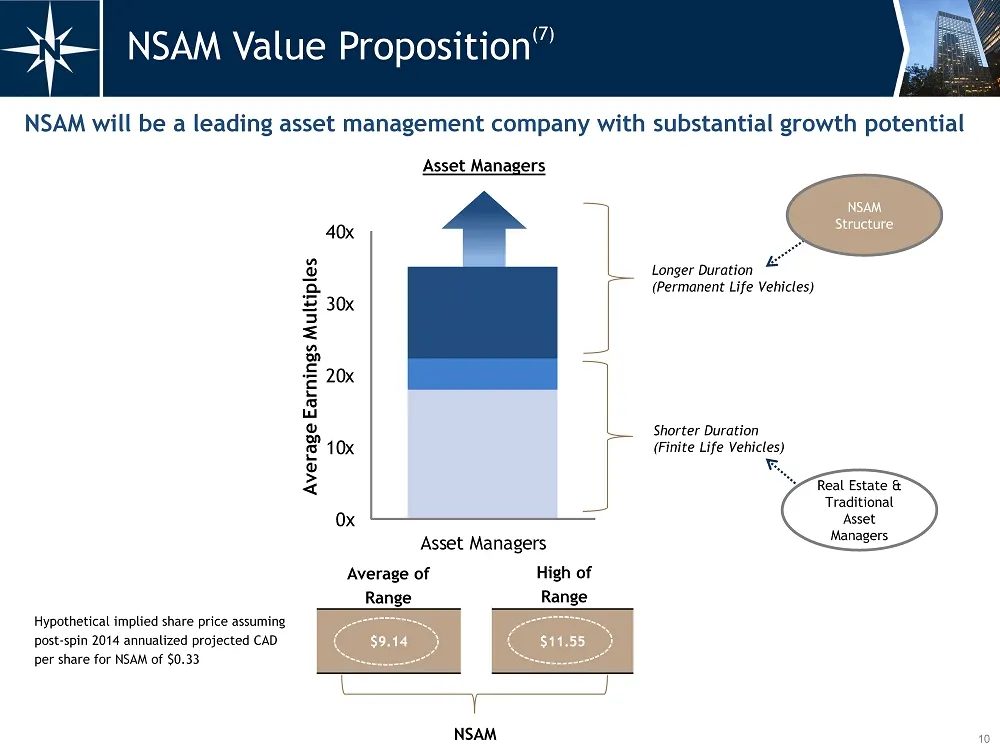
0x 10x 20x 30x 40x Asset Managers Average Earnings Multiples $9.14 $11.55 10 NSAM Value Proposition (7) Asset Managers Hypothetical implied share price assuming post - spin 2014 annualized projected CAD per share for NSAM of $0.33 NSAM will be a leading asset management company with substantial grow
Slide 12: NRF Post-Spin 2014 Annualized Projected CAD
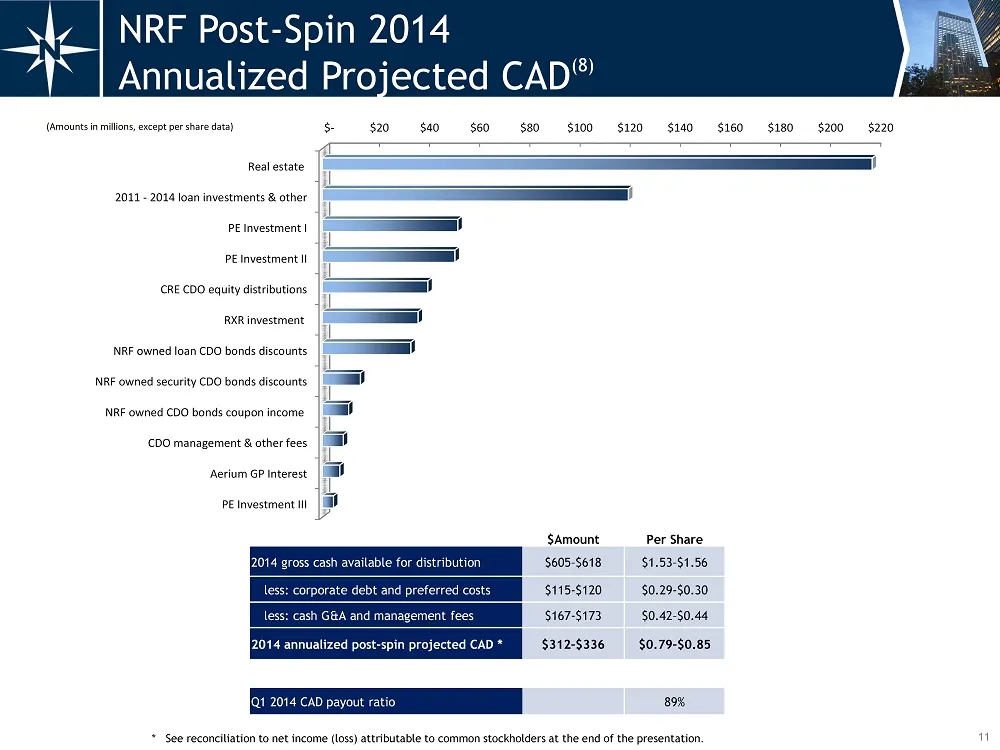
NRF Post - Spin 2014 Annualized Projected CAD (8) $Amount Per Share 2014 gross cash available for distribution $605 – $618 $ 1.53 – $1.56 less: corporate debt and preferred costs $115 - $120 $ 0.29 - $0.30 less: cash G&A and management fees $167 - $173 $ 0.42 – $0.44 2014 annualized post - spin proj
Slide 13: NRF Post-Spin 2014 Annualized Projected CAD
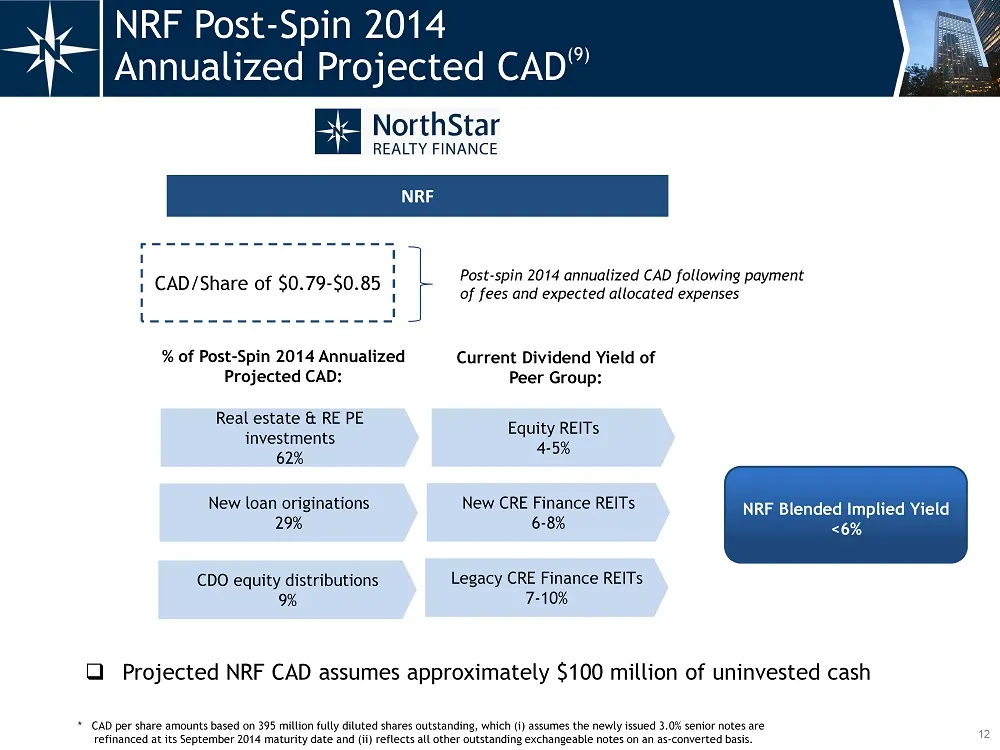
12 NRF Post - Spin 2014 Annualized Projected CAD (9) NRF CAD/Share of $0.79 - $0.85 Post - spin 2014 annualized CAD following payment of fees and expected allocated expenses New loan originations 29% CDO equity distributions 9% Real estate & RE PE investments 62% % of Post - Spin 2014 Annualized Pro
Slide 14: NRF Value Proposition
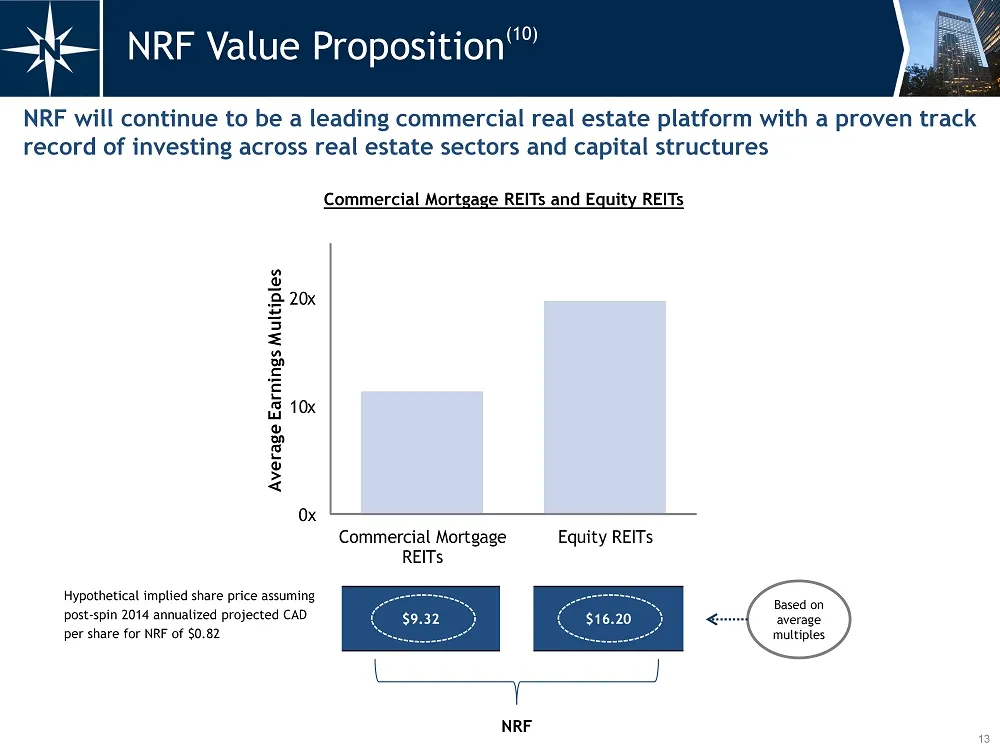
0x 10x 20x Commercial Mortgage REITs Equity REITs Average Earnings Multiples $9.32 $16.20 13 NRF Value Proposition (10) Commercial Mortgage REITs and Equity REITs Hypothetical implied share price assuming post - spin 2014 annualized projected CAD per share for NRF of $0.82 NRF will continue to be a
Slide 15: 2014 NRF Investments
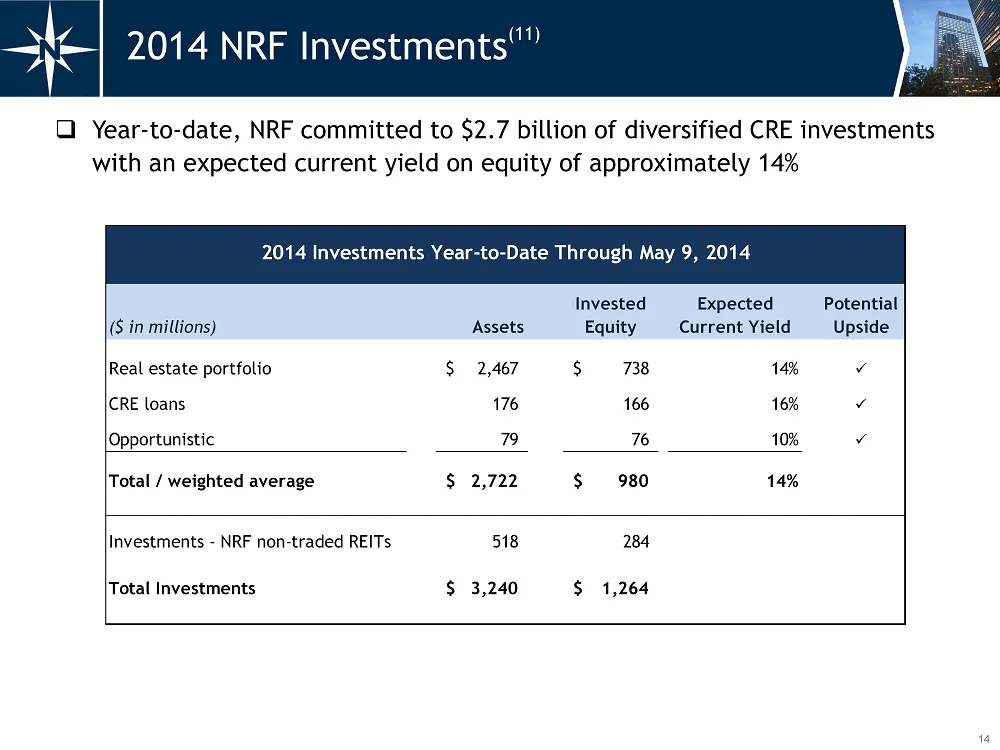
14 2014 NRF Investments (11) □ Year - to - date, NRF committed to $2.7 billion of diversified CRE investments with an expected current yield on equity of approximately 14% 2014 Investments Year-to-Date Through May 9, 2014 ($ in millions) Assets Invested Equity Expected Current Yield Potential Upside
Slide 16: NRF Real Estate Portfolio – Healthcare
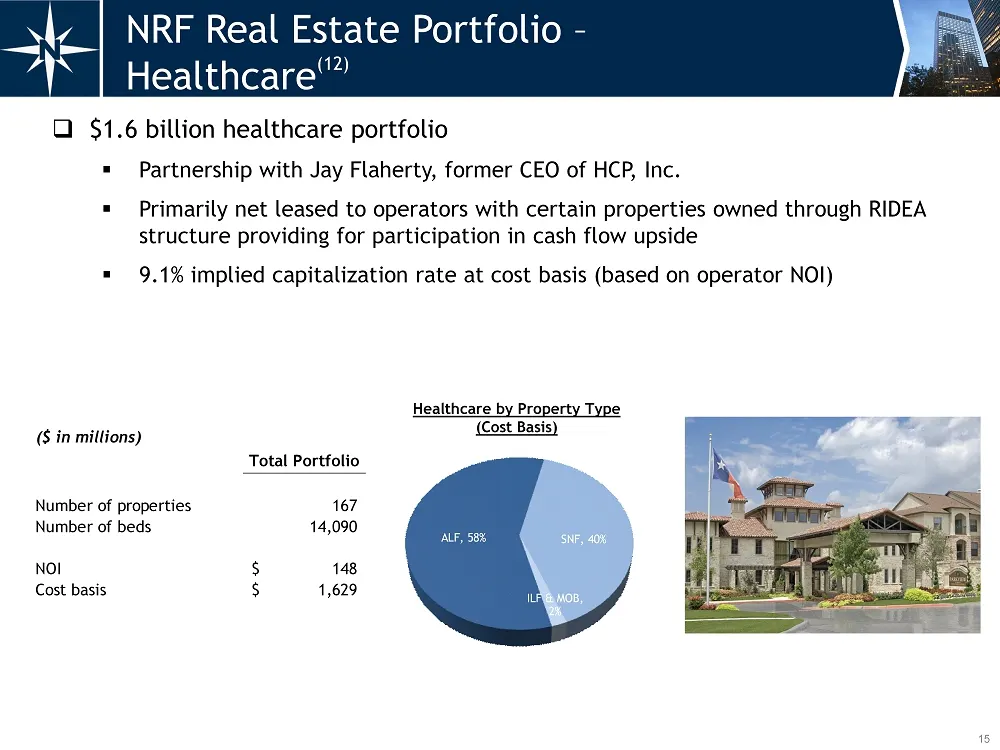
ALF, 58% SNF, 40% ILF & MOB, 2% ($ in millions) Total Portfolio Number of properties 167 Number of beds 14,090 NOI 148$ Cost basis 1,629$ 15 □ $1.6 billion healthcare portfolio ▪ Partnership with Jay Flaherty, former CEO of HCP, Inc. ▪ Primarily net leased to operators with certain properties owned
Slide 17: NRF Real Estate Portfolio – Manufactured Housing
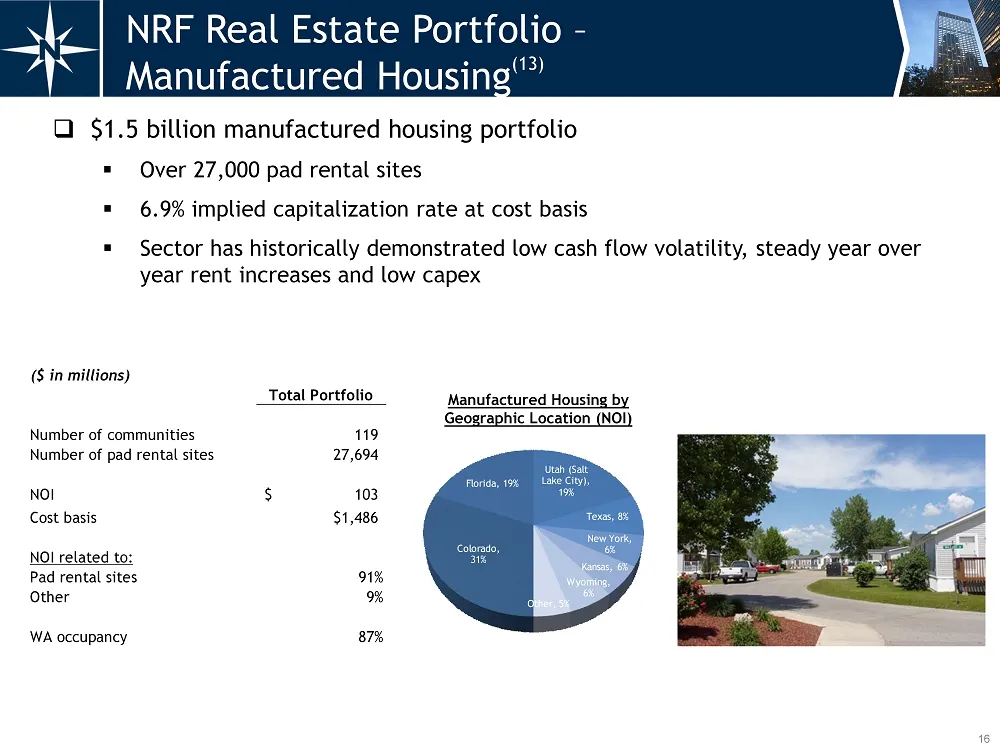
($ in millions) Total Portfolio Number of communities 119 Number of pad rental sites 27,694 NOI 103$ Cost basis $1,486 NOI related to: Pad rental sites 91% Other 9% WA occupancy 87% 16 □ $1.5 billion manufactured housing portfolio ▪ Over 27,000 pad rental sites ▪ 6.9% implied capitalization rate at
Slide 18: Innkeepers Hotel Portfolio Acquisition
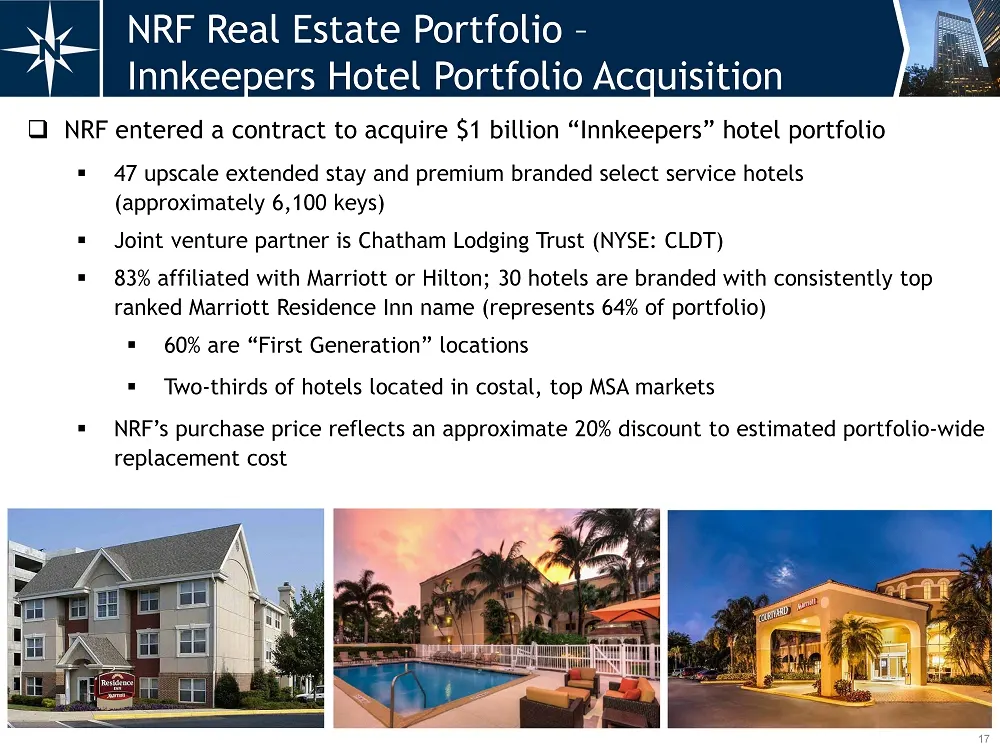
17 NRF Real Estate Portfolio – Innkeepers Hotel Portfolio Acquisition □ NRF entered a contract to acquire $1 billion “Innkeepers” hotel portfolio ▪ 47 upscale extended stay and premium branded select service hotels (approximately 6,100 keys) ▪ Joint venture partner is Chatham Lodging Trust (NYSE: CL
Slide 19: NRF Real Estate Portfolio – Other
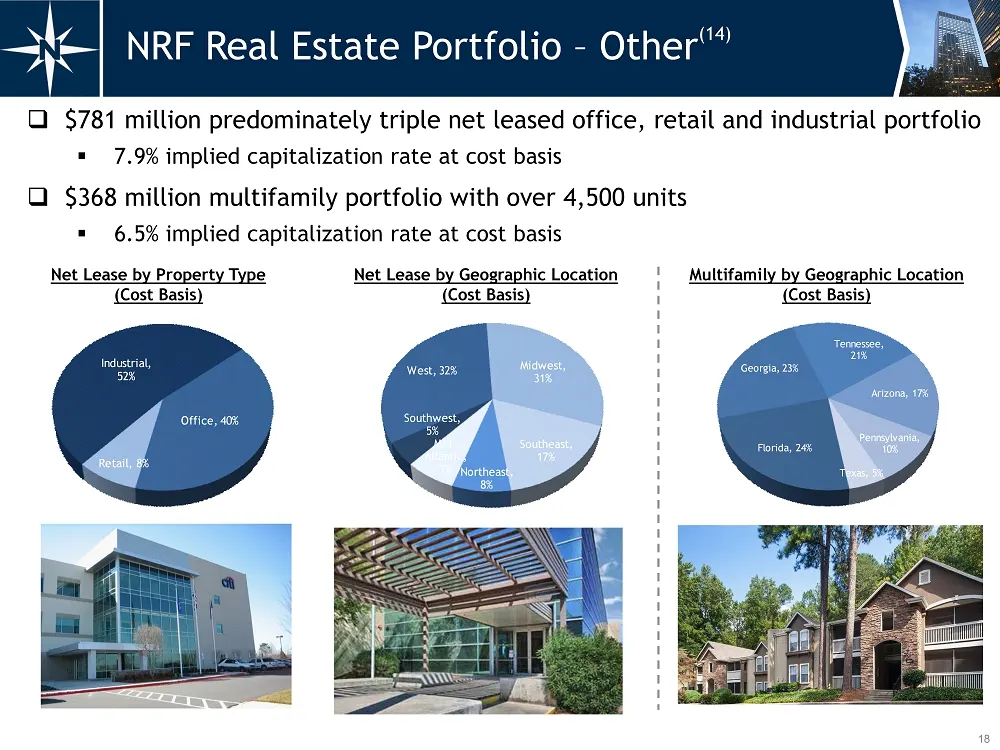
18 NRF Real Estate Portfolio – Other (14) □ $781 million predominately triple net leased office, retail and industrial portfolio ▪ 7.9% implied capitalization rate at cost basis □ $368 million multifamily portfolio with over 4,500 units ▪ 6.5% implied capitalization rate at cost basis Net Lease by P
Slide 20: NRF New Loan Originations
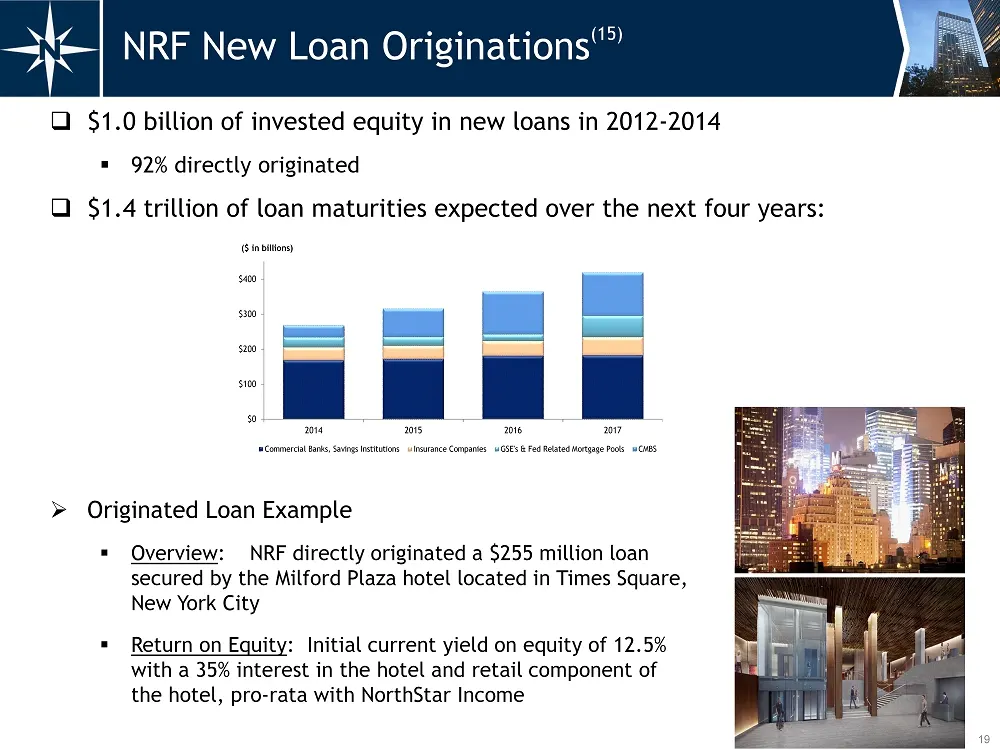
19 NRF New Loan Originations (15) □ $1.0 billion of invested equity in new loans in 2012 - 2014 ▪ 92% directly originated □ $1.4 trillion of loan maturities expected over the next four years: $0 $100 $200 $300 $400 2014 2015 2016 2017 ($ in billions) Commercial Banks, Savings Institutions Insurance
Slide 21: Aerium Investment / European Investments
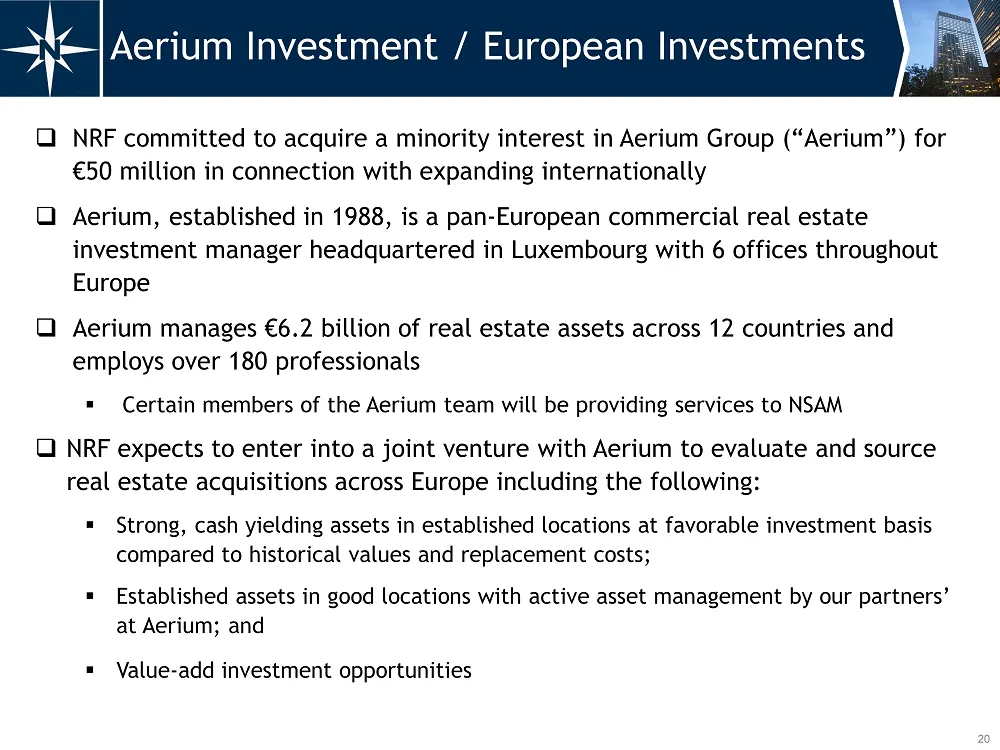
20 Aerium Investment / European Investments □ NRF committed to acquire a minority interest in Aerium Group (“Aerium”) for € 50 million in connection with expanding internationally □ Aerium, established in 1988, is a pan - European commercial real estate investment manager headquartered in Luxembourg
Slide 22: European Debt Opportunities
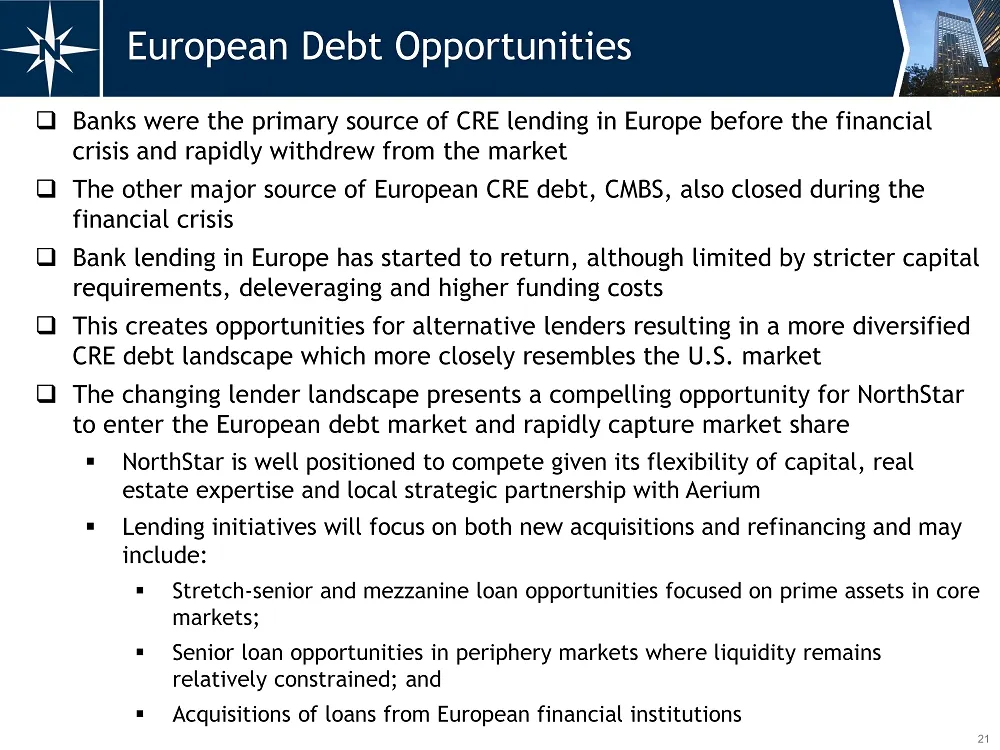
21 European Debt Opportunities □ Banks were the primary source of CRE lending in Europe before the financial crisis and rapidly withdrew from the market □ The other major source of European CRE debt, CMBS, also closed during the financial crisis □ Bank lending in Europe has started to return, althou
Slide 23: NRF PE Investments
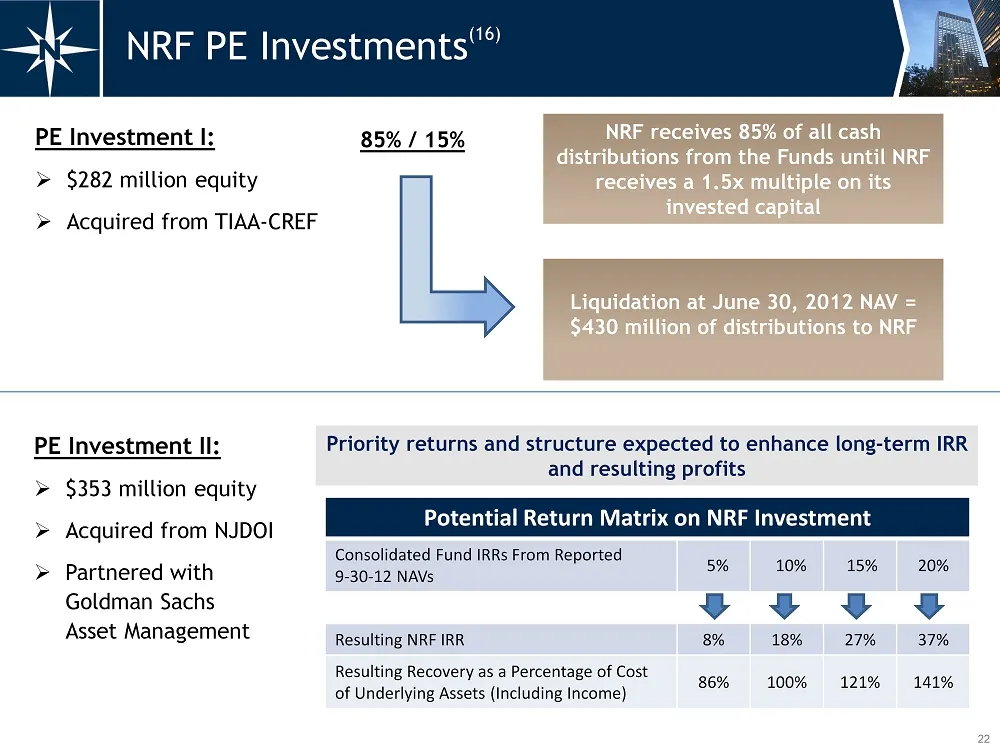
22 NRF PE Investments (16) PE Investment I: » $282 million equity » Acquired from TIAA - CREF Potential Return Matrix on NRF Investment Consolidated Fund IRRs From Reported 9 - 30 - 12 NAVs 5% 10% 15% 20% Resulting NRF IRR 8% 18% 27% 37% Resulting Recovery as a Percentage of Cost of Underlying Asset
Slide 24: NRF PE Investments
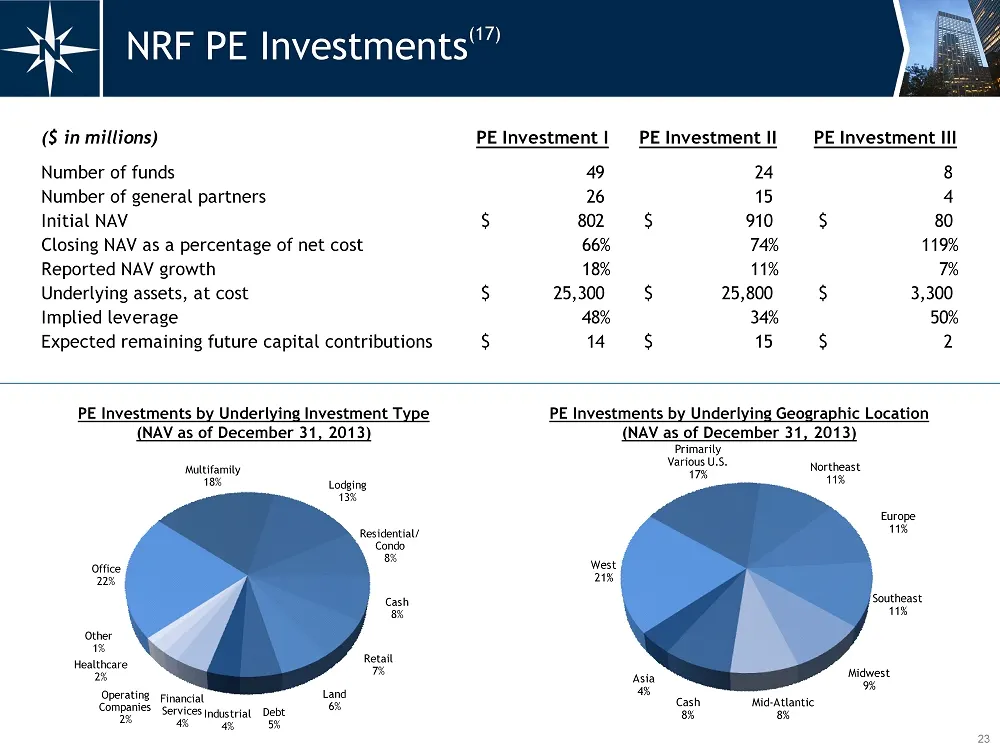
($ in millions) PE Investment I PE Investment II PE Investment III Number of funds 49 24 8 Number of general partners 26 15 4 Initial NAV 802$ 910$ 80$ Closing NAV as a percentage of net cost 66% 74% 119% Reported NAV growth 18% 11% 7% Underlying assets, at cost 25,300$ 25,800$ 3,300$ Implied levera
Slide 25: NRF CDO Bonds Repurchased
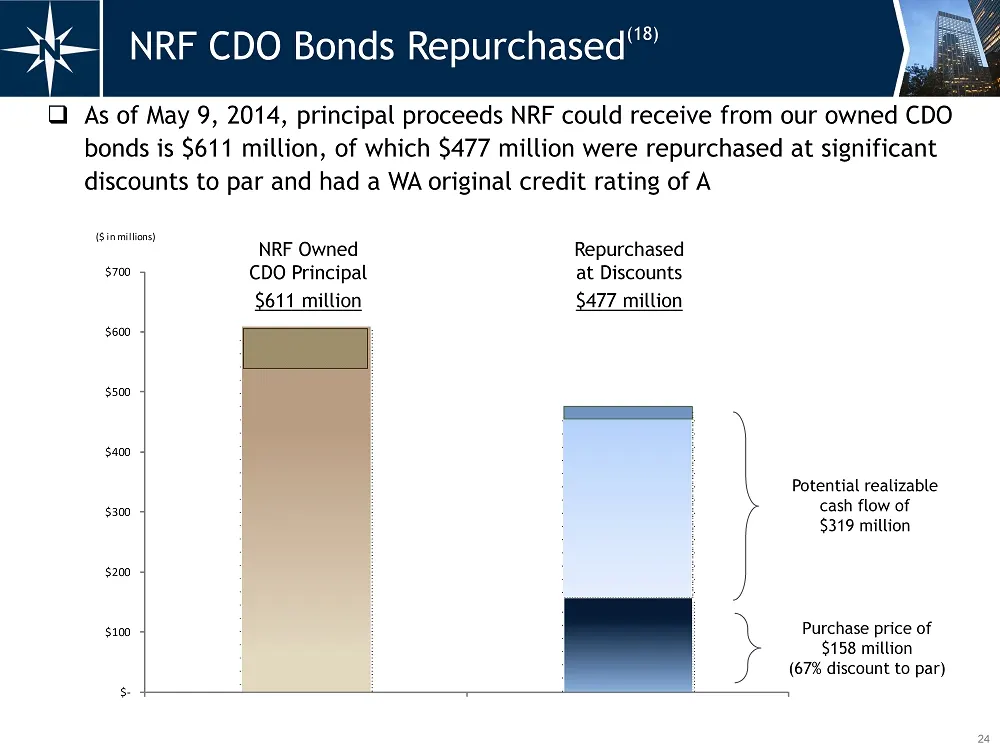
$- $100 $200 $300 $400 $500 $600 $700 ($ in millions) 24 □ As of May 9, 2014, principal proceeds NRF could receive from our owned CDO bonds is $611 million, of which $477 million were repurchased at significant discounts to par and had a WA original credit rating of A Potential realizable cash flow
Slide 26: Seasoned Executive Team
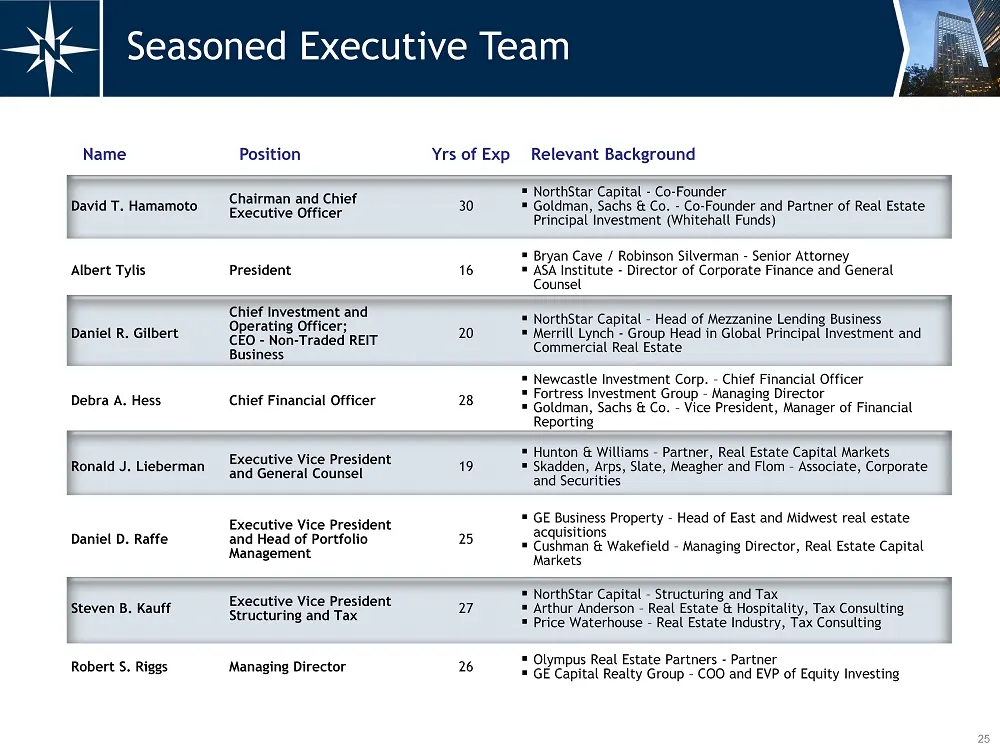
25 Seasoned Executive Team Name Position Yrs of Exp Relevant Background David T. Hamamoto Chairman and Chief Executive Officer 30 ▪ NorthStar Capital - Co - Founder ▪ Goldman, Sachs & Co. - Co - Founder and Partner of Real Estate Principal Investment (Whitehall Funds) Albert Tylis President 16 ▪ Bry
Slide 27: Appendix
26 Appendix □ Non - Traded REIT Industry New Capital □ Repurchased CDO Bond Example □ 2013 Financing Transaction □ Reconciliation of Post Spin 2014 Annualized Projected Cash Available for Distribution for NRF and NSAM □ Presentation Endnotes
Slide 28: Non-Traded REIT Industry New Capital
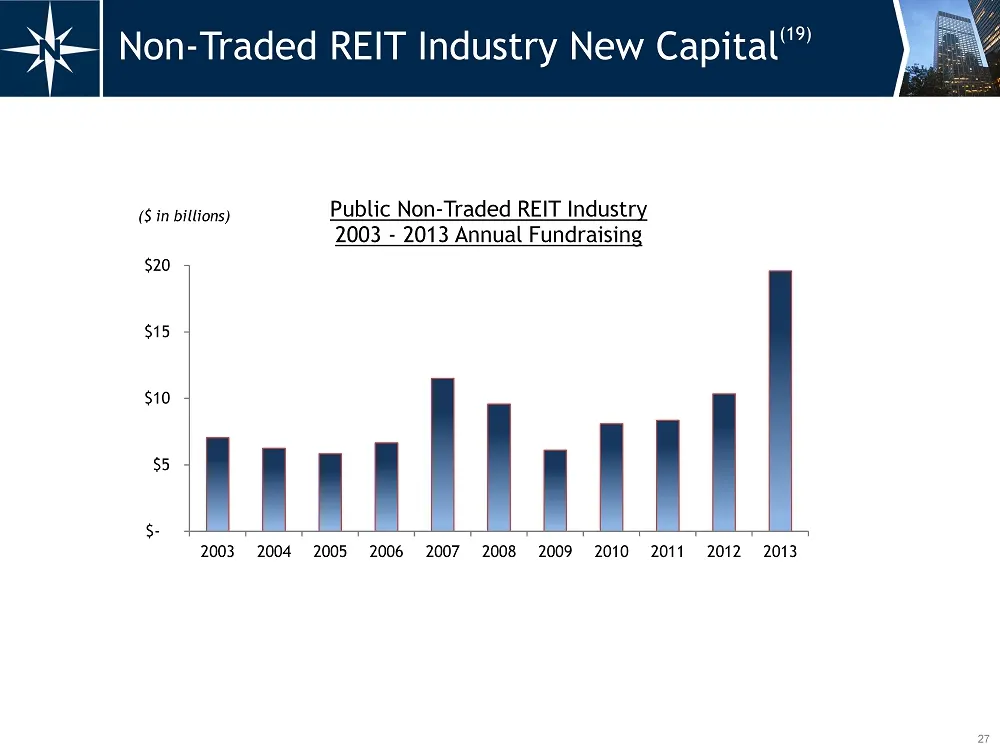
$- $5 $10 $15 $20 2003 2004 2005 2006 2007 2008 2009 2010 2011 2012 2013 Public Non - Traded REIT Industry 2003 - 2013 Annual Fundraising ($ in billions) 27 Non - Traded REIT Industry New Capital (19)
Slide 29: Repurchased CDO Bond Example
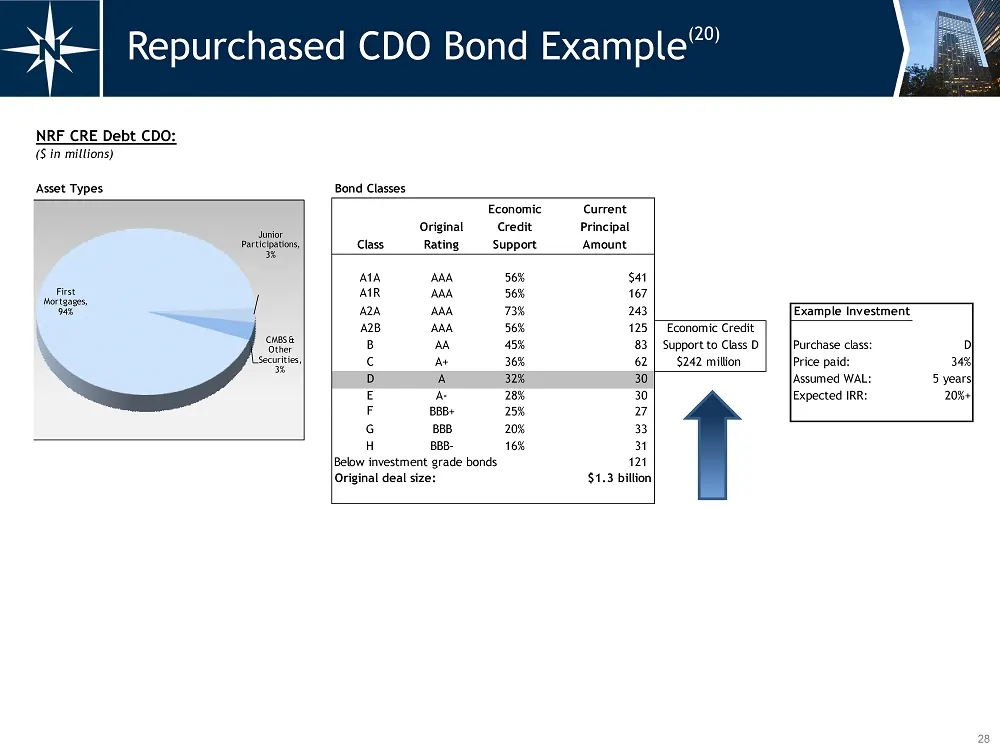
28 Repurchased CDO Bond Example (20) NRF CRE Debt CDO: ($ in millions) Asset Types Bond Classes Class Original Rating Economic Credit Support Current Principal Amount A1A AAA 56% $41 A1R AAA 56% 167 A2A AAA 73% 243 Example Investment A2B AAA 56% 125 Economic Credit B AA 45% 83 Support to Class D Pur
Slide 30: 2013 Financing Transaction
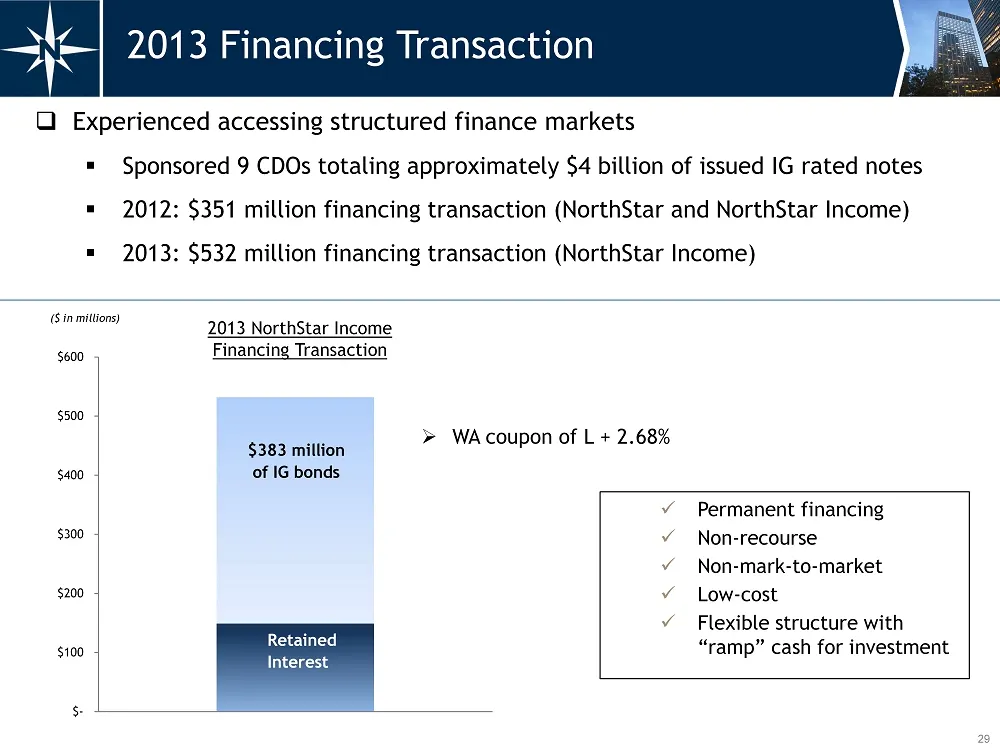
$- $100 $200 $300 $400 $500 $600 ($ in millions) 29 2013 Financing Transaction □ Experienced accessing structured finance markets ▪ Sponsored 9 CDOs totaling approximately $4 billion of issued IG rated notes ▪ 2012: $351 million financing transaction (NorthStar and NorthStar Income) ▪ 2013: $532 mil
Slide 31: Reconciliation of NRF Post-Spin 2014 Annualized Projected CAD
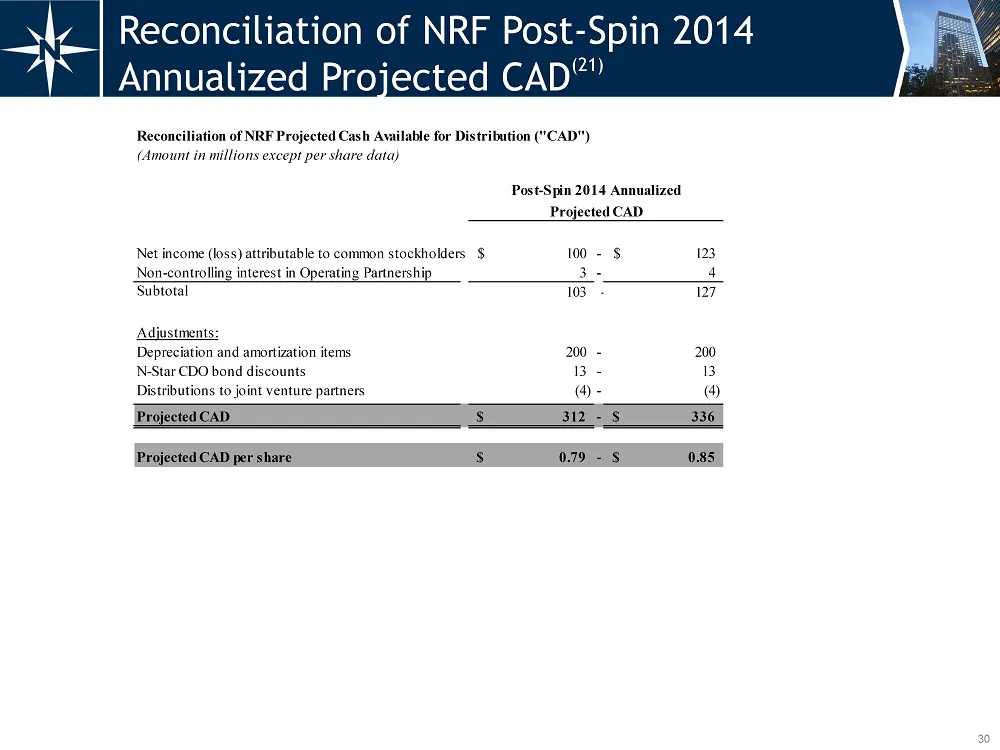
30 Reconciliation of NRF Post - Spin 2014 Annualized Projected CAD (21) Reconciliation of NRF Projected Cash Available for Distribution ("CAD") (Amount in millions except per share data) Post-Spin 2014 Annualized Projected CAD Net income (loss) attributable to common stockholders 100$ - 123$ Non-con
Slide 32: Reconciliation of NSAM Post-Spin 2014 Annualized Projected CAD
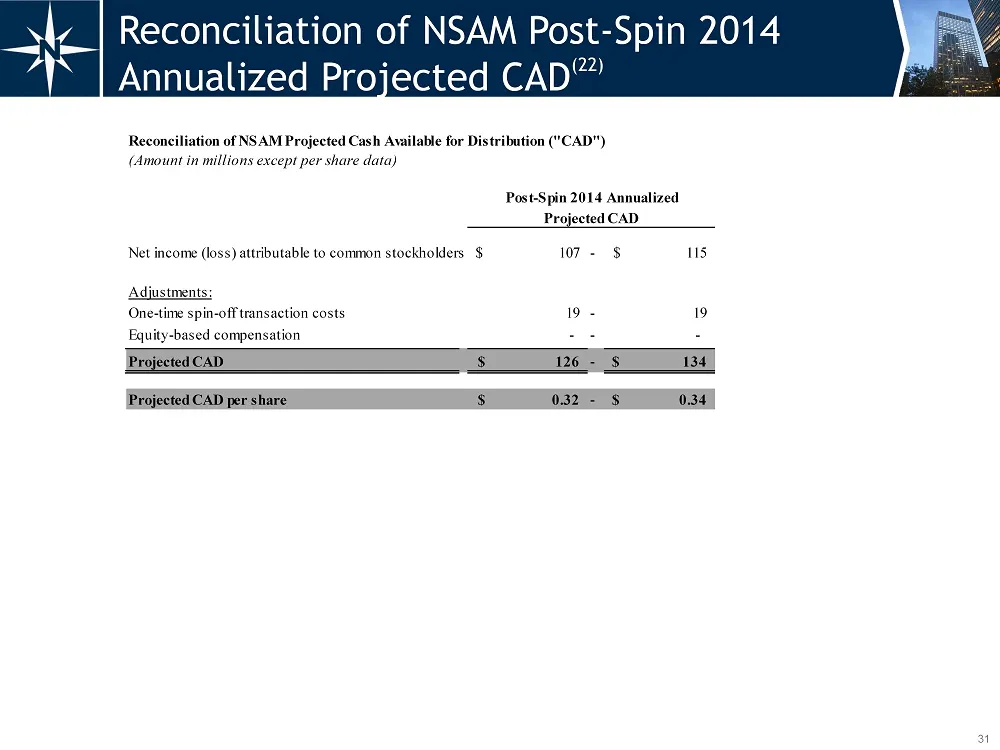
31 Reconciliation of NSAM Post - Spin 2014 Annualized Projected CAD (22) Reconciliation of NSAM Projected Cash Available for Distribution ("CAD") (Amount in millions except per share data) Post-Spin 2014 Annualized Projected CAD Net income (loss) attributable to common stockholders 107$ - 115$ Adjus
Slide 33: Presentation Endnotes
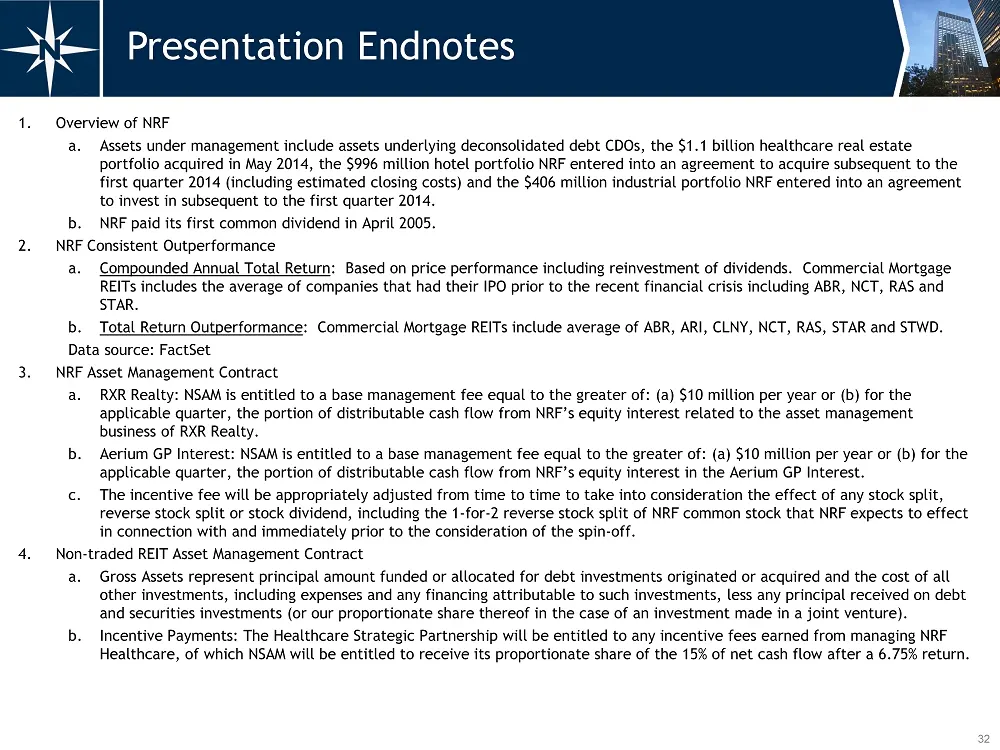
32 Presentation Endnotes 1. Overview of NRF a. Assets under management include assets underlying deconsolidated debt CDOs, the $1.1 billion healthcare real estate portfolio acquired in May 2014, the $996 million hotel portfolio NRF entered into an agreement to acquire subsequent to the first quarter
Slide 34: Presentation Endnotes (continued)
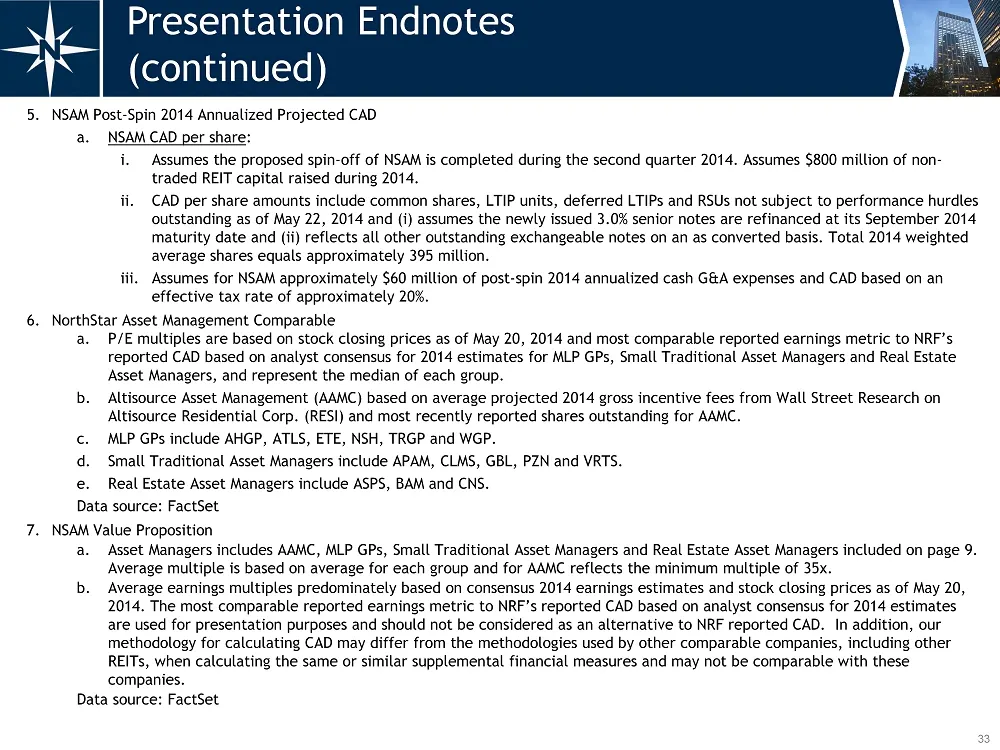
33 Presentation Endnotes (continued) 5. NSAM Post - Spin 2014 Annualized Projected CAD a. NSAM CAD per share : i. Assumes the proposed spin - off of NSAM is completed during the second quarter 2014. Assumes $800 million of non - traded REIT capital raised during 2014. ii. CAD per share amounts inclu
Slide 35: 8. NRF Post - Spin 2014 Annualized Projected CAD: Assumes the spin - off
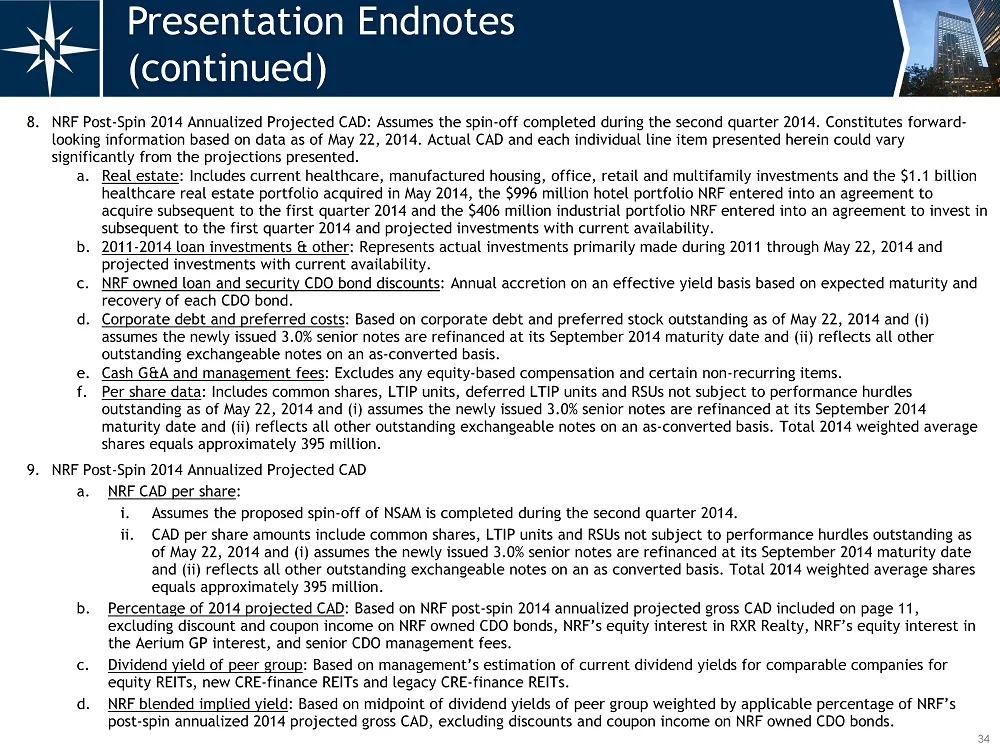
34 8. NRF Post - Spin 2014 Annualized Projected CAD: Assumes the spin - off completed during the second quarter 2014. Constitutes forward - looking information based on data as of May 22, 2014. Actual CAD and each individual line item presented herein could vary significantly from the projections pr
Slide 36: 10. NRF Value Proposition a. Commercial mortgage REITs include ABR, ARI, BXMT, CLNY, NCT,
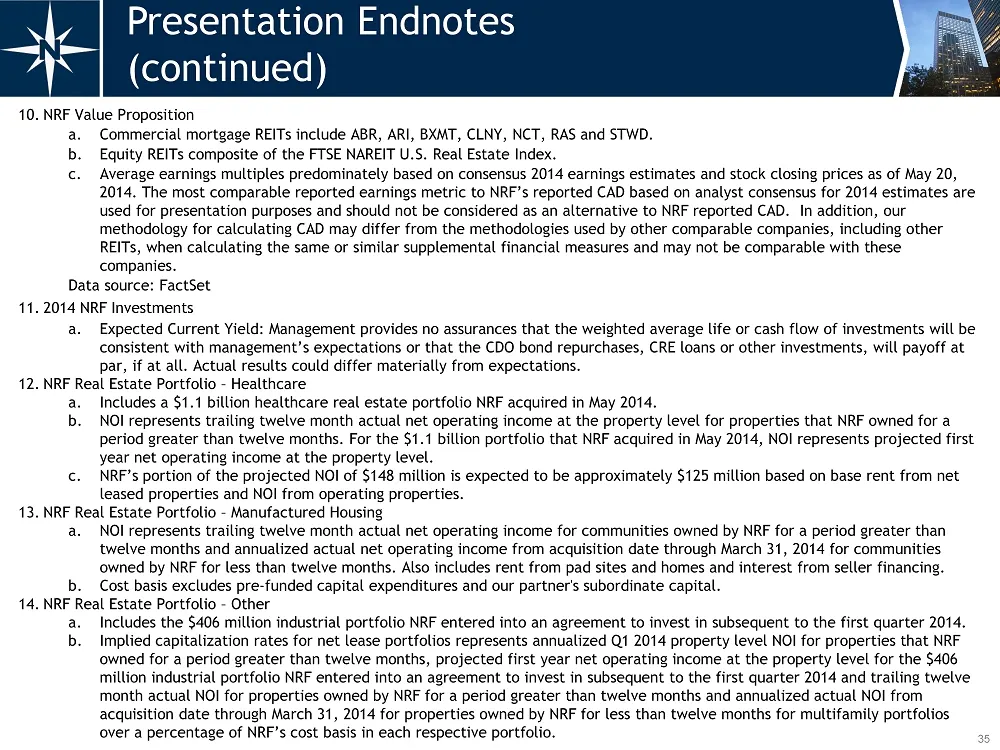
35 10. NRF Value Proposition a. Commercial mortgage REITs include ABR, ARI, BXMT, CLNY, NCT, RAS and STWD. b. Equity REITs composite of the FTSE NAREIT U.S. Real Estate Index. c. Average earnings multiples predominately based on consensus 2014 earnings estimates and stock closing prices as of May 20
Slide 37: 15. New Loan Originations a. Invested equity primarily relates to loan investments made in
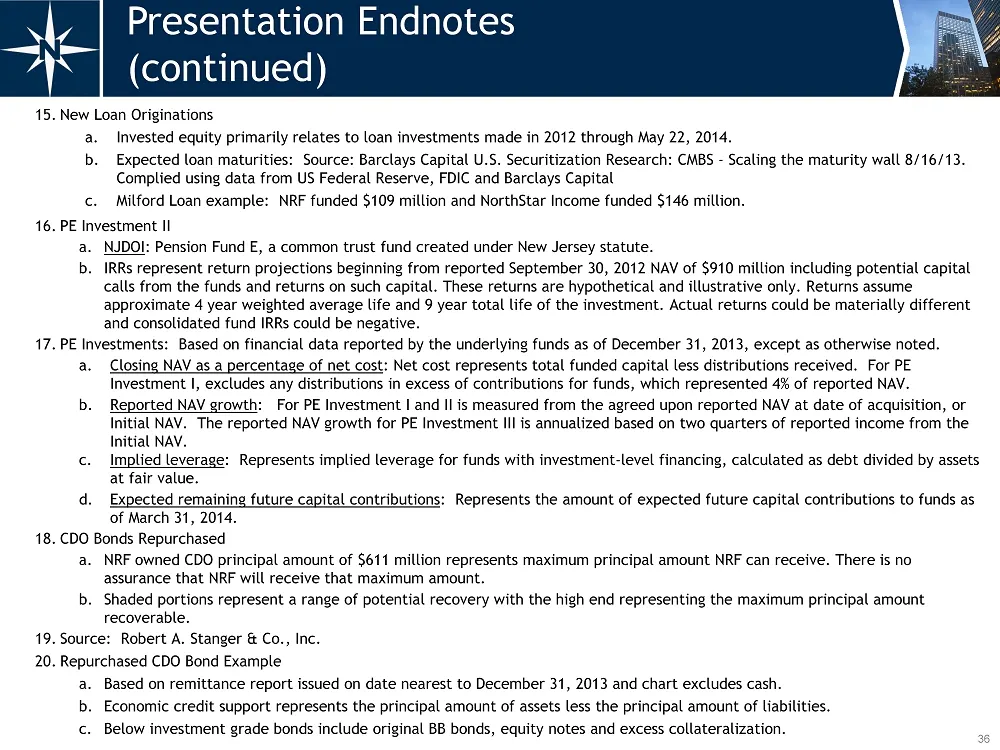
36 15. New Loan Originations a. Invested equity primarily relates to loan investments made in 2012 through May 22, 2014. b. Expected loan maturities: Source: Barclays Capital U.S. Securitization Research: CMBS - Scaling the maturity wall 8/16/13. Complied using data from US Federal Reserve, FDIC and
Slide 38: 21. Reconciliation of NRF Projected Post - Spin Annualized 2014 Projected CAD a. CDO
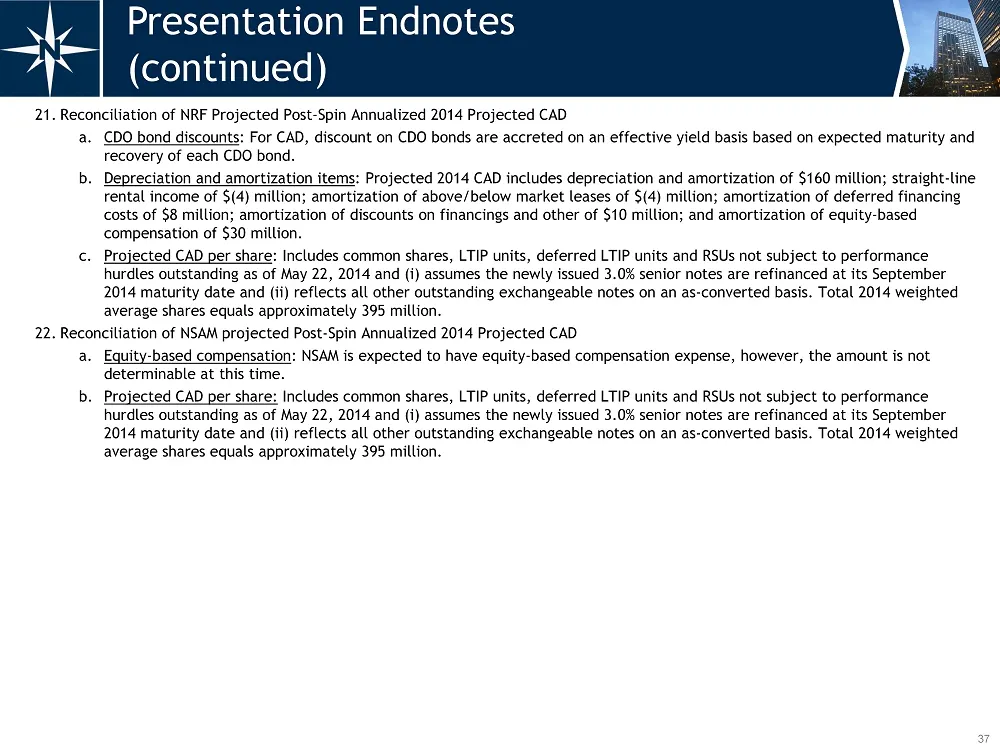
37 21. Reconciliation of NRF Projected Post - Spin Annualized 2014 Projected CAD a. CDO bond discounts : For CAD, discount on CDO bonds are accreted on an effective yield basis based on expected maturity and recovery of each CDO bond. b. Depreciation and amortization items : Projected 2014 CAD inclu
Slide 39: NorthStar Realty Finance contact
38 399 Park Avenue, 18 th Floor, New York, NY 10022 | 212.547.2600 | nrfc.com
Source: SEC EDGAR · 8-K filed May 23, 2014
More decks from NorthStar Realty Finance Corp
 Merger or Acquisition (July 2016)5 slides · Jul 29, 2016
 Merger or Acquisition (June 2016)31 slides · Jun 7, 2016
 Merger or Acquisition (June 2016)27 slides · Jun 3, 2016
 Merger or Acquisition (February 2015)23 slides · Feb 26, 2015
 Investor Presentation (January 2015)14 slides · Jan 13, 2015
 Investor Presentation (August 2014)28 slides · Aug 11, 2014