Flutter Entertainment plc · NYSE:FLUT
Flutter Entertainment — Paddy Power — FY2008 Earnings Presentation
30 slides from Flutter Entertainment's earnings presentation, 2009

Slide 1: Paddy Power plc
Paddy Power pic
Slide 2: Introduction
Introduction Introduction Financial Performance Operational Review Strategy & Outlook Page 1
Slide 3: Highlights
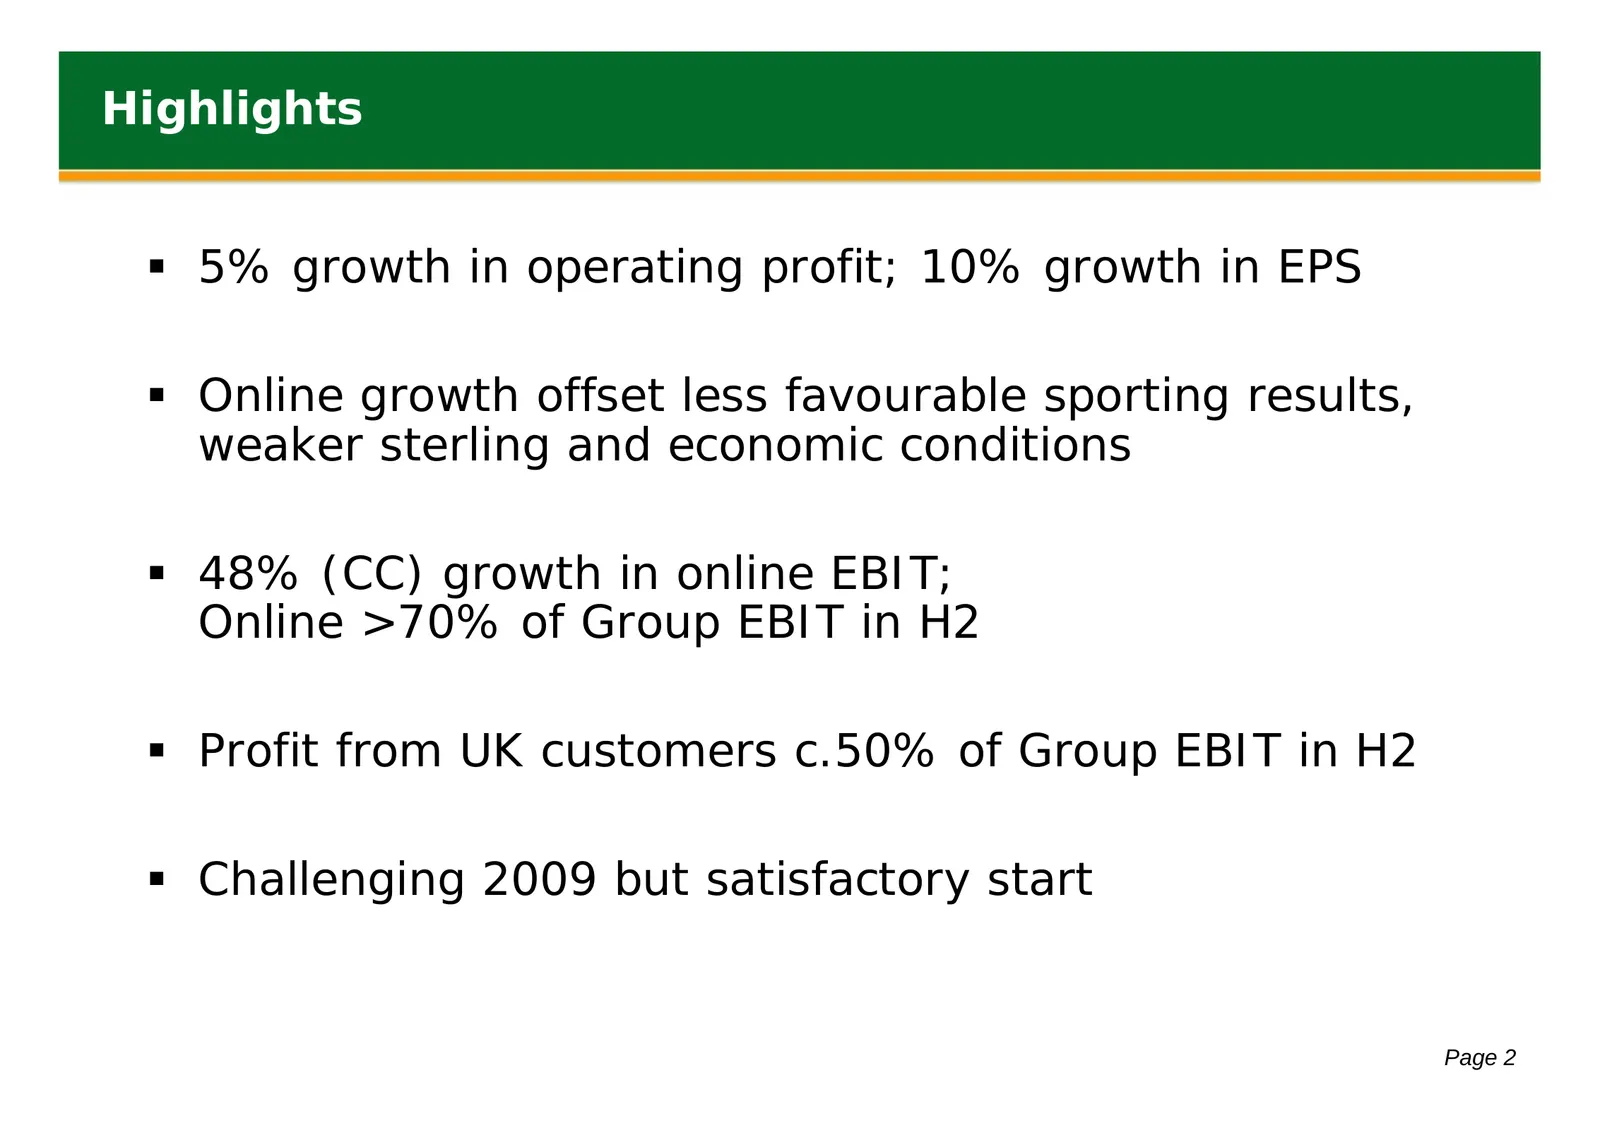
Highlights 5% growth in operating profit; 10% growth in EPS Online growth offset less favourable sporting results, weaker sterling and economic conditions 48% (CC) growth in online EBIT; Online >70% of Group EBIT in H2 Profit from UK customers c.50% of Group EBIT in H2 Challenging 2009 but
Slide 4: Financial Performance
Financial Performance Introduction Financial Performance Operational Review Strategy & Outlook Page 3
Slide 5: Financial Highlights
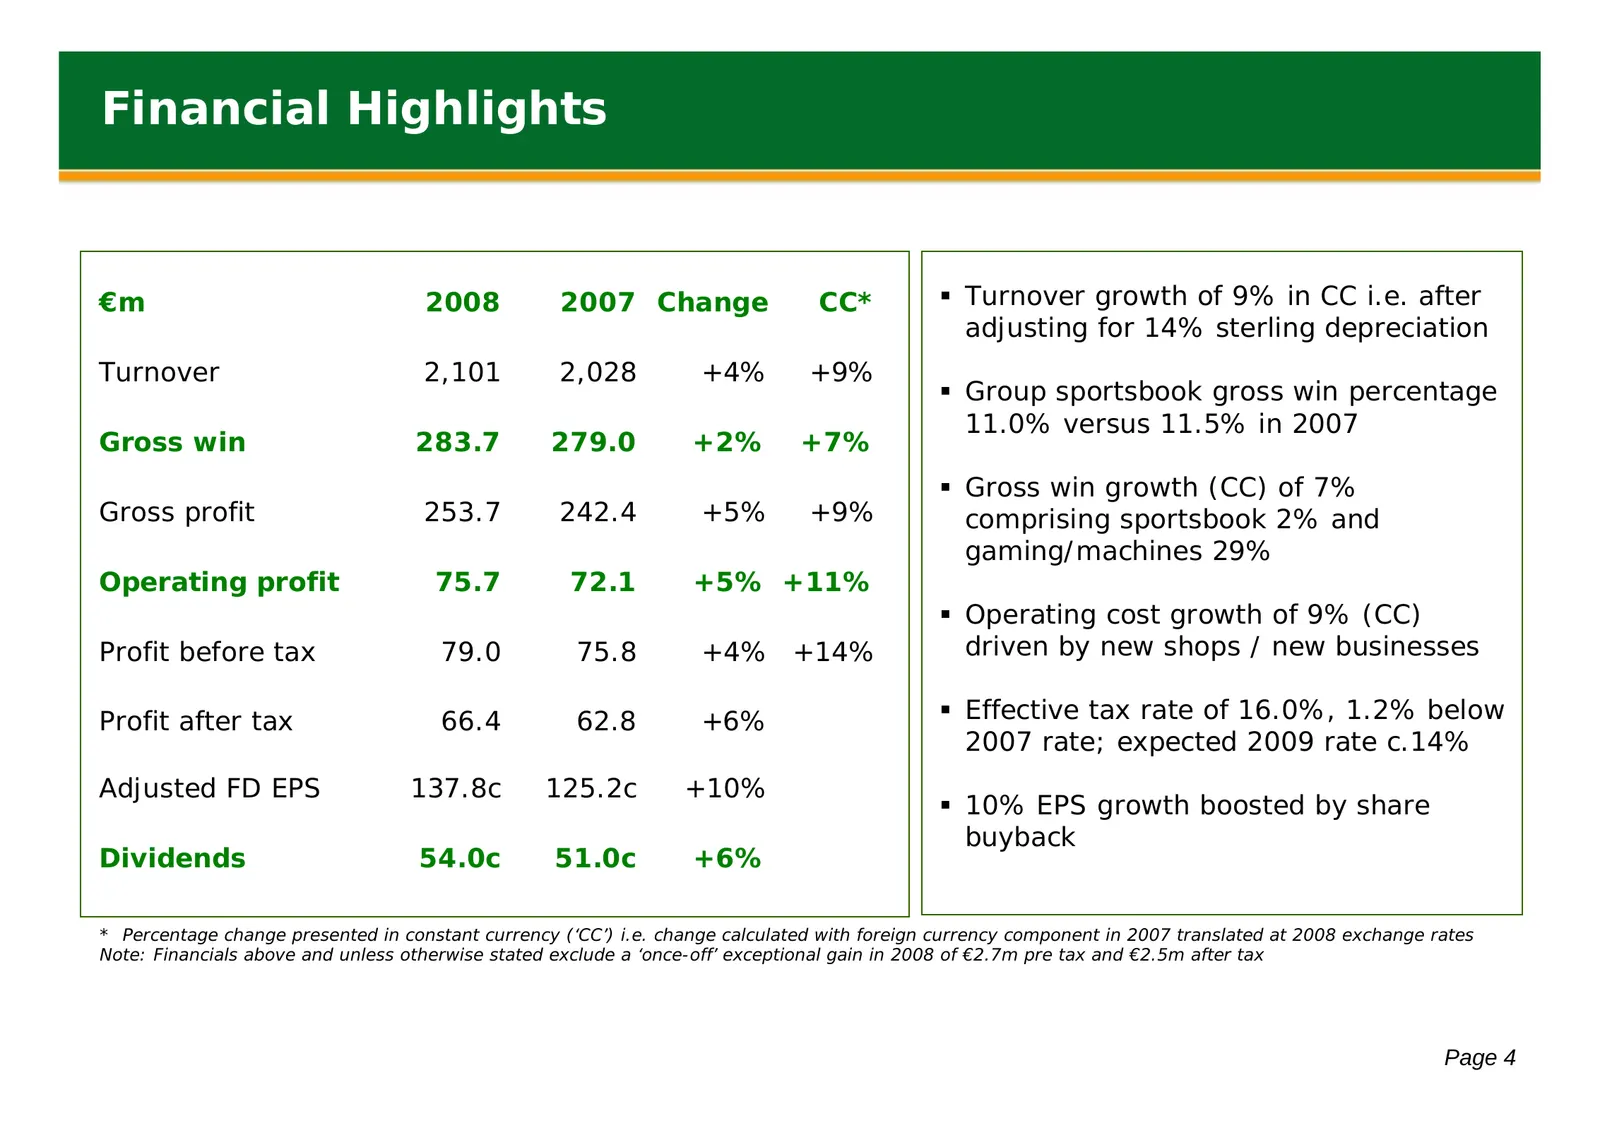
Financial Highlights €m 2008 2007 Change CC* Turnover growth of 9% in CC i.e. after adjusting for 14% sterling depreciation Turnover 2,101 2,028 +4% +9% Group sportsbook gross win percentage 11.0% versus 11.5% in 2007 Gross win 283.7 279.0 +2% +7% Gross win growth (CC) of 7% Gross profit 253.7
Slide 6: Gross Win to Gross Profit
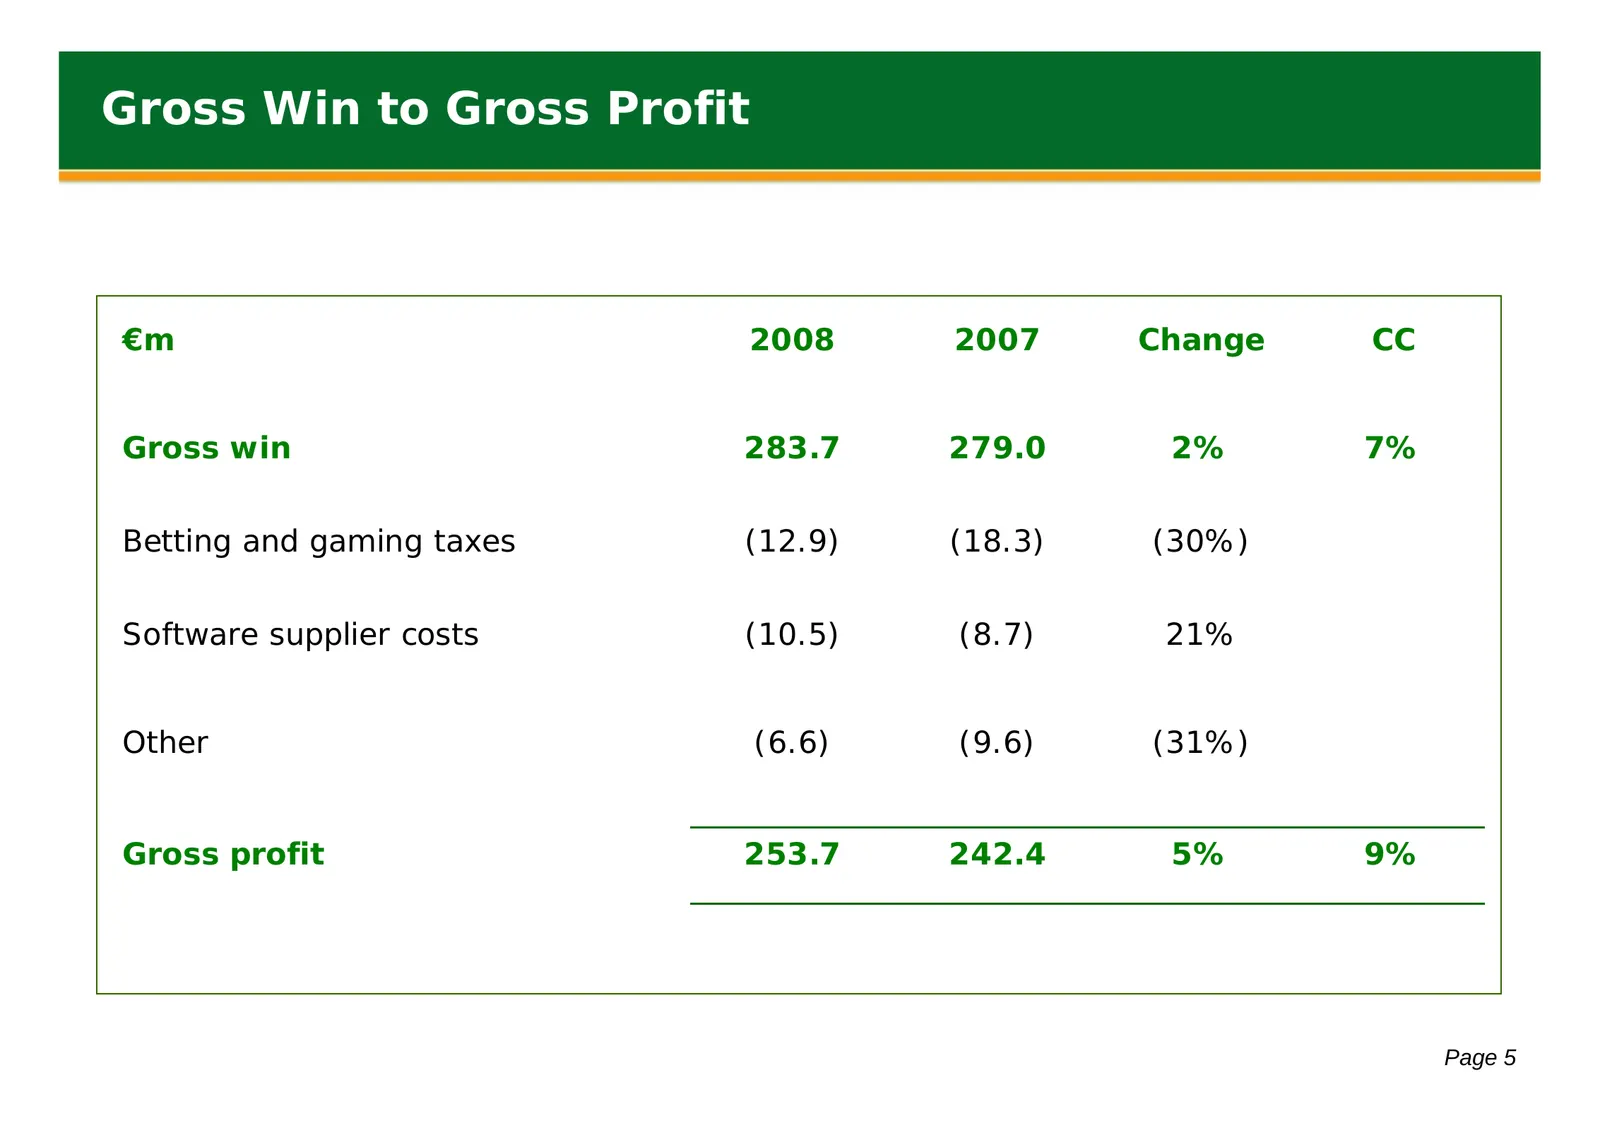
Gross Win to Gross Profit €m 2008 2007 Change CC Gross win 283.7 279.0 2% 7% Betting and gaming taxes (12.9) (18.3) (30%) Software supplier costs (10.5) (8.7) 21% Other (6.6) (9.6) (31%) Gross profit 253.7 242.4 5% 9% Page 5
Slide 7: Cash Flow
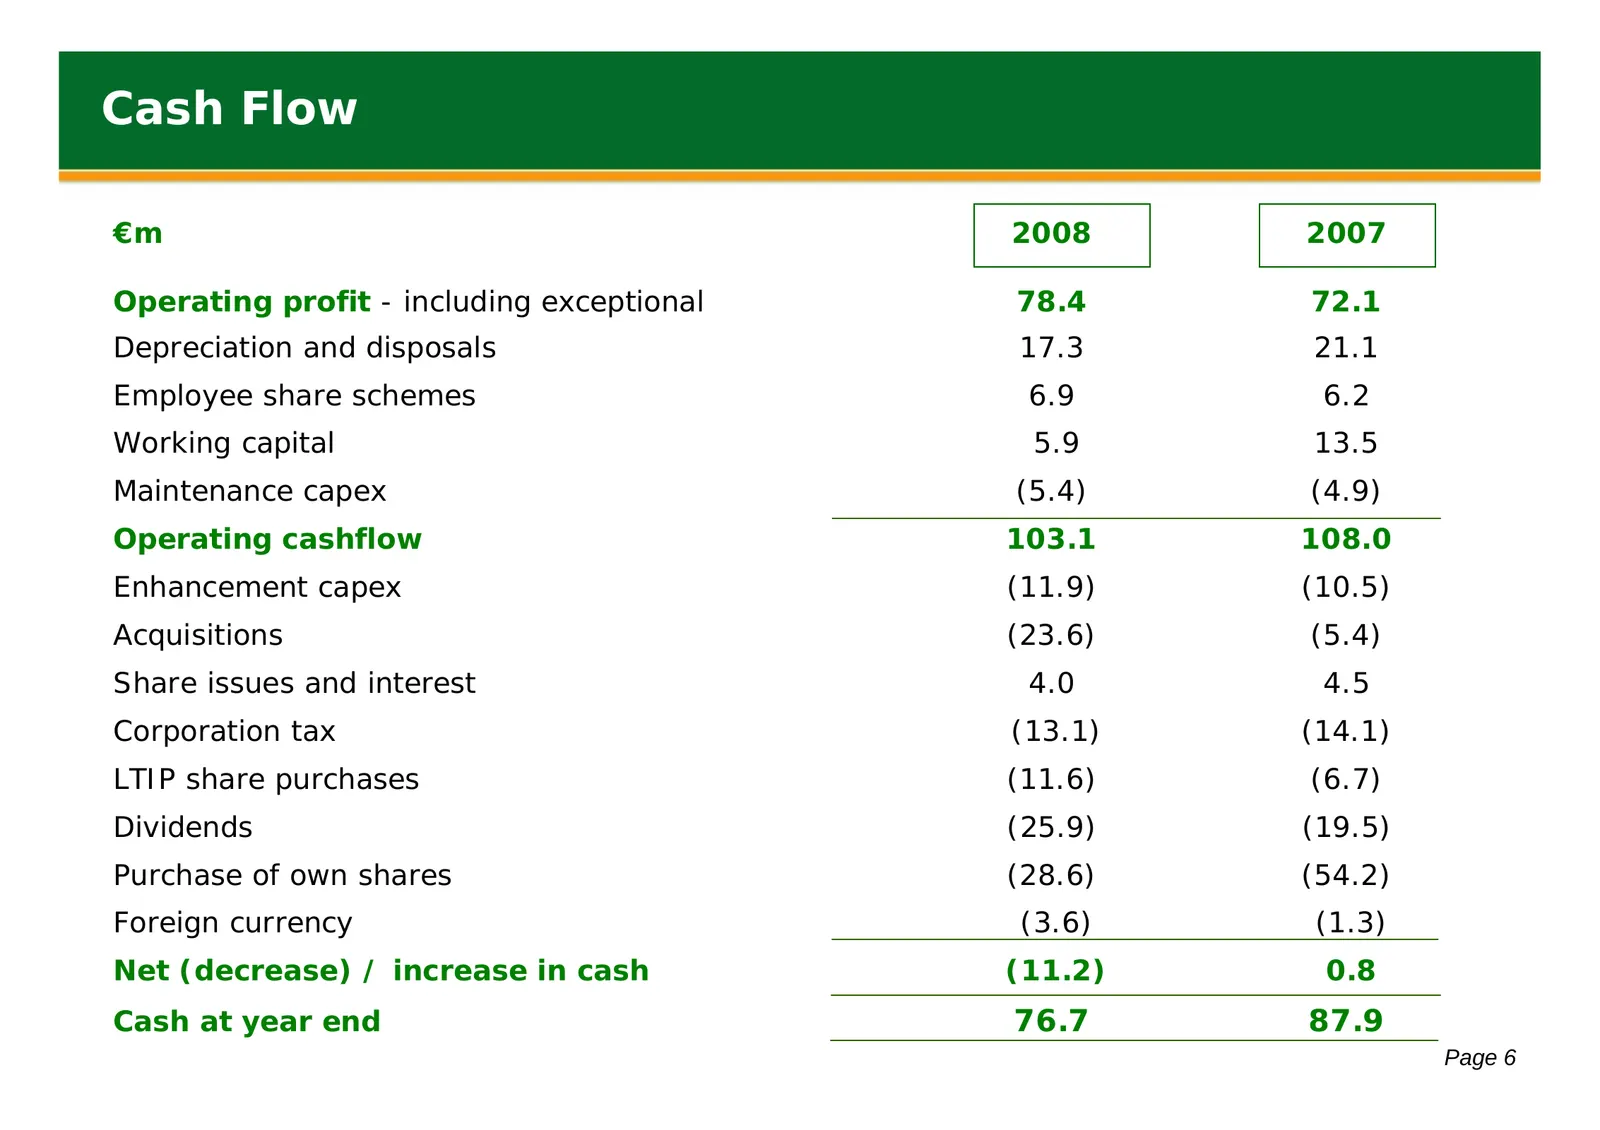
Cash Flow €m 2008 2007 Operating profit - including exceptional 78.4 72.1 Depreciation and disposals 17.3 21.1 Employee share schemes 6.9 6.2 Working capital 5.9 13.5 Maintenance capex (5.4) (4.9) Operating cashflow 103.1 108.0 Enhancement capex (11.9) (10.5) Acquisitions (23.6) (5.4) Share issues a
Slide 8: Capital Expenditure
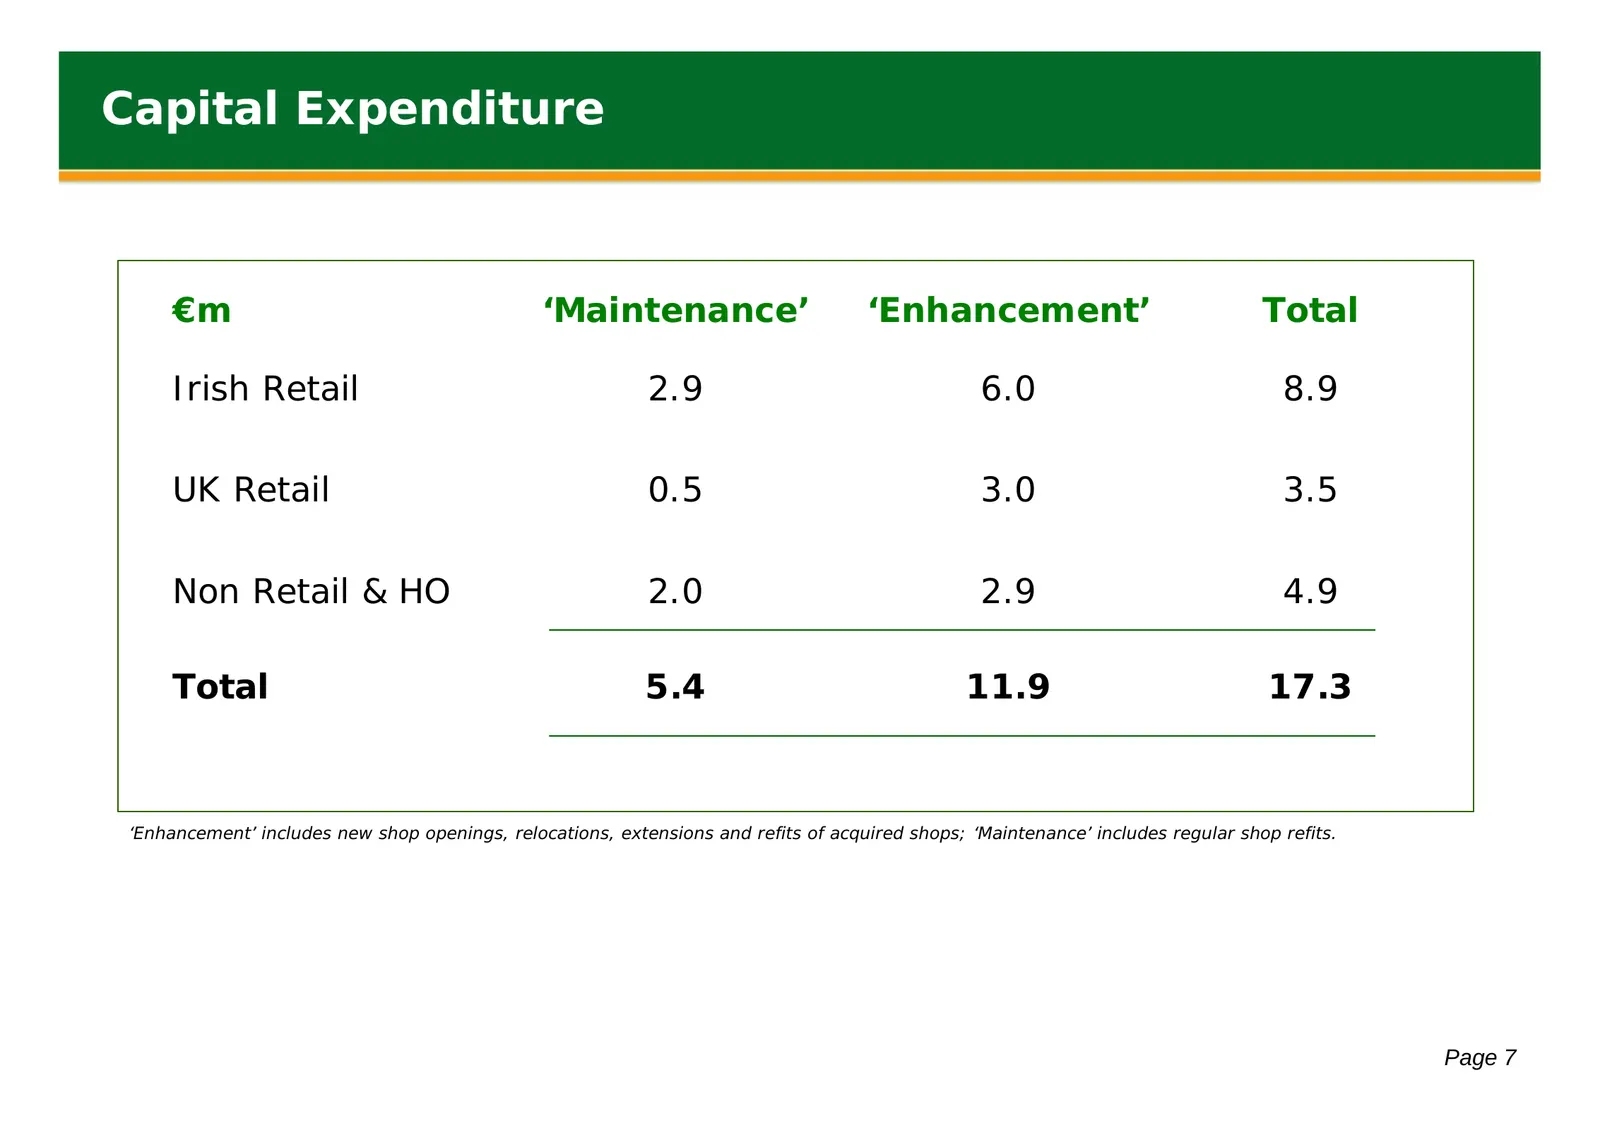
Capital Expenditure €m ‘Maintenance’ ‘Enhancement’ Total Irish Retail 2.9 6.0 8.9 UK Retail 0.5 3.0 3.5 Non Retail & HO 2.0 2.9 4.9 Total 5.4 11.9 17.3 ‘Enhancement’ includes new shop openings, relocations, extensions and refits of acquired shops; ‘Maintenance’ includes regular shop refits. Page 7
Slide 9: Operational Review
Operational Review Introduction Financial Performance Operational Review Strategy & Outlook Page 8
Slide 10: Divisional Summary
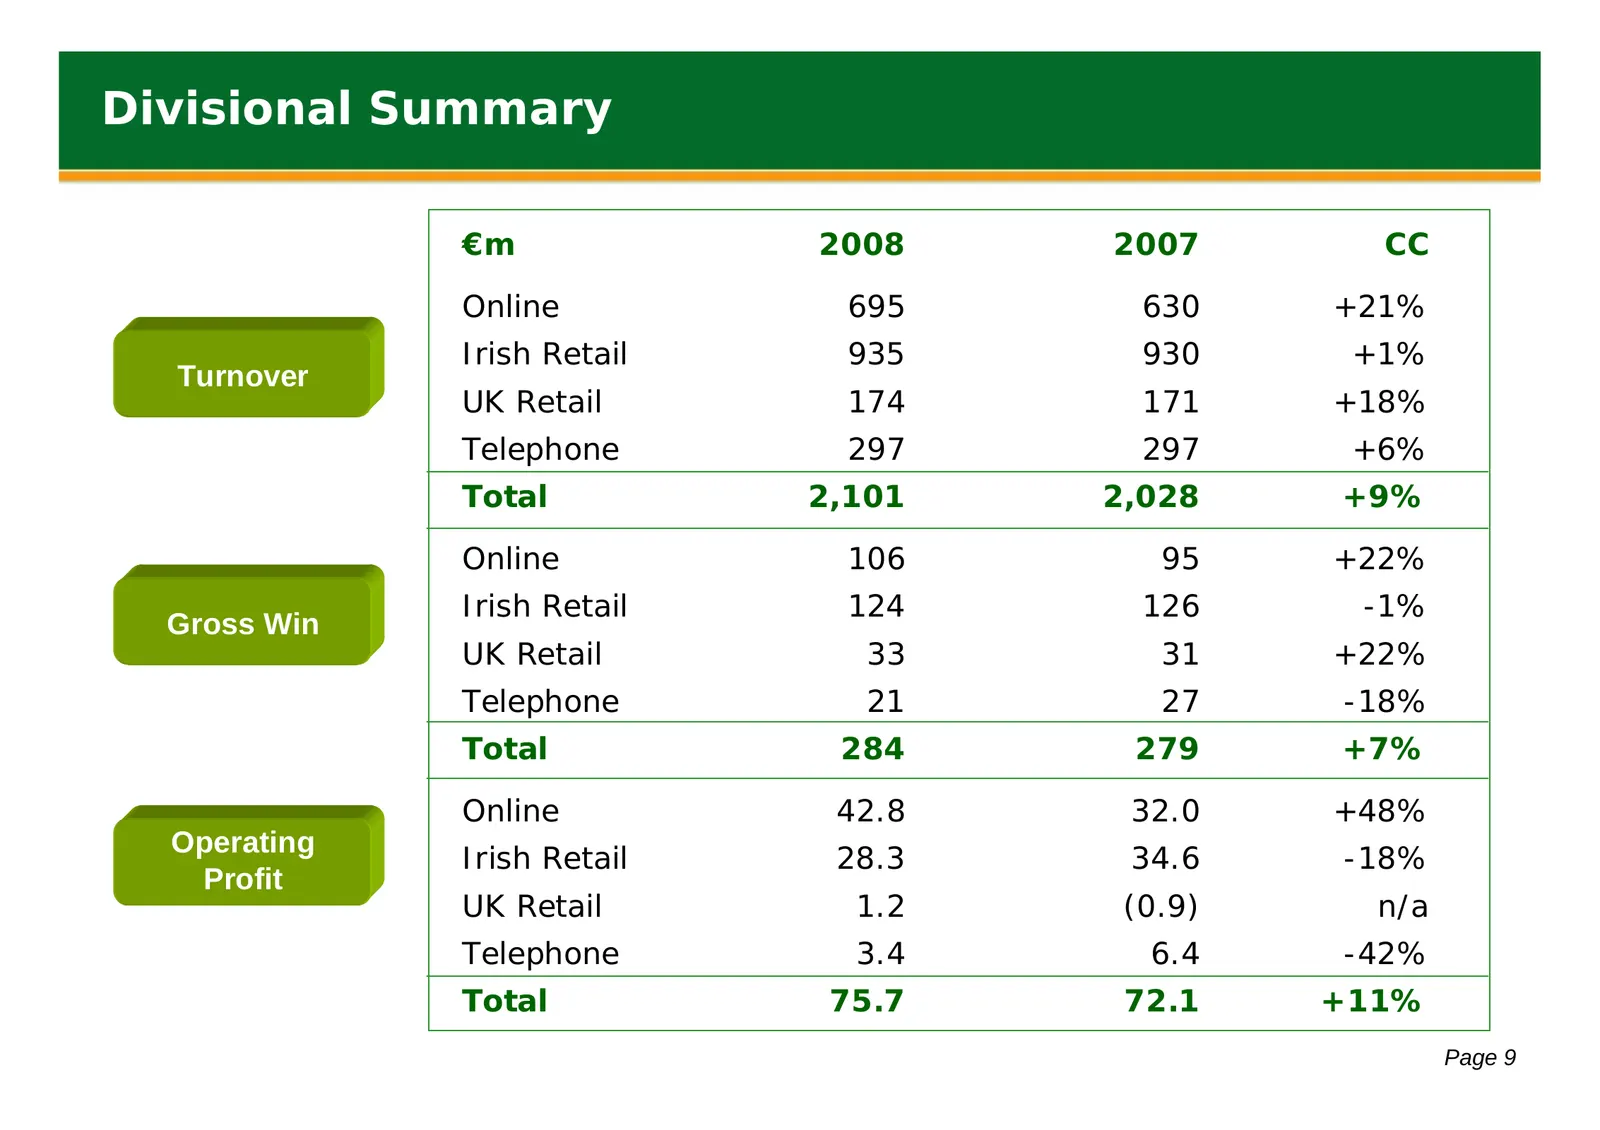
Divisional Summary €m 2008 2007 CC Online 695 630 +21% Irish Retail 935 930 +1% Turnover UK Retail 174 171 +18% Telephone 297 297 +6% Total 2,101 2,028 +9% Online 106 95 +22% Irish Retail 124 126 -1% Gross Win UK Retail 33 31 +22% Telephone 21 27 -18% Total 284 279 +7% Online 42.8 32.0 +48% Operatin
Slide 11: 2008 Gross Win By Week – Lowest to Highest
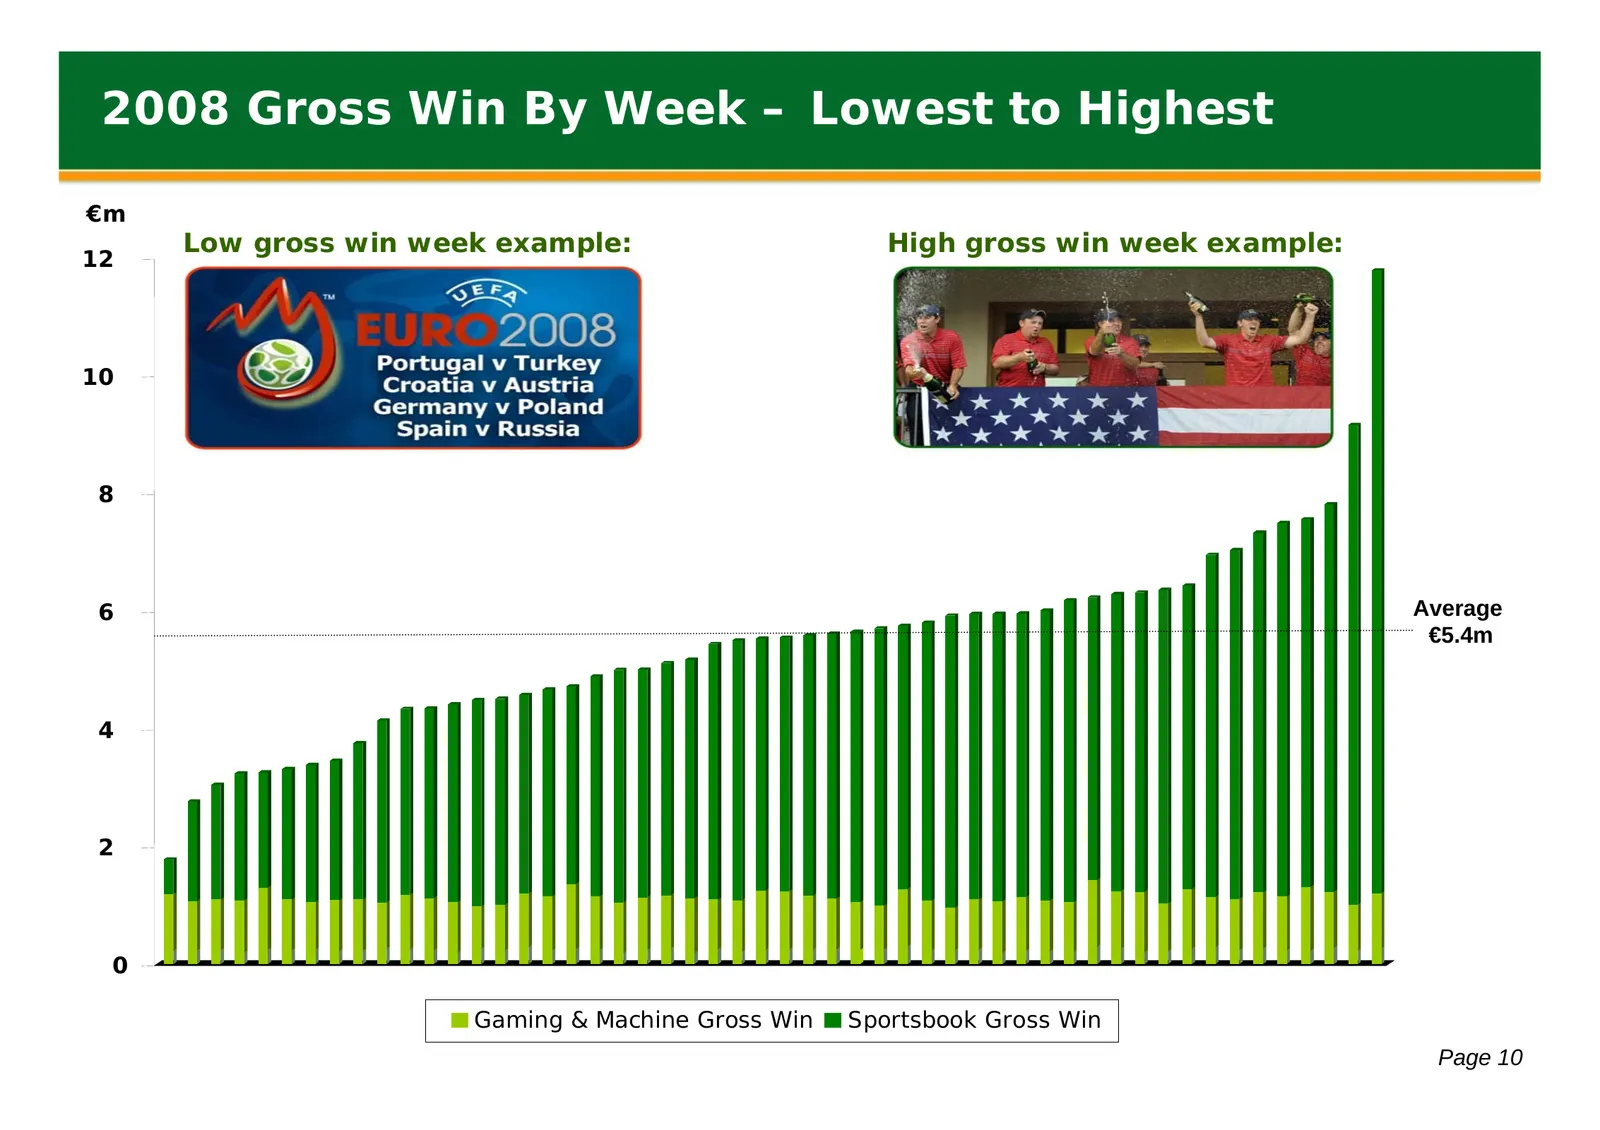
2008 Gross Win By Week – Lowest to Highest €m Low gross win week example: High gross win week example: 12 10 8 6 Average €5.4m 4 2 0 Gaming & Machine Gross Win Sportsbook Gross Win Page 10
Slide 12: Online
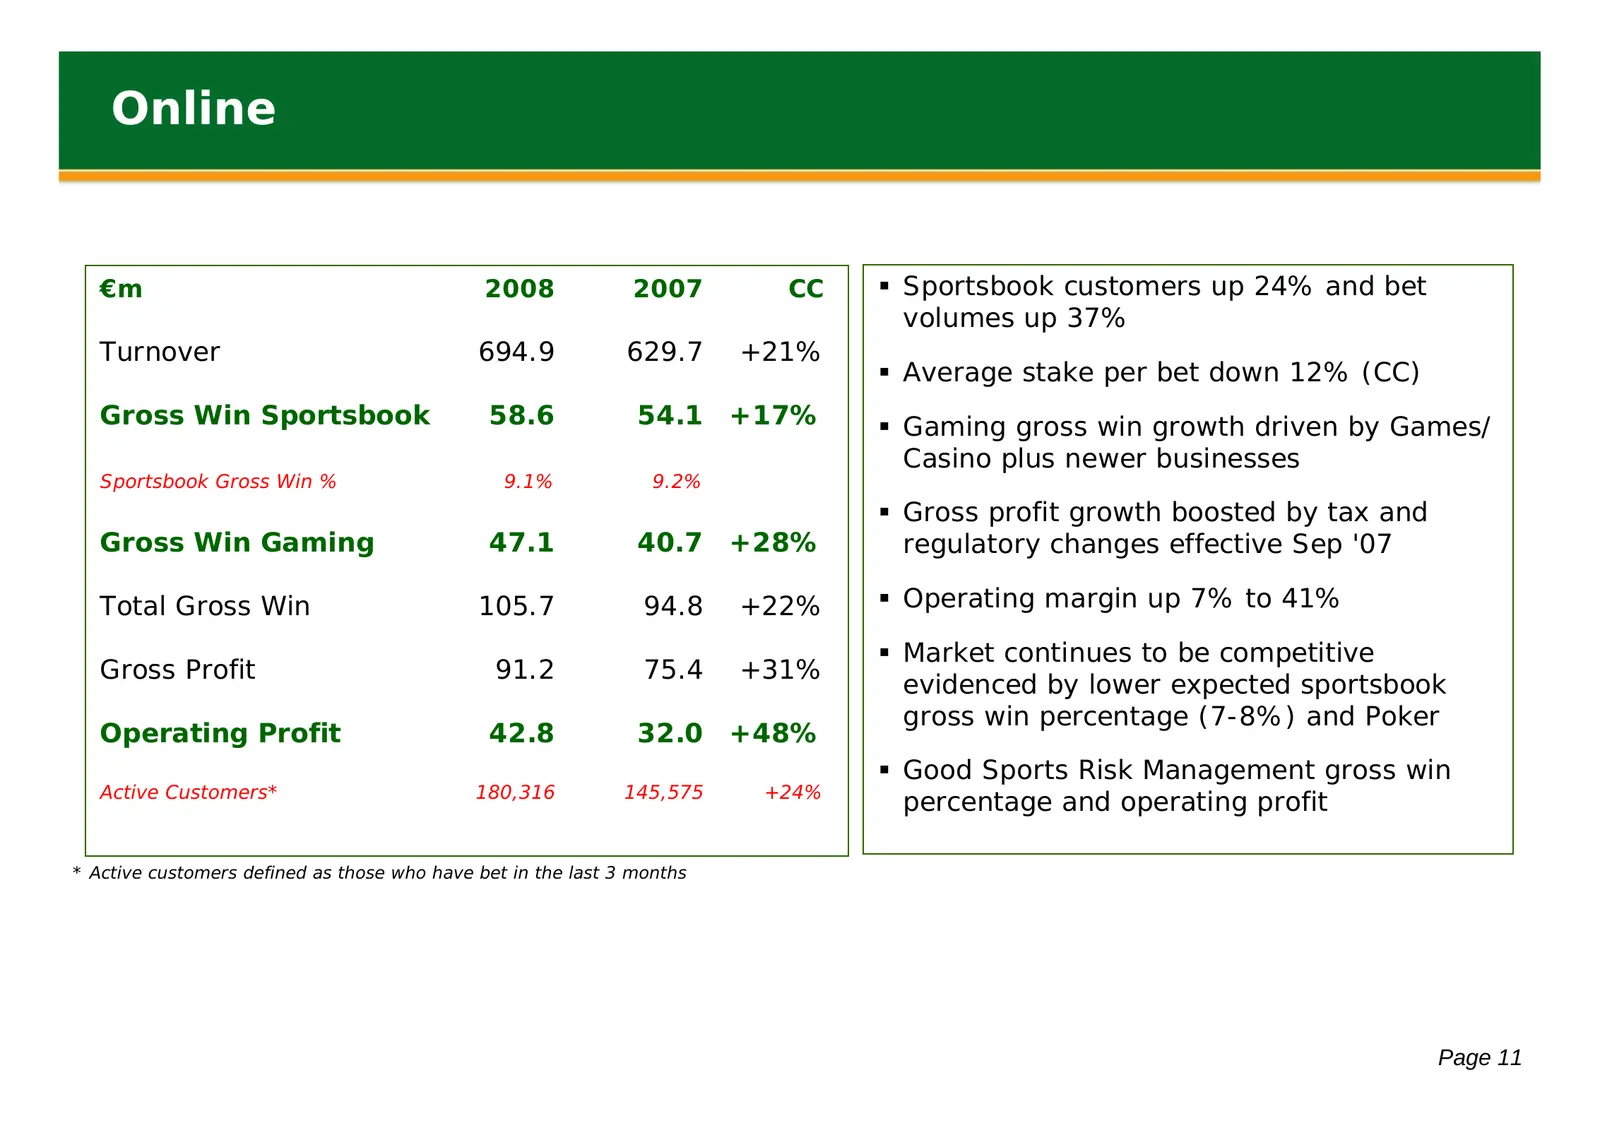
Online €m 2008 2007 CC Sportsbook customers up 24% and bet volumes up 37% Turnover 694.9 629.7 +21% Average stake per bet down 12% (CC) Gross Win Sportsbook 58.6 54.1 +17% Gaming gross win growth driven by Games/ Casino plus newer businesses Sportsbook Gross Win % 9.1% 9.2% Gross profit grow
Slide 13: Irish Retail
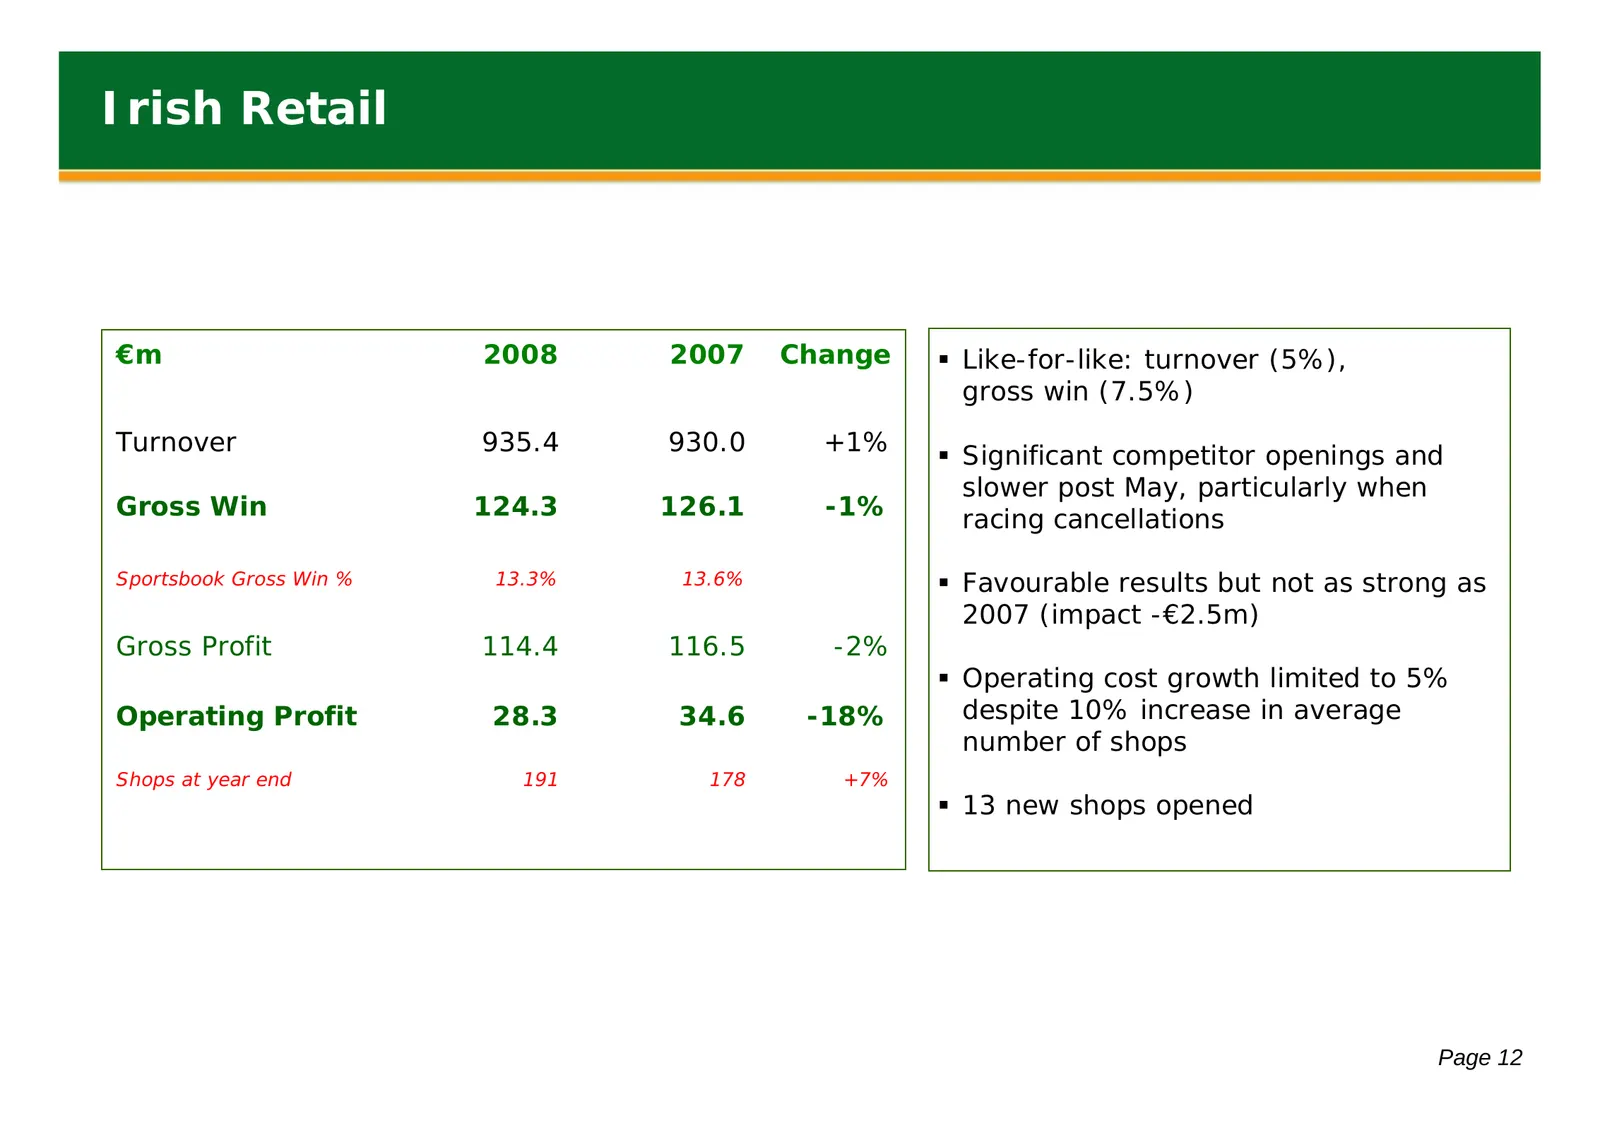
Irish Retail €m 2008 2007 Change Like-for-like: turnover (5%), gross win (7.5%) Turnover 935.4 930.0 +1% Significant competitor openings and slower post May, particularly when Gross Win 124.3 126.1 -1% racing cancellations Sportsbook Gross Win % 13.3% 13.6% Favourable results but not as strong
Slide 14: UK Retail
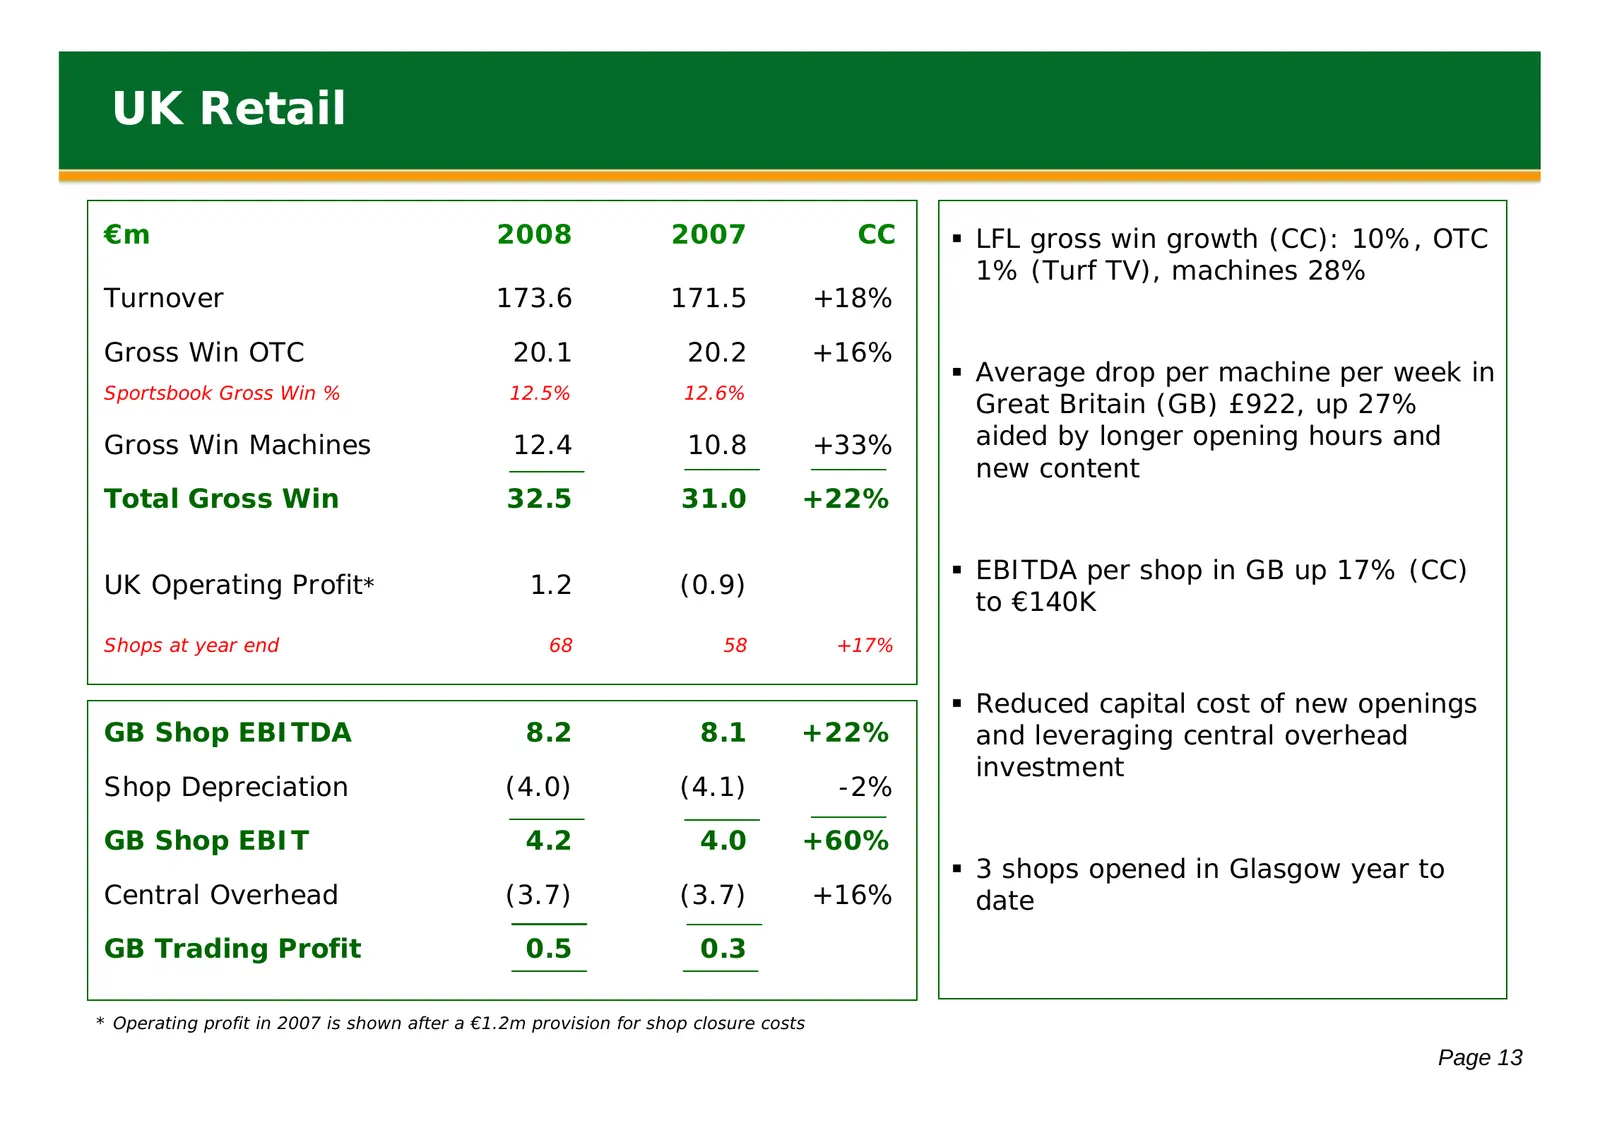
UK Retail €m 2008 2007 CC LFL gross win growth (CC): 10%, OTC 1% (Turf TV), machines 28% Turnover 173.6 171.5 +18% Gross Win OTC 20.1 20.2 +16% Average drop per machine per week in Sportsbook Gross Win % 12.5% 12.6% Great Britain (GB) £922, up 27% Gross Win Machines 12.4 10.8 +33% aided by longe
Slide 15: Telephone
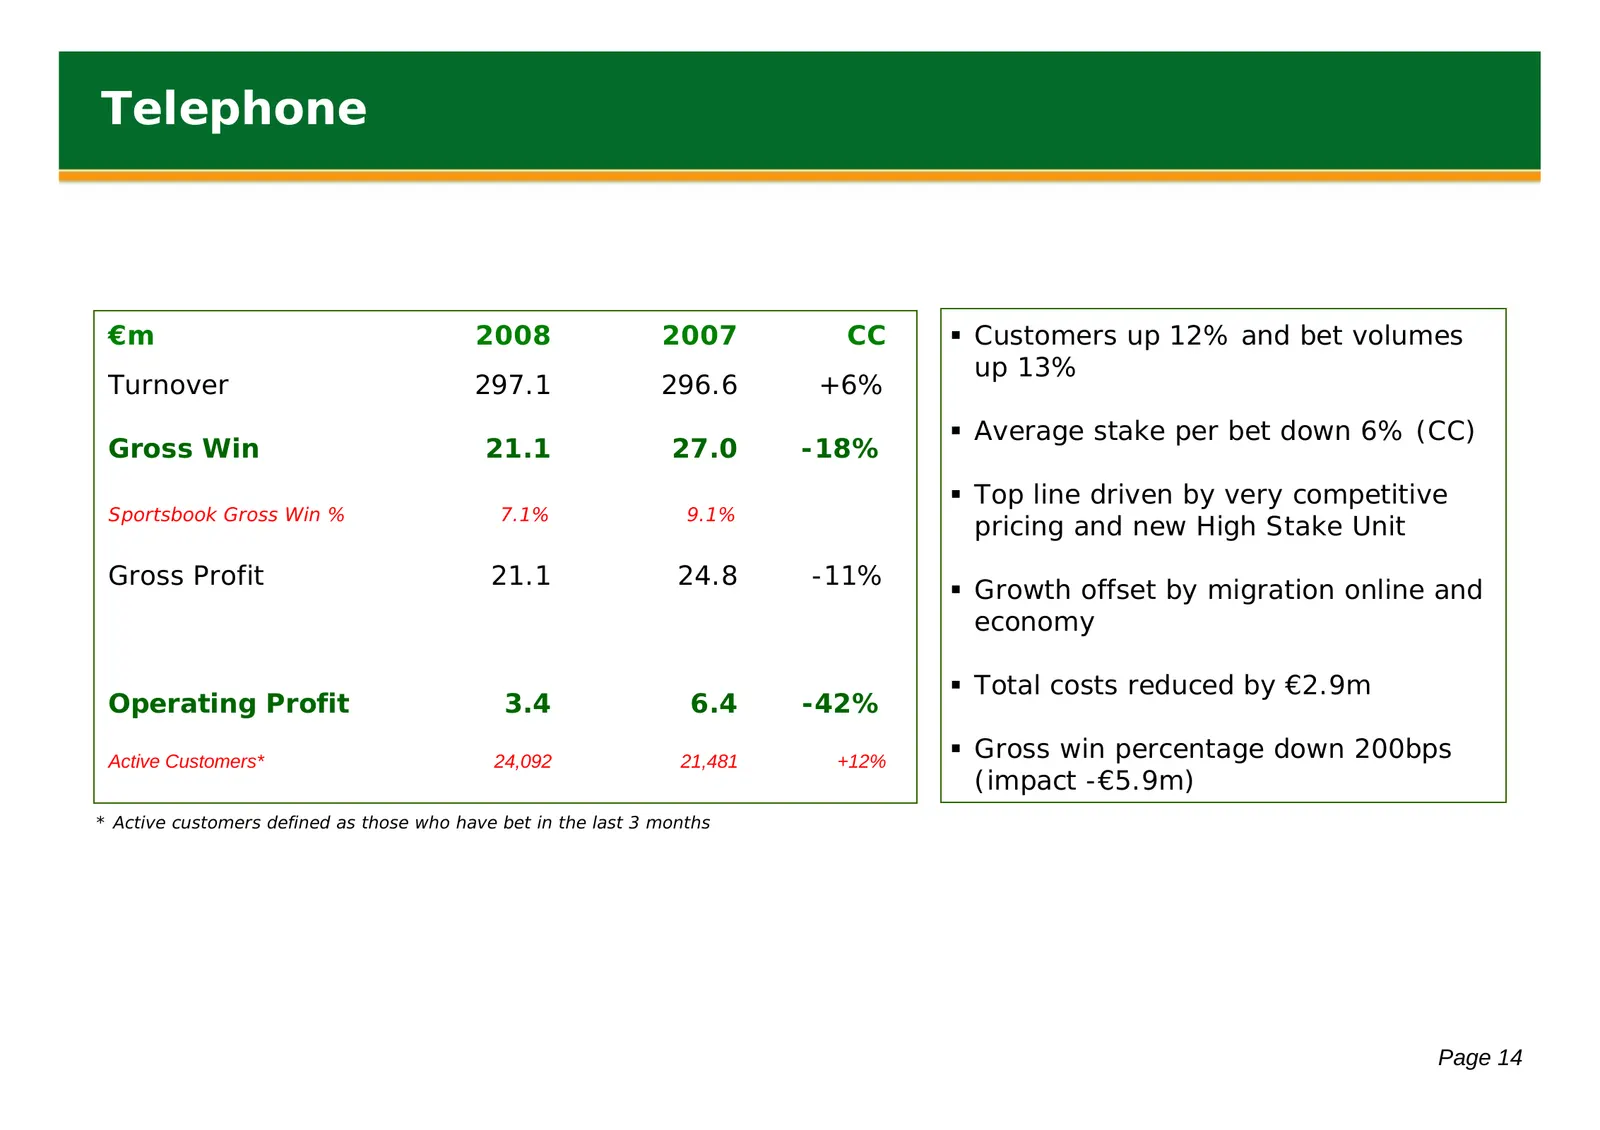
Telephone €m 2008 2007 CC Customers up 12% and bet volumes up 13% Turnover 297.1 296.6 +6% Average stake per bet down 6% (CC) Gross Win 21.1 27.0 -18% Top line driven by very competitive Sportsbook Gross Win % 7.1% 9.1% pricing and new High Stake Unit Gross Profit 21.1 24.8 -11% Growth offse
Slide 16: Strategy and Outlook
Strategy and Outlook Introduction Financial Performance Operational Review Strategy & Outlook Page 15
Slide 17: Irish Retail
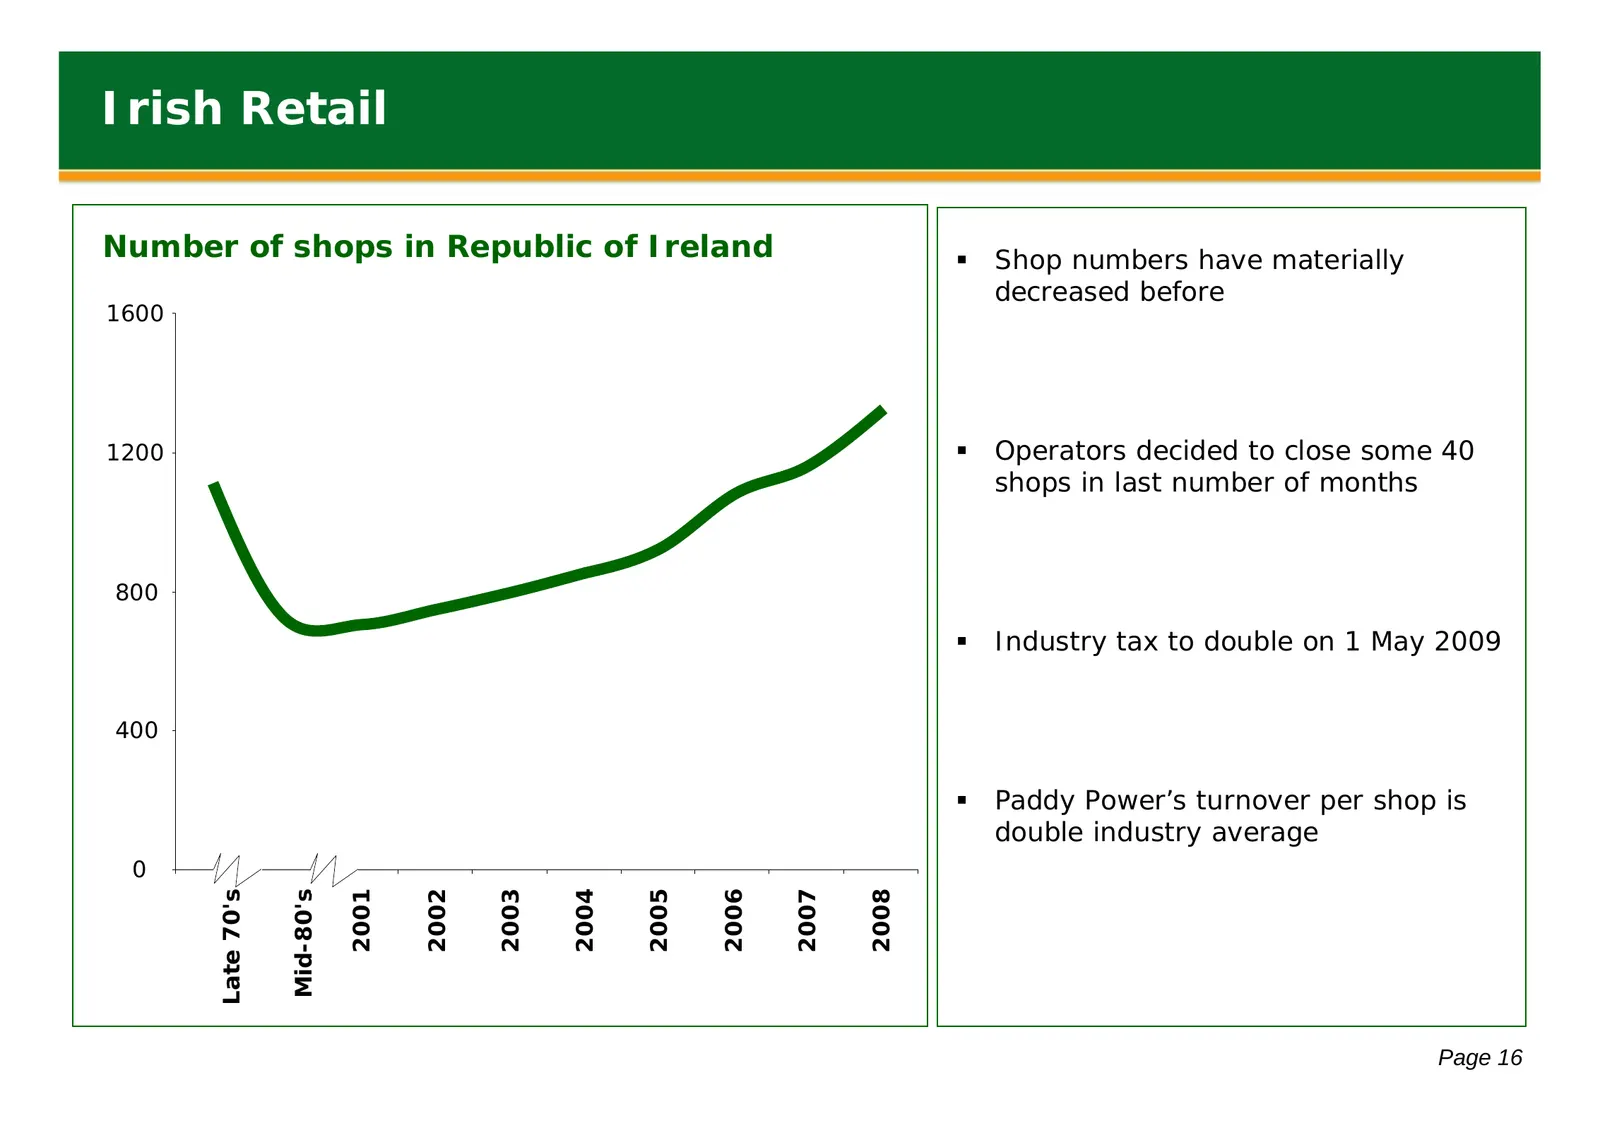
Irish Retail Number of shops in Republic of Ireland Shop numbers have materially decreased before 1600 1200 Operators decided to close some 40 shops in last number of months 800 Industry tax to double on 1 May 2009 400 Paddy Power’s turnover per shop is double industry average 0 2004 2005 20
Slide 18: Online Profit Growth
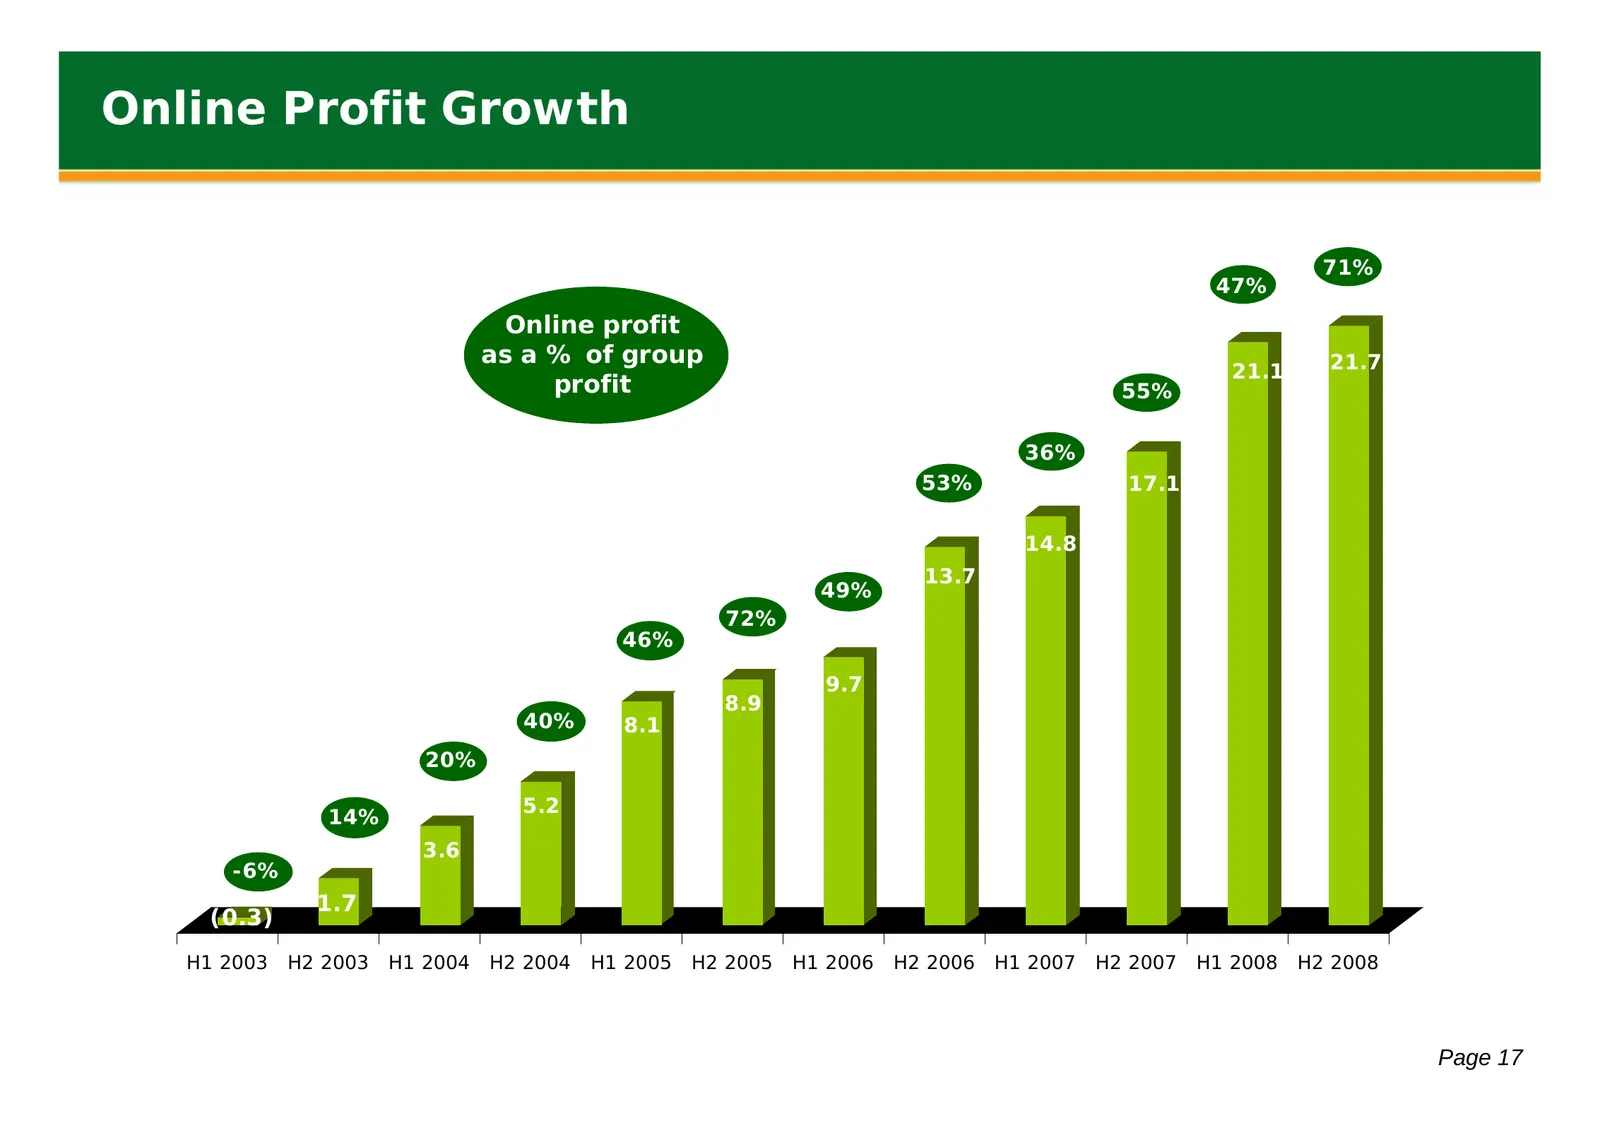
Online Profit Growth 71% 47% Online profit as a % of group 21.7 21.1 profit 55% 36% 53% 17.1 14.8 13.7 49% 72% 46% 9.7 8.9 40% 8.1 20% 5.2 14% 3.6 -6% 1.7 (0.3) H1 2003 H2 2003 H1 2004 H2 2004 H1 2005 H2 2005 H1 2006 H2 2006 H1 2007 H2 2007 H1 2008 H2 2008 Page 17
Slide 19: UK Profit Growth
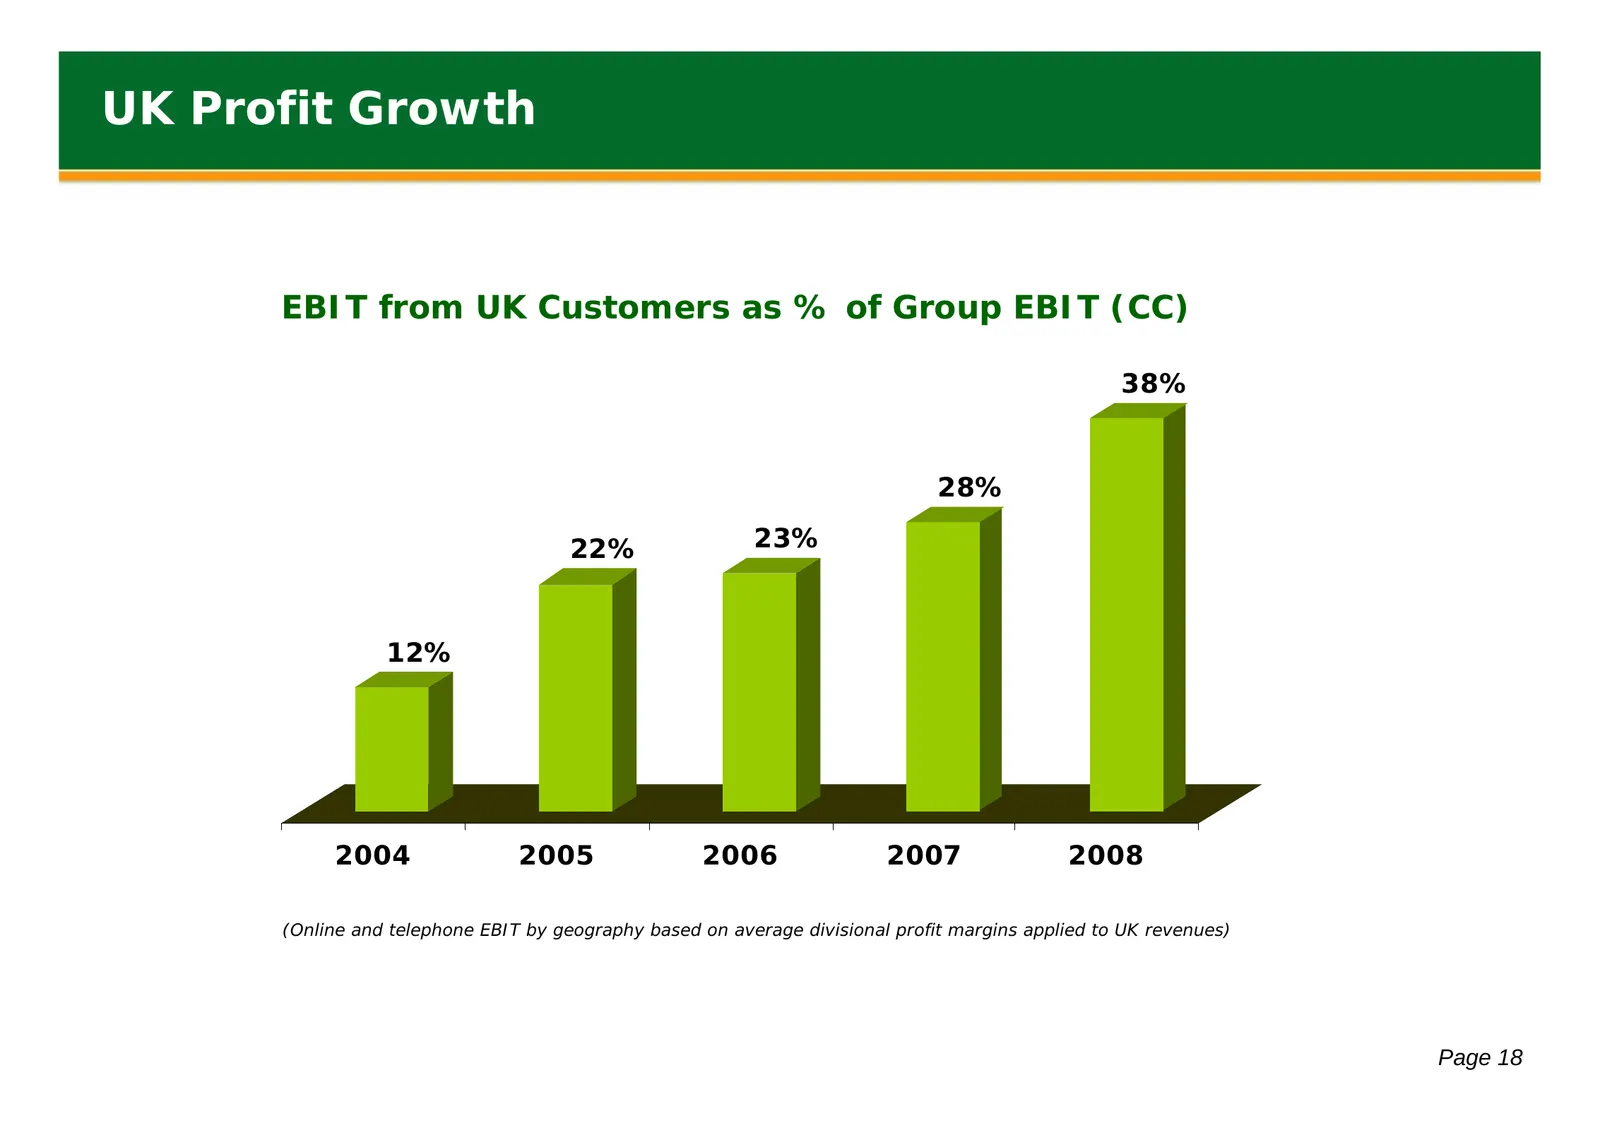
UK Profit Growth EBIT from UK Customers as % of Group EBIT (CC) 38% 28% 22% 23% 12% 2004 2005 2006 2007 2008 (Online and telephone EBIT by geography based on average divisional profit margins applied to UK revenues) Page 18
Slide 20: Reason to bet with paddypower.com
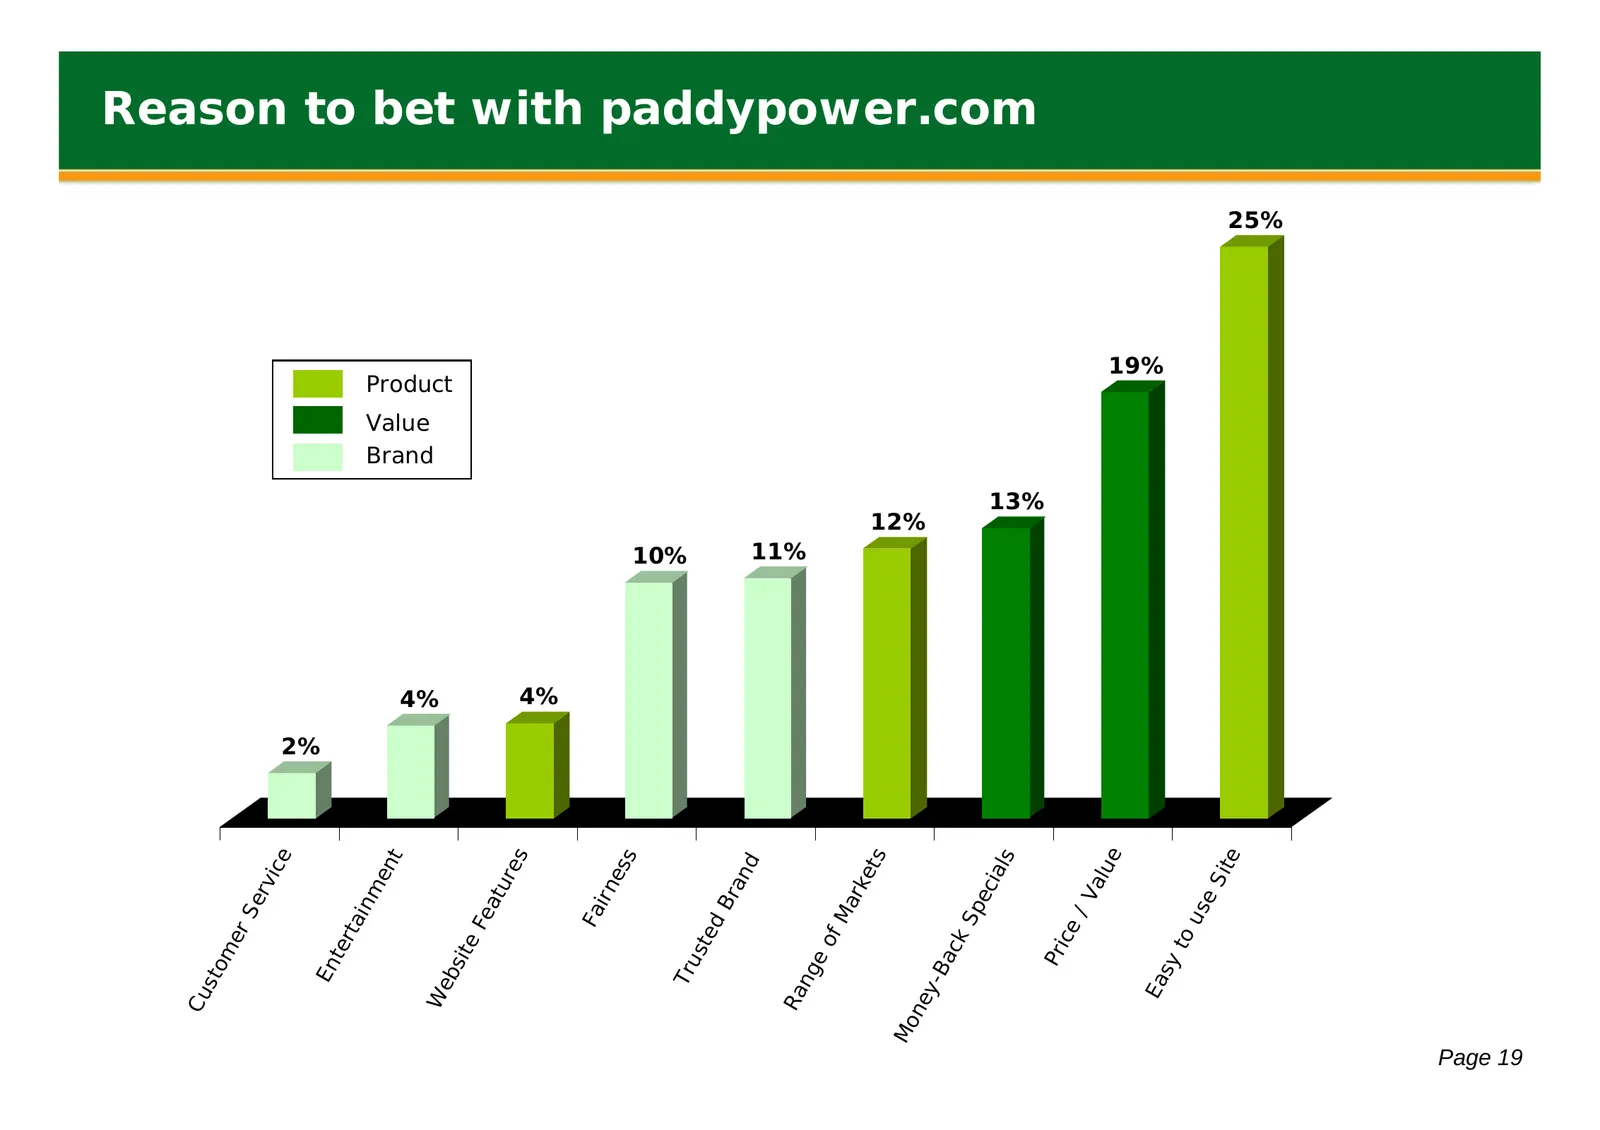
Cu st o me r Se rv ice 2% En ter tai nm en t Value Brand 4% Product We bs ite Fe atu re s 4% Fa ir n es s 10% Tr us ted Br an d Ra 11% ng eo fM ar ke ts Mo 12% ne y -B ac kS pe cia ls Reason to bet with paddypower.com 13% Pr ice / Va lue Ea 19% sy to u se Sit e 25% Page 19
Slide 21: Value
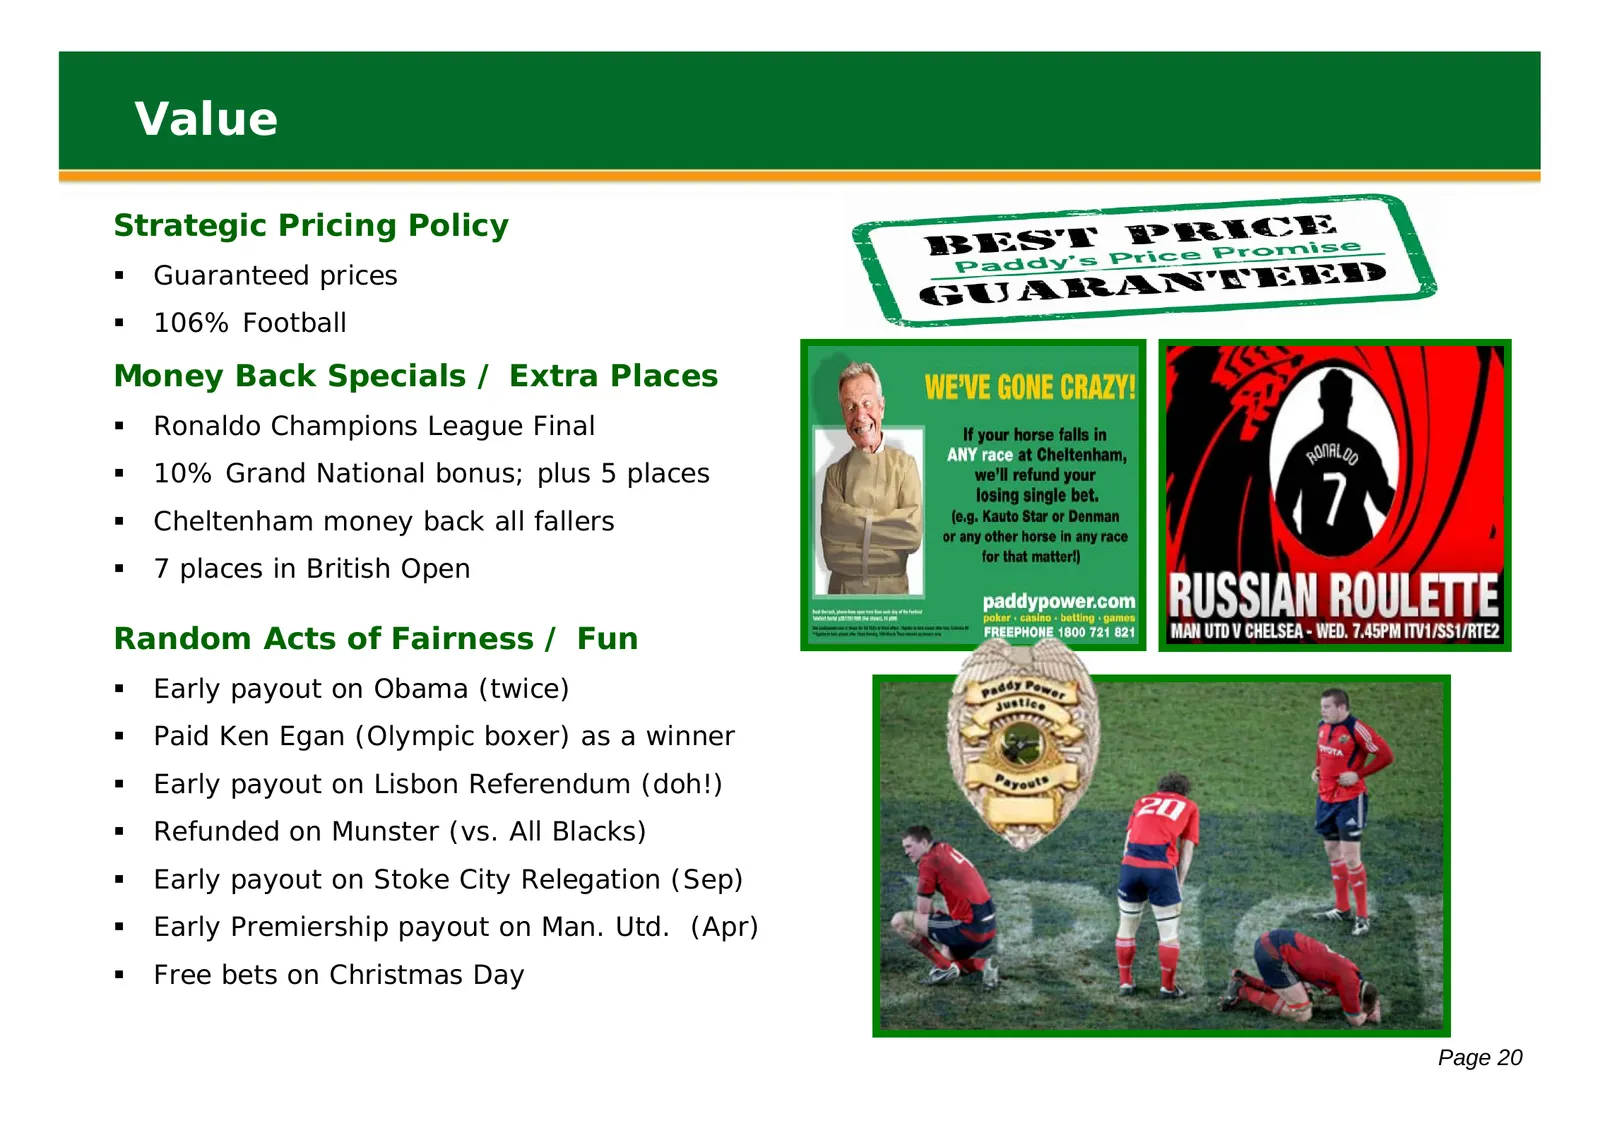
Value Strategic Pricing Policy Guaranteed prices 106% Football Money Back Specials / Extra Places Ronaldo Champions League Final 10% Grand National bonus; plus 5 places Cheltenham money back all fallers 7 places in British Open Random Acts of Fairness / Fun Early payout on Obama (twice
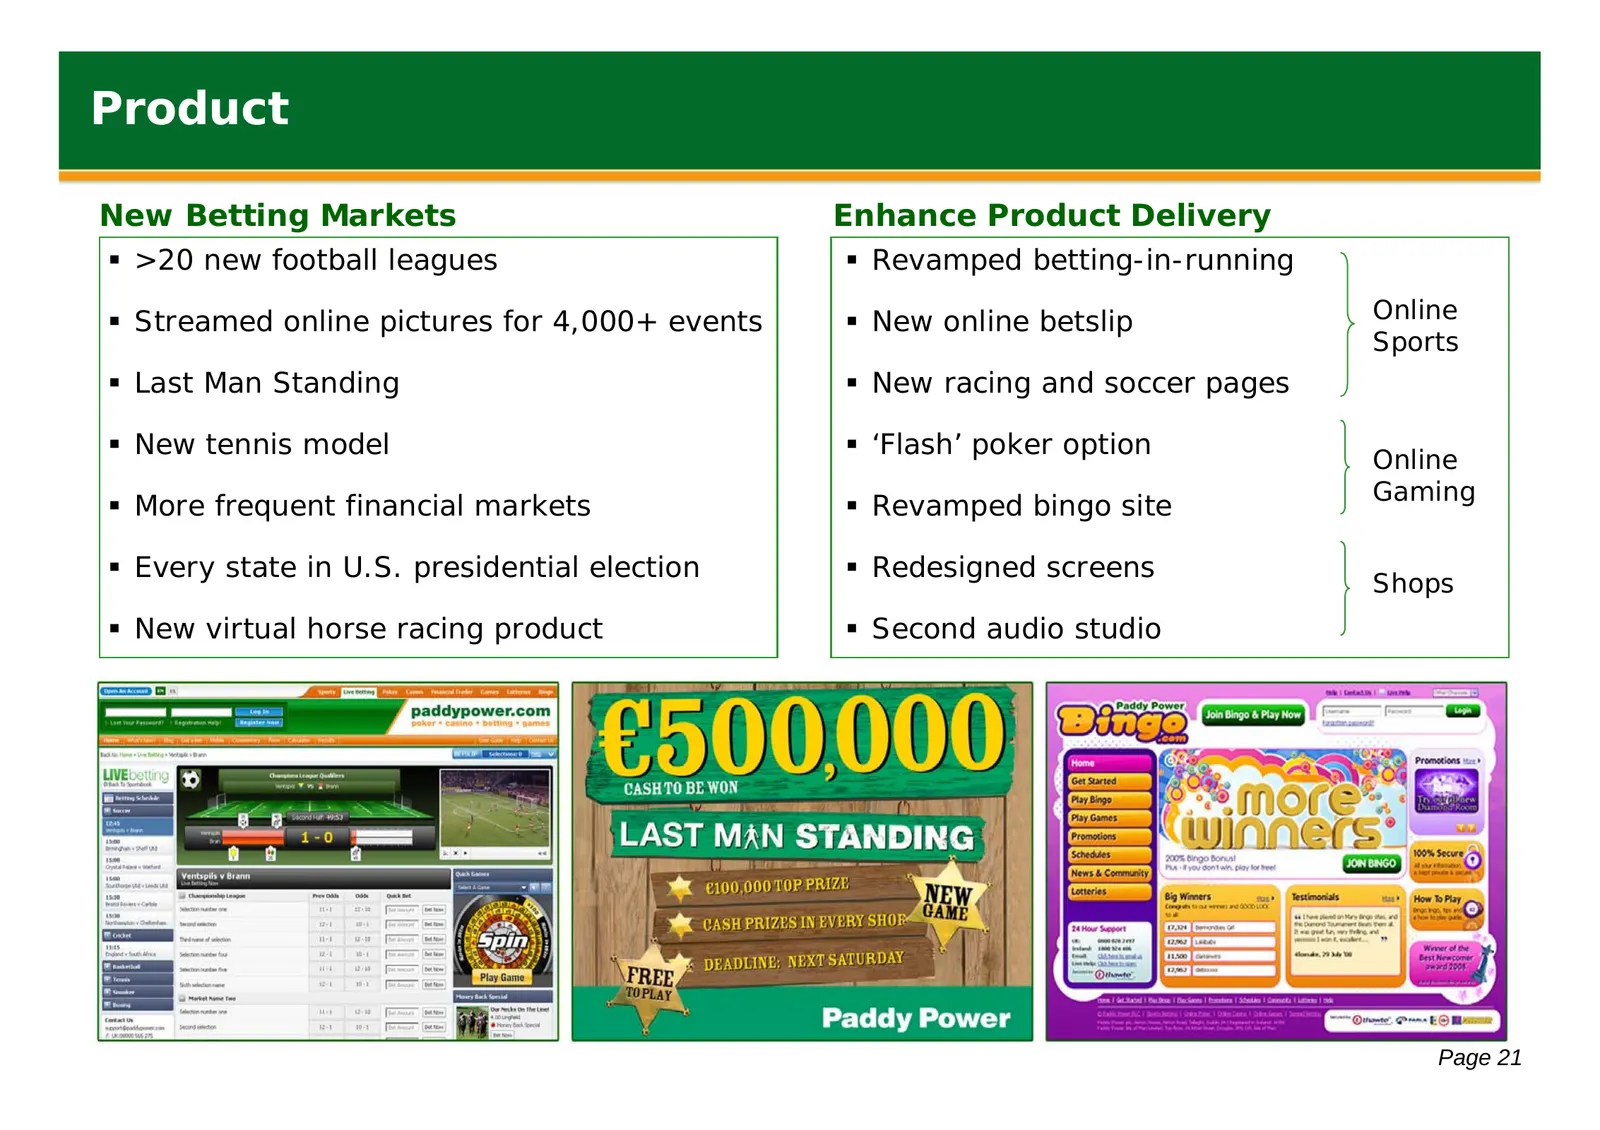
Slide 22: Product
Product New Betting Markets Enhance Product Delivery >20 new football leagues Revamped betting-in-running Streamed online pictures for 4,000+ events New online betslip Online Sports Last Man Standing New racing and soccer pages New tennis model ‘Flash’ poker option Online Gaming Mo

Slide 23: Brand: Non-Traditional Betting Markets
Brand: Non-Traditional Betting Markets Recession Betting - Betting on the American Airlines, Banks, Riots! Existence of God Election Betting Full Post Posted Friday, October 17, 2008 2:34 PM Irish Bookies: U.S. Election Is Over By Joanna Heath The U.S. election is less than 3 weeks away, but some be
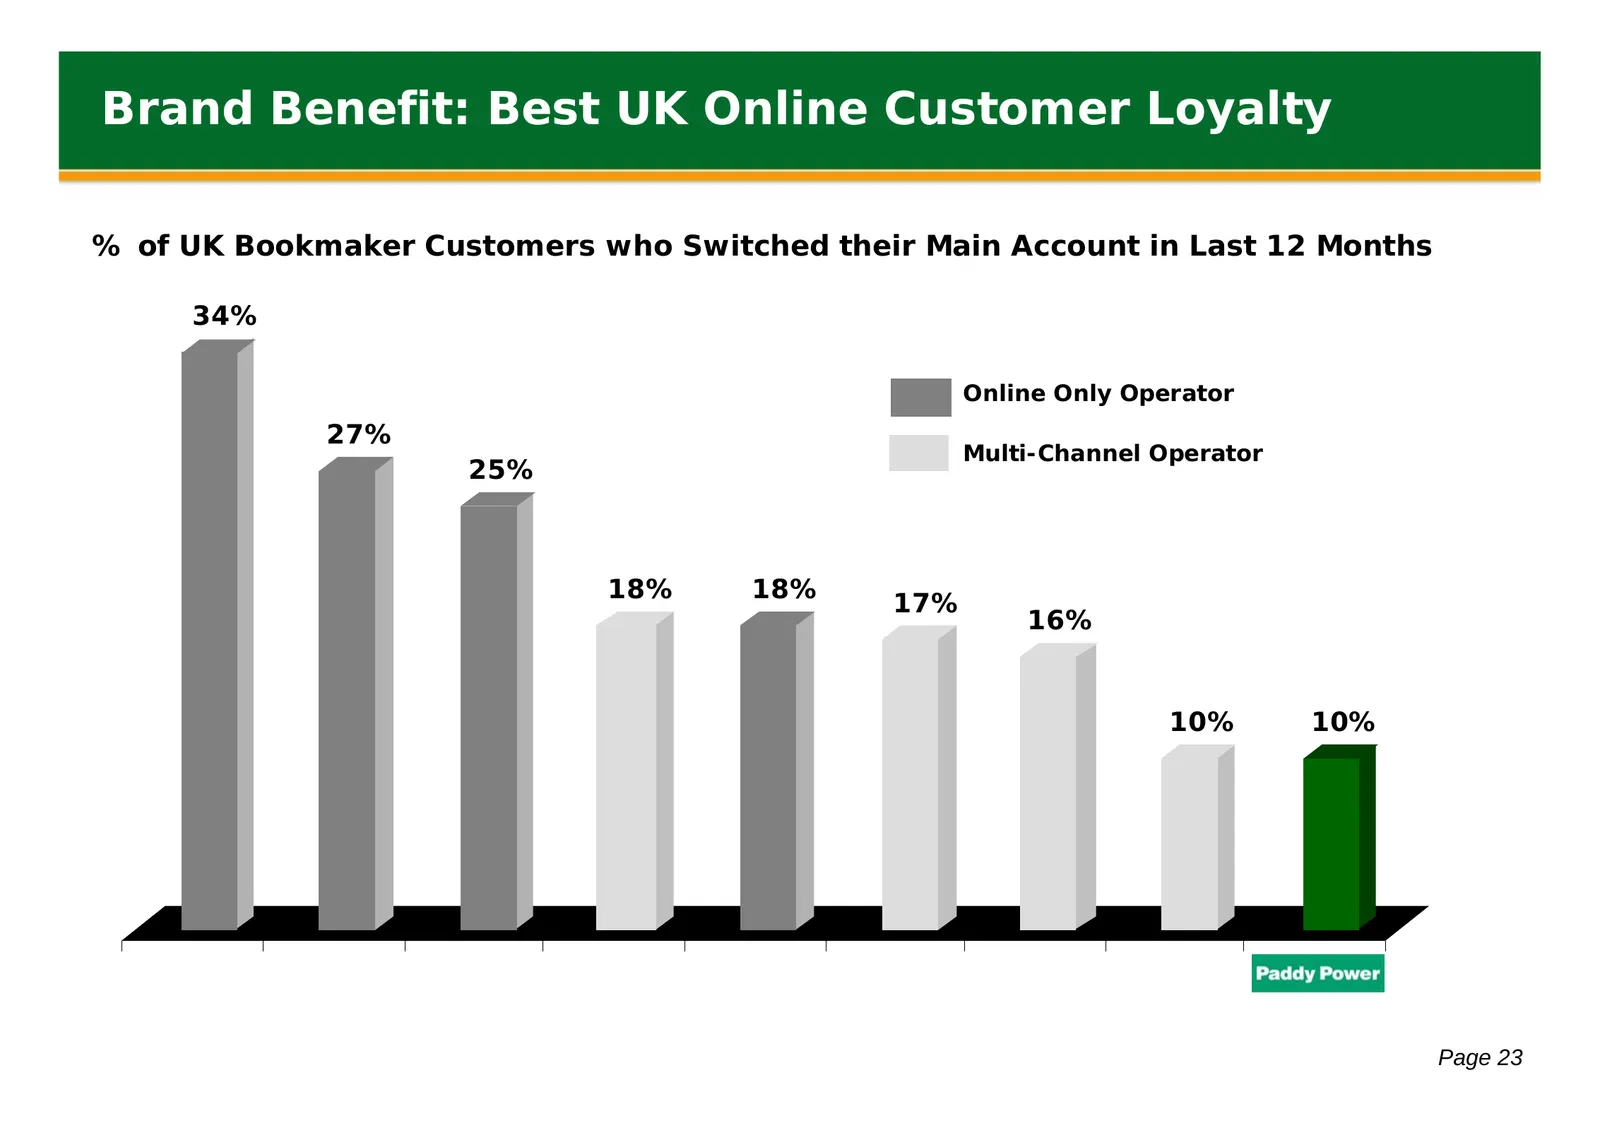
Slide 24: Brand Benefit: Best UK Online Customer Loyalty
Brand Benefit: Best UK Online Customer Loyalty % of UK Bookmaker Customers who Switched their Main Account in Last 12 Months 34% Online Only Operator 27% Multi-Channel Operator 25% 18% 18% 17% 16% 10% 10% Page 23
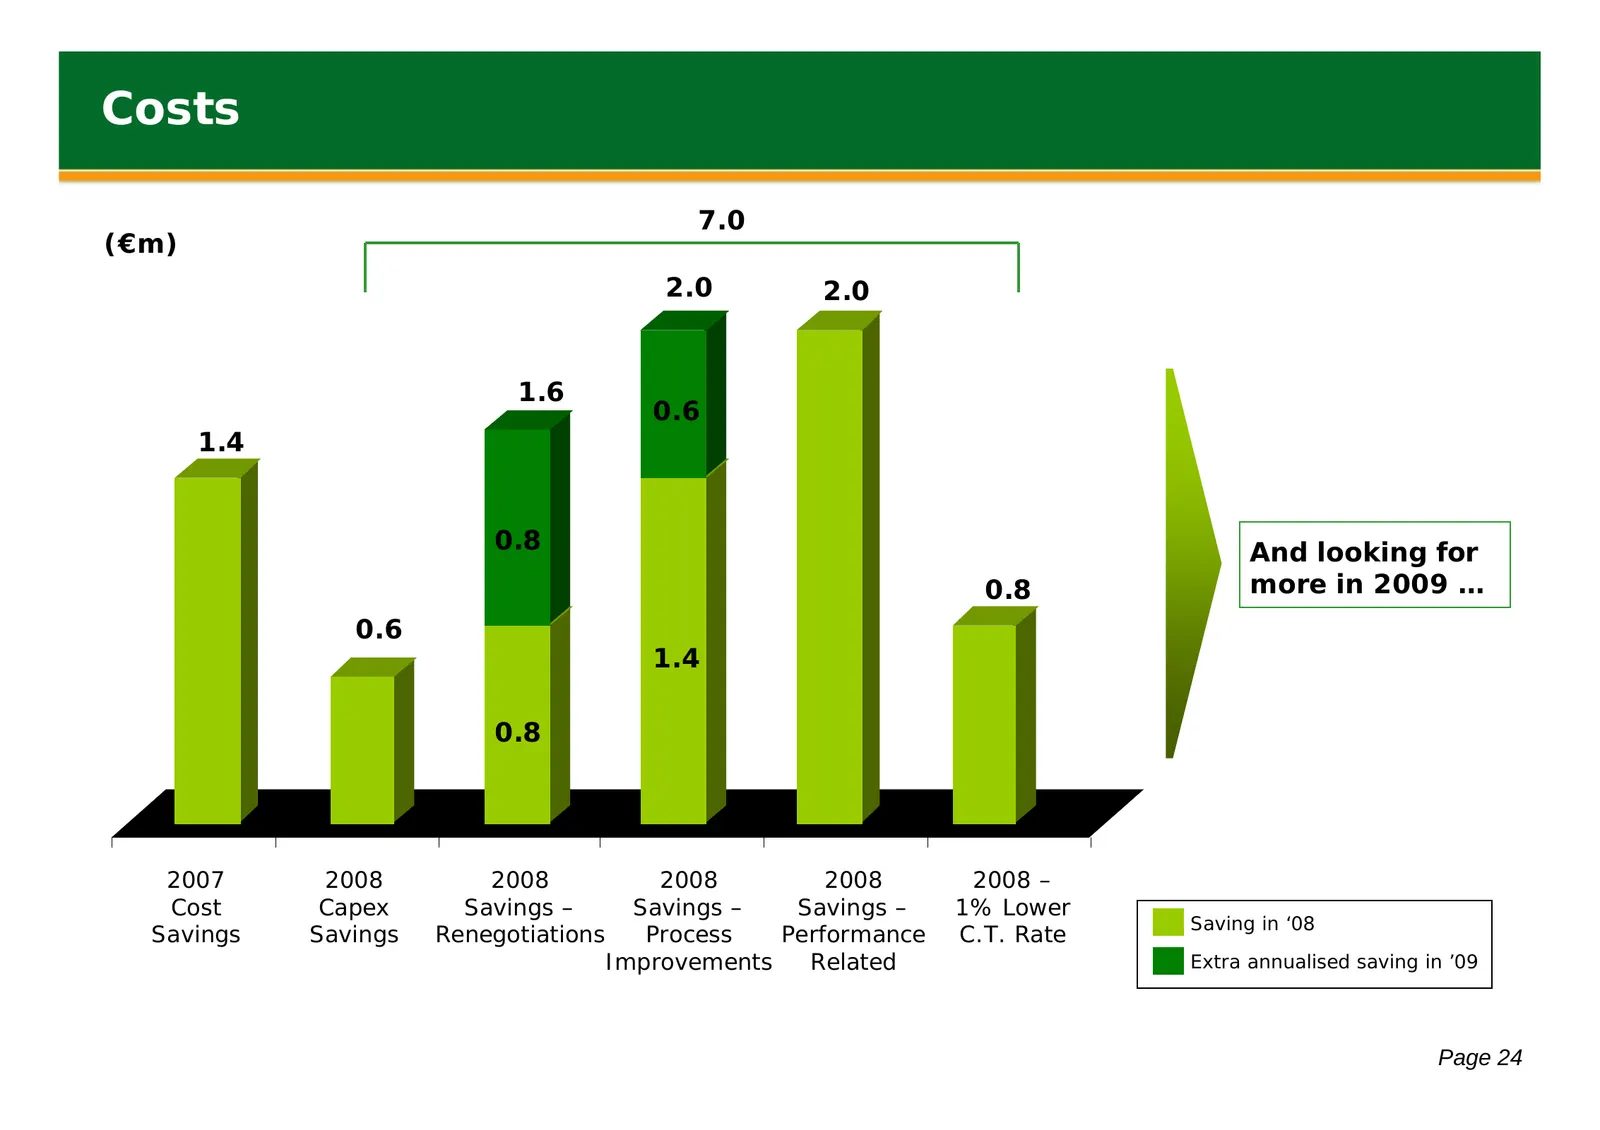
Slide 25: Costs
Costs 7.0 (€m) 2.0 2.0 1.6 0.6 1.4 0.8 And looking for 0.8 more in 2009 … 0.6 1.4 0.8 2007 2008 2008 2008 2008 2008 – Cost Capex Savings – Savings – Savings – 1% Lower Saving in ‘08 Savings Savings Renegotiations Process Performance C.T. Rate Improvements Related Extra annualised saving in ’09 Page
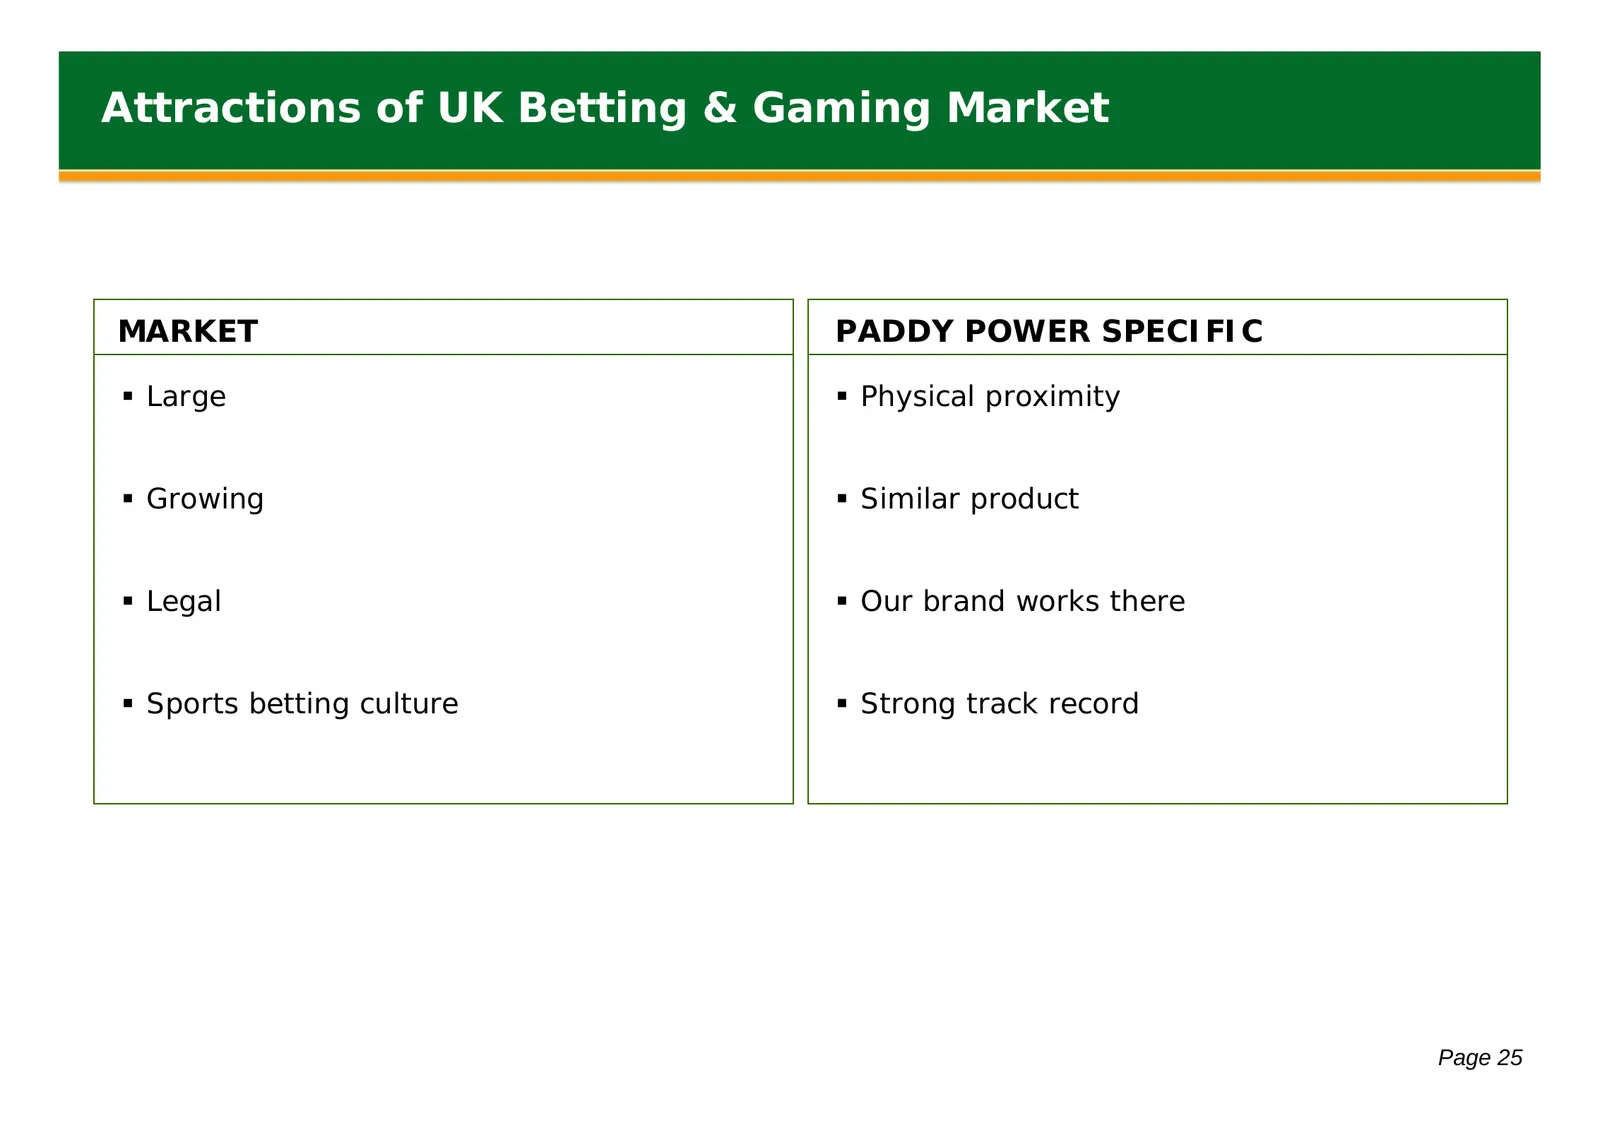
Slide 26: Attractions of UK Betting & Gaming Market
Attractions of UK Betting & Gaming Market MARKET PADDY POWER SPECIFIC Large Physical proximity Growing Similar product Legal Our brand works there Sports betting culture Strong track record Page 25
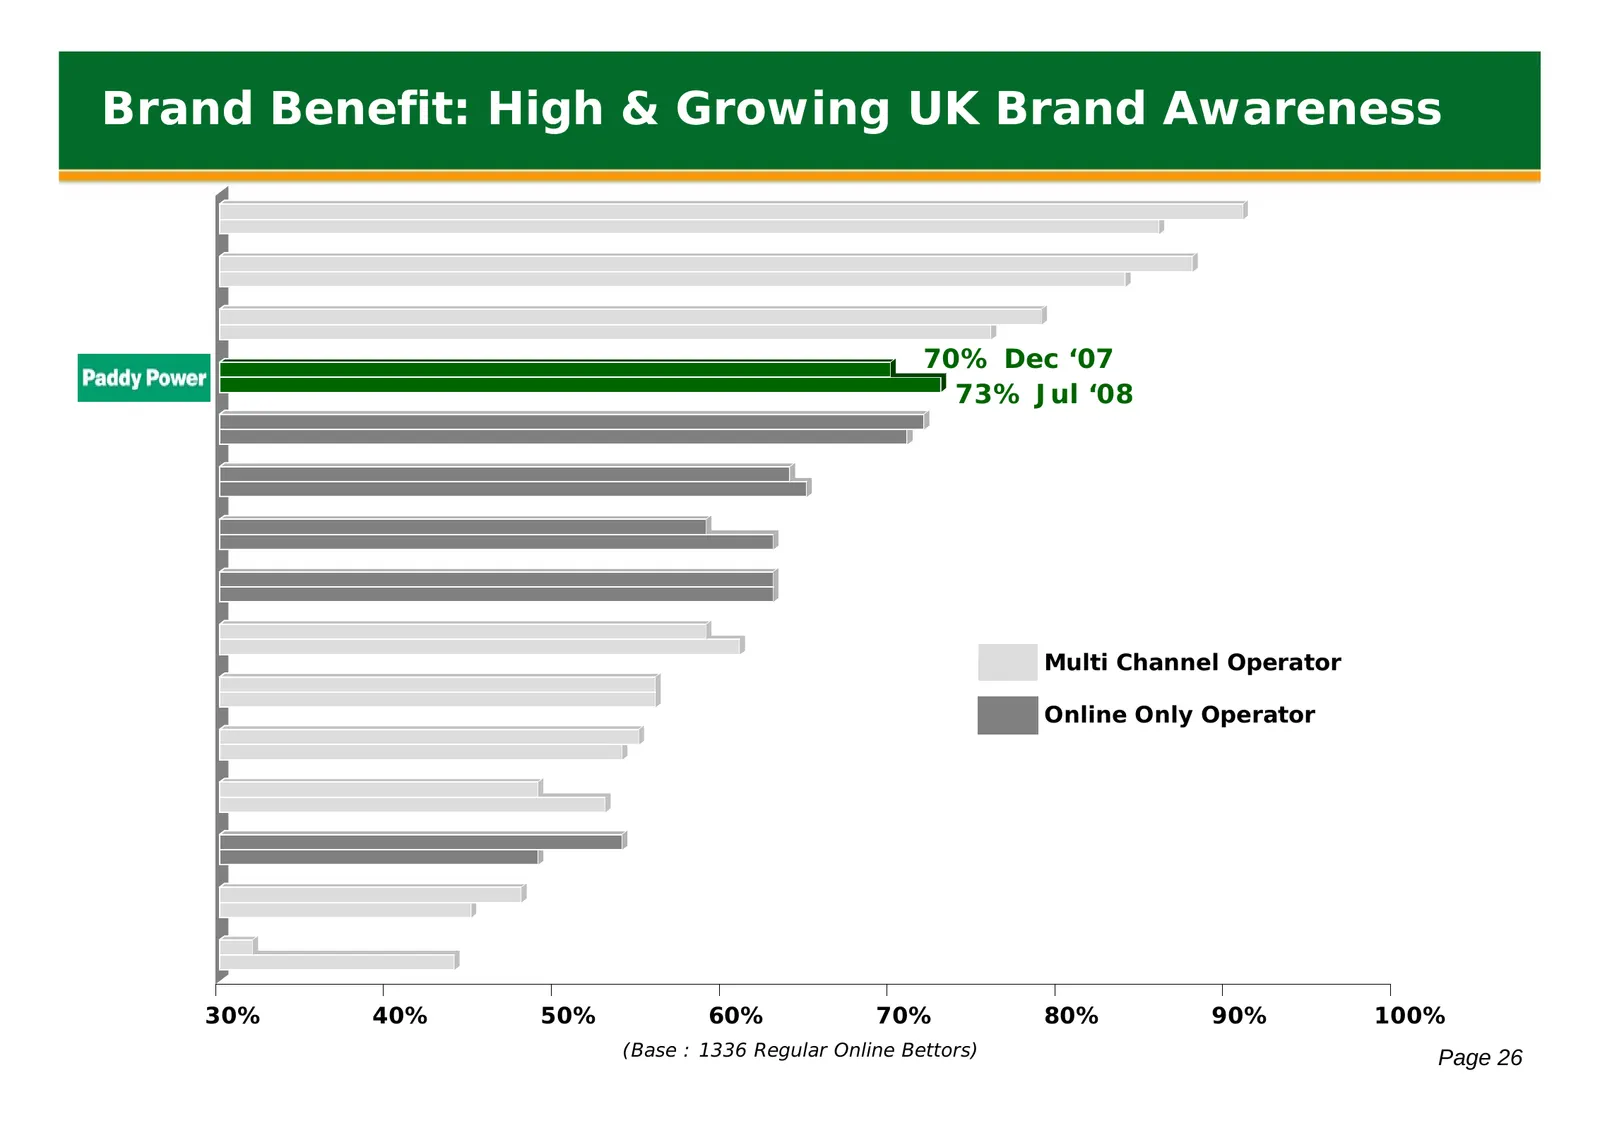
Slide 27: Brand Benefit: High & Growing UK Brand Awareness
Brand Benefit: High & Growing UK Brand Awareness 70% Dec ‘07 73% Jul ‘08 Multi Channel Operator Online Only Operator 30% 40% 50% 60% 70% 80% 90% 100% (Base : 1336 Regular Online Bettors) Page 26
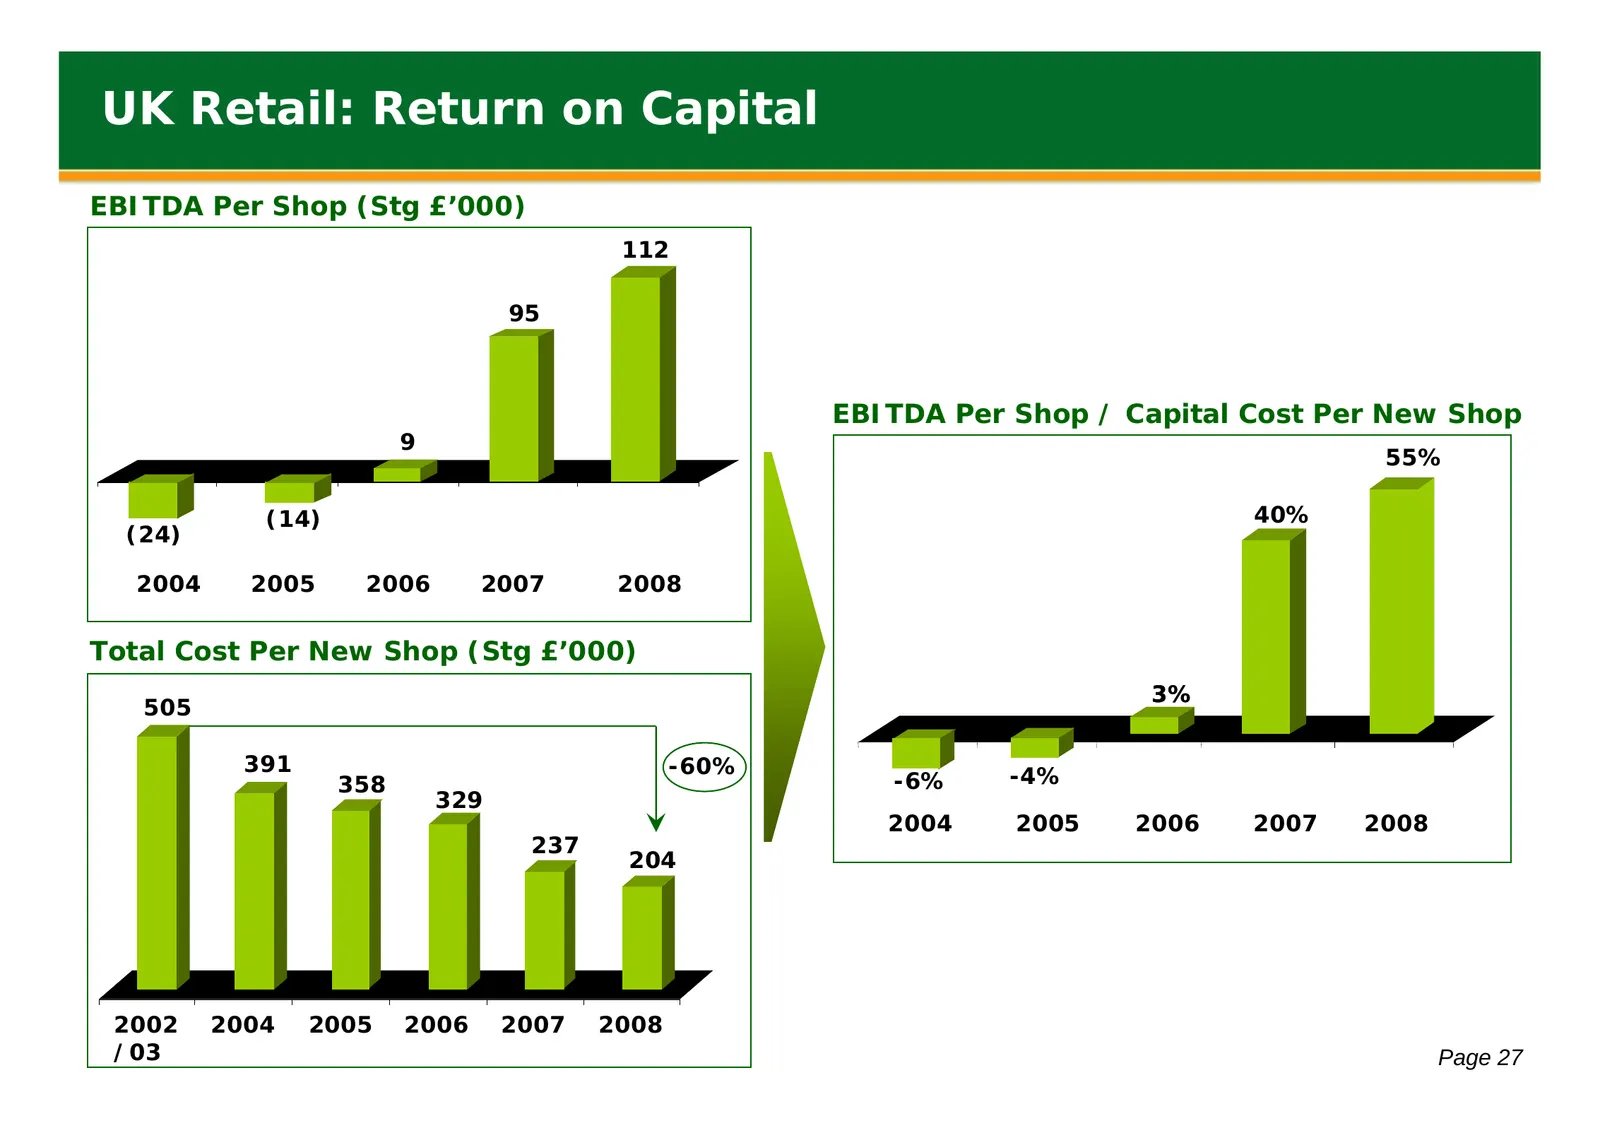
Slide 28: UK Retail: Return on Capital
UK Retail: Return on Capital EBITDA Per Shop (Stg £’000) 112 95 EBITDA Per Shop / Capital Cost Per New Shop 9 55% (14) 40% (24) 2004 2005 2006 2007 2008 Total Cost Per New Shop (Stg £’000) 3% 505 391 -60% 358 -6% -4% 329 2004 2005 2006 2007 2008 237 204 2002 2004 2005 2006 2007 2008 /03 Page 27
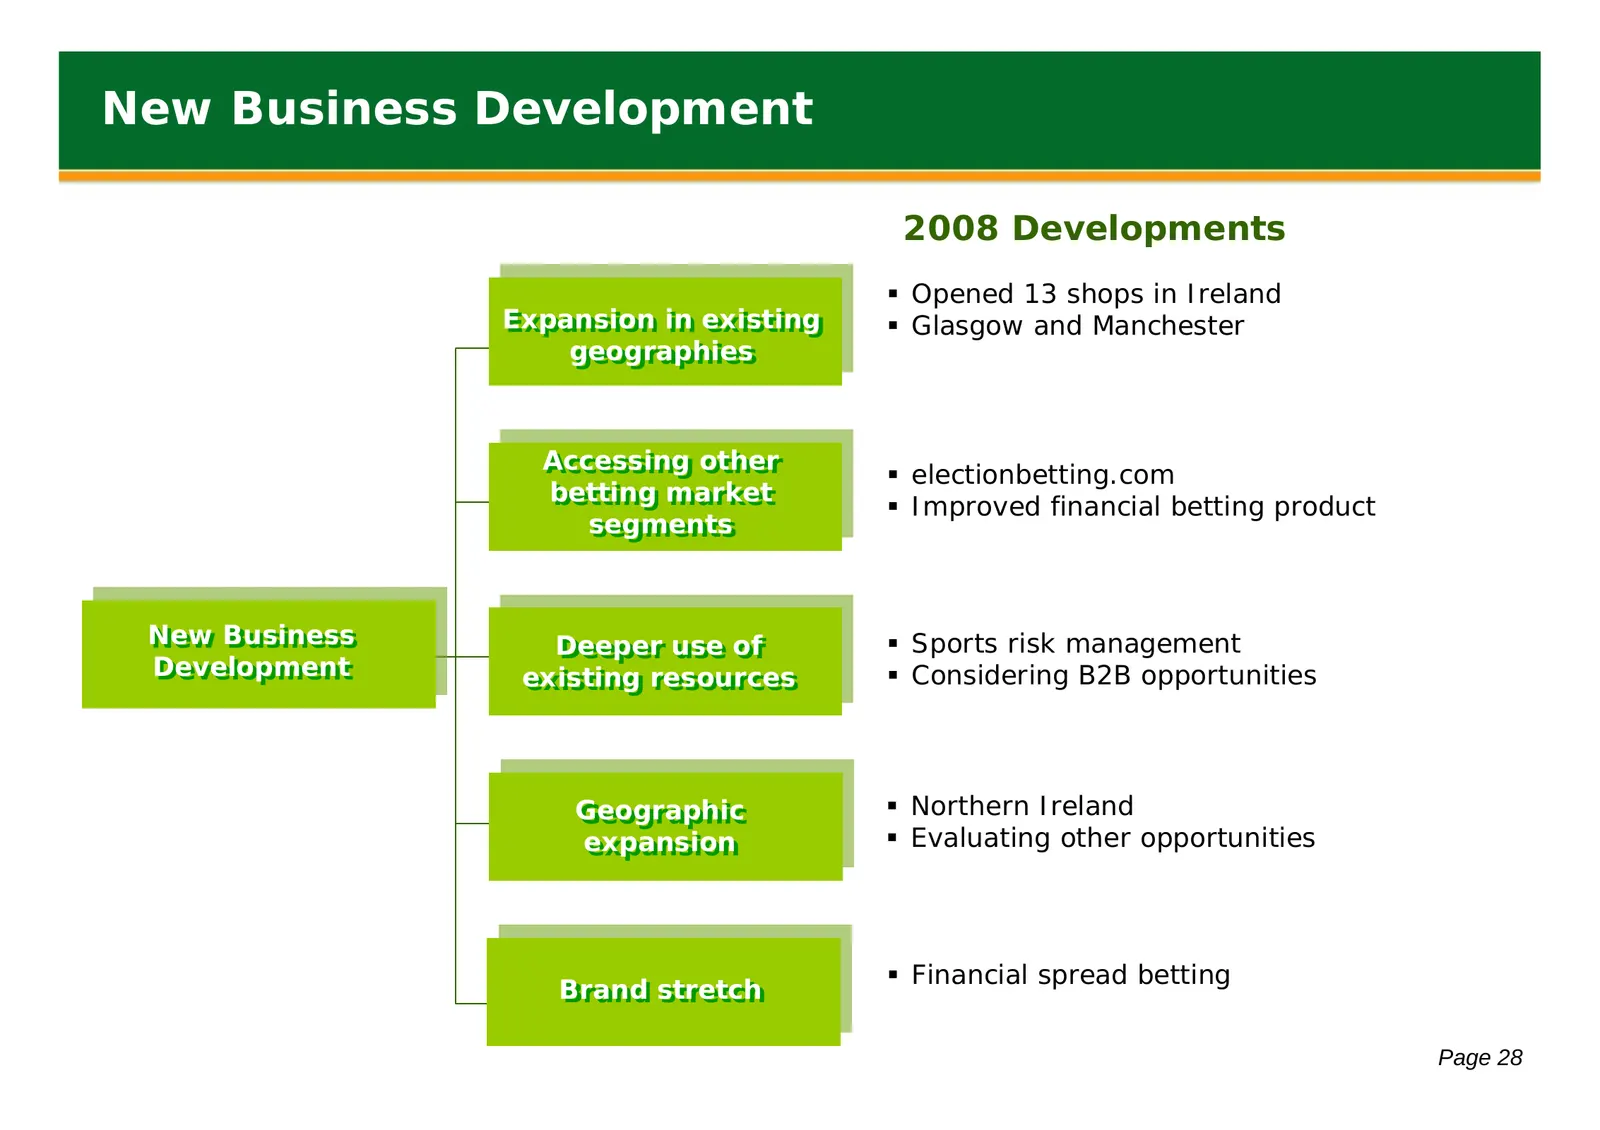
Slide 29: New Business Development
New Business Development 2008 Developments Opened 13 shops in Ireland Expansion Expansion in in existing existing Glasgow and Manchester geographies geographies Accessing Accessing other other electionbetting.com betting betting market market Improved financial betting product segments segme
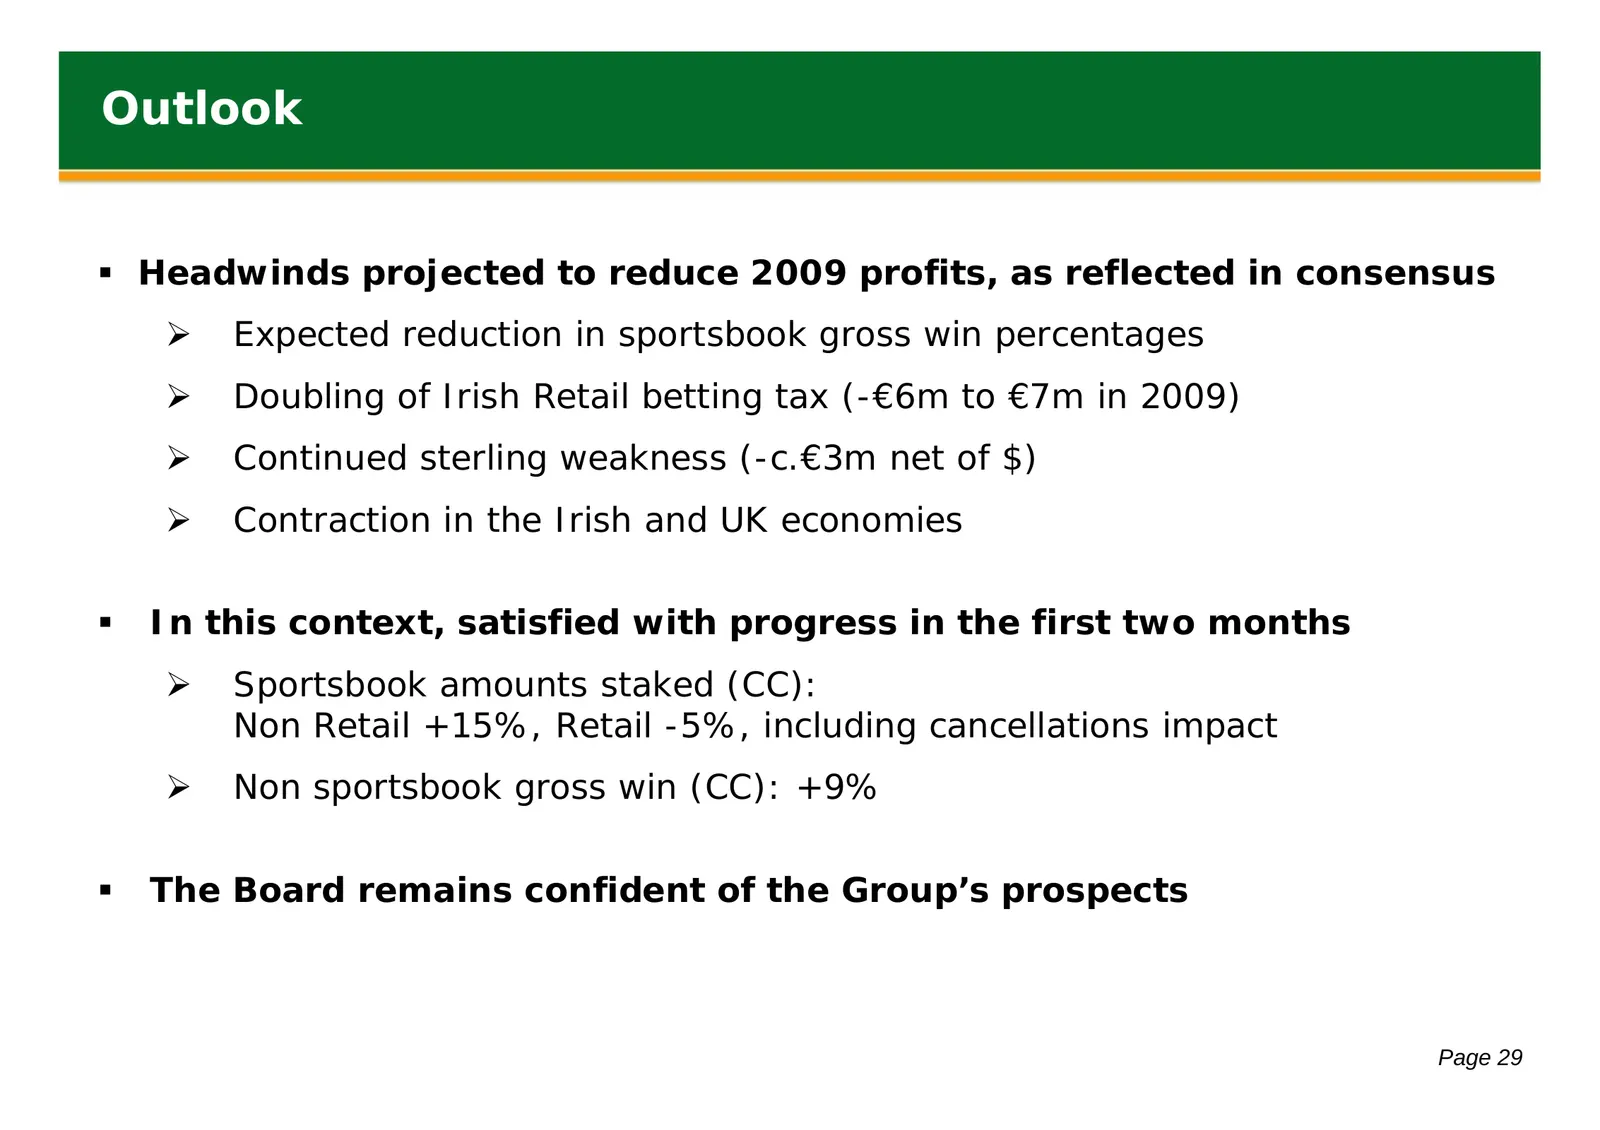
Slide 30: Outlook
Outlook Headwinds projected to reduce 2009 profits, as reflected in consensus ¾ Expected reduction in sportsbook gross win percentages ¾ Doubling of Irish Retail betting tax (-€6m to €7m in 2009) ¾ Continued sterling weakness (-c.€3m net of $) ¾ Contraction in the Irish and UK economies In this
Source: Internet Archive copy of flutter.com
More decks from Flutter Entertainment plc
 Q3 2026 Earnings Presentation15 slides · Nov 4, 2026
 Q2 2026 Earnings Presentation14 slides · Aug 5, 2026
 Investor Day (September 2024)152 slides · Sep 25, 2024
 Q2 2024 Earnings Presentation20 slides · Aug 13, 2024
 Q1 2024 Earnings Presentation20 slides · May 14, 2024
 FY2023 Earnings Presentation36 slides · Mar 26, 2024