Sembcorp Industries Ltd. · SGX:U96
Sembcorp Industries — H1 2014 Earnings Presentation
21 slides from Sembcorp Industries's earnings presentation, Aug 6, 2014
Slide 1: 1H2014 Results Announcement
1H2014 Results Announcement August 6, 2014 © Sembcorp Industries 2014 Scope of Presentation • CEO’s Report • Financial Review • Group Outlook © Sembcorp Industries 2014 2 1
Slide 2: CEO's Report: 1H2014 Performance Round-up
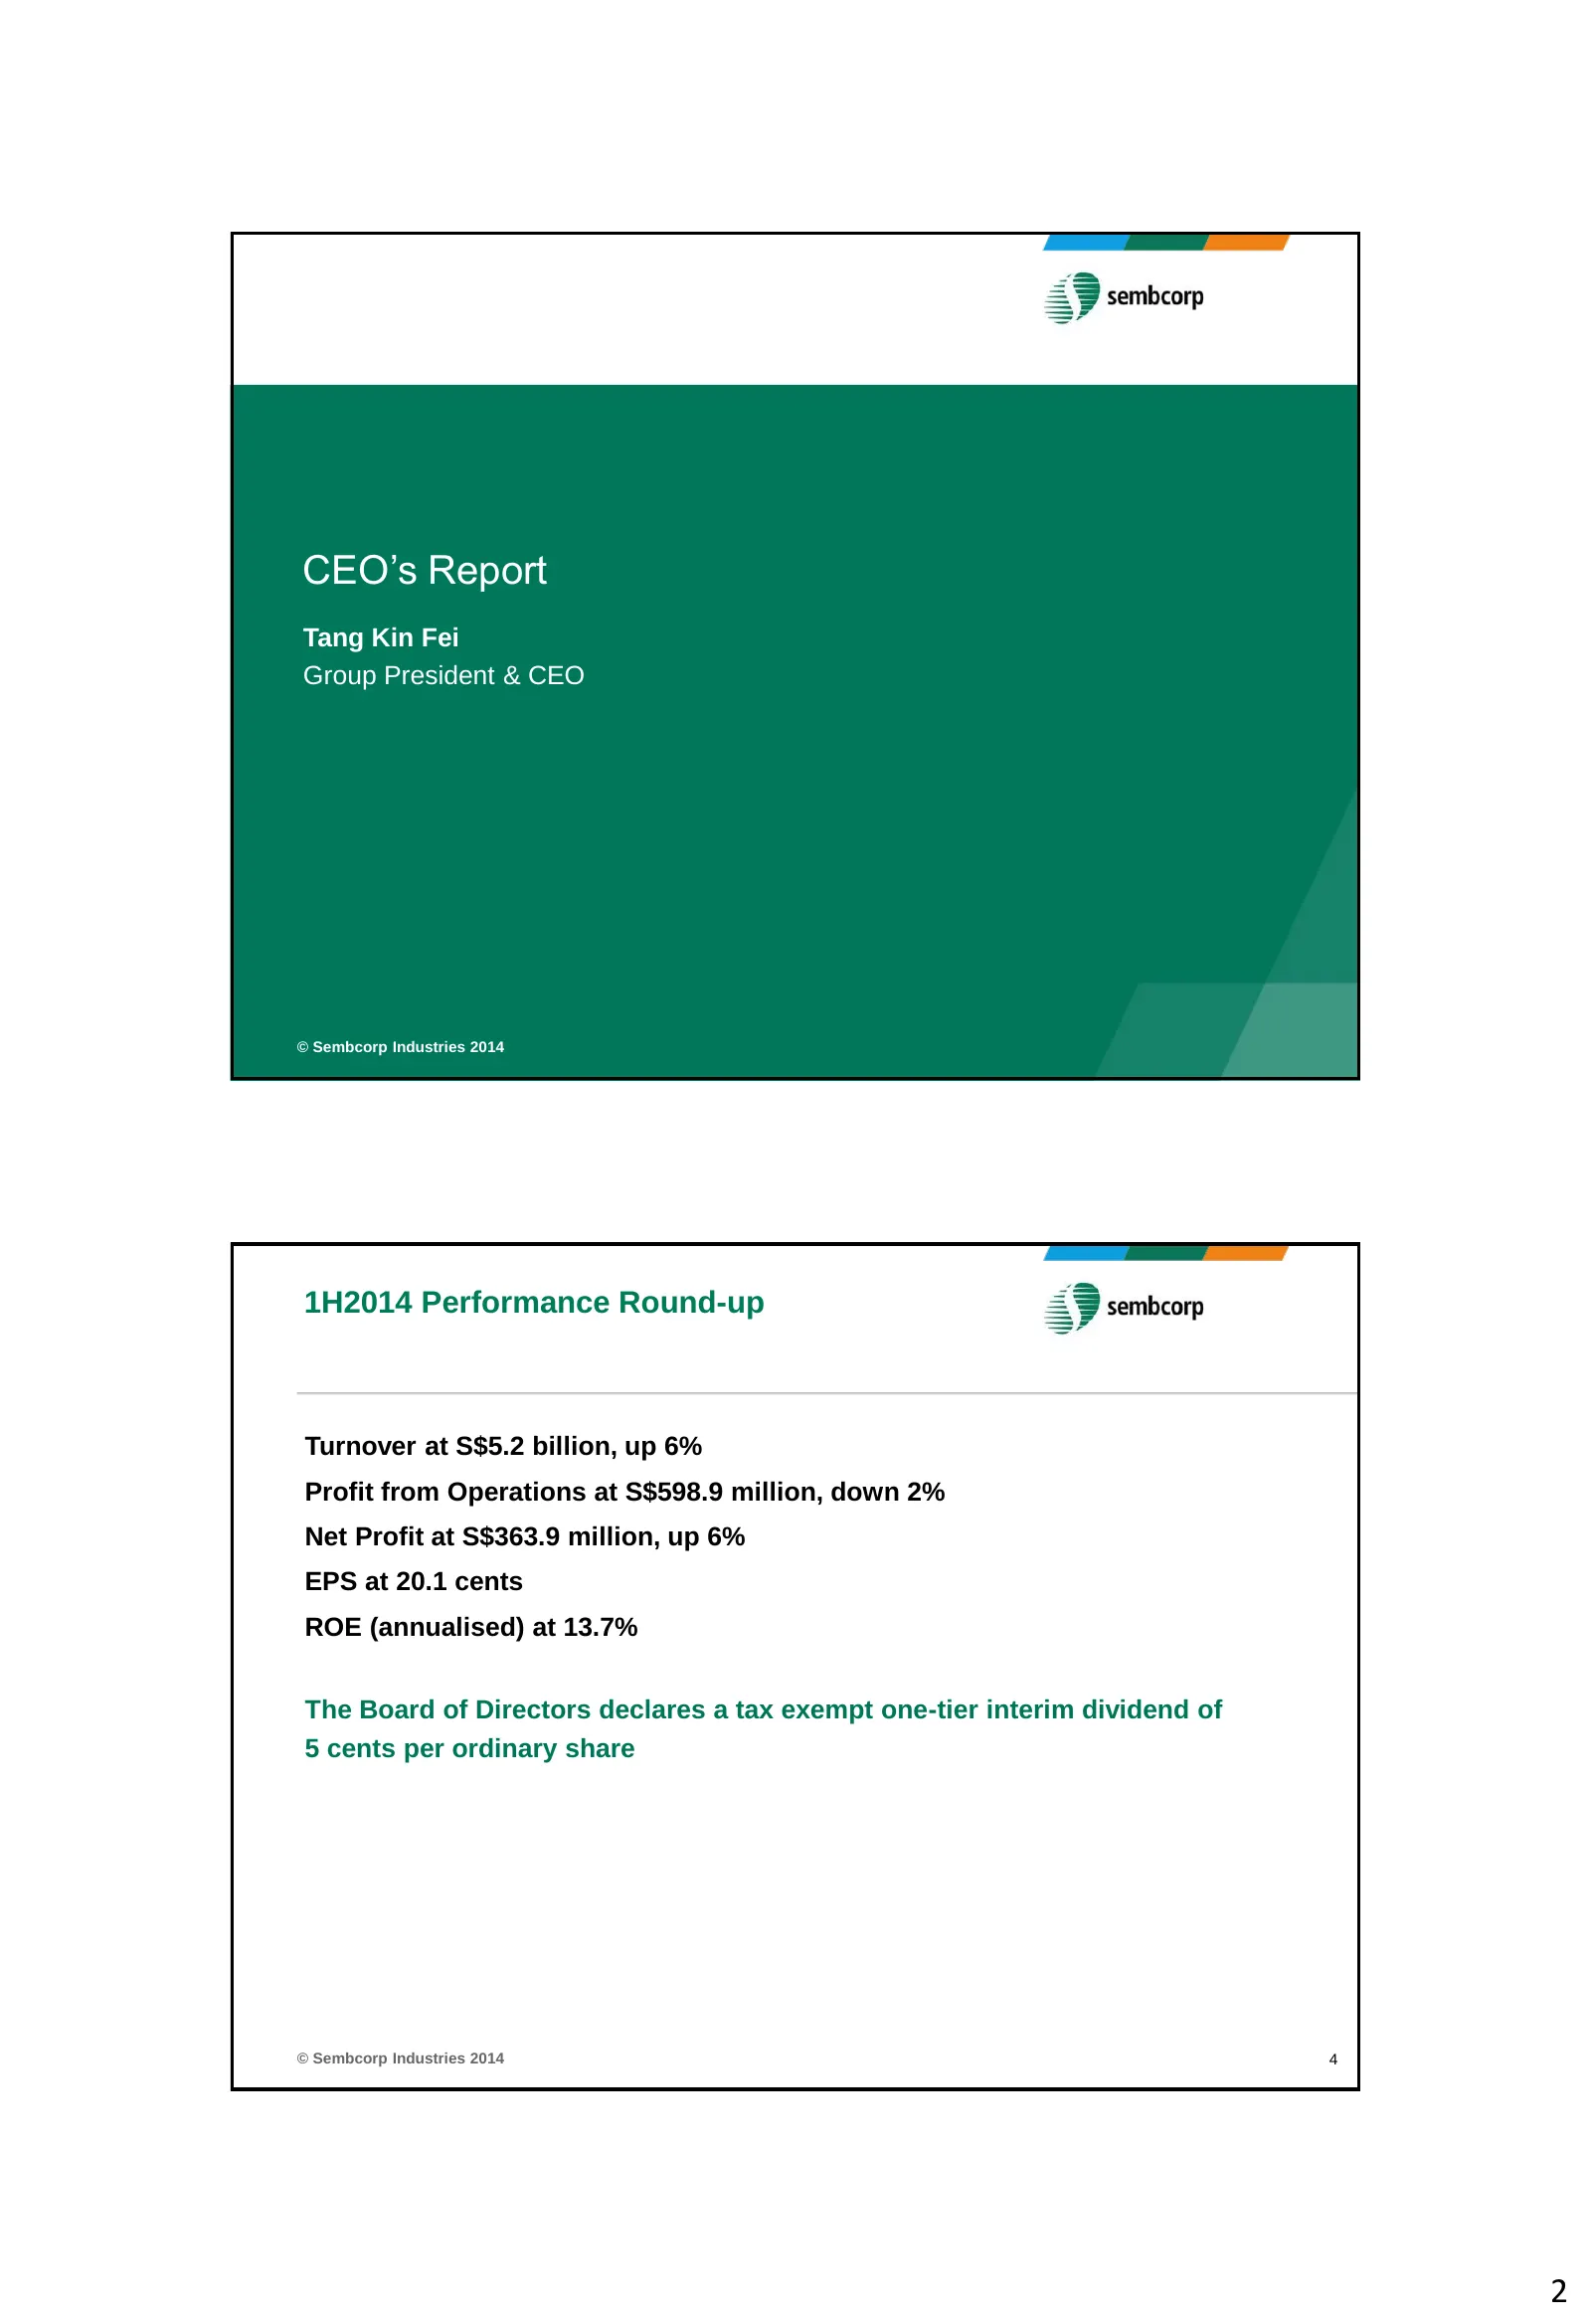
CEO’s Report Tang Kin Fei Group President & CEO © Sembcorp Industries 2014 1H2014 Performance Round-up Turnover at S$5.2 billion, up 6% Profit from Operations at S$598.9 million, down 2% Net Profit at S$363.9 million, up 6% EPS at 20.1 cents ROE (annualised) at 13.7% The Board of Directors declares
Slide 3: Group Net Profit Mix
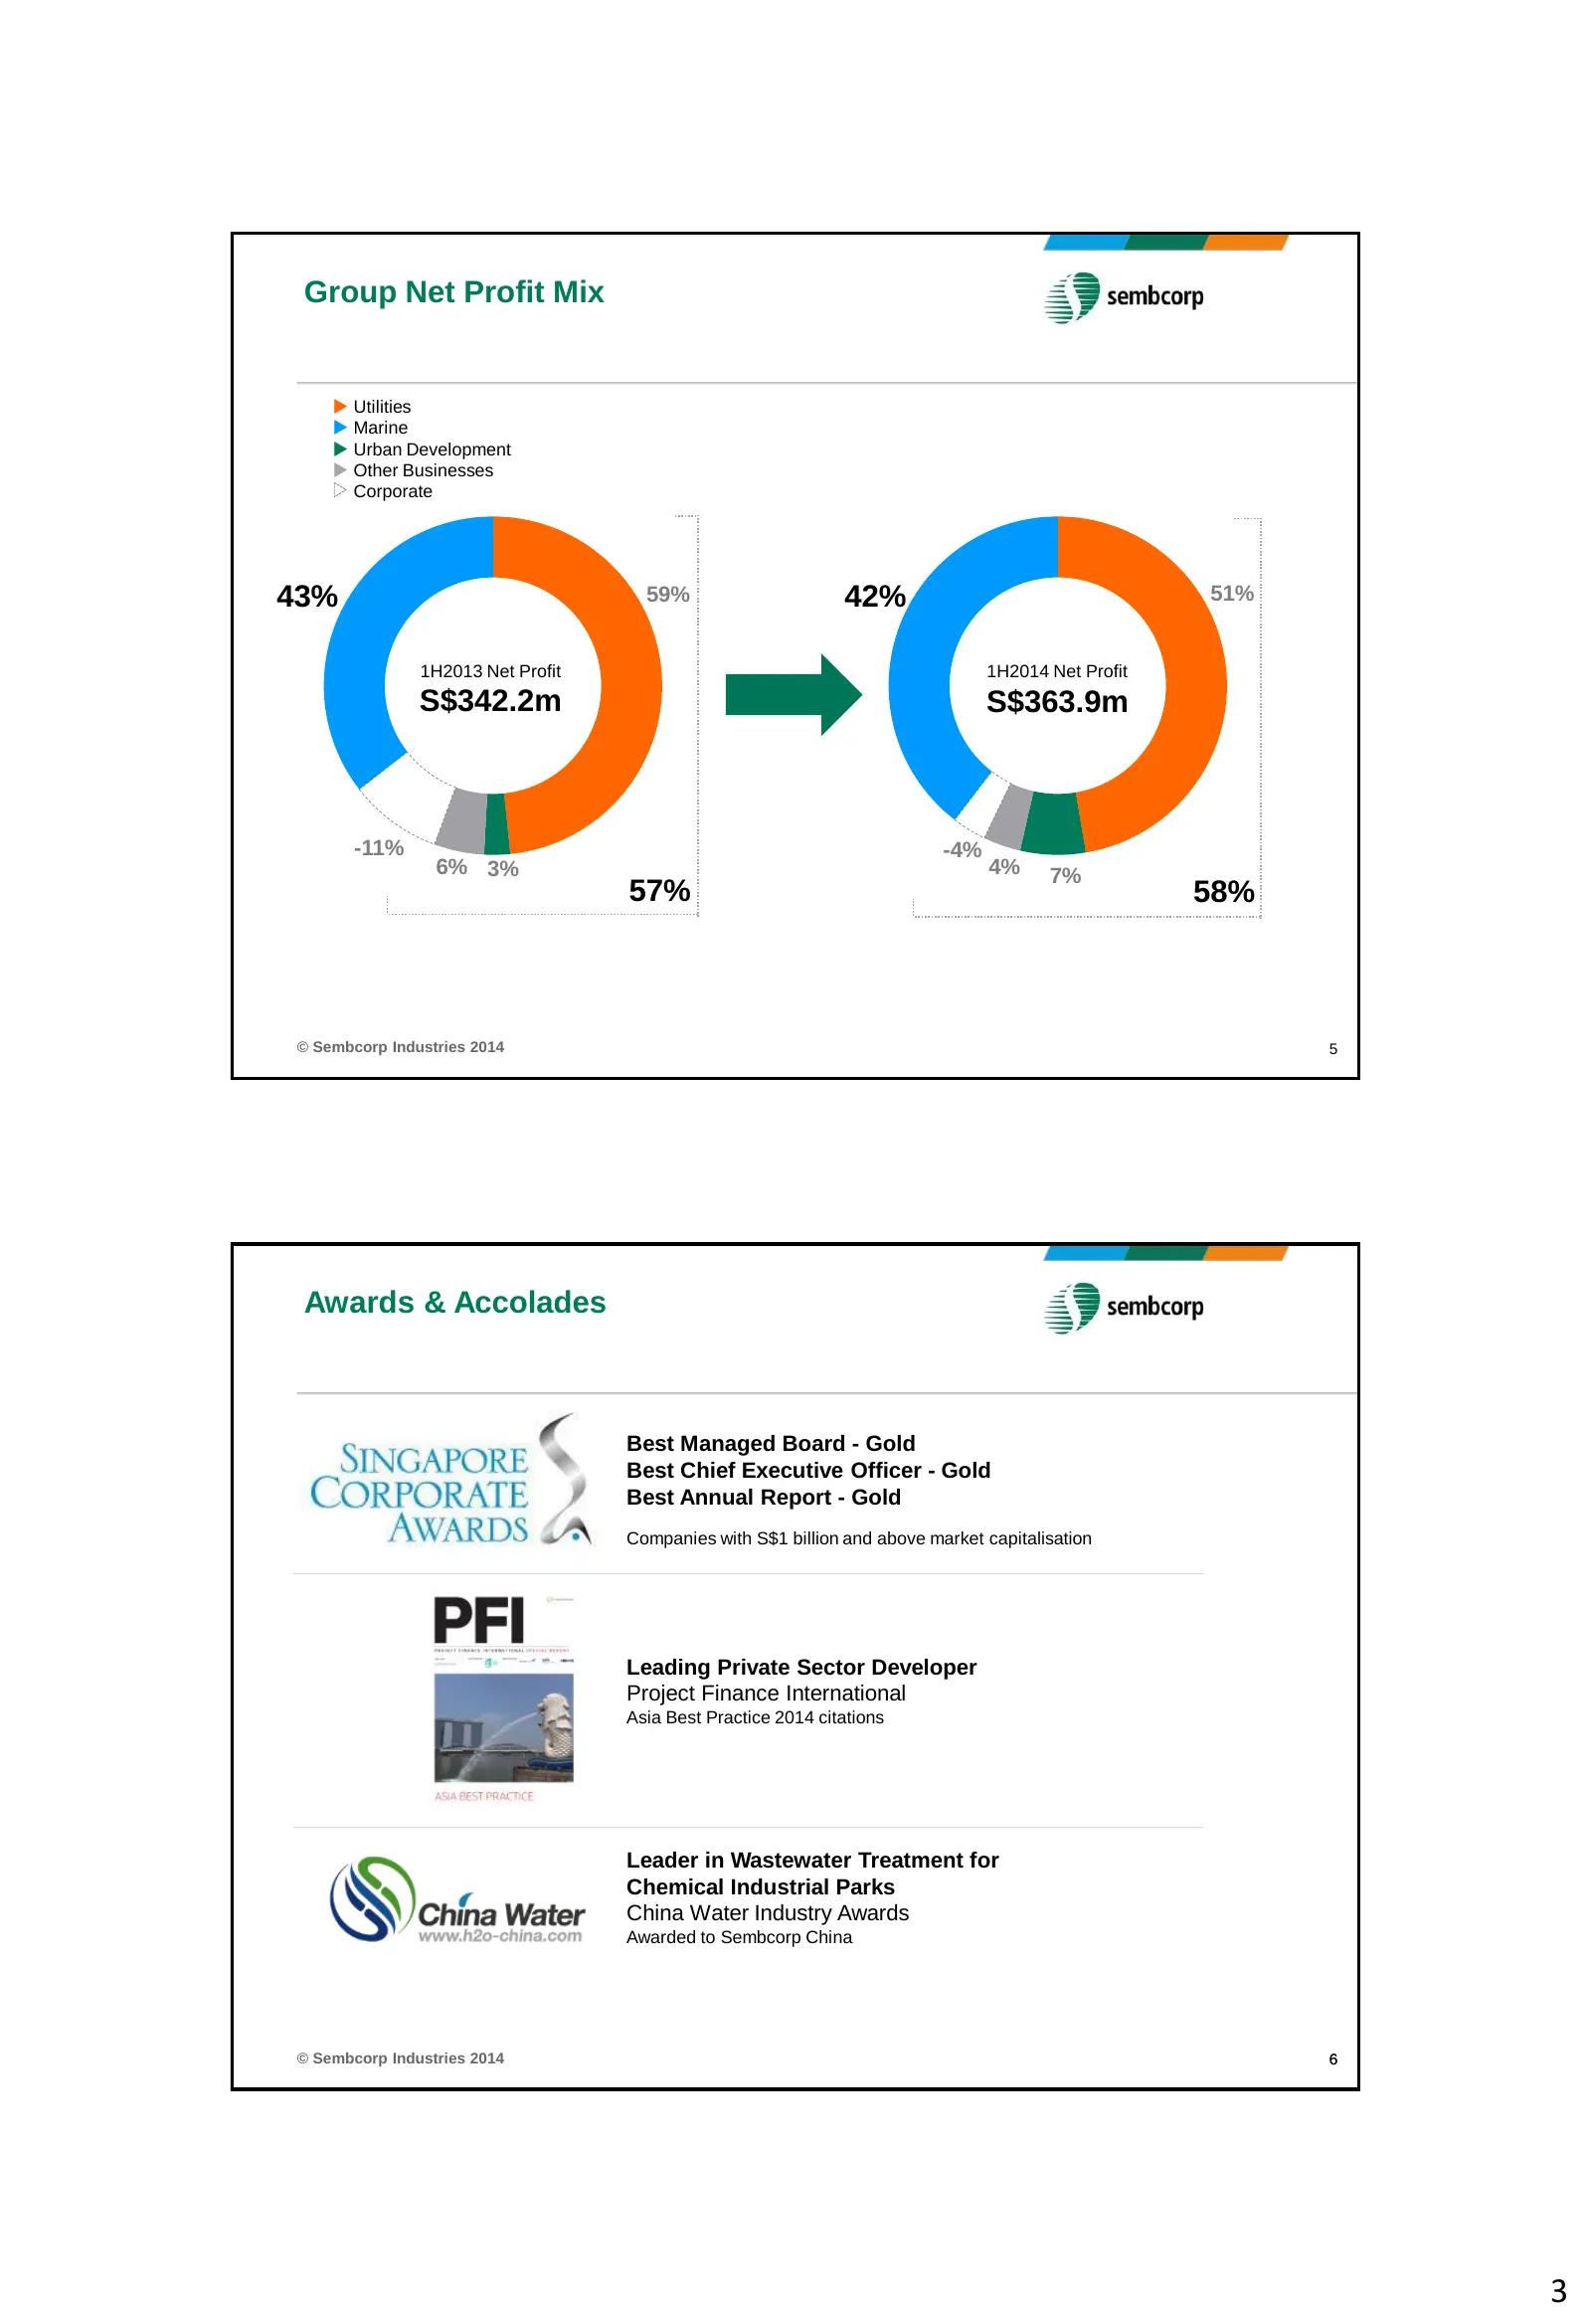
Group Net Profit Mix Utilities Marine Urban Development Other Businesses Corporate 43% 59% 42% 51% 1H2013 Net Profit 1H2014 Net Profit S$342.2m S$363.9m -11% -4% 6% 3% 4% 7% 57% 58% © Sembcorp Industries 2014 5 Awards & Accolades Best Managed Board - Gold Best Chief Executive Officer - Gol
Slide 4: Utilities
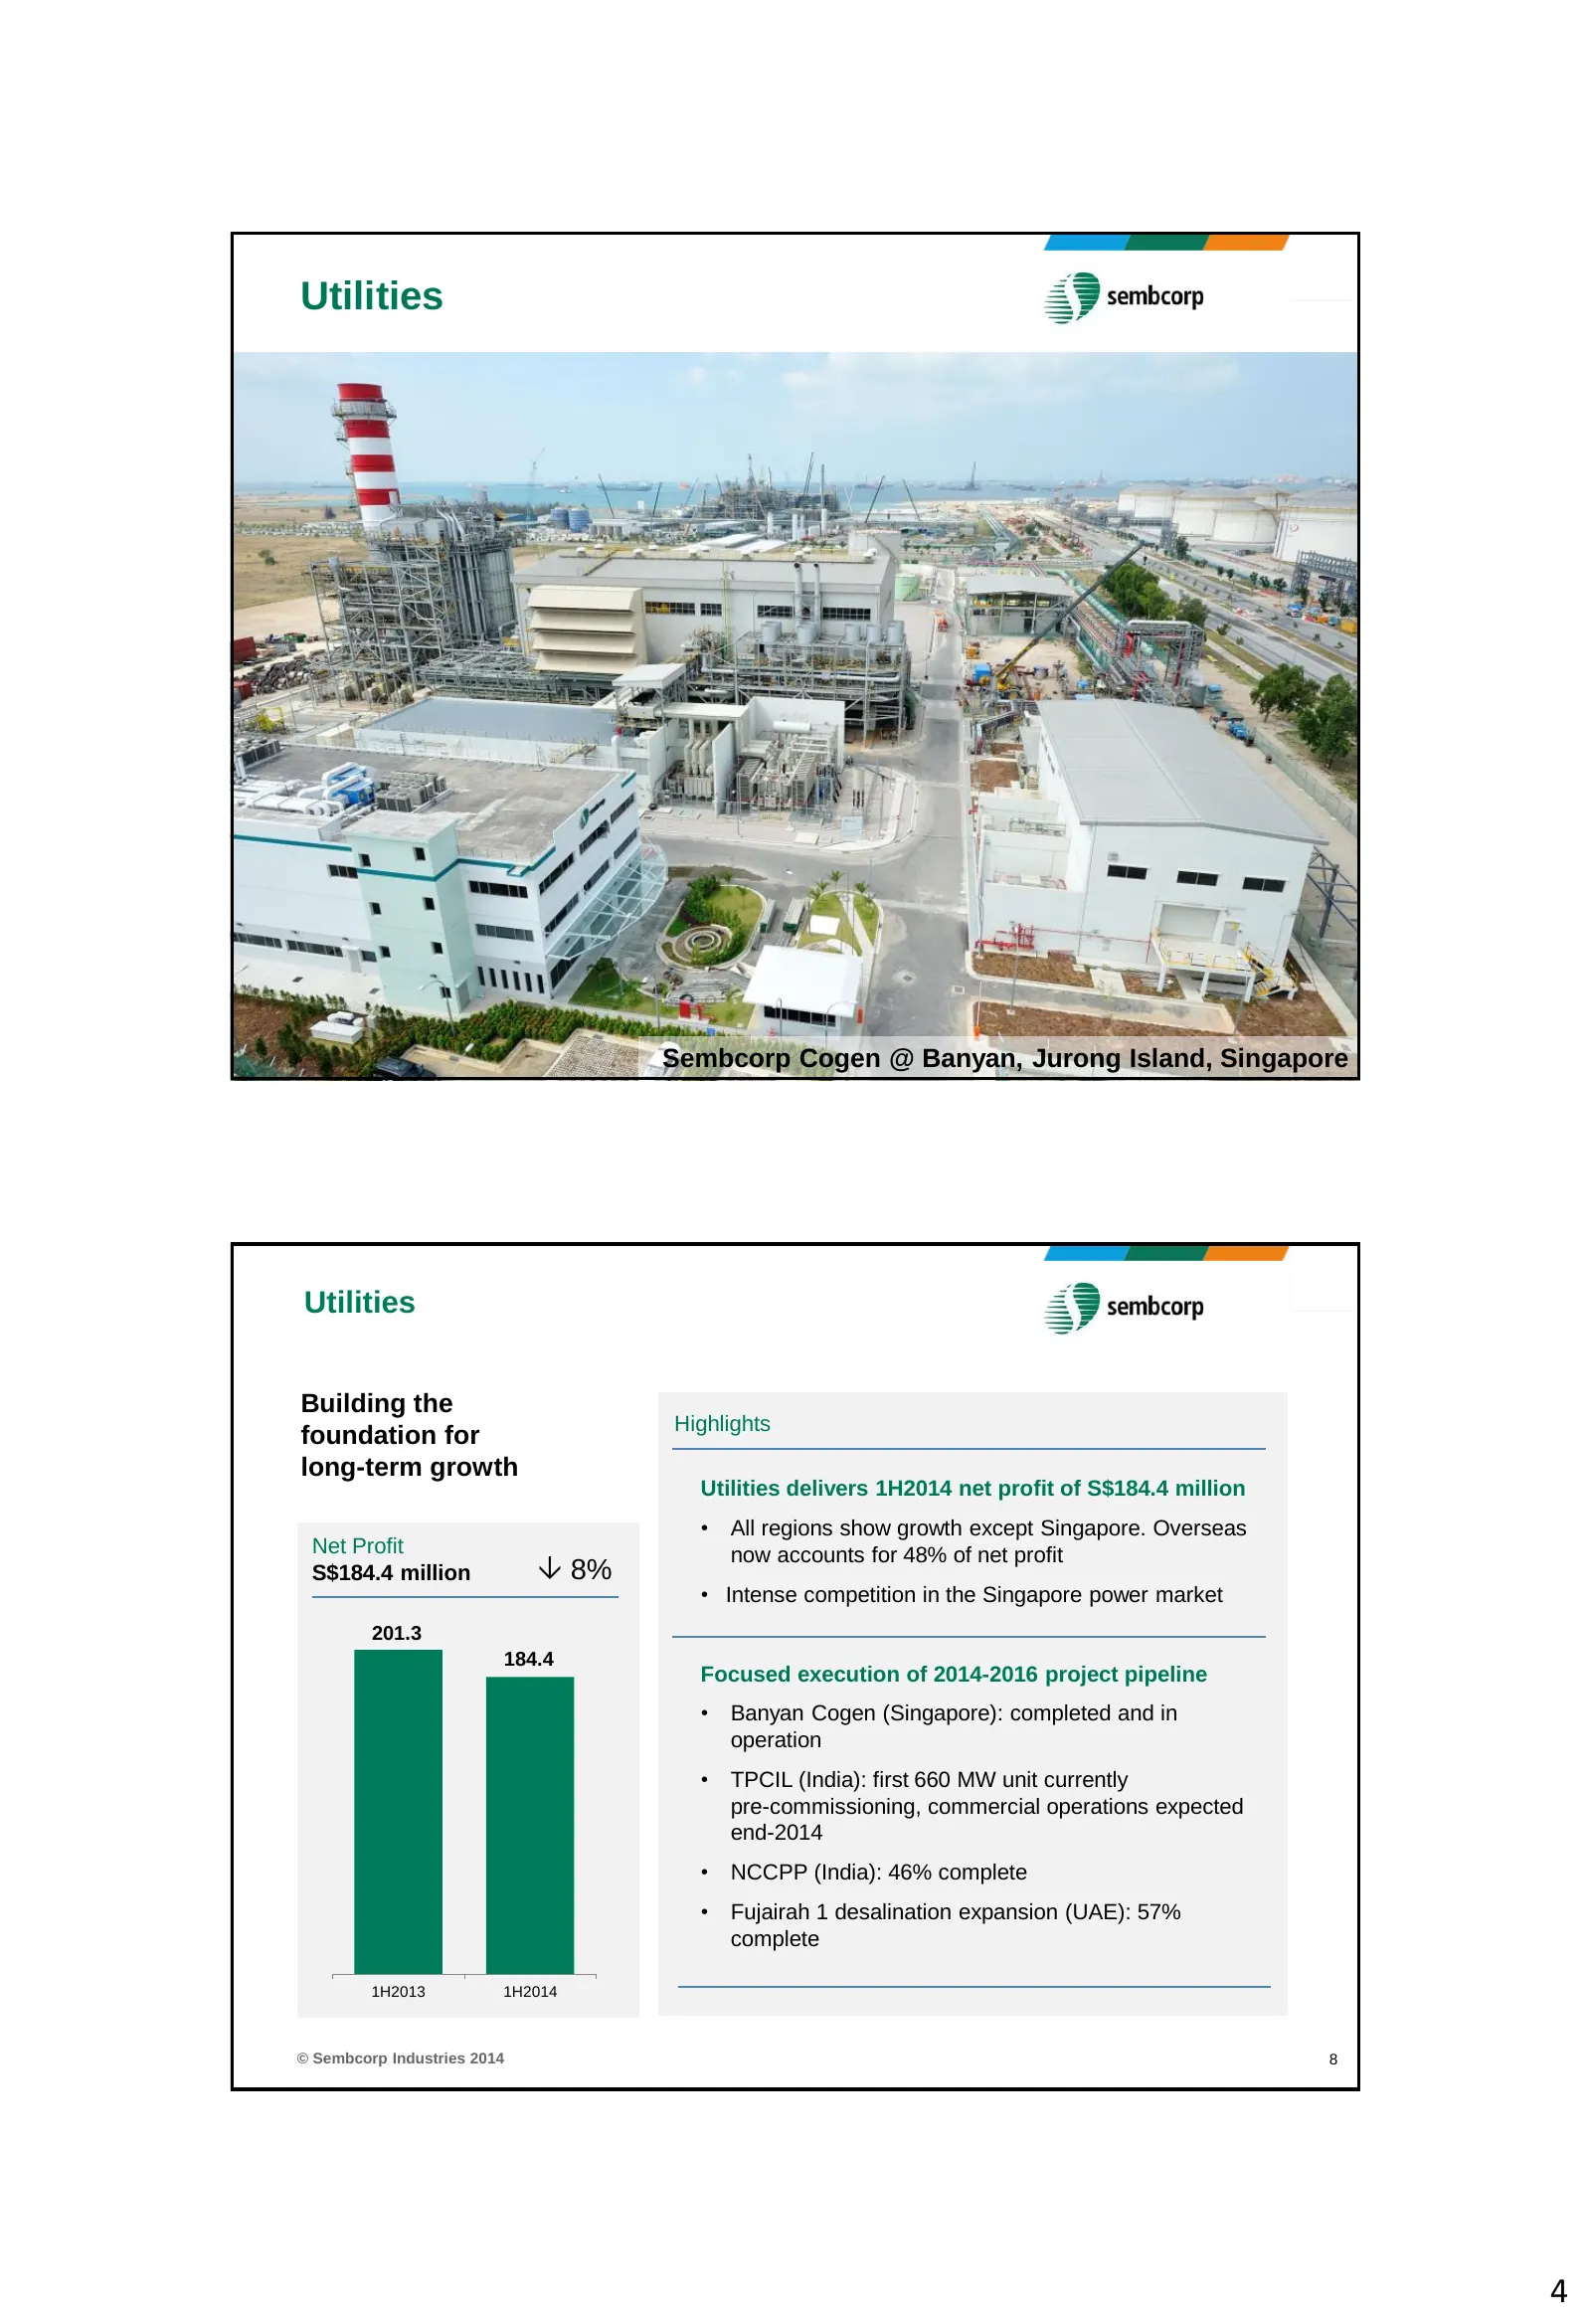
Utilities © Sembcorp Industries 2014 7 Sembcorp Cogen @ Banyan, Jurong Island, Singapore Utilities Building the Highlights foundation for long-term growth Utilities delivers 1H2014 net profit of S$184.4 million • All regions show growth except Singapore. Overseas Net Profit now accounts for 48% of n
Slide 5: Utilities: Solid Pipeline of Projects
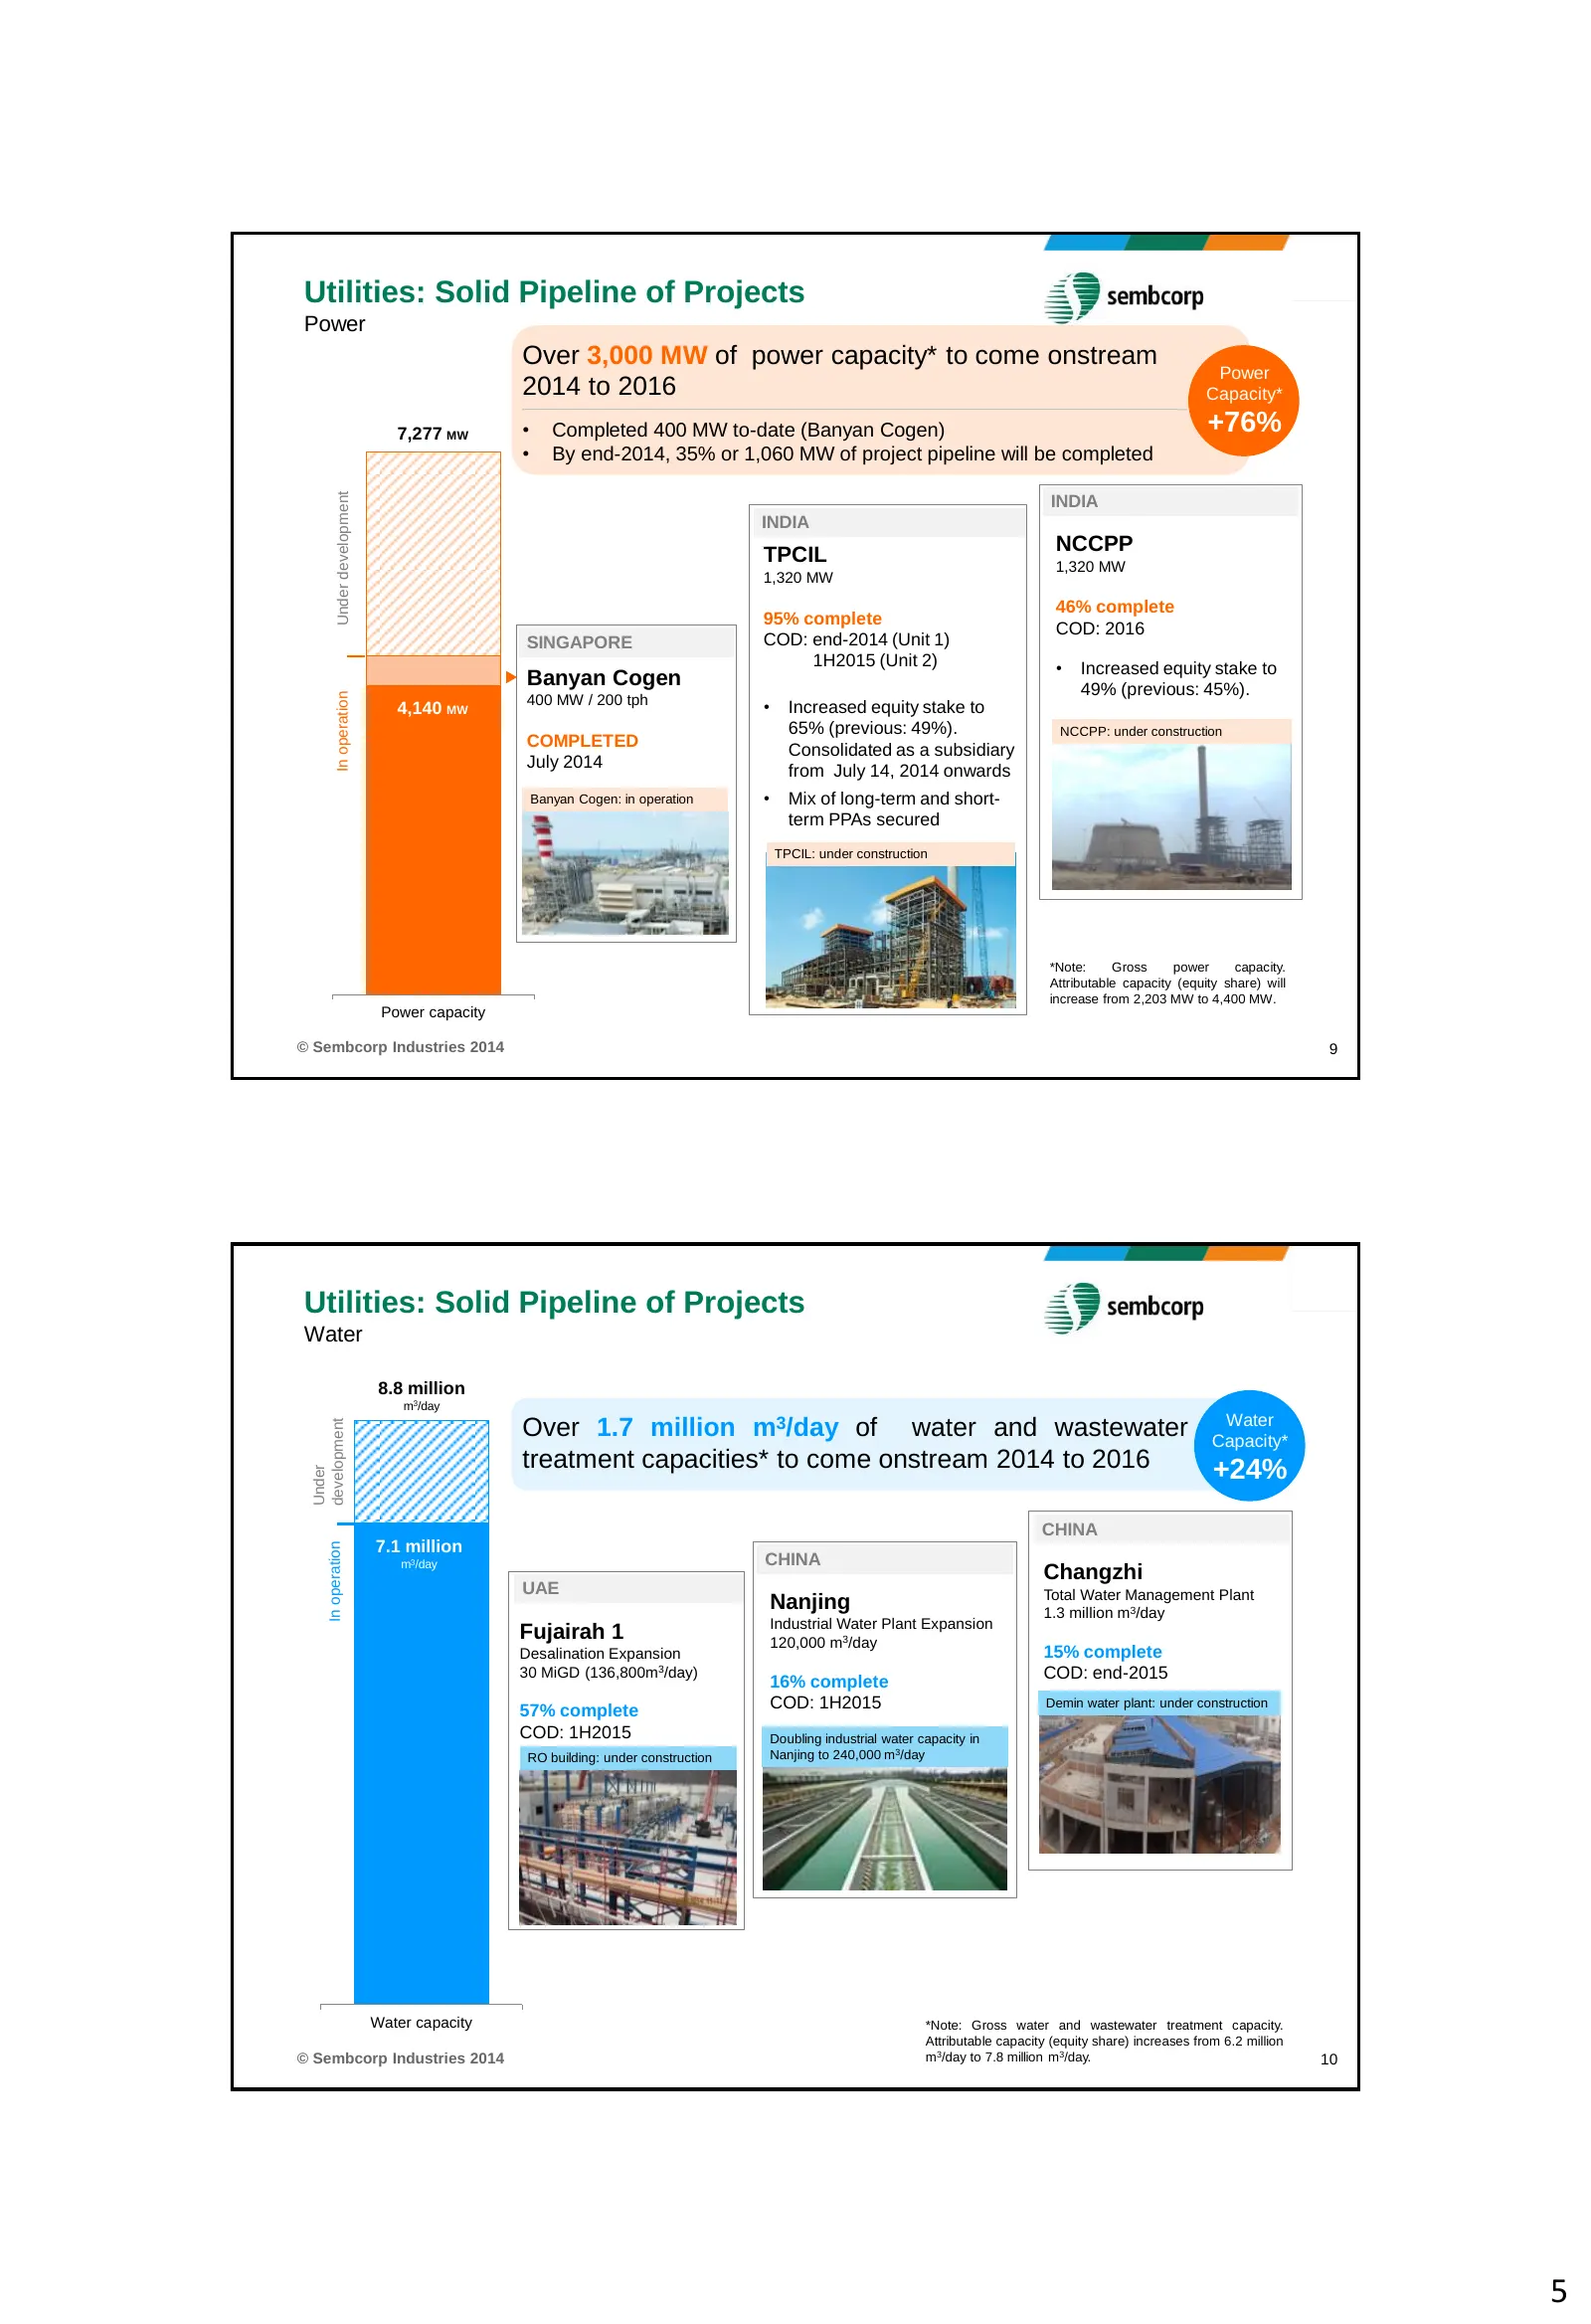
Utilities: Solid Pipeline of Projects Power Over 3,000 MW of power capacity* to come onstream Power 2014 to 2016 Capacity* 7,277 MW • Completed 400 MW to-date (Banyan Cogen) +76% • By end-2014, 35% or 1,060 MW of project pipeline will be completed Under development INDIA INDIA NCCPP TPCIL 1,320 MW 1
Slide 6: Marine
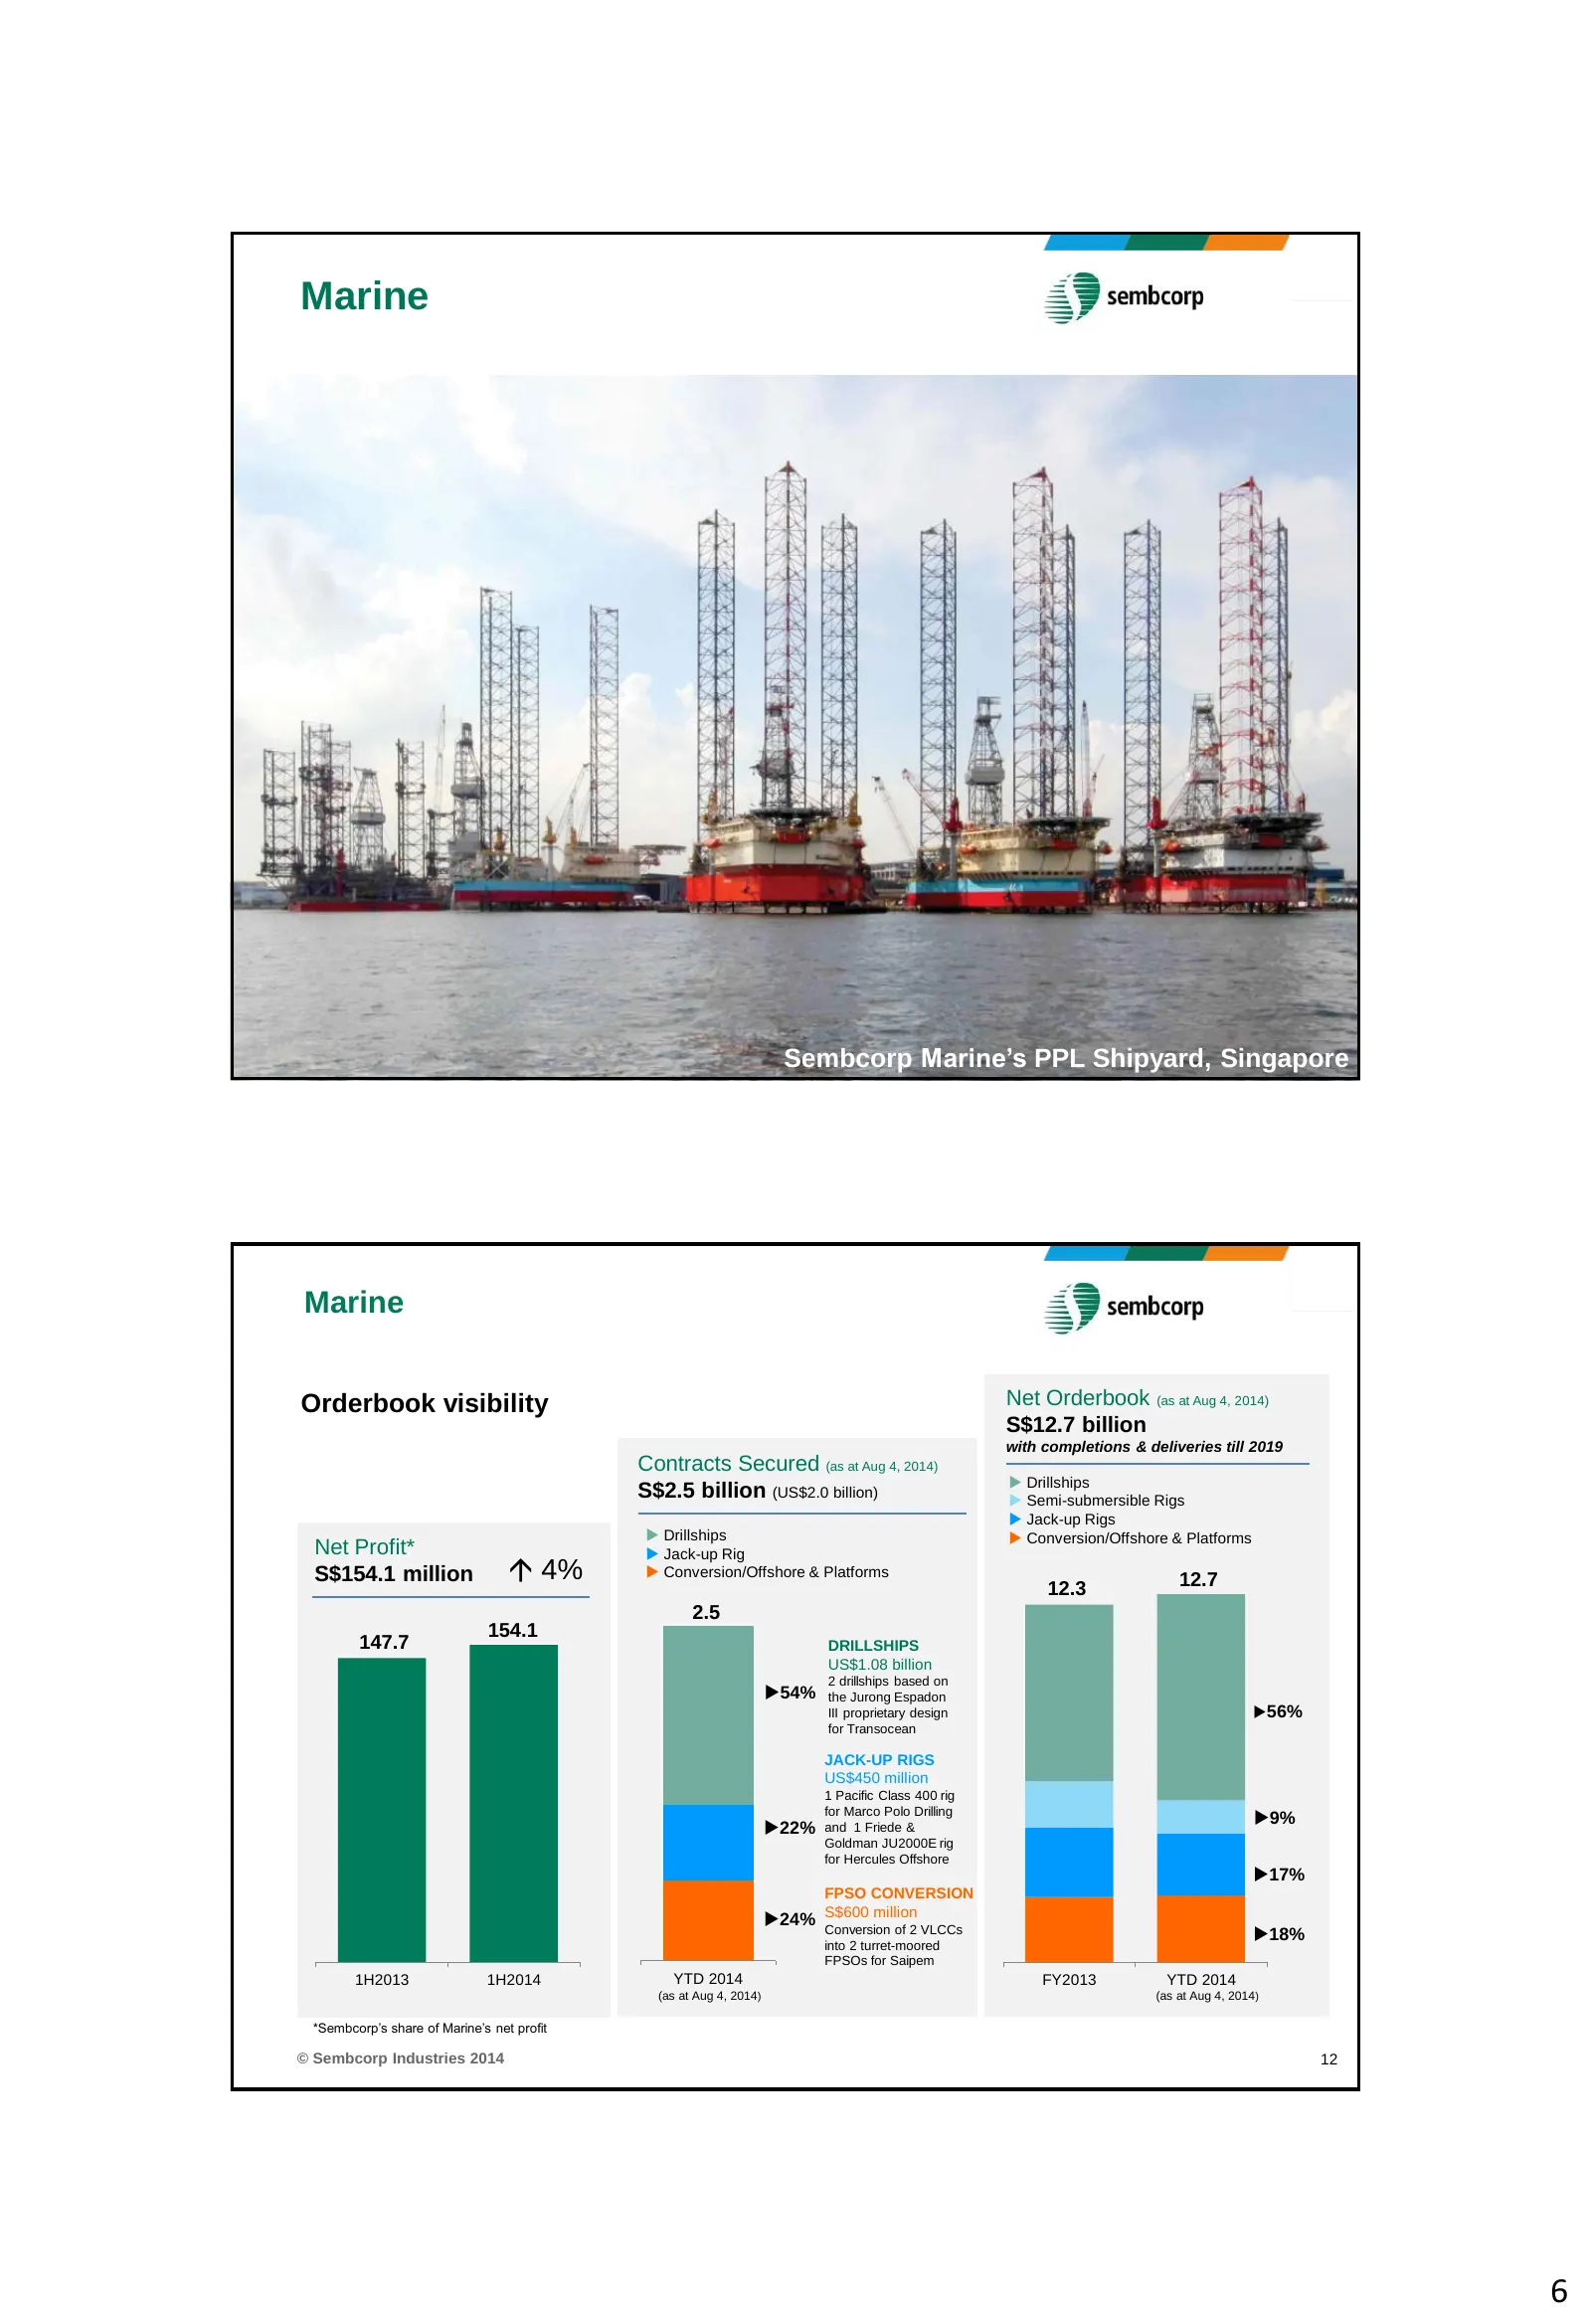
Marine © Sembcorp Industries 2014 11 Sembcorp Marine’s PPL Shipyard, Singapore Marine Orderbook visibility Net Orderbook (as at Aug 4, 2014) S$12.7 billion with completions & deliveries till 2019 Contracts Secured (as at Aug 4, 2014) Drillships S$2.5 billion (US$2.0 billion) Semi-submersible Rig
Slide 7: Urban Development
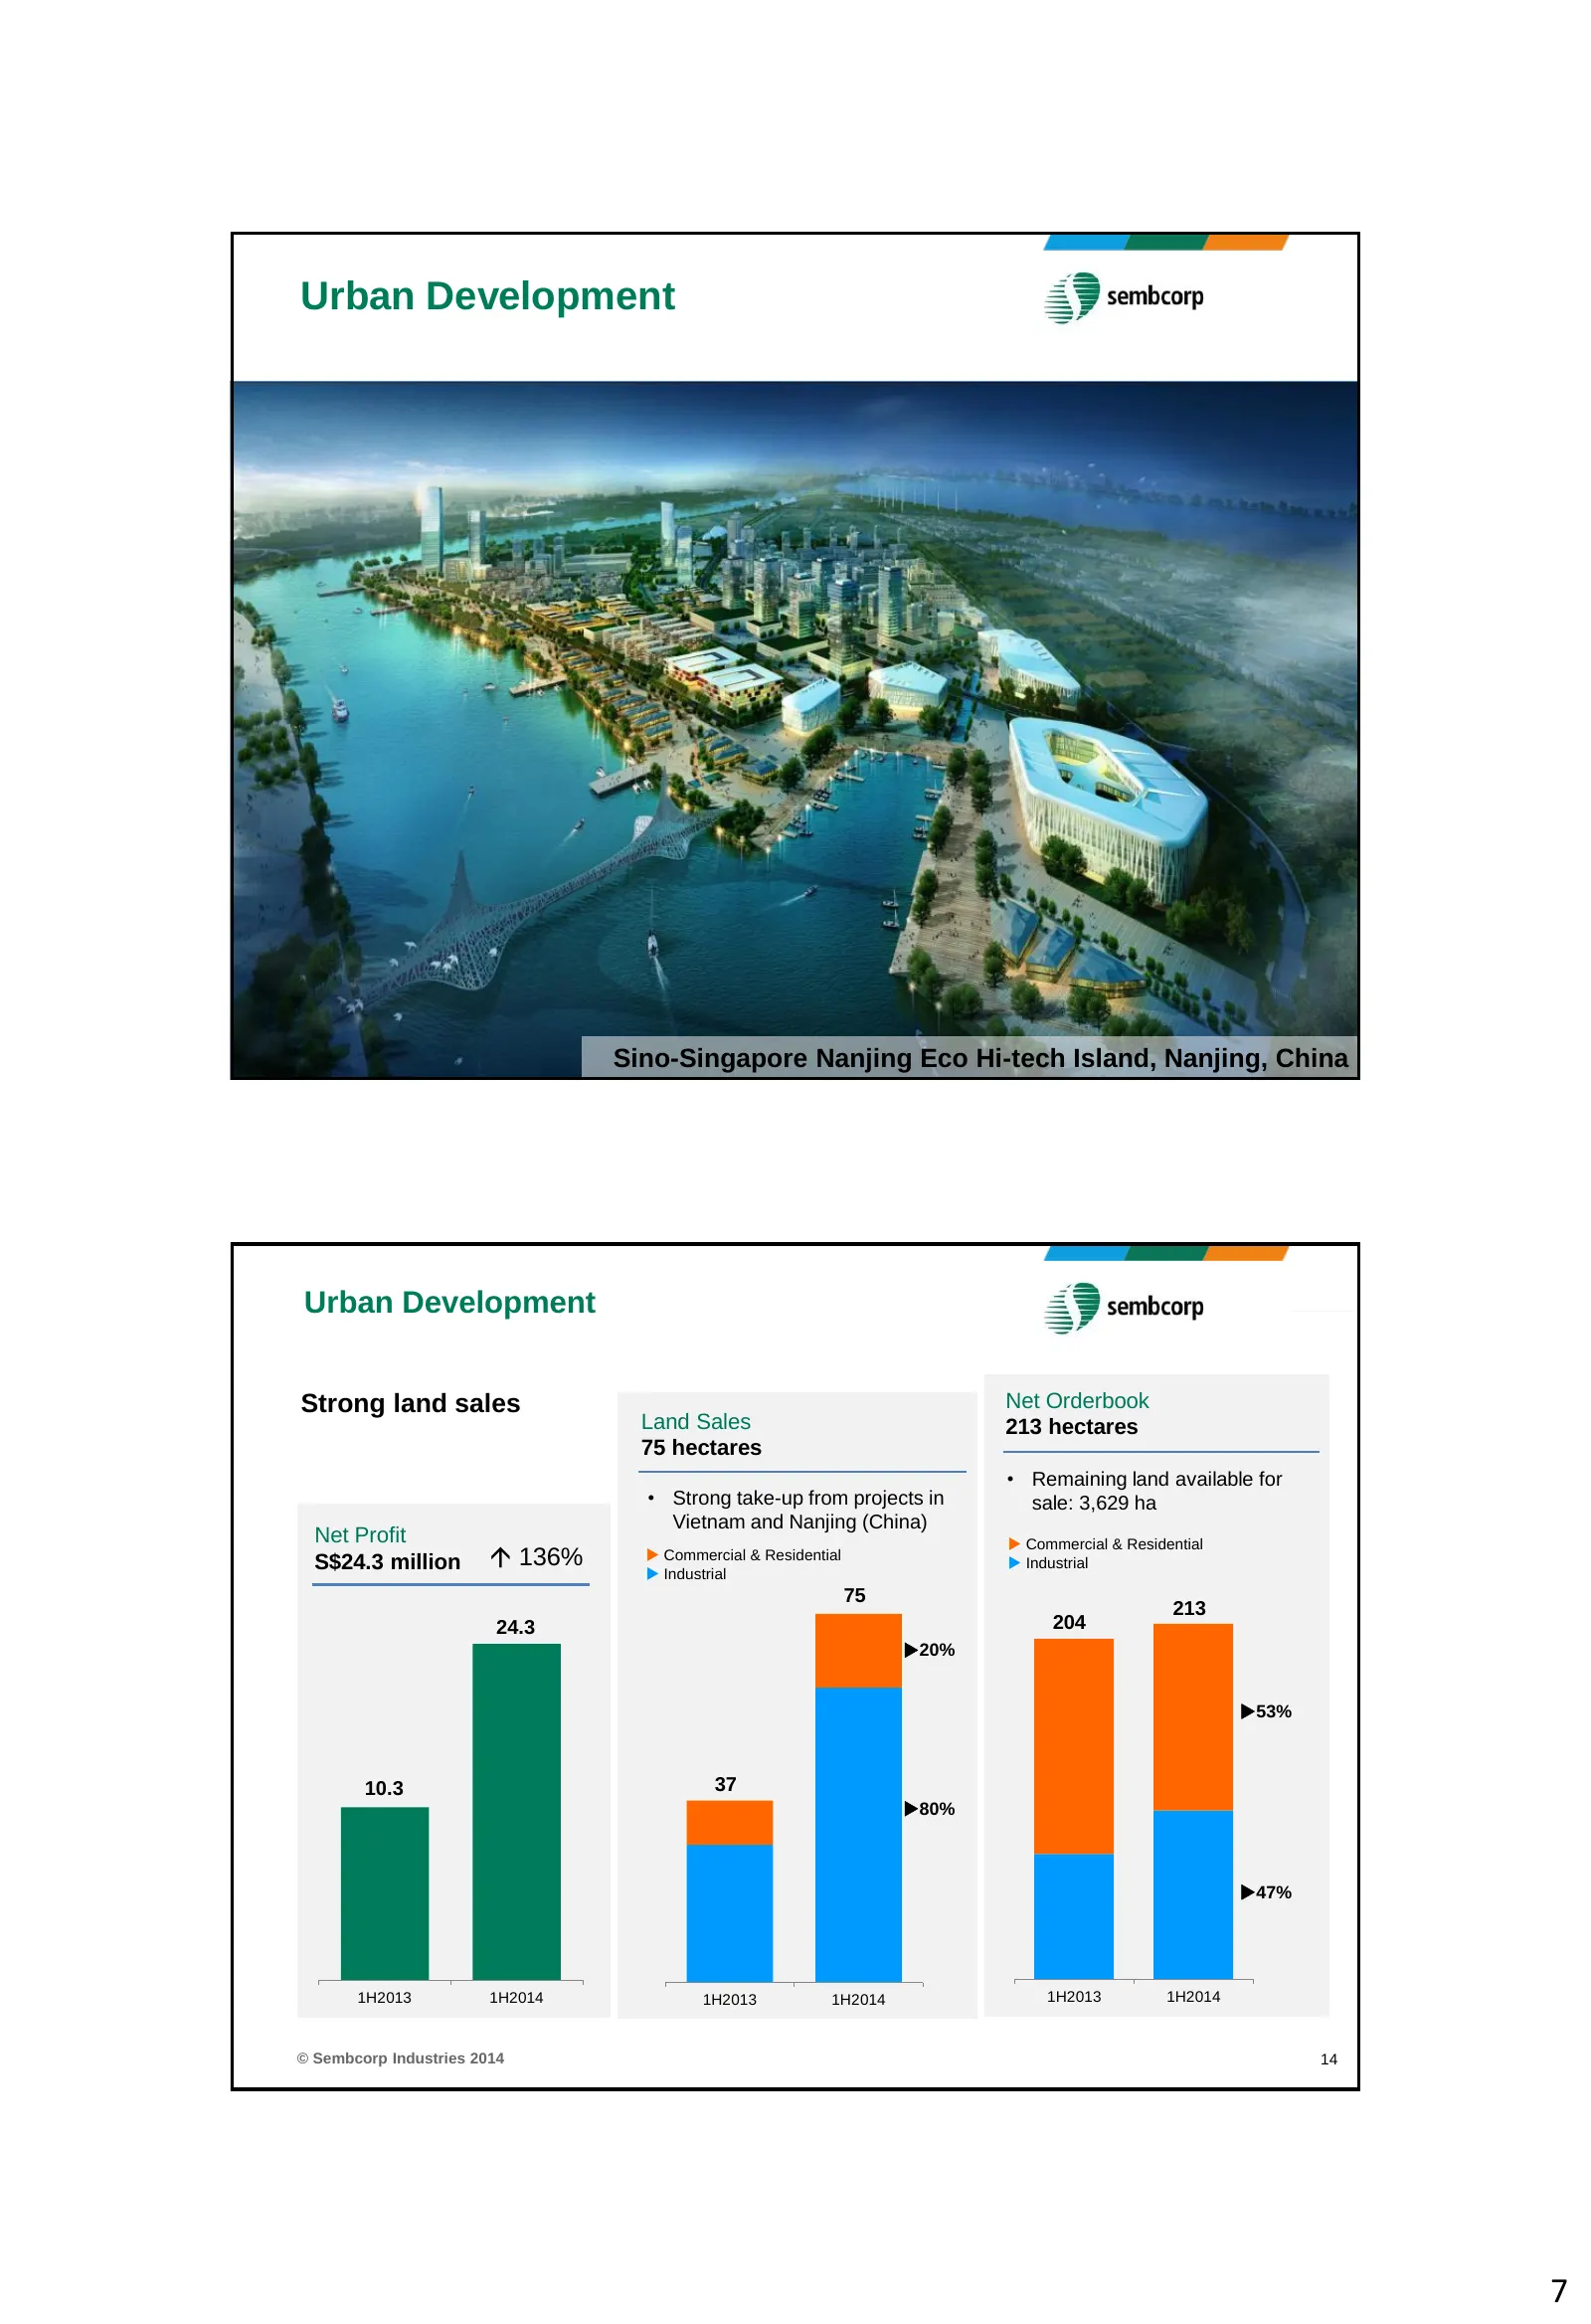
Urban Development © Sembcorp Industries 2014 13 VSIP Sino-Singapore Hai Phong Integrated Township Nanjing & Industrial Eco Hi-tech Park, Vietnam Island, Nanjing, China Urban Development Strong land sales Net Orderbook Land Sales 213 hectares 75 hectares • Remaining land available for • Strong take-u
Slide 8: Urban Development: Commencing Land Sales from New Projects
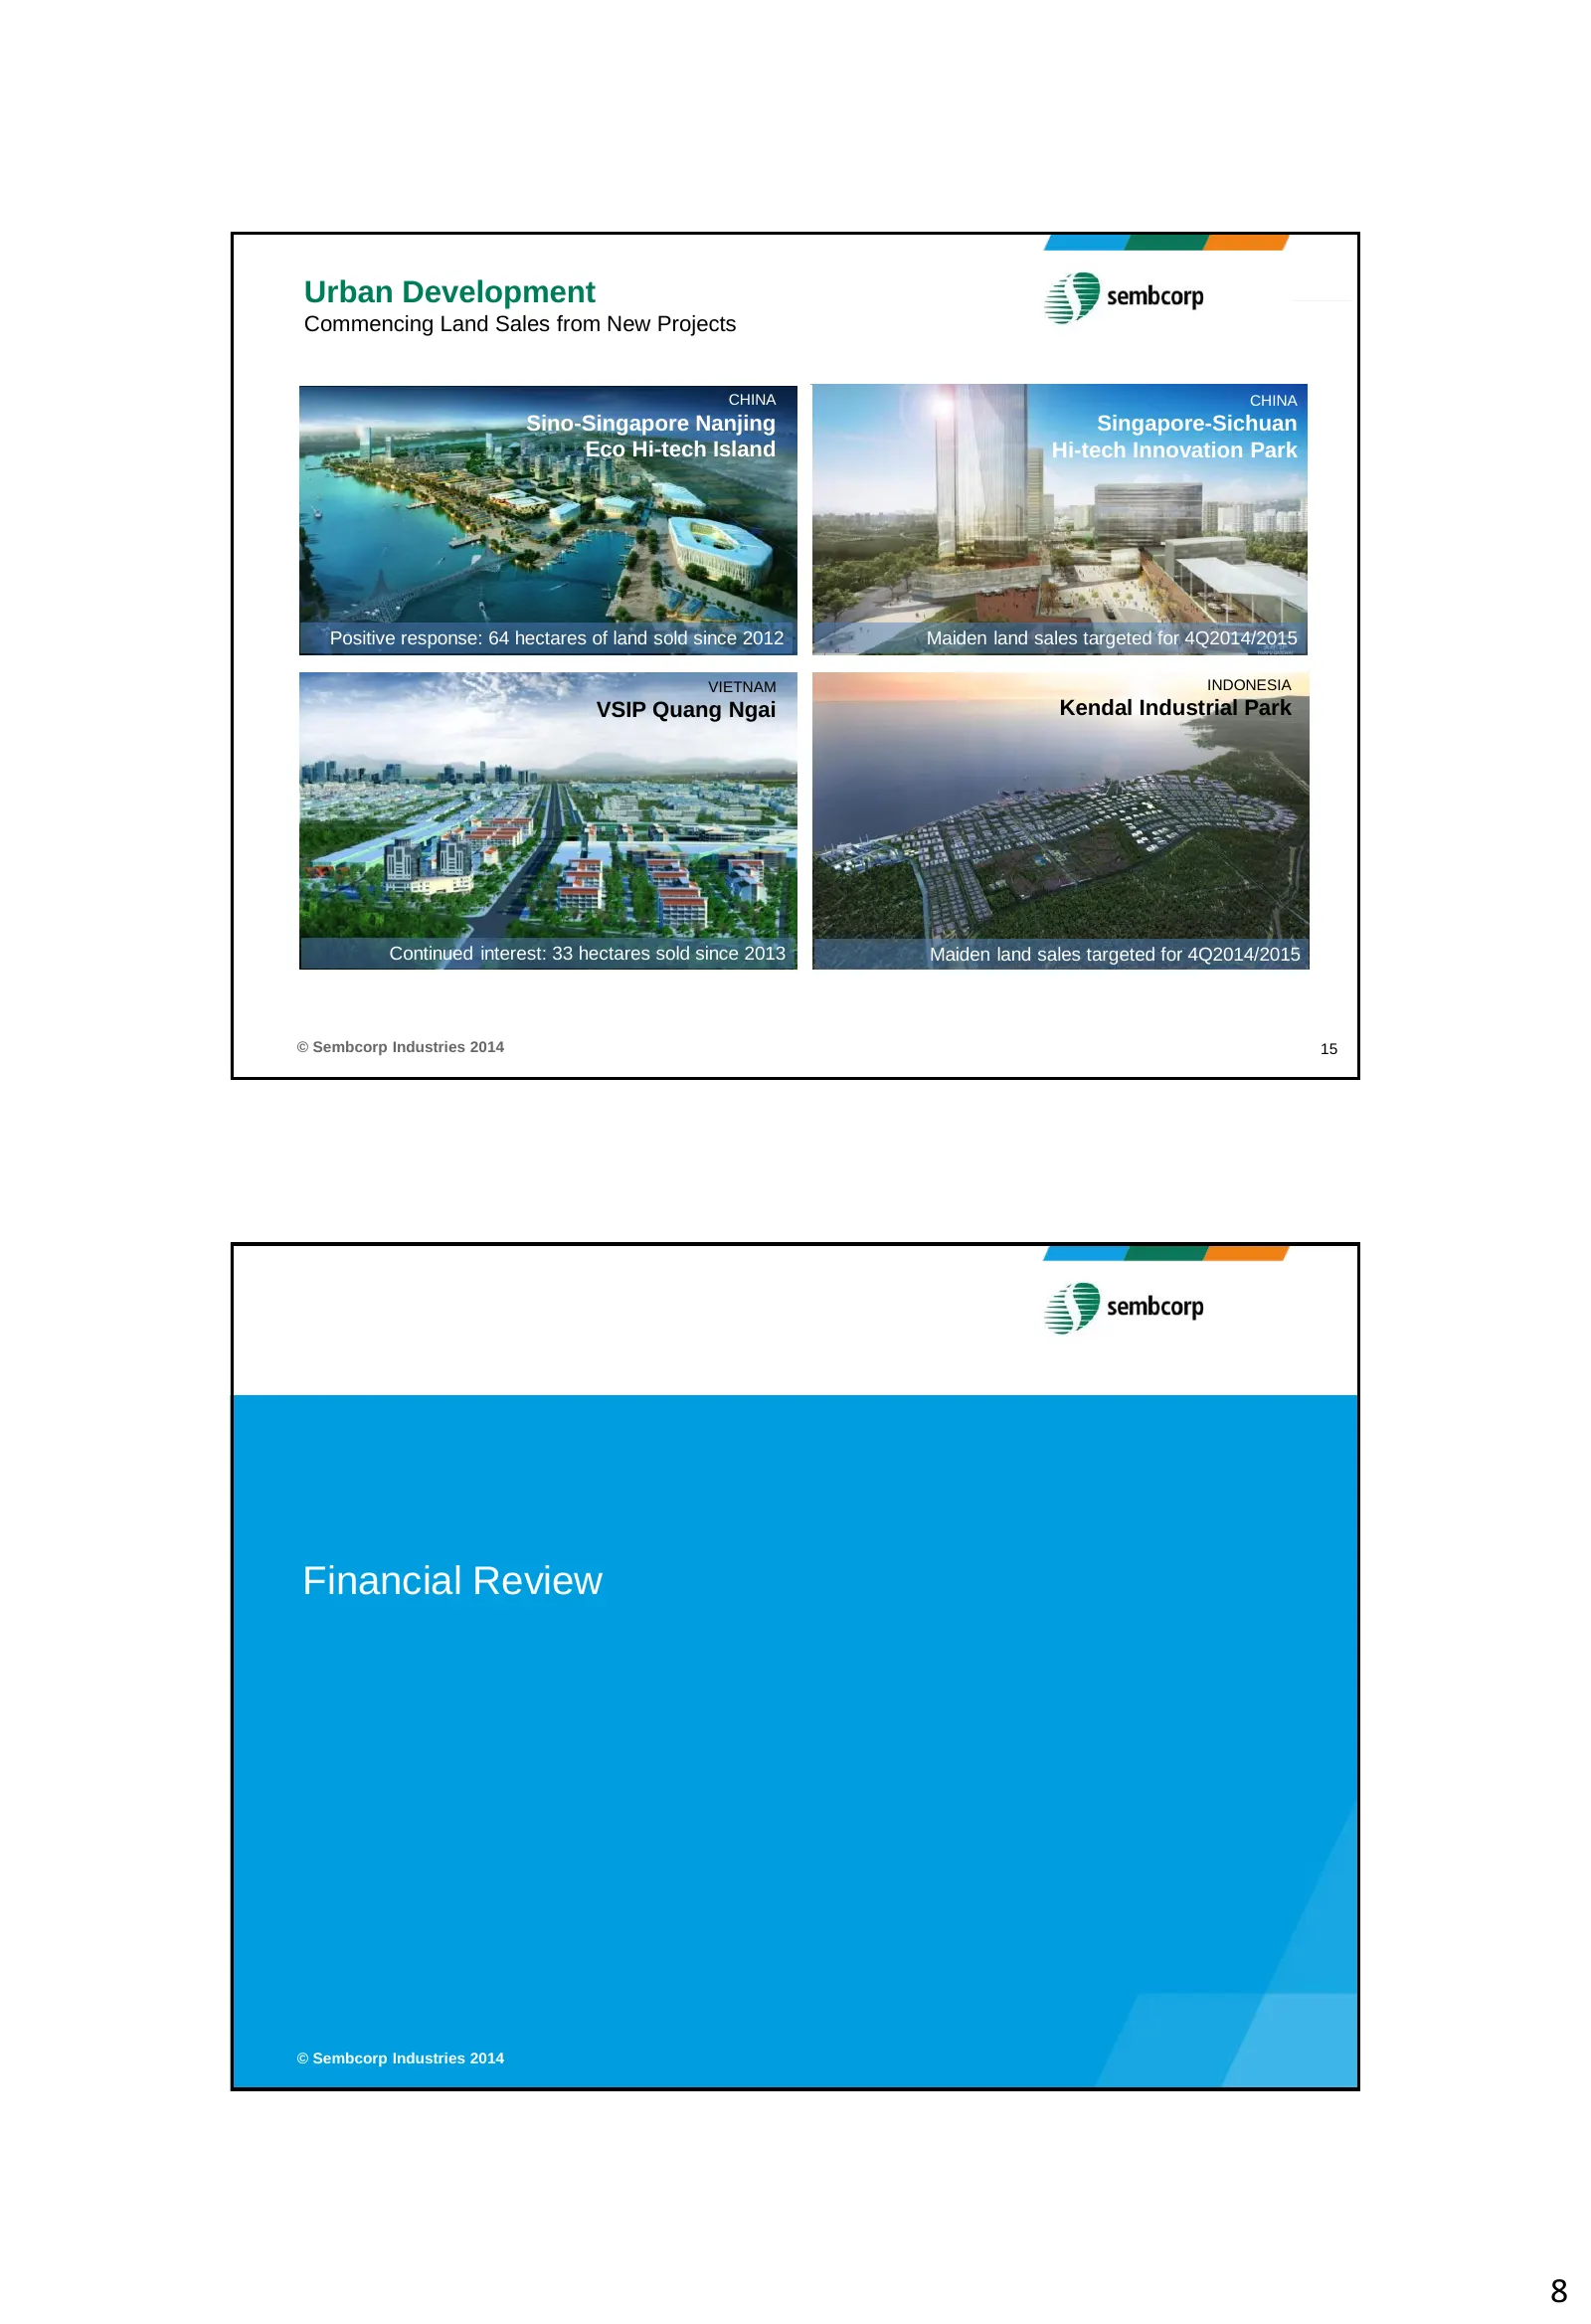
Urban Development Commencing Land Sales from New Projects CHINA CHINA Sino-Singapore Nanjing Singapore-Sichuan Eco Hi-tech Island Hi-tech Innovation Park Positive response: 64 hectares of land sold since 2012 Maiden land sales targeted for 4Q2014/2015 VIETNAM INDONESIA VSIP Quang Ngai Kendal Industr
Slide 9: Group Profit & Loss
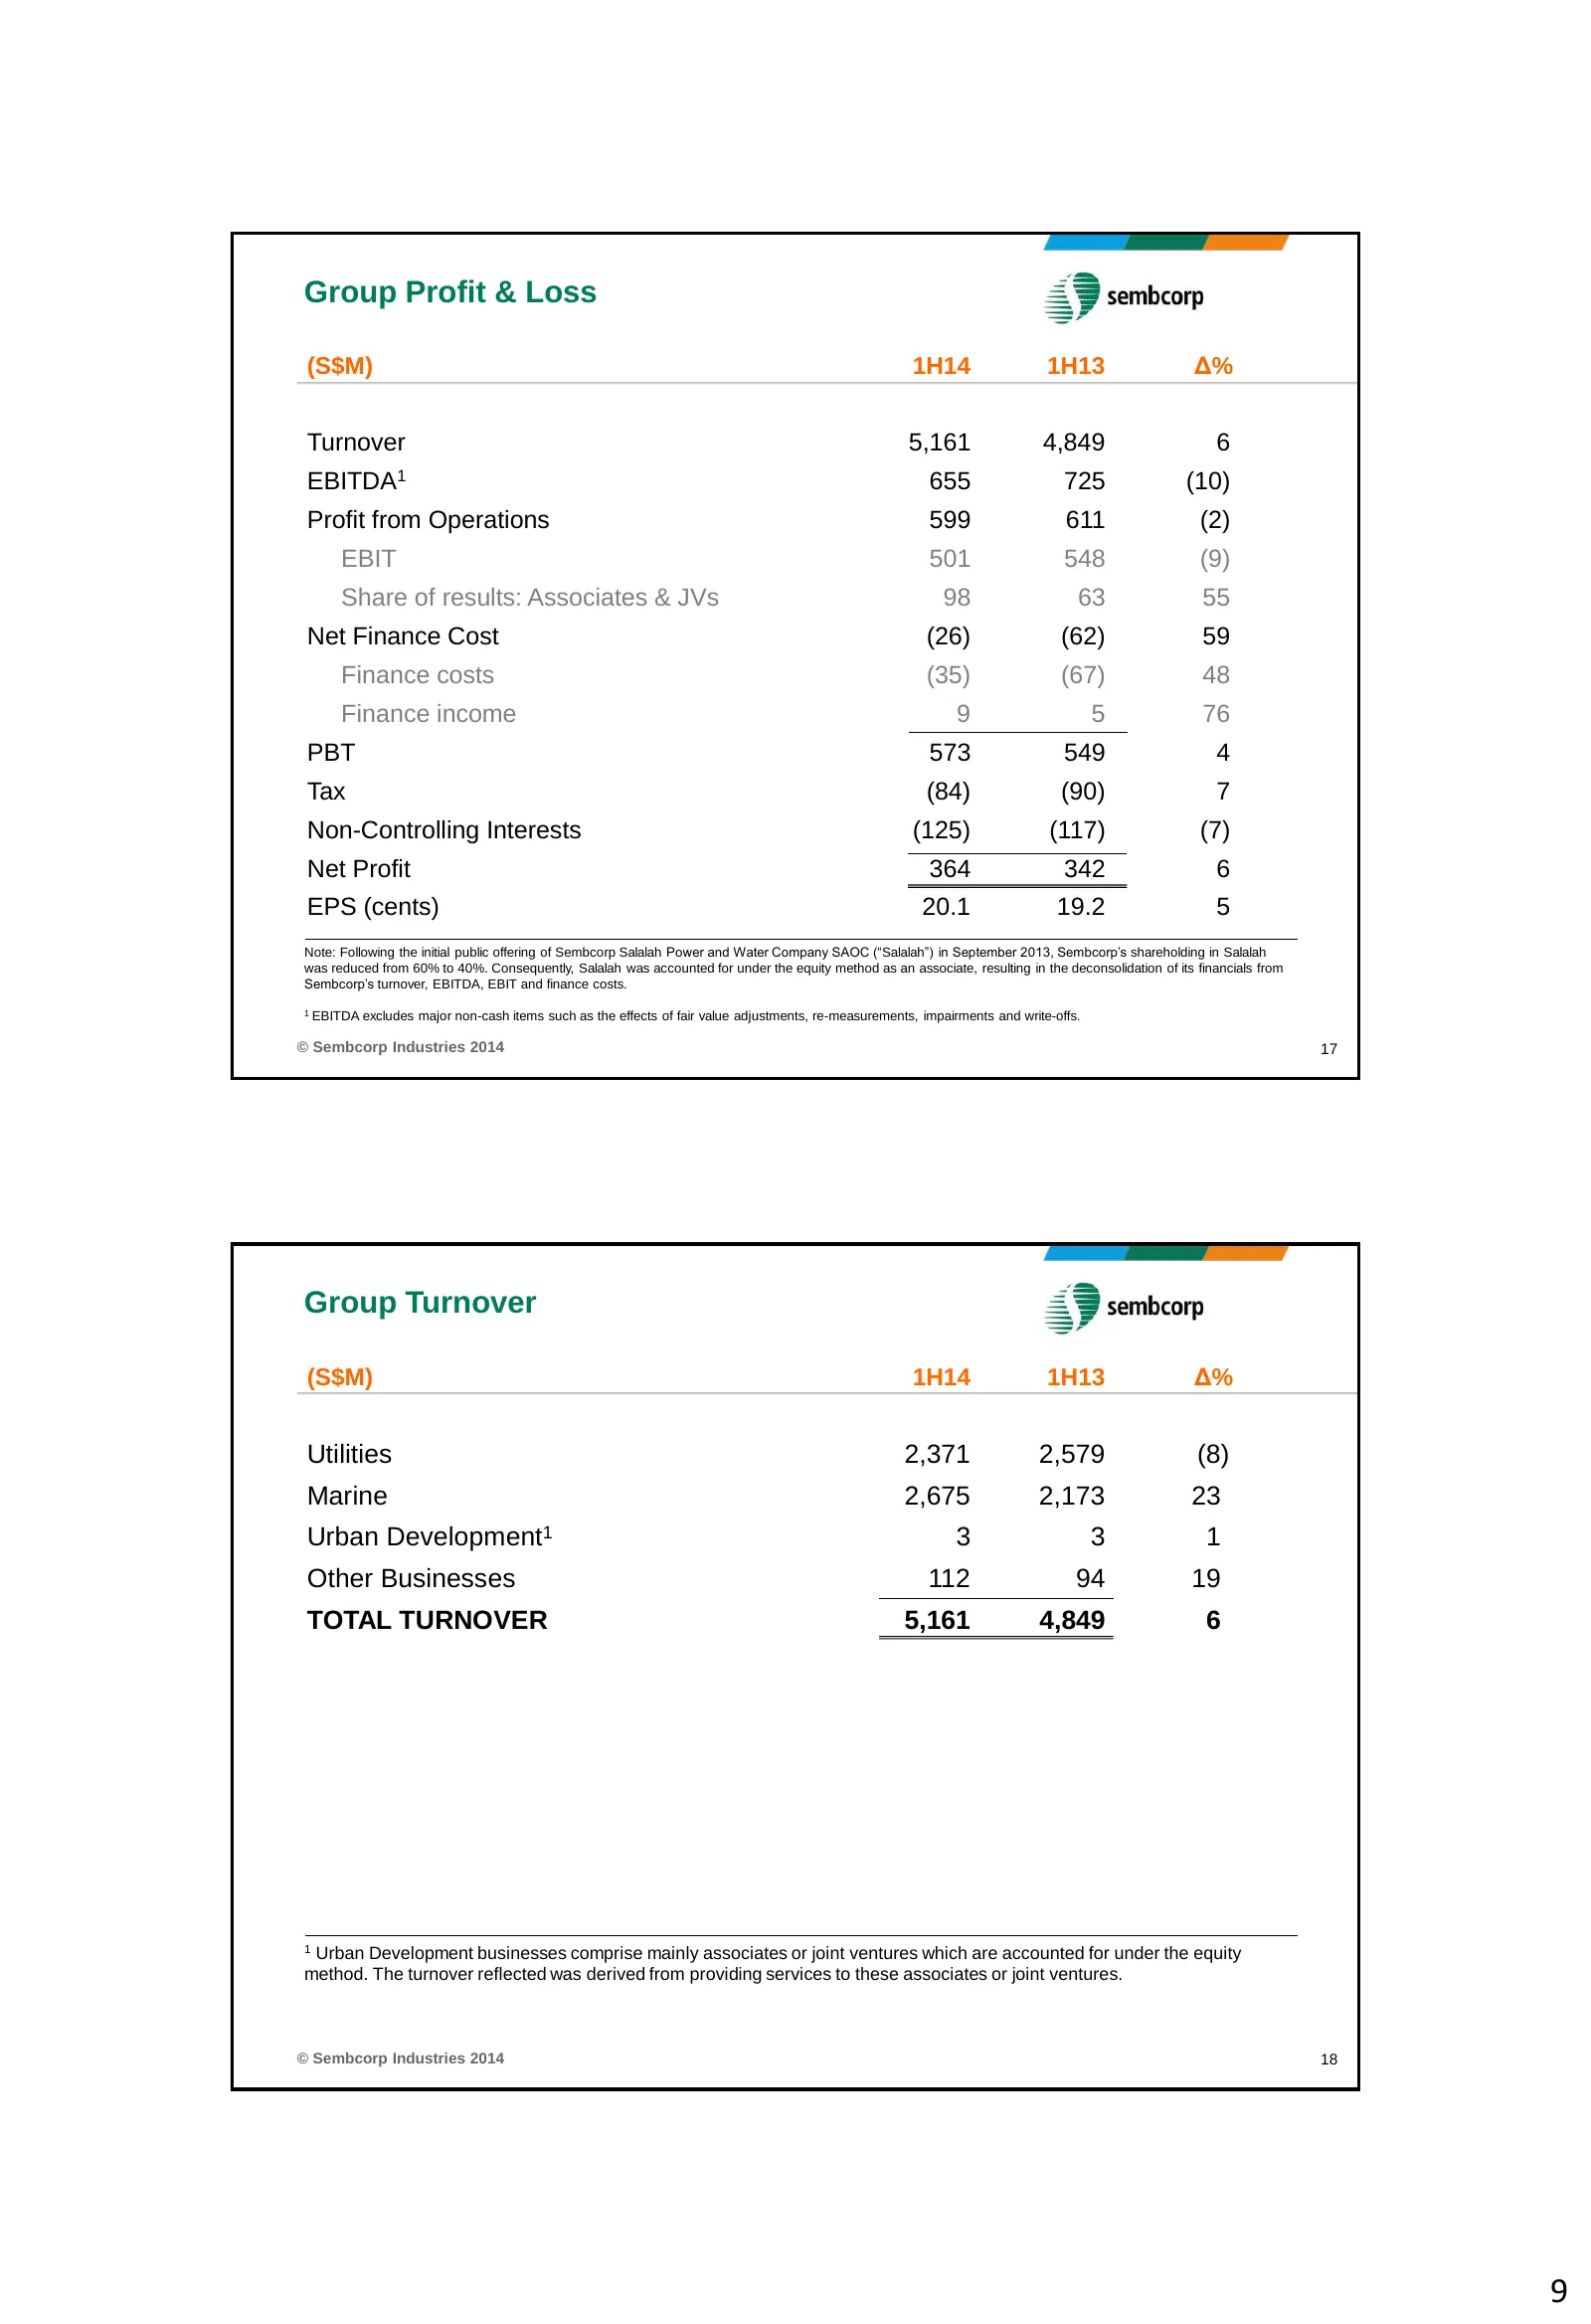
Group Profit & Loss (S$M) 1H14 1H13 Δ% Turnover 5,161 4,849 6 EBITDA1 655 725 (10) Profit from Operations 599 611 (2) EBIT 501 548 (9) Share of results: Associates & JVs 98 63 55 Net Finance Cost (26) (62) 59 Finance costs (35) (67) 48 Finance income 9 5 76 PBT 573 549 4 Tax (84) (90) 7 Non-Controll
Slide 10: Group Profit from Operations and Net Profit
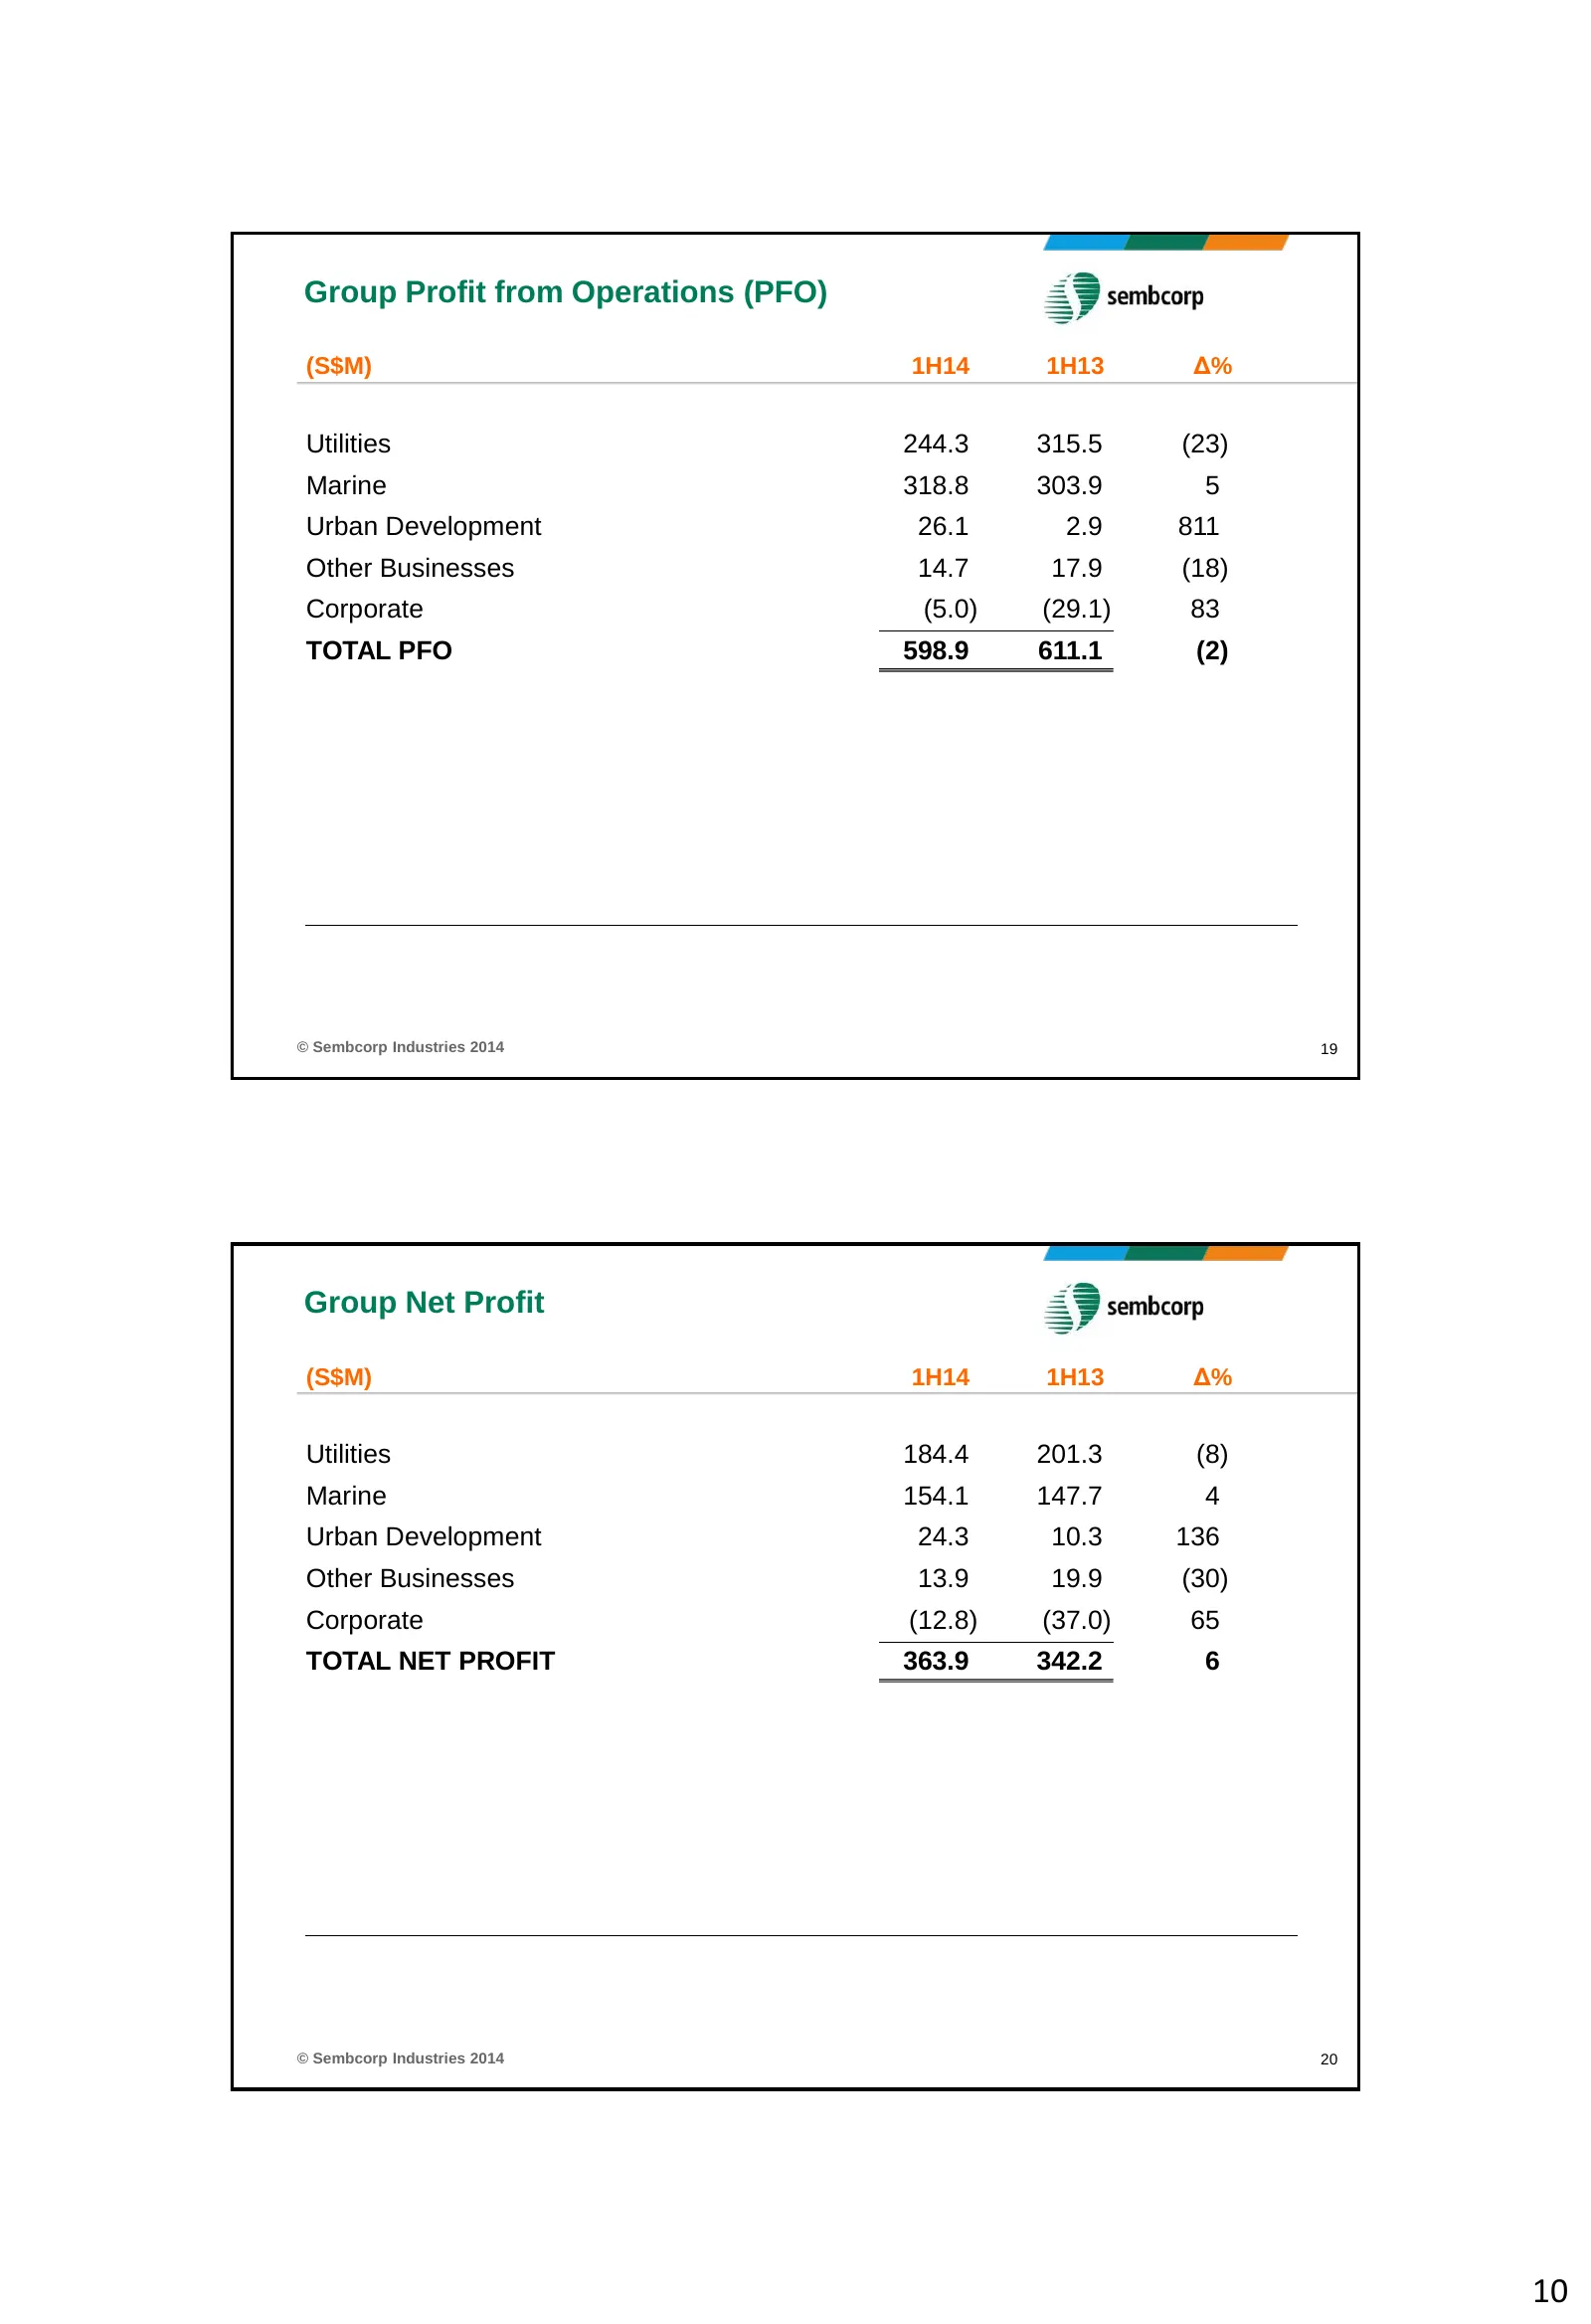
Group Profit from Operations (PFO) (S$M) 1H14 1H13 Δ% Utilities 244.3 315.5 (23) Marine 318.8 303.9 5 Urban Development 26.1 2.9 811 Other Businesses 14.7 17.9 (18) Corporate (5.0) (29.1) 83 TOTAL PFO 598.9 611.1 (2) © Sembcorp Industries 2014 19 Group Net Profit (S$M) 1H14 1H13 Δ% Utilities 184.4 2
Slide 11: Utilities Net Profit
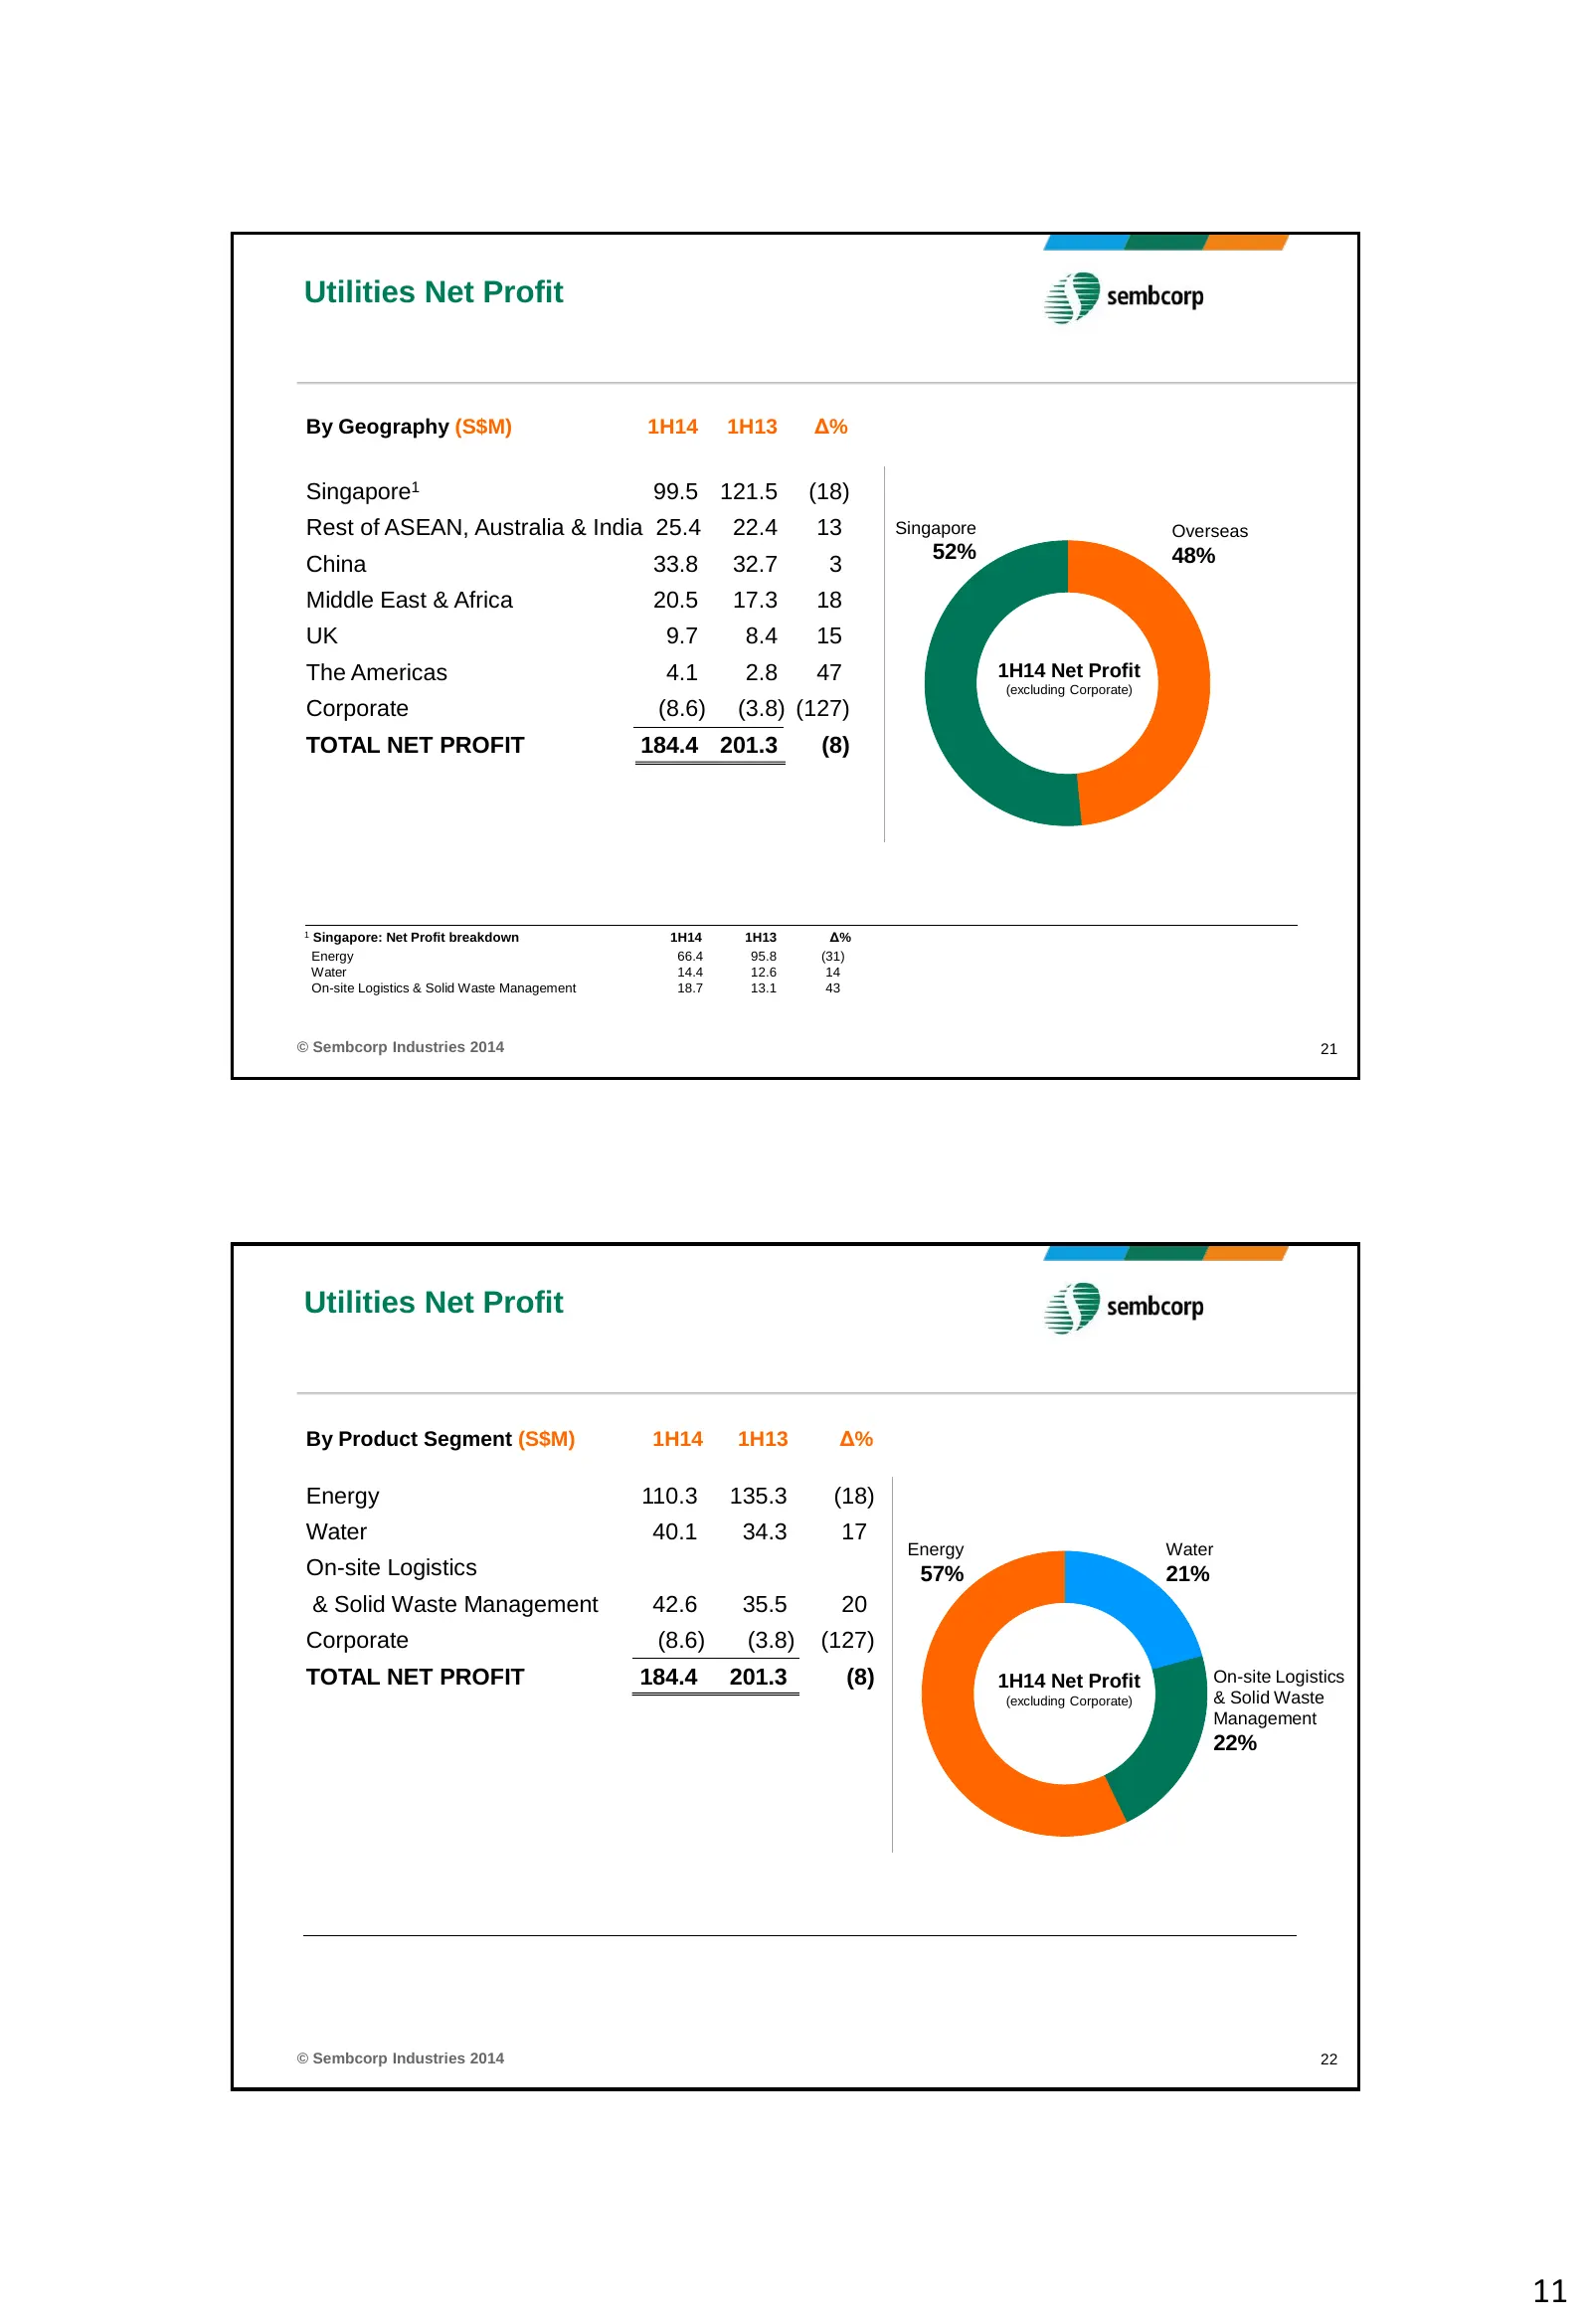
Utilities Net Profit By Geography (S$M) 1H14 1H13 Δ% Singapore1 99.5 121.5 (18) Rest of ASEAN, Australia & India 25.4 22.4 13 Singapore Overseas 52% 48% China 33.8 32.7 3 Middle East & Africa 20.5 17.3 18 UK 9.7 8.4 15 The Americas 4.1 2.8 47 1H14 Net Profit (excluding Corporate) Corporate (8.6) (3.
Slide 12: Capex and Equity Investment; Group Free Cash Flow
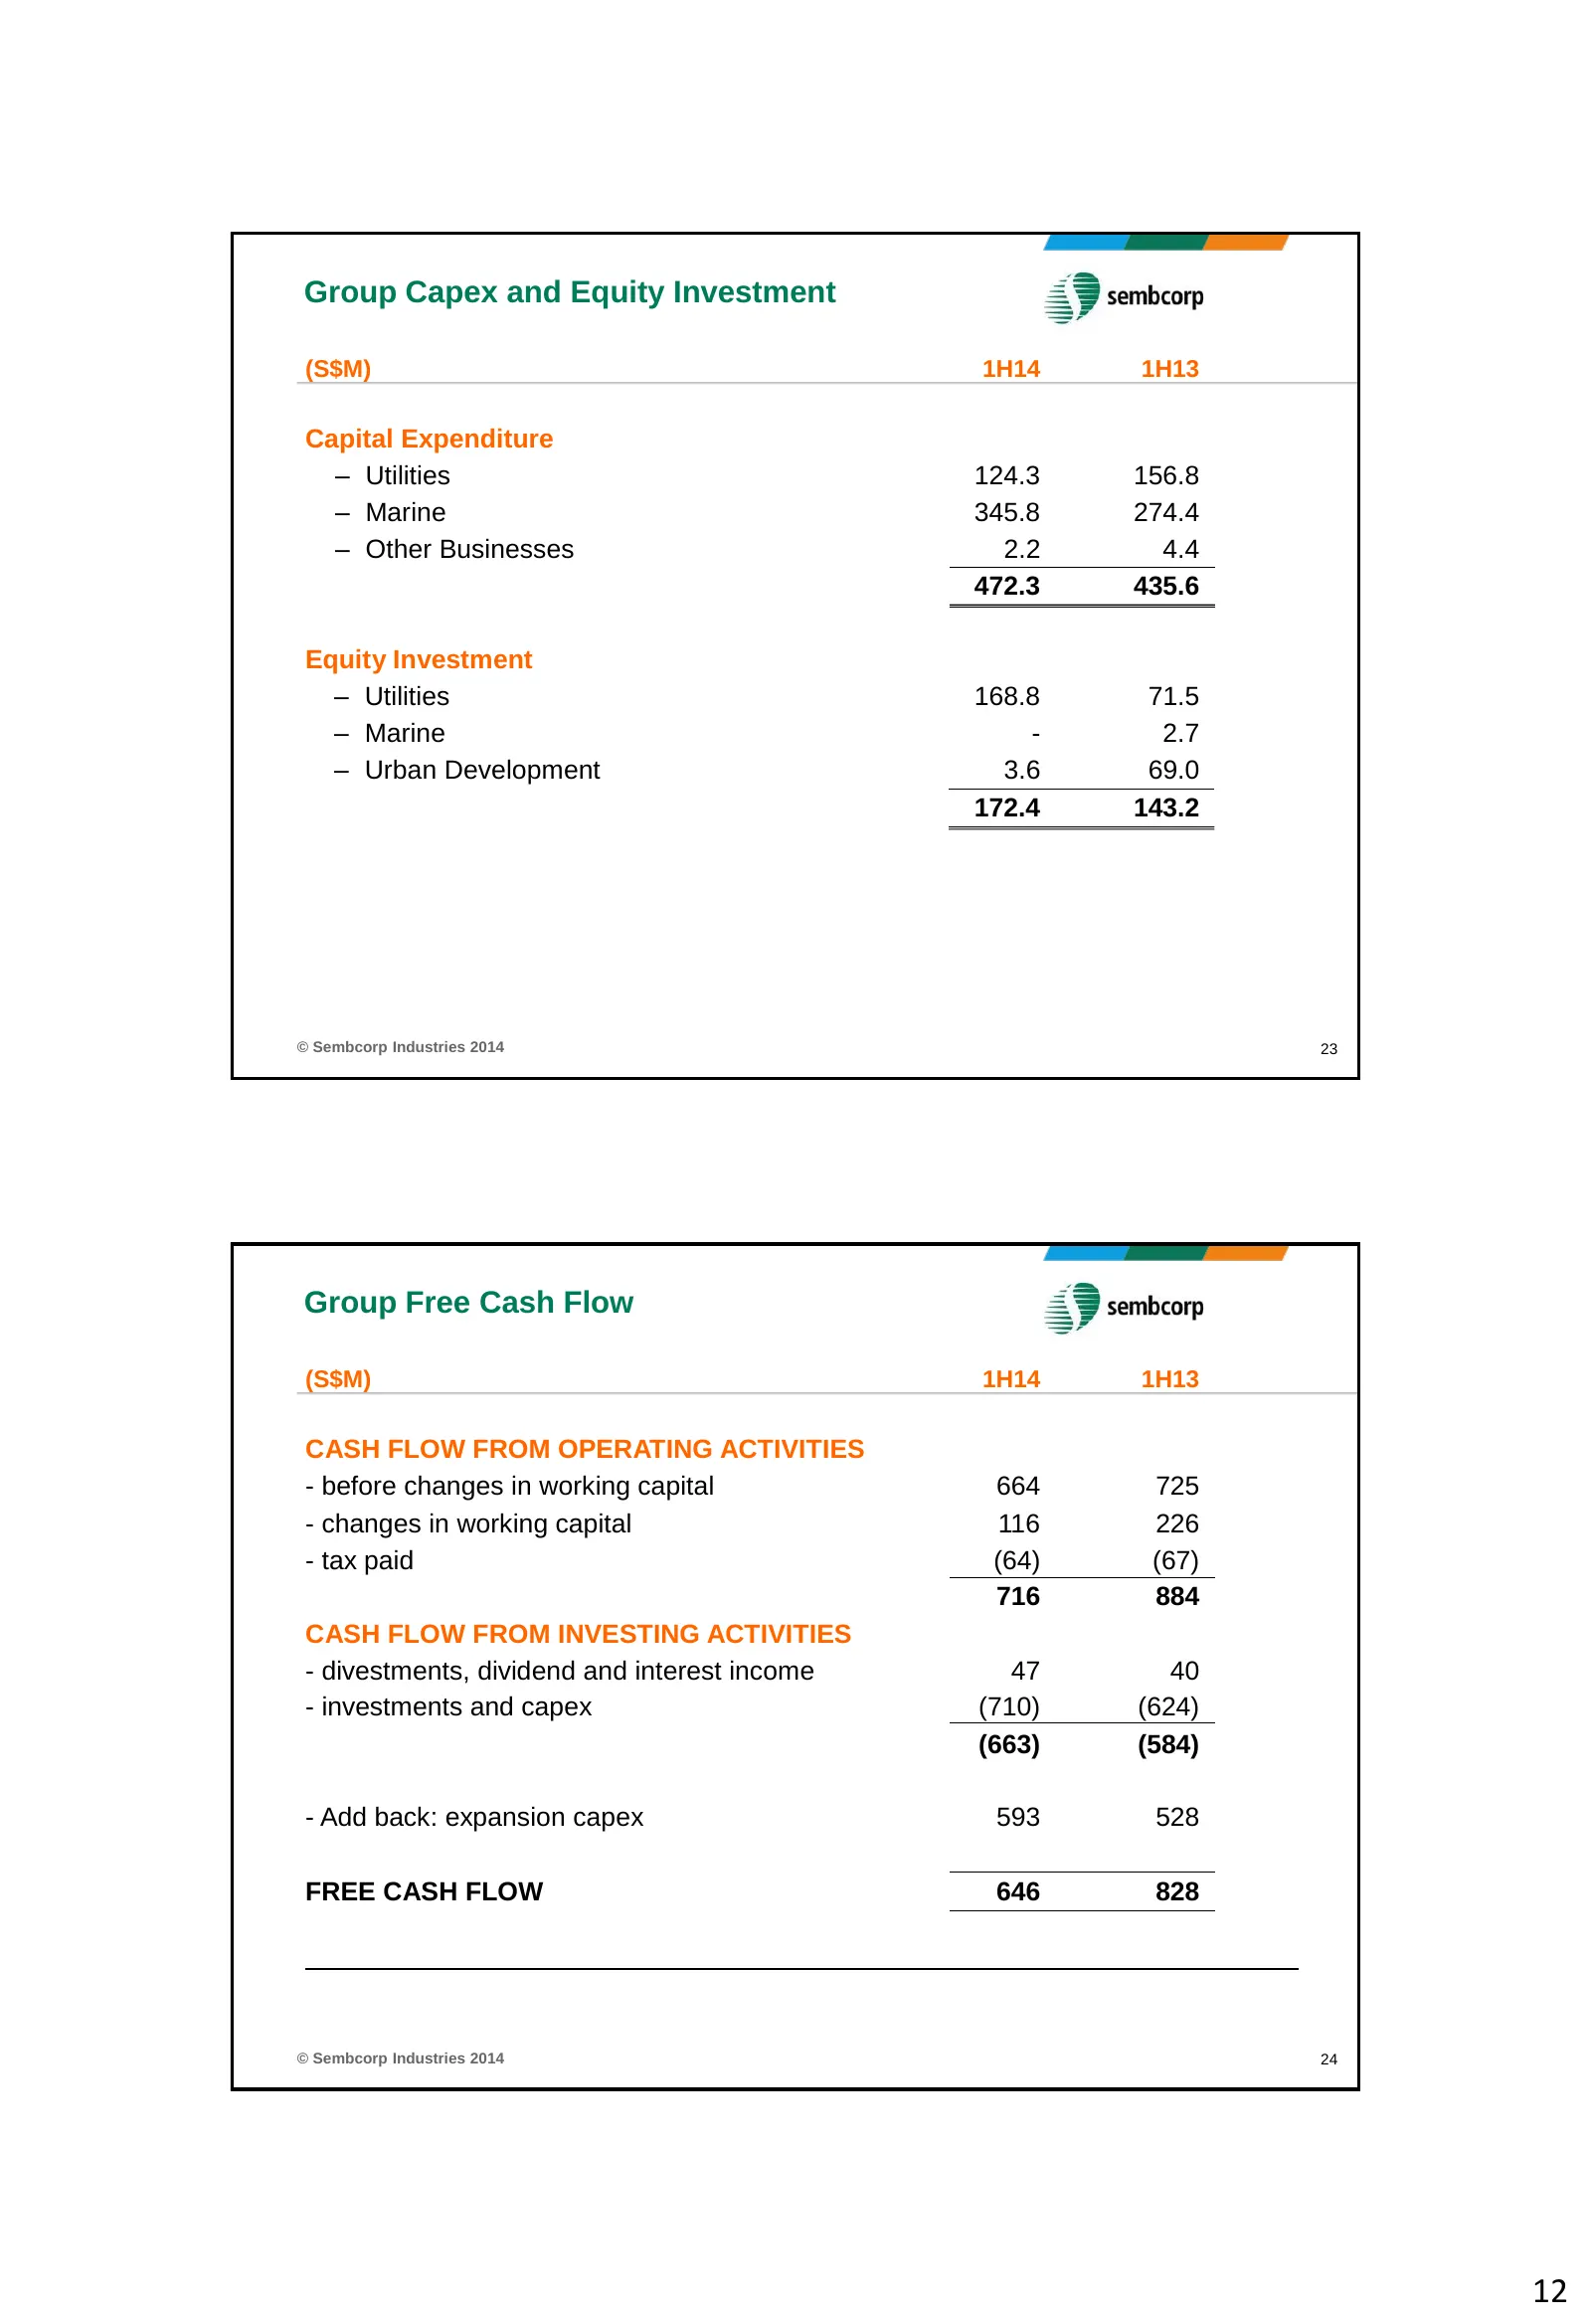
Group Capex and Equity Investment (S$M) 1H14 1H13 Capital Expenditure – Utilities 124.3 156.8 – Marine 345.8 274.4 – Other Businesses 2.2 4.4 472.3 435.6 Equity Investment – Utilities 168.8 71.5 – Marine - 2.7 – Urban Development 3.6 69.0 172.4 143.2 © Sembcorp Industries 2014 23 Group Free Cash Flo
Slide 13: Group Borrowings
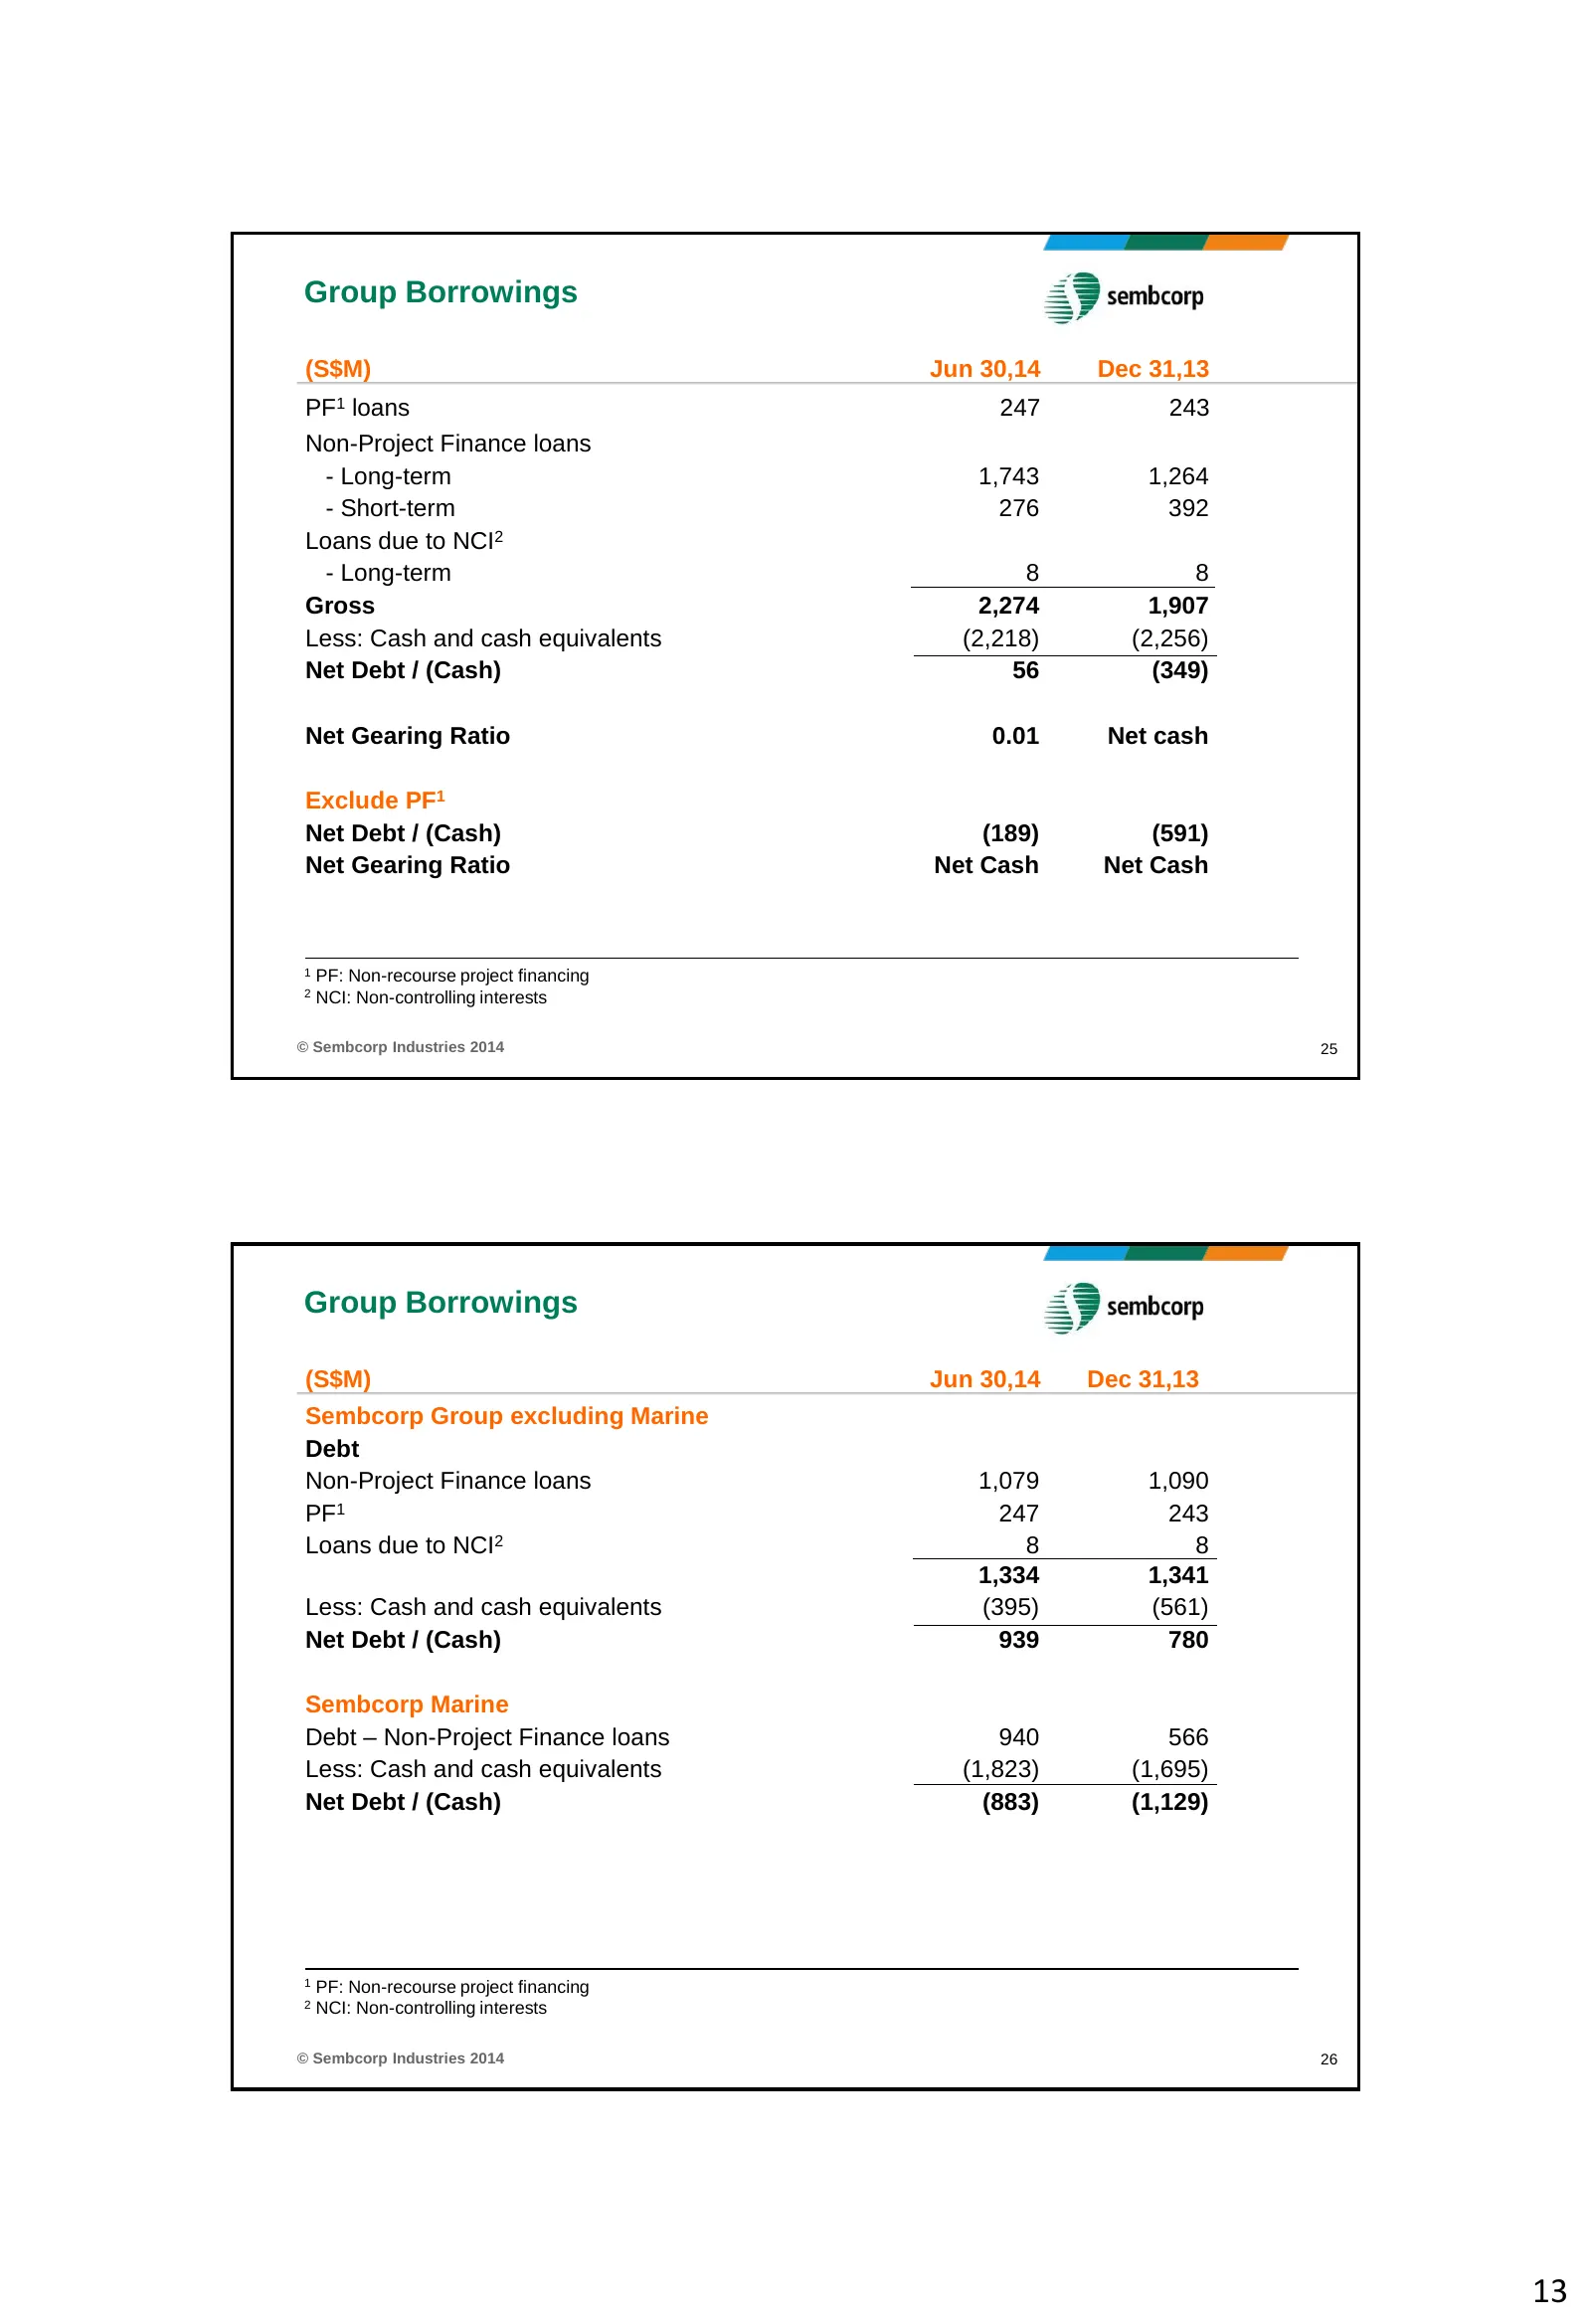
Group Borrowings (S$M) Jun 30,14 Dec 31,13 PF1 loans 247 243 Non-Project Finance loans - Long-term 1,743 1,264 - Short-term 276 392 Loans due to NCI2 - Long-term 8 8 Gross 2,274 1,907 Less: Cash and cash equivalents (2,218) (2,256) Net Debt / (Cash) 56 (349) Net Gearing Ratio 0.01 Net cash Exclude P
Slide 14: Financial Indicators and Group Outlook
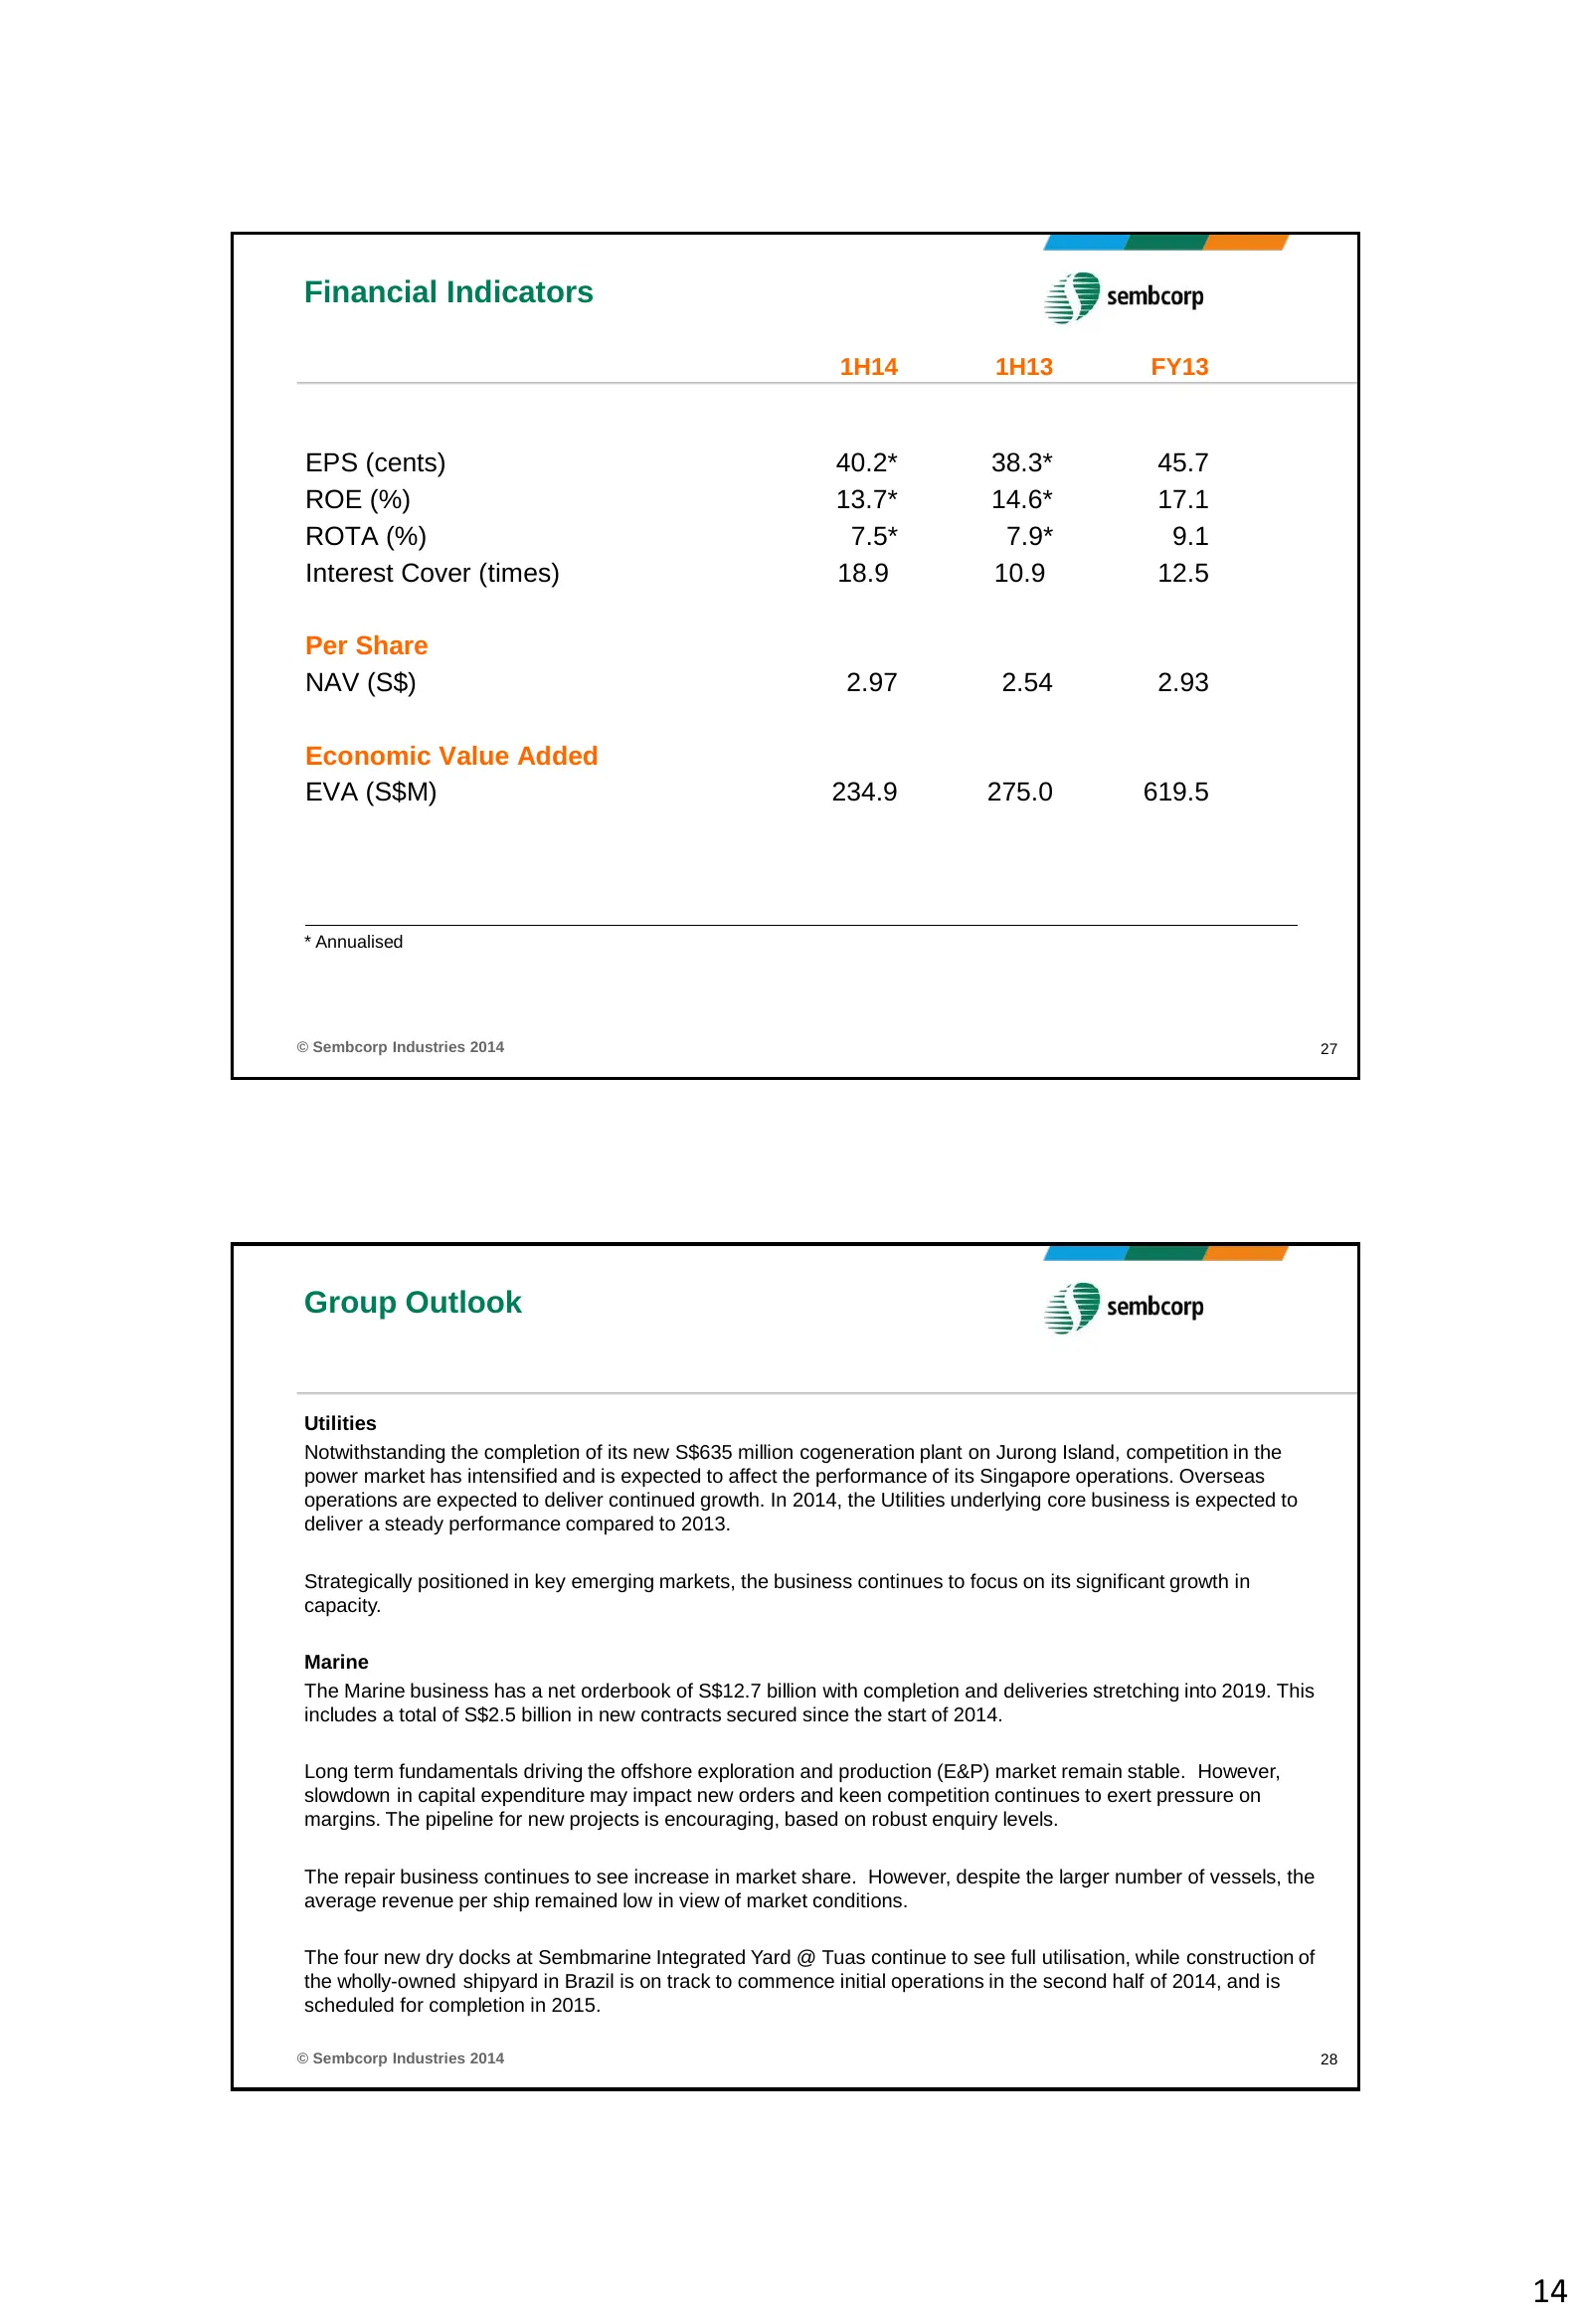
Financial Indicators 1H14 1H13 FY13 EPS (cents) 40.2* 38.3* 45.7 ROE (%) 13.7* 14.6* 17.1 ROTA (%) 7.5* 7.9* 9.1 Interest Cover (times) 18.9 10.9 12.5 Per Share NAV (S$) 2.97 2.54 2.93 Economic Value Added EVA (S$M) 234.9 275.0 619.5 * Annualised © Sembcorp Industries 2014 27 Group Outlook Utilities
Slide 15: Outlook: Urban Development and Group
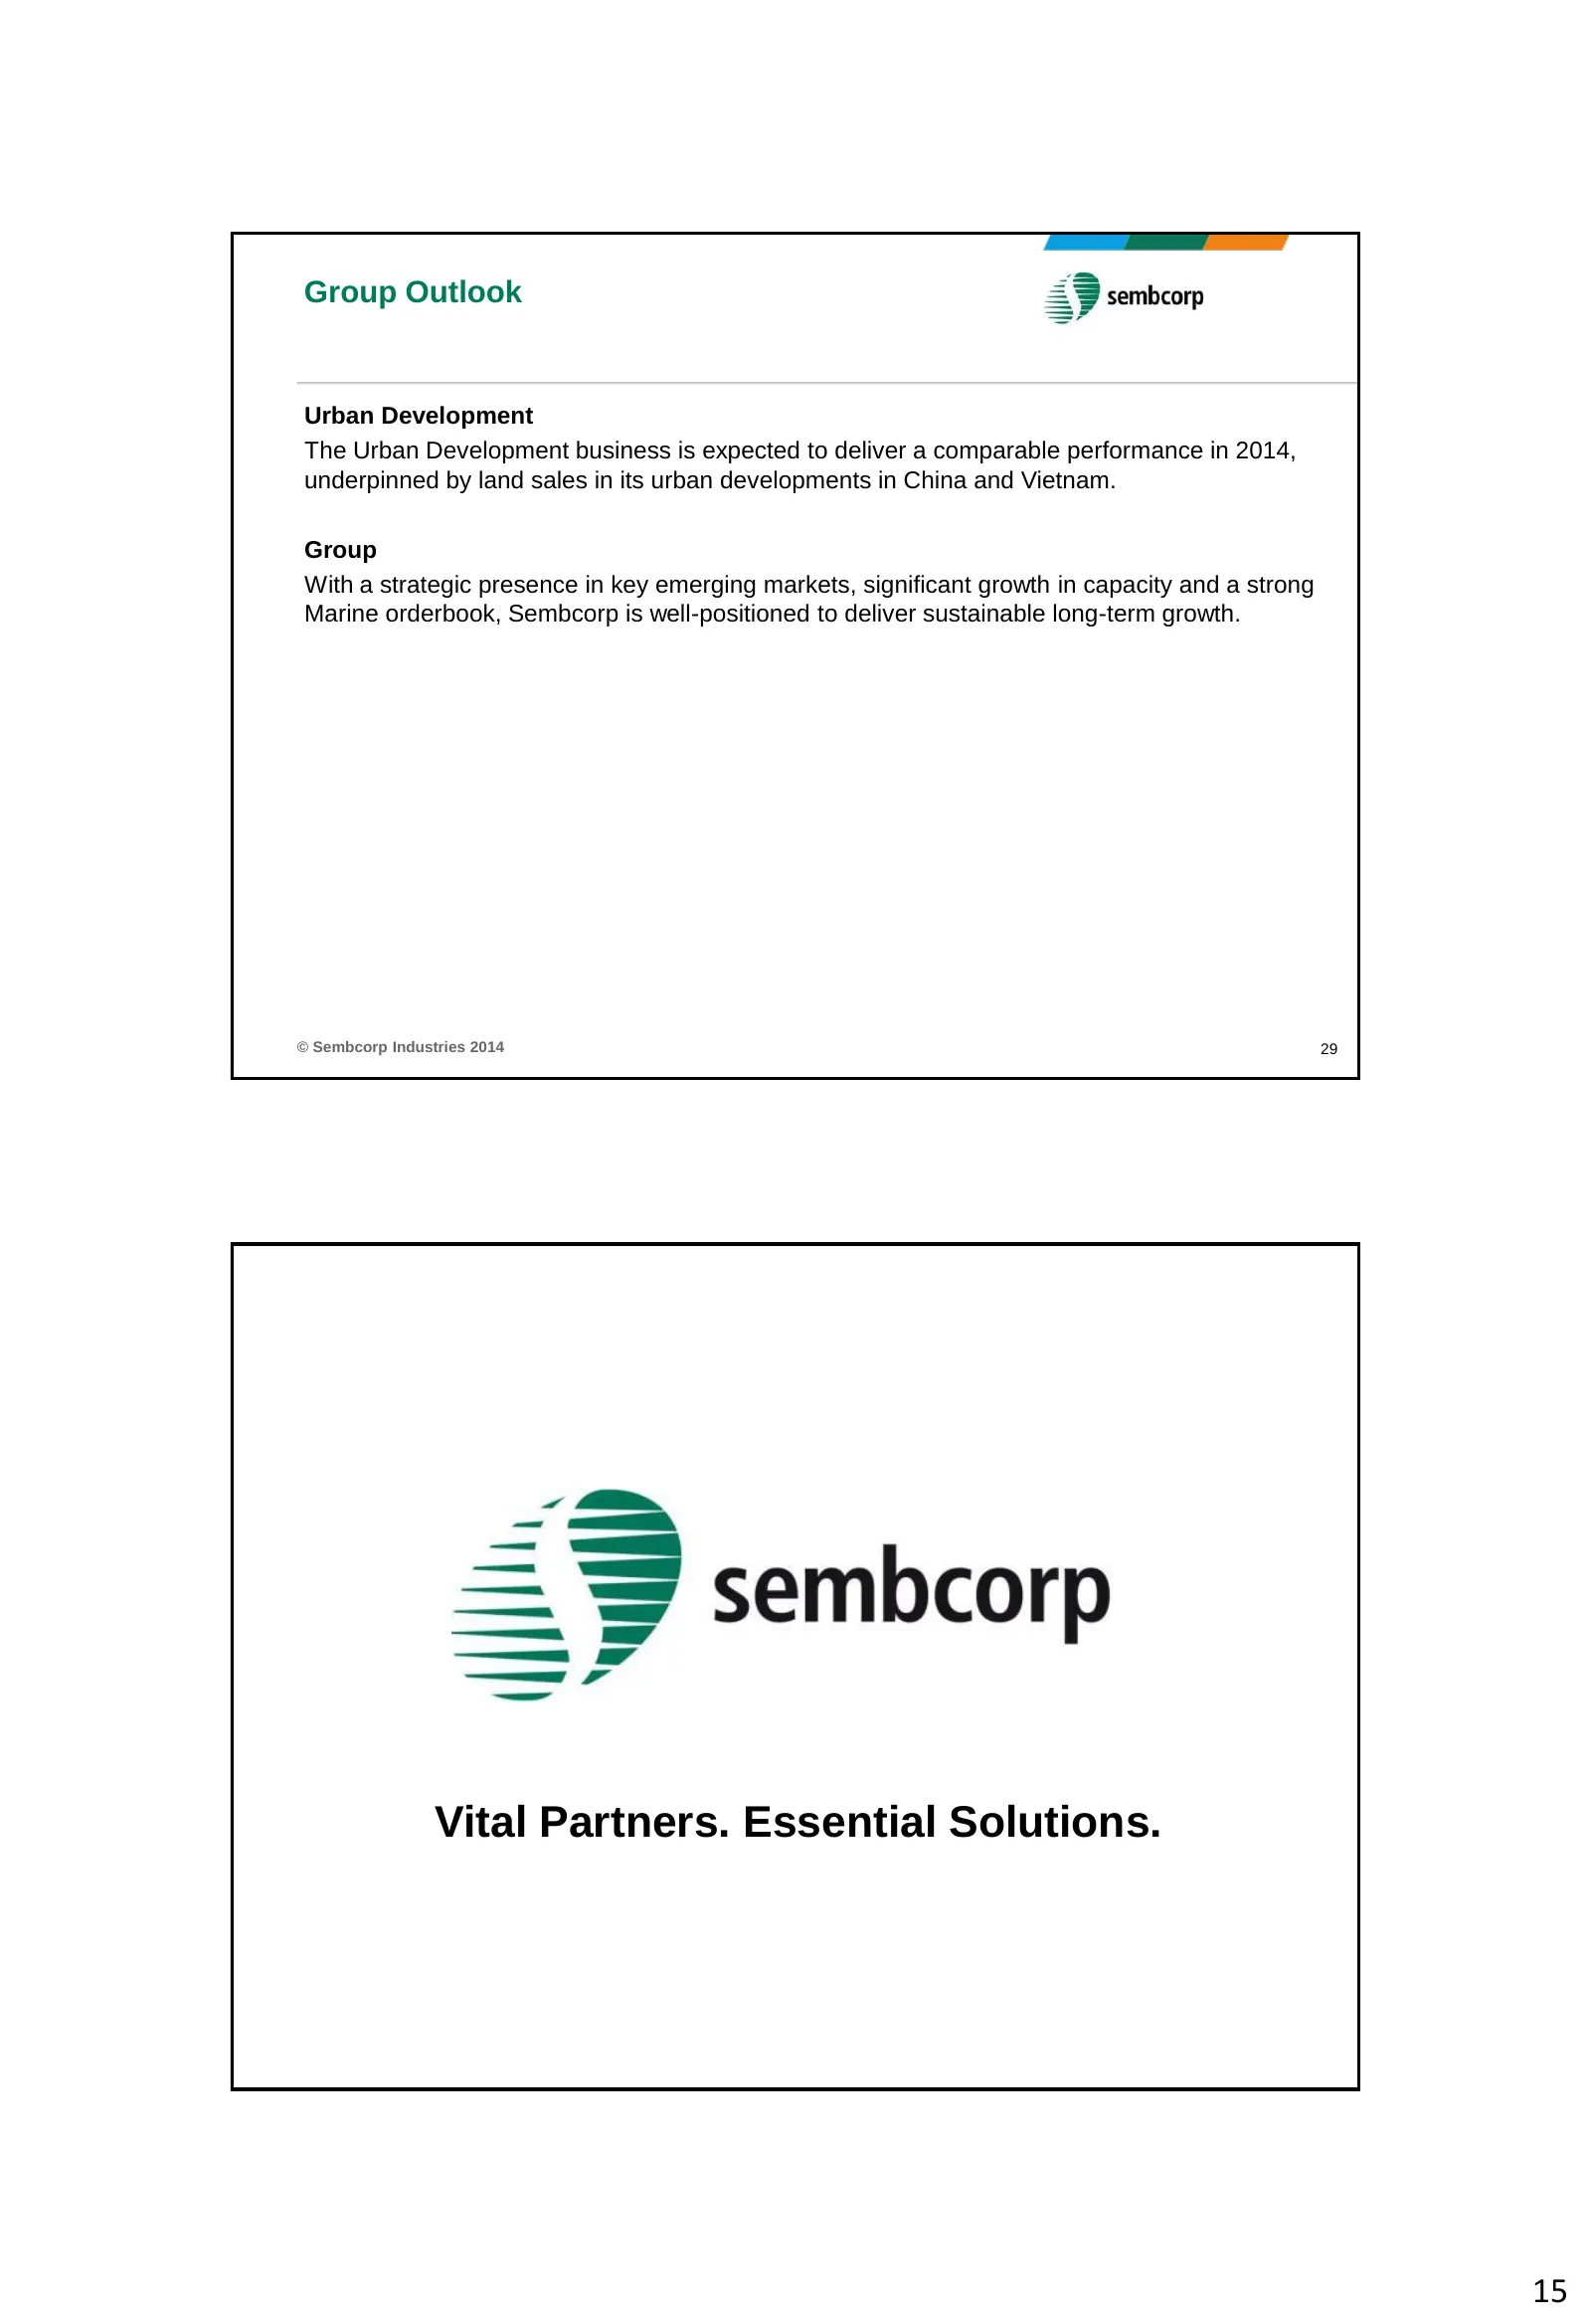
Group Outlook Urban Development The Urban Development business is expected to deliver a comparable performance in 2014, underpinned by land sales in its urban developments in China and Vietnam. Group With a strategic presence in key emerging markets, significant growth in capacity and a strong Marin
Slide 16: Appendix: Disclaimer
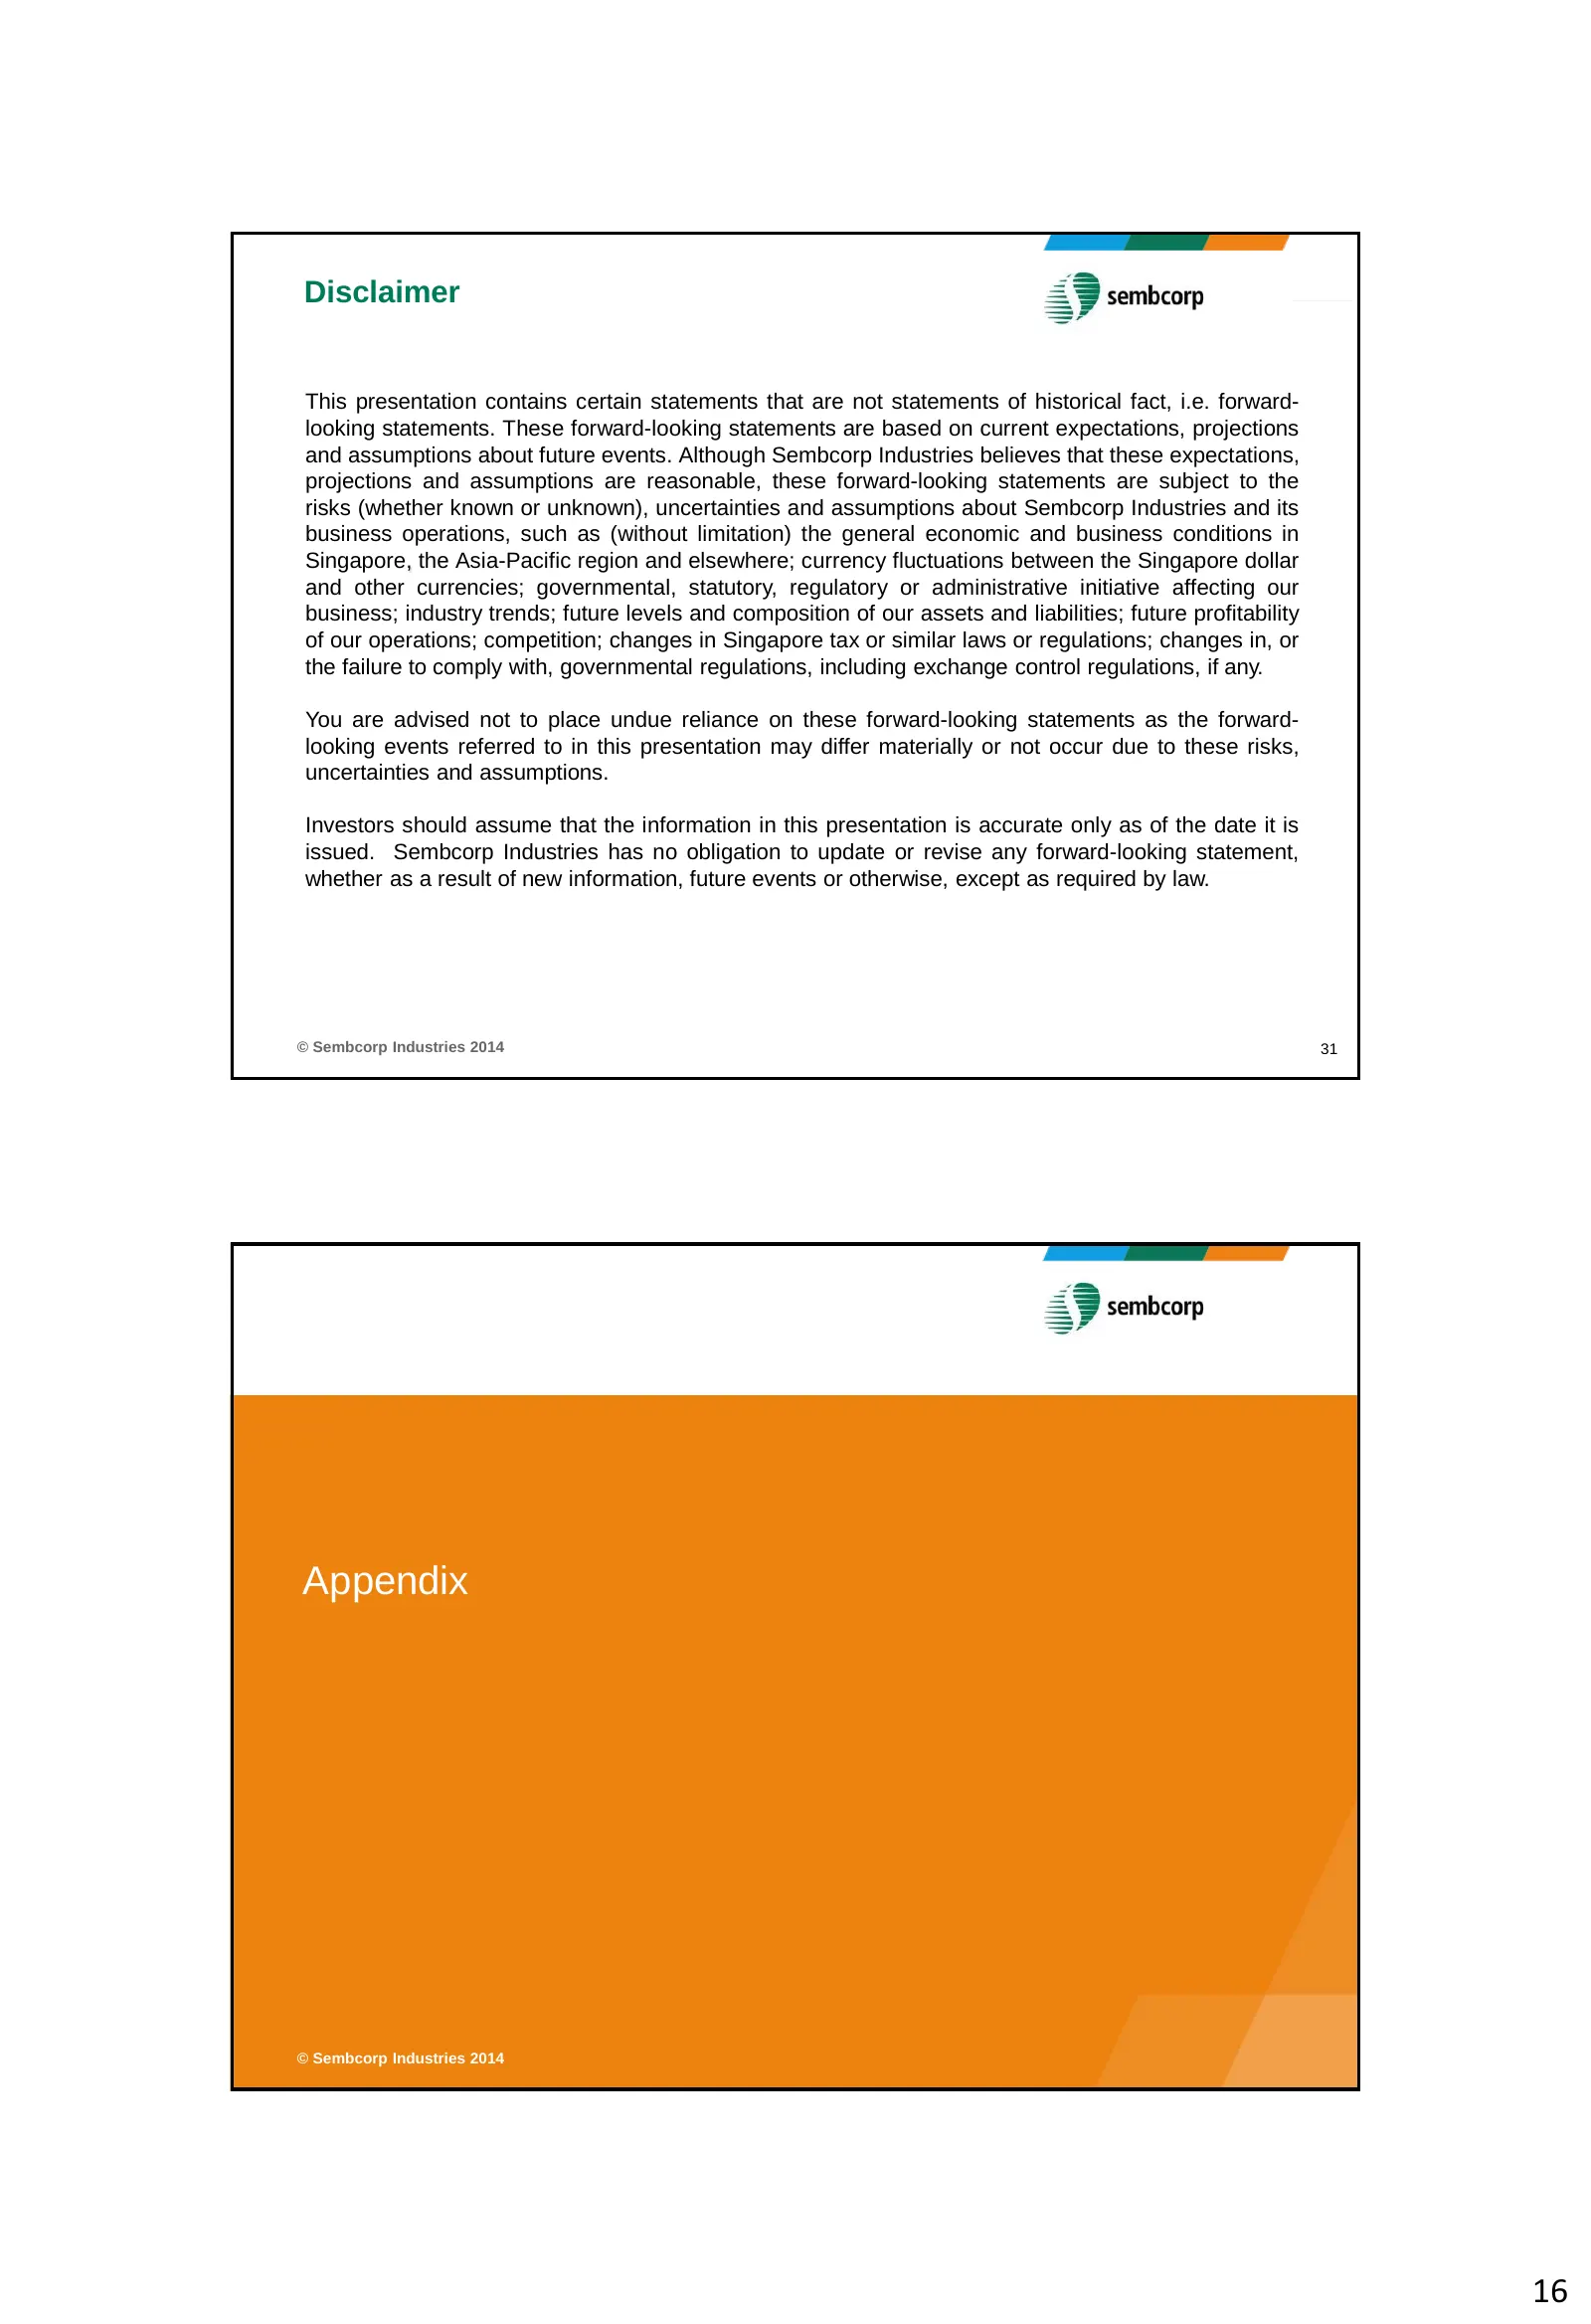
Disclaimer This presentation contains certain statements that are not statements of historical fact, i.e. forward- looking statements. These forward-looking statements are based on current expectations, projections and assumptions about future events. Although Sembcorp Industries believes that these
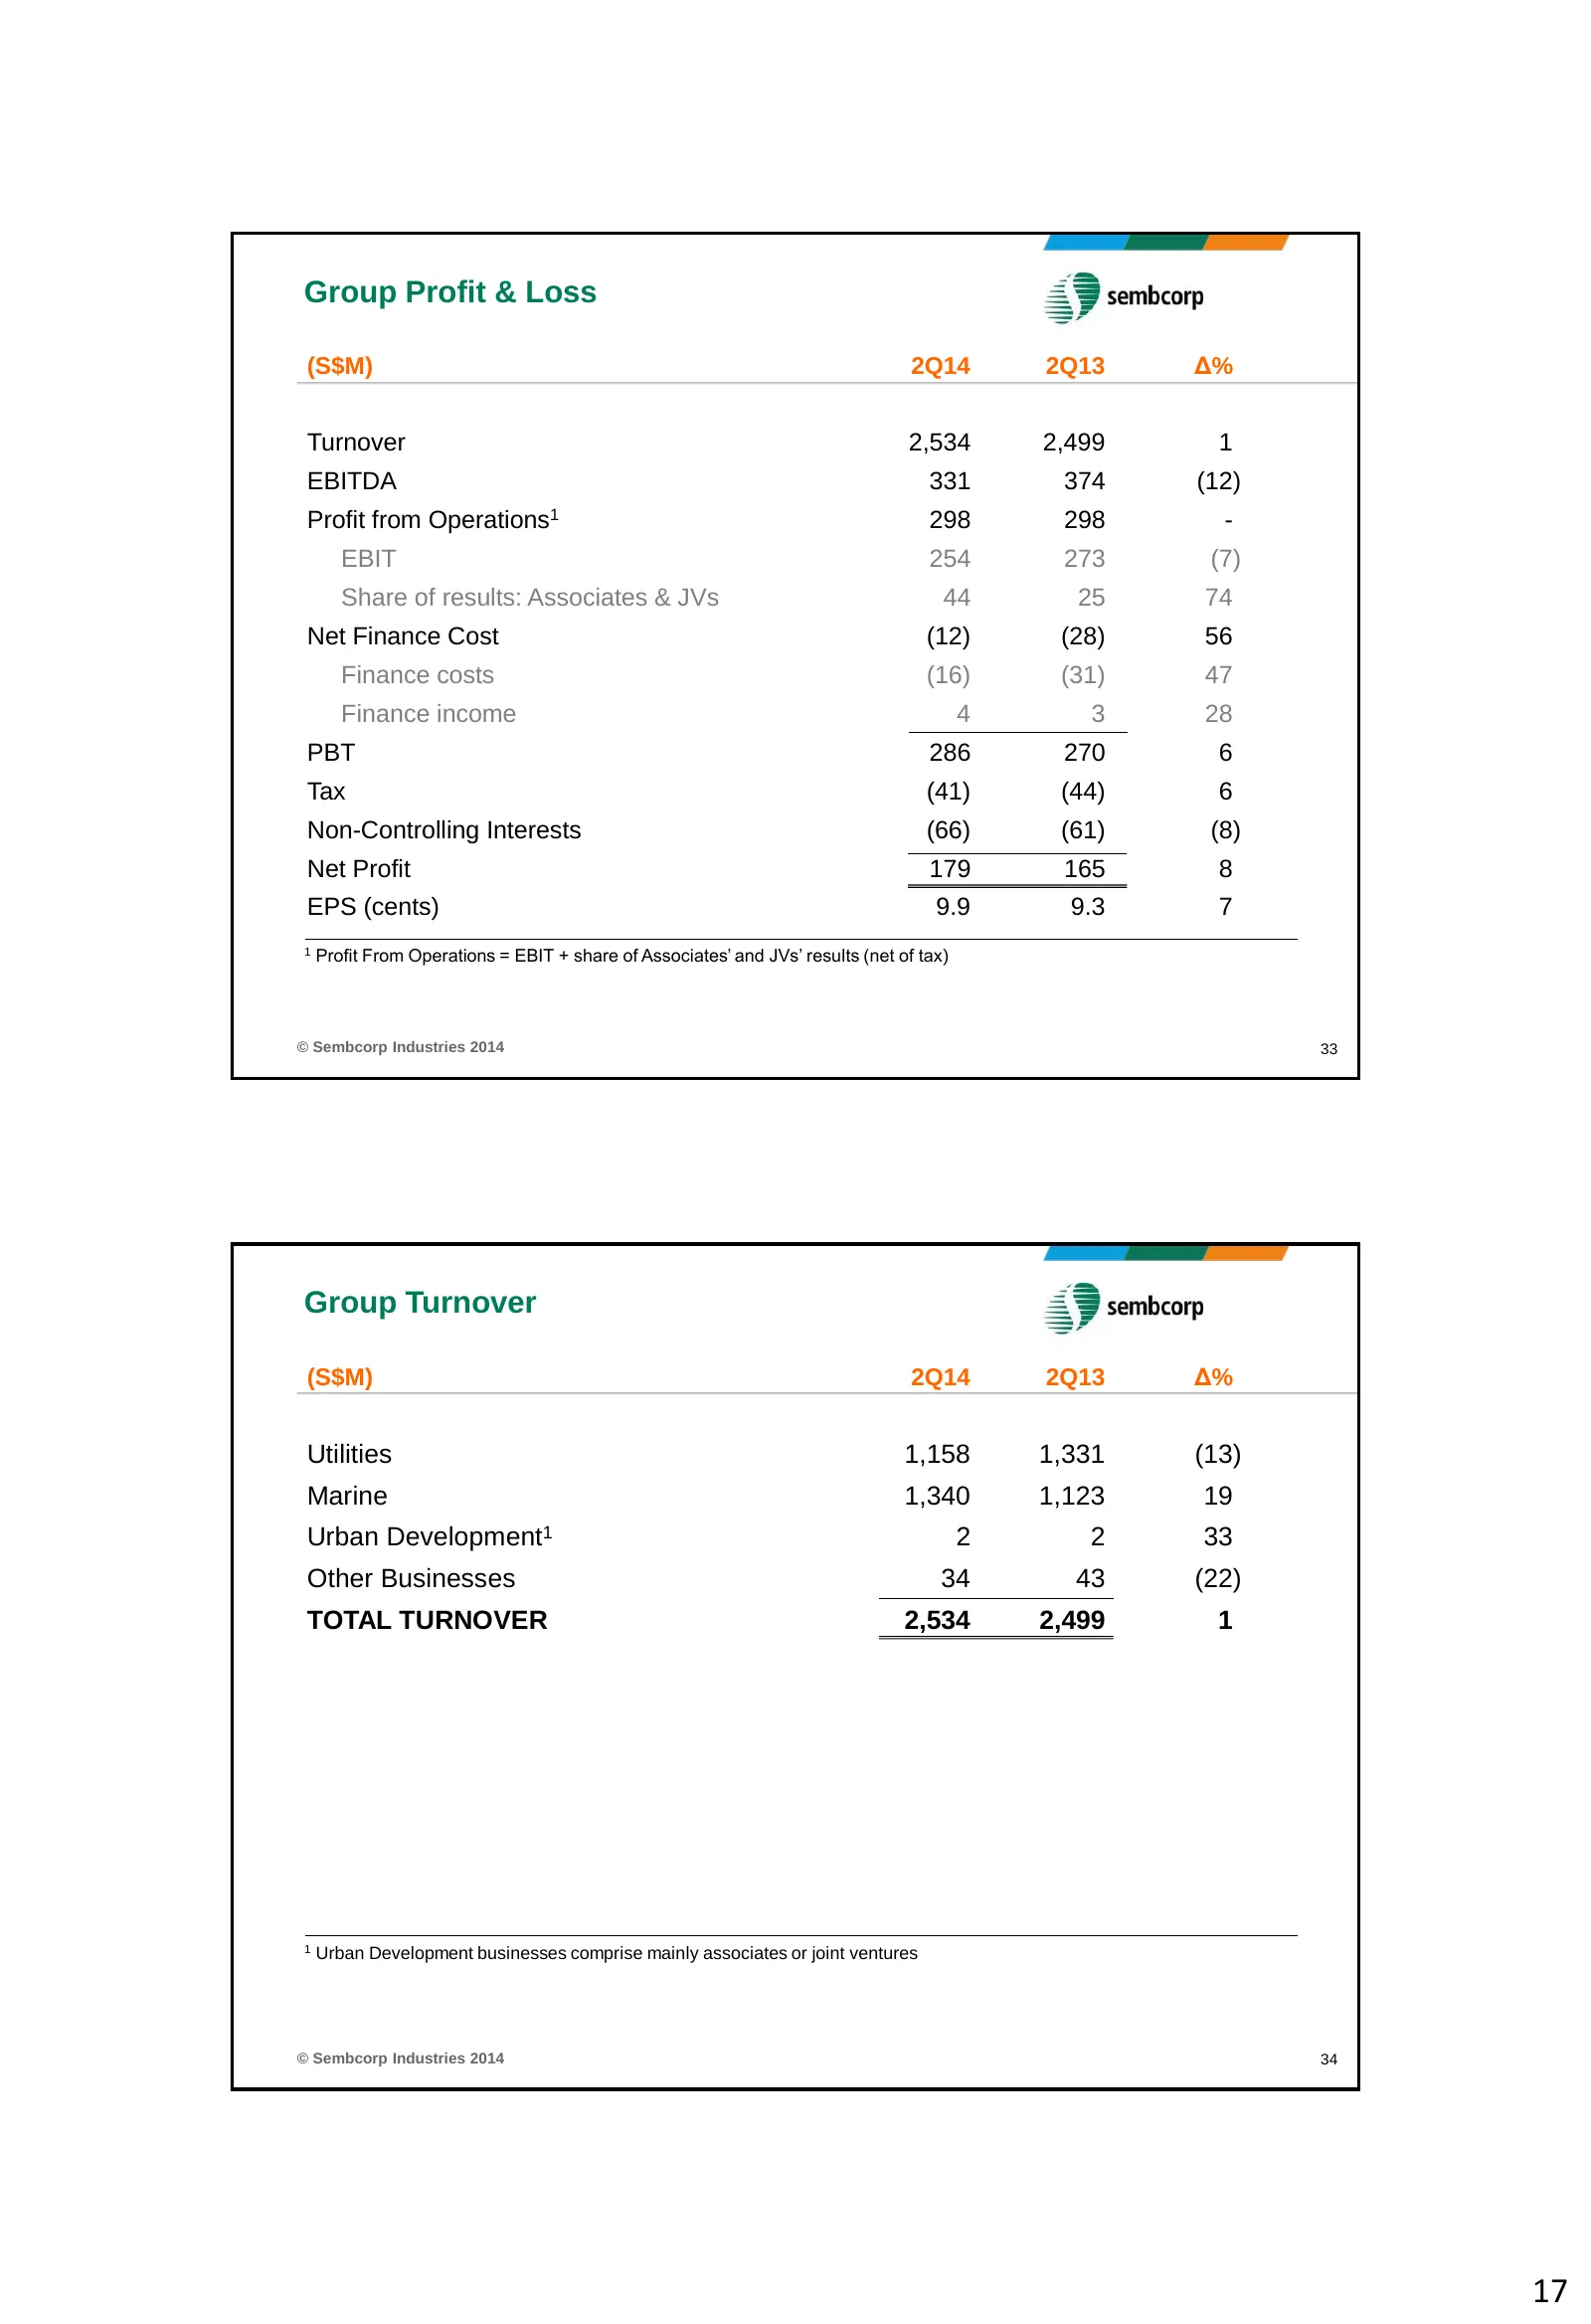
Slide 17: Group Profit & Loss (2Q14)
Group Profit & Loss (S$M) 2Q14 2Q13 Δ% Turnover 2,534 2,499 1 EBITDA 331 374 (12) Profit from Operations1 298 298 - EBIT 254 273 (7) Share of results: Associates & JVs 44 25 74 Net Finance Cost (12) (28) 56 Finance costs (16) (31) 47 Finance income 4 3 28 PBT 286 270 6 Tax (41) (44) 6 Non-Controllin
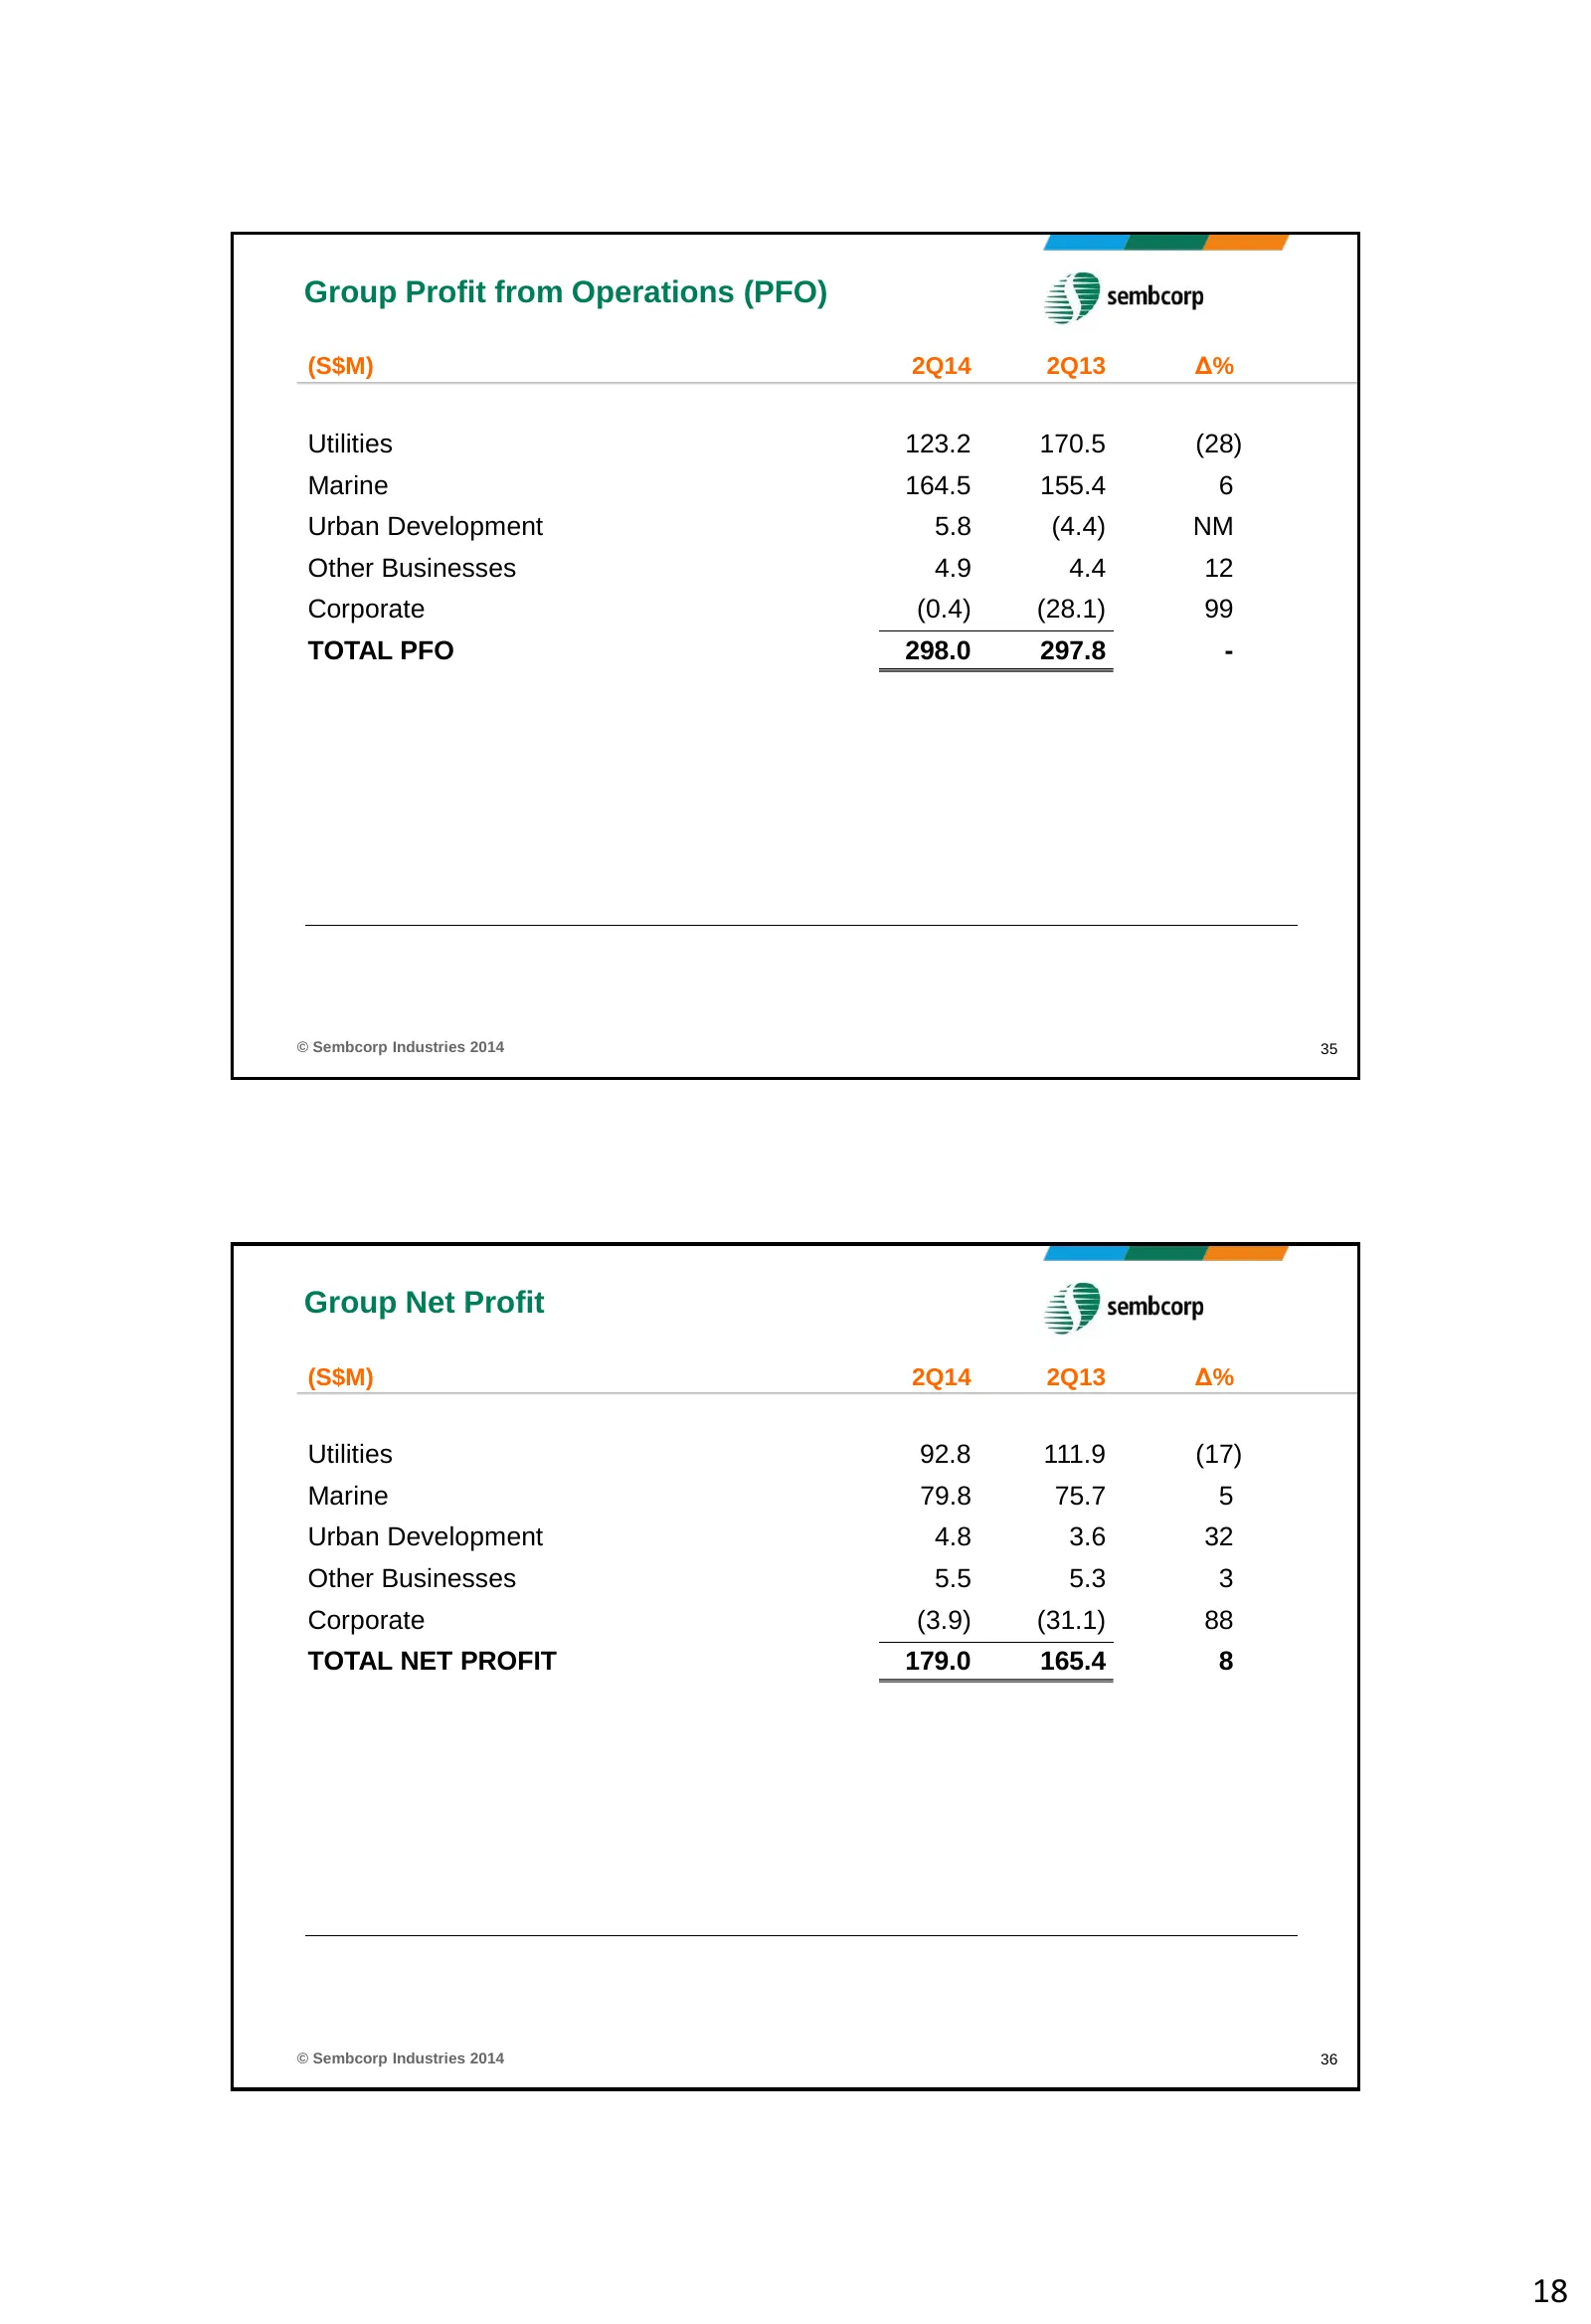
Slide 18: Group Profit from Operations and Net Profit (2Q14)
Group Profit from Operations (PFO) (S$M) 2Q14 2Q13 Δ% Utilities 123.2 170.5 (28) Marine 164.5 155.4 6 Urban Development 5.8 (4.4) NM Other Businesses 4.9 4.4 12 Corporate (0.4) (28.1) 99 TOTAL PFO 298.0 297.8 - © Sembcorp Industries 2014 35 Group Net Profit (S$M) 2Q14 2Q13 Δ% Utilities 92.8 111.9 (1
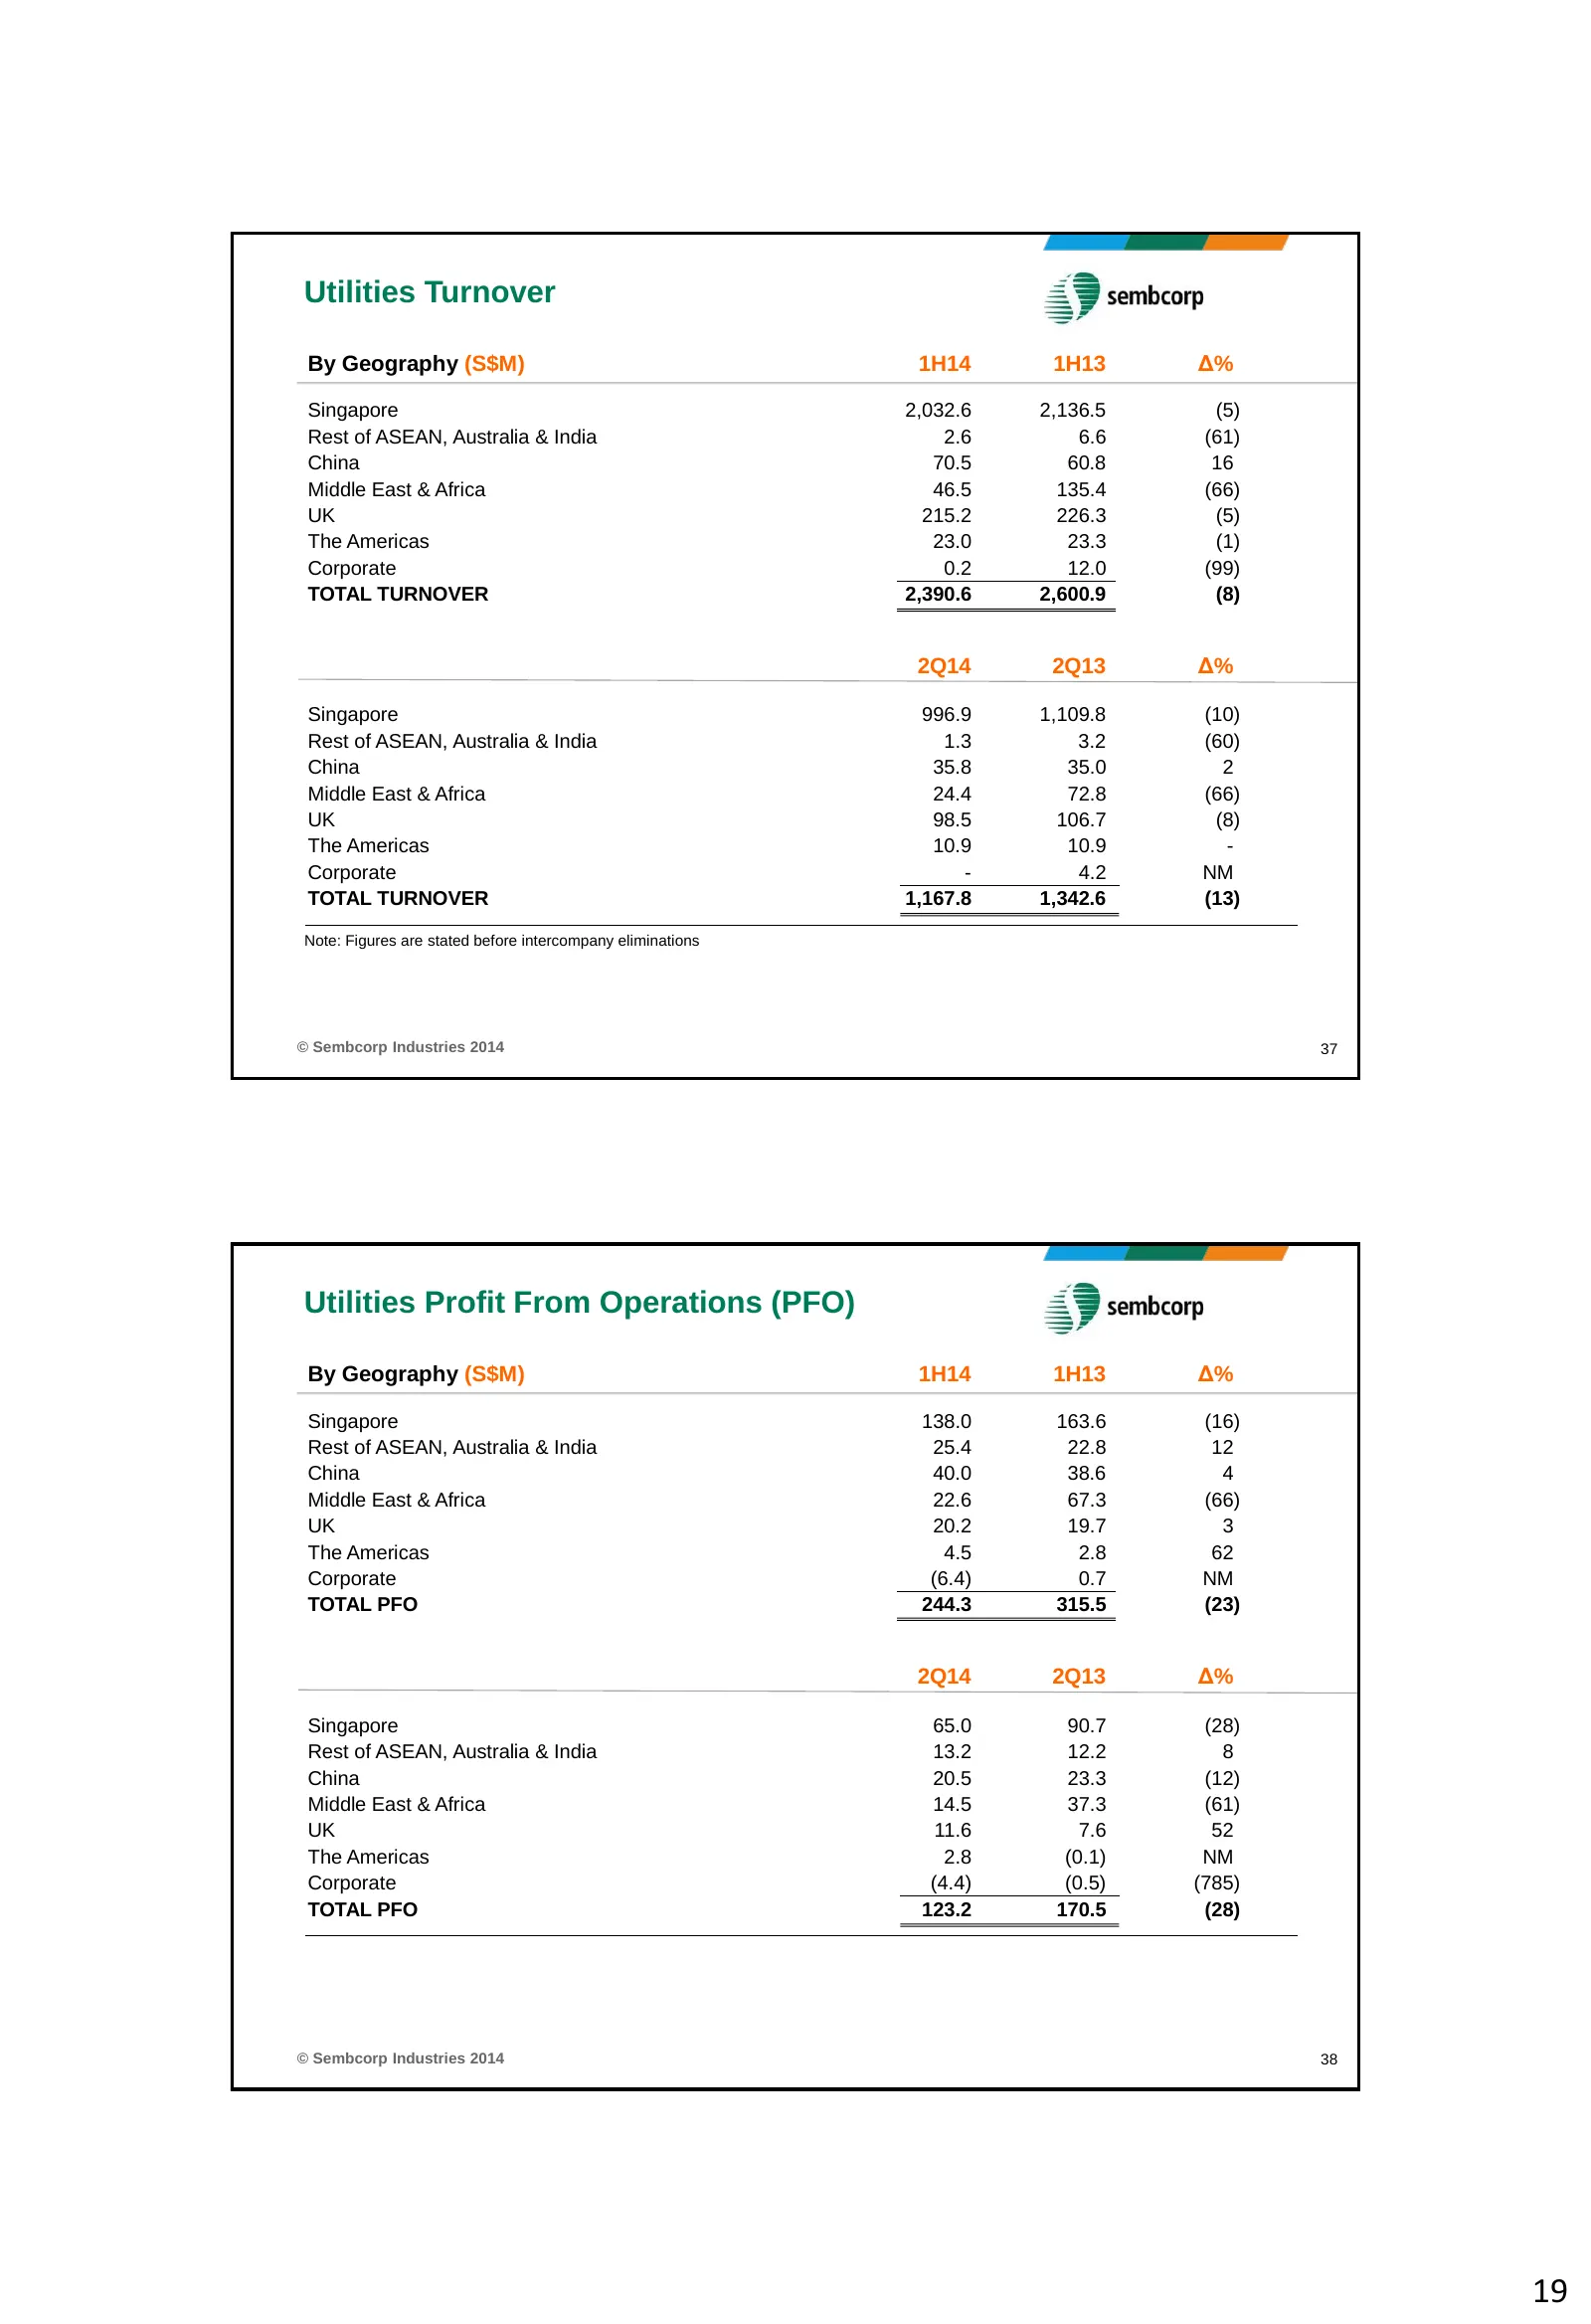
Slide 19: Utilities Turnover and Profit from Operations by Geography
Utilities Turnover By Geography (S$M) 1H14 1H13 Δ% Singapore 2,032.6 2,136.5 (5) Rest of ASEAN, Australia & India 2.6 6.6 (61) China 70.5 60.8 16 Middle East & Africa 46.5 135.4 (66) UK 215.2 226.3 (5) The Americas 23.0 23.3 (1) Corporate 0.2 12.0 (99) TOTAL TURNOVER 2,390.6 2,600.9 (8) 2Q14 2Q13 Δ%
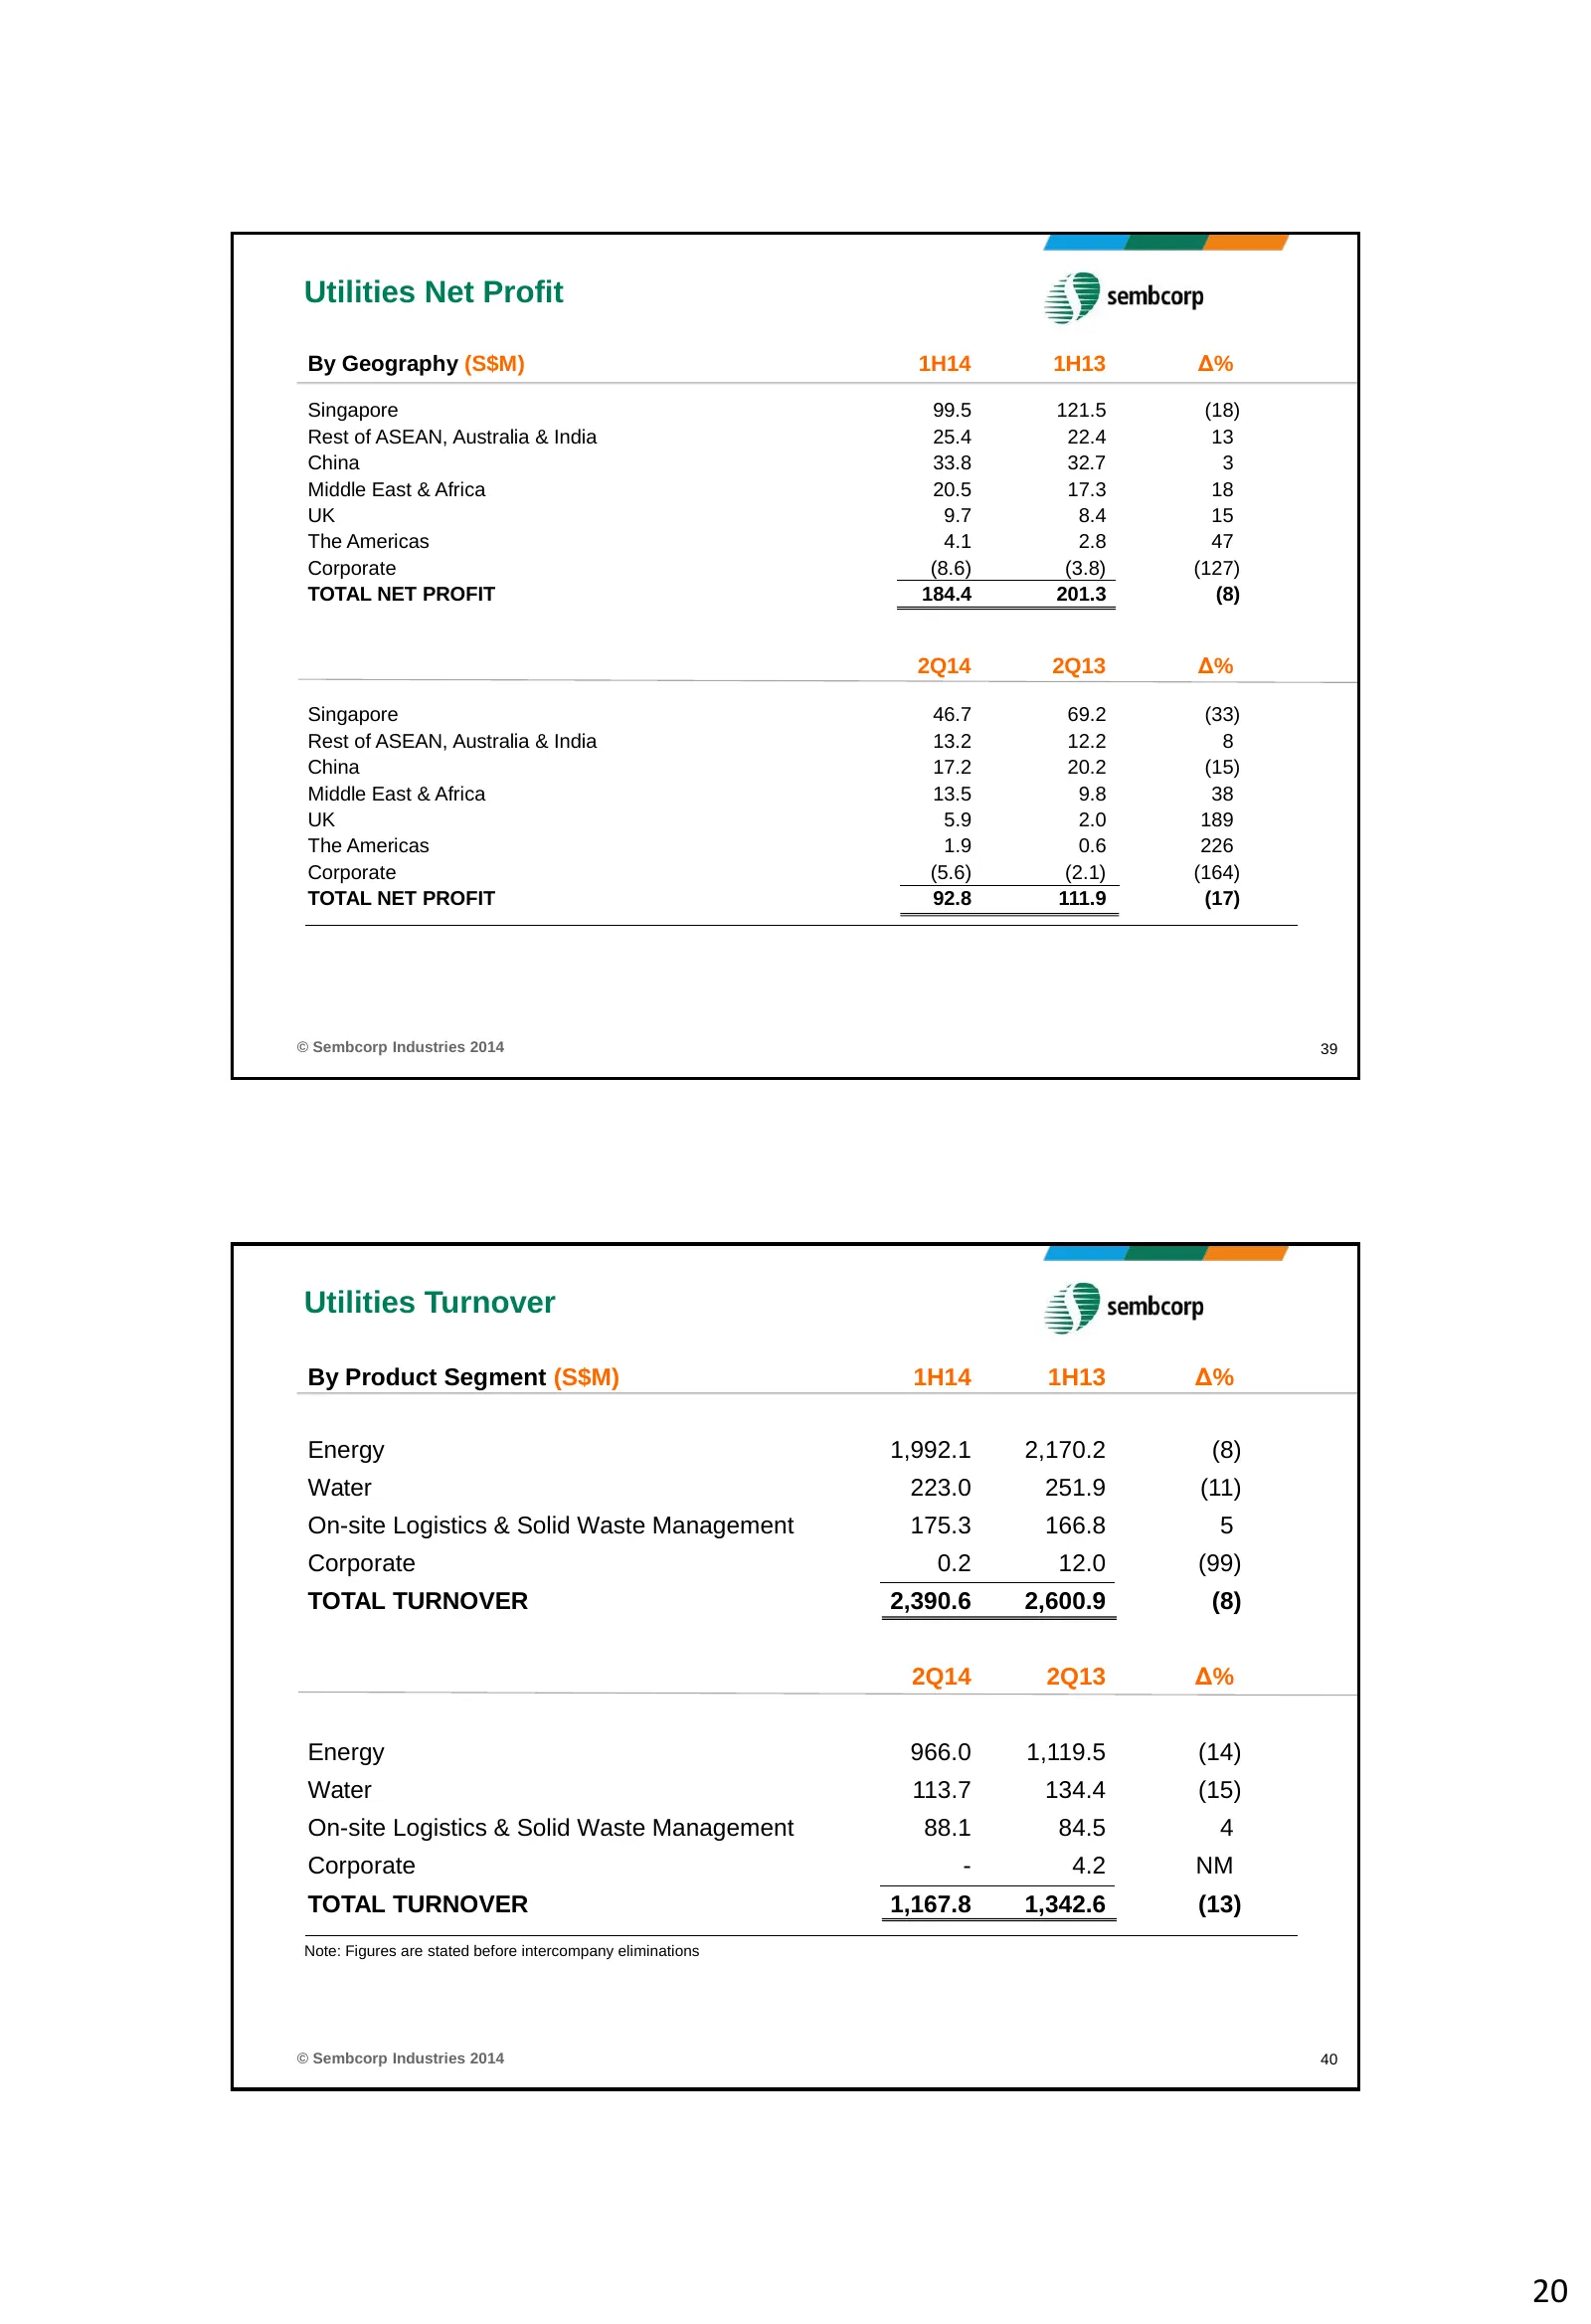
Slide 20: Utilities Net Profit and Turnover
Utilities Net Profit By Geography (S$M) 1H14 1H13 Δ% Singapore 99.5 121.5 (18) Rest of ASEAN, Australia & India 25.4 22.4 13 China 33.8 32.7 3 Middle East & Africa 20.5 17.3 18 UK 9.7 8.4 15 The Americas 4.1 2.8 47 Corporate (8.6) (3.8) (127) TOTAL NET PROFIT 184.4 201.3 (8) 2Q14 2Q13 Δ% Singapore 4
Slide 21: Utilities Profit from Operations and Net Profit by Product Segment
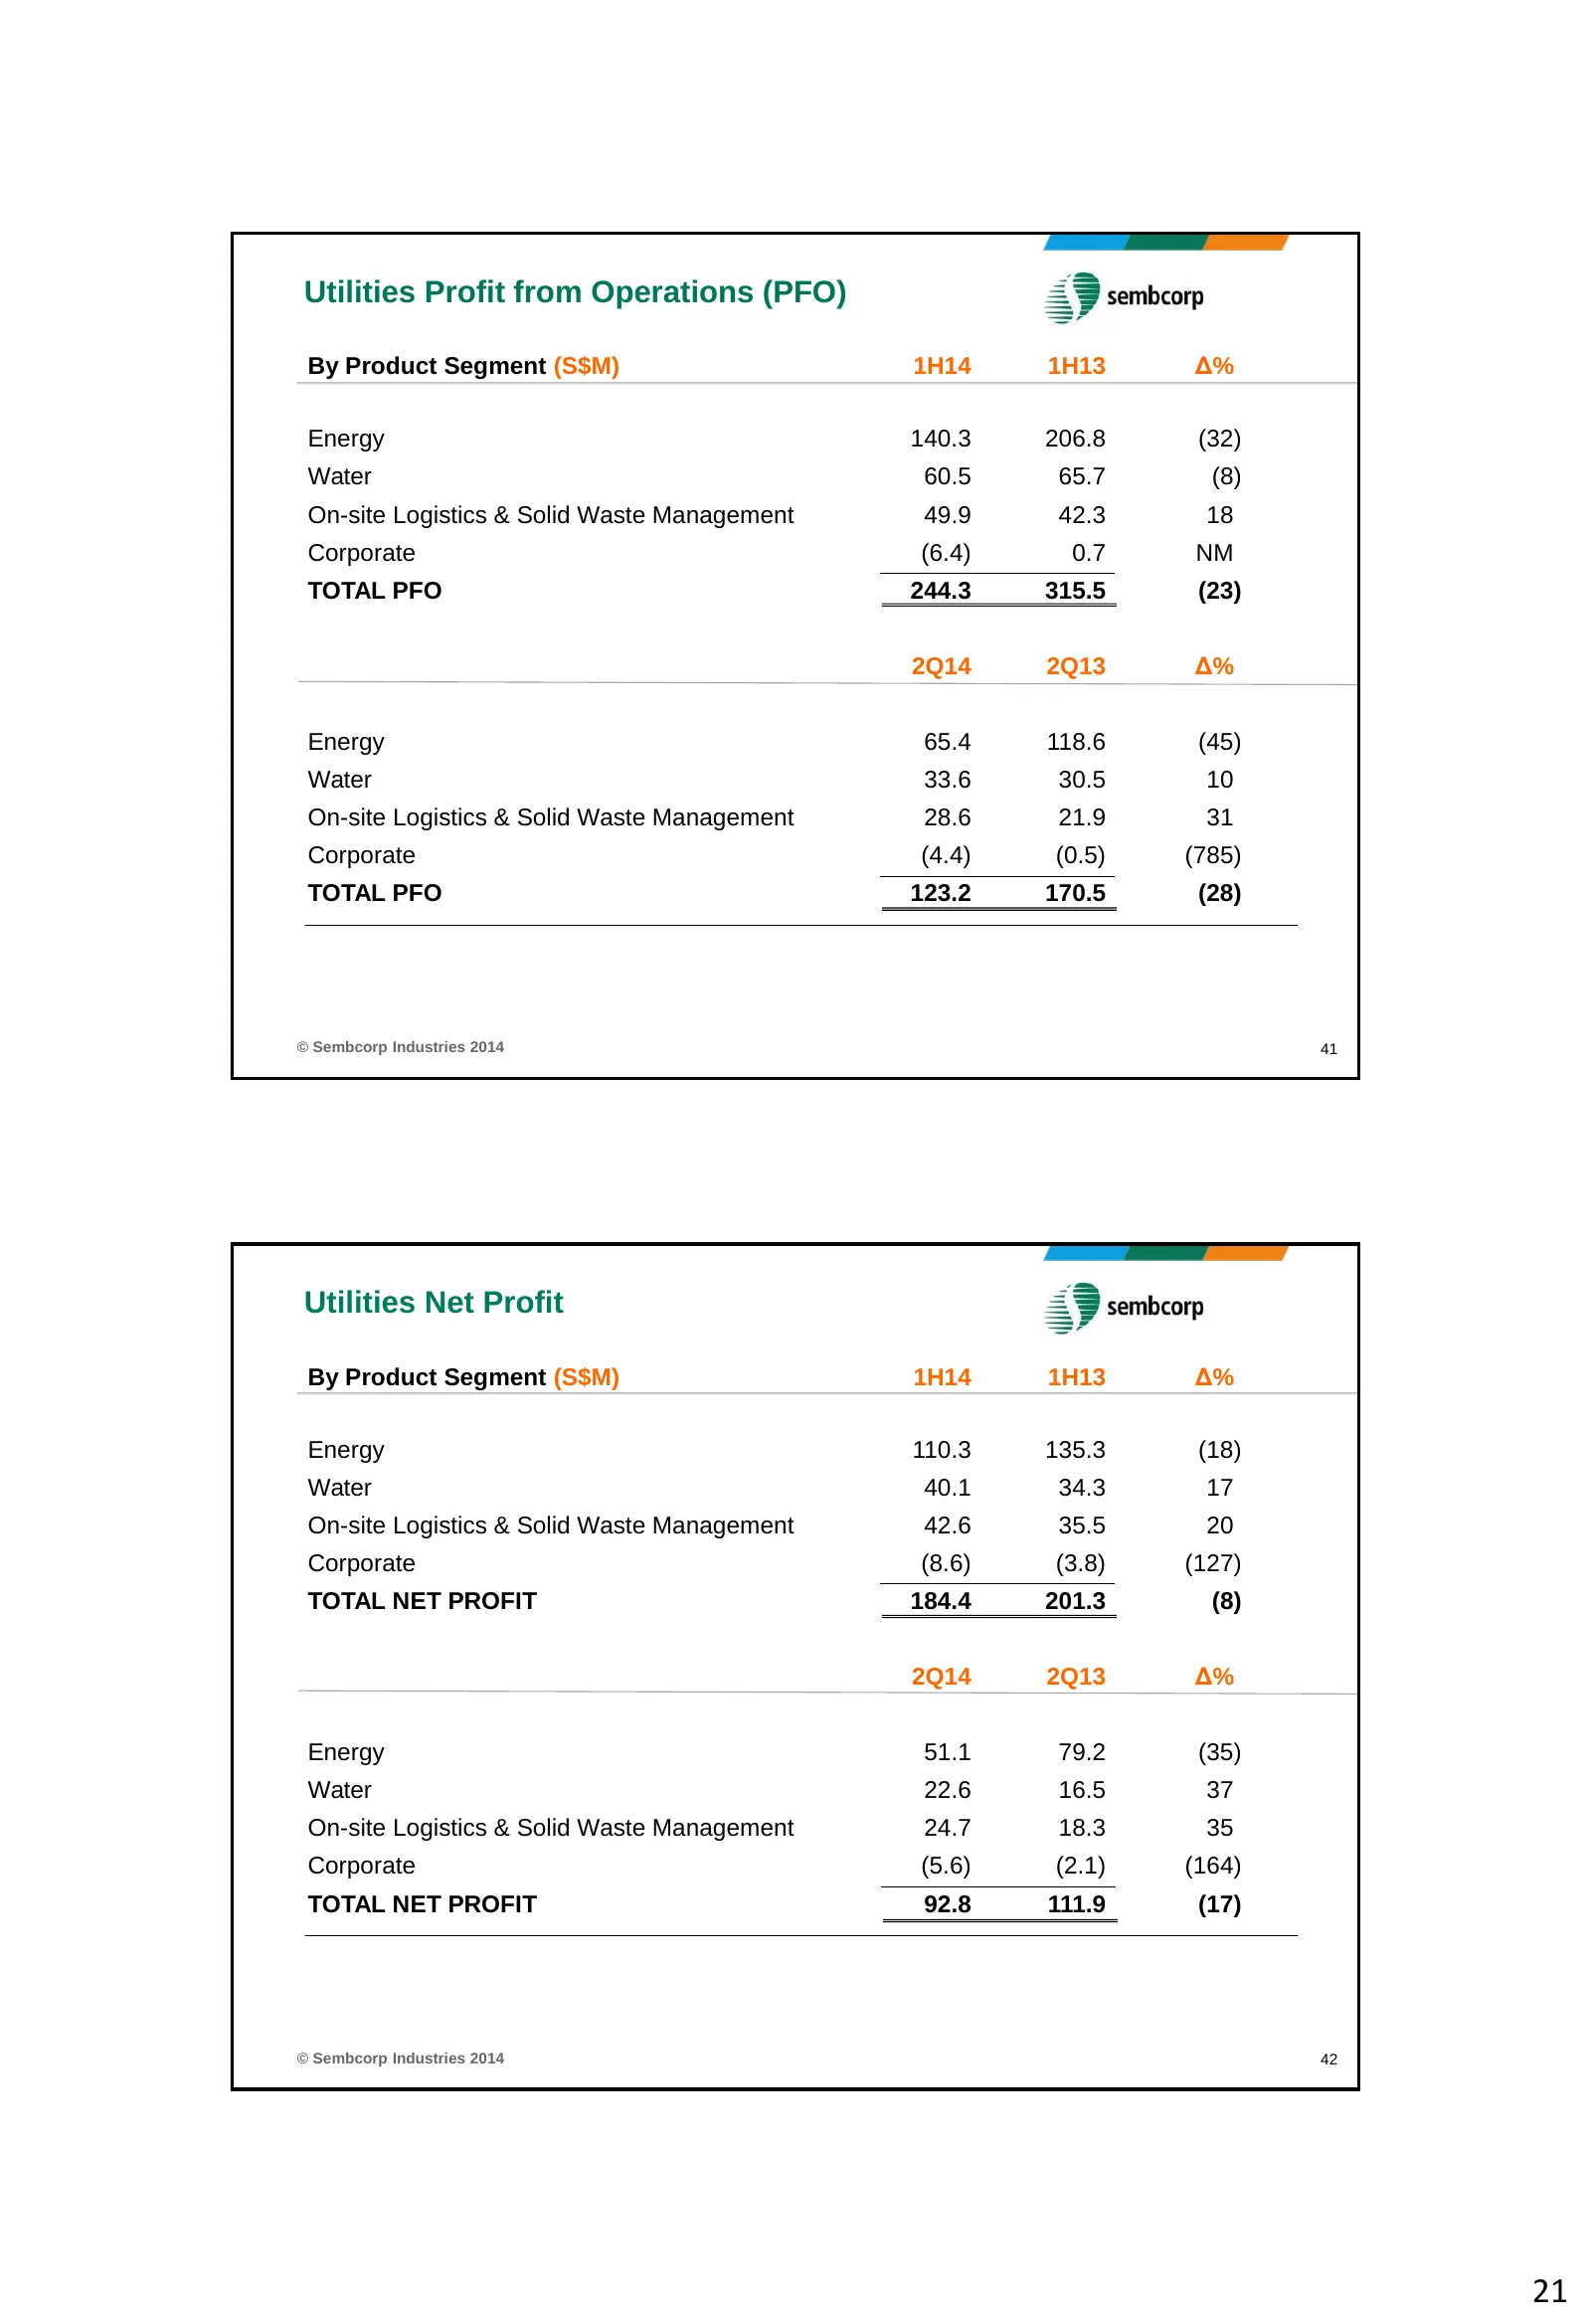
Utilities Profit from Operations (PFO) By Product Segment (S$M) 1H14 1H13 Δ% Energy 140.3 206.8 (32) Water 60.5 65.7 (8) On-site Logistics & Solid Waste Management 49.9 42.3 18 Corporate (6.4) 0.7 NM TOTAL PFO 244.3 315.5 (23) 2Q14 2Q13 Δ% Energy 65.4 118.6 (45) Water 33.6 30.5 10 On-site Logistics
Source: Internet Archive copy of sembcorp.com
More decks from Sembcorp Industries Ltd.
 H1 2026 Earnings Presentation26 slides · Aug 13, 2026
 Investor Presentation (June 2026)52 slides · June 2026
 Shareholder Meeting (April 2026)11 slides · Apr 29, 2026
 FY2025 Earnings Presentation35 slides · Feb 25, 2026
 Merger or Acquisition (January 2026)13 slides · Jan 30, 2026
 Merger or Acquisition (December 2025)24 slides · Dec 11, 2025