Windstream — Valor Communications Group — Raymond James 26th Annual Institutional Investors Conference 2005
23 slides from Windstream's conference presentation, Mar 14, 2005
Slide 1: Raymond James 26th Annual Institutional Investors Conference
Valor Communications Group Raymond James 26th Annual Institutional Investors Conference March 9th 2005
Slide 2: Safe Harbor Statement
Safe Harbor Statement Some of the statements included herein may include forward looking statements which reflect our current views with respect to future events and financial performance. Statements which include the words "expect," "intend," "plan," "believe," "project," "anticipate" and similar s
Slide 3: Senior Management Representatives
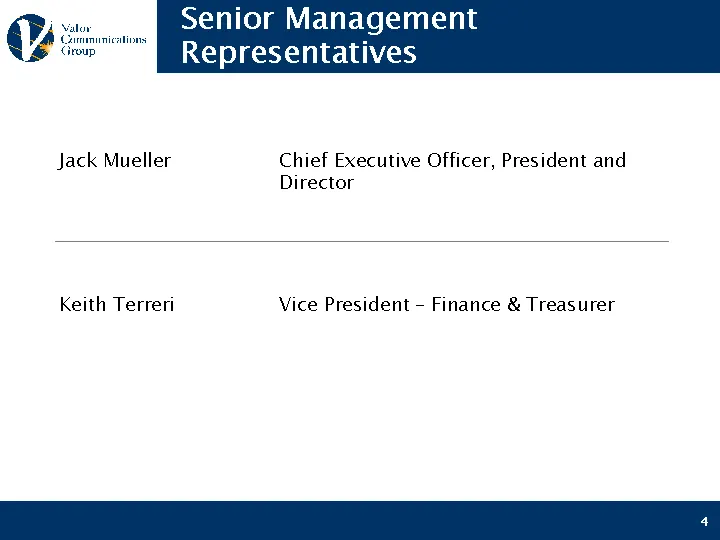
Senior Management Representatives Jack Mueller Chief Executive Officer, President and Director 4 Keith Terreri Vice President - Finance & Treasurer
Slide 4: Investment Highlights
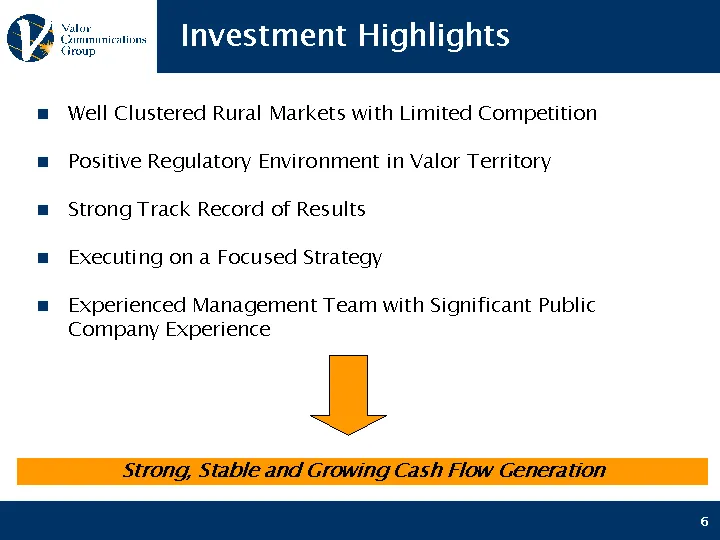
Investment Highlights 6 Strong, Stable and Growing Cash Flow Generation Well Clustered Rural Markets with Limited Competition Positive Regulatory Environment in Valor Territory Strong Track Record of Results Executing on a Focused Strategy Experienced Management Team with Significant Public Company
Slide 5: Company Overview
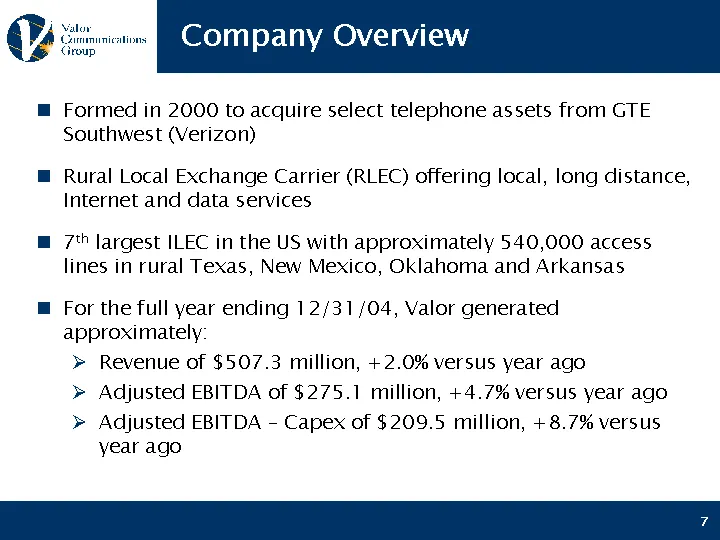
Company Overview Formed in 2000 to acquire select telephone assets from GTE Southwest (Verizon) Rural Local Exchange Carrier (RLEC) offering local, long distance, Internet and data services 7th largest ILEC in the US with approximately 540,000 access lines in rural Texas, New Mexico, Oklahoma and Ar
Slide 6: Well-Clustered Rural Markets
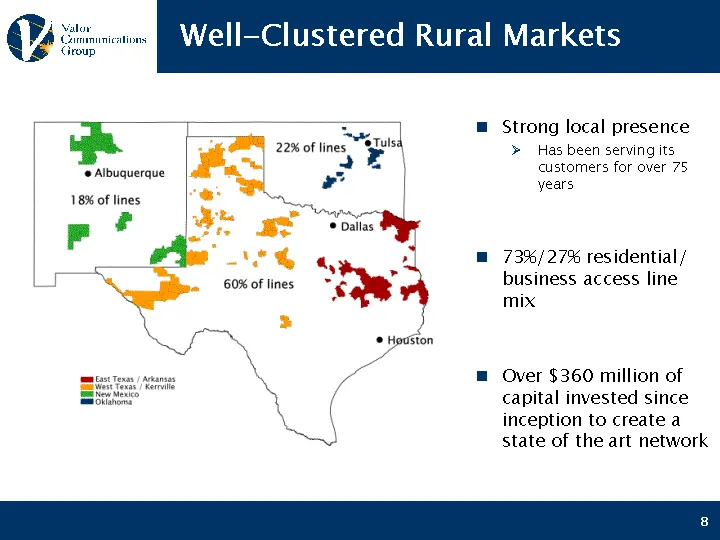
Well-Clustered Rural Markets Strong local presence Has been serving its customers for over 75 years 73%/27% residential/ business access line mix Over $360 million of capital invested since inception to create a state of the art network 8 NY001FQK_a.jpg
Slide 7: Favorable Rural Characteristics
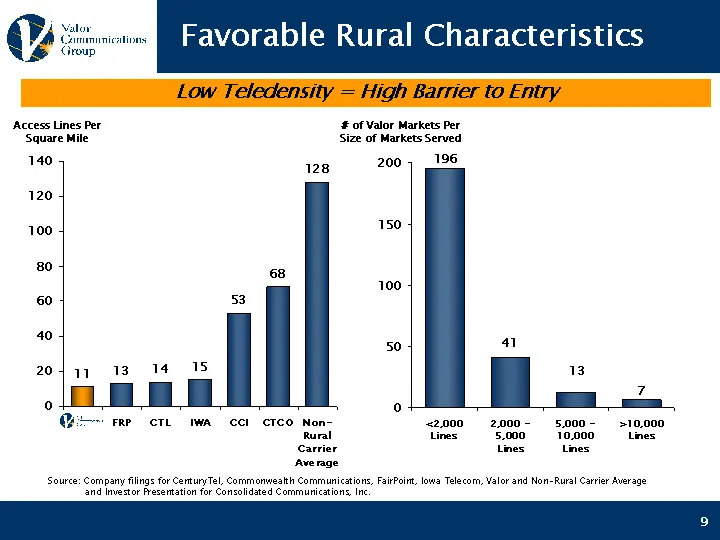
Favorable Rural Characteristics Lines per Square Mile 11 FRP 13 CTL 14 IWA 15 CCI 53 CTCO 68 Non-Rural Carrier Average 128 Access Lines Per Square Mile 9 Source: Company filings for CenturyTel, Commonwealth Communications, FairPoint, Iowa Telecom, Valor and Non-Rural Carrier Average and Investor Pre
Slide 8: Limited Competition
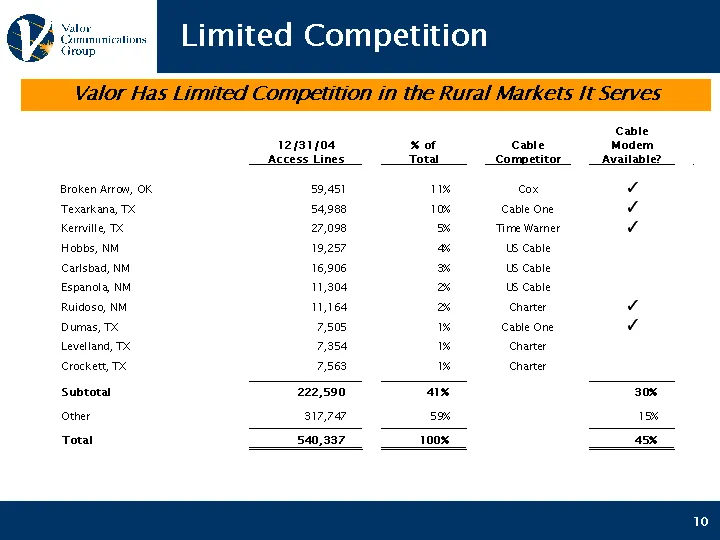
Limited Competition Valor Has Limited Competition in the Rural Markets It Serves 10
Slide 9: Positive Regulatory Environment
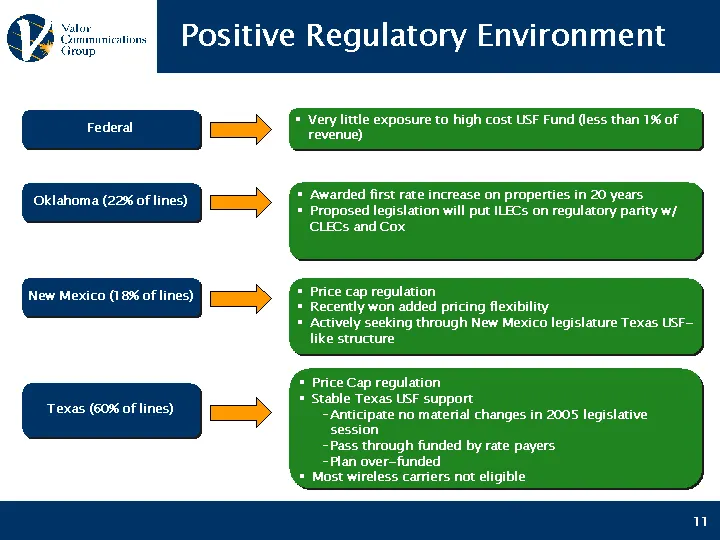
Positive Regulatory Environment Federal Texas (60% of lines) Very little exposure to high cost USF Fund (less than 1% of revenue) Price Cap regulation Stable Texas USF support Anticipate no material changes in 2005 legislative session Pass through funded by rate payers Plan over-funded Most wireless
Slide 10: Texas Universal Service Fund: Fund is Stable and Secure
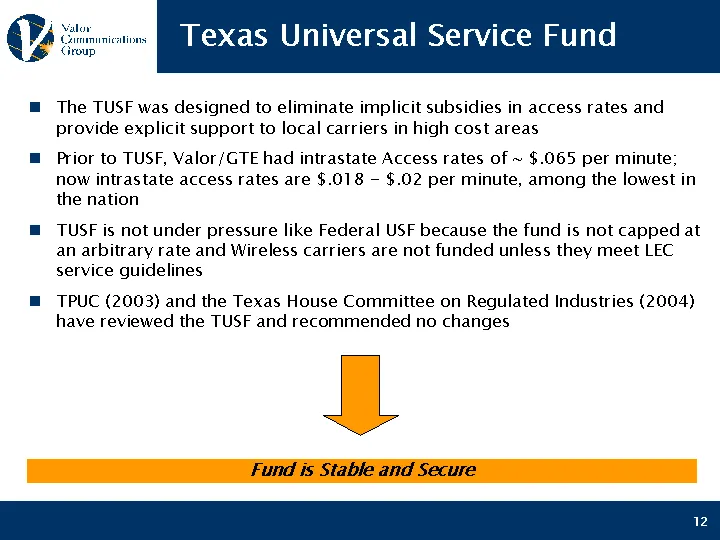
The TUSF was designed to eliminate implicit subsidies in access rates and provide explicit support to local carriers in high cost areas Prior to TUSF, Valor/GTE had intrastate Access rates of ~ $.065 per minute; now intrastate access rates are $.018 - $.02 per minute, among the lowest in the nation
Slide 11: Experienced Leadership
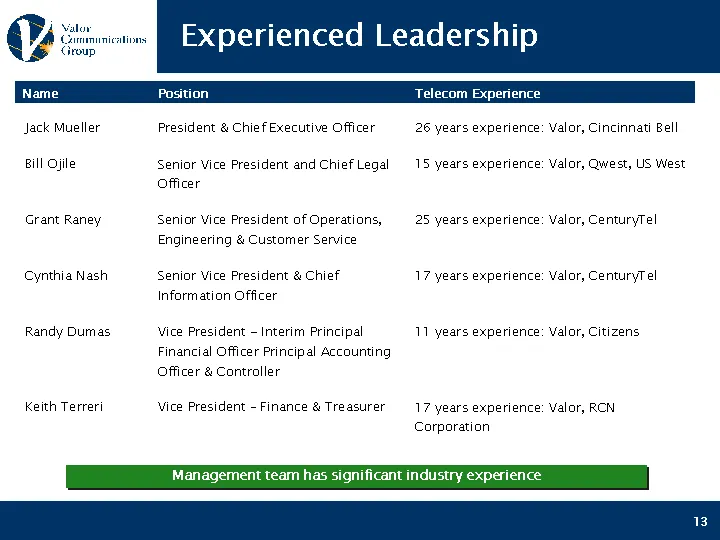
Experienced Leadership Management team has significant industry experience 13
Slide 12: Executing on a Focused Strategy
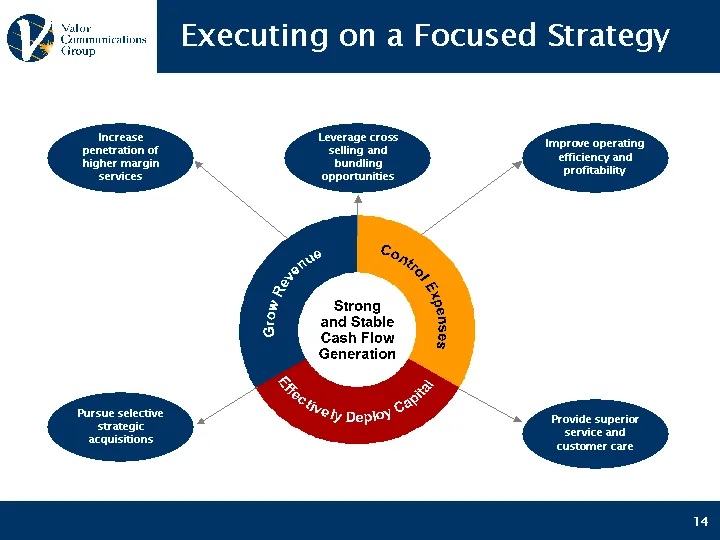
Executing on a Focused Strategy Leverage cross selling and bundling opportunities Provide superior service and customer care Improve operating efficiency and profitability Increase penetration of higher margin services Pursue selective strategic acquisitions 14
Slide 13: Increase Penetration of Higher Margin Services
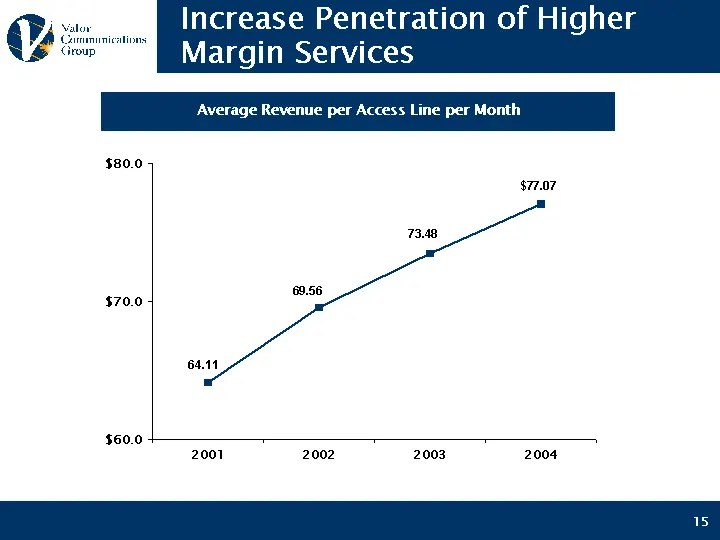
Increase Penetration of Higher Margin Services 15 Average Revenue per Access Line per Month Best-in-Class ARPU 2001 64.11 2002 69.56 2003 73.48 2004 86.6 77.07
Slide 14: Increase Penetration of Higher Margin Services (cont'd)
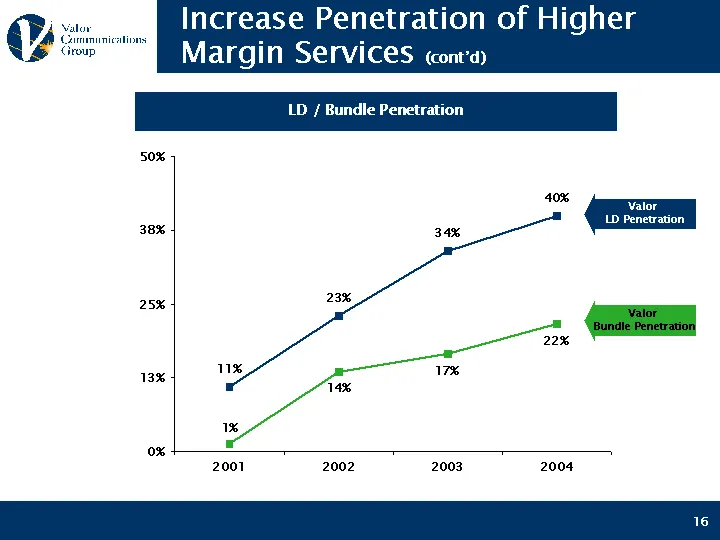
Increase Penetration of Higher Margin Services (cont'd) LD Penetration Bundle Penetration Best in Class 2001 11 1.3 2002 23 13.5 2003 34 16.5 2004 40 21.6 58 LD / Bundle Penetration 16 Valor LD Penetration Valor Bundle Penetration
Slide 15: Increase Penetration of Higher Margin Services (cont'd)
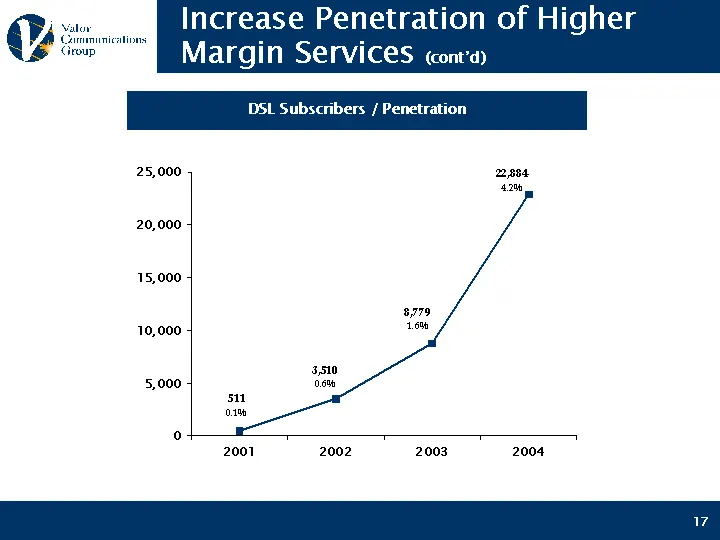
Increase Penetration of Higher Margin Services (cont'd) Revenue per Line Total Revenue 2001 511 424.9 2002 3510 479.9 2003 8779 497.3 2004 22884 DSL Subscribers / Penetration 17 [
Slide 16: Improve Operating Efficiency and Profitability
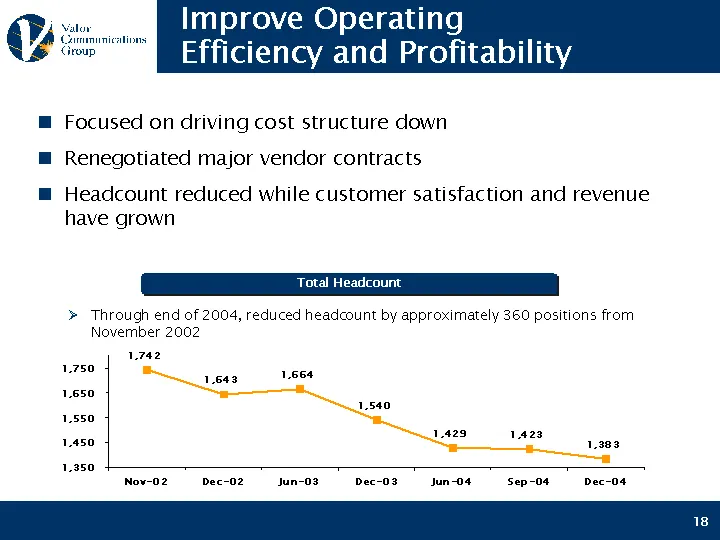
Improve Operating Efficiency and Profitability Focused on driving cost structure down Renegotiated major vendor contracts Headcount reduced while customer satisfaction and revenue have grown Through end of 2004, reduced headcount by approximately 360 positions from November 2002 18 Legend Text P&C I
Slide 17: Provide Superior Service and Customer Care
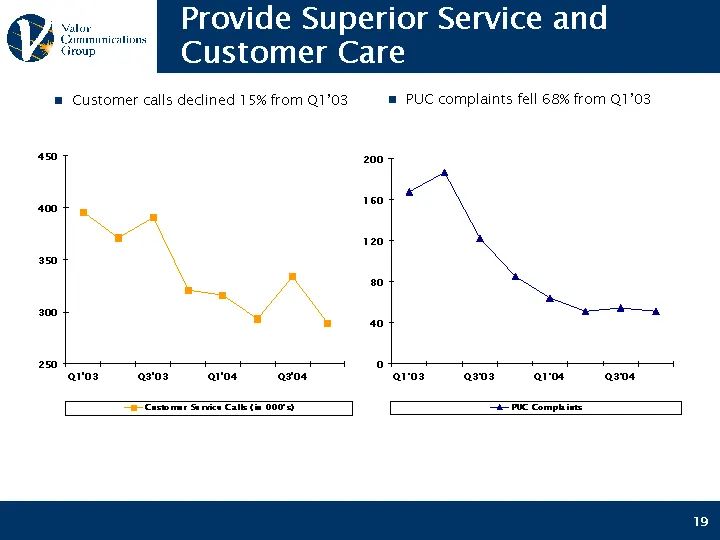
Provide Superior Service and Customer Care Legend Text Customer Service Calls (in 000's) Q1'03 395.774 Q2'03 371.055 Q3'03 390.744 Q4'03 320.845 Q1'04 316.225 Q2'04 292.832 Q3'04 333.812 Q4'04 289.123 Customer calls declined 15% from Q1'03 19 Legend Text PUC Complaints Q1'03 167 Q2'03 186 Q3'03 122
Slide 18: Pursue Selective Strategic Acquisitions
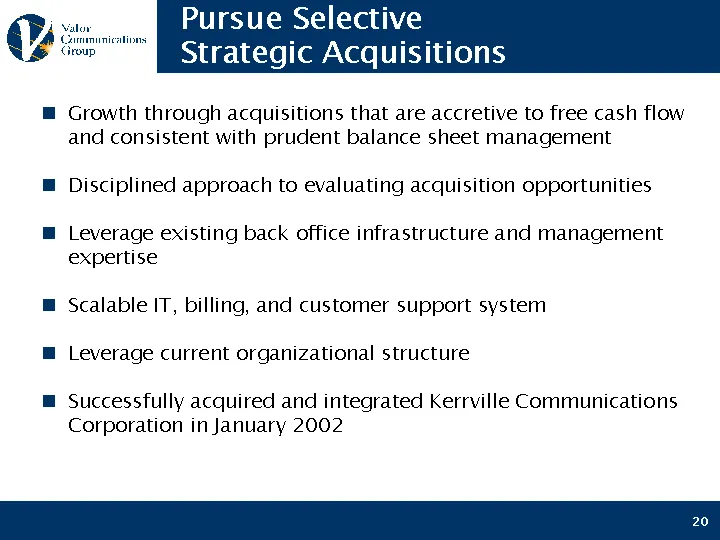
Pursue Selective Strategic Acquisitions 20 Growth through acquisitions that are accretive to free cash flow and consistent with prudent balance sheet management Disciplined approach to evaluating acquisition opportunities Leverage existing back office infrastructure and management expertise Scalable
Slide 19: Financial Goals
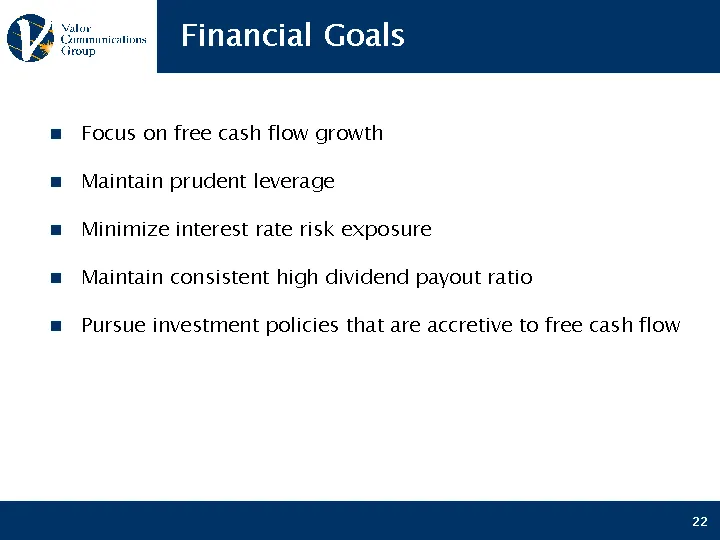
Financial Goals Focus on free cash flow growth Maintain prudent leverage Minimize interest rate risk exposure Maintain consistent high dividend payout ratio Pursue investment policies that are accretive to free cash flow 22
Slide 20: Financial Overview
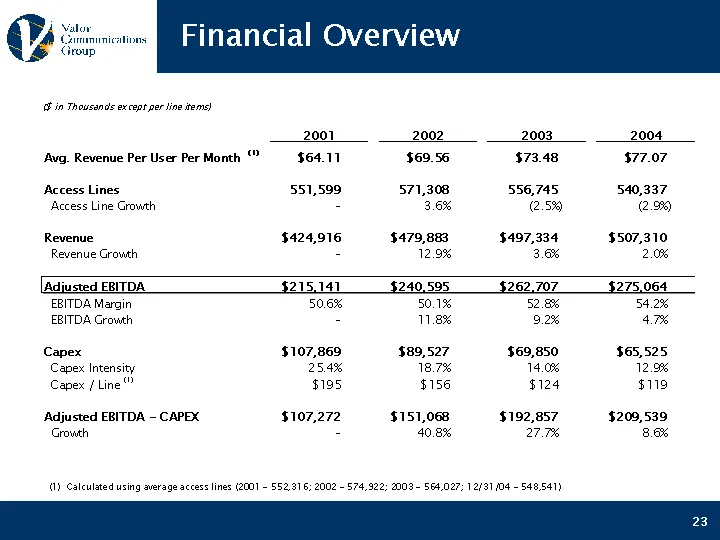
Financial Overview (1) Calculated using average access lines (2001 - 552,316; 2002 - 574,922; 2003 - 564,027; 12/31/04 - 548,541) ($ in Thousands except per line items) 23
Slide 21: Access Line Trends
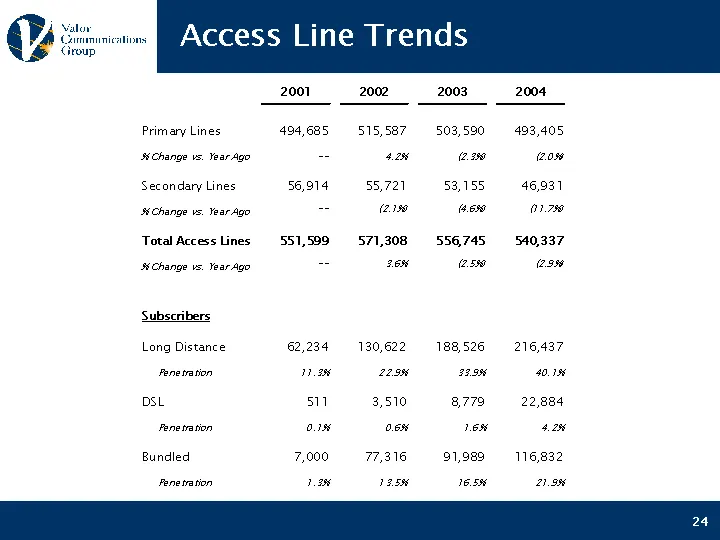
Nalow Group Primary Lines SChange 1s. Year Ago Secondary Lines SChange 1s. Year Ago Total Access Lines SChange 1s. Year Ago Subscribers Long Distance Penetration DsL Penetration Bundled Penetration ram” Access Line Trends 2001 2002 2003 2004 494,685 515,587 503,590 493,405 - 428 a2 ow 56,914 95,721
Slide 22: Capital Expenditures
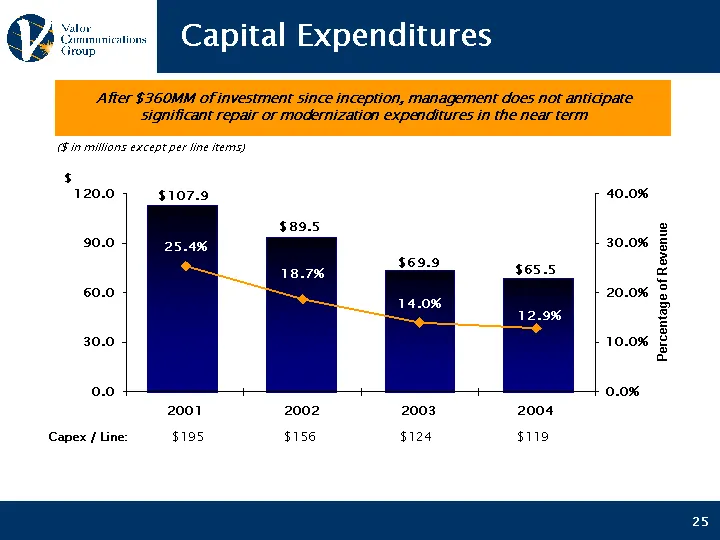
Growth 2001 107.9 2002 89.5 2003 69.9 2004 65.5 Capex % of Revenue 2001 107.9 0.254 2002 89.5 0.187 2003 69.9 0.14 2004 65.5 0.129 $ Capital Expenditures ($ in millions except per line items) After $360MM of investment since inception, management does not anticipate significant repair or modernizati
Slide 23: Investment Highlights
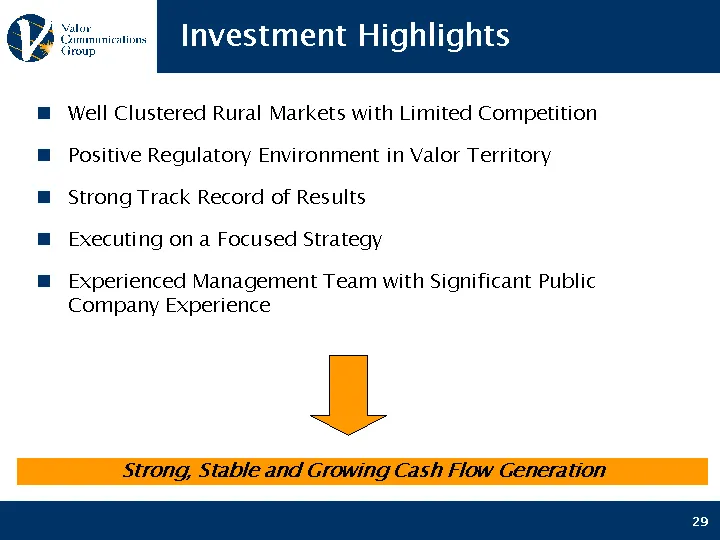
Investment Highlights 29 Strong, Stable and Growing Cash Flow Generation Well Clustered Rural Markets with Limited Competition Positive Regulatory Environment in Valor Territory Strong Track Record of Results Executing on a Focused Strategy Experienced Management Team with Significant Public Company
Source: SEC EDGAR · 8-K filed Mar 14, 2005
More decks from Windstream Holdings Inc
 Corporate Update (April 2019)6 slides · Apr 29, 2019
 Q3 2016 Earnings Presentation39 slides · Nov 7, 2016
 Merger or Acquisition (November 2016)38 slides · Nov 7, 2016
 Merger or Acquisition (December 2014)14 slides · Dec 18, 2014
 Merger or Acquisition (July 2014)20 slides · Jul 29, 2014
 Merger or Acquisition (December 2009)29 slides · Dec 1, 2009